
Appendix for : Implications of climate mitigation for...
15
1 Appendix for: Implications of climate mitigation for future agricultural production Christoph Müller 1 , Joshua Elliott 2,3 , James Chryssanthacopoulos 3 , Delphine Deryng 4,5 , Christian Folberth 6 , Thomas A. M. Pugh 7 , and Erwin Schmid 8 1 Potsdam Institute for Climate Impact Research, Potsdam, Germany 2 University of Chicago Computation Institute, Chicago, Illinois 3 Columbia University Center for Climate Systems Research, New York, New York 4 School of Environmental Sciences, University of East Anglia, Norwich, United Kingdom 5 Grantham Research Institute on Climate Change and the Environment, London School of Economics and Political Science, London, United Kingdom 6 International Institute for Applied Systems Analysis, Laxenburg, Austria 7 Karlsruhe Institute of Technology, IMK-IFU, Garmisch-Partenkirchen, Germany 8 University of Natural Resources and Life Sciences, Vienna, Austria Correspondence: C. Müller ([email protected]) and J. Elliott ([email protected])
Transcript of Appendix for : Implications of climate mitigation for...

1
Appendix for:
Implications of climate mitigation for future
agricultural production
Christoph Müller1, Joshua Elliott2,3, James Chryssanthacopoulos3, Delphine Deryng4,5, Christian
Folberth6, Thomas A. M. Pugh7, and Erwin Schmid8
1 Potsdam Institute for Climate Impact Research, Potsdam, Germany
2 University of Chicago Computation Institute, Chicago, Illinois
3 Columbia University Center for Climate Systems Research, New York, New York
4 School of Environmental Sciences, University of East Anglia, Norwich, United Kingdom
5 Grantham Research Institute on Climate Change and the Environment, London School of
Economics and Political Science, London, United Kingdom
6 International Institute for Applied Systems Analysis, Laxenburg, Austria
7 Karlsruhe Institute of Technology, IMK-IFU, Garmisch-Partenkirchen, Germany
8 University of Natural Resources and Life Sciences, Vienna, Austria
Correspondence: C. Müller ([email protected]) and J. Elliott ([email protected])
2
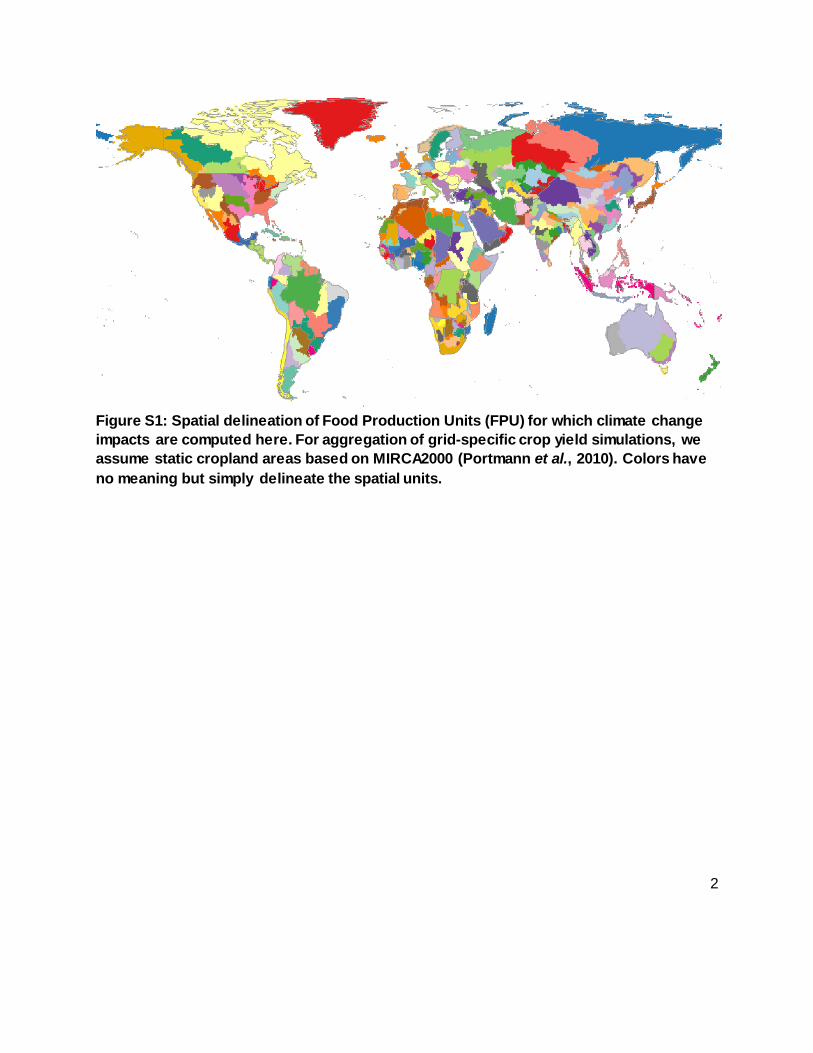
Figure S1: Spatial delineation of Food Production Units (FPU) for which climate change impacts are computed here. For aggregation of grid-specific crop yield simulations, we assume static cropland areas based on MIRCA2000 (Portmann et al., 2010). Colors have no meaning but simply delineate the spatial units.

3
Figure S2: As figure 1 but for absolute changes in production (Pcal) per FPU.

4
Figure S3: Total production of maize, wheat, rice and soy (measured in Pcal) for current cropland areas for RCP 8.5. Blue bars display the full GCMxGGCM ensemble for the assumption of fully effective CO2 fertilization. Yellow bars are as the blue bars, but for one GCM (HadGEM2-ES) only. Red bars are as the yellow bars, but for the assumption of ineffective CO2 fertilization. Bars display the interquartile range (IQR) and whiskers extend to the max/min of the ensemble, ignoring outlier points that lie further than 1.5 time IQR beyond the IQR Outliers are depicted as crosses. Positive outliers are from LPJ-GUESS which typically has the least strong climate change impact projections strongest response to CO2 fertilization and negative outliers are typically from PEGASUS.

5
Figure S4: As figure S3 but for RCP 2.6.

6
Figure S5: Effects of climate mitigation on agricultural productivity as in figure 3, but assuming no effectiveness of CO2 fertilization. This figure is based on only one GCM (HadGEM2-ES) for limited data availability for the assumption of ineffective CO2 fertilization. Green (avoided damages) and blue (gained potentials) areas profit from climate mitigation.

7
Figure S6: The share of GGCM-induced uncertainty per FPU in the full scenario ensemble assuming full CO2 fertilization effectiveness (5 GCMs x 6 GGCMs x 2 RCPs) as also presented in Table S4 for the global aggregation. The CO2-induced uncertainty is not included here, as this ensemble is only available for the assumption on full CO2 fertilization effectiveness.

8
Figure S7: Effects of CO2 fertilization on agricultural productivity for the median projection of all GGCMs for HadGEM2-ES only. Panel A corresponds to panel A in Figure 1 but is for HadGEM2-ES only, panel C corresponds to panel A in figure 2 but also for HadGEM2-ES only. The panels on the right (B, D) show the climate change impacts on agricultural productivity if CO2 fertilization is assumed to be inefficient under RCP 8.5 (top) and RCP 2.6 (bottom). Values are computed at FPU level but are displayed only for regions currently cropped.

9
Figure 8: The share of CO2-induced uncertainty per FPU in the HadGEM2-ES scenario ensemble (6 GGCMs x 2 RCPs x 2 CO2) as also presented in Table S3 for the global aggregation. The GCM-induced uncertainty is not included here, as this ensemble is only available for HadGEM2-ES.

10
Table S1: Model characteristics and setup. Modified from (Rosenzweig et al., 2014) EPIC GEPIC LPJ-GUESS LPJmL pDSSAT PEGASUS Type1 Site-based Site-based Ecosystem Ecosystem Site-based Ecosystem CO2 effects2
RUE, TE RUE, TE LF, SC LF, SC RUE (for w heat, rice, maize) and LF (for soy)
RUE
Stresses3 W, T, H, A, N, P, BD, AL
W, T, H, A, N, P, BD, AL
W, T W, T W, T, H, A, N W, T, H, N, P, K
Fertilizer application4
automatic N input (max 200 kg ha-1 yr-1) PK (national stat. IFA) dynamic application
NP (national stat: FertiSTAT), dynamic application
na na SPAM, dynamic application
NPK (national stat. IFA), annual application
Calibration Parameters
Site-specif ic (EPIC 0810) Na
Site-specif ic and global F HIpot (for maize and rice)
Uncalibrated na
Global LAImax HI αa
Site-specif ic (DSSAT) Na
Global β
Evaluation (Izaurralde et al., 2006; Schneider et al., 2007; Balkovič et al., 2013; Mitter et al., 2015; Williams et al., 1989)
(Liu et al., 2007; Gaiser et al., 2010; Folberth et al., 2012; Izaurralde et al., 2006; Liu, 2009)
(Bodin et al., 2014; Lindeskog et al., 2013)
(Bondeau et al., 2007; Fader et al., 2010; Waha et al., 2013; Waha et al., 2012)
(Jones et al., 2003 and references therein; Glotter et al., 2014)
(Deryng et al., 2014; Deryng et al., 2011)
Notes for abbreviations (na = not applicable): (1) site-base crop model; GAEZ: Global agro-ecological zones; ecosystem: global ecosystem model (2) Elevated CO2 effects: LF: Leaf-level photosynthesis (via rubisco or quantum-efficiency and leaf-photosynthesis saturation; RUE: Radiation use efficiency; TE: Transpiration efficiency; SC: stomatal conductance (3) W: water stress; T: temperature stress; H: specific-heat stress; A: oxygen stress; N: nitrogen stress; P: phosphorus stress; K: potassium stress; BD: bulk density; AL: aluminum stress (based on pH and base saturation) (4) Fertilizer application, timing of application; NPK annual application

11
Table S2: Models’ key physiological process implementations. Modified from (Rosenzweig et al., 2014)
Notes for abbreviations (NA where not applicable): (1) D: Dynamic simulation based on development and growth processes; PS: prescribed shape of LAI curve as function of phenology, modified by water stress & low productivity (2) S: Simple approach: D: Detailed approach (3) RUE: Simple (descriptive) radiation use efficiency approach; P-R: Detailed (explanatory) gross photosynthesis – respiration (4) Yield formation depending on: HI: fixed harvest – index; B: total (above – ground) biomass; Gn: number of grains and grain growth rate; Prt: partitioning during reproductive stages; HIws: HI modified by water stress (5) W: water stress; T: temperature stress; H: specific-heat stress; A: oxygen stress; N: nitrogen stress; P: phosphorus stress; K: potassium stress; BD: bulk density; AL: aluminum stress (based on pH and base saturation) (6) V: vegetative (source); R: reproductive organ (sink); F: number of grain (pod) set during the flowering period (7) Crop phenology is a function of: T: temperature; DL: photoperiod (day length); O: other water/nutrient stress effects considered; V: vernalization; HU: Heat unit index (8) E: ratio of supply to demand of water; S: soil available water in root zone (9) PM: Penman – Monteith; PT: Priestley –Taylor (10) number of soil layers (11) LIN: linear; EXP: exponential; NON: no roots-just soil depth zone; W: actuals water depends on water availability in each soil layer (12) C model; N model; P(x): x number of organic matter pools; B(x): x number of microbial biomass pools (13) Elevated CO2 effects: LF: Leaf-level photosynthesis (via rubisco or quantum-efficiency and leaf-photosynthesis saturation; RUE: Radiation use efficiency; TE: Transpiration efficiency; SC: stomatal conductance (14) Concentration levels assumed for simulations with static [CO2] for simulations with assumed ineffective CO2 fertilization
Model
Leaf area developm
en1
Light interception
2
Light utilisation
3
Yield
formation
4
Stresses involved
5
Type of heat stress 6
Crop
phenology7
Type of w
ater stress 8
Evapo-
transpiration9
Soil water
dynamic
10
Root
distribution over depth
11
Soil CN
m
odel 12
CO
2 effects 13
CO
2 levels 14
EPIC D S RUE HIws Prt B
W T H A N P BD AL
V T(HU) V O
E PM
10 LIN W C N B(1) P(6)
RUE, TE
380 ppm
GEPIC D S RUE HIws Prt B
W T H A N P BD AL
V T(HU) V O
E PM 5 LIN W C N B(1) P(6)
RUE, TE
364 ppm
LPJ-GUESS
D S P-R HIws W T NA T V E PT 2 LIN NA LF, SC
379 ppm
LPJmL PS S P-R HIws W T NA T V E PT 5 EXP NA LF, SC
370 ppm
pDSSAT D S ; Soy:
D
RUE; soy: P-R
Gn W T H A
N
V R F
T V DL O
E PT 4 EXP C N P(3)
RUE, TE, soy: LF, TE
330 ppm
PEGASUS
D S RUE Prt W T H
N P K
V F T(HU)
E PT 3 NON NA RUE TE
369 ppm

12
Table S3. As Table 1 but across both assumptions on CO2 fertilization effectiveness. The assumptions on CO2 fertilization effectiveness is important for the overall uncertainty in results but typically depends on the RCP and the GGCM implementation and thus mainly shows in the cross-interaction terms with these.
All crops Maize Wheat Rice Soy
CO2 share [%] 23.8 5.2 43.2 27.5 33.5
GGCM share [%] 40.1 59.7 14.6 31.7 31.0
RCP share [%] 15.7 23.7 11.3 3.4 9.1
CO2xRCP share [%] 8.1 1.6 15.0 10.1 10.8
GGCMxRCP share
[%]
6.5 9.1 5.4 6.8 4.0
CO2xGGCM share
[%]
3.8 0.5 7.1 13.8 7.7
CO2xRCPxGGCM
share [%]
2.1 0.2 3.4 6.7 3.8
Standard Deviation
[Pcal]
882 377 220 276 114

13
Table S4: ANOVA results for all GCMs, assuming full CO2 fertilization, describing the shares of
overall variance explained by the GCMs, GGCMs, the RCPs and their interaction in percent.
The Standard Deviation [Pcal] indicates how variable projections are across RCPs, GCMs and
GGCMs. All crops Maize Wheat Rice Soy
GCM share [%] 7.2 6.6 13.3 2.0 7.6
GGCM share [%] 71.7 62.9 59.6 72.0 70.7
RCP share [%] 0.0 9.5 3.9 4.1 1.3
GCMxRCP share
[%]
2.4 2.2 4.7 0.9 1.8
GGCMxRCP share
[%]
16.7 12.4 13.4 20.6 15.7
GCMxGGCM share
[%]
1.6 5.0 2.9 0.4 2.4
GCMxRCPxGGCM
share [%]
0.4 1.4 2.2 0.2 0.5
Standard Deviation
[Pcal]
780 298 170 292 111

14
References Balkovič J, van der Velde M, Schmid E, Skalský R, Khabarov N, Obersteiner M, Stürmer B and
Xiong W 2013 Pan-European crop modelling with EPIC: Implementation, up-scaling and regional crop yield validation Agricultural Systems 120 61-75
Bodin P, Olin S, Pugh T A M and Arneth A 2014 Optimizing cropland cover for stable food production in Sub-Saharan Africa using simulated yield and Modern Portfolio Theory Earth Syst. Dynam. Discuss. 5 1571-606
Bondeau A, Smith P C, Zaehle S, Schaphoff S, Lucht W, Cramer W, Gerten D, Lotze-Campen H, Müller C, Reichstein M, et al. 2007 Modelling the role of agriculture for the 20th century global terrestrial carbon balance Global Change Biology 13 679-706
Deryng D, Conway D, Ramankutty N, Price J and Warren R 2014 Global crop yield response to extreme heat stress under multiple climate change futures Environmental Research Letters 9 034011
Deryng D, Sacks W J, Barford C C and Ramankutty N 2011 Simulating the effects of climate and agricultural management practices on global crop yield Global Biogeochem. Cycles 25 GB2006
Fader M, Rost S, Müller C, Bondeau A and Gerten D 2010 Virtual water content of temperate cereals and maize: Present and potential future patterns Journal of Hydrology 384 218-31
Folberth C, Gaiser T, Abbaspour K C, Schulin R and Yang H 2012 Regionalization of a large-scale crop growth model for sub-Saharan Africa: Model setup, evaluation, and estimation of maize yields Agric Ecosyst Environ 151 21-33
Gaiser T, de Barros I, Sereke F and Lange F-M 2010 Validation and reliability of the EPIC model to simulate maize production in small-holder farming systems in tropical sub-humid West Africa and semi-arid Brazil Agric Ecosyst Environ 135 318-27
Glotter M, Elliott J, McInerney D, Best N, Foster I and Moyer E J 2014 Evaluating the utility of dynamical downscaling in agricultural impacts projections Proceedings of the National Academy of Sciences 111 8776-81
Izaurralde R C, Williams J R, McGill W B, Rosenberg N J and Jakas M C Q 2006 Simulating soil C dynamics with EPIC: Model description and testing against long-term data Ecological Modelling 192 362-84
Jones J W, Hoogenboom G, Porter C H, Boote K J, Batchelor W D, Hunt L A, Wilkens P W, Singh U, Gijsman A J and Ritchie J T 2003 The DSSAT cropping system model European Journal of Agronomy 18 235-65
Lindeskog M, Arneth A, Bondeau A, Waha K, Seaquist J, Olin S and Smith B 2013 Implications of accounting for land use in simulations of ecosystem carbon cycling in Africa Earth Syst. Dynam. 4 385-407
Liu J, Wiberg D, Zehnder A J B and Yang H 2007 Modeling the role of irrigation in winter wheat yield, crop water productivity, and production in China Irrigation Science 26 21-33
Liu J G 2009 A GIS-based tool for modelling large-scale crop-water relations Environmental Modelling & Software 24 411-22
Mitter H, Heumesser C and Schmid E 2015 Spatial modeling of robust crop production portfolios to assess agricultural vulnerability and adaptation to climate change Land Use Policy 46 75-90

15
Portmann F T, Siebert S and Döll P 2010 MIRCA2000-Global monthly irrigated and rainfed crop areas around the year 2000: A new high-resolution data set for agricultural and hydrological modeling Global Biogeochemical Cycles 24 Gb1011
Rosenzweig C, Elliott J, Deryng D, Ruane A C, Müller C, Arneth A, Boote K J, Folberth C, Glotter M, Khabarov N, et al. 2014 Assessing agricultural risks of climate change in the 21st century in a global gridded crop model intercomparison Proceedings of the National Academy of Sciences 111 3268-73
Schneider U A, McCarl B A and Schmid E 2007 Agricultural sector analysis on greenhouse gas mitigation in US agriculture and forestry Agricultural Systems 94 128-40
Waha K, Müller C, Bondeau A, Dietrich J P, Kurukulasuriya P, Heinke J and Lotze-Campen H 2013 Adaptation to climate change through the choice of cropping system and sowing date in sub-Saharan Africa Global Environmental Change 23 130-43
Waha K, van Bussel L G J, Müller C and Bondeau A 2012 Climate-driven simulation of global crop sowing dates Global Ecology and Biogeography 21 247-59
Williams J R, Jones C A, Kiniry J R and Spanel D A 1989 The EPIC Crop Growth Model Transactions of the ASABE 32 0497-511


