APPENDIX F · F.2 AIR MONITORING Air monitoring was ... (SOp), and volatile organics. Air...
202
(Red) APPENDIX F | • • • • • • " •' ' i . . . • •.' ' - ' • • . ' ' ' • ' " • " ! • ' • ' ' " REMEDIAL INVESTIGATION - SAMPLING AND ANALYTICAL PROGRAM
Transcript of APPENDIX F · F.2 AIR MONITORING Air monitoring was ... (SOp), and volatile organics. Air...
(Red)
APPENDIX F |• • • • • • " •' ' i . . . •
• . ' ' - ' • • . ' ' ' • ' " • " ! • ' • ' ' "
REMEDIAL INVESTIGATION - SAMPLING AND ANALYTICAL PROGRAM

ORIGINAL(ncd)
I-" ::."A'i'

APPENDIX F
REMEDIAL INVESTIGATION -SAMPLING AND ANALYTICAL,PROGRAM
F.I GENERAL
The following subsections briefly summarize the sampling and analyticalprogram Implemented during the Bruin Lagoon remedial Investigation.Detailed procedures for sample collection, preservation, shipping,documentation, and decontamination are provided in the Work Plan andPOP. Sampling rationale, health and safety guidelines, and QA/QC arealso discussed in these documents.
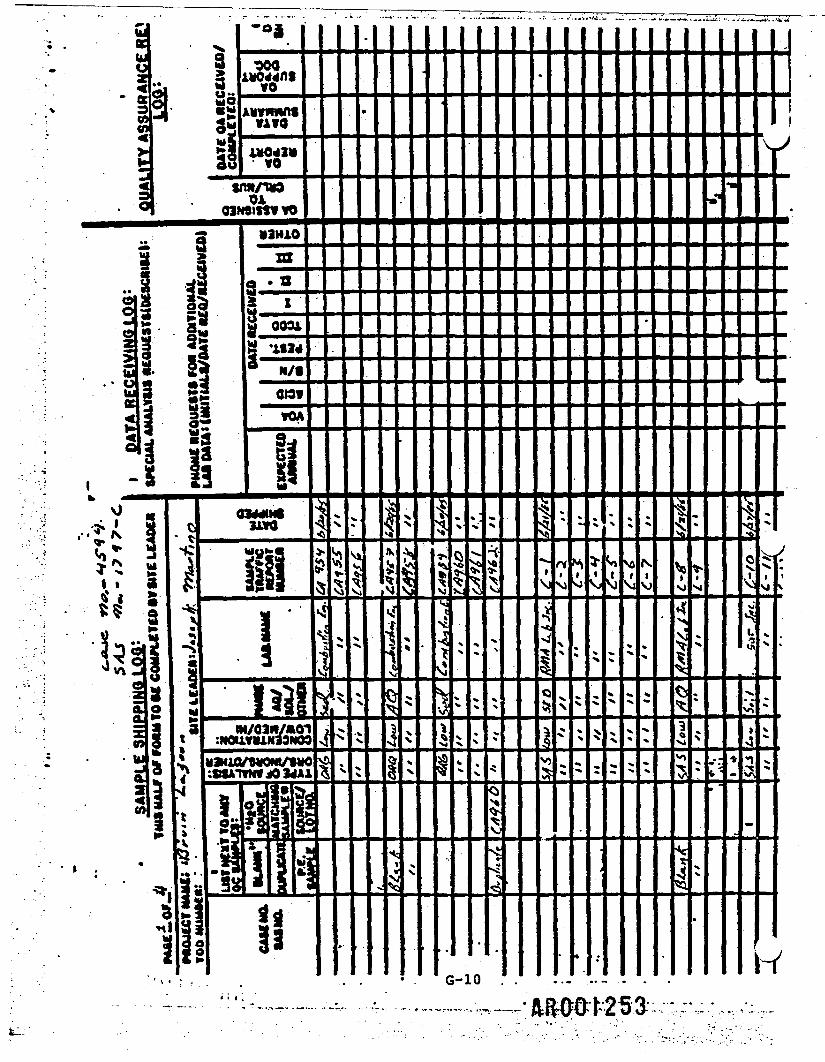
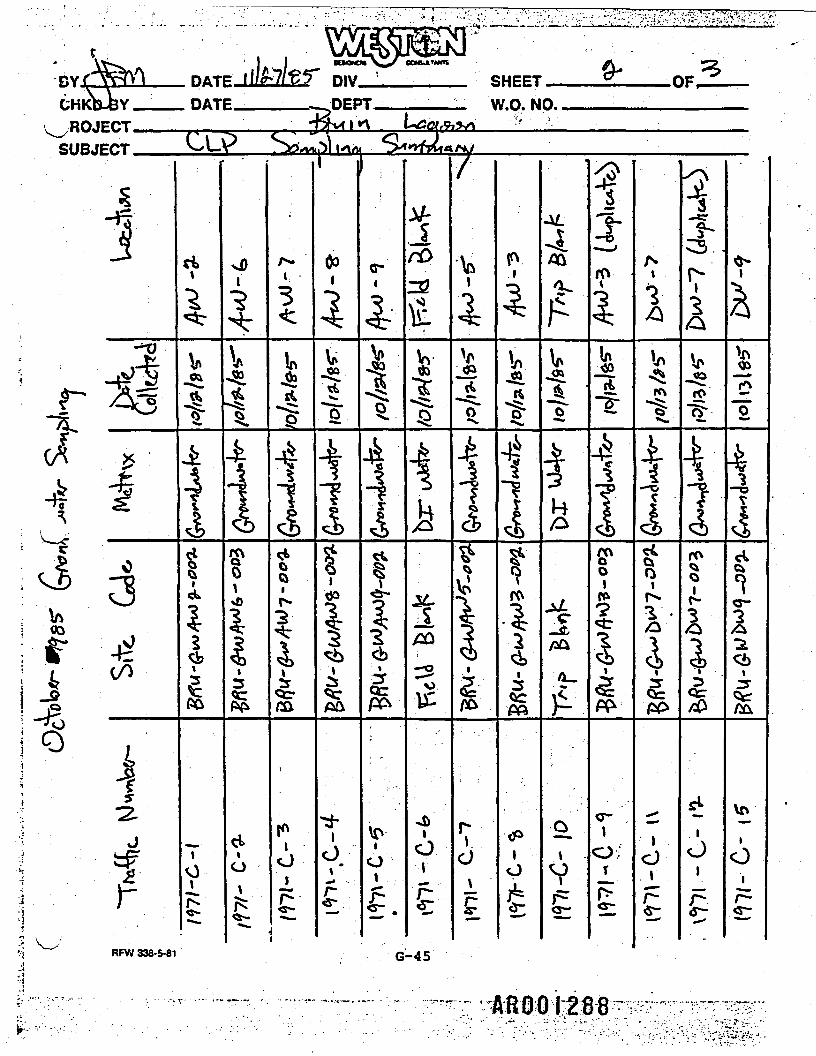
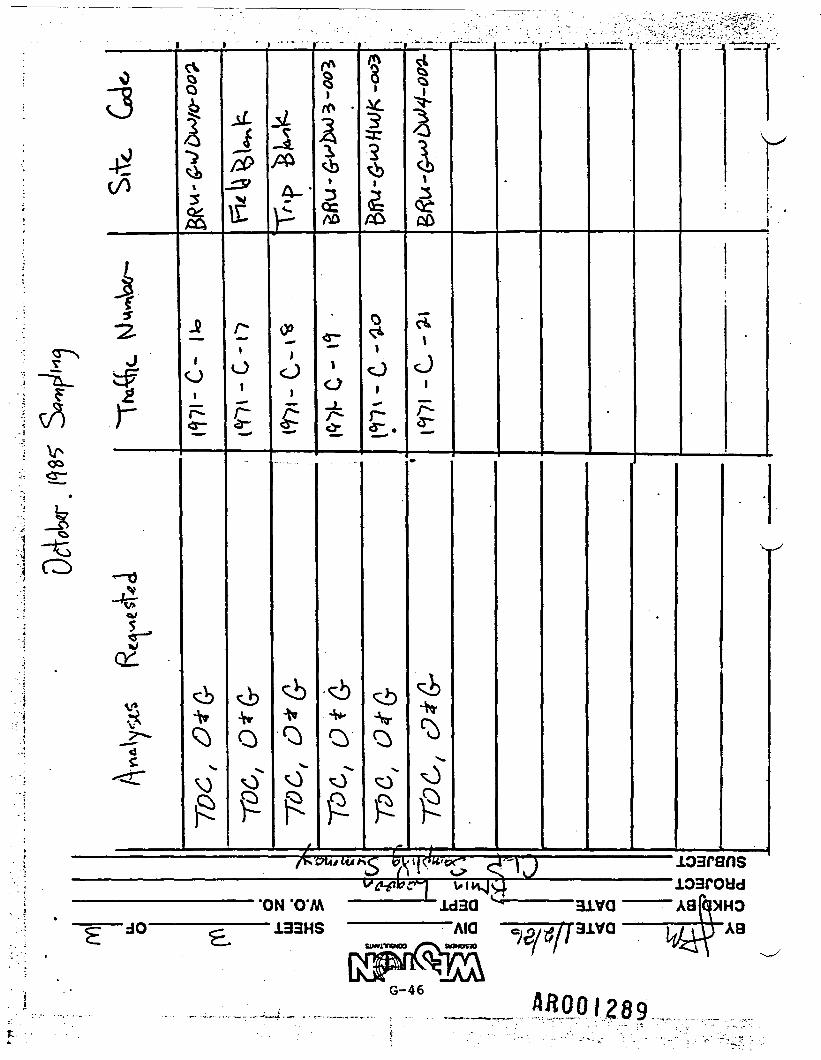
It should be noted that the sample containers used during the BruinLagoon remedial investigation were obtained through the CLP's samplebottle repository program. Following collection, samples were preservedas required, packed in coolers in accordance with U.S. Department ofTransportation (DOT) regulations, and shipped via overnight carrier to •the designated CLP laboratory. CLP paperwork (i.e., sample tags,chain-of-custody forms, traffic reports, SAS packing lists) werecompleted as appropriate and included with each sample shipment. Allanalyses performed at the site were completed as soon as possible aftersample collection.
F-I ASQOI22I

F.2 AIR MONITORING
Air monitoring was conducted throughout the Bruin Lagoon remedialinvestigation primarily for health and safety purposes during drilling.and sampling activities. Air monitoring was also used as a screeningtechnique to characterize the gases present beneath the lagoon surfacethat could be released during drilling operations. The gases of concernwere hydrogen sulfide (H S), sulfur dioxide (SOp), and volatileorganics. Air monitoring activities during drilling consisted of:
• Health and safety monitoring.
• Site perimeter monitoring. •
• Ambient breathing zone monitoring.
• Downhole sampling and analysis.
• Sample screening.
The following air monitoring equipment was available on-site during alldrilling activities:
• HNu photoionization detector (PID) with 11.7 and 10.2 eV probes.
• OVA (organic vapor analyzer) - flame ionization detector (FID).
• H2$ portable gas monitor.
• S02 portable gas monitor.
• H2$ monitor alarms.
• Explosimeter/oxygen monitor.
• Detector tubes - SOj, H2$, H2S04, 02, C02, natural gas.
F-2 1222

Due to the known gases present from past site work, portable directreading real-time instrumentation was primarily utilized for gascharacterization and health and safety purposes. Detector tubes wereused for screening of possible instrumentation interferences,confirmation of direct reading concentrations, and analysis of gases notdetected on available instrumentation.
Monitoring equipment and detector tubes were used in accordance with themanufacturer's operating instructions. Prior to all investigativeactivities, each Instrument was calibrated using specific calibrationgases. Weekly calibrations and daily response checks were made to ensureinstrument operation. Instrumentation that did not respond or calibratecorrectly was not used on field activities.
Table F-l presents the specific air monitoring equipment used with modelnumbers, detectable gases, detection ranges, alarm concentrations,sensitivities, and possible interferences.
The direct reading monitoring instruments determined to be most effectivefor monitoring drilling operations were the HNu PID (11.7 eV), H«Sportable gas monitor, H,,S monitor alarms, and SOp portable gasmonitor. The HNu PID (11.7 eV) was selected over the OVA FID due to thesensitivity of the unit to hydrogen sulfide gas. As a result, the HNuPID (11.7 eV) could detect both hydrogen sulfide gas and organic vapors.This selection was made because of past historical data demonstratingpossible HpS gas release.
ftfiOOI223

a*•
S
•H r<.« ab
B
2
VSVMU
2
V V(0
5§*»44J
S*
•8
(0
83
V
JJgc
u
O
a att< S*Hi Oi
a! S rH m alCM CM O CM rHi i i t i j j < » O P a ! SO O OO O S ^^CM +|
0)IiOf HP
•fl C w vt>2O O O CM rH
rH 2 rH
o o o cr> o <JPQ O O C™ in O
CM CM rH £ I CM g5 rH 5 CM .5-5I I I I I Q , O I r H S ( A r H J J J J
1 CMO 1 f*
m o— 1 O
m o §sCM CM rH E I Q «J
do o' o o orHA
U I I I I I I
u o o o o o o
fl) 1 o 41»q IQ Q, >o( O n ( O - H W - ^ i g - t n a j 0 )M I H M U H I ^ I U ^ MH'C'Q'QO O O 'H "iH rH rH (0 rH **4 **H > HQi QJ U4 3 X 3 V f O C 3 X O X
O O > O O9» 4) "jJVw § -52•»• *O -H • » < & > u rn C O C O O i u u C CC --H C C OS O 34IO 0 33 Oili g < M < q QiH >w u 42l7lt>' u oj u^ ^ 3-. _C/>rH O1 t7> TJ rH 'Q S >1 "O TJ " "~• U >. JJJ H 3 U J i > i 3 j>> 5?j>i 5 .33H}?(0O W O O 3 Cfl = O O — = W W U O 2
C <Qu
Gu CM
ootM
CO>. COtn yjj jj -S X
U) 10 r-l C 2nj o NW 01 b JJ
id 3S SI i S IU U X 2 u -3N N 5"~ 3 3 O JJ •-> £>*«-»>•<-•> *J JJ JJ V 0f* > r— > f 1+ •** -ri ••* 5*J U
C •— --* N ^ 5 ~ '•/] ' " J3 p- < .N c _>, S S 2 _£ 5 V2 r 23 •TI'J -n JN -.3 "o,* J2 — 2 « IJ C -N Q -^1 5J -"M 3)2 « — — • — C<= 35 = 2o 3'
r F-4 AMD 1221*

Periodic monitoring of ambient air at the site perimeter was performedroutinely during drilling operations. Also, if ambient breathing zoneconcentrations Indicated possible gas releases, perimeter monitoring wasinitiated immediately. Seventeen monitoring locations were establishedalong the site fence line at intervals of approximately 150 feet andmarked with stakes. The perimeter monitoring locations are shown inFigure F-l. Perimeter monitoring was conducted with the HpS and SOpportable gas monitors and the HNu PIO (11.7 eV).
During all drilling operations, the HpS and SOp portable gas monitor,H2S monitor alarms, exploslmeter/oxygen monitors, and HNu PID (11.7 eV)were used for characterization of the ambient breathing zone. Backgroundlevels were determined prior to the start of the drilling work. Portableinstrument readings were utilized to provide continuous, real-timemonitoring of each split spoon and drilling depth to determine at whatdepth, if any, gas releases occurred.
If ambient breathing zone monitoring showed elevated concentrationssignificantly above background levels, a grab sample of the gas presentin the boring/well was collected for analysis. These grab samples wereanalyzed to characterize the emitted gases. Grab samples were collectedfrom a point approximately three feet below the ground surface byinserting tubing into the well/boring and pumping the gas into an air bagcollector. The bag sample was then sealed and analyzed on-site usingavailable instrumentation and detector tubes.
&ROOI225

MWOI226

The portable gas monitors were also used during drilling operations forsplit spoon and bedrock core sample screening. Each split spoon and coresample was scanned with all direct reading Instrumentation Immediatelyafter collection. Samples showing positive readings were usuallyselected for chemical analysis.
Air monitoring was also performed as a health and safety measure duringthe two rounds of subsurface gas, groundwater, and surface-water samplingconducted 1n September and October. Portable monitoring instrumentationand detector tubes were utilized to characterize the ambient breathingzone during these on-site activities.
F.3 SEDIMENT
Sampling and analysis of sediments from the two ponds located on theabandoned refinery property along the southern boundary of the BruinLagoon site was conducted to verify that they do not contain significantquantities of waste materials.
Pond sediment sampling was performed on June 19-20, 1985. Samples werecollected from the ponds across three transects distributed along eachpond as shown in Figure F-2. Each sample was a composite composed ofthree grab samples collected from the middle and either side of thetransect.
RROOI227

Note: Depth of water is shownfor each sampling location.
«*
AbandonedRefineryProperty
Scale In Feet
HP=?40 0 40 80
FIGURE F-2 Pond sediment sampling locations.
F-Q AROOI228L.

Samples were collected from a boat using a clamshell dredge. Individualgrab samples across a transect were composited in a stainless steelbucket, mixed thoroughly, and decanted before being placed into samplecontainers. An HNu PID (11.7 eV) was also used to scan the samples. Theclamshell and bucket were decontaminated between samples. In addition tothe six composite samples, duplicate and blank samples were alsocollected.
Pond sediment samples were analyzed for TOC, oil and grease, volatile andsemi-volatile HSL compounds, and EP toxicity (metals only). Allanalytical work was performed using the CLP.
F.4 SOIL
Sampling and analysis of on-site and off-site soils was performed todefine the nature and extent of contamination at Bruin Lagoon and toprovide a stratigraphic record of the site.
Soil sampling was conducted during drilling operations at the site fromlate June through mid-August 1985. Fifty-nine samples were collected forchemical analysis during the construction of borings for shallow wells(AW), bedrock wells (DW), and soil borings (SB). These samples werecollected at discrete 2-foot Intervals with depths ranging from 0 to 26feet. Figure F-3 shows the locations of the wells and borings.
ASOQI229

AROOI230

For each we11/boring constructed, continuous sampling was performed fromthe surface to auger refusal using ASTM-approved split spoon barrels. Adecontaminated split spoon was used for the collection of each sample.
Samples for chemical analysis were selected on the basis of visualappearance and readings obtained from screening with the portable airmonitoring equipment. A portion of each sample was also retained as anarchive record of the 2-foot interval sampled. These stratigraphicsamples are stored on-site in the decontamination trailer. QA/QC sampleswere collected as part of the soil sampling task.
The soil samples were analyzed for the contamination indicator parameters- pH, TOC, and oil and grease. Additionally, approximately 30 percent ofthe samples were analyzed for HSL organic (volatiles and semi-volatiles)and inorganic (metals) compounds and S04. All analyses were performedby the CLP.
F.5 BEDROCK
Sampling and analysis of bedrock was performed to delineate the extent ofcontamination in the bedrock under the Bruin Lagoon site.
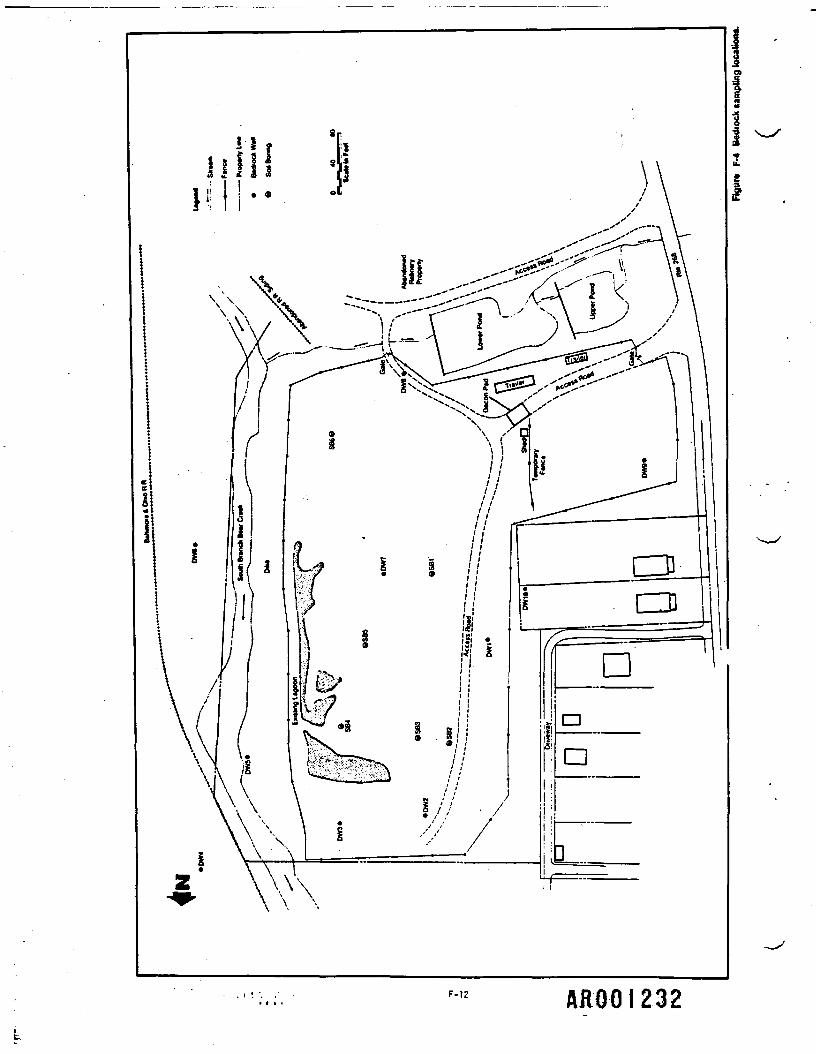
Bedrock sampling was conducted during drilling operations at the sitefrom late June through mid-August 1985. Approximately 680 feet ofbedrock was cored during the construction of bedrock wells (DW) and soilborings (SB), and 27 samples were collected for chemical analysis. Thesesamples were collected at depths varying from approximately 13 to 51feet. The well and boring locations from which bedrock samples werecollected are shown in Figure F-4.
F-ll A100I23I
F-12 AROOI232
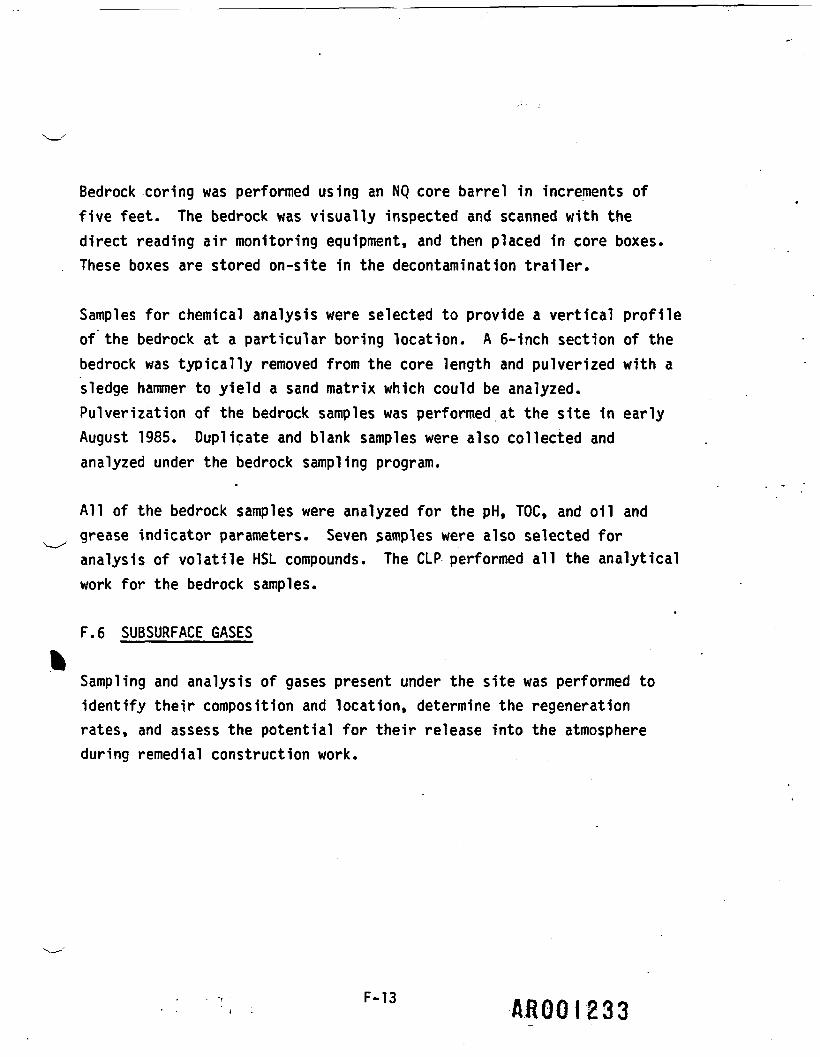
Bedrock coring was performed using an NQ core barrel in increments offive feet. The bedrock was visually inspected and scanned with thedirect reading air monitoring equipment, and then placed in core boxes.These boxes are stored on-site in the decontamination trailer.
Samples for chemical analysis were selected to provide a vertical profileof the bedrock at a particular boring location. A 6-inch section of thebedrock was typically removed from the core length and pulverized with asledge hammer to yield a sand matrix which could be analyzed.Pulverization of the bedrock samples was performed at the site in earlyAugust 1985. Duplicate and blank samples were also collected andanalyzed under the bedrock sampling program.
All of the bedrock samples were analyzed for the pH, TOC, and oil andgrease indicator parameters. Seven samples were also selected foranalysis of volatile HSL compounds. The CLP performed all the analyticalwork for the bedrock samples.
F.6 SUBSURFACE GASES
Sampling and analysis of gases present under the site was performed toidentify their composition and location, determine the regenerationrates, and assess the potential for their release into the atmosphereduring remedial construction work.
F'13 AROOI233

Two rounds of subsurface gas sampling and analysis were conducted at thesite. The first round was performed in early September 1985,approximately one month after the completion of the well Installationprogram. The second sampling occurred about one month after the firstduring the second week of October 1985. Twenty-three samples werecollected during each of the two Identical sampling rounds.
• •
The sampling program for each round consisted of the collection of a grabsample of the gases contained in the 10 shallow wells (AW) installed aspart of the remedial Investigation and the 13 shallow wells (A) installedby the emergency contractor during the summer of 1984. These welllocations are shown in Figure F-5.
Grab samples of the gases contained at the top of the shallow wells werecollected using the air sample connector located in the cap of the wellhead. The design of the shallow monitor well heads is shown In FigureF-6. Samples were collected using two sections of Teflon tubing, apersonal sampling pump, and an air bag. One length of tubing was •attached to the air sample connector on the well and the inlet of thepump, while the other piece of tubing was connected to the outlet of thepump and the air bag. A sample volume of approximately 10 liters wascollected from each well.
New sections of Teflon tubing were used at each well and the pump waspurged with ambient air between each sample's collection. This procedurewas used to prevent possible cross-contamination between wells.Duplicate and background samples were also collected for QA/QC purposes.
AROQI231*

oIiI
F-15
&BOOI235

Slip on Connectors
Used to Sample Gas At „_ S \ ^ ?/as*Top of Well ^ -4f V^^Vah"
2" Gate Valve\
2" Male Quick Connect
11 11^II >IIIIIIIIIIII-IIIt—IIIIII1
11IIIIIIIIIIIInn
—— H— iiMuiIInMMu———— H —— l
IIIIIIIIII
1-
—
Used to Sample Liquids
Cap
Teflon Tubing to theBottom of Well
Threaded and Glued
PVC
Stainless Steel
Figure F-6 Detail of typical shallow monitor well head.
F-i6 AROOI236

The gas samples were analyzed immediately after collection by on-siteWESTON personnel. Each sample was analyzed for volatile organics, SOp,H2S, H2S04, 02, C02, and natural gas. An HNu PID with 11.7 eVprobe was used to measure the volatile organics content of the samples.Analysis of the six other constituents was made using Draeger detectortubes. Samples were drawn directly from the air bags for analysis via a3-inch length of tubing. Analytical determinations were performedfollowing the manufacturer's operating instructions.
F.7 SURFACE WATER AND 6ROUNDWATER
Sampling and analysis of surface water and groundwater was performed todetermine the impact of the Bruin Lagoon site on the South Branch of BearCreek, and to define the extent of contamination in the shallow liquidzone and the bedrock aquifer. Elevations of the shallow liquid zone andthe bedrock aquifer, and the South Branch of Bear Creek were alsomeasured to develop groundwater contour maps.
Two identical rounds of water sampling and analysis were conducted at thesite. This work was performed immediately after subsurface gas samplingand analysis was completed. As a result, surface water and groundwatersampling occurred in mid-September and mid-October 1985, approximatelyone and two months after the installation of the monitor wells.
The sampling program for each round consisted of the collection of twograb samples from the South Branch of Bear Creek and one sample from eachof the 23 shallow wells (AW and A), 10 bedrock wells (DW), and oneresidential bedrock well (Hawk). It should be noted that some of theshallow wells were dry and, consequently, samples could not be obtained.
F-17 W800.I237

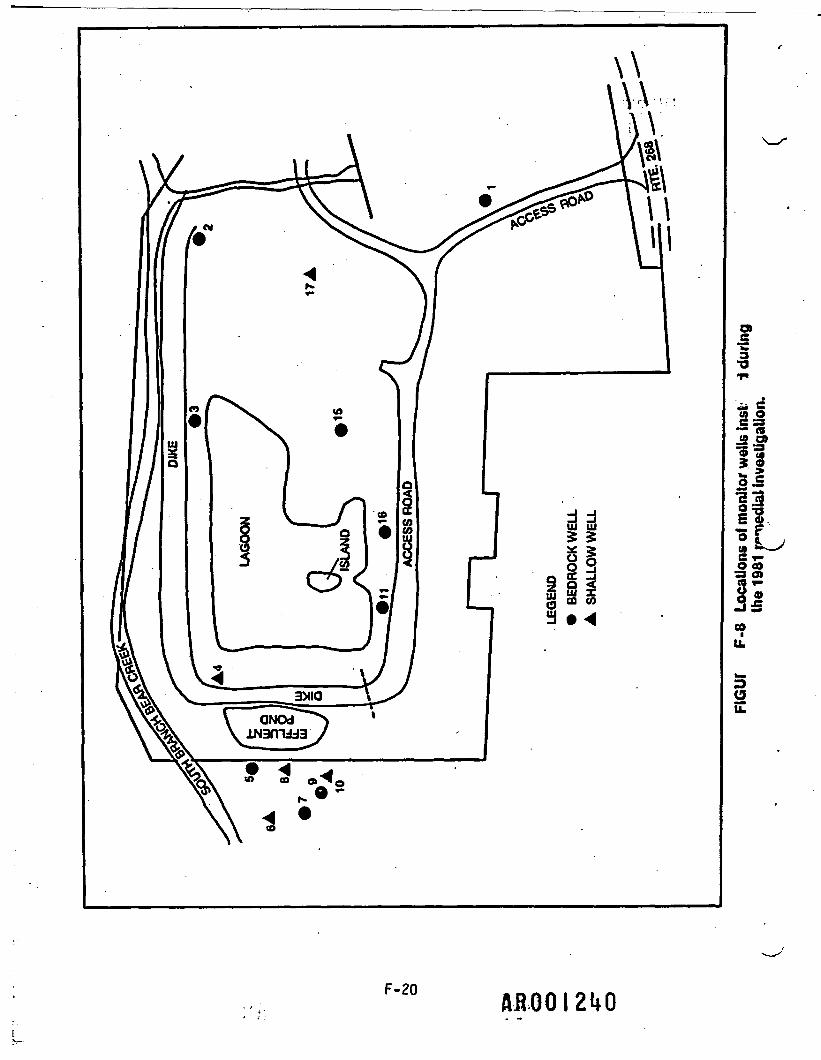
The surface-water sampling stations were located approximately 50 feetupstream and downstream of the site fence line. The locations of thesestations and the monitor wells are shown in Figure F-7 and F-8,respectively.
Prior to sampling, depth to water/oil measurements were made In each wellusing a water-level Indicator probe. 011 was present in a number of theshallow wells. The probe was decontaminated between wells. Surface-water elevations were also determined at three staff gauges along theSouth Branch of Bear Creek adjacent to the site. The locations of thestaff gauges are also Indicated in Figure F-7. All of the water surfacemeasurements were made 1n a single day to develop elevation contourplots. Water measurements were determined on September 6, 1985 andOctober 10, 1985 for the first and second rounds of sampling,respectively.
Surface water sampling was performed by wading to the middle of thestream and directly filling the sample containers with water. The •downstream location was sampled first. Approximately 20 minutes elapsedbetween the collection of the downstream and upstream samples.
Monitor well samples were collected using a stainless-steel or Teflonbailer, or a Johnson-Keck submersible pump. Each of the wells was purgedof standing liquid before sampling. A minimum of one well volume wasremoved from the shallow wells, while at least three well volumes wereremoved from the bedrock wells. Sampling was performed immediatelyfollowing the purging of the well. Samples for oil and grease analysiswere collected from the top of the wells with a bailer, while all othersamples were collected from the bottom of the wells.
F-18 AROOI238

F-19
AROOI239
I•a
cO
w —"IIilo
F"2° AROOI2UO

The bailers and pump were decontaminated between wells and a new sectionof nylon cord was used for each well. The samples were preserved, asappropriate, after collection. Groundwater samples for metals analysiswere filtered on-site. Duplicate and blank QA/QC samples were alsocollected for each round of water sampling.
The surface water samples were analyzed for the indicator parameters (pH,TOC, oil and grease, and specific conductivity), as well as volatile andsemi-volatile HSL compounds, pesticides, HSL metals, total iron, ferrousiron, TOX, S03, and SO*. The surface water samples were not filtered.
Samples from the shallow wells (AW) were analyzed for pH, TOC, oil andgrease, and specific conductivity, while samples from the TAT shallowwells (A) were analyzed for pH and specific conductivity only.
During the first sampling round, groundwater samples from DW-1, DW-2,DW-5, DW-6, and DW-8 were analyzed for the four indicator parametersonly, while samples from the remaining bedrock wells (DW-3, DW-4, DW-7,DW-9, and DW-10) were analyzed for the same parameter list describedabove for surface water samples. The analytical scheme was reversedduring the October sampling. Therefore, over the two rounds of samplingconducted, each bedrock well was analyzed once for the indicatorparameters and once for the expanded list of parameters.
The Hawk's well was analyzed for pH, TOC, oil and grease, and specificconductivity during each of the two sampling rounds.
F-21 AR00I2M

With the exception of pH and specific conductivity, all analyses wereperformed by the CLP. The pH and specific conductivity of the sampleswere determined on-s1te by WESTON personnel as soon as possible aftersample collection. A Haakebuchler pH stick was used to measure pH and aYSI Model 33 C-S-T meter was used to measure specific conductivity. Eachinstrument was operated in accordance with the manufacturer'sInstructions and calibrated frequently during sample analysis usingstandard reference solutions. The probes of each unit were alsothoroughly rinsed and cleaned between measurements to prevent cross-contamination of the samples.
• : . , , - . F-22
I_

•fJ
APPENDIX G
SAMPLE SUMMARY SHEETS


• I
o g*i- raffiaw W'i*1*1*14*1*1*1*151*1*1*oro
S
G-4
'Si 1 1
-*'3?
IIIls?l


xj
M
<
ylSi«w
•300to
°llit...vito1M04Mto01aiwitsvto
- - • mI _j"*63iHI
tt. 3Iu4««. «•! I" »/•32 ES I oraf51 31 I -*0*sr si n
»Ml J lHM-.IMS
- •*- »»li l-r I -J -
I*""ISJ
» ? : g*M'H'H I Wk
M3M10
0031•1S34
UtO Or«
O
aa*S lc"l :»wiit«rN¥bH03»^a
fi
13
v
G-6
<T
J
•rU
P

I ug.MIffWo"'
°" "°,r"SwirSafliNcKitte
«1H10I
mnT00311
w *

/ Jr Ua
uVa- *• c«u««><•«4<••
«I
i
il2 jSuia
o
i
• • .
\
**•o• o^ Q
a\A i
{/ *aaV
*
tfiOQ
• '
1•
;
^
. 1
j»
:• iI '"tI si '-1 :9 *9 3? 1» i
3
b.' J
iiwa
•sCO
a i
Ii"
1..go«g
wiii
Jas.•300ivounsto
ivtimnstito
"to"tnijrwa
|ii
jiji*
S
W3M10m
I-. B1| 0031
i-•111*N/f
013VtOA
ii03M111
Ht•o
13ii
'
^
X| ;
• ' ~
» 1?d 0
^
3 ~*8 ''L
m/QlH/AQl 5:NOUt«lNi3N03 f -
:«SAltNtJ03411
iSByIII1it
|3
iww'i
• .
.
>
t -^ *
t to > \rf f f?J O «J U
i s - »
*
\i
*
(
»* .
N'lV/
*
v«
•%t
f+
1
1.t
*
B1
vi1V
i
1
1VJ
«
-
NiO
s.
ri
<J
-
•lVJ
V
-
^
0
M,
y
-
Vj
•
r
Vio
•
9r
^
-
Xc
.
•
.
|
|
0V
M
1vtV
p-
1
"
*
.
-i
•
c
|in
u
C10VV
Jvi
1
V
1X.
-
1-J
t
-
•
•
*"35J
O
o<
—v>•x.
•*
•pr
-V
t'&
*v*
'•m
-N
Oeri
2
5i
£
.ccr
^
.•••••
•
ri
=
c"
V
;
r
^

l* OS',
„, ... -,i-.. ," _.'.";' "..
' V' -V - •'"•
g£SBS3
3O
•300ucmntto
fltQ
1M043Uto01
03NOt«St tO
F fe * ••:-i*.Wii •
W
I
ilPis
^ 1§-S I!
QIC i ..i 3
°.«M
U1H10m
o •n
0031•ItM«/tonv
___VOA
Sg '
uto
•"" IrlM yi.'j .i ii|Oi(.jI ' rawi racsiBwi!
*i/Qin/*cn8| :HOUtilIl33H03
•SSSB l
4
IS
CS
VI I I I I I I I I I I I I !<*« I Ic-fc
S
$*
G-9
,.. —, —• • .-••".
G-10
t:.-'


1
OUALITV ASSURANCE RE5
\
il1?• Vui i. • c «ui «ge ;4i ic iii
'••>? !» N <
>5 !I 4 i* «^§
• '3a• a.50)uaa40)
•'_
3
11ii
*
AIWIINASVIVO
mo<3«vo
0103N8imtO, j•1«<. 5'
•s«<11J
% .
.
1*i
•ii
V3H10m. S1
i 0031n *iM*a »/•
Or3VVOAu
I i 3 03441MIj J 3WO• ^^
5il••
iiu32
I
§
*i,3,i
i
.1
a1S
X
* V
•4t
3c«c
iiil'
*i •s •»
VJ VjI-iai?m/Q3N/«01 .
:NOUtVlN33N03 I *U3M10/9MOM/1UO •» -:«t&TfNtJ034Al 5 x
SB'**
lli
3
u
jt
BC
(k
M
-
1
Sifc "^ Vi M
\
< ^
i N
^ V! \
! N
V,
l
*
t
^
N
S.
*
•
•
'
$
fe".1
^
3
^:
S
1
-
V7
;
^
^z
>
-
^ft
$
JVHM
V*
^
C
1
1*
1
•j
.
.
c
1
t
t
iu
t
t
^
*
a.
S
4«
.
%
v£
*
*
•4'
i
1
•
K
oIA
ii31*S
VJ
V13If$
••'
rJm0
4
S
3
f
VT>
<
*
"- 1
"
O
s
^j
f
•P
•
• i
•"
it0
*
£$
•*
o
'
if2
s
AV.
f
^
$^
t
A0
'•
§
4
$
ie
n
i!
->
J
;
G-12

0
u9Cuca
^ _ y * ft
f
•4
. i
'•••
a wMe
il
JSJ-•300t(f
AVtimftStito1M043VVO
SON/TO01
MN<ft V
* ———— tVMOIllQOt MM
flUAOW 3*OlW
:|MW3S30)1163A03<t tlSAItMV ltt934S
:001 ONIAp03a Vivd
I•
- . ',-•vuA-JtI-
. ••
O. cJ< i
**
_/
1iaS
3S
»
W
fi
I
1i«
i*•c
CO•* *
81t
C3 '
C i
*
B
|
I3
» _ . . _M3M10 1m
e
!-o
. B. tQQ31•1S34N/ScotVOA
Ii03444M13XTQIIs11
ii,:;5i
S * * 'rCB «J * •
<1 <1> 0 s.
I"1(5, "
M/Q3M/A01 S -. .:NOUt)llll33N03 £
fttnTNVMUll " *
5
'Is
?!i i1<s•11
j-j
|! £
11
r'
, &
•
' * * *
J gi .r " 7 *^
«u v! o Cj
V » S S S
. > S , ;
* - - ' '
t t y * s
^
-P
^
G-]
V
-
1
•fe<r1
*
/*
.3
*:
ff«
-
Q«
VJ*
1Q
t '
*
'•** =/ i
- *
'
,
»
•
.
»
•
•i
•
V
•
-;
*
•
^
*
—
ftftD

frl-D

<!• •
RFW338-5-B1G-15
-AflCOIESS

<
*£oo
03-el
j
o
\
$
t
0
AD
o\o
_ _ Olor
JT
Ji
O IT O
o
Qi; 3
t£> \ flft
r- c0:
-d-
»roIr-
a^ «-r
S ^^ L \ « I—' ?
X
fX
vj
A-UA A-tu
X
O
O
X
A-a)rVO
O"
«
ot
oAT
l0
•3-
XT
oVO O o
o"•YQo"
S0~
^- p- F. P i2 p750 ^ ^ S pA
<c
4-,
)*.
o
o
d
iooO«5
d-l
r-
v5-X
V
pAU]
*w£r~|•ON'O'M ————""idaa ————3iva
G 1 ^
Q—:————— loarans"^———————xoaroud
•JO————^5————133HS —————————Aid <=,,!»/y?//31Va———L/i \J A9

rt 3/py. l/r^/oc^"' • ..;vs*:<- v^.DATE-lU£lLE2 DIV.________ CHPPT -.*- ppHKD BY ____ DATE______^-^DEPJ_______ W.O. NO.
-
i^ _ „ _ __ v)
e: r-*-I IN
§.^k 44
At
1C
.ol -ef S-d a
0cc«i0
QOt3
r *v f\ .
S
oi
^DI
feO
O - °
ADif
CO
t • »3
i51
»Tc-IT* tr
J?
° ^ - - IPi iO VrO oi ¥
OI 1r- «- » o-
o! u£ ' O
RFW338-5-B1

G-18

vSUBJECT
^00<3-
S1-t;r»
L)J\j*1i03c/)
4yJij
t~_
i
5$
0IV
Vn
3^
[f\
Ox
l
J
iACs
c-•3-v
IVJ1 — 'p* <r
?5
^
1
^
O1IY-vto
]*P
A0
11SorPC*
iOir-s-r
0jV
o7"33 7
Iftua•0
r
-;
T»-cs\
1
I1^ .
VJ&.
;
l01r-c
•v_ 1ck
Oi
1
1«V>4z^• * ' . '
+
r0
o
1i5 -fi&
&i —0\,r-c-r-
j — • —
i7*4t..5Sfx
/x«
f
rj \•
r-o0ir-j .
/JCi
_
1
0ir»>
i"o
f
I\j\Cb
r-
s
0O1r-3
•s/>P
S
vj1r -
/t
r-3_
livJoV
0v\
001r-
1iSIX.
1
1f>
-
~ 000-5^ 3
/7"
1.ifi-5^•
1~r
? a
<r-j
3CCCO
^iO1
rj-
:*?'•-
Tlfi^P>W
*•0
00o- 01rI
iK&
*'"O•r-r;
17-
"3-\ ; '
\y<*a
-S
o(A
gO1
.-y :
CCna
e-
iOir~-r
i"s
i
•ilr>vio
^'
X
0
oo1
i;i
tscA -
•3"
Mo* C^1|X,
r;o
1ct
*
3orVr.
T1
^
oW
t
'
1orOO
r0ir-r-
i
^r3
«*N• wr-
W3-0
\
CC££
r-ioir-r
RFW 338-5-81G-19

*
-n0OJV
•
kf*"i
$T" ^
T '. tf\ ^i *>*t ^ *1•j»""' "**<- j X ^•4 — £••i 3"1
-71 -a^ t —1 — 'ti.% ^
3 5,I ^• s.— -
"i«
• j
3 J^1 J-j *****•:•
!
oi
IJt
ro/iO
r-r
U)O
._
1po
j£
r-
r-
c!?-VOo
C
SS-2.V
1C
lrr*or>-r-
ci)0o"
c*
,M»
o1r-
^
iTX
io
V
o"
r.fr-
020i
3(A
1
r0r£
ioVJ
r^
r-a•3-POJt
00r-io1r-r;
«
Oo"
.
. .-««fc/.*.
5A3
£"">OK\t
.
CJ
OO
S.
^
•»! ———— ... ———
.
*
£U
S••*.Qif
J
o-
0
f
Cfc
o\
I\(1C
00
1oVr-
Svj"
)-3To.
00Q\o-
u .
1It^
f'
1
\ *"
^ ^^ ^^/Y\
_^ ^
^•»s
V\'
^^^
0o"fA-
•
oio-
'•'irt")s
0
i0
V£r-
6oop.i:
..- .
o
!.|-a
I
__iOVr-<rr
Q
O
hA-
•-— — '«-^ -ooi
jDCCD
Ci
\0
tr-<rr-
^
vb0
h
A.j . /wuutuMf U'lK'ift*'1 J'-v™) " "" """'loarans3 f ifff \ injl 103POUd| ON OM IddG /* 31VO AafflXHOi C.dO 0 13dh» AlU c,nyy»/MlVU I,/|\\A«>

•VV- ' - :
J I «OOHD»\ /~«»I™»IB ' _
__ DATE jlMjm DIV________ RHPPT^ f np ?__ DATE______^J5EPT——————— W.O. NO.
SUBJECT -_____ V U.V . >yi>v. l>An. ^
te
1
-el
InOB
ii
oI
5
a4
frr-
>\c
1
i
r
rct.i
ir-
I
r
r-
O
3-*Ai
CD
v\i
iO
r-«-r
f
J*r-
5
fl-
to.
00M v
orO
JPC*
CO
-d:O
RFW338-5-81 , « «. •
t-. r-:-'.'' - ':-•-:.-'•'••• - :.-,.'•'. •.' ':,'••• ;':'-\C..-Y-'-.;.':;' -.;-:
*-I
oi
so
vr3
o
I"A
±J
Cbr*
IT
35\
9(Too1
\CD \ QZ \ *e
1o
! ICO
\*tOI
tO

-o0 ^- r cv O0
^F
oo
>v
a
vji
VNt
VJ1r-
iVJI
a
r-?:*c: o
COV
QC
IVJIr*
3
*
tVJ1
ocrCO
£r
i
1
.0 - ^ $
\
o-r
•3 -fc,-AVN
e
CJ
oc
o\
_Afi00-l265

HATF tl/£7/g5J DIV________ SHEET,____±!___OF.DATE____~LDEPT .
gim.iprT ^^_>___-~~Y
^ •
.V_
1
iJ^
I
O0I
1<r
US
i£r
t
r*
o0
to
Vrv
O
ITc*»r-
d\'0
VrooI_1 I ft ^ i 7 —t- * I
CO
Qc
10
co\
G
o 00
JE
8
VA1
iO
1L
Oo
"S7
V)u:
t,H/a
— s"5U-
vn
Oi '
O0
r <.r-
•3-
\u\r-
*.
2:'
0»-
3"QCCD
iO
ir«*>"f^ •—•r
0
35w1CC
o3-tO1
RFW 338-5-81 G-23
1
0o\
U1
IT.i
o
3- ~OQ ic
0j
00
CD (£>
\ iO O
ir-
loaransioaroudAafaMHo
AH
G-24
-,-' ._,-,,_ ,.....„._ .___AI00J 261I;," •-.-. ••.•-•::, --•,. V,., V - ;fc."

RFW 335-5-81 G-25

G-26

;V
•'i .
i|
J
£
.OF.DATE______~_DEPT______ W.O. NO.
2
«•
•oro-
— -Q
VQ0
rt
a
1C
— vorcr
V*
IQ,
iPO
0
t/Vt
OrCD
ITa-
00 j , pjj
1 • . I ' t
AT
vP
r-
O-OO
. \COJv>
fiD
j*
o- . 8
VrOo
0t
S
!r-*
PO
CJ
\r00
0035
orCO
1O
ir-r
RFW 338-5-81 __G—27
.' 9
-r)
Vr
OCA
Oo
tOr-c—r-
_ iO
AAIn
1V
3
'flDo
.Vf>
I
cb) Io o
Ir-
i
1270

1271

urwi^\>iu%v>UNJ /I I eowcw x*X eaMULTMn /
nATP.ll/£7/1?yoniv SHEET _____-DEPT——————— W.6. NO.—————
PROJECT————_——_——. , J?M)
1
*V 3
"•K
i
r>"iva •O
, T«0
to
?r--
fft
>* XT*- » T _ • .,- .'»
-iisi
Pto
r-
fc
' JCO
k
it
-r
1ooTo
0 " "" a
a
MO
ii
ir
J O
bl«t O
*IT*CV
Ok
*
v)
O
rjo
0
k 00_^J .r-o
o
QC:
* G-
U
F-3-
o
\s
O
ti
0
i3-
IO»
5RJ=W 338-5-81
G-29
ro
JeCo
? i-0
ti- \o r-

:j ST'•} 3-
•,.':...;:.. :-W-- A'.; . '':>• ',.:•'.•' ;; -•'" •;'.'• v:;-.- '.: . •-'•'.-'•• . ••'-• •-•v-v;.'-;;; '-"• ' ' :'- .""• '•' " -' '. " ' • ' ' . .'. ..'•'•..* ' " ' • ' ' . •-':''. : ''• -'"J'.i.'' •".; """.'•'• ••.' :
• • • -'••••••••
3g
0!
iHf•s
" S- -22
\i
*
^
\r. cr
~d
<c
••.-. ...:.• r -..,. . ...
\J
~S-i
•
/X.
/ i
o-\O1r.r-
vbV0
^hT.
ALr
—rA-
•— -Q
^
j
i
ir-o-r
vb
O
o"^p~
"oo
t"b>"oo
i
A
i
r;
cbO
o"oh.ft-
- ••••' , -.-...: j..-.. . , .. , .• ... ..,_... . .' ,. ........-,„-, .... f .. —— r--'. -.-.
^
~C^
«•*^
/C
S<rf
>
.
•
3
-0T_
i
Otr-P.— -
vb>0o"P-t
s
\
—rft
rt
1
ooOi
r"—
OvS"51A-
f
=oTo
\3/O
03lO
rO-r
cb
0}
A-
sQ
T%-"ro
Ti
iOtr»r-**
cb-v-
vf{
A-
|"cO3
6•o-r;
vO
"N.
O)1A- .
"oo"e-0»fN
•=r\
E
OkiO«.r-i .*
vb0o"{
i"
i^-~5>^i
00iOtr-r*
vbO0-
P-i:
w>' ' "'w~'
•
.\"*" Vr~
^"y
J"3
r .
V
s
•-
loaroud'ON'O'M—133HS
G-30...... A8&OI273. . •.-- •»•»•« \f \j t K 1 v

*-'
r-VOQ
±
i
\ vlr
i
oi£r
103
o"*"•
ior-r
ooo
r
I
roio
£••r-
"7
rft
TooiO
5i RFW 338-5-61
J S-31»f .J*
-.'-""'" """"•""' r":" ""••-. V •'* ". **•**"• '-"•• ' .""•* -ff. --.- T- -W *•» -»——-.•-»»*.-•-.- -.' ••••IT"——-* ->A -.-i- «.— .- „.»-,-.„-. ' • . . - • '• •• • • - • • - . '• :,: -- ;,.r,." ' . . . , • - • . .
JQ
3
/a
\p00IiO»
Io\
Sco3
Or-
6J
Oft•o».r-
OO
sj
-4
XT\
ooioir-o-r-
'4s

r00
cr
Oo-' lOO
ir-
i
oo"n
vb
Oo
"A-
Vi 0C- c? tf ' J>0
3/o
o-I<J^I *r-
•xA-
Ov)"
i.
cO
<rO
<rr
p-a-O1
eTjr
vb-vO
vb•*0
A-
a\
Oi
P
vb-voot
4-CO
4-
%3

-RFW 338-5-81
G-33

V
0TO_p>•T_»oo
-, i^ -?•s .•~j>• *£•
1 f.£)-Vftkp
—TJ-2L
~" AAM5,<3*J01
$2 -"c
V"k1<v>X01c$vr
—oto1r<i-r-
4>•4**¥**ovT
>.:t/i-
s«1ft.5V"*-j>CO<
$0•M*
%
O1r-«-r-
vb-wOo".r£-
>>$\%«fc?IntCOVT
rc»0•*iO
r-o-r-
vbit-B-
T1
O
o"F.•%A-
f
e
"JX^%^
"SsVft
$
3-01o1 •r*-«r
vi>4»roo"F.1/a-
"50i-D2*r~j •V*\
Qc.|C£N
VN0
lO1r-s-
vb•0
o"_-£p~
**
^Bij>3<rv*tc5/
j0
1c->'r**rr
vb- r
0o"_XA-
bfc==
0ij>35VPtCSCA>
r-o1Otr<rr;
vi)- r
oo"?-•z/v
rOOOkto3.e3"CCm
o»0
1orr-r
vb^O
•s.0
OfP-
i
f
c
«.
[<j
\i&>>>Xi\
^•»P
*9O
?AAS-*-£v^ 61
3<3Z/
<i•••iOt
C£
cb>OvT
>•A-
±£(- S. rpa-
J5
• >VJir0-r
vi)-*oo"£XA-
•": i V. J • !
(F\td
•
•
• x***n»*i
a.'-
7v1/\_
?3Vk
_>>
Q-( 'X
A'T
^
^
•ioaroudI --.T
'ON *O'MdO———21———— 133HS
G-34
MOOI277

RFW 338-5-81G-35
moo 1279

RFW 338-5-81G-37
I---'..


*.-.. -.! -i;v»;v

TO
03
vb\
5A-
\<J
d - y
lr
3
o, . » .. .
IPI<b
t
»-O
V Q,
100
1C
J>ro
VO
V
7> w«T*«*c »vi|v'*<<*"'<^T J lospans^ -^———————————103POUd
'ON'O'M ——————'-JLdSQ v>*—————31VO————AalqXHOdO—————7=-———133HS ————————AIO e.o/^/'/SlVa———TTTTTAa
G-40

nATF Il/£7/g5" DIV________ SHEET.nATF •' • - ^ 'nPPT—————— W.O.NO.
1
r
IN
^ • j- ra
O
S ^ ".*"-S5.
4 tiV _A
*O O »J ^ ii' iL* v/
» -$Cb >^ cb
cxr—d
\c
io$rO
i<J 04 i
TO ro po fO
RFW 338-5-81 ' .,G-41

G-42

.OF.DATE_____^i DEFT _____!__ W.a NO.
^ it 5: _g ve. r s ••? s u
3
to\
"ft
v£ •> <r- -5 .
§Ito
1
I * ,,. , < , . I « , i , iI * 1^
!oc«;
JO
4i
onSVJCOv\
o
_ ~++ . v -^ * ^~^ - ^_* iix "^ fn '£0
j
4k»I
o o
£
i
OCk
§\£>
3
CO
rc\o
\n i- fc03
§
I
0$
o
£>•
t
i
rp
0
RFVl,' 338-5-81G-43
; • : •
jf;v::-. ' • - . .-. •,. .-,.-''. ;.. ' ..-'. ." '- .v.-.. 'V;..r;^:;-/c;

3
I
3 o5«5vcr
I 1
u\
r4
10i
vb
•o
fcb
OI
Vu:
or-
r\O
rev
1vb
PA
1O
-Jt
V
oo\
Oi
CiOi
0ir-
ct
iO
1r
c-1
O
G-44
r~%.
An00r-so
i3oo
4
ft
Ict,
|vbI
O
0\
l
I
*1o
In
1
to
£
00
-174
1O
ii»
QC
1Oi
yc
Vvia
o
vi
2
to_\_c
•: v /''i RFW 338-5-81 G-45J '
(XV
ivb
PA
v<X
V
In5»
ti
01fft
Vnvi - - —r \O/T
ciO.O1
iOrF
rOIS"
i1
O
r
c-1
iO
•-••- .:•'•;-'. : •;•.••-,:;. - ' •~-f ?±..'•"'•: •''•*,'''•'-•"• ""•'f-j"-'I1V':vV''::«v¥V>'C>%'
CO
, . • G-46i
1
3c/>
inr•sN J
r
-T)
«jS ,
jhdC
• ' i
O11301£Ci
J81O
5
cbQ
g
• 1
JN
r-,o
t
^Ovj"
iA-'
1s
tf>"*O
5
>^
o"PN»
e
ivbQC/VD
—IO_L
-xDO
o"
t11?vb
I
O10^
v >
5N.
O
«t3CD
ct*o
i
'£
o
*— 1=
.. .. . .,
•
~~.r " ' .
V
1
'
Xj
loaransioaroud
'ON'O'M ——————^Id30 ^*—————31VO
128 9

00
4O
OUKMCtS
nATP ti/£7te5~ DIV______ SHEET"——"£.___OFDATE——————^DEPT——————— W*O. NO.
v ~~ 1>.
3
?
3/Q
1ts
i
4.
>4o - ^
f
\o
0°
O, , - I"
roi
Joa
iO
4
S
}O
-I-?.t4
RFW 338-5-81 G-47


APPENDIX H
CHEMICAL COMPOUNDS COMPRISING EPA'S HAZARDOUS SUBSTANCE LIST
1291

APPENDIX H
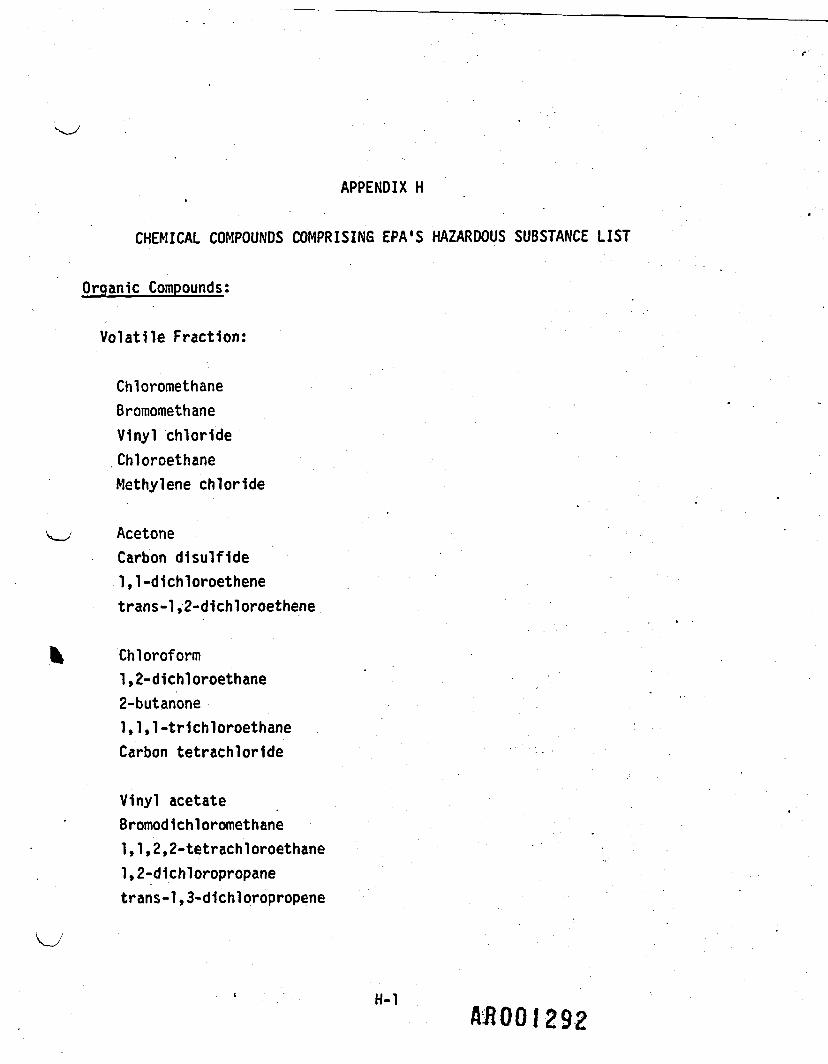
CHEMICAL COMPOUNDS COMPRISING EPA'S HAZARDOUS SUBSTANCE LIST
Organic Compounds:
Volatile Fraction:
ChloromethaneBromomethaneVinyl chlorideChloroethaneMethylene chloride
AcetoneCarbon disulfide1,1-dichloroethenetrans-1,2-dichloroethene
Chloroforml,2-d1chloroethane2-butanone1,1,1-trichloroethaneCarbon tetrachloride
Vinyl acetateBromodichloromethane1,1,2,2-tetrach1oroethane1,2-dichloropropanetrans-1,3-dichloropropene
AtOO!292

TrichloroetheneDibromochloromethane1,1,2-trichloroethaneBenzenecis-1,3-dichloropropene2-chloroethyl vinyl etherBromoform2-Hexanone4-methy1-2-pentanoneTetrachloroethene
TolueneChlorobenzeneEthyl benzeneStyreneTotal xylenes
Semi-volatile Fraction:
N-NitrosodimethylaminePhenolAnilinebis(2-chloroethyl)ether2-chlorophenol
1,3-dichlorobenzene1,4-dichlorobenzeneBenzyl alcohol1,2-dichlorobenzene2-methylphenol
H-2 WOO 1293

bis(2-chloroisopropyl)ether4-methylphenolN-nitroso-dipropylamineHexachloroethaneNitrobenzene
Isophorone2-nitrophenol2,4-dimethylphenolBenzoic acidbis(2-chloroethoxy)methane
i ; 2,4-dichlorophenol1,2,4-trichlorobenzeneNaphthalene4-chloroanilineHexachlorobutadiene
t4-ch1oro-3-methy1phenol(para-chloro-meta-cresol)2-methylnaphthaleneHexachlorocyclopentadlene2,4,6-trichlorophenol2,4,5-trichlorophenol2-chloronaphthalene2-nitroanilineDimethyl phthalateAcenaphthylene3-Nitroaniline
. t H"3

Acenaphthene2,4-dinitrophenol4-nitrophenolDibenzofuran2,4-dinitrotoluene
2,6-dinitrotolueneDiethylphthalate4-chlorophenyl phenyletherFluorene4-nitroaniline
4,6-dinitro-2-methylphenolN-nitrosodiphenylamine4-bromophenyl phenyl etherHexachlorobenzenePentachlorophenol
PhenanthreneAnthraceneDi-n-butylphthalateFluorantheneBenzidine
H-4 ASOOI29S

PyreneButyl benzyl phthalate3,3'-dichlorobenz1dineBenzo(a)anthracenebis(2-ethylhexyl)phtha!ate
ChryseneDi-n-octyl phthalateBenzo(b)f1uorantheneBenzo(k)fluorantheneBenzo(a)pyrene
Indeno(l,2,3-cd)pyreneDibenz(a,h)anthraceneBenzo(g,h,i Jperylene
PCB/Pesticide Fraction:
alpha-BACbeta-BAC
delta-BACgamma-BAC (lindane)HeptachlorAldrinHeptachlor epoxide
H-51296

Endosulfan IDieldrin4,4'-DDEEndrinEndosulfan II
4,4'-DDDEndrin aldehydeEndosulfan sulfate4,4'-DOTEndrin ketone
MethoxychlorChlordaneToxapheneAROCLOR-1016AROCLOR-1221
AROCLOR-1232AROCLOR-1242AROCLOR-1248AROCLOR-1254AROCLOR-1260
H-6

Inorganic Compounds;
Metals
AluminumAntimonyArsenicBariumBerylliumCadmiumCalciumChromiumCobaltCopperIronLeadMagnesiumManganeseMercuryNickelPotassiumSeleniumSilverSodiumThalliumTinVanadiumZinc
I298

Other Inorganics
Sulfate (mg/L)Sulflte (mg/L)Ferrous Iron (mg/L)TOX (ug/L)
HQ MOO 1299

-' . . . .•'•;- „"•'>--,• -f; ' .-, :• .:';-•;•.;•
- -. ...

TABTE I-l
TENTATIVELY IDENTIFIED COMPOUNDS DLTECIkJD IN SEDIMENT SAMPLES
_____Volatile Compounds____ ________Semivolatile CompoundsConcen- Concen-tration tration
Sample Date • Rangea Range*I— ition Collected Compound (ugAg) Compound (ugAg)
•Jpper 6/20/85 ND ND Sulfur (molecular) 60,000Pond Vitamin E acetate 1,000Transect Unknown(4) 600-1,0001 Unknown amide(2) 1,000-3,000
Unknown saturated aliphatichydrocarbon(4) • 1,000-8,000
6/20/85 ND ND Vitamin E acetate 2,000Unknown(3) 1,000-2,000
Transect . Unknown saturated aliphatic2 hydrocarbon(3) 2,000-8,000
Upper 6/20/85 ND ND Vitamin E acetate 2,000Pond Unknown(3) 1,000-2,000Transect ' Unknown aldahyde 2,0003 > Unknown saturated aliphatic* . hydrocarbon(3) 2,000-5,000
Lower 6/19/85 ND ND Carboxylic acid(2) 2,000-3,000Pond Unknown saturated aliphaticTransect hydrocarbon(2) 3,000-5,0001 Unknown{3) 1,000-2,000
I-l

TABLE I-l(CONTINUED)
Volatile Compounds Semivolatile Compounds
Sample DateLocation Collected
Lower 6/19/85PondTransect2
Lower 6/19/85PondTransect2(Duplicate)
Lower 6/19/85PondTransect3
Concen-trationRange3
Compound (ugAg) Compound
ND ND Sulfur (molecular)Carboxylic acidUnknown esterUnknown saturatedhydrocarbon (3)Unknown (4)
ND "ND Sulfur (molecular)Carboxylic acid (2)Vitamin E acetateUnknown saturatedhydrocarbon (4)Unknown (4)
ND ND Carboxylic acidVitamin E acetateUnknown aldahydeUnknown saturatedhydrocarbon (3)Unknown (3)
Concen-trationRange3(ugA
100,0008002,000
aliphatic3, 00 0-10, 00 (1,000- 3,00(
90,000 v1,000- 4,00(2,000
aliphatic2, 00 0-20, 00 (1,000- 4,00(
1,0001,000901
aliphatic700- 4,00<
1,000- 2,001
aAll concentrations are estimated values.
1-2
URO-01302

TABLE 1-2
TENTATIVELY IDENrjllEU COMPOUNDS DETECTED IN SOIL SAMPLES
\ ' • • Volatile Compounds Semivolatile Compounds
Sampleation
DW-710'-12'
DW-84 '-6'
D )
SB-1
SB-21 f^ i.1 '
Qft;
SB-36 '-8'
SB-320'-22'
SB-6
DateCollected
6/27/85
6/28/85
8/7/85
7/2/85
7/25/85
7/13/85
7/15/85
7/1/85
Compound
Methyl ester aceticacid
Cyclic hydrocarbonHydrocarbonUnknown (2)
ND
Methyl proponate3-metnyl-2-butanoneUnknown (4)
Unknown
ND
Unknown (7)
3-methyl-2-butanone2-pentanoneUnknown (3)
Concen- Concen-tration trationRange3 Range3(ug/kg) Compound (ugAg)
50,000
11,00012,000 . • •7,000-10,000
ND NA NA
30,00010,00010,000-300,000 .
30
ND NA NA
. 1,000-2,000 NA
606040-90
1-3
fifiOO1303
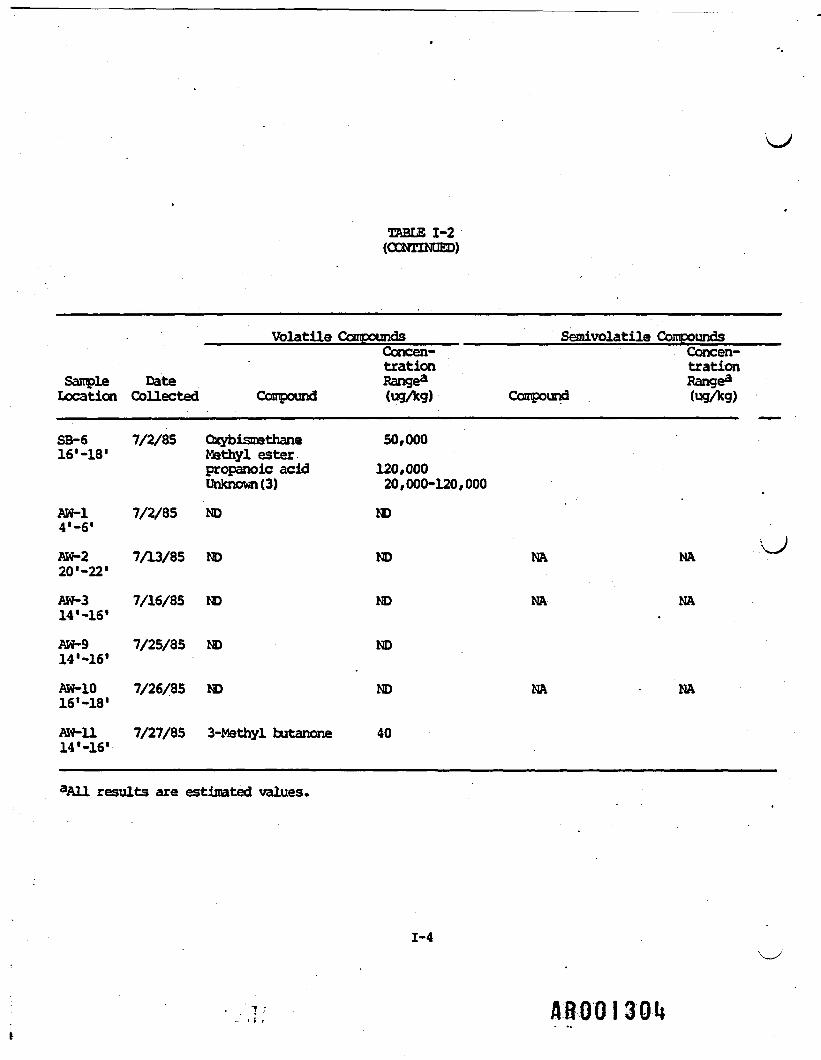
TABLE 1-2(CONTINUED)
Volatile Compounds Semivolatile Compounds
SampleLocation
SB-616' -18'
AW-14'-6'
AW-220'-22'
AW-314 '-16*
AW-9
AW-10
AW-U14 '-16'
DateCollected
7/2/85
7/2/85
7/13/85
7/16/85
7/25/85
7/26/85
7/27/85
Compound
Qxybisme thaneMethyl esterpropanoic acidUnknown (3)
ND
ND
ND
ND
ND
3-Methyl butanone
Concen- Concen-tration trationRange3 Range3(ugAg) Compound (ugAg)
50,000
120,00020,000-120,000
ND(
ND NA NA ^
ND NA NA
ND
ND NA NA
40
3A11 results are estimated values.
1-4
13 Oh

TABLE 1-3
TENTATIVELY IDENTIFIED COMPOUNDS DETECTED IN BEDROCK SAMPLES
Volatile Compounds
SampleLocation
DW-722'10"-23'3"
DW-923'8"-24'l"
DW-10
EW-1032'10"-33I6"
SB-121'8"-22'3"
SB-428'0"-28'7"
SB-446'11"-47I5"
DateCollected3
7/10/85
6/26/85'
8/8/85
8/8/85
7/2/85
8AO/85
8/11/85
Compound
ND
ND
ND
ND
ND
ND
ND
Concen-trationRange0(ugAg)
ND
ND
ND
ND
ND
ND
ND
&AU samples were pulverized in early August 1985.bAll results are estimated values.
.1-5.
fifiOOISOS

TABLE 1-4
TENTATIVELY TnpM.rTBr|M> COMPOUNDS DETECTED IN SURFACE WATER
SampleLocation
Upstream- BearCreek
Down-stream- BearCreek
Volatile Compounds
DateCollected Compound
9/8/85 ND
10A5/85 2-ethyl-l-hexanolEthanolHexaneC-7 Hydrocarbon3-Hexanol4-Heptanoll-heptan-4-ol
9/8/85 Ethanol
10/15/85 EthanolHexaneC-7 hydrocarbon3-hexanoll-hepten-4-ol4-heptanol2-ethyl-l-hexanol
Semivolatile Compounds •Concen-trationRange3(ugAg)
ND
24249. SB17181817
60J
3010B1819171818
Compound
2-methyl-2-pentanol2-methyl-3-pentanone3-hexanolC-9 Hydrocarbon (3)C-U HydrocarbonHydrocarbon matrix (3)Unknown (2)
2-methyl-3-hexanolDimethyl benzeneC-7 alcohol2, 2-dimethyl-l-pentanolC-8 hydrocarbonDioclylester hexanedioic acidUnknown alcoholUnknown (2)
2-methyl-3-pentanol2-methyl-3-pentanoneC-9 hydrocarbon (4)C-U hydrocarbonUnknownTotal hydrocarbon matrix (3)
2-methyl-3-hexanolDimethyl benzeneDimethyl pentanol2-butoxyethanolTrimethyl benzene2, 4-dimethyl-l-decane1, 3-benzehedialSaturated hydrocarbon (2)Unknown (4)
Concen-trationRange3
102010020-.
• . 1010,000
20
4S~50BUO17010056B37028-
202020-20200
20,000
2417B50105.61495.3-15-1
1-6
ABOOI306

TABLE 1-4(CONTINUED)
Sampleluxation
Down-stream- BearCreek(RE)b
O
Volatile Compounds
DateCollected Compound
10/15/85 EthanolHexaneC-7 hydrocarbon3-hexanoll-hepten-4-ol4-heptanol2-ethyl-l-hexanol
• • - * . *
Semivolatile CompoundsConcen-trationRange3(ugAg)
3010B1819171818
Compound
2-methyl-3-hexanolDimethyl benzeneDimethyl pentanol2-butoxyethanolTrimethyl benzene2 , 4-diroethyl-l-decane1 , 3-benzenedialSaturated hydrocarbon (2)Unknown (4)
Concen-trationRange0(ugAg)
2417B50105.3B6149
5.3-2415-120
aAll results are estimated values.°Re-extracted sample.
1-7
aaooiso?

TABLE 1-5
TENTATIVELY IDENTIFIED COMPOUNDS DETECTED IN GROUNDWATER
Sample DateLocation Collected
DW-1 10/13/85
EW-2 10/15/85
DW-3 9/9/85
DW-3 9/9/85(duplicate)
DW-4 9/9/85
Volatile CompoundsConcen-trationRange3
Compound (ugAg)
ND
Hexane 4B
ND
ND
ND
Semivolatile Compounds
Compound
Dimethyl benzeneTrimethyl benzeneUnknown
TolueneCyclic hydrocarbonDimethyl benzeneTrimethyl benzeneDioctylester hexanedoic acidUnknown (3)
Sulfur (molecular)Unknown (2)
Sulfur (molecular)Unknown (3)
2,6,10,14-tetramethylheptadecaneHexacosane0-decyl-hydroxylamineUnknown phthalateUnknown
Concen-trationRange3(ugAg)
29B10B17
121316B11B v— 35B4-325
7609.8-18
66011-18
1627201312
SB001308

TABLE 1-5(CONTINUED)
Volatile Compounds
Sample DateLocation Collected
U.-5 10/15/85
t t v , 10/15/85(Duplicate)
DW-6 10/15/85
. fc 9/10/85
Compound
Sulfur dioxide3-methyl-2-butanoneHexane
Sulfur dioxide
ND
2,4-Dimethyl-2-pentenol2-methyl butanePentaneCyclohexaneMethyl-cyclopentanePropylbenzene
Concen-trationRange3(ugAg)
340253.9B
7,200
53J170J82J300J160JIIOJ
Semivolatile Compounds
Compound
Dimethyl benzeneTrimethyl benzeneDimethyl hexadieneSulfur2 , 3 , 4-tr iroathyl-2-cyclopenten-1-oneUnknown (2)
Dimethyl benzene2,3, 4-tr imethyl-2-cyclo-penten-1-oneDiochytester hexanedoic acidUnknown (3)
Dimethyl benzeneTrimethyl benzene
Ethyl benzene4-methyl octane1,2-dimethyl benzene3-methyl octane1,4-dimethyl benzene(1-methyl ethyl) cyclohexane
Concen-trationRange3(ugAg)
20997
2217-53
18B
2548B8-51
9B5B
73' 601705164120
1-9
AHOOI309

SampleLocation
DW-8
EW-9
EW-10
TABLE 1-5(CONTINUED)
Volatile CompoundsConcen-tration
Date Range3Collected Compound (ug/kg)
Unknown (4) 70-160J
.
10/13/85 C-4 hydrocarbon 7Hexane 4.2B2,3-diroethyl pentane 41,1,3-triroethyl-cyclopentane 9Unknown (2) 2.9-3.3
9/9/85 ND ND
9/10/85 2-methyl pentane 5.4JUnknown 12-15J
Semi volatile
Compound
2,6-dimethyl octane5, 6-dimethyl-undecanel-ethyl-2-methyl benzene1,3,5-trimethyl benzene1,2,3-trimethyl benzeneDecanel-ethyl-4-methyl-benzene4-methyl decanel-methyl-3-propyl benzeneNonocosaneUnknown (4)
Dimethyl benzeneTrimethyl benzene3-methyl-3-pentanol
Unknown (3)
ND
TetradecaneHeptacosanePentadecaneHexadecaneOctacosane{2)HeptadecaneHexacosane(2)NonacosaneNonadecaneEicosaneNeneicosane7-hexyl-decosane2,3-dimethyl undecaneUnknown (5)
CompoundsConcen-trationRange3(ugAg)
87526116036050 O73457746
. 47-210
9.4B7. SB9.4 i
8.3-41
ND
50221009537-4311018-28601209787542718-37 W
aAll results are estimated values.- . . , - . 1-10 AROO1310

TABLE 1-6
TENTATIVELY IDENTIFIED COMPOUNDS DhTfcJClH) IN GROUNDWATER (RE)3
______Volatile Compounds Semivolatile Compounds_____Concen- Concen-tration . tration
iple Date Range3 RangebLocation Collected Compound (ugAg) Compound (ugAg)
DW-10 9AO/85 ND ND Tetradecane 782,3,7-trimethyldecane 35Pentadecane 160Hexadecane 130Heptadecane - ' 140 'Heptacosane 70Octacosane 63NonacosaneO) 31-104Nonadecane 200Eicosane 1401-iodo-hexadecane 1007-hexyl-eicosane 30Unknown(6) . 26-61
«9 9/9/85 ND ND N,N-Diphenyl hydrazineCosboxymide 10Unknowns(4) 10-20
DW-7 9AO/85 ND ND 2,5-dimethylheptane 90Y .. . Ethyl benzene 75
4-methyl octane 721,2-dimethyl benzene 1733-methyl octane 611,4-dimethyl benzene 653-methyl-nonane 956-methyl-octadecane 551,3,5-trimethylbenzene 1672,6-dimethyl-octane 501,2,3-trimethyl benzene 374Decane 50
1-11
AROO13 I I

TABLE 1-6(CONTINUED)
Volatile Compounds Semivolatile Compounds
Sample DateLocation Collected
EW-7(cont.)
EW-8 10A3/85
DW-1 10A3/85
Concen- Conren-tration tr -nRange3 Rar e0
Compound (ugAg) Compound (ugAg)
1,2,4-trimethyl benzene 714-methyl decane 53l-methyl-2-propylbenzene . 831,2,3,4-tetramethyl benzene 77l,3-dioxolane-2-methanol 182Unknown (3) 57-12,\_
ND ND Methylcyclohexane 21Toluene 13Xylene 17BTrimethyl benzene 12B1,1'bicyclohexane ' 7.3Hydrocarbon (3) 9.9-10Unknown(13) i 1-89
ND • ND Methyl cyclohexane **Toluene 27Dimethyl benzene (2) 13-6SBTrimethyl benzene 32Hexadecane 13Hexadoic acid 14Hexadecanoic acid 27Hexamethyl cyclocisoxane 67Octamethyl cyclotetrasioxane 40Decamethyl cyclopentasioxane 50Trimethyl cyclopentenomet 25acid1,2 Benzene dicarboxylic acid 58Decamethyl cyclohexasioxane 40Unknown sioxane 33Unknown (6) 14-48
1-12
AROOI3I2
•
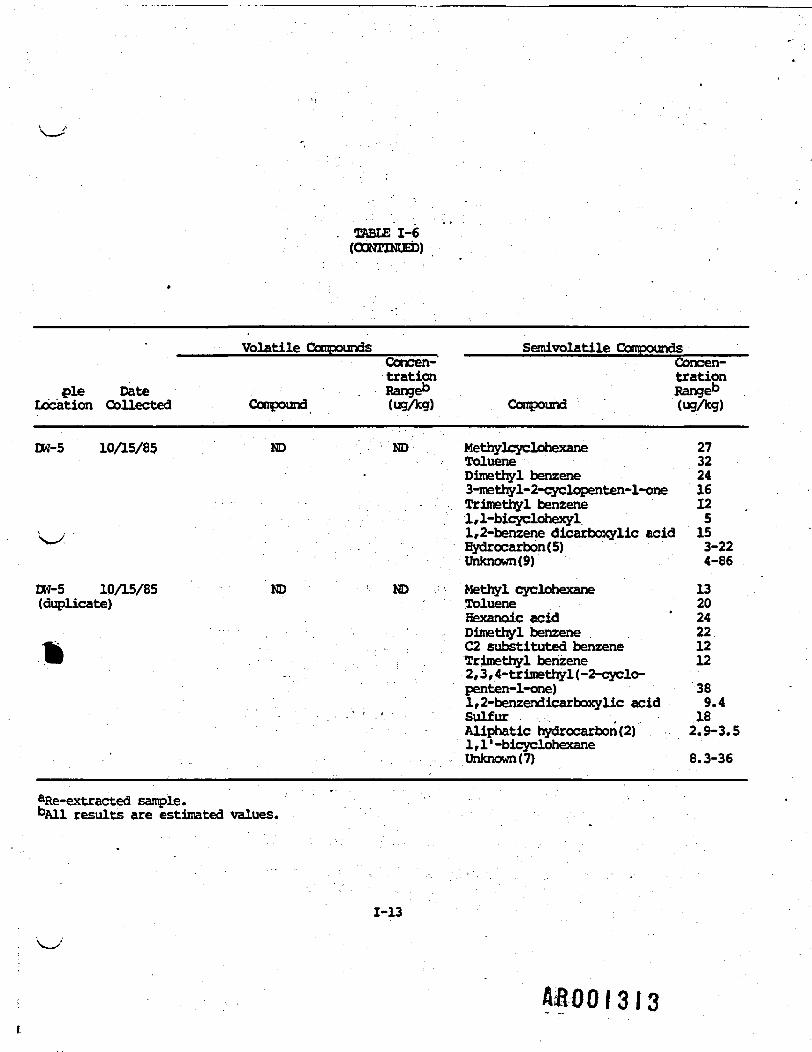
. TABLE 1-6(OONTINUEb)
Volatile Compounds Semi volatile Compounds
pie DateLocation Collected
DW-5 10/15/85
Concen-tration
. Range0Compound (ug/kg) Compound
ND ND MethylcyclohexaneTolueneDimethyl benzene3-methyl-2-cyclopenten-l-oneTrimethyl benzene1,1-bicyclohexyl
Concen-trationRange0(ug/kg)
27322416125
v; 1,2-benzene dicarboxylic acid 15'
DW-5 10A5/85(duplicate)\ *MMJ^* ***** ** > /
m
Hydrocarbon (5)Unknown (9)
ND ND Methyl cyclohexaneTolueneHexanoic acid
' Dimethyl benzene: C2 substituted benzene
Trimethyl benzene- 2,3,4-trimethyl(-2-cyclo-
penten-1-one)1,2-benzendicarboxylic acidSulfurAliphatic hydrocarbon (2)1 , 1 ' -bicyclohexane
, Unknown (7)
3-224-86
132024221212
389.4182.9-3.5
8.3-36
aRe-extracted sample.°A11 results are estimated values.
1-13
flaooi3i3
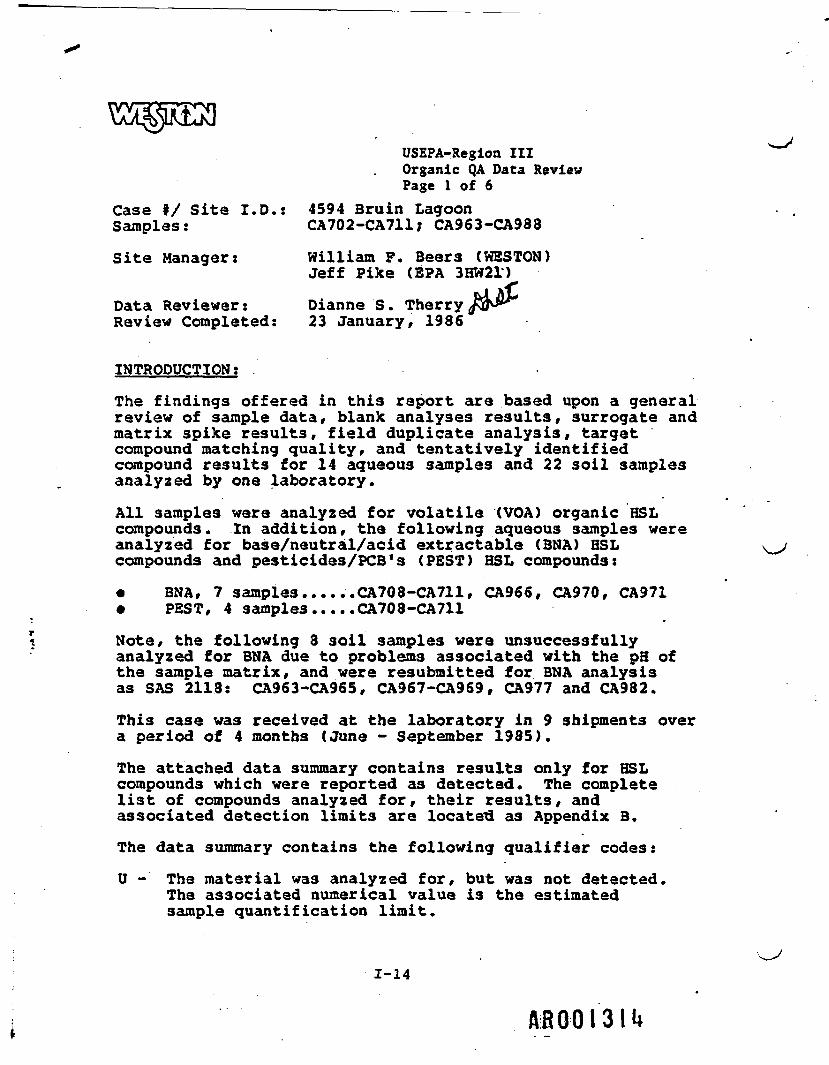
USEPA-Region IIIOrganic QA Data ReviewPage 1 of 6
Case */ Site I.D.: 4594 Bruin LagoonSamples: CA702-CA711; CA963-CA988
Site Manager: William F. Beers (WEST ON)Jeff Pike (EPA 3HW21)
Data Reviewer: Dianne S. TherryReview Completed: 23 January, 1986
INTRODUCTION ;
The findings offered in this report are based upon a generalreview of sample data, blank analyses results, surrogate andmatrix spike results, field duplicate analysis, targetcompound matching quality, and tentatively identifiedcompound results for 14 aqueous samples and 22 soil samplesanalyzed by one laboratory.
All samples were analyzed for volatile (VOA) organic HSLcompounds. In addition, the following aqueous samples wereanalyzed for base/neutral/acid extr actable (BNA) HSLcompounds and pesticides/PCB's (PEST) HSL compounds:
• BNA, 7 samples ...... CA708-CA711, CA966, CA970, CA971• PEST, 4 samples..... CA708-CA711
Note, the following 8 soil samples were unsuccessfullyanalyzed for BNA due to problems associated with the pH ofthe sample matrix, and were resubmitted for BNA analysisas SAS 2118: CA963-CA965, CA967-CA969, CA977 and CA982.
This case was received at the laboratory in 9 shipments overa period of 4 months (June - September 1985).
The attached data summary contains results only for HSLcompounds which were reported as detected. The completelist of compounds analyzed for, their results, andassociated detection limits are locatetl as Appendix B.
The data summary contains the following qualifier codes:
U -' The material was analyzed for, but was not detected.The associated numerical value is the estimatedsample quantification limit.
1-14
ARQOI3U

Case 4594Page 2 of 6
J - The associated numerical value is an estimatedquantity because quality control criteria were notmet.
R - Quality Control indicates that data are unusable(compound may or may not be present). Resamplingand reanalysis is necessary for verification.
N - Presumptive evidence of presence of material (tentativeidentification.)
QUALIFIERS -
It is recommended that this data package be utilized onlywith the following qualifier statements:
VOLATILES (VGA)
• For the following aqueous samples, the reporteddetection limits for volatile aromatic compoundshave been qualified as estimated (UJ):
' CA708-CA711, CA975, CA979, CA980, CA983, CA984.The maximum allowable holding time for these compoundswas exceeded. The failure to detect aromatic com-pounds under these conditions does not confirm theirabsence in the original sample.
• For aqueous sample CA975, the reported detection limitsfor all volatile compounds were qualified as estimated(UJ). The maximum allowable holding time for thesecompounds was exceeded. The failure to detect volatilecompounds under these conditions does not confirm theirabsence in the original sample.
Technical requirements for sample holding times havenot been established for soil/sediment matrices.
The following results have been qualified as notdetected due to blank contamination: ,
Compound: Samples Affected;
methylene chloride all samplesacetone all sampleschloroform CA702, CA707, CA711, CA970,
CA971, CA9752-butanone CA964, CA967, CA968, CA974, CA976benzene CA964, CA965, CA967, CA968, CA969
CA971
1-15 At 001315

Case 4594Page 3 of 6
Qualifiers (Con't)
• For sample CA973, the detection' limit for 2-butanonewas qualified as unusable (R).
• The reported values for 2-butanone in samples CA965,CA977 and CA982 were qualified as estimated (J) values.
• The detection limits for up to 11 compounds werequalified as estimated (UJ) values in each sample.The respective compounds can be determined by referringto Figure 1 "Calibration Criteria" of Appendix A.
BASE/NEUTRAL/ACID EXTRACTABLES (BNA)
• The following results were added to the data summaryfor sample CA703:
Compound Concentration Qualifier Lab Reportedppb; ug/L___ Code CRDL (ug/Ll
2-methylphenol 2 N 204-methylphenol 7 N 20
The raw data contained sufficient evidence to indicatetheir presence. The trace amounts were qualified astentative identification (N).
• The results for acid extractables in sample CA710 werequalified as unusable (R). Actual detection limits maybe higher than reported.
• The reported detection limits for many non-detected BNAcompounds were qualified as estimated values (UJ). Therespective compounds in each sample can be determinedby referring to Figure 1 "Calibration Criteria" ofAppendix A. "
• For samples CA703 and CA709, the actual detectionlimits may be higher than reported for compounds listedon the data summary from diechylphthalate through benzo(ghi) perylene.
1-16
A«OOI3I6
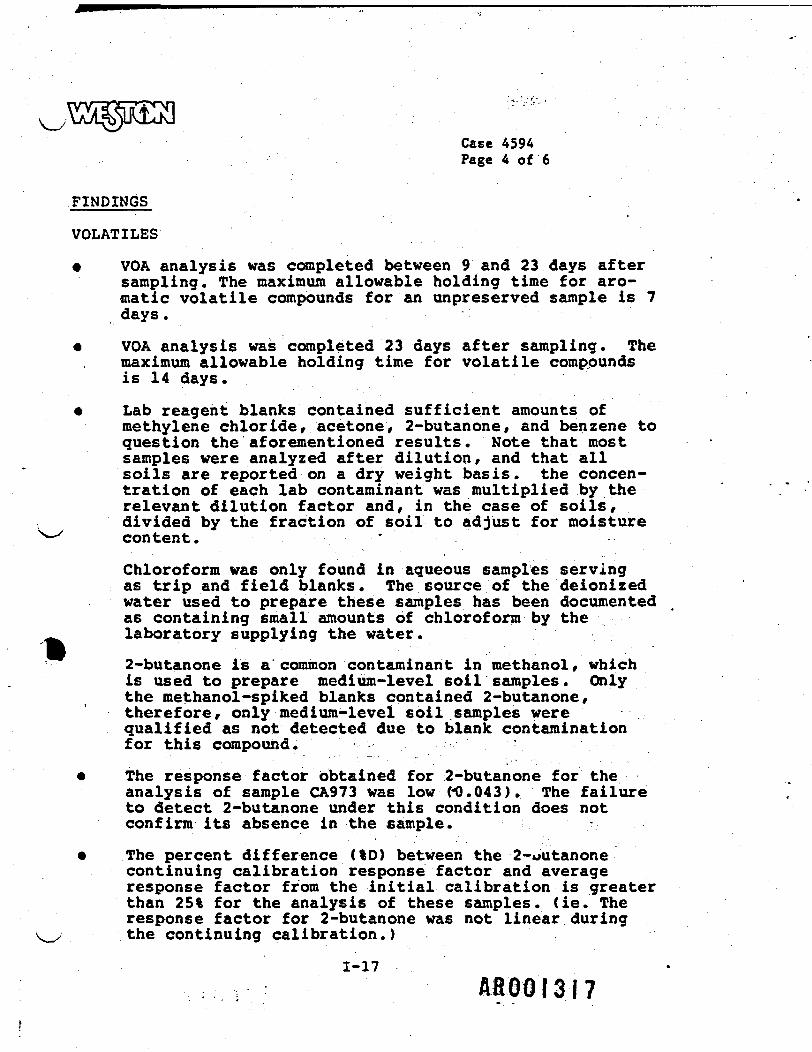
Case 4594Page 4 of 6
FINDINGS
VOLATILES
VOA analysis was completed between 9 and 23 days aftersampling. The maximum allowable holding time for aro-matic volatile compounds for an unpreserved sample is 7days .
VOA analysis was completed 23 days after sampling. Themaximum allowable holding time for volatile compoundsis 14 days.
Lab reagent blanks contained sufficient amounts ofmethylene chloride, acetone, 2-butanone, and benzene toquestion the aforementioned results. Note that mostsamples were analyzed after dilution, and that allsoils are reported on a dry weight basis, the concen-tration of each lab contaminant was multiplied by therelevant dilution factor and, in the case of soils,divided by the fraction of soil to adjust for moisturecontent. '
Chloroform was only found in aqueous samples servingas trip and field blanks. The source of the deionizedwater used to prepare these samples has been documentedas containing small amounts of chloroform by thelaboratory supplying the water.
2-butanone is a common contaminant in methanol, whichis used to prepare medium-level soil samples. Onlythe methanol-spiked blanks contained 2-butanone,therefore, only medium-level soil samples werequalified as not detected due to blank contaminationfor this compound. •
The response factor obtained for 2-butanone for theanalysis of sample CA973 was low (-0.043). The failureto detect 2-butanone under this condition does notconfirm its absence in the sample.
The percent difference (%D) between the 2-uutanonecontinuing calibration response factor and averageresponse factor from the initial calibration is greaterthan 25% for the analysis of these samples, (ie. Theresponse factor for 2-butanone was not linear duringthe continuing calibration.)
: - ' I 48.0013-17

Case 4594Page 5 of 6
Detection limits were qualified for one or more of thefollowing reasons:
(1) Response factor was not linear during the initialcalibration.
(2) Response factor was not linear during the con-tinuing calibration.
(3) Response factor was very low «0.05). Failure todetect a compound under this condition does notconfirm its absence in the samples.
BASE/NEUTRAL/ACID EXTRACTABLES
• Raw data for sample CA708 contained sufficient evidenceto indicate tentative identification of 2-methylphenoland 4-methylphenol at trace levels.
• Surrogate recoveries for all three acid extractablesurrogate compounds were outside «10%) the loweracceptance limits for sample CA710 and its respectivere-extraction. Failure to detect acid extractablesunder these conditions does not confirm their absencein the samples. A summary of surrogate recoveriescan be found as Figure 2 "BNA Surrogates of Appedix A.
• Individually, the response factors for BNA HSLcompounds were not all linear during initial andcontinuing calibration. Affected samples andrespective compounds which were qualified as estimated(UJ) are summarized in Figure 1 "Calibration Criteria"(page 4 of 4) of Appendix A.
• Chromatographic evidence for samples CA708 and CA709indicates the presence of a hydrocarbon envelope,which .ay interfere with the detection of low levelsof other compounds eluting in the same range (encom-passes approximately scans 1200-2400).
1-18
A8001318

Case 4594Page 6 of 6
SUMMARY
This Quality Assurance Review has identified the followingareas of concern:
• 40 CFR 136 and contract holding time criteria exceeded.
• Small amount of laboratory contamination.
• Response factors for HSL compounds were not all linearduring initial and continuing calibration and/orproduced very low «0.05) response.
• Poor acid surrogate recovery in one sample.
ATTACHMENT: Data Summary
APPENDICES;
A Data Validation SummaryB Sample Data Sheets
1-19
19

USEPA-Region IIIOrganic QA Data ReviewPage 1 of 6(Revision A, 3/86)
Case It /Site I.D.: 4594 Bruin LagoonSamples: CA702-CA711; CA963-CA988
Site Manager: William F. Beers (WESTON)Jeff Pike (EPA 3HW21)
3&$"Data Reviewer: Dianne S Therr t WESTON) /Diana Pickens(EPA-R3Review Completed: 23 January 1986
INTRODUCTION
The findings offered in this report are based upon a generalreview of sample data, blank analyses results, surrogate andmatrix spike results, field duplicate analysis, target compoundidentification, and tentatively identified compound results for14 aqueous samples and 22 soil samples analyzed by one laboratory
All samples were analyzed for volatile (VOA) organic HSLcompounds. In addition, the following aqueous samples wereanalyzed for base/neutral/acid extractable (BNA) HSL compoundsand pesticides/FCB's (PEST) HSL compounds:
• BNA, 7 samples . . . . . .CA708-CA711, CA966, CA970, CA971• PEST, 4 samples . . . . .CA708-CA711
Note, the following 8 soil samples were unsuccessfully analyzfor BNA due to problems associated with the pH of the samplematrix, and were resubmitted for BNA analysis as SAS 2118:CA963-CA965, CA967-CA969, CA977 and CA982.
This case was received at the laboratory in 9 shipments over aperiod of 4 months (June - September 1985).
The attached data summary contains results for positivecompounds, which were reported as detected. Detection limits areprovided at the end of the data summary, however, these valuesmust be multiplied by appropriate dilution factors (factor=lxunless otherwise noted at the bottom of the summary table).Laboratory data sheets are located as Appendix B.
I~2° Afl.0 01320

\-> Case 4594 •Page 2 of 6(Revision A, 3/86)
The data summary contains the following qualifier codes:
D - The material was analyzed for, but was not detected. Theassociated numerical value is the estimated samplequantitation limit.
J - The associated numerical value is an estimated quantitybecause quality control criteria were not met.
R - Quality Control Indicates that data are unusable (compoundmay or may not be present). Resampling and reanalysis is
• necessary for verification.
N - Presumptive evidence of presence of material (tentativeidentification).
Data qualifier statements in this review have been numberedsequentially Ql, Q2, Q3 etc. with the respective finding leadingto the qualification designated Fl, F2, F3 etc.
QUALIFIERS
It is recommended that this data package be utilized only withthe following qualifier statements:
VOLATILES (VOA)
Ql) For the following aqueous samples, the reported detectionlimits for volatile aromatic compounds have been qualifiedas estimated (UJ): CA708-CA711, CA975, CA979, CA980, CA983,CA984. The maximum allowable holding time for thesecompounds was exceeded. The failure to detect aromaticcompounds under these .conditions does not confirm theirabsence in the original sample.
Q2) For aqueous sample CA975, the reported detection limits forall volatile compounds were qualified as estimated (UJ).The maximum allowable holding time for these compounds wasexceeded. The failure to detect volatile compounds underthese conditions does not confirm their absence in theoriginal sample.
Technical requirements for sample holding times have notbeen established for soil/sediment matrices,
"21 ABOOI32I

Case 4594Page 3 of 6(Revision A, 3/86)
Q3) The following results have been qualified as not detecteddue to blank contamination:
Compound Samples Affected:
methylene chloride all samplesacetone all sampleschloroform CA702,CA707,CA711,CA970,CA971,CA9-~2-butanone CA964,CA967,CA963,CA974,CA976benzene CA964,CA965,CA967,CA963,CA969,CA971
Q4) For sample CA973, the detection limit for 2-butanone wasqualified as unusable (R).
Q5) The reported values for 2-butanone in samples CA965, CA977and CA982 were qualified as estimated (J) values.
Q6) The detection limits for up to 11 compounds were qualifiedas estimated (UJ) values in each sample. The respectivecompounds can be determined by referring to Figure 1"Calibration Criteria" of Appendix A.
BASE/NEUTRAL/ACID EXTRACTABLES (BNA)
Q7) The following results were added to the data summary fsample CA708:
Corn-pound Concentration Qualifier Lab Reportedppb: ug/L Code CRDL (ug/L)
2-methylphenol 2 N 204-methylphenol 7 N 20
The raw data contained sufficient evidence to indicate theirpresence. The trace amounts were qualified as tentativeidentification (N).
Q8) The results for acid extractables in sample CA710 werequalified as unusable (R). Actual detection limits may besignificantly higher than reported.
'-22 ABOOI322

Case 4594Page 4 of 6(Revision A, 3/86)
Qualifiers (Con't)
Q9) The reported detection limits for many non-detected BNAcompounds were qualified as estimated values (UJ). Therespective compounds in each sample can be determined byreferring to Figure 1 "Calibration Criteria" of Appendix A.
Q10) For samples CA708 and CA709, the actual detection limits maybe higher than reported for compounds listed on the datasummary.from diethylphthalate through benzo(ghi)perylene.
FINDINGS
VOLATILES
Fl) VOA analysis was completed between 9 • and 23 days aftersampling. The maximum allowable holding time for aromaticvolatile compounds for an unacidified aqueous sample is 7days.
F2) VOA analysis was completed 23 days after sampling. Themaximum allowable holding time for volatile compounds is 14days.
F3) Lab reagent blanks contained sufficient amounts of methylenechloride, acetone, 2-butanone, and benzene to question theaforementioned results. Note that most samples were analyzedafter dilution, and that all soils are reported on a dryweight basis. The concentration of each lab contaminant wasmultiplied by the relevant dilution factor and, in the caseof soils, divided by the fraction of soil to adjust formoisture content.
Chloroform was only found in aqueous samples serving astrip and field blanks. The source of the deionized waterused to prepare these samples has been documented ascontaining small amounts of chloroform by the laboratorysupplying the water.
2-Butanone is a common contaminant in methanol, which isused to prepare medium-level soil samples. Only themethanol-spiked blanks contained 2-butanone, therefore, onlymedium-level soil samples were qualified as not detected dueto blank contamination for this compound.
1-23 &ROOI323

Case 4594Page 5 of 8(Revision A, 3/86)
Findings (Cont'd)
F4) The response factor obtained for 2-butanone for the analysisof sample CA973 was low (0.043). The failure to detect2-butanone under this condition does not confirm its absencein the sample.
F5) The percent difference (%D) between the 2-butanonecontinuing calibration response factor and average responsefactor from the initial calibration is greater than 25% fthe analysis of these samples. (ie. The response factor fc*2-butanone was variable during the continuing calibration).
F6) Detection limits were qualified for one or more of thefollowing reasons:
(1) Response factor was variable during the initialcalibration.
(2) Response factor was variable during the continuingcalibration.
(3) Response factor was very low (<0.05). Failure todetect a compound under this condition does not confirmits absence in the samples.
BASE/NEUTRAL/ACID EXTRACTABLES
F7J Raw data for samples CA708 contained sufficient evidence toindicate tentative identification of 2-methylphenol and4-methylphenol at trace levels.
F8) Surrogate recoveries for all three acid extractablesurrogate compounds were outside (<10%) the lower acceptablelimits for samples CA710 and its respective re-extraction,indicating possible matrix interference. Failure to detectacid extractables under these conditions does not confirmtheir absence in the samples. A summary of surrogaterecoveries can be found as Figure 2 "BNA Surrogates ofAppendix A.
ftflOOI32t»

. . .Case 4594Page 6 of 6(Revision A, 3/86)
F9) Individually, the response factors indicate that theresponse for BNA HSL compounds were not all linear duringinitial calibration and/or were variable during continuingcalibration. Affected samples and respective compoundswhich were qualified as estimated (UJ) are summarized inFigure 1 "Calibration Criteria" (page 4 of 4) of Appendix A.
F10) Chromatographic evidence for samples CA708 and CA709indicates the presence of a hydrocarbon envelope, which nayinterfere with the detection of low levels of othercompounds eluting in the same range (encompassesapproximately scans 1200-2400).
SUMMARY
This Quality Assurance Review has identified the following areasof concern:
• 40 CFR 136 and contract holding time criteria exceeded.
• Laboratory contamination in method blanks.
• Response factors for HSL compounds were variable duringinitial and continuing calibration and/or produced very low(<0.05) response. .
• Poor acid surrogate recovery in one sample, indicatingpossible matrix interference.
ATTACHMENT; Data Summary
APPENDICES;
A. Data Validation SummaryB. Sample Data Sheets
A800I325

USEPA - Region IIIOrganic QA Data ReviewPage 1 of 5(Revision A, 3/86)
Case 8/Site I.D.: 4969 Bruin LagoonSamples: CA712 - CA718Site Manager: William F. Beers (WESTON)
Jeff Pike (EPA 3HW21)
Data Reviewer: Dianne S. TherryReview Completed: 23 January, 1986
INTRODUCTION
The findings offered in this report are based upon a gener&.review of sample data, blank analyses results, surrogate andmatrix spike results, field duplicate analysis, target compoundidentifications, and tentatively identified compounds results for7 aqueous samples analyzed by one laboratory.
Each sample was analyzed for organic HSL compounds in the follow-ing fractions: Volatiles (VOA), base/neutral/acid extractable(BNA), and pesticides/PCB's (PEST).
The attached data summary contains results for positive HSLcompounds, which were reported as detected. Detection limits areprovided at the end of the summary, however, these values mustmust be multiplied by appropriate dilution factors (£actor=lxunless otherwise noted at the bottom 'of the summary table).Laboratory data sheets are included as Appendix B.
The data summary contains the following qualifier codes:
U - The material was analyzed for,but was not detected. Theassociated numerical value is the estimated samplequantitation limit.
J - The associated numerical value is an estimated quantitybecause quality control criteria were not met.
R - Quality Control indicates that data are unusable (compoundmay or may not be present). Resampling and reanalysis isnecessary for verification.
1-26
48001326

Case 4969Page 2 of 5(Revision A, 3/86)
QUALIFIERS
It is recommended that this package be utilized only with thefollowing qualifier statements:
Ql) The following results have been qualified as not detected. (UJ) due to blank contamination;
COMPOUND SAMPLES AFFECTED SUMMARY
Methylene Chloride CA712, CA714, CA717, CA718
Acetone CA712-CA715, CA717
2-Butanone CA712-CA716
Toluene CA712-CA714, CA716, CA718
Phenol '- CA713, CA716
Q2) The detection limits for bromomethane were qualified asestimated (UJ).
Q3) The detection limits for bis(2-chloroisopropyl)ether,hexachlorocyclopentadiene, 4-nitrophenol, 4-nitroaniline,indeno(l,2,3-cd)pyrene and dibenzo(a,h)anthracene werequalified as estimated (UJ).
Q4) The detection limits for base/neutral/acid extractablecompounds in 5 samples were qualified as unusable (R) orestimated (UJ). Actual detection limits may be substantial-ly higher.
COMPOUNDS SAMPLES AFFECTED SUMMARY
Acid Extractables (R) CA712, CA714, CA715, CA712RE
Base/Neutrals: CA713, CA714, CA716, CA716RENitroaromatics (R)Other B/N (UJ)
If resample/rean&lysls is opted for (R) qualified samplesabove, it is recommended than an alternate method beselected which addresses the complexity of the sample matrixat this site.
1-27
flfiOOI327

Case 4969Page 3 of 5(Revision A, 3/86)
Some considerations for selecting a method follow:Extraction/analysis procedures need to be effective forextremely acidic samples (ie pH<2). Continuous extractionprovides better phenol recovery than separatory funnelextraction. An analytical method such as EPA 1625B "Semi-Volatile Organic Compounds by Isotopic Dilution GC/MS"could provide more effective recovery data for a wider rangeof samples/compounds than the CLP-required MS/MSD.
Q5) For samples CA715, CA715 and CA716RE, the actual detectionlimits may be higher than reported for compounds listed onthe data summary from diethylphthalate throubenzo(ghi)perylene.
FINDINGS
Fl) Lab Method Blanks contained sufficient methylene chloride,acetone, 2-butanone, and toluene to question theaforementioned results.
Both field and trip blanks contained sufficient amounts ofphenol to question the aforementioned results. Note,however, site contamination with phenol has been documentedfrom previous site investigation. No phenol was found inthe laboratory blanks.
F2) The response factor for bromomethane indicates the responsewas not linear during the initial calibration.
F3) The response factors for bis(2-chloroisopropyl)-ethex,hexachlorocyclopentadiene, 4-nitrophenol, 4-nitroaniline,indeno(l,2,3-cd)pyrene and dibenzo( ah) anthracene werevariable during the continuing calibration. (See Figure 1"Calibration Criteria" of Appendix A).
F4) All three acid surrogate recoveries for samples CA712,CA714, and CA715 were outside (0-3%) the lower acceptancelimits. On re-extraction/reanalysis of samples CA712 andCA715 (insufficient sample remained for reanalysis ofCA714), 2 of 3 surrogates were still outside the lower QCacceptance limits. Failure to detect acid extractablesunder these conditions does not confirm their absence in thesamples. This may be in part due to matrix interference,but also in part to analytical technique, as recoveries werebetter (although still low) in the reextracted samples.Better phenol recoveries can be obtained using continuousextraction rather than separatory funnel extraction. It isnot known which technique was used for this, analysis (bothare acceptable under this contract).
1-28 MOO 1328

Case 4969Page 4 of 5(Revision A. 3/86)
Base/neutral surrogate recovery for nitrobenzene-cU insamples CA713, CA714,and CA716, as well as in there-extraction/reanalysis of CA716, was outside (0-2%) thelower QC acceptance limit. (Insufficient cample was avail-able for reanalysis of samples CA713 and CA716). Failure todetect nitroaromatic compounds under these conditions doesnot confirm their absence in the samples. Based on accept-able recoveries of the other two base/neutral surrogates,other groups of compounds in this fraction may be accept-able. Polynuclear aromatic hydrocarbons are probablyacceptable. Phthalate esters, chlorinated hydrocarbons,haloethers and nitrosamines require additional informationto make a judgement.
Field Blank CA717 and Trip blank CA718 had acceptablerecoveries for all surrogates. A summary of surrogaterecoveries can be found as Figure 2 "Water Surrogate PercentRecovery Summary" of Appendix A.
In addition to poor surrogate recovery, re-extracted BNAsamples CA712RE, CA715RE, and CA716RE were completed 10-11days after sampling. The recommended holding time for BNAcompounds is 7 days to extraction. These data are presentedas confirmation of positive identifications made in theoriginally extracted sample.
«F5) Chromatographic evidence for samples CA715, CA716 andCA716RE indicates the presence of a hydrocarbon envelope,which may interfere with the detection of low levels ofother compounds eluting in the same range (Hydrocarbonenvelope encompasses approximately scans 2100-3500).
F6) DDT was found in the field blank at 7.5 times the detectionlimit. No other samples or laboratory blanks contained thiscompound.
SUMMARY
This Quality Assurance Review has identified the following areasof concern:
• Laboratory contamination in method blanks.
• Possible matrix interference for BNA compounds indicated bypoor surrogate recovery (0-3%) for BNA surrogate compoundnitrobenzene-dc and all 3 acid surrogates.
* Poor instrument response to 2-butanone.
1-29 AROOI329
Case 4969Page 5 oi 5(Revision A, 3/86)
ATTACHMENT: DATA SUMMARY
APPENDICES:
A. Data ValidationB. Sample Data Sheets
1-30
AEOOI330

USEPA - Region IIIOrganic QA Data ReviewPage 1 of 5(Revision A, 3/86)
Case it/Site I.D.: 5079 Bruin LagoonSamples: C7638-C7641, CB901-CB906Site Manager: William F. Beers (HESTON)
Jeff Pike (EPA 3HW21)
Data Reviewer: Dianne TherryReview Completed: 23 January 1986
INTRODUCTION". ' / - -
The findings offered in this report are based upon a generalreview of sample data, blank analyses results, surrogate andmatrix spike results, field duplicate analysis, target compoundidentification, and tentatively identified compound results for10 aqueous samples analyzed by one laboratory.
Each sample was analyzed for organic HSL compounds in the follow-ing fractions: Volatiles (VOA), base/neutral/acid extractables(BNA), and pesticides/PCB's (PEST),
The attached data summary contains results for positive com-pounds, which were reported as detected. Detection limits areprovided at the end of the data summary, however, these valuesmust be multiplied by appropriate dilution factors (factor=lxunless otherwise noted at the bottom of the summary table).Laboratory data sheets are located as Appendix B.
The data summary contains the following qualifier codes:
U - The material was analyzed for, but was not detected. Theassociated numerical value is the estimated samplequantitation limit.
J - The associated numerical value is an estimated quantitybecause quality control criteria were not met.
R - Quality Control indicates that data are unusable (compoundmay or may not be present). Resampling and reanalysis isnecessary for verification.
1-31
AflflOI33l
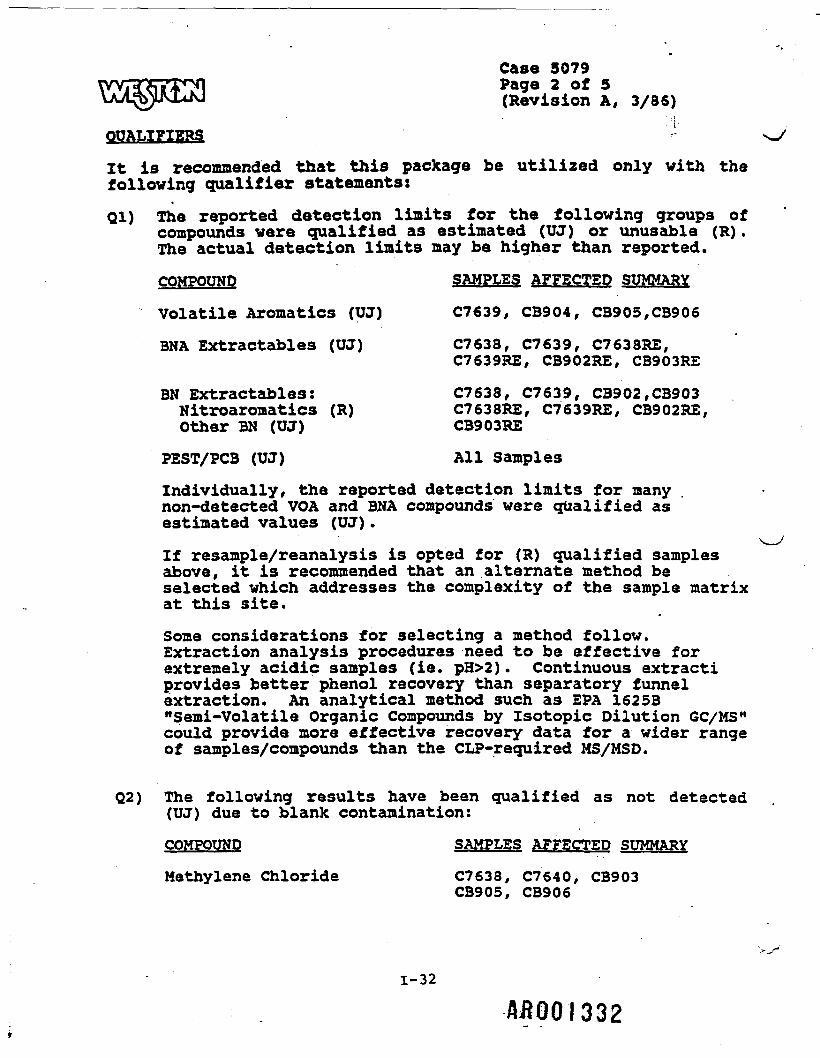
Case 5079Page 2 of 5(Revision A, 3/86)
QUALIFIERS
It is recommended that this package be utilized only with thefollowing qualifier statements:Ql) The reported detection limits for the following groups of
compounds were qualified as estimated (UJ) or unusable (R) .The actual detection limits may be higher than reported.
COMPOUND SAMPLES AFFECTED SUMMARY
Volatile Aromatics (UJ) C7639, CB904, CB905,CB906
BNA Extractables (UJ) C7633, C7639, C7638RZ,C7639RE, CB902RE, CB903RE
BN Extractables: C7638, C7639, CB902,CB903Nitroaromatics (R) C7633RE, C7639RE, CB902HE,Other BN (UJ) CB903RE
PEST/PC3 (UJ) All Samples
Individually, the reported detection limits for manynon-detected VOA and BNA compounds were qualified asestimated values (UJ) .
If resample/reanalysis is opted for (R) qualified samplesabove, it is recommended that an alternate method beselected which addresses the complexity of the sample matrixat this site.Some considerations for selecting a method follow.Extraction analysis procedures need to be effective forextremely acidic samples (ie. pH>2) . Continuous extract!provides better phenol recovery than separatory funnelextraction. An analytical method such as EPA 162 5B"Semi-Volatile Organic Compounds by Isotopic Dilution GC/MS"could provide more effective recovery data for a wider rangeof samples/compounds than the CLP-required MS/MSD.
Q2) The following results have been qualified as not detected(UJ) due to blank contamination:
COMPOUND SAMPLES AFFECTED SUMMARY
Me thy 1 en e Chloride C7633, C7640, CB903CB905, CB906
1-32
AftOOI332

Case 5079Page 3 of 5(Revision A, 3/86
COMPOUND SAMPLES AFFECTED SUMMARYAcetone C7640, CB904, CB905, CB906
2-Butanone All samples2-Hexanone C7641Bis(2-ethylhexyl)- C7638, C7639, C7640, C7641,phthalate CB903, CB905, CB906
Q3) The reported values for acetone in samples C7638, CB902,CB903 were qualified as estimated values (J).
Q4) The reported values for benzyl alcohol in sample C7641 andfor benzole acid in samples C7638, C7639, C7641, CB903,CB904 were qualified as estimated values (J).
FINDINGS
Fl) Detection Limits vere qualified for one or more of thefollowing conditions:A. The recommended holding times for the respective groups
of compounds vere exceeded.
VOA analyses vere completed between 7 and 11 days aftersampling. The recommended holding times for volatilearomatic compounds for an unacidified sample is 7 days.Note that although samples C7638, CB902, and CB903 verealso analyzed 9 and 11 days after sampling, theseunpreserved samples each had pK<2, meeting the 14 dayrecommended holding time for acidified sample.BNA extractions for samples C7638 and C7639 werecompleted 8 days after sampling. The recommendedholding time for BNA compounds is 7 days to extraction.
BNA extractions for re-extracted samples C7638RZ,C7639RE, CB902RE and CB903RE vere completed 17 and 19days after sampling. The recommended holding time forBNA compounds is 7 days to extraction. These data are
, presented as confirmation of positive identificationscade in the originally extracted sample.PEST extractions vere completed initially 9-11 daysafter sampling. Due to poor surrogate recovery, CB901- CB906 were re-extracted 32 days after sampling. Nopesticides were found in either set of CB901 - CB906analyses. Recommended holding time for pesticides is 7days to extraction, with analysis within 40 days ofextraction.
• • • ' - "I~33 : •••'''• ••• " :
AaOOI333

Case 5079Page 4 of 5(Revision A, 3/86)
B. Surrogate recoveries for base/neutral compoundswere outside the lower acceptance limits for samplesC7638, C7639, CB902 and CB903. On initial analysis,there was no recovery of nitrobenzene-de in any of the4 samples and low recovery for terphenyl-d-. in samplesC7638 and CB902. The reanalysis of these samples hadno recovery of nitrobenzene-d- in samples C7638RE,C7639RE, CB903RE and only 2% recovery of nitro-benzene-dg in sample CB902RE. Terphenyl-d.. recovery .was within acceptance limits on reanalyzed Samples.
Failure to detect nitroaromatic compounds under theseconditions does not confirm their absence in thsamples, as actual detection limits may be substantially higher than reported. Based on acceptable recover-ies of the other two base/neutral surrogates, othergroups of compounds in this fraction may be acceptable.Polynuclear aromatic hydrocarbons are probably accept-able. Phthalate eaters, chlorinated hydrocarbons,haloethers, and nitrosoamines, require additionalinformation to make a judgement.
Field blank CB906 and trip blank CB905 had acceptablerecoveries for all surrogates. A summary of surrogaterecoveries can be found as Figure 2 "Water SurrogatePercent Recovery Summary" of Appendix A.
In order for resampling/reanalysis to provide additonalinformation, an alternate method should be requestedwhich takes into account the extremes in the matrixthis site. Extraction/analysis procedures need to u-effactive for extremely acidic samples (ie pH<2). Ananalytical method such as EPA 1625B "Semi-VolatileOrganic Compounds by Isotope Dilution GC/MS" couldprovide more effective recovery data for a wider rangeof samples/compounds than the CLP-required MS/MSD.
C. Individually, the response factors indicate that theresponse for VOA and BNA HSL compounds were not alllinear during initial calibration, were variable duringcontinuing calibration, and/or produced very low(<0.05) response. Affected samples and respectivecompounds which were qualified as estimated (UJ) aresummarized in Figure 1 "Calibration Criteria" ofAppendix A.
F2) Lab Method Blanks contained sufficient amounts of methylenechloride, acetone, 2-butanone,and bis(2-ethylhexyl)phthalateto question the aforementioned results. Note that VOAsamples C7638, C7641, CB901, CB902 and CB903 were analyzedafter dilution. The concentration of each lab contaminantwas multiplied by the relevant dilution factor.
1-34 AROOI33l»
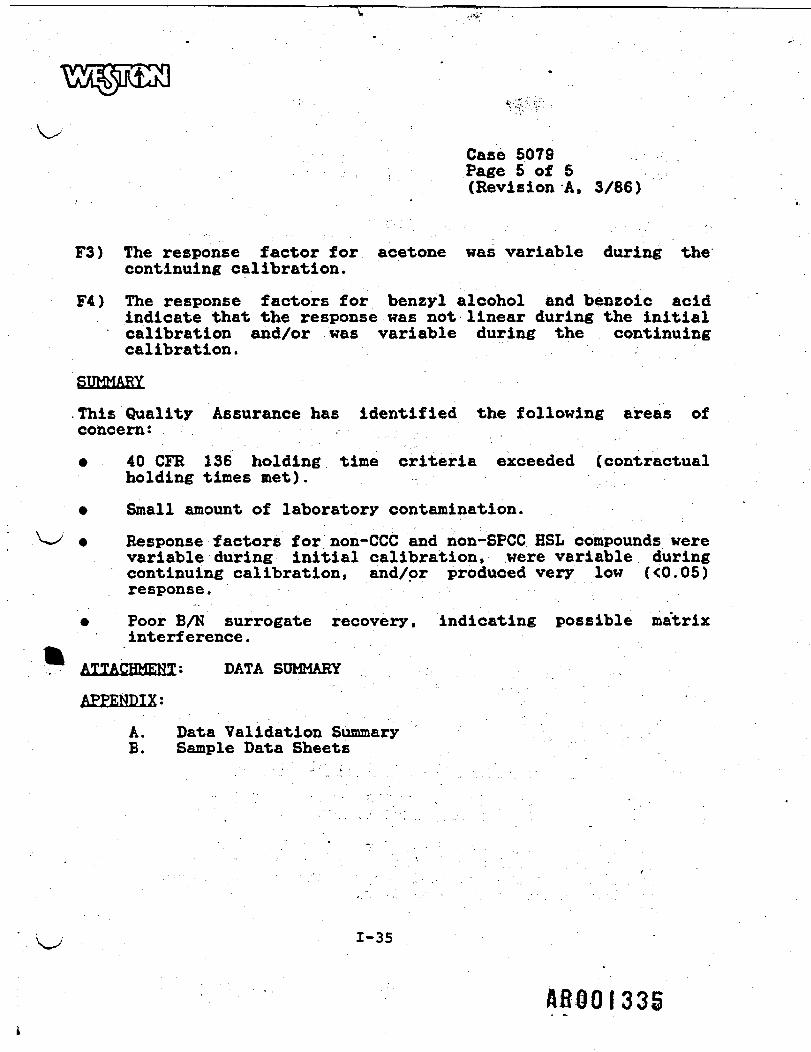
Case 5079Page 5 of 5(Revision A, 3/86)
F3) The response factor for acetone was variable during thecontinuing calibration.
F4) The response factors for benzyl alcohol and benzoic acidindicate that the response was not linear during the initialcalibration and/or was variable during the continuingcalibration.
SUMMARY
This Quality Assurance has identified the following areas ofconcern: .
• 40 CFR 136 holding time criteria exceeded (contractualholding times net).
• Small amount of laboratory contamination.
• Response factors for non-CCC and non-SPCC HSL compounds werevariable during initial calibration, were variable duringcontinuing calibration, and/or produced very low «0.05)response.
• Poor B/N surrogate recovery, indicating possible matrixinterference.
ATTACHMENT; DATA SUMMARY
APPENDIX:
A. Data Validation SummaryB. Sample Data Sheets
AEOOI33S

s-/USEPA-Region IIIInorganic QA Data ReviewPage 1 of 3
Case I/Site I.D.: 5079/SAS 1971C Bruin LagoonSample Numbers: MCD286-MCD290, MCD301, HCD303-MCD306
1971C-1 through. 1971C-29
Site Manager: William F. Beers (WESTON)Jeff Pike (EPA. 3HW21)
Data Reviewer: Earl M. Hansefr/Dianne S. TherrReview Completed: 24 January, 1986
INTRODUCTION
The findings offered in this report are based upon a reviewof all available sample data, blank results, matrix spikeand duplicate analysis results, calibration data, andquality assurance documentation.
All samples were aqueous and were analyzed for total organiccarbon (TOC) and for oil and grease (0/G). In addition,samples 13, 14, 22-29 (also designated as MCD286-MCD290,MCD301 and MCD303-MCD306) were analyzed for total organichalides (TOX), sulfite (SO "*), sulfate (SO ), andferrous iron (Fe ). No results were reported for sample7 (requested TOC and O/G) due to sample matrix problems..
QUALIFIERS
It is recommended that this data package be utilized onlywith the following qualifier statements:
• The results which may be quantitatively questionable arelisted below:
Constituent Samples with Questionable Results
TOX (A) MCD287, MCD283, MCD304, MCD305(B) MCD286, MCD301, MCD303
The above results under (A) for TOX analyses aredesignated questionable since there is evidence toindicate that the reported sample data may representmaximum values in these samples.
AR001336

Case 5079/SAS 1971CPage 2 of 3
The above results under (B) for TOX analyses aredesignated questionable since there is evidence toindicate that the reported samples data may representminimum concentrations,, and that the actual TOXconcentration in the sample may be higher thanreported.
The results which may be qualitatively questionable are.listed below:
Constituent Samples with Questionable Results
Sulf ite 27, 29
The aforementioned results were designated questionable(UJ) since there is evidence to doubt the presenceof these constituents at any concentration less than orequal to the levels reported. However, it can beassumed that concentrations significatly greater thanthe levels reported for these samples cannot.be present.
FINDINGS
The recovery of TOX in the matrix spike (sample MCD268+)is 196%. All calculations appear to be correct assubmitted. This high recovery may indicate a high biasfor TOX values reported in the referenced samples .
The recovery of TOX in the matrix spike (sample MCD301)is 46%. The calculations appear to be correct assubmitted. This low recovery may indicate a low biasfor TOX values reported in the referenced samples.
Field blank sample analysis revealed the presence ofsulfite.
TOC was measured in field blanks at levels less than orequal to 1 mg/L. Although sample results are notaffected at these levels , the presence of TOC in thefield blanks indicate the presence of an unknownconcentration of organic contamination associated withsample collection.
1-37
AROOI337

Case 5079/SAS 1971CPage 3 of 3
SUMMARY
This Quality Assurance review has indicated the followingareas of concern:
• Poor (both high and low) matrix spike recoveries for thereferenced sample for TOX analyses.
• The presence of field contamination in samplescollected for TOC analysis.
• Ferrous iron should be analyzed as soon as samples arereceived due to the change in ferrous to ferric ratiowith time. Ferrous iron was analyzed one month aftercollection.
ATTACHMENT; Data Summary
APPENDICES;
A. Inorganic QA Review/Support DocumentationB. Laboratory Sample Data Sheets (Form I)
1-38
AROOI338

USEPA Region IIIInorganic QA Data ReviewPage of 1 of 3
Case I/Site I.D.zQ>079/SAS 1971C Bruin LagoonSamples Numbers: MCD286-MCD290, MCD301, MCD303-MCD306
Site Manager: William F. Beers (WESTON)Jeff Pike (EPA 3EW21)
Data Reviewer: Dianne TherryReview Completed: 24 January, 1986
INTRODUCTION
The findings offered in this report are based upon a reviewof all available sample data, blank results, matrix spikeand duplicate analysis results, ICP interference QC,calibration data, and quality assurance documentation.All 10 aqueous samples were analyzed for 24 HSL metals.
QUALIFIERS
It is recommended that this data package be utilized onlywith the following qualifier statements:
• The following results have been qualified as quanti-tatively questionable (J) due to possible chemical orphysical interference:
Constituent Samples with Questionable Results
Aluminum MCD289, MCD290Arsenic MCD286Beryllium MCD286, MCD301, MCD303Cadmium MCD286, MCD301, MCD303Calcium MCD286, MCD301, HCD303Cobalt MCD286, MCD301, MCD303Copper MCD286, MCD301, MCD303Lead MCD286, MCD301, MCD303Silver MCD286, MCD301, MCD303Sodium MCD286-MCD288, MCD301-MCD304Zinc MCD287-MCD290, MCD304
1-39
1-339

Case 5079/SAS1971CPage 2 of 3
The aforementioned results for cadmium may be biased10-50% nigher than the actual result.
Reported detection limits for thallium in all samples andfor lead in samples MCD286, MCD301 and MCD303 have beenqualified as estimated (UJ) . Actual detection limits maybe 10-80% higher than reported for thallium and 40-80%higher than reported for lead.
Constituent/ Bias Samples Affected
Lead 40-80% MCD289, MCD290, MCD306Thallium 10-50% MCD286, MCD201, MCD303
20-60% MCD287, MCD288, MCD304, MCD30540-80% MCD289, MCD290, MCD306
• Results for selenium in all samples and for tin insamples MCD286, MCD301 and MCD303 have been qualified asunusable (R). Failure to detect selenium and tin inthese samples does not confirm their absence. Actualdetection limits may be higher than reported.
FINDINGS
• Results for diluted sample analysis for aluminum,beryllium, calcium, cobalt, copper, lead, silver, sodiumand zinc do not agree within 10% of the originalanalysis, indicating a possible chemical or physicalinterference effect.
High matrix spike recovery was reported for cadmium(130%).
• Low matrix spike recovery was reported for thallium (68%,60%, and 40%, respectively) in three separate spikedsamples and for lead (42%) in one of three spiked samples
• No matrix spike recovery (0%) was reported for seleniumin three of three spiked samples and for tin in one ofthree spiked samples. This condition indicates thepossibility that false negatives exist.
1-40
AROOI3tfO

Case 5079/SAS1971CPage 3 of 3
SUMMARY
This QA review has identified the following areas ofconcern:
• possible matrix interference indicated by results fromserial dilutions and matrix spike recoveries.
• Possible false negatives for selenium and tin.
• improper flagging on Form I
ATTACHMENT: Data Summary
APPENDICES:
A. Inorganic QA Review Report/Support DocumentationB. Laboratory Sample Data Sheets(Form I)
i 3U I

f. V-
APPENDIX 0 •
ANALYTICAL DETECTION LIMITS
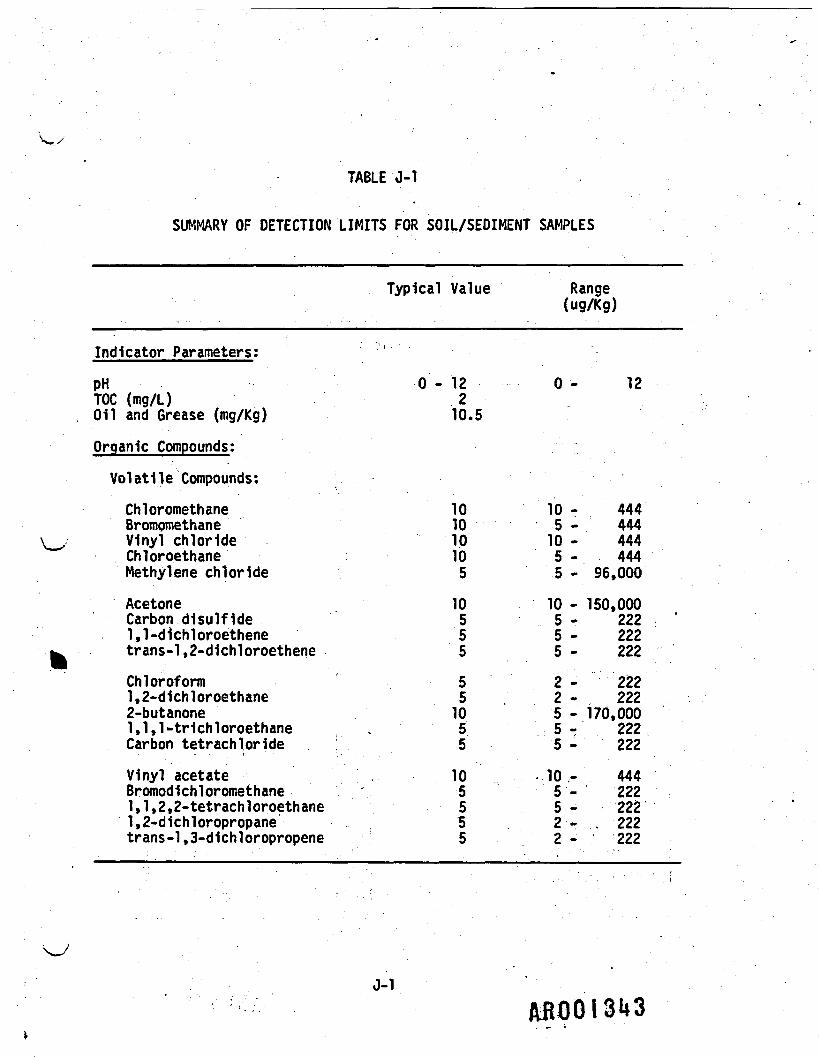
TABLE J-l
SUMMARY OF DETECTION LIMITS FOR SOIL/SEDIMENT SAMPLES
Typical Value Range(ug/Kg)
Indicator Parameters;pH 0 - 12 0 - 12TOC (mg/L) 2011 and Grease (mg/Kg) 10.5
Organic Compounds;
Volatile Compounds:Chloromethane 10 10 - 444Bromomethane 10 5 - 444Vinyl chloride 10 10 - 444Chloroethane 10 5 - 444Methylene chloride 5 5- 96,000
Acetone 10 10 - 150,000Carbon dlsulflde 5 5 - 2 2 2I,l-d1chloroethene 5 5 - 2 2 2trans-1,2-dlchloroethene 5 5- 222
Chloroform 5 2 - 222l,2-d1chloroethane 5 2 - 2222-butanone 10 5-170,0001,1,1-trlchloroethane , 5 5- 222Carbon tetrachlorlde 5 5 - 222
Vinyl acetate ... 10 10 - 444Bromodlchloromethane . . ' - . 5 5 - 2221,1,2,2-tetrachloroethane 5 5- 222l,2-d1chloropropane 5 2- . 222trans-1,3-d1chloropropene 5 2 - 222
J-l

TABLE J-l(CONTINUED)
Typical Value Range(ug/Kg)
Organic Compounds: (continued)
Trlchloroethene 5 5 - 222Dlbromochloromethane 5 5 - 2221,1,2-trlchloroethane 5 5 - 2 2 2Benzene 5 2-6,700c1s-l,3-d1chloropropene . 5 2 - 222 •2-chloroethyl vinyl ether 10 5 - 444Bromoform 5 5 - 2 2 22-Hexanone 10 2 - 4 4 44-methyl-2-pentanone 10 2 - 4 4 4Tetrachloroethene 5 2 - 2 2 2
Toluene 5 5 - 2 2 2Chlorobenzene 5 • 5 - 222Ethyl benzene 5 5 - 1,400Styrene 5 5 - 2 2 2Total xylenes 5 5 - 2 2 2
Semi-volatile Compounds:
N-N1trosod1methy1am1ne 4,000 4,000 - 8,000Phenol 1,000 1,000 - 3,000Aniline 2,000 2,000 - 5,000b1s(2-chloroethyl)ether 2,000 2,000 - 5,0002-chlorophenol 1,000 1,000-3,000
l,3-d1chlorobenzene 1,000 1,000 - 3,000l,4-d1chlorobenzene 1,000 1,000 - 3,000Benzyl alcohol 4,000 4,000 - 8,0001,2-dichlorobenzene 1,000 1,000 - 3,0002-methylphenol 1,000 1,000 - 3,000
J-2r I t
&BOOI3UU

TABLE J-l(CONTINUED)
Typical Value Range(ug/Kg)
Organic Compounds; (continued)
bis(2-ch1oroisopropyl)ether 1,000 1,000 - 3,0004-methylphenol 6,000 6,000 - 10,000N-nitroso-d1propylam1ne 5,000 5,000 - 10,000Hexachloroethane 2,000 2,000 - 3,000Nitrobenzene 5,000 5,000-10,000Isophorone " 2,000 2,000- 5,0002-nitrophenol 2,000 2,000 - 3,0002,4-dlmethylphenol 800 800 - 2,000Benzole acid 4,000 4,000 - 8,000bis(2-chloroethoxy)methane 3,000 3,000 - 6,000
2,4-dichlorophenol 800 800- 2,0001,2,4-trlchlorobenzene 2,000 2,000 - 4,000Naphthalene 2,000 2,000- 4,0004-chloroanlllne 10,000 10,000-20,000Hexachlorobutadlene 2,000 2,000- 5,0004-chloro-3-methylphenol 2,000(para-chloro-meta-cresol) 800 2,000- 3,0002-methylnaphthalene 6,000 800 - 2,000Hexachlorocyclopentadiene 800 6,000-10,0002,4,6-trichlorpphenol 800 800 - 2,0002,4,5-tHchlorophenol 2,000 2,000-3,0002-chloronaphthalene 2,000 2,000-' 3,0002-n1troan1l1ne 8,000 8,000-20,000Dimethyl phthalate 2,000 2,000 - 3,000Acenaphthylene 800 800 - 2,0003-N1troan1l1ne . 8,000 8,000-20,000
J-3

TABLE J-l(CONTINUED)
Typical Value Range(ug/Kg)
Organic Compounds; (continued)
Acenaphthene 2,000 2,000 - 4,0002,4-d1n1trophenol 10,000 10,000 - 30,0004-nitrophenol 20,000 20,000 - 30,000Dibenzofuran 2,000 2,000 - 3,0002,4-d1nitrotoluene 5,000 2,000 - 3,000
4,000 5,000 - 10,000
2,6-d1n1trotoluene 2,000 4,000 - 8,000D1ethylphthalate 800 2,000 - 4,0004-chlorophenyl phenylether 1,000 800 - 2,000Fluorene 5,000 1,000 - 3;0004-nitroanlline 5,000 - 10,0004,6-d1nitro-2-methylphenol 10,000 10,000 - 20,000N-nitrosod1phenylam1ne 4,000 4,000 - 8,0004-bromophenyl phenyl ether 3,000 3,000 - 6,000Hexachlorobenzene 2,000 2,000 - 3,000Pentachlorophenol 2,000 2,000 - 3,000
Phenanthrene 800 800 - 2,000Anthracene 1,000 1,000 - 3,000Di-n-butylphthalate 8,000 8,000 - 20,000Fluoranthene 2,000 2,000 - 4,000Benzldine 6,000 6,000 - 10,000
Pyrene 5,000 5,000 - 10,000Butyl benzyl phthalate 2,000 2,000 - 5,0003,3'-d1chlorobenzidine 4,000 4,000-8,000Benzo(a)anthracene 1,000 1,000 -• 3,000bis(2-ethylhexyl)phthalate 2,000 1,400 - 2,000
J-4
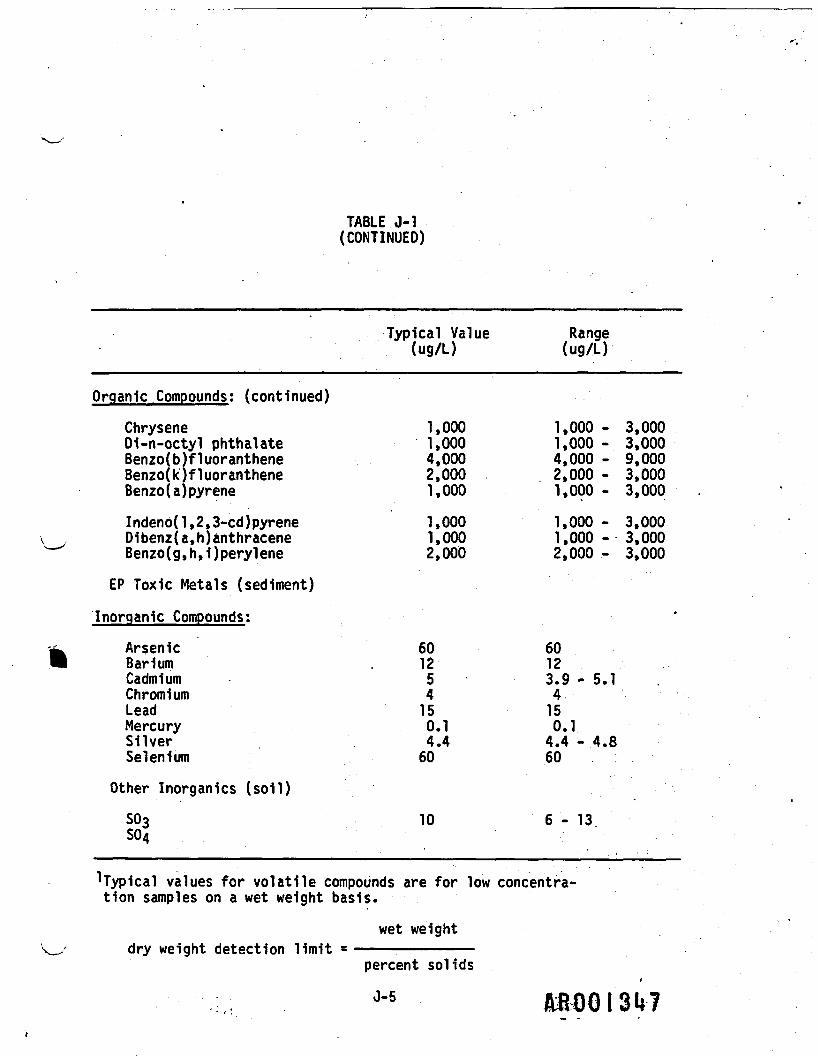
TABLE J-l(CONTINUED)
Organic Compounds; (continued)
ChryseneD1-n-octyl phthalateBenzo(b)fluorantheneBenzo( k )f 1 uorantheneBenzol a) pyrene
Indenb(1,2,3-cd)pyreneD1benz(a,h)anthraceneBenzo(g, h, 1 )perylene
EP Toxic Metals (sediment)
Inorganic Compounds;
ArsenicBariumCadmiumChromiumLeadMercurySilverSelenium
Other Inorganics (soil)S03S04
Typical Value(ug/L)
1,0001,0004,0002,0001,000
1,0001,0002,000
601254150.14.460
10
Range(ug/L)
1,000 -1,000 -4,000 -2,000 -1,000 -
1,000 -1,000 -2,000 -
60123.9 - 5.14150.14.4 - 4.860
6-13.
3,0003,0009,0003,0003,000
3,0003,0003,000
•
typical values for volatile compounds are for low concentra-tion samples on a wet weight basis.
wet weightdry weight detection limit
percent solids/
J-5 t&OOISdJ

TABLE J-2
SUMMARY OF DETECTION LIMITS FOR BEDROCK SAMPLES
Typical Value7 Range(ug/Kg) (ug/Kg)
Metals (soil)
Arsenic 6.0 5.9 - 10Barium 1.5 1.5 - 109Cadmium 2.6 2.4 - 3.8Chromium 3 3 3.2Lead 25 25 - 36Mercury 0.1 0.1 - 0.4Silver 1.8 1.8 - 3.3Selenium • 3.2 2.9 - 5.0
Indicator Parameters;TOC (mg/L) 2.0 2 20Oil and Grease (mg/Kg) 0.2 0.2 - 2p H 0-12 0 - 1 2
Organic Compounds;
Volatile Compounds:
Chloromethane 10 10 - 40Bromomethane 10 10 - 40Vinyl chloride 10 10 - 40Chloroethane 10 10 - 40Methylene chloride 5 5 - 80,000
Acetone 10 10- 175,000Carbon disulfide 5 5 - 2 01,1-dichloroethene 5 5 - 20trans-1,2-dichloroethene 5 5 - 2 0
AR0013U8

Organic Compounds; (continued)
Chloroform1,2-dichloroethane2-butanone1 , 1 , 1-tr ichloroethaneCarbon tetrachloride
Vinyl acetateBromodi Chloromethane1 , 1 ,2,2-tetrachloroethane1,2-dlchloropropanetrans-1 ,3-d1chloropropeneTrichloroetheneDibromochloromethane1 , 1 ,2-tr IchloroethaneBenzenec 1 s - 1 , 3-d i ch 1 oropropene2-chloroethyl vinyl etherBromoform2-Hexanone4-methyl -2-pentanoneTetrachloroetheneTolueneChlorobenzeneEthyl benzeneStyreneTotal xylenes
TABLE J-2(CONTINUED)
Typical Value
551055
1055555555510510105
55555
551055
1055225555510510105
55555
Range(ug/Kg)
2020
- 84,0002020
402020202020202020204020404020
202020
- . 2020
^Typical Value is for low concentration samples on a wetweight basis.
wet weightdry wt detection limit
percent solids
J-7

TABLE J-3
SUMMARY OF DETECTION LIMITS FOR WATER SAMPLES
Typical Value7 Range(ug/L) (ug/L)
Indicator Parameters;
TOC (mg/L) 1 0.2 10011 and Grease (mg/L) 1.2 0.2 - 10p H 0 - 1 2 0 - 1 2
Organic Compounds:
Volatile Fraction:
Chloromethane 10 10 - 100Bromomethane 10 10 - 100Vinyl chloride 10 10 - 100Chloroethane 10 10 - 100Methylene chloride 5 2 - 3 2 0
Acetone 10 4 - 4,900Carbon dlsulfide 5 5 - 5 01,1-dichloroethene 5 5 - 50trans-1,2-dichloroethene 5 5 - 5 0
Chloroform 5 2 - 5 01,2-dlchloroethane 5 5 - 502-butanone 10 5 - 1,1001,1,1-trichloroethane 5 5 - 5 0Carbon tetrachloride 5 5 - 5 0
Vinyl acetate 10 10 - 100BromodlChloromethane 5 5 - 5 01,1,2,2-tetrachloroethane 5 5 - 5 01,2-dichloropropane 5 2 - 50trans-1,3-d1chloropropene 5 2 - 5 0
/SRQOI350

Organic Compounds; (continued)
TrichloroetheneD 1 bromoch 1 orometh ane1 , 1 ,2-trichloroethaneBenzenecis-1 ,3-d1chloropropene2-chloroethyl vinyl etherBromoform2-Hexanone4-methy 1 -2-pentanoneTetr ach 1 oroethene
TolueneChlorobenzeneEthyl benzeneStyreneTotal xylenes
TABLE J-3(CONTINUED)
Typical Value(ug/L)
5555510510105
55555
55555101010105
15555
Range(ug/L)
505050505010010010010050
5050505050
1Typical Value is for low concentration samples on a wetweight basis.
wet weightdry wt detection limit « _________
percent solids
J-9
&BOOI35I

TABLE J-3(CONTINUED)
Typical Value Range(ug/L) (ug/L)
Organic Compounds; (continued)Semi-volatile Fraction:
N-Nitrosod1methyl amine 10 10 - 20Phenol 10 1 0 - 2 0 .Aniline 10 1 0 - 2 0bis(2-chloroethy!)ether 10 10 - 202-chlorophenol 10 10 20 , j
-—"
l,3-d1chlorobenzene 10 10 - 201,4-dichlorobenzene 10 10 - 20Benzyl alcohol 10 10 - 201,2-dfchlorobenzene 10 10 - 202-methylphenol 10 10 - 20bis(2-ch1oroisopropyl)ether 10 10 - 204-methylphenol 10 10 - 20N-nitroso-dipropylamine 10 10 - 20Hexachloroethane 10 10 - 20Nitrobenzene 10 1 0 - 2 0
WOO 1352

TABLE J-3(CONTINUED)
Typical Value(ug/L)
Organic Compounds; (continued)
Isophorone2-n1tropheno12, 4-dimethyl phenolBenzole acidbis(2-chloroethoxy)methane
2,4-d1ch1oropheno11,2,4-trichlorobenzeneNaphthalene4-ch1oroan1l1neHexachlorobutadlene
4-chloro-3-methylphenol(para-chloro-meta-cresol)2-methyl naphthaleneHexach 1 orocyc 1 opentad iene2,4,6-trichlorophenol2,4, 5-tr ichlorophenol2-chloronaphthalene2-n1troanilineDimethyl phthalateAcenaphthylene3-N1troan1line
Acenaphthene2,4-dinitrophenol4-nitrophenolDibenzofuran2,4-dinitrotoluene
10101050
10
1010•101010
10101010501050101050
1050501010
Range(ug/L)
10 -10 -10 -50 -
10 -
10 -10 -10 -10 -10 -
10 -10 -10 -10 -50 -10 -50 -10 -10 -50 -
10 - -50 -50 -10 -10 -
202020100
20
2020202020
20202020100201002020100
201001002020
ftflOOI353

Organic Compounds; (continued)
2,6-d1nitroto1ueneDiethylphthalate4-chlorophenyl phenyletherFluorene4-nitroaniline
4,6-d1n1tro-2-methylphenolN-n1trosod1phenylam1ne4-bromophenyl phenyl etherHexachlorobenzenePentachlorophenol
PhenanthreneAnthraceneDi-n-buty 1 Iphthal ateFluorantheneBenzidine
PyreneButyl benzyl phthalate3,3 ' -dichlorobenzldlneBenzo( a) anthracenebis(2-ethy1hexy1)phthalate
ChryseneDi-n-octyl phthalateBenzo(b)f1uorantheneBenzo( k ) f 1 uorantheneBenzo(a)pyrene
Indeno(l,2,3-cd)pyreneDibenz( a, h) anthraceneBenzo(g,h,i)pery1ene
TABLE J-3(CONTINUED)
Typical Value(ug/L)
1010
101050
5010101050
1010101080
1010201010
1010101010
101010
1010
101050
5010101050
1010101050
1010201010
1010101010
101010
Range(ug/L)
2020
2020 .100
100202020100
20202020160
2020402036
2020202020
202020
ABOOI35U

TABLE J-3(CONTINUED)
Typical Value Range(ug/L) (ug/L)
PCB/Pest1c1de Fraction:
alpha-BAC 0.05 0.051 beta-BAC 0.05 0.05
delta-BAC 0.05 0.05gamma-BAC (lindane) 0.05 0.05Heptachlor . 0.05 0.05Aldrin 0.05 0.05Heptachlor epoxide 0.05 0.05
Endosulfan I 0.05 0.05Dieldrin 0.10 0.104,4'-DDE 0.10 0.10Endrin 0.10 0.10Endosulfan II 0.10 0.10
4,4'-DDD . 0.10 0.10Endrin aldehyde 0.10 0.10Endosulfan sulfate 0.10 0.104,4'-DDT 0.10 0.10Endrin ketone 0.10 0.10
Methoxychlor 0.5 0.5Chlordane 0.5 0.5Toxaphene 1.0 1.0AROCLOR-1016 0.5 0.5AROCLOR-1221 0.5 0.5
AROCLOR-1232 0.5 0.5AROCLOR-1242 0.5 0.5AROCLOR-1248 0.5 0.5AROCLOR-1254 1.0 1.0AROCLOR-1260 1.0 1.0
J-l 3
AHOOI355

TABLE J-3(CONTINUED)
Typical Value Range(ug/L) .(ug/L)
Inorganic Compounds;
Metals
Aluminum 200 200 - 2,000Antimony 60 60 600Arsenic 10 1 0 - 1 0 0Barium 200 200 - 2,000Beryllium . 5 5 - 5 0Cadmium 5 5 - 5 0Calcium 5,000 5,000 - 50,000Chromium 10 10 - 100Cobalt 50 50 - 500Copper 25 25 - -250Iron 100 100 - 1,000Lead 5 5 - 5 0Magnesium 5,000 5,000 - 50,000Manganese 15 1 5 - 1 5 0Mercury 0.2 0.2 - 2Nickel 40 40 - 400Potassium 5,000 5,000 - 50,000Selenium 5 5 - 5 0Silver 10 10 - 100Sodium 5,000 5,000 - 50,000Thallium 10 10 100Tin 40 4 0 - 4 0 0Vanadium 50 50 - 500Zinc 20 20 - 200
Other Inorganics
Sulfate (mg/L) 1 0 5 - 1 0Sulfite (mg/L) 2 2Ferrous Iron (mg/L) 0.05 0.05TOX (ug/L) 10 10
^00/355

t...iIt
APPENDIX K
ANALYTICAL RESULTS FOR FIELD BLANKS AND TRIP BLANKS

w'
1GQ
V n
3 '*5 O
1g
i
^
JS
in
^
TT
CM
CM
r-t
§
CO
so
sr-03
§
CM
SCM
O
S.
.
*o$ % 9*< & 2
r-»•tf ^
g git
gg" T,•
SgS gg g2is go CM in :O^ C^l O(M Z
"I ® * ,-•^•V F^ g
in r*
g g
CM H%IP CO 00 tf
•H iH Z
1ft a sU -H "S
£ 111 "I JU 4J E "— >. -H «^ 3
5 -£~u, 8 «^ T*s ^
m«eog
it d • • 'ag g gg . g gg ' g • . gg g g
g g gg g gg g gg g g
g g 2
K-l 1358

3a
iiiiHf
CM
51
aof
=1ofCOc*rH£
O\
enMx.
VOMX
corH^
CMrH
CM
SVO
o§
oen CM- in n- •» r-CM a: CM in «» CM in rH
g g
g g
g g
• ' 8 gZg gg gg gg 2g gg gg gg gg ' g
g g•« •• c3 3 ' SX. X. M
.. 5 U I flfll(0 C rH <3 -H OU (Q C'QVrHU (0 IMUHU•H rH O fl rH (Q C M rH rH k4 JSS(Q U W 41 j2 "r4 w 3 3 V O
•JJ M --J t?5 f N J5 W W 64 P
I-l
•JJ
iJJ
84)ug
.31bHO31?•H '
!3SJ•HJJ
I1
1JJ
JJ
o3§49
w $^ ¥CB•H Skj dJff . «3 TJ "O t)2 oi B >
N JJ (0SSyj=(Q 4J (A
10 C 0* -O•H fQ T3 'HX 4J 4J (rtto Q Q 01ol c c u
J?ljl*S800I359
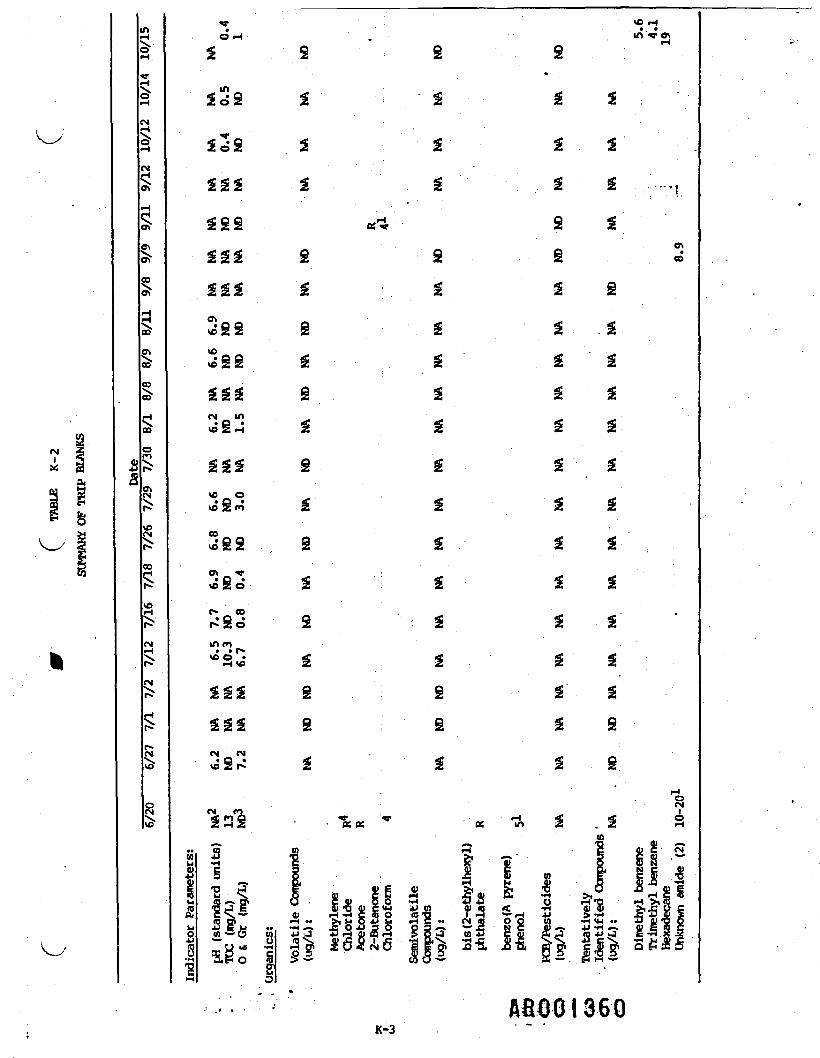
_y
CM -3
MM £Q
a<
u fef^ O
s
i
J
a2
m
SH
rH
(N
I
CMrH
1
S
03
rH
O%
00
rH
O •n
M
VON
CO
$VO
CM
£
>
$
r-
S.
I
O rH
g
gdg
s2gggggggggggggSfifi* O QD 53 2
ggg2gr]
ggg
*e°vo 2 f>
CO
VO g O
r. _ co• O •r- z o
in r>>
*Svo
ggg
ggg
.Qvo 2 r-
\A•• (0
| -a 3g m » Qi
O W *"^ U W4J ^ O
IH O
i VO rH
in V ojg g g
g ' ' g g g '
g g g g
g g g g :'-:-.f
«^ g g
g g g 2
g ; g g g
g g g . g
g ;. g g ' g
g g g g
g g g g
g g g g
g g g g
g g . g g:
g ' g g g
g g g g
g g g g
g . g g g
g g g S
g g g g
rH
7. *5« «j * 'QJ I?, g ^ S
(A r? C flj C CM
! %illi fill t! jilj|| il«ll ||i M il Ii Jit iJ.i
f
•
1360K-3 ~ '

CM1X
il
"I
i.
Ss
n
1w|
CM
§rH
rH
o?
rH
0?
enofCO0?r1£
eno>eoo>rH
0>
O*)
^VOsX
CO
>
VO
CMs-CM
rH
r>
r»CMv>
!
:3S^ r*rH g
%
4 . <&2 . A
$ g
go3 g^ M
g
g g
g g
g g
g g
g g
g g
g g
g g
rH*r «n § g g g
g g
g g
g g
g g
§ g
** ** ' C1 1 ~3 - i S 41 4[ M•• •"* S 3 u S ~* JJJJ383 —4 4) 3 <0 -n OO •* S > S"* O VH V M U•H rH H ' U rH O 'O U rHrHUX§ 5 IsSr^a | 53.2| 0l-t
' K-4fllftfcOO1361

APPENDIX L :.
ANALYTICAL RESULTS FOR THE WATERS USED IN THE DRILLING OPERATIONS

APPENDIX L
ANALYTICAL RESULTS FOR WATERS USED IN THE DRILLING OPERATIONS
I
Ori-S1teSample Location WaterDate 7/2/85
Organic Compounds (ug/L):
Volatile Organics: NDa
ChloroformBromodichl oromethaneDibromochloromethaneMethylene chloride
Semi-Volatile Compounds: ND
PhenolTentatively IdentifiedCompounds:
Decane, 2,4-dimethylOctane, 2,4,6-tr1 methyl (2)Dodecane, 2,7,10-Trimethyl
PCB/Pest1c1des: ND
Inorganic Compounds (ug/L):
Metals:Iron 659Z1nc 171
Other:
Phenol NDCyanide ND
Drilling8/8/85
199.55
8.6b
1.43.5-4.4
5.1
ND
ND
NDND
Trip TripBlank Blank7/2/85 8/8/85
ND
4
2
ND - ND
*
ND ND
NAC NA
aND - None detected.''Numerical quantity is an estimated value.CNA - Not analyzed.
L-I RBOOI363

APPENDIX M
SUMMARY OF PREVIOUS FINDINGS

APPENDIX M
SUMMARY OF PREVIOUS FINDINGS
M.I GENERAL .
The following subsections summarize relevant .data and results from paststudies conducted at the Bruin Lagoon site. Most of the informationpresented is taken from the January 1982 RI/FS report. A comparison ofthe previous findings with those of the present work 1s made to determineif site conditions have changed significantly over the past four years.
M.2 AIR MONITORING
Air monitoring conducted during the 1981 remedial investigation of BruinLagoon revealed no detectable levels of organics, SOp, HpS, HC1, orHCN In the ambient air at the site. Organic vapors were detected withinone well boring during drilling operations; however, no detectable levelswere found in the ambient breathing zone at this location. It should benoted that no borings were constructed through the open lagoon during theinitial RI. As a result, the trapped gases below the crust were notencountered.
A1r monitoring performed during WESTON's field work in June 1984 includedambient and downhole sampling at the four locations where borings wereInstalled in the lagoon and completed below the crust. Ambientmonitoring showed no detectable levels of H2S or methane. The analysisof air bag samples collected 5 feet into the borings showed the presenceof HgS, COp^ methane, and aromatic.hydrocarbons. SOp was notdetected in the downhole samples. A sample from B-l had an HpSconcentration of greater than 1,000 ppm. Based on the results of samples
'
M-l AKOOI365

collected by 1mp1ngers, it was concluded that HpS was present ataverage levels of approximately 300 to 400 ppm and that Initialconcentrations could be greater by an order of magnitude, or more.Impinger analysis also indicated HF and HC1 were not (as a mist) present.
The results of the current air monitoring at Bruin Lagoon are generallyconsistent with the findings of the previous site work. The availableinformation shows that no detectable levels of contaminants are presentin the ambient air at the site; however, the potential does exist for therelease of gases during activities which disturb the site surface. Suchactivities are likely to occur during a remedial cleanup.
The air monitoring work indicates that the gases released from thesubsurface may include organic vapors, S02, H2$, C02, or methane atvarying concentrations. The elevated levels of H2S detected indownhole grab samples collected during the June 1984 work were not foundin large amounts during the most-recent drilling operations. Furtherdiscussion of these findings is provided in Subsection 6.4.6, which'covers the results of subsurface gas testing.
M.3 LAGOON SAMPLES
A summary of the organic and inorganic analytical results for the fourlagoon samples collected during the 1981 remedial investigation of BruinLagoon are presented 1n Tables M-l and M-2, respectively. These sampleswere collected from the upper layer of the lagoon.
Only a limited number of organic priority pollutant compounds weredetected in the lagoon samples, and they were found at concentrations inthe low ppb range. High levels of inorganic contaminants (ranging in thehundreds to thousands of ppm), however, were identified in the lagoonsludge samples. These included aluminum, calcium, iron, lead, magnesium,
M-2 AHOOI366

TABLE M-1
ORGANICS RESULTS FOR LAGOON SAMPLES COLLECTED DURINGTHE 1981 REMEDIAL INVESTIGATION
ConcentrationNumber of Range
Organic Tested Occurrences2 (ug/g)
Volatile Compounds
Methylene chloride 1 1.0
Semivolatile Compounds
Bis(2-ethy1hexy1)phthalate . 1 <10
Pesticides/PCBsPCB-1260 4 0.38-0.53
Tentatively Identified Compounds** '
Hexadecane 2 10-100Licosane 3 15-160Octadecane 3 26-160Pentacosane 4 17-2601-Hexptadecanol 1 77Hexatriacontane 1 91Undecane 1 77Phenol, 2,6-b1s(l,l-dimethylethyl)-4-ethyl 1 18
Heneicosane 1 27
aBased on four samples collected 9/1/85.Estimated concentrations.
M-3

TABLE M-2
INORGANIC RESULTS FOR LAGOON SAMPLES COLLECTED DURINGTHE 1981 REMEDIAL INVESTIGATION
Number ofParameter Tested Occurrences3
AluminumAntimonyArsenicBariumBerylliumBoronCadmiumCalciumChromiumCobaltCopperIronLeadMagnesiumManganeseMercuryNickelSeleniumSilverSodiumThalliumTinVanadiumZincpH (standard units)CODTOCMBASTS (percent)VS (percent)Cyanide
8008.060837188880700800288888880
Concentration Range(mg/kg unless otherwise specified)
510 - 1,270NDND
6-30ND
4-34ND
2,120 - 5,9802 - 42 - 4
42,680 - 5,040
40 - 240240 - 50068 - 170
ND4 - 12
NDND
880 - 2.040NDND
2 - 444 - 1301.9 - 2.8
528,000 - 886,00074,300 - 215,000
930 -: 41, 00040.0 - 64.631.3 - 45.9
ND
aBased on eight samples (four duplicates) collected 9/1/85.
M-4ARQ01368

manganese, sodium, and zinc. High concentrations of volatile solids (VS)and TOC (typical of asphaltlc sludges) were also identified. Significantconcentrations of surface-active detergents (MBAS) were detected in thelagoon samples as well.
Finally, the analyses showed that the sludge was highly acidic with a pHin the range of 2 to 3. The low pH of the sludge is also likely to havecontributed to the high Inorganics concentrations in the lagoon samples.The acidic conditions created by the lagoon may have liberated theconstituent cations of aluminum, calcium, iron, magnesium, and manganesefrom the wastes in the lagoon (ash, coal refuse, filter clay, and soil)and resulted in accumulations 1n the lagoon sludge.
The analytical results for the soil collected during the current RI, showthat they were composed largely of uhstabilized sludge; this agrees withthe previous characterization of the lagoon sludge. These samples showedthat this material has an extremely low pH, and contained a number ofinorganics and relatively few organic compounds.
Additional analyses of lagoon samples, as well as sludge contaminatedsoils, were conducted during the 1981 RI to evaluate the heating valueand potential incinerabllity of on-site wastes. The results of thisstudy are provided in Table M-3.
The results Indicate that the sludge generally has a high heating value.Samples taken from the middle of the lagoon had values of approximately12,000 Btu/lb. Heating values for some of the contaminated soil samplescould not be determined since they would not burn in the calorimetrytest. Halogen concentrations ranged from 2 to 23 mg/kg of chloride and,as such, are not viewed as a problem for incineration. The sulfurcontent was about 2.6 percent, a level that would not create significantair contamination during incineration.
M-5RSOOI369
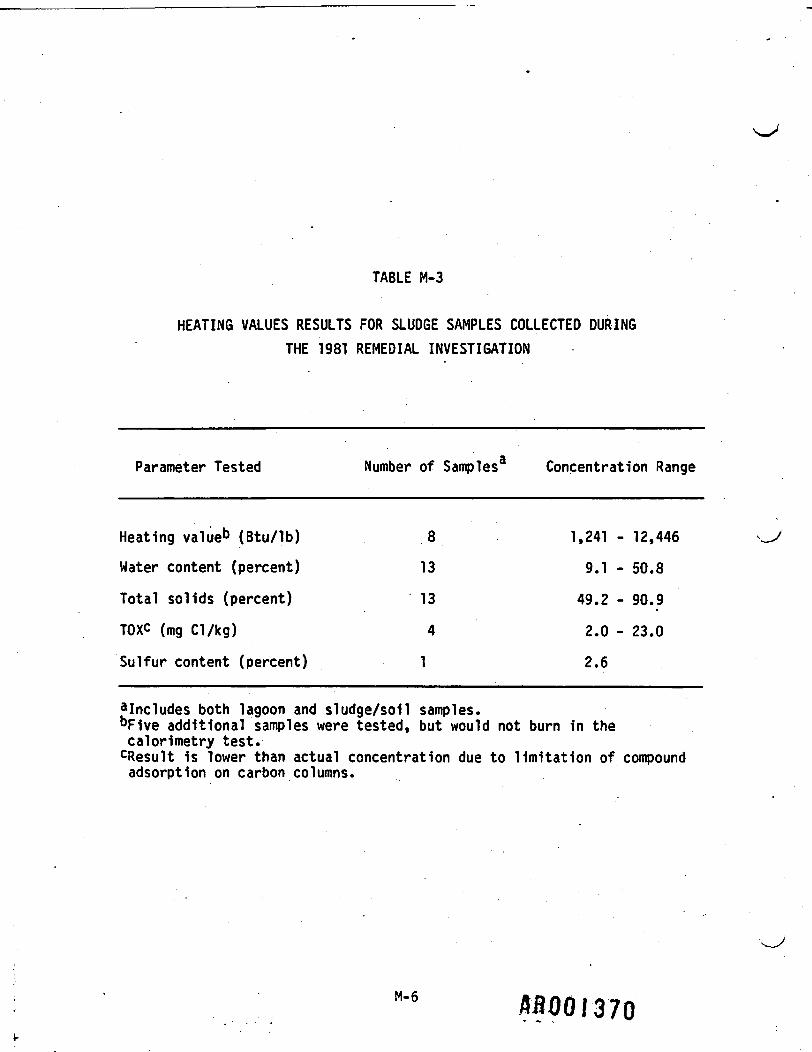
TABLE M-3
HEATING VALUES RESULTS FOR SLUDGE SAMPLES COLLECTED DURINGTHE 1981 REMEDIAL INVESTIGATION
Parameter Tested Number of Samples3 Concentration Range
Heating valueb (Btu/lb) 8Water content (percent) 13
Total solids (percent) 13
TOXC (mg Cl/kg) 4
Sulfur content (percent) 1
1,241 -
9.1 -
49.2 -
2.0 -
2.6
12,446
50.8
90.9
23.0
alnc1udes both lagoon and sludge/soil samples."Five additional samples were tested, but would not burn in thecalorimetry test.cResult is lower than actual concentration due to limitation of compoundadsorption on carbon columns.
M-6 ABOOI370

Viscosity testing of the sludge samples was also performed. The materialshowed a great variability in viscosity with changing temperature. Itwas concluded that the highly viscous nature of the sludge would presentmaterials handling problems during the implementation of incineration andother remedial alternatives.
M.4 SOIL SAMPLES
The organic and inorganic analytical results for soil samples collectedduring the 1981 RI of Bruin Lagoon are summarized in Tables M-4 and M-5,respectively. Soil samples were collected from various depths during thedrilling of the 14 monitoring wells at the site, and the excavation ofthe 9 test pits from the covered lagoon areas.
Tables M-6 and M-7 provide summaries of the organics and Inorganics,respectively, for the soil samples collected during the 1984 emergencyaction. These samples were collected at various depths during theinstallation of well A-l. Additionally, pH versus depth data is providedin Table M-8 for the shallow wells installed during the 1984 emergencywork. •

TABLE M-4
ORGANICS RESULTS FOR SOIL SAMPLES COLLECTED DURING THE1981 REMEDIAL INVESTIGATION
Concentration RangeOrganic Tested Number of Occurrences3 (ug/g)
Volatile Compounds
Benzene 4 0.01 - 0.03Chlorobenzene 3 <0.01 - 0.011,1,1-trichloroethane 2 0.01 - 0.02Chloroethane 4 0.01Ethylbenzene 4 0.03 - 0.07Methyl chloride 14 0.01 - 0.036Bromomethane 1 0.01Bromoform " 1 0.01Trichlorofluoromethane 2 <0.01 - 0.01Tetrachloroethylene 3 0.01 - 0.05Toluene 13 <0.01 - 0.30Trichloroethylene 4 0.02 - 0.05
Semivolatile Compounds
Phenol 3 <0.2 - 5.61,2,4-trichlorobenzene 1 1.7Hexachlorobenzene ' 1 0.201,2-Diphenylhydrazine 1 ^O^OFluoranthene 1 -<0.204-chlorophenyl 1 <0.20phenyl ether
4-bromophenyl 1 <0.20phenyl ether
M"8 mo 1372

Organic Tested
Semi volatile Compounds
N-n1trosod1pheny1am1ne
TABLE M-4(continued)
Number of Occurrences3
(continued)r
Bis (2-ethylhexyl) phthalate 2Diethyl phthalateDimethyl phthalateBenzo (a) anthraceneChryseneAnthraceneFluorenePhenanthrenePyrene
Pest1cides/PCBsPCB-1242PCB-1260
11114111
24
Concentration Range(ug/g)
O.20<0.20 - 1.1-=0.20-rO.20<0.20<0.20<0.20 - 1.5<=0.20<0.27 - 1.5<0.50
•
1.47 - 1.790.053 -.5.61
3Based on 15 samples collected from August 24 to September 3, 1981.
M-9
A860-I373
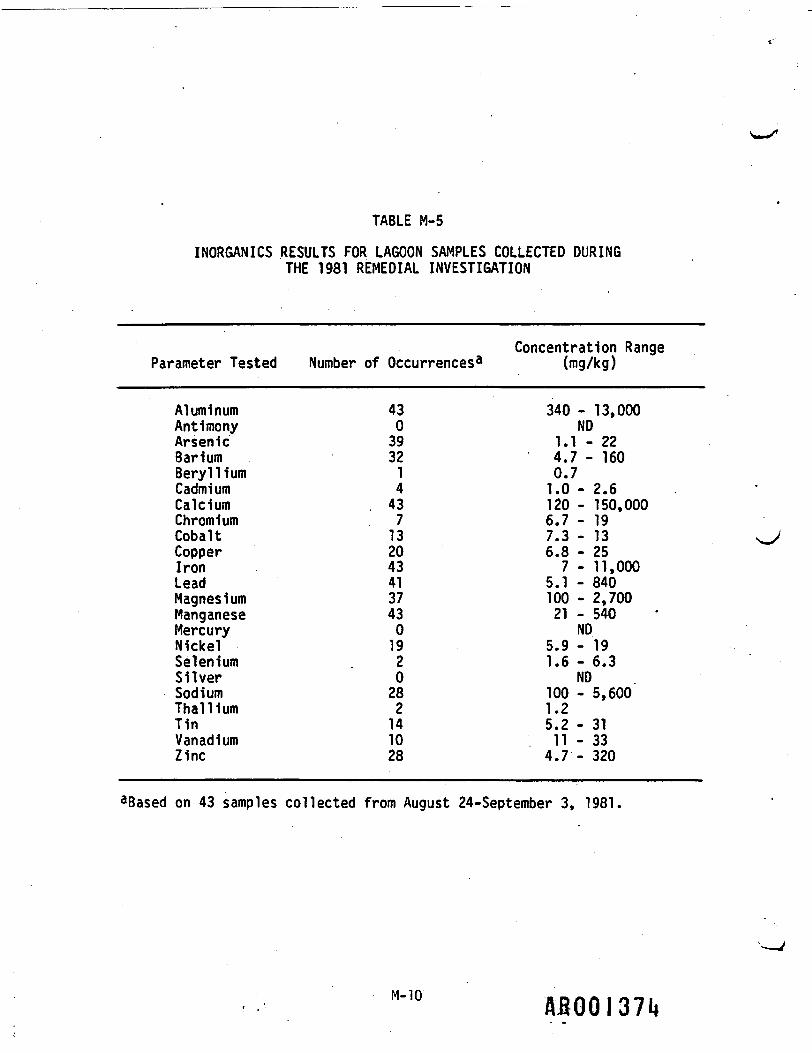
TABLE M-5
INORGANICS RESULTS FOR LAGOON SAMPLES COLLECTED DURINGTHE 1981 REMEDIAL INVESTIGATION
Parameter Tested
AluminumAntimonyArsenicBariumBerylliumCadmiumCalciumChromiumCobaltCopperIronLeadMagnesiumManganeseMercuryNickelSeleniumSilverSodiumThalliumTinVanadiumZinc
Number of Occurrences3
430393214
. 43713204341374301920282141028
Concentration Range(mg/kg)
340 - 13,000NO
1.1 - 224.7 - 1600.71.0 - 2.6120 - 150,0006.7 - 197.3 - 136.8 - 257 - 11,000
5.1 - 840100 - 2,70021 - 540
ND5.9 - 191.6 - 6.3
ND100 - 5,6001.25.2 - 3111 - 334.7 - 320
aBased on 43 samples collected from August 24-September 3, 1981.
M"10 ABOOI371*

TABLE M-6
ORGANICS RESULTS FOR SOIL SAMPLES COLLECTED DURING. THE 1984 EMERGENCY ACTION
Concentration RangeOrganic Tested Number of Occurrences3 ._ (ug/g)
Volatile Compounds
Benzene 3 0.1-0.4Carbon tetrachloride 1 0.11,1,1-trichloroethane 6 0.1 - 0.5Chloroform 7 0.2 - 0.6Trans-1,2-dichloroethylene 3 • 0.1Ethylbenzene 4 0.4-1.0Methylene chloride 7 1.3-29Tetrachloroethylene 2 0.1 - 0.2Toluene 7 0.1-1.8Trichloroethylene 6 0.1 - 0.6
Semivolatile Compounds
2,4-dimethylphenol 1 0.1Phenol 5 0.2 - 1.7Fluoranthene 2 0.2Naphthalene 2 0.3 - 0.8Bis (2-ethylhexyl)-phthalate 4 0.2- 3.2Butylbenzylphthalate 1 0.3Di-n-butylphthalate 2 0.2- 0.3Diethylphthalate 1 0.1Chrysene 1 0.2Fluorene 2 0.2-0.6Phenanthrene 1 0.7
3Based on 7 samples collected on July 31, 1984..Note: Pest1c1de/PCB compounds were not analyzed.
"-" AROOI375

TABLE M-7
INORGANICS RESULTS FOR SOIL SAMPLES COLLECTED DURINGTHE 1984 EMERGENCY ACTION
Concentration RangeParameter Tested Number of Occurrences3 (mg/kg)
Metals
Aluminum 7 3,000 - 18,000Antimony 3 550 - 600Arsenic 7 50 - 360Barium 0 NDBeryllium. 0 ND • • -Boron 3 950 - 1,400Cadmium 3 10Calcium 7 400 - 14,000 v >Chromium 3 49-150Cobalt 3 45-60Copper 7 10-400Iron 7 4,500 - 80,000Lead 3 70 - 80Magnesium 7 200 - 1,000Manganese 7 60 - 1,000Mercury 7 0.2 - 0.42Molybdenum 1 50Nickel 7 65 - 180Potassium 7 1,100 - 10,000Selenium 7 0.6 - 60Silver 0 N/ASodium 7 450 - 2,000Thallium 0 NDTin • 0 NDTitanium 3 650 - 3,500Vanadium 3 29-40Zinc 7 44 - 270
M"12 AROOI376

TABLE M-7(continued)
Parameter Tested Number of Occurrences3
Other Inorganics
pH (standard units) 7
Total sulfur(percent) 7
Soluble sulfate(percent S) 7
Soluble sulfide (mg/kg) 6
Concentration Range(mg/kg)
1.3 - 3.8
1.2 - 5.7
0.16 - 4.1
4.2 - 43
aBased on 7 samples collected on July 31, 1984.
M-13
48001877

TABLE M-8
pH RESULTS FOR SOIL SAMPLES COLLECTED DURING THE1984 EMERGENCY'ACTION
Approximate Depth pHSample Location (ft) (standard units)
A-l 16 1.317 3.519 2.920 3.821 2.722 2.023 2.8
A-2 17 9.519 4.221 4224 (S/B) 0.*5
A-3 17 2.5
A-4 16 0.419 0.4
A-6 17 6.022 1.025 (S/B) 5.0
A-7 15 1.018 1.022 1.0
A-8 25 (S/B) 2.0
A-9 22 2.025 (S/B) 1.0
M-14

TABLE M-8(continued
Approximate DepthSample Location (ft)
A-10 202325 (S/B)
A-11 1320
A-12 816 .21
A-13 192225
pH(standard units)
1.01.02.0
2.02.0
5.05.04.0
<1.0<1.0-=1.0
Notes: Samples were collected during July and August 1984.S/B denotes sample collected at soil-bedrock Interface.
M-15 >nnn i QflQ
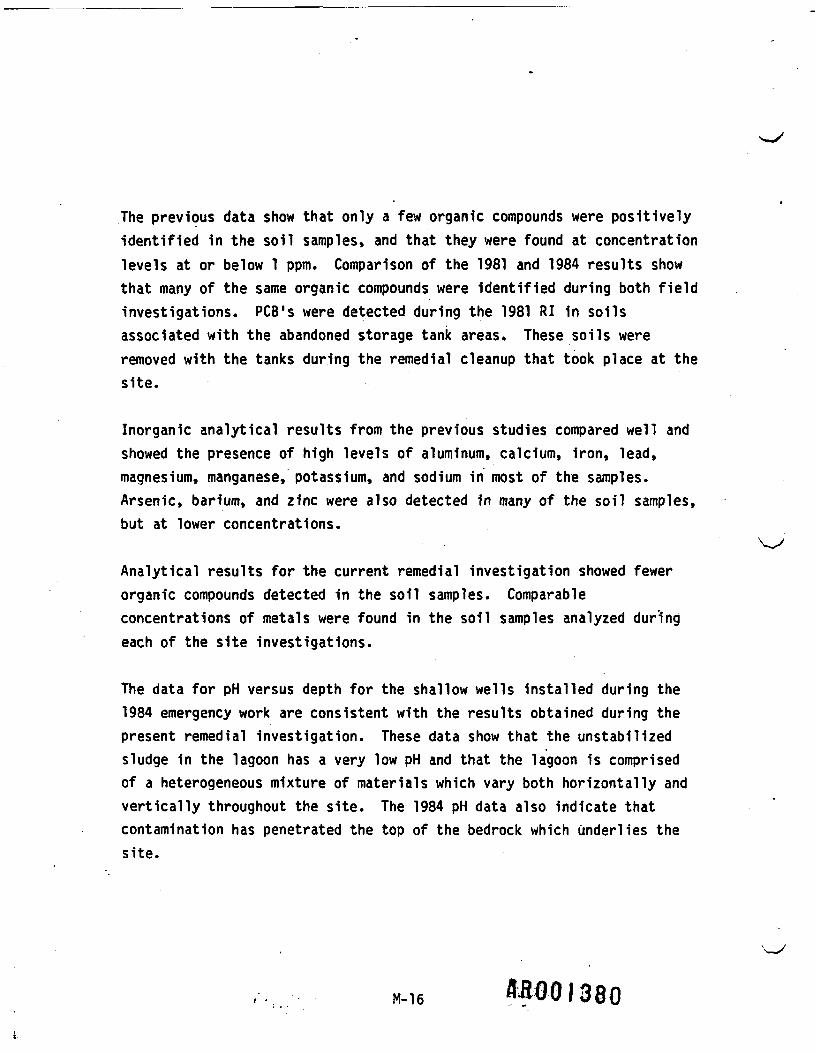
The previous data show that only a few organic compounds were positivelyidentified in the soil samples, and that they were found at concentrationlevels at or below 1 ppm. Comparison of the 1981 and 1984 results showthat many of the same organic compounds were identified during both fieldinvestigations. PCB's were detected during the 1981 RI in soilsassociated with the abandoned storage tank areas. These soils wereremoved with the tanks during the remedial cleanup that took place at thesite.
Inorganic analytical results from the previous studies compared well andshowed the presence of high levels of aluminum, calcium, iron, lead,magnesium, manganese, potassium, and sodium in most of the samples.Arsenic, barium, and zinc were also detected in many of the soil samples,but at lower concentrations.
Analytical results for the current remedial investigation showed fewerorganic compounds detected in the soil samples. Comparableconcentrations of metals were found in the soil samples analyzed duringeach of the site investigations.
The data for pH versus depth for the shallow wells installed during the1984 emergency work are consistent with the results obtained during thepresent remedial investigation. These data show that the unstabilizedsludge in the lagoon has a very low pH and that the lagoon is comprisedof a heterogeneous mixture of materials which vary both horizontally andvertically throughout the site. The 1984 pH data also indicate thatcontamination has penetrated the top of the bedrock which underlies thesite.
M-16 £8001380
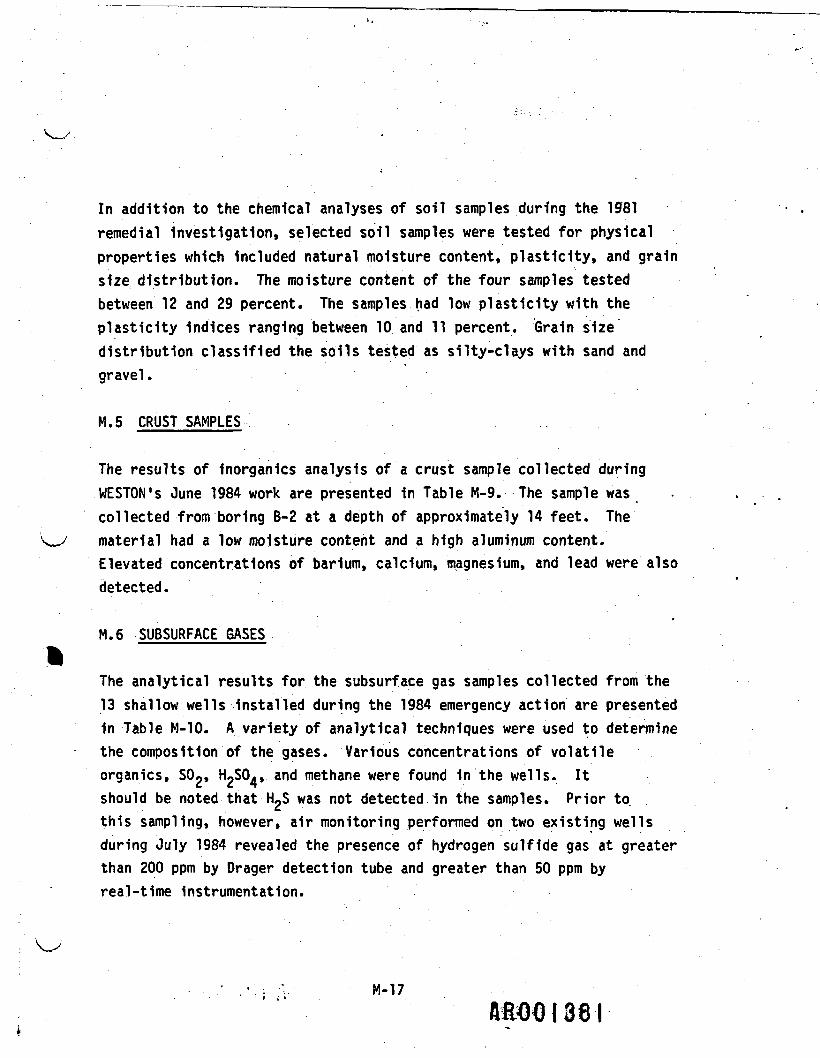
In addition to the chemical analyses of soil samples during the 1981remedial investigation, selected soil samples were tested for physicalproperties which included natural moisture content, plasticity, and grainsize distribution. The moisture content of the four samples testedbetween 12 and 29 percent. The samples had low plasticity with theplasticity Indices ranging between 10 and 11 percent. Grain sizedistribution classified the soils tested as silty-clays with sand andgravel.
M.5 CRUST SAMPLES
The results of inorganics analysis of a crust sample collected duringWESTON's June 1984 work are presented in Table M-9. The sample wascollected from boring B- 2 at a depth of approximately 14 feet. Thematerial had a low moisture content and a high aluminum content.Elevated concentrations of barium, calcium, magnesium, and lead were alsodetected.
M.6 SUBSURFACE GASES
The analytical results for the subsurface gas samples collected from the13 shallow wells installed during the 1984 emergency action are presentedin Table M-10. A variety of analytical techniques were used to determinethe composition of the gases. Various concentrations of volatileorganics, S02, HpS04, and methane were found in the wells. Itshould be noted that H2S was not detected 1n the samples. Prior to.this sampling, however, air monitoring performed on two existing wellsduring July 1984 revealed the presence of hydrogen sulfide gas at greaterthan 200 ppm by Drager detection tube and greater than 50 ppm byreal-time instrumentation.
M-17

TABLE M-9
INORGANIC RESULTS FOR CRUST SAMPLE COLLECTED DURINGTHE JUNE 1984 INVESTIGATION
ConcentrationParameter Tested (mg/kg)
Aluminum 38,500Barium 1,500BerylliumCadmium 10Calcium 8,000Chromium 55Copper 131Lead 6,500Magnesium 3,200Nickel 32SilverThallium 148Tin 111Zinc 466Moisture content (percent) 11.5
Note: Sample was collected on June 8, 1984.
M-18 A&OOI382
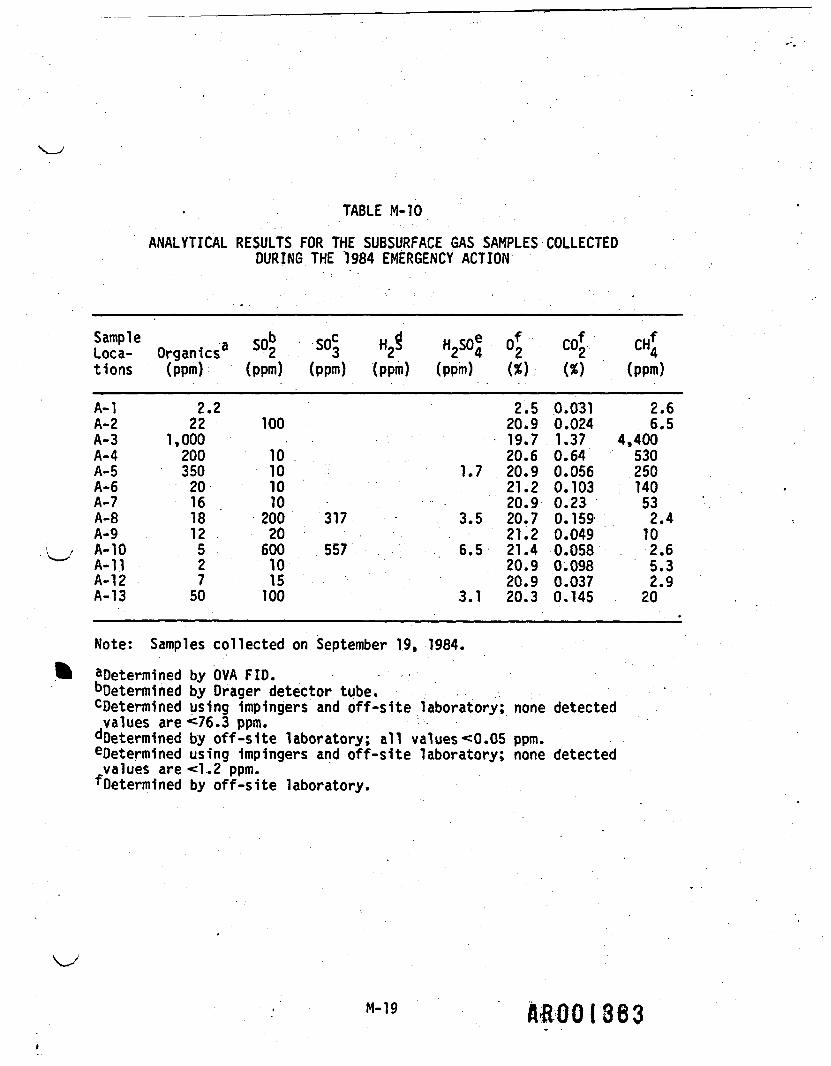
TABLE M-10
ANALYTICAL RESULTS FOR THE SUBSURFACE GAS SAMPLES COLLECTEDDURING THE 1984 EMERGENCY ACTION
SampleLoca-tions
A-lA-2A-3A-4A- 5A-6A-7A-8A-9A-10A-llA-12A-13
Organics8(ppm)
2.222
1,0002003502016181252750
SO|J SOg H23(ppm) (ppm) (ppm)
100
10101010200 31720600 5571015100
H2SO|(ppm)
1.7
3.5
6.5
3.1
«roo.-2.520.919.720.620.921.220.920.721.221.420.920.920.3
CO*(*)
0.0310.0241.370.640.0560.1030.230.1590.0490.0580.0980.0370.145
CHj(ppm)
2.66.5
4,400530250140532.4102.65.32.920
Note: Samples collected on September 19, 1984.
aDetermined by OVA FID. •bOetermined by Drager detector tube.cDetermined using Impingers and off-site laboratory; none detectedvalues are <76.3 ppm.dDetermined by off-site laboratory; all values<0.05 ppm.eDeterm1ned using impingers and off-site laboratory; none detectedvalues are <1.2 ppm.'Determined by off-site laboratory.
M'19 AHOOI383

Methane was observed in all the wells with a concentration range of 2.6 -4,400 ppm. Wells A-3, A-4, A-5, and A-6 had the highest methaneconcentrations. These values showed good correlation with the organics/CH. levels measured in the field by the OVA. Analysis of carbon tubesamples collected from each well for volatile organic compounds showednone to be present. Additionally, samples from each well were analyzedfor methyl, ethyl, propyl, and t-butyl mercaptan and these compounds werenot detected in any of the wells.
Drager detector tubes showed the presence of sulfur dioxide in 11 of the13 wells. Wells A-2, A-8, A-10, and A-13 had S02 concentrations ofgreater than 100 ppm. Subsequent laboratory analysis of impinger samplesconfirmed the presence of elevated levels of S02 in wells A-8 andA-10. Additional laboratory analysis for each sample indicated thatS02 was present at concentrations less than 0.002 percent. Sulfuricand mist was found in wells A-5, A-8, A-10, and A-13.
Laboratory analysis of the samples also showed that gases from each wellcontained about 21 percent 02 and approximately 78 percent N2.Carbon dioxide varied from well to well, ranging from 0.024 percent inwell A-12 to 1.37 percent in well A-3. Levels of C02 and CH4 foundin particular wells indicate that biological processes may be occurringin the subsurface.
M-20

The results of the 1984 sampling of subsurface gases at the Bruin Lagoonsite showed that elevated levels of S02 and the presence of H2S04mist were limited to three wells (A-8, A-10, and A-13). Additionally,reactions and gas releases occurred during the installation of each ofthese wells. Elevated levels of SOp were also detected in well A-2.These wells are all located within 50 feet of one another and, as aresult, the data suggests that this area of the site is a "hot spot" withrespect to potentially harmful trapped subsurface gases.
Analytical results for subsurface gas samples collected from wells A-lthrough A-13 during 1984 and 1985 are summarized for comparison in TableM-ll. A period of approximately one year elapsed between the 1984sampling and the first sampling round conducted in 1985. Comparison ofthe results shows them to be in general agreement and confirms thepresence of a "hot spot" area at the site. Sulfur dioxide was detectedduring the 1985 samplings in only five wells; these included A-2, A-8,A-10, and A-13, as well as A-l. It should be noted that well A-l islocated about 30 feet south of well A-2, and approximately 45 feet westof wells A-8, A*10, and A-13. This additional well provides furthersupport for the presence of a "hot spot" area located in the central partof the site. Additionally, sulfuric add mist and hydrogen sulfide wereeach detected in only one well during the current remedial investigation,A-10 and A-13, respectively.
M-21AiOOI385

TABLE M-ll
COMPARISON OF ANALYTICAL RESULTS FOR SUBSURFACE GAS SAMPLES
SampleLocation
A-l
A-2
A-3
A-4
A-5
A-6
A-7
A-8
DateCollected
9/19/849/5/8510/9/85
9/19/849/5/8510/9/85
9/19/84 >19/5/8510/9/85
9/19/849/5/8510/9/85
9/19/849/5/8510/9/85
9/19/849/5/8510/9/85
9/19/849/6/8510/9/85
9/19/849/5/8510/9/85
VolatileOrganics(ppm)
2.28000.5
2.20.60.5
,0000.21.0
200
1.0
3503.00.5
201.21.0
162.01.0
186.02.5
so2(ppm)
^25
100
>25
10
10
10
10
259
>25
H9S H0SO. 0,2 2 4 2(ppm) (ppm) (%)
20.5I 20
18
20.9NA18
19.7< 519.5
20.6818.5
1.7 20.9I NA
18
21.2NA14
20.91918.5
3.5 20.7NA20
co2W
0.0310.060.22
0.0240.010.25
1.37 4>0.300.04
0.64>0.30>0.30
0.0560.040.10
0.1030.040.13
0.230.040.15
0.1590.060.08
CH4(ppm)
2.6AA
6.5PP
,400PA
530P
• P
250PP
140AP
53PP
2.4PA
M-22ABQOI386

TABLE M-ll(continued)
SampleLocation
A-9
A-10
A-ll
A-12
A-13
DateCollected
9/19/849/5/8510/9/85
9/19/849/5/8510/9/85
9/19/849/5/8510/9/85
9/19/849/5/8510/9/85
9/19/849/5/8510/9/85
VolatileOrganics(ppm)
120.80.5
50.41.0
20.42.0
70.61.0
502.64.0
so2(ppm)
20
579>25>25
10
15
100
(ppm) (*) (%)
21.2NA18
6.5 21.4NA
>1.2 19.5
20.9NA20
20.9NA
I 19
3.1 20.317.5
160 5.0
co2(*)
0.0490.040.06
0.0580.10
>0.30
0.0980.100.12
0.0370.06
>0.30
0.1450.20
>0.30
CH4(ppm)
10AA
2.6AP
5.3AP
2.9AP '
<20PP
Notes: A - Absent; P - present.I - Interference prevented analysis.
NA - Not analyzed.
M-23 .89001-387

Carbon dioxide and methane results for the September 1985 sampling ofwells A-l through A-13 are in agreement with the values measuredpreviously. The data confirm the presence of increased C02 and CH4levels in certain wells at the site. Also, it should be noted that theoxygen content in wells A-3 and A~4 decreased dramatically below that ofair during the year between samplings. This Information, coupled withthe elevated levels of C02 and CH. measured in each of these wellsduring September 1984 and September 1985 samplings, confirms thepossibility that biological degradation may be occurring below thesurface of the site.
M.7 SURFACE WATER
Tables M-12 and M-13 summarize the analytical results for organics andinorganics, respectively, for one set of surface water samples collectedduring the 1981 remedial investigation of Bruin Lagoon. Samples werecollected at three locations in the South Branch of Bear Creek, as wellas in the small feeder stream flowing along the southern boundary of-thesite.
The results for the feeder stream indicated that it was not contaminatedat that time. No detectable levels of organic priority pollutants werefound and only background concentrations of natural constituentinorganics were measured. These data indicate that the feeder stream hadlittle impact on the water quality of the South Branch at the time ofsampling.
With the exception of phenol, the results for the three samples collectedin Bear Creek indicated that specific organic compounds (see Table M-12)are at or below detection levels. Phenol showed a 10-fold increasebetween the upstream and downstream sampling locations (37 ppb. to 310ppb); however, the samples were collected on different days andconclusions cannot be drawn from the data at this time.
AR 001388M-24

TABLE M-12
ORGANICS RESULTS FOR SURFACE WATER SAMPLES COLLECTED DURINGTHE 1981 REMEDIAL INVESTIGATION
OrganicCompound Bear Creek Feeder(ug/L) Upstream3 Stream3
Volatile Compounds
Semi volatile Compounds
PhenolAnthracene <•Phenanthracene <
Pesticides/PCSs
ND ND
371010
ND ND
Bear CreekBase of D1keb
ND
281212
ND
Bear CreekDownstreamb
ND
310
ND
aSample collected on August 27, 1981,bSamp1e collected on August 26, 1981.ND - None detected.
ftROOI-389

TABLE M-13
INORGANICS RESULTS FOR SURFACE WATER SAMPLES COLLECTED DURINGTHE 1981 REMEDIAL INVESTIGATION
ParameterTested
AluminumAntimonyArsenicBariumBerylliumBoronCadmiumCalciumChromiumCobaltCopperIronLeadMagnesiumManganeseMercuryNickelSeleniumSilverSodiumThalliumTinVanadiumZincCODTOCMBASTSSVSSCyanide
Bear CreekUpstream3(mg/L)
5.0
0.032.720.0020.10
74.10.020.010.0458
13.51.7
0.04
0.018200.01
0.020.12
1,910454510
3,880800
FeederStream3(mg/L)
0.15
0.06
0.02
27.2
0.60
6.400.18
6.10
0.39
80.1
27084
Bear CreekBase of D1keb
(mg/L)
0.65
0.032.39
0.12
55
5.500.0510.81.01
0.10
906
0.053,7301,266775
4,6901,530
Bear CreekDownstreamb(mg/L)
20.7
0.123.870.0060.10
2410.200.090.66
1640.10 .387.9
0.240.02
946
0.0090.051.12
11,4003,586475
4,7801,420
aSample collected on August 27, 1981.bSample collected on August 26, 1981.
M-26A&OOI390

Organics results for the two rounds of surface water samples collectedduring the current RI showed general agreement with the previousfindings. Again, phenol was the only organic compound to be positivelyidentified and at the same levels as previously found. The concentrationincrease of phenol across the site, however, was not as great as thatfound during the 1981 study.
The inorganics results for surface water samples collected during the1981 investigation showed significant increases in COD and TOC in BearCreek between upstream and downstream sampling stations. The upstreamsamples indicated that the creek contained greater than 1 ppmconcentrations of aluminum, barium, magnesium, and manganese; and greaterthan 50 ppm concentrations of calcium, iron, and sodium. The siteappeared to add to the surface water pollution, although contaminantIncreases of less than one order of magnitude were observed.
The Inorganics surface water-results for the present remedialinvestigation generally confirm the previous findings. The same metalswere identified in the same concentration ranges found during the 1981sampling. Slight increases in concentrations were usually noted in thedownstream samples as well. It should be noted that TOC showed a markeddecrease between the studies with average stream concentrations of 1,770mg/L for the 1981 samples, and 85 mg/L for the 1985 samples.
M-27AfiOOI39l

In summary, available information from the surface water samplingperformed for the South Branch of Bear Creek, in the Immediate area ofBruin Lagoon, confirms the highly polluted nature of the stream, andshows that the site appears to have only a limited impact on the waterquality of the creek.
M.8 GROUNDWATER
The results of organic and inorganic analyses performed for groundwatersamples collected during the 1981 RI are summarized in Tables M-14through M-19. These tables provide results for samples collected fromshallow and bedrock wells installed during the RI as well as for samplescollected from three residential wells located on adjacent propertiesdirectly to the west of the site. The locations of 14 monitor wellsinstalled during the 1981 RI are shown in Figure M-l. It should be notedthat all of these wells, except Wells 1 and 4, were abandoned in late1983 to early 1984 during the remedial cleanup work.
As indicated in Tables M-14 and M-19, only a limited number ofsemivolatile organic compounds, were detected in the shallow and bedrockwell samples from 1981. No volatile or pesticide/PCB compounds wereidentified. The compounds that were quantified were generally found inthe 10 to 25 ppb range. No substantial differences in organicconcentrations were observed between the shallow and bedrock wellsamples. The organic results showed that the site has a limited impacton groundwater downgradient of the lagoon.
M-28
AMD 1392

TABLE M-14
ORGANICS RESULTS FOR GROUNDWATER SAMPLES COLLECTED FROM SHALLOW WELLSDURING THE 1981 REMEDIAL INVESTIGATION
Concentration Range. .Organic Tested Number of Occurrences3 (ug/L)
Volatile Compounds
Semi-volatile Compounds
PentachlorophenolFluorantheneN-n i trosod i phenyl ami neBis (2-ethylhexyl) phthalatePhenanthrenePyrene
Pesticides/PCB's
0
111211
0
NDb
<10•<102116-211314
ND
3Based on three samples (wells 6, 8, and 10) collected on September2, 1981.
bND - None detected.
M"29 ARBOI393
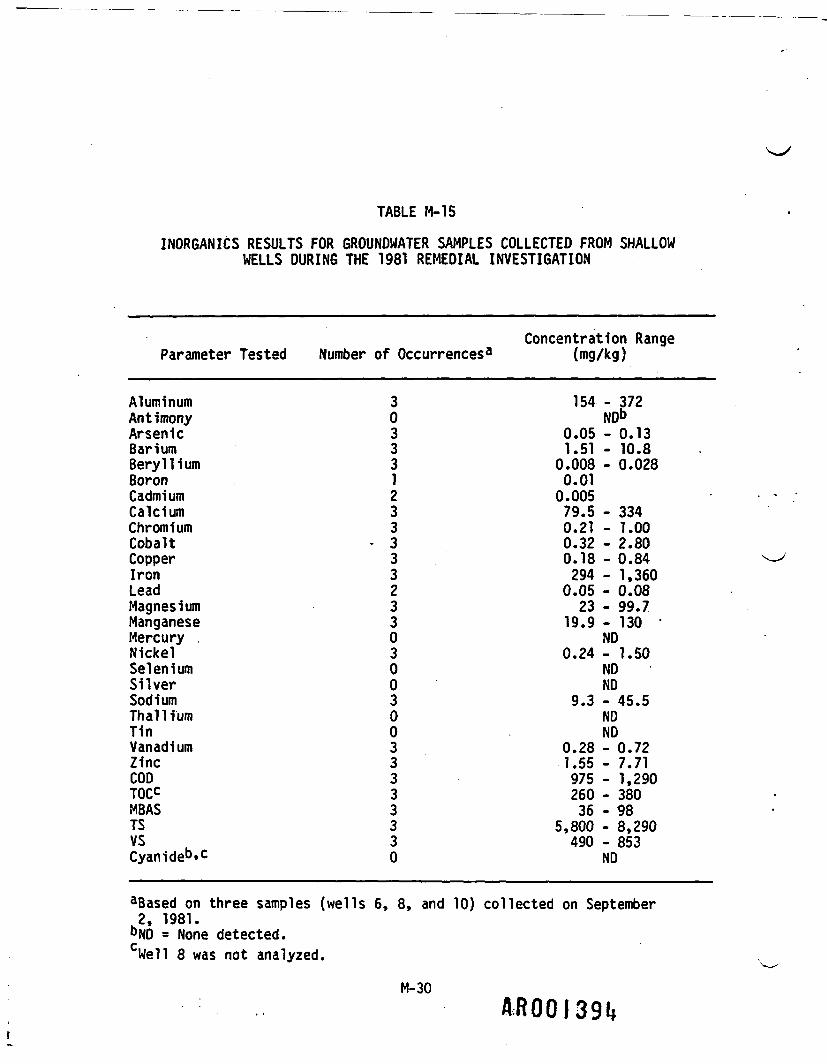
TABLE M-15
INORGANICS RESULTS FOR GROUNDWATER SAMPLES COLLECTED FROM SHALLOWWELLS DURING THE 1981 REMEDIAL INVESTIGATION
Concentration RangeParameter Tested Number of Occurrences3 (mg/kg)
Aluminum 3 154 - 372Antimony 0 NDDArsenic 3 0.05 - 0.13Barium 3 1.51 - 10.8Beryllium 3 0.008 - 0.028Boron 1 0.01Cadmium 2 0.005Calcium 3 79.5 - 334Chromium 3 0.21-1.00Cobalt - 3 0.32 - 2.80Copper 3 0.18 - 0.84Iron 3 294 - 1,360Lead 2 0.05 - 0.08Magnesium 3 23 - 99.7Manganese 3 19.9 - 130 'Mercury . 0 NDNickel 3 0.24 - 1.50Selenium 0 NDSilver 0 NDSodium 3 9.3 - 45.5Thallium 0 NDTin 0 NDVanadium 3 0.28 - 0.72Zinc 3 1.55 - 7.71COD 3 975 - 1,290TOCC 3 260 - 380MBAS 3 36-98TS 3 5,800 - 8,290VS 3 490 - 853Cyanideb»c 0 ND
3Based on three samples (wells 6, 8, and 10) collected on September2, 1981.
bND = None detected.cWell 8 was not analyzed.
M-30ARQOI391*

TABLE M-16
ORGANICS RESULTS FOR GROUNDWATER SAMPLES COLLECTED FROM BEDROCKWELLS DURING THE 1981 REMEDIAL INVESTIGATION
Concentration RangeOrganic Tested Number of Occurrences3 (ug/L)
Volatile Compounds 0 NDb
Semi-volatile Compounds
Phenol 2 <10Isophorone 3 17-43N-nitrosodlphenylamine 1 15Bis (2-ethylhexyl) phthalate 3 <10 - 32Diethyl phthalate .1 <10Dimethyl phthalate 1 11
3Based on three samples (wells 1, 2, 3, 5, 7, 9, 11, and 16) collectedon September^, 1981.
bND = None detected.
M"31 A ROD 1395

TABLE M-17
INORGANICS RESULTS FOR GROUNDWATER SAMPLES COLLECTED FROM BEDROCKWELLS DURING THE 1981 REMEDIAL INVESTIGATION
Concentration RangeParameter Tested Number of Occurrences3 (mg/kg)
Aluminum 8 26.2-393Antimony 0 NDbArsenic 7 0.01 - 0.30Barium 8 0.15 - 1.70Beryllium 7 0.004 - 0.018Boron 5 0.01 - 0.03Cadmium 6 0.005 - 0.02Calcium 8 28.9 - 182Chromium 8 0.05 - 0.33Cobalt 8 0.09 - 1.16Copper 8 0.02 - 0.48Iron 8 0.20 - 607Lead 4 0.05 - 0.24Magnesium 8 9.30 - 72.5Manganese 8 6.70 - 57.7 'Mercury 1 0.01Nickel 8 0.12 - 0.46Selenium 0 NDSilver 0 NDSodium . . 8 12.8 - 163Thallium 1 0.01Tin 1 0.50Vanadium 8 0.01 - 0.44Zinc 8 0.67 - 4.48COD 8 55 - 2,420TOC 8 18 - 620MBAS 8 2.3 - 110TS 8 1,600 - 12,600VS 8 207 - 7,360Cyanide 0 ND
3Based on three samples (wells 1, 2, 3, 5, 7, 9, 11, and 16) collectedon September 2, 1981.
bND * None detected.
M-32AROOI396

TABLE M-18
ORGANICS RESULTS FOR GROUNDWATER SAMPLES COLLECTED FROM RESIDENTIALWELLS DURING THE 1981 REMEDIAL INVESTIGATION
Organic Tested
Volatile Compounds
Semivolatile Compounds
PentachlorophenolN-nitrosod1phenylaminePhenanthrene
Pesticides/PCB's
Number of Occurrences3
0
121
0
Concentration Range(ug/L)
NDb
<10<10<10
ND
3Based on three samples (Moser, Reider, and Williams wells) collectedon August 31, 1981 and September 2, 1981.bND = None detected.
M-33AROOI397

TABLE M-19
INORGANICS RESULTS FOR GROUNDWATER SAMPLES COLLECTED FROM RESIDENTIALWELLS DURING THE 1981 REMEDIAL INVESTIGATION
Parameter Tested
AluminumAntimonyArsenicBariumBerylliumBoronCadmiumCalciumChromi urnCobaltCopperIronLeadMagnesiumManganeseMercuryNickelSeleniumSilverSodiumThalliumTinVanadiumZincCODCTOCMBASCTSCVSCCyanide
Number of Occurrences3
300300030203033010031003131220
Concentration Range(mg/kg)
0.05 - 0.20NDbND
0.08 - 0.15ND
0.01 - 0.05ND
21.4 - 43.1ND
0.01 - 0.11ND
0.40 - 6.90ND
6.70 - 7.20 .0.01 - 5.38
ND0.04
NDND
24.4 - 39.40.01
NDND
0.05 - 0.401518 - 26
0.1107 - 300103 - 107
ND
3Based on three samples (Moser, Reider, and Williams wells) collectedon August 31, 1981 and September 2, 1981.
bND * None detected.cWilliams well was not analyzed.
M-34AROOI398
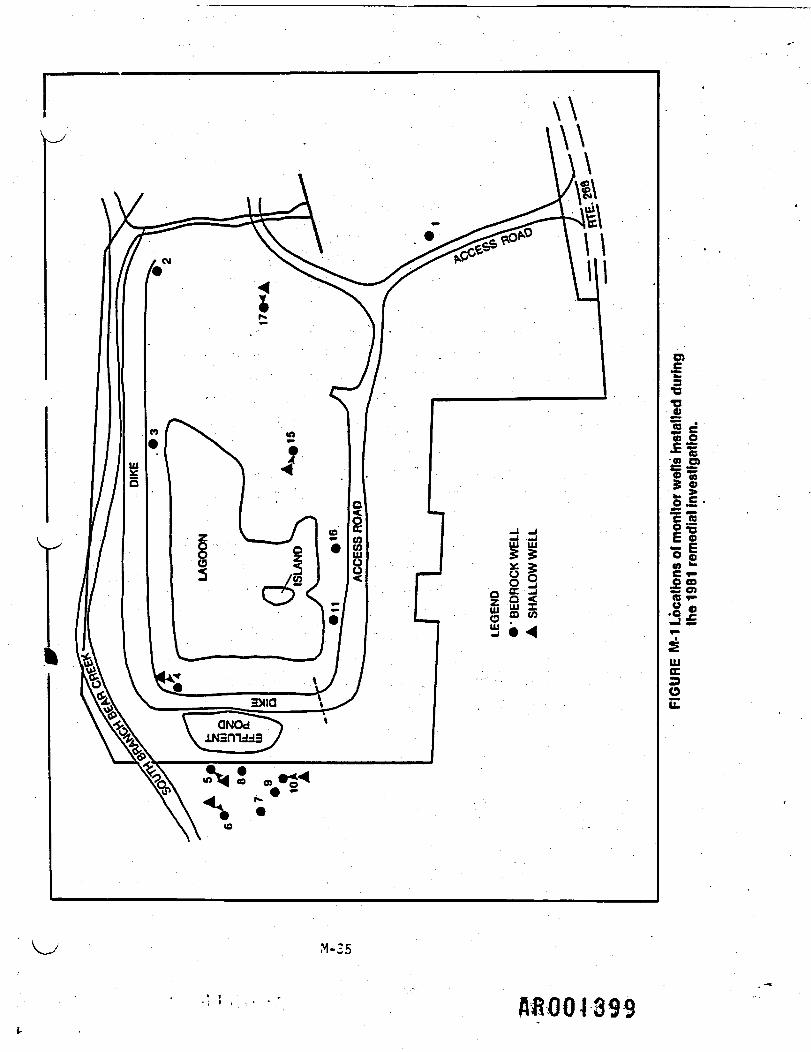
fi1S c40 O
•E'gJ2 .S>Q) Tij
co 55
<o »-
•IIIUCCsO
M-35
A8004-899

Samples collected from shallow wells during the present study were notanalyzed for organic compounds. The organics results for groundwatersamples collected from bedrock wells during September and October 1985,however, are consistent with the previous findings. These results showedthe presence of a limited number of semivolatile compounds in the 5 to 25ppb range. Additionally, a few volatile compounds were detected in thebedrock well samples. The results of the 1985 sampling confirm thatlimited organics contamination has occurred in the bedrock aquiferdowngradient of the site. The results also show negligible organicsconcentrations in bedrock wells at Bear Creek across from the site.
The inorganics results in Tables M-15 and M-17 show the presence ofnumerous compounds at the ppm level in both the shallow and bedrock wellsamples collected in 1981. The metals identified in every groundwatersample collected included aluminum, barium, calcium, chromium, cobalt,copper, iron, magnesium, manganese, nickel, sodium, vanadium, and zinc.Many of these same metals were found at elevated concentrations in thesludge and soil. The inorganics results showed that although contaminantlevels varied throughout the site, localized contamination existsdowngradient from the lagoon. It should be noted that the 1981 resultsalso showed existing elevated levels of soil constituent inorganics inthe background monitor wells.
M-36 ftRQOUQO
Primary drinking water standards for arsenic, barium, cadmium, chromium,lead, and mercury were exceeded within the 1981 groundwater samplescollected from wells immediately downgradient of the site. The highestlevels of inorganic comtamlnants were noted in Well 10, a shallow welllocated north of the lagoon. In general, the shallow groundwatercontained greater contaminant levels than,deeper groundwater flowingwithin the bedrock. Approximately one order of magnitude differenceexisted between the organic pollutants in the shallow and bedrockgroundwater. The 1981 results are supported by the inorganics dataobtained for bedrock aquifer samples collected as part of the presentremedial investigation. Samples collected from shallow wells during thefall of 1985 were not analyzed for metals. The same metals wereIdentified in the bedrock samples in the same concentration ranges asfound in 1981. The most recent inorganic results confirmed the existenceof localized contamination downgradient of the site, as well as thepresence of elevated levels of soil constituents in the backgroundmonitor wells. These results also showed that primary drinking waterstandards for several metals were also exceeded in the bedrock wells.
Water quality results for the three residential wells sampled during the1981 remedial investigation are summarized in Tables M-18 and M-19.These data revealed essentially no contamination of the deep aquifer Inadjacent drinking water wells due to the presence of Bruin Lagoon. Noneof the priority pollutant organic compounds was positively identified,and only naturally occurring background concentrations of inorganics weredetected. No sampling of adjacent resident water supplies was performedas part of the 1985 RI. -
M-37 AiooiitOi
A summary of inorganics results for liquid samples collected from shallowWells B-l through B-4 during the June 1984 investigation is presented inTable M-20. These results showed that the liquids above the bedrock inthe immediate vicinity of the open lagoon had an extremely low pH (lessthan 1.0), as well as high values for specific conductivity, sulfate, andTOC. Additionally, these liquids contained various metals at elevatedconcentrations. No organics analyses were performed for these samples.
The indicator parameter results for liquid samples collected from shallowwells during September and October 1985 show good agreement with theprevious findings. Samples collected from shallow wells in the vicinityof the four boring locations had pH, specific conductivity, and TOCvalues similar to those determined during the June 1984 work. Sulfateand metal analyses were not performed for liquid samples collected duringthe current RI.
M'38 AROQI

TABLE M-20
INORGANICS RESULTS FOR LIQUID SAMPLES COLLECTED DURINGJUNE 1984 INVESTIGATION
Parameter Tested
BerylliumCadmiumChromiumCopperLeadNickelSilverTinThalliumZincpH (standard units)Specific conductivityb»c (umhos/cm)SulfateTOCChlorideFluorideCyanide
Number ofSamples3
1111
3333333
Concentration Range(ug/L unless noted
otherwise)
0.31,300
422550
*
2251470.1
1 ,22024,0003,1602,480
13
NDb
ND
- 0.8- 6,800- 146,000- 11,500 •- 57,000- 17
ND
3Meta1s analyses were performed on a composite of samples collectedfrom wells B-l, B-2, and B-4. Analyses for the other parameters wereperformed on samples collected from wells B-l, B-2, and B-3. All sampleswere collected on June 9, 1984.
bND = None detected.cVa1ue at 100:1 dilution.
M-39

APPENDIX N
GEOTECHNICAL TESTING DATA
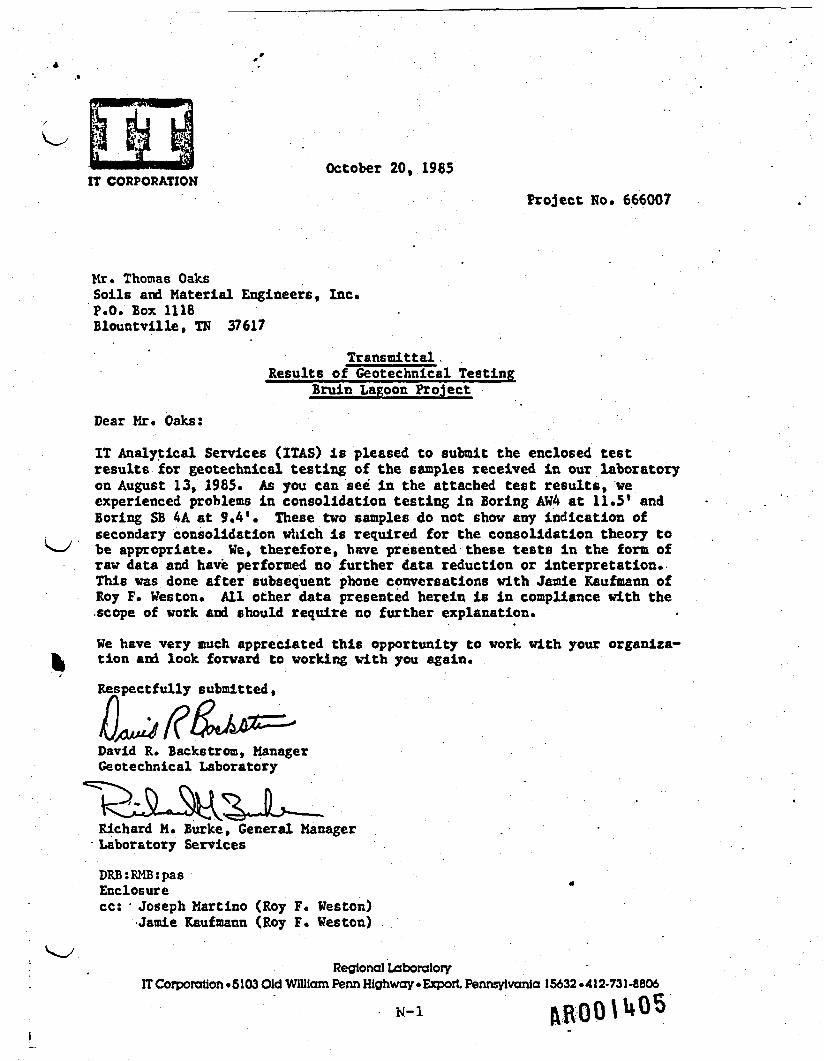
October 20, 1985IT CORPORATION
Project No. 666007
Mr* Thomas OaksSoils and Material Engineers, Inc*P.O. Box 1116Blountville, TN 37617
Transmittal.Results of Geotechnical Testing
Bruin Lagoon Project
Dear Mr. Oaks:
IT Analytical Services (ITAS) is pleased to submit the enclosed testresults for geotechnical testing of the samples received in our laboratoryon August 13, 1985* As you can see in the attached test results, weexperienced problems in consolidation testing in Boring AW4 at 11.5' andBoring SB AA at 9.4*. These two samples do not show any indication ofsecondary consolidation which is required for the consolidation theory tobe appropriate. We, therefore, have presented these tests in the form ofraw data and have performed no further data reduction or Interpretation.This was done after subsequent phone conversations with Jamie Kaufmann ofRoy F. West on. All other data presented herein is in compliance with the.scope of work and should require no further explanation.
We have very much appreciated this opportunity to work with your organiza-tion and look forward to working with you again.
Respectfully submitted,
David R. Backstrom, ManagerGeotechnical Laboratory
Richard M. Burke, General ManagerLaboratory Services
DRB:RMB:pasEnclosurecc: • Joseph Martino (Roy F. Weston)
Jamie Kaufmann (Roy F. Weston)
Regional LaboratoryIT Corporation • 5 1 03 Old William Penn Highway • Export Pennsylvania 1 5632 « 4 1 2-73 1 -8806
N-l
CONSOLIDATION TESTING DATA
IM) 6

SfiELBY TUBE LABORATORY RECORD
IECT NO. fe - QQ? ________ BORING NO. A u>-3NAME fgo.*» ^/>Ce»x» ______ SHELBY TU8E NO..^ _ ________
TESTED BY G*~ DATE «-/>.fl rf DEPTH PUSHED <-'° TOCALCULATED BY V«*> DATE *«aa-»»- GROUND SURFACE ELEVATIONCHECKED BY £**> DATE S-3**Y TUBE ELEVATION ________ TO
TUBE RECOVERY_______'
Z3 ',|«>
1 •':M
.6 .
OB
-1 -
S£?.e> «•
DEPTH(fr)
» •• ' - •* m
' t* % *
• •
*• <••* m* «• - •
•• . OBri• <•
— rrr —•7. fi
ELEV.
•
H 9
i 9
» I
> • «
1 •
f •
1 •
^ «ta
• ' •
• •
' «
41 «•
* •
SECTIONNO.
«»t•Nan
*•»^•• ' .
• Z• t
SOILPROFILE
*\x
SOIL DESCRIPTIONAND REMARKS
<4«»b tf1Lii\t&l, — 57-X€i<uy CU>«£.
TESTPERFORMED
4
•
* <
tac.1
-m
««
<
p#*l» ftWt*lT j** u.c y ;
u/c.
»
• .•
*
»
«i
•ft•
ui
u.UJ
I
NOTE'WHEN FULL RECOVERY IS NOT ACHIEVED,SOIL ELEVATION CAN NOT BEACCURATELY DEFINED 2
INDICATE EACH CUT OF THE TU.BE WITH AN ARROW ———•*• -INDICATE EACH SOIL CUT (AFTER EXTRUDING) BY A BROKEN LINE—————— VINDICATE DIVIDING LINE BETWEEN SOIL TYPES BY A SOLID LINE—————— ^INDICATE WAX BY CROSS-HATCKINGSi±±i=y 5- V<- V
_______INDICATE SOIL TYPES BY STANDARD SYMBOLS . 5 y./CsSECTION NUMBERTARE NUMBERWt. TARE + WS, «mWt. TARE + OS. «mWt. WATER, gmWt. TARE, «mWt. OS, CmWHTER CONTENT.%
l«3 .5 R
99
CO
-UJ.o
<CC
12
S4
5
6T
e9
Wt. TARE 4- WS, flmWf. TARE, «mWt. WS, «mCIRCUMFERENCE, emLENGTH. InLENGTH, emAREA. emsUNIT WET WlnCm/emSi62.4UNrrncT wt.. pcfWATER CONTENTCONSTANT 1UNIT DRY Wt., KrfUNIT DRY Wt jm/emSG(ASSUMCD/M£ASURCO;CONSTANT 1VOID RATIODEC. SATURATION. »/n
79T.V1S'n.lL,ffi.i/?»t?-32.'/'0?.lfc'11.11
•*
^
W.«l7.7.C_• ,.
f,?. «?
• -
...
N-V
»
-
s•
^«
t1»
11,Ii!1
•

SHELBY TUBE LABORATORY RECORD^ ^ • • M ^ M M H HBM B M B M B ^ ^ ^ ^ MM M HHH ^ HtfK 4 -
'PROJECT NO. 1.16. QO*? ________ BORING NO.PROJECT NAME 6£o«*J X/l^oo^ _____ SHELBY TUBE NO..TESTED BY ggA* DATE a-/7.fliT DEPTH PUSHEDCALCULATED BY *»> DATE >'2girr GROUND SURFACE ELEVATIONCHECKED BY £«* DATE t-3"** TUBE ELEVATION _ _______ TO
TUBE RECOVERY _____________1oz3 ~
$ :^7* *<t :UJ
Fl
DEPTH(FY7
» »» *t •
'• /o.-u •» «t •
^ ^» *
1 *1 *
M ^i •
P> •
t I 1 ij^ *
l •
' if. 9 "• •
ELEV.
m •> *» •> <•
P •
> *» •
•» mmt *!
1 •
1 *
•> ^
> *
1 •
• •
» •
•> •
» •
• •
SECTIONNO.
$»•»M
»
•
B»
»
•
»
»
: i• i
SOILPRORLE
SrSrx'^
vy\x \
SOIL DESCRIPTIONAND REMARKS
ss sr JT=ST
*»" ,
TESTPERFORMED
• C
-.
•
Vwe.
o:UJ
NOTE-WHEN FULL RECOVERY IS NOT ACHIEVED, SOIL ELEVATION CM NOT BEACCURATELY DEFINED . *
INDICATE EACH CUT OF THE TUBE WITH AN ARROW ———•"• jINDICATE EACH SOIL CUT (AFTER EXTRUDING) BY A BROKEN LINE-————— *'INDICATE DIVIDING LINE BETWEEN SOIL TYPES BY A SOLID LINE 2-'INDICATE WAX BY CROSS-HATCHINGESSS 2.'INDICATE SOIL TYPES BY STANDARD SYMBOLS ____________________ 7.iSECTION NUMBER
TARE NUMBERWt. TARE + WS, gmWt. TARE + DS, gmWt. WATER, QfNWt. TARE. V"Wt. OS. omWATER CONTENT, %
't+1171,93/«/7.y>3£is/02.</C»vr<?>rt.J
2 1 y r c.• •
7 -£—£3ir/.iv/«/7tf.oi9ft.3i«/l.iff;*/,£
-"~~
fc
toUJo
12
34
5
67
39
Wt. TARE 4. WS. «mWt. TARE, gmWt. WS, «mCIRCUMFERENCE, emLENGTH. InLENGTH. emAREA. em'UWTWET Wl^gm/em362.4UNIT U€T Wt.. pefWATER CONTENTCONSTANT 1UNIT DRY Wt., pefUNIT DRY Wt., fm/cmfSG (ASSUMCOAKASUREOCONSTANT 1VOID RATIOOEG. SATUPATIOM •/.
CV7.-JV189. ?l?r?.n3tt5.1l3,<fTIfr/WHJ.ISi.ari• — ••7T.rO7(f,>^b«*
tI-4
-
1
1
,,.„ aC•*
mm
G.
— a^~

StiELBY TUBE LABORATORY RECORD
PROJEC
TESTEDCALCUbCHECKE
g :3 :OL C? A_2g :1 '
•
CC
§ "
T NO (*ULoo*l ' P/WS "« &?&.< R -4 AT NAME rt* L^ccr,*, SMPLBYTIIRF MOBC £W, ' DATE _fi-JKtr£r DEPTH ttieum , , ft.<=> Tn /«,«ED BY / /><, , DATE i?'.l*'*f' GBOUNO SURFACE ELEVATIOND BY C*— DATE -l-'tlr' TUBE ELEVATION ' TD
TUBE RECOVERYDEPTH(PTJ
» :>*. t
•
•>•> •
•• 9
* ' 9
•• mmi 9
mm mm• • M
• *
ELEV.
•
V •
f 9
> •
1 ' •
• . 9
mm ' +mtm m
• 9
* •
t •
mm mm» 9
m 9
• •
mm mm• •• •
SECTIONNO.
, —— K v
•
•
mmm•
*K
•1
•
»
US
•
•
•v
• ;
SOILPRORLE
.. __ ..
t\3<X
SOIL DESCRIPTIONAND REMARKS
jSt'tllb' fnJC. X «**' ****/'*•fl»Ot»fe^ |vrk*fT e.e'1'- AATvCIi)
TESTPERFORMED
•
v
**•» *—
• " -«««•««•
4M4
™ •
__ ' t'l/ff}*'m J ^*
t«rf"* * *' *
***-
*
*
•
mm
*mm-*
mm»M
NOTE* WHEN FULL RECOVERY IS NOT ACHIEVED,SOIL ELEVATION CAN NOT BEACCURATELY DEFINED
INDICATE EACH CUT OF THE TUBE WITH AN ARROW ••\. J INDICATE EACH SOIL CUT (AFTER EXTRUDING) BY A BROKEN LINE^-^ INDICATE DIVIDING LINE BETWEEN SOIL TYPES BY A SOLID LINE
' • INDICATE WAX BY CROSS-HATCHINGBS^H• INDICATE SOIL TYPES BY STANDARD SYMBOLS
UJ
JSECTION NUMBERTARE NUMBERWt. TARE + WS, cmWf. TARE + OS, «mWt. WATER, «mWt. TARE. V"Wt. PS._____jjm
j| WffTER CONTENT.%
YT
zUJO
<(C
12
S4
5
e7
e9
Wt. TARE 4- WS, «mWt. TARE, «mWl. WS, flmCIRCUMFERENCE. CmLENGTH. InLENGTH. emAREA. cm'UNIT WET Wl,flm/cm3€2.4UNIT WET Wt^ pcfWATER CONTENTCONSTANT 1UNIT DRY Wt., pefUN IT DRY Wt.,sm/cm«SG (ASSUMCD/UCASURECCONSTANT 1VOID RATIOOEG. SATURATION. %
*
il
1r
_ [
t.
"
N-5
* •
-
!

SMELBY TUBE LABORATORY RECORD
1
PROJECPROJECTESTEDCALCULCHECKE
o * •z
< JUJ-11 123-*~
§ :
T wn £tc. oo_> nnoiu wfi ^ - £- .T NAME Gt»l*> ,-i46o«»»« SHELBY TIBF Nft ' ^W Ca- DATE S-f9-sr DEPTH aisurn 3.» , Tn «,i.rATED BY_/-(*3. DATE _£;»«* GROUND SURFACE ELEVATIOND BY C.*A DATE >3— *r TUBE ELEVATION TO
TUBE RECOVERY. .„,„.„.
DEPTH
• *• • *
• xi. r •• •
» - *» *f».r -——
i »mm mm> •» •i m
P| M
1-22,3-:f
ELEV.
p *• *» •
i •
i •k •mm mm
t •• •t •^ ^p»» *
p> *
» •• *•
» <P
SECTIONNO.
p>
»mm
P>••mmp>»••
: z. ^- ————— a»
1
SOILPROFILE
mSOIL DESCRIPTIONAND REMARKS
/^4iSl(5L& p|«.U
fi<4/J"7 0ytdt*'*' S4rJ***f
'. i
i • • " '• *
TESTPERFORMEI
JI/«.
T "" c*-l°u*«.
NOTE'WHEN FULL RECOVERY IS NOT ACHIEVED,SOIL ELEVATION CAN NOT BCACCURATELY DEFINED
INDICATE EACH CUT OF THE TUBE WITH AN ARROW——mm*INDICATE EACH SOIL CUT (AFTER EXTRUDING) BY A BROKEN LINE————INDICATE DIVIDING LINE BETWEEN SOIL TYPES BY A SOLID LINEINDICATE WAX BY CROSS-oHATCHINGt^S^SINDICATE SOIL TYPES BY STANDARD SYMBOLS
ZUI
a:uiI
K
§
12
Z4
5
67
99
SECTION NUMBERTARE NUMBERWt. TARE + WS, omWt. TARE * OS, gmWt. WATER. gmWt. TARE. 0*Wt. OS. am'WATER CONTENTS
Wt. TARE + WS, amWt. TARE. gmWt. WS, «mCIRCUMFERENCE. emLENGTH. inLENGTH, cm-AREA. cm'UNIT WET Wt,gm/cm362.4UNIT VCT Wt., pefWATER CONTENTCONSTANT 1UNIT DRY Wt., petUNIT DRY Wt., jiw/epw=SG CASSUMCD/MCASUREqCONSTANT 1VOID RATIOOEG. SATURATION^ %
,1™vor/?7.?1/v*j5ii.it9v, af/.fcoiv«r
i
i_*hH2/2.3 S/favaJAffe•?3,r»ffrV«V3S.5?
79%7t3o9. 790,39
3>,V.«T%./2.7T.97/«/A«5/.751—
,6?. 3V3C?•—lf.?5i.Wi
,7 Y
N-6
A*"
t
L.2C7031.7?34V.3-?7.ATlot.rtf<??.*<?.o
*
. .
i*
•v

SHELBY TUBE LABORATORY RECORD
^OJECPROJECTESTEDCALCULCHECKE
AMPLING
V)..>....
(/)
1 1UJ ^
_J
T NO. ———— MxC* Od^ BftBIWft Wft AJUJ-7T NAME &(L<H*> t,>0^oaw SWFI RY T1WF Wft *>Pf ' €?&* DATE BS_JU*ik«. DEPTH wicurn ?r<P T^ </. oATED BY, **** DATE . 'T-f r GROUND SURFACE ELEVATIOND BY <Ti»* DATE . r -SV TUBE ELEVATION TO
f TUBE RECOVERY /.£*DEPTH
• •• •* 9
P» •!
mm mm• •• . 41
• 41
mm mm
" y* *<•«* M> •
• 5 «i *J. o
ELEV.
•• •Pt 9
m 9
mt mm• 9
» •mm ••f •K •
• ' -mmm mm• «• •* «
* - •• •
SECTIONNO.
••t•*
#4 V*mm-»t»
m*•
• «P*
* * - i *
SOILPROFILE
*~.' — -
)/ \S\s \\X\X\ S
SOIL DESCRIPTIONAND REMARKS
••£TV i7/*S-'V
TESTPERFORMED
m
9
4
«P
«
•k t«4
• ~*
4
1
•
1
tM w .. «•4i/* Cft* *
I'W M * . *
•
p»
»
9
mmm
PPP»
PP>•
•
•P«P>
•
•
i*«
*
*
NOTE'WHEN FULL RECOVERY IS NOT ACHIEVED .SOIL ELEVATION CAN NOT BEACCURATELY DEFINED
INDICATE EACH CUT OF THE TUBE WITH AN ARROW ••INDICATE EACH SOIL CUT (AFTER EXTRUDING) BY A BROKEN LINE—-INDICATE DIVIDING LINE BETWEEN SOIL TYPES BY A SOLID LINE——INDICATE WAX BY CROSS—HATCHING!! I I I 1 MINDICATE SOIL TYPES BY STANDARD SYMBOLS
UJ
aUJ
I
SECTION NUMBERTARE NUMBERWt. TARE 4- WS, cmWt. TARE + DS, «mWt. WATER. flmWt. TARE. V"Wt. DS. cm.WATER CONTENT.%
' 1till2«3.9?MIOO/I/-919r.re<?/.</;»/r.(.
i iA
20V-Y7/•79/v^~-fO. I•—
ar. U
tr
:
•
S" f. •y S,?77i ff.; iU3.VA/4.5L5.l«7.29v^ri1 2-
I<1C
12
34
5
67
e9
Wt. TARE 4- WS, «mWt. TARE, fimWt. WS, «mCIRCUMFERENCE, cmLENGTH. InLENGTH, cmAREA. cm*UNIT WET Wt,em/em362.4UNIT WET Wt.. pcfWATER CONTENTCONSTANT 1UNIT DRY Wt., pefUNIT DRY Wt..cm/cmSG (ASSUMCD/MCASURECCONSTANT 1VOID RATIOnrr ««TiiPATtnu «/.
~
;
t
;
i N-7
. . -
_•— -.£*•
0
F*~*

SPECIFIC GRAVITY DETERMINATIONPROJECT R/2VtrJ 6/)<£».3<w/ . TESTED BY **#S OATP 9- */-PROJECT Na & K* °°7_________ CALCULATEDBORING MO * V/- 3__________ CHECKED av *fr~ nATF V-OEPTH_____2^SOIL DESCRIPTION-
50O -CD—
* *
•tr
DETERMINATION NO.
BOTTLE NO.Wt. BOTTLE + WATER
•»• SOIL, W,, gm.TEMPERATURE, T, tWt. BOTTLE + WATER, W2lgm.
EVAPORATING DISH NO.Wt. DISH 4- DRY SOIL,gm.Wt. DISH.gm.
Wt. SOIL, Ws, gm.
Ws-W,-fW2 , gm.SPECIFIC GRAVITY OFSOIL AT T. GsCONVERSION FACTOR,FOR TEMPERATURE T, KSPECIFIC GRAVITY OFSOIL AT 20»CtG
1
239
-;?*./ f7 •:, c
iTCVl'-'^ ?r .-«v,s-r
3D.4.C*
,l..97/i
.9 7
c7.3C.7'
2
?<
C,?7e/3^ ..
C.7/../6/
^/7
Cd,3.2.rVfSTW
7.CV
//,r7
.38*0
.?9/y-P.3T7
3
.
t
4
-
ro-. REMARKS:
c5
KG. N"S G"

SPECIFIC GRAVITY DETERMINATIONPROJECT £W" Lab&W _______ TESTED RY ^^ OATF 9- J VPROJECT NO. Ofefraa'? __________ CALCULATED • ?**<> H&TF r - J. g*-BORING NO._Ji£±£ _____________ CHECKED BY«2£.--__ DATE
SOIL DESCRIPTION,
DETERMINATION NO.
BOTTLE NO.Wt. BOTTLE + WATER+ SOIL, W,, gm.
TEMPERATURE. T, tWt. BOTTLE + WATER, W2,gm.
EVAPORATING DISH NO.A. DISH +• DRY SOIL,gm.
Wt. DISH.gm.
Wt. SOIL, Ws, gm.
%s~W,+W2 ,gm.SPECIFIC GRAVITY OFSOIL AT T, GsCONVERSION FACTOR,FOR TEMPERATURE T, KSPECIFIC GRAVITY OFSOIL AT 20°C,G
1
JZ?
£S?>?0
pr.r-•bTSWI
£"S'S'/.V*-
Tf<f-1/^
l(*.l<<nAr\>W!>.9W/.5 'l
2
?£-*
&?.?.. <* \
?$*>
•Mf.-iWCS&
41*2. i0Z~
VC ./3
MM •21.9ll
/<Z10Q
. -n ft/.$M
z
•
4
1
: •
i
REMARKS:
AROOI It 13

SPECIFIC GRAVITY DETERMINATIONPROJECT <? \J'fJ 6*6 a aW_____ TESTED BYPROJECT NO. ••** "•»*"?___________ CALCULATED BY-ILi>ii__DATE ?' •*'BORING un 4V/'t»_____________ CHECKED RV flg OATP f'J'f-6DEPTH_______23,o f ______SOIL DESCRIPTION ————————'.———————J^. /j> C£——————————————————
DETERMINATION NO.
BOTTLE NO.Wt. BOTTLE * WATER+ SOIL, W,, gm.
TEMPERATURE, T% tWt. BOTTLE + WATER, W2,gm.
EVAPORATING DISH NO.Wt. DISH+ DRY SOIL,gm.
Wt. DISH.gm.
Wt. SOIL, Ws, gm.
WS-W,+W2 ,gm.SPECIFIC GRAVITY OFSOIL ATT, GsCONVERSION FACTOR,FOR TEMPERATURE T, KSPECIFIC GRAVITY OFSOIL AT 20°C,G
1
' IS*
-/ -•:•*")P.<7 /
L'i/Jf*./x/Sf.o*
<?o.b>°•kWQ
IS. £2*
y.rtte,¥&-P.fc'/7
2
-?S"I?
7// U
7,f470.93
*T«
• is&tr'10. Z)
fc V. :?'/
Wtly.bCiz.'•••//-•/ ;. • " /* » » -^'
3
•
4
-
. '
W
-•
REMARKS:
wsWS-W,*W2

«ttu»u«»no«
SPECIFIC GRAVITY DETERMINATIONLAG&W_____ TESTED BY_Jiii!2___DATE.
PROJECT NO. f-L-(*Of)_________ CALCULATED IMO yJV>'-~)________________ CHECKED BY... " H&TP
SOIL DESCRIPTION,
DETERMINATION NO.
BOTTLE NO.Wt. BOTTLE •»• WATER+ SOIL, W|, gm.
TEMPERATURE, T, tWt. BOTTLE + WATER, W2,gm.
EVAPORATING DISH NO.>Wt. DISH 4- DRY SOIL,j flm.Wt. DlSH,gm.
Wt. SOIL, Ws, gm.
lws-W,+W2 ,gm.SPECIFIC GRAVITY OFSOIL AT T, GsCONVERSION FACTOR,FOR TEMPERATURE T, KSPECIFIC GRAVITY OFSOIL AT 20°C,G
1
<23<?
W7./-?-.**x'47£>/7£-7S/ T3
'/ 'V.'/ 1
2<,.<?<*
tZ.21P.40-2-
.-Wr-#•400
2
?rC,97.7/PJ:?VM2?7
-r-'-/o5"Ct.S«
r2^-/>-//V7
:2.o.0t,?. /£"</
. ?7f/^.3/3
3 '
•
4
'••
REMARKS:
WS-W,4-W2N-ll

•CONSOLIDATION TEST DATA
DPOJPCT tfV.fJ LAlaD& ______________ TESTED 3Y MAS DATE 9~<> 2_________________ CALC. BY /4/t» 'DATg /0-IO
BORING NO. <~ _____________________ __ CHECKED BY *?•*• PATEDEPTH _____ L£ _____ : _________
%
WC
SAMPLE DATASAMPLE DIAMETERCONSOLIDATION RING NOWT WET
1 3 . S"C> 1 N.' •»* 1-
SAMPLE > CONSOL. RING /<T£. «ff GM,WT CONSOL. RING'WT. WETWT DRYINITIAL
SAMPLESAMPLE •
_ 2. A> GM.V.2 GM.•71. / GM.
HEIGHT «,e) lfc FINAL HEIGHT* . SL'N.
O* f * 'rf y fa 9
£/ ~t * **
BEFORE TESTTARE NUMBERWT. TARE t WS, gm,WT. TARE + DS, gm.WT WATER, gm.WT. TARE, gm.WT DS, gmWC %
V5"7/{/•j.S'O///. 57
-y / o
«x
•50. G
/.f2.N^/y/. *?z-^ «>a e>/.7«1
d.?7oil*c».T-7<;O L- f7<WC AFTER TEST
TARE NUMBERWT. TARE + WS, gm.WT.TARE +03, gm.WT. WATER, gm.WT.TARE, gm.WT OS, gm.WC %
323-2O2.*faf-7 7.5*0.-— '•
/06. 0'*-• -~~bl-t
H'12

F* *
c c.
•" -—
?•>
-*— *i,
CONSOLIDATION TEST DATA (CON'T. )
l<iCM£
ON
1
v\HI
&
e•rLM
1O>5S1<*«!C
ii
a»r\
1
?
6uS
i>0osSovsf
II
iVv
UJii
Izic5
%
><»>•
Qt$<*\r. 2
i!i
'
»
»i .
ic
11 _!tit
' . • ' * " " ' • ; • ' •
i
•
isc
*»
nT
.
ikl
S
*en
•
fj
f.
W
w
to«\
nCOM
O0e
0
o
o
to
tN
ifen
0o
:*NMO
so
ftCO
O0
*nO
0o
'iKN
0«ir4g
.?
r>O
8'o
to
S!2
l
«T
i
O
KO
oinO
0'Ov.
enn
JJb"eii
•iOO
8
rl
0(X.
(«'_
8M
L,0
0£
£8M
8*
^
^ &*2 Ci
' N
, .
vt '. :: i : ; : :g .........o CiJ1"""i •o C 0 (S ^ r^ iCC
o ........
~
'I*x* "
i* " "*
j
fc.*'|
^
(:• t •
" -• *
•
i .
o <:
e
0 ,
u: S
S•ki2P
o .
-
*^
! |cn- is• s*z
kiHS

CONSOLIDATION TEST DATA (CON'T.)
K«i
iA
t$iV.V
3-*1.ca
f\*
I1<S*
&0_2
r>05sSV
£
&:cLQ
S
UI§£^1t5
v
v
gs*?!!>v — i
:1
•
»pi
JA
1%xX
*as:VU1 h-
• r
3|23
a*
UI
»E
is
1 COMPRESSION (ML. 1
|
CMV. 1
i
ELAPSED TIME, t,
min.
'HIi
S-
N
a
8CJ
3
O
0
•\r\
t
t)l
•
J
»
oqin
rn
NN6
6
<?
O-
CO
Oq
v.
md
0o
r
K
8g
V
ind
0o
£3o
8§
>•v
.§
„o
VMv
o»*2
4
x.
g
4O-N.
rt
*
3
8M
t
O
of •
\\rr*IC"
x.V
cvi
s
Ss"""^
.
2 ::S«> ! . . I
| « Sa •---
(
[•j(*)| i
p« £
- f
(!)r
*
^
.
* S
' ' 1
•
V ^
o
0•• • • 9 tf... H
::: a_ . .. U,a- ... H .'
O
0. ,
C:::§ v
^
^
•
b::: ' }:::: w
N-14