Appendix D - Economics
56
APPENDIX D ECONOMICS
Transcript of Appendix D - Economics
APPENDIX D
ECONOMICS

•
APPENDIX D
ECONOMIC ANALYSIS
GENERAL METHODOLOGY
Purpose and Scope
The principal purpose of this economic analysis was to identify the extent of the flood problem and comparably evaluate solutions to reduce flood losses. As part of these activities, a field survey was conducted to identify the numbers and types of property, and the value of the investment affected by flooding. Calculations were done to develop estimates of the damages and benefits assignable to the various flood protection plans investigated. This analysis was conducted following procedures and guidelines as set forth in the Water Resources Council's Principles and Guidelines (July 1983) and current implementing regulations.
Due to its complexity, the plan formulation for this reevaluation occurs in 1hree stages -1991-1993, 1993-1996, and 1996-1997. The results of the first two stages are summarized with the final array presented in detail. Annual benefits were determined by subtracting residual flood losses from the without project losses. Significant future changes in hydrology and increased urbanization in the flood plain areas are anticipated in this study, however equivalent average annual damages were assessed for with and without project conditions only in the final stage (1996-1997) of the analysis .
The prevailing price, level of development and the Federal interest rate were documented ,and applied accordingly. Final estimates of the total array of the plans flood damages and benefits presented herein reflect January 1997 prices and level of development, and a Federal interest rate of 7.375 percent.. The Recommended and the Locally Preferred plans were uJXlated to reflect the Fiscal Year 1998 interest rate of 7 .125 percent. This rate was also applied to convert first costs and undiscounted future damages and benefits to average annual equivalent values.
Flood Profiles and Delineations.
A full range of water surface profiles, based on existing stream conditions, was developed for this study. These profiles were used to delineate the flood plain limits and determine the relationship of damageable properties to both elevation and frequency of flood occurrence. The satisfactory development of the hydraulic model in each reach was a multistage iterative process, with the reasonableness of the resulting economic effects being used to help in refining the hydraulic models used.
Probabilities of Flood Events
USAGE policy (as per ER 1105-2-101) states, "The estimate of NED benefits and costs will be reported as single expected value and on a probabilistic basis for each planning alternative." This requires the classical nomenclature describing the relative risk of given flood events to be changed to reflect the actual probability, rather than the average recurrence interval, of flood events.
Dallas Floodway Extension Reevaluation Report - Page D - 1

For example, the commonly used term · "1 OO•year frequency flood", meaning that flood which stands a one percent chance of being equaled or exceeded in any given year period will hereafter be described as the "1 percent annual chance exceedance (ACE) flood". For convenience, the new probabilistic nomenclature will be abbreviated as n1 percent ACE flood".
The classical terminology and the equivalent current terminology for this report is shown below
Classic Terminology
1•Year Flood 2-Year Flood 5. Year Flood
1 Q. Year Flood 25•Year Flood SO-Year Flood
100-Year Flood 500-Year Flood BOO-Year Flood
Damage Categories.
Current Terminology
<100 Percent Annual Chance Exceedance Flood 50 Percent Annual Chance Exceedance Flood 20 Percent Annual Chance Exceedance Flood 1 O Percent Annual Chance Exceedance Flood 4 Percent Annual Chance Exceedance Flood 2 Percent Annual Chance Exceedance Flood 1 Percent Annual Chance Exceedance Flood
.2 Percent Annual Chance Exceedance Flood .125 Percent Annual Chance-Exceedance Flood
Damageable property and costs associated with flooding are divided among five .damage categories. Flood damages are calculated in terms of structure and content damage and loss, damage to infrastructures_, costs to the public in subsidizing flood insurance, and the cost to combat floods and provide emergency management. These categories are detailed in table 0-1.
Data Collection.
In May 1991, an inventory was made of the floodplain lands along the subject streams to identify existing flood plain development. Due to the large size of the floodplain, residential structure data for this inventory was collected in aggregates of city blocks. It included enumeration of the numbers and types of structures within the SPF limit. Existing damageable properties were dassifred into the major damage categories. This inventory was field-checked and extensively supplemented in June 1992. Surveys were also taken of individual homes within a sample residential city block. Statistical relationships between the sample residential data and the _ original aggregated data for the same blocks were used to calibrate the aggregated residential data set as a whole. Individual surveys of all nonresidential properties were taken.
A determination was made of the value of flood plain investment (structures and contents) for each major damage category, based on data provided by the Dallas County Tax Appraisal District. These data, which were reviewed by Real Estate Division personnel in Fort Worth District, represent the depreciated replacement value of each structure, net of the value of associated lands. The value of existing residential contents was assumed to be 50 percent of the structure value. The values of contents for the other damage categories were based on direct field observation and interviews with property owners, and the relationships between structure value and content value observed in previous studies of similar areas.
Dallas Floodway Extension Reevaluation Report - Page D - 2

Table D-1 Major Damage Categories
Damage Category Activity Description
Residential Single and multifamily dwellings
Commercial & Industrial Retail and wholesale businesses
Public Public and quasi-public buildings
Flood Insurance Admin. Costs to the public of flood insurance program administration
Other:
Transportation Streets, highways, and bridges
Communications Electrical, gas, telephone, sewerage, and water supply & Utilities facilities and buildings
Public Health and Flood-fighting and related emergency.management activities Relief
Flood Damage Programs
The STOMA program, written in the Memphis District in 1977, was originally developed in to avoid certain analytical simplifications common to flood_ damage computer models of the time. Namely, that within a given reach all properties are at the same stream station and all flowlines are parallel. The program also improved the manipulation of multiple sets of hydraulics data. Since the start of its use in Fort Worth District, the program and its input data sets have been modified to incorporate ongoing field survey findings concerning depth-damage relationships for various kinds of property. More recently, the program has been expanded to provide automatic computation of expected annual benefits for flood proofing every structure to one, two and three feet above the finished floor, and other enhancements.
The STOMA program was used in this analysis to facilitate data tabulation, aggregation and segregation by reach and flood zone. Single-event damage estimates were extracted and entered in the HEC-FDA program to derive depth-damage curves. Average annual da_mage estimates per structure were used to evaluate nonstructural alternatives.
The NexGen Hydrologic Engineering Center-Flood Damage Assessment Program (HECFDA) was developed to facilitate the· plan formulation and evaluation of flood damage consistent with federal and Corps of Engineer (COE) policy regulations (ER 1105-2-100 and ER 1105-2-101). The program integrates hydrologic engineering and economic analysis through application of the Monte Calio simulation, a technique that computes expected value of damage while accounting for uncertainty in the basic value. This program was used to calculate stagedamage-uncertainty information at damage reach index locations and to compute equivalent annual damage.
Dallas Floodway Extension Reevaluation Report - Page D - 3

Depth-Damage Relationships
The original depth-damage cuive file was adapted, at ·the time STOMA was created, from the one used by the older 761-F5-M3020 flood damage computer program and was based on data from the U.S. Flood Insurance Administration. Current files were supplemented and modified based on the findings of numerous subsequent economic field surveys of flood plain properties in Fort Worth District, considering such factors as the design of the structure and nature of the structure contents. The depth-damage relationships deterrriine damages after a comparison of flood elevation with the elevation of the finished floor of each structure.· A finished floor- the lowest occupied floor of a building - is generally higher than the local ground elevation by an amount that varies with the structure (typically 0.5 to 1.5 feet above the ground ,for most detached residences and commercial establishments and 3 feet for mobile homes). For a vehicle, "finished floor" refers to the bottom of the engine block and the floorboard of the passenger compartment, and is assumed to be one foot above the ground.
Residential Vehicles
Fonnidable pradical difficulties are directly related to field-surveying the number and value of residential vehicles in a flood plain at the various times that a flood might occur. Damages for residential automobiles were therefore estimated considering the average number of vehicles per residence characteristic of the study area, and their probability of being present at the time of a flood. An analysis was conducted of registered motor vehicles per occupied housing unit for counties within Metropolitan Statistical Areas in Texas (MSA), using data from the U.S. Census and the Texas State Department of Highways and Public Transportation. The number of registered vehicles per occupied housing unit in MSA counties clusters closely around a mean value of 2.48. However, not all registered motor vehicles are associated with private homes, and not all housing units are occupied. For simplicity, it was assumed that an average of 2.0 vehicles per gross residence exists, about 1.5 of which would be present during non-work hours (128 hours per week) and about 0.5 would be present during work hours (4_0 h_ours per week). The e).(pected number of vehicles present at any given time that a flood might occur would therefore be
((128/168)*1.5)+((40/168)*0.5)
or 1.26 expected vehicles per residence. The exact number would vary depending on_ the assumptions made, but for further simplicity, and conservatism, it was assumed that one expected vehicle exists per residence, which would be present at the time of a flood . This vehicle was assumed to be at the same location as the structure with which it is associated, with the same stream station and ground elevation values. (As noted above, damages start when flooding reaches one foot above the ground elevation.)
It should be noted that this calculation of the expected number of vehicles thatwould be present in the flood plain at the time of a flood has nothing to do with the waming time flood plain residents would have. A flood affects only those vehicles present at the time of a flood, While a vehicle is usually the single-most valuable item of personal property, and by definition the most mobile, the overwhelming majority of urban floodplain users experience flooding with little or no warning time. This is either because of a steep flood hydrograph, a lack of a warning system, or both, and substantial vehicl.e damages are typically observed. In any case, the effects of increased flood warning time would take the expected number of flood plain vehicles as its baseline.
A strong positive correlation would be expected between the value of a residential structure and the value of the vehicles associated with it, based on general field observation. The relationship is not simply proportional, since an extremely low-value structure can have a vehicle worth as much as the structure itself, while the most affluent residence would have
Dallas Floodway Extension Reevaluation Report • Page D ~ 4

•
vehicle worth not much more than a tenth of the value of the structure. Plausible average vehicle values result by assuming the following relationship for detached single-family residences:
V = (0.1*S)+1000
where V is the vehicle value and S is the value of the residential structure. The typical residence, with a structure value between $40,000 and $60,000, would have a vehicle worth $5,000 to $7,000. This Is in good agreement both with field observation, the observed average age of the private vehicle stock (on the order of five years), the corresponding depreciation (about 50 percent), and the average vehicle cost when new (on the order of $10,000 to $15,000). An exception to this general fonnula is made for mobile homes, which have a much lower structure value relative to the economic status of the residents (which is the basic determinant of the value of their personal property, including vehicles). The assumed relationship for mobite homes is
· V = (0.2*$)+1000
While each of these calculated vehicle values is assumed rather than empirical, varying them does not greatly affect the resulting assumed average vehicle value or the vehicular flood damages that result from using them. The above set of assumed relationships, although .hypothetical, are considered realistic and a sufficient basis for planning purposes.
Flood Insurance Administrative Costs
A public cost is incurred for each flood insurance policy, reflecting the administrative costs of the national flood insurance program. The average cost per policy is $131 per year, which is applied to all structures within the 1 percent ACE (100-year) floodplain.
Other Damages
Damages associated with transportation, communications, and public utilities facilities, and with flood-fighting and public health and relief activities, are estimated based on historical data collected from the City of Dallas Public Works Department. Data includes documented costs submitted to FEMA following major flood events.
Frequency-Damage Calculations
Using the appropriate water surface profiles, the depth of water at each structure within the study area was calculated for the 0.00125, 0.002, 0.01, 0.02, 0.04, 0.1, 0.2, and 1.0 percent ACE flood events. These depths were combined with the damage susceptibility factors and estimated values to estimate damages. Damages to the various activities were accumulated by frequency to produce a frequency--damage function. Estimates of expected annual damages were calculated through an integration process using frequency-damage data. Generally, this involved aggregating the multiplication of the mean damage between each pair of flood events by the difference in exceedance probabilities for that pair of events, repeated over the entire range of flood events for each category of damageable property. These calculations were facilitated by the HEC-FDA program.
Dallas Floodway Extension Reevaluation Report - Page D - 5
Magnitude and Extent of the Flood Problem
Descriptive information on the existing flood problem along the Trinity River is provided below. This includes field survey data and follow-up office analysis to ascertain the severity of the flood hazard, including:
o Enumeration and estimates of existing flood plain properties.
o Estimates of single occun:ence flood losses for various events.
o Estimates of average annual flood losses to existing properties.
o Estimates of risk associated with selected flood events
o Estimates of equivalent annual flood losses based on significant future changes in hydrology and urbanization.
STUDY AREA DESCRIPTION
Socioeconomic Conditions
The Bureau of the Census reports the population for the city of Dallas as 904,100 persons in 1980 and 1,007,600 persons in 1990. These figures account for more than 80 percent of the population in Dallas County. These figures also show an annual growth rate of over 10 percent. The 1996 population was estimated at 1,039,100.
Employment in the service industry highlights the significant shift from a manufacturingbased economy to a service related economy. Over the 10-year period service industry employment increased almost 50 percent. Between 1990 and 1994 non-farm employment figures increased almqst 4 percent. The construction industry lead the job growth figures in 1994 with an increase.of over 10 percent.
The Texas Wor1<.force Commission reported area unemployment 1994 at 5.3 percent. In 1996 the unemployment decreased to 3.9 percent and is currently reported by the commission at 3.6 percent. The employment rate continues to be lower than the state and the nation. Per capita income for 1995 was estimated at $1'8, 180 with an average salary of about $30,000.
Dallas is a major hub for hundreds of rail routes. The major railroads that serve the Dalt as area include: Burlington Northern, Cotton Belt, Kansas City Southern Lines, Santa Fe Railway, Southern Pacific and Union Pacific. Many of these lines traverse the study area. The city also provides public transportation with a net work of local and suburban bus routes, light rail, and High Occupancy Vehicle lanes.
Reach Determination
The study area is located along the Trinity River in the southern sector of the city of Dallas. The initial area of investigation can be defined as that portion of the Trinity River between the confluence of Five Mile Creek, near lnterstate-20 (1-20) downstream and the terminus of the existing Dallas Floodway Levee System upstream. However, preliminary analysis revealed significant hydraulic correlations between the extension area and the existing levee system upstream . Specifically, implementation of flood control projects in the extension area significantly influences the perfom,ance of the Dallas Floodway Levee System. Subsequently, about eight miles of the Dallas Floodway Levee System was included in the study area. To facilitate the analysis of benefits and inducements in both locations the study area was divided
Dallas Floodway Extension Reevaluation Report - Page D - 6
•
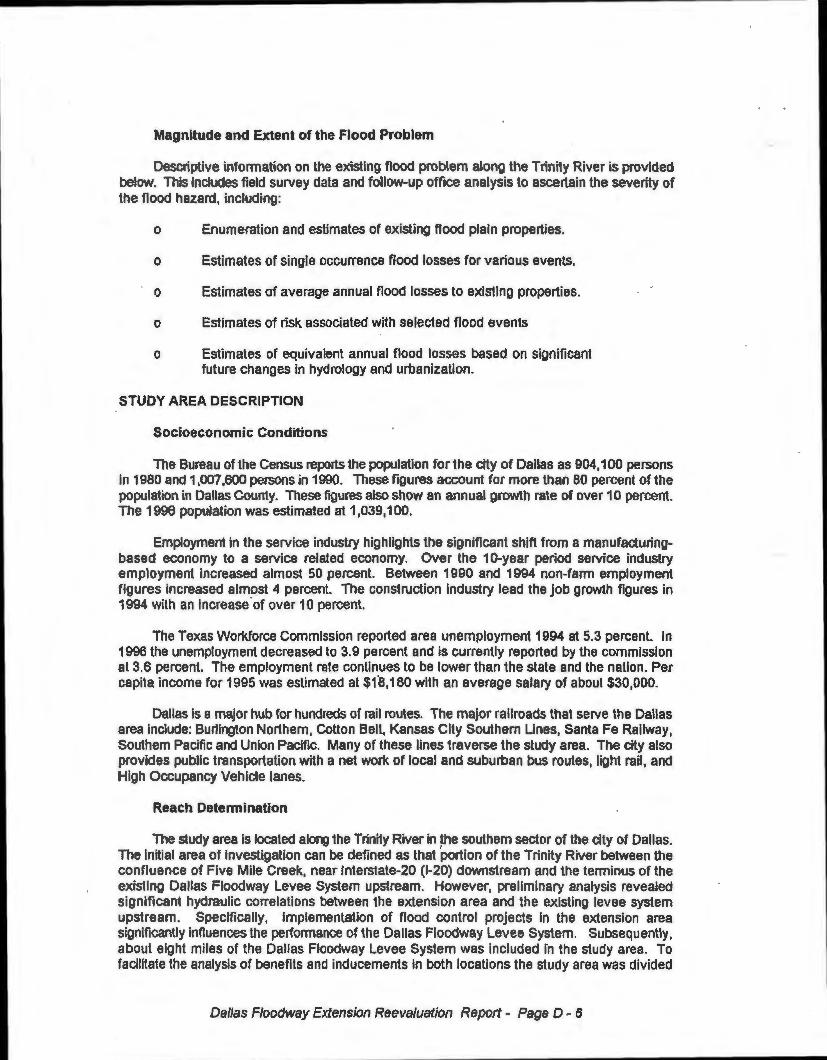
accordingly. The Dallas Floodway Extension is referred to as the Primary Study Area and the Dallas Floodway Levee System as the Secondary Study Area.
The primary study area was surveyed in 1991 and included all properties identified within the standard project flood (SPF) floodplain along the Trinity River and the White Rock Creek Tributary between station 499+14 and station 954+04. This area was considered the _primary study area. The secondary study area includes all properties protected by the Dallas F loodway Levee System between station 1083+80 and 1180+00. The reach extends from the tem1inus of the levee system to the confluence with the West Fork of the Trinity River. These primary and secondary study areas were further subdivided into reaches based on concentrations of damag_eable properties. The reach boundaries are shown in table 0-2.
Table D-2 Study Area Reach Boundaries
Reach Reference Name Station_ Range Index Bank
Primary Study Area
Reach 1 Sleepy Hollow 499+14 to 823+61 768+24 Both
Reach 2 White Rock Creek 823+61 to 859+16 859+16 Both
Reach 3 Rochester Park 859+16 to 998+01 998+00 Left
Reach 4A Lamar Street 895+27 to 1083+80 998+00 Left
Reach 4B OakJand Channel 895+27 to 1083+80 998+00 Left
Reach 5 Cadillac Heights 998+00 to 1063+80 1011+38 Right
Reach 6 Treatment Plant 954+04 to 1011+38 1011+38 Right
Secondary Study Area
Reach 7 East Levee 1083+80to11BO+00 1083+80 Left
Reach 8 West Levee 1 083+80 to 1180+00 1083+80 Right
Detailed Reach Description
Primary Study Area: This area begins at the Atchison, Topeka and Santa Fe Railroad (AT&SF) upstream and extends southwesterly to the river crossing at 1-20. The study area also includes floodplain lands along the White Rock Creek Tributary from 1-30 to its confluence with the Trinity River. Under existing conditions the .125 percent ACE floodplain encompasses over 10,400 acres and the 1 percent chance exceedance flood over 9,200 acres. A map of the total study area is presented in the main report. To facilitate the analysis the study area was separated into the following reaches:
Reach 1 (Sleepy Hollow): Extends from the confluence of White Rock Creek south eastward to the confluence of 5-Mile Creek. The reach is bounded by 1-20, the MKT Rail Road, and Linfield and Riveiwood Roads. This reach includes the Sleepy Hollow Golf Course located near the river and Loop 12. The land use includes commercial, industrial, residential, and public facilities. The McCommas Bluff and Linfield landfill sites are located in this reach .
Dallas Floodway Extension ~eevaluation Reporl - Page D - 7

Reach 2 (White Rock): Includes a portion of the White Rock Creek Tributary from 1-30 upstream to its confluence with the Trinity River near Linfield Street. The reach is further bounded by Pemberton Road, 1-30, the Southern Pacific Railroad and the Rochester Park Levee. Land use includes single and multi-family residential, commercial and industrial properties.
Reach 3 (Rochester Park): This reach is located near the center of the study area and is predominately enclosed along its southern border by the Rochester Park Levee. The reach is further bounded by Hwy. 175 (Hawn Freeway), and Hwy. 310 {Central Expressway). The land use is predominately single and multi-family residential and a few commercial and public properties.
Reach 4A (Lamar): This reach (initially combined with reach 48) is located within the SPF floodplain limits along the east bank of the Trinity River. Beginning near the intersection of Lamar Street and Hwy. 175 and continuing northerly upstream to the AT & SF railroad . The reach is bounded on the east by Hwy. 310 (Central Expressway). The major land use categories include residential, commercial and industrial facilities.
Reach 48 (Oakland Channel): This reach (initially combined with reach 4A) is located parallel and to the east of Reach 4A. It is bounded by Hwy. 310 and Second Avenue. The Oakland Channel, which flows into White Rock Creek is located within this reach. The primary land use categories are single and multifamily residential and some commercial facilities. ·
Reach 5 (Cadillac Heights): Located on the West Bank of the Trinity River, the SPF limit of this reach extends from 1-45 to the Ai&SF Railroad at the end of the existing Dallas Floodway. This area includes single-family residential, commercial, industrial and public properties. ·
Reach 6 (Treatment Plant): This reach is located downstream of Reach 5 and consists solely of the Central Wastewater Treatment Plant facility. This public facility represents the greatest single investment in the study area.
Secondary Study Area: Property protected by the east and west levees between the floodway terminus and the confluence of the West Fork of the Trinity River is included in the secondary study area. The total investment behind these levees was estimated at over $5.7 billion.
Reach 7 (East Levee): This reach, located upstream of the primary study area, encompasses the SPF flood plain limits protected by the East Levee of the existing Dallas Floodway System. The area includes the Central Business District and a mixture of all land use categories. Commercial facilities dominate the reach (69 percent) with almos119B2 structures. A total of 2,885 structures was identified with an estimated value of over $4.B billion.
Reach 8 (West Levee): This reach, located upstream of the primary study area, encompasses the SPF flood plain limits protected by the West Levee of the existing Dallas Floodway. The area includes all land use categories- residential and commercial and industrial and public facilities. Residential structures make up over 90 percent of the land use in this reach with over 6,900 identified. A total of 7,700 structures was identified with an estimated value of over $934 million.
Dallas F/oodway Extension Reevaluation Report - Page D - 8

Key Assumptions
o Investigations through 1993 utilized the hydrological model developed for the original 1989 Upper Trinity River Reconnaissance Study, existing two foot topography maps and expected probability water surface elevations.
o Property values, based on the Dallas County Appraisal District data, were adjusted to reflect depreciated replacement value.
o Floodway extension is considered a modification to the existing floodway project. The benefits attributable to restoring the level of protection should be claimed and are not considered incidental benefits. The cost of the extension needs to be incrementally justified.
o In accordance with PGL 26, Benefit Determination Involving Existing Levees benefits were based on Probable Failure Points {PFP) and Probable Non-Failure Points (PNP).
o The chance exceedance flood event for the Rochester Park levee was estimated at the .68 percent ACE level and the Central Wastewater Treatment Plant at the .7 percent ACE level.
o Prevailing interest rate of 8 percent for analysis c.onducted before fiscal year 1993. ·
o 1993 analysis used standard frequency models and STOMA to determine benefits. Included benefits\disbenefits for overtopped levees upstream in existing Dallas Floodway.
o Design grade is assumed for benefit and damage calculation. The height of the existing Federal Dallas Floodway Levee System was estimated to stand at the .23 percent ACE flood level based on the design grade. The Dallas Floodway System has settled in some areas and is not currently at design grade.
Structures and Investment Identified
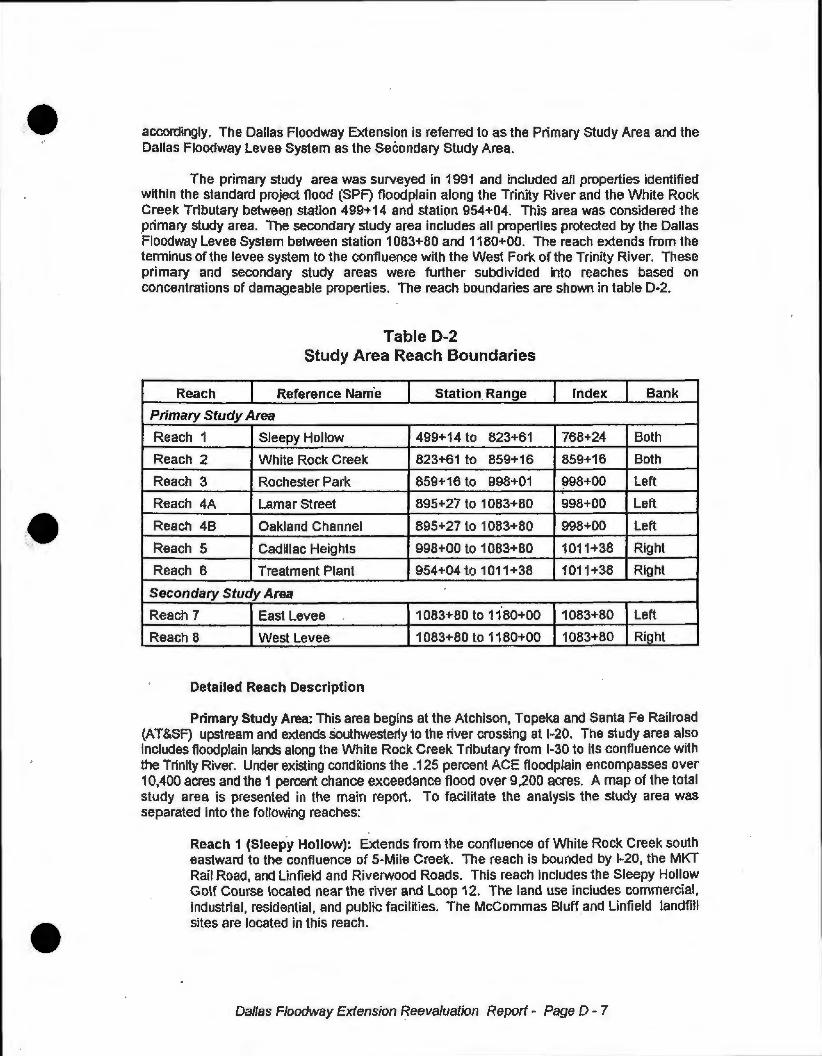
Table D-3 displays the numbers and estimated total values of properties (structures and contents) identified within the Primary study area surveyed. A total of 2,640 structures was identified within the .125 percent ACE (SPF) flood limits, of which about 90 percent are located above the confluence of White Rock Creek. The total flood plain investment within the .125 percent ACE floodplain limit of the primary study area was valued at over $7 40 million based on June 1993 prices and level of development.
About 90 percent of the structures, representing about 11 percent of the value of floodplain investment, are residential. These are nearly all one or two-story detached residences, with an average structure value of about $26,000. Commercial and industrial properties represent 9 percent of the total number of structures and 10 percent of the total floodplain investment value. Although only 26 public structures are identified, they constitute 78 percent of the floodplain investment value.
Preliminary estimates of the investments protected by the Dallas Floodway Levee System were extracted .from the 1989 Dallas Floodway Reconnaissance Report. Investments
Dallas F/oodway Extension Reevaluation Report - Page D - 9

of over $5.0 billion were identified within the SPF floodplain. The majority of these investments are commercial and industrial in nature.
Single-Occurrence Flood Losses
Cumulative single-occurrence flood losses by reach and flood zone under with and without-project conditions are presented in Table D-4. Within the primary study area, under without-project conditions, damages begin al the 50 percent ACE discharge in reach 4 for railroad facilities. A 10 percent ACE event could produce damage~ totaling $4.8 million. The 4 percent ACE flood discharge could produce damages that exceed $12.0 million. The 1 percent ACE event could produce losses totaling over $40.0 million. A significant increase in loss occurs with the .2 percent ACE event that could produce over $296.0 million in damage. This would represent about 48 percent of the floodplain investment. It was estimated that a .125 percent ACE event could cause direct structure and content damage of about $374.0 million based on June 1993 prices. A flood of this magnitude would destroy about 50 percent of the total investment in the primary study area. Estimates of flood losses for different singleoccurrence flood events by reach, are presented in table D-4.
Single-event damages in the secondary study area were based on data used in the 1989 Dallas floodway Section 215 Reconnaissance Report. The preliminary investigation assumed the entire levee system to be at risk. The single-event damages for the levee system were reported as follows:
East Levee (E): West Levee (VV): North West Levee (NW):
$7,247 billion $1,550 billion $ 388 billion
and tabulated based on a weighted-average of the damages occurring behind the three levees where,
Weighted Average = NW+(E+W+(E+W})/3,
which yields weighted av_erage damages of $6,253 billion. These damages were updated to the prevailing price level based on an October 1988 index of 4555.4 and an October 1993-estimated index of 5208.8. The calculated factor of 1.43 was applied to yield total single-event damages of $7 .15 billion for the secondary study area.
Dallas Floodway Extension Reevaluation Report - Page D - 10
Single-Family Multi-Family Residential Residential
No. Value No. Value
Table D-3 Total Floodplain Investments by Reach
(June 1993 Prices and Level of Development) (1,000's $)
Commercial\ Total Structure Industrial Public . Investment
No. Value No. Value No. Value -:-·_ · .. : · .~:_, • ." :., -. •.. •• • -. =-: ... x. , <~~:-.,ii-~~~~~'t1l~~~·i?}~~l~'-.:t~=-:.:-1-:'S,~~- ~~:\~:::-. __ :--!~k1.~ ... ~1~;.;; ~ ~ ®$.~:-:-:~~§: ... J ~'$':~~; · · ,. •/~; · :-~::;:
,~~~~~~~~~~,li-~~~~~l1§,~~~li!~~~~~~~~a~~~r'Y·~·'··~~":~~~:m~---*~~~'1'4~->:~- ,, 1amt 1 73 1 672.9 0 0.0 26 21,601 .3 3 2,420.8 102 25 695.0
2 68 4,105.9 3 450.5 19 1 615.6 0 0.0 90 6,172.0
3 247 6 114.8 112 8736.0 8 188.3 4 34 675.0 371 49,714.1
4 1 641 39 580.2 6 361.4 131 40,669.8 3 107,013.2 1 781 187,6247.6
5 215 6 025.5 0 0.0 66 17,035.2 0 0.0 281 23 060.7
6 0 0.0 0 0.0 0 0.0 15 434,133.0 15 434,133.0 Area Total
2,244 $57,499.3 121 $9,547.9 250 $81,110.2 25 $578,242.0 2,640 $824,141 .1
% 85.0% 8.0% 5.0% 1.0% 9.0% 11 .0 1.0% 71 .0% 100.0%
Table D-4 Cumulative Single-Event Damages
% ACE Event 1 2 3* 4 5 <100 $0 $0 $0 $13,129 $0
50 $6,083 $0 $0 $43,596 $22,479 20 $30,070 $365,150 $0 $243,9i6 $477,256 10 $317,055 $639,283 $0 $1,470,734 $2,470,518 4 $565,731 $687,813 $0 $6,750,943 $4,041,161 2 $834,462 $747,697 $0 $12,129,761 $5,895,266
Vehicles
Value -~- -,; • ..:,:-:=:-:-:-- • ·- ... _
182.5 .407.7
1,483.2
2 295.2 661.7
0 .0
$3,732.9 1.0%
6* $0.0 $0.0 $0.0 $0.0 $0.0 $0.0
1 $3,326,273 $1,116,522 $2,230,000 $24,671,859 $8,367,142 $24,489 000.0
Total Rail Investment
Value Value
·■,1111111ww 4 204.2 30,081.7
0.0 6,579.7 0.0 51 ,197.3
6 ,682.2 196 602.( 1 535.5 25 257.9
0.0 434,133.0
$13,129.9 . $743,851 .6 2.0% 100.0%
Total $13,129 $72,158
$1,116,452 $4,897,590
$12,045,648 $19,607,186 $64,200,796
.2 $14 021 172 $3 448 877 $14 038 560 $91 586 716 $14 902 354 S158 841 900.0 $296 839 579 .125 $16,802,385 $4,001 ,853 $18,400,480 $102,406,626 $16,167,014 $216,891 ,800.0 $374,670,15!
*Reach 3 assumes 148-year Rochester levee and reach 4 assumes 142-year Treatment Plant levees.
Dallas Ffoodway Extension Reevaluation Report - Page D - 11
1991..:1993 INVESTIGATED PLANS
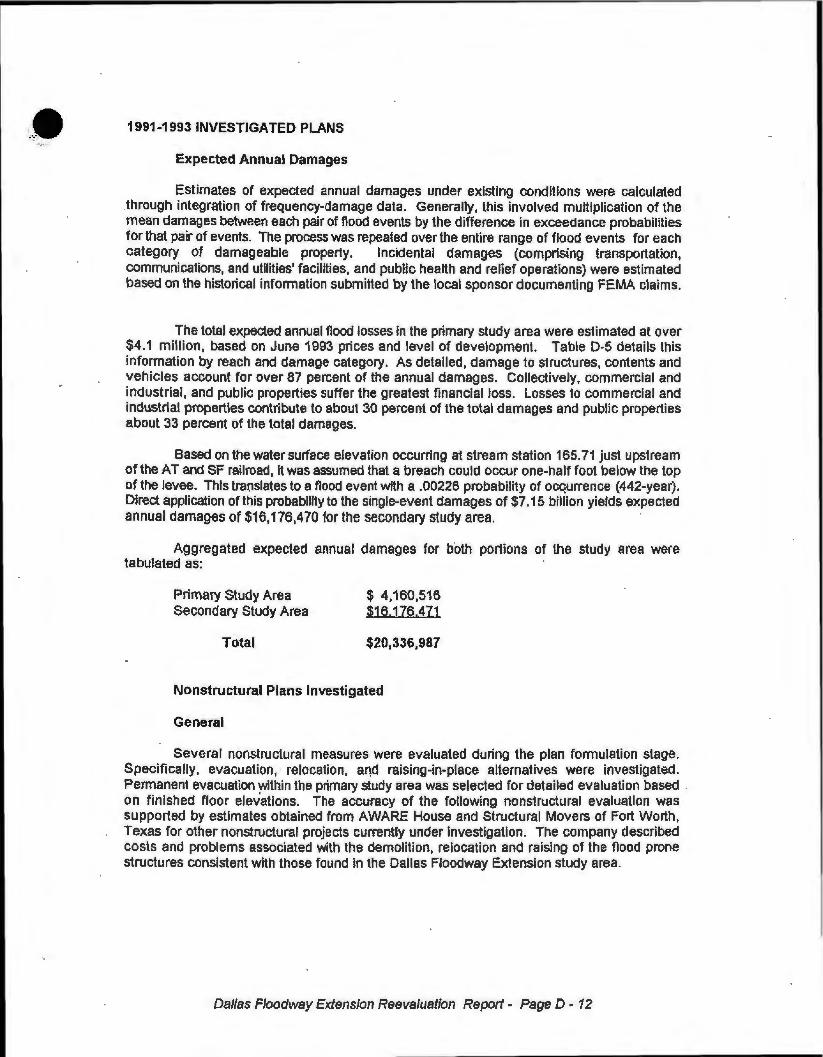
Expected Annual Damages
Estimates of expected annual damages under existing conditions were calculated through integration of frequency-damage data. Generally, this involved multiplication of the mean damages between each pair of flood events by the difference in exceedance probabilities for that pair of events. The process was repeated over the entire range of flood events for each category of damageable property. Incidental damages (comprising transportation, communications, and utilities' facilities, and public health and relief operations) were estimated based on the historical information submitted by the local sponsor documenting FEMA claims.
The total expected annual flood losses in the primary study area were estimated at over $4.1 million, based on June 1993 prices and level of development. Table D-5 details this information by reach and damage category. As detailed, damage to structures, contents and vehicles account for over 87 percent of the annual damages. Collectively, commercial and industrial , and public properties suffer the greatest financial loss. Losses to commercial and industrial properties contribute to about 30 percent of the total damages and public properties about 33 percent of the total damages.
Based on the water surface elevation occurring at stream station 165.71 just upstream of the AT and SF railroad, it was assumed that a breach could occur one-half foot below the top of the levee. This translates to a flood event wfth a .00226 probability of ocqurrence (442-year). Direct application of this probability to the single-event damages of $7 .15 billion yields expected annual damages of $16,176,470 for the secondary study area.
Aggregated expected annual damages for both portions of the study area were tabulated as:
Primary Study Area Secondary Study Area
Total
$ 4,160,516 $16,176,471
$20,336,987
Nonstructural Plans Investigated
General
Several nonstructural measures were evaluated during the plan formulation stage. Specifically, evacuation, relocation, af'!d raising-in-place alternatives were investigated. Permanent evacuation within the primary study area was selected for detailed evaluation based -on finished floor elevations. The accuracy of the following nonstructural evaluation was supported by estimates obtained from AWARE House and Structural Movers of Fort Worth, Texas for other nonstructural projects currently under investigation. The company described costs and problems associated with the demolition, relocation and raising of the flood prone structures consistent with those found in the Dallas Floodway Extension study area.
Dallas Floodway Extension Reevaluation Report - Page D - 12

Table D-5 Existing Conditions Expected Annual Damages
(June 1993 prices and level of development)
Total Expected Annual Direct Damages Total ~xpected Annual Incidental Damages
Reach Res. Comm\lnd Public Vehicles Rail Primary Roads Utilities Emergency Clean.Up Flood Incidental Subtotal Aid Insurance Subtotal
1 $10,449 $117,682 $2,356 $1 ,702 $55,352 $187,541 $992 $1,567 $8,579 $3,039 $2,148 $16,324
2 $23,328 $163,241 $0 $7,972 $0 $194,541 $3,443 $5,441 $18,985 $10,550 $1 ,499 $39,917
3 $45,331 $658 $33,995 $8,016 $0 $88,000 $1,559 $2,464 $39,416 $4,778 $0 $48,217
4 $200,432 $510,740 $323,497 $47,601 $346,038 $1,428,308 IS15,867 $25,076 $161,375 $48,622 $26,124 $277,064
5 $114,283 $481,849 $0 $19,692 1$103,109 $718,933 $8,500 $13,433 $70,250 $26,045 $9,790 $128,018
6 $0 $0 $1 ,'033,143 $0 $0 $1,033,143 $66 $104 $139 $201 $0 $509
TOTAL $393,823 $1,274,170 $1,392,991 $84,983 $504,499 $3,650,466 $30,426 $48,085 $298,743 $93,235 $39,560 $510,049
% 9.5% 30.6% 33.5% 2.0% 12.1% 87.7% 0.7% 1.2% 7.2% 2.2% 1.0% 12.3'l!
Dallas Floodway Extension Reeva! uation Report - Page D - 13
Total Damaqes
$203,865
$234,458
$136,217
$1,705,372
$846,951
$1,033,652
$4,160,516
100.0%

••
Nonstructural Benefit Methodology
As stated in ER 1105-2-100, and IWR Report 88-R-2, page IX-12, benefits for removing individual structures from the flood plain are limited to the sum of:
plus:
plus:
annualized residual value of the vacated land, or average annual recreation benefits for the land
reduction in annual flood insurance subsidies:
agency cost:
average annual damages to the structure and its contents, plus:
minus:
agent fees (at 15 percent of the estimated premium), and other administrative costs (at $131 per policy)
policy holders' cost:
estimated annual insurance premium (at $0.55 per $100 of structure value for the first $45,000 and $0.17 per $100 thereafter, plus $0.65 per $100-of contents value for the first $15,000 and $0.30 per $100 thereafter),
annual deductible ($500 each for structure and: contents per flood occurrence, times the probability of a flood in a typical year), and
annual uninsured tosses (5 percent of the structure value per flood occurrence, times the probability of a flood in a typical year)
average annual public damages prevented (that is, damages to communications and public utilities facilities, and costs for flood fighting and public relief) based on actual FEMA claims.
Nonstructural Analysis Results
Floodplain evacuation involves the acquisition and removal or demolition of frequently flooded structures from the flood plain. This alternative was initially evaluated for the evacuation of structures within the 1 0 percent ACE flood event according to the nonstructural economic criteria previously outlined. Eligibility under the evacuation alternative rests primarily with the economic criteria and the frequ~ncy of flooding. The structural integrity of the structure was not a factor in determining feasibility as in other nonstructural plans. Reaches 2 and 5 contain commercial and industrial structures within the 50 to 20 percent ACE flood events, which meet these nonstructural economic criteria. Table D-6 presents a summary of the economic analysis for the evacuation of eligible structures in reaches 2 and 5. The cost estimates include land acquisition, demolition and disposal, and the remediation of asbestos, lead based paint, and other hazardous non-CERCLA contaminants.
l n reach 2 about $154,300 in annual damages w·ould be eliminated with the permanent evacuation of 5 commercial structures. The first cost for this plan was estimated at about $874,800. The annual costs and claimable annual benefits are $75,800 and $145,600, respectively with a resultant benefit-to-cost ratio of 1.8 to 1.0 and excess benefits of about $66,000 .
Dallas Floodway Extension Reevaluation Report - Page D - 14

ln reach 5 an estimated $419,000 in annual damages could be eliminated with the ;,, evacuation of only 2 commercial structures. First cost for this plan was estimated at about $580,300. The annual costs and claimable annual benefits are $50,800 and $410,800, respectively with a resultant benefit-to-cost ratio (BCR) of 7 .6 and excess benefits of about $357,000. The benefits derived signal the need for a more detailed investigation to obtain empirical flooding evidence associated with the contents in these structures for this reach.
In summary, the permanent evacuation plans were economically feasible for 7 commercial structures. Total damages would be reduced damages by 12 percent in the immediate study area. The combined plans would have an estimated project first cost of $1,455,100. The total annual benefits and costs would be $556,400, and $133,400, respectively. The resultant BCR would be 4.2 to 1.0 with excess benefits of $423,100.
The Uniform Relocation Assistance Program requires that displaced property owners be compensated for tosses attributable to evacuation. A maximum of $22,000 was allowed for residential structures to cover moving expenses, temporary lodging, and' the cost to obtain housing in accordance with Federal guidelines. Maximum relocation expenses have not been set for commercial/industrial structures. These costs would be 100 percent non-Federal.
The local sponsor needs recreational facilities, however, a specific recreation design was not considered at this point since the BCR exceeds 1.0, and the structures are randomly located throughout the flood plain. It is recognized that individual structures may be selected for evacuation in conjunction with other flood control measures.
Reach
Reach 2
Reach 5
Combined
Table 0-6 Summary of Estimated Benefits and Costs of
Investigated Evacuation Plans (October 1993 prices, 8.0 percent interest rate)
(In thousands of dollars)
Number of Total First Annual Annual Benefit to Structures Costs Costs Benefits Cost Ratio
5 $874.8 $75.8 $145.6 1.8
2 $580.3 $50.8 $410.8 7.6
7 $1,455.1 $125.1 $556.4 4.2
Channel Plans Investigated ·
Annual Net Benefits
$ 66.0
$357.0
$423.0
The preliminary design features a 5-mile channel extending from the downstream end of the existing Dallas Floodway upstream to Loop 12. The channel would be a grass-lined trapezoid with 3' horizontal to 1' vertical side slopes. Between the existing floodway upstream and continuing just below 1-45 with alignment along the West bank of the Trinity River. At 1-45 the channel would veer to the east and cross the river to the East bank, rejoining the natural channel at the center of the large oxbow and continue along the East bank to 1-20. The channel was aligned to preserve at least 1 side of the river bank. Bottom width sizes investigated for this alignment included the 250', 200', 150', and 100'. The results of the analysis are shown in table D-7.
Dallas Floodway Extension Ree.valuation Report - Page D - 15
··•

••
•
Project first costs' range from about $37.0 million to $75.0 million. Each plan would be feasible with B/C ratios ranging from 1.7 to 2.8. The optimum bottom width would be 150'. All four designs would increase the level of protection provided by the existing levees in the primary and secondary study portions of the study area and reduce damages in the unprotected primary study area by 50-to 75 percent. However, due to an unfavorable public acceptance, plans with fewer environmental impacts were evaluated.
Table D-7 Summary of Channel Alternatives
(Mi/1/ons of Dollars) · (June 1993 prices and level of development, 8.0% interest)
Option First Annual Annual Benefit/Cost Net Benefits Cost Cost Benefit Ratio
100' BW $38.9 $3.6 $11.1 2.8
200'BW $74.2 $6.3 $12.5 2.0
25D'BW $78.3 $7.6 $13.2 1.7 $5.6
Levees Investigated
Levee designs for the 1 percent and .125 percent ACE flood events, were investigated for the left and right banks of the Trinity River between the existing Dallas Floodway Levee System and Hwy. 75 (Central Expressway). ·
Lamar Street Levee: Constructed along the left bank with an average height of about 27' with 3.Sv on 1h side slopes and a length of about 2.5 miles. A 1 percent ACE levee would consist of a series of small levees with a typical height of about 15' and an aggregate length of about 13,200'.
Cadillac Heights/Treatment Plant Levees: Consti:u_cted along the right bank of the Trinity river between the Cedar Creek confluence and Hwy. 75. The levees are referred to as the Cadillac Heights Levee (Reach 5) and Wastewater Treatment Plant Levee (Reach 6). The design of _each was based on the permitted design plan developed by the engineering firm of Halff Associates. The average height would be about 25' for the .125 percent ACE levee and 15' for the 1 percent ACE levee. The total length is about 1.3 miles.
As shown in table ·D-8, annual levee costs are supported by the annual benefits. It was not considered practical to construct single levees along the East or West bank of the Trinity because inducements would occur along the opposite bank. However, as a system, inducements to the existing floodway produced negative net benefits .
Dallas Ffoodway Extension Reevaluation Report - Page D - 16

Table D-8 Summary of Levee Alternatives
(Millions of Dollars) (June 1993 prices and level of development, 8.0% interest)
Investigated Alternative Firs~ Annual Annual Benefit/Cost Net Cost Cost Benefit Ratio Benefits
100-Year Lamar $9.0 $.8 $1.5 1.9 $.7
100-Year Cadillac $9.1 $.8 $1.2 1.5 - $.4
SPF Lamar $14.6 $1.3 $2.2 1.7 $.9
SPF -Cadillac\Treatment Plant $29.3 $2.6 $2.8 1.1 $.2
ALL 100-Year Levees $18.2 $1.6 $2.6 1.6 ($1 .1)
All SPF Levees $43.9 $3.9 $1.8 0.5 ($2.1}
Vegetation Management
This plan would clear non-endangered species underbrush from the downstream end of the existing Dallas floodway to Loop 12. The width of the clearing would extend approximately 1,000' from each side of the centerline of the river leaving an overstory of tree cover from 20' upward and a 200' corridor of existing vegetation along the natural channel. Although some selective clearing and pruning may be required, an attempt to leave a buffer zone 100' wide for a riparian habitat along both sides of the river channel . Small parcels of the understory (shrubs and other vegetation of approximately 3-5 acres in size) left in existing state dolled throughout the 2,000 foot area. All-remaining understory vegetation would be removed. Hydraulic performance of this alternative demonstrated the significant impact of vegetation on the water surface elevations. The alt~mative was removed from consideration due to the requirement for expensive,
.intense maintenance. However, hydraulic findings initiated development of the swale plan.
Swale Plans Investigated
An economic analysis was conducted to ascertain the performance of overbank swales. Bottom width (BW) sizes investigated inch,1de an average of 300', 500', 600' 900', 1_,200' and 1,500' with both swales in place. The swale plan would clear the site of all non-endangered species vegetation. A description of these swales is given below.
Lower Overbank Swale: Extends from Hwy. 75 (Central Expressway) upstream beginning at least 100' from the edge of the east bank and continues downstream to about 2,000' below Loop 12, for a total length of 17,300' or 3.3 miles. The lower swale was designed with a s!ope of .0005 ft/ft.
Upper Overbank-Swale: To maximize channel relief, this grass-lined, overbank swale was designed to work in conjunction with the lower overbank swale to maximize channel relief. The length of the Upper Swale is about 7,800' or 1.5 miles and extends from the confluence or Cedar Creek upstream to the river crossing of 1-45.
The Multi-Objective Management (MOM) Approach was used to design the swales to avoid and minimize environmental impacts. The wider swales impact the higher quality habitat to a greater extent than the 300' BW to 500' BW swales. Fragmentation was unavoidable and will require significant mitigation. Approximately 3,200 acres of land would be required to offset the environmental impacts. Each size swale was determined to be economically feasible. Benefits
Dallas Floodway Extension Reevaluation Report - Page D - 17
•

•
range from $9.0 million to $15.3 million, without future discharges. greatest net benefits between all the swale plans and among all the alternatives evaluated in the 1991 to 1993-period. The plan captured 75 percent of the floodplain damages. Further, investigations of the 1200' BW swale were not conducted during this period of analysis.
Table D-9 Economic Summary of Swale Alternatives
(Millions$, June 1993 prices and level of development, 8.0% interest)
Option First Annual Annual Benefit/Cost Net Benefits Cost Cost Benefit Ratio
300'BW $15.2 $1.4 $ 9.3 6.6 $ 7.8 600' BW $23.7 $2.3 $11 .8 5.2 $ 9.5 900'BW $31.9 $3.1 $12.7 4.1 $ 9.6
1500' BW '$54.8 $5.4 $15.7 2.9 $10.2
Swale and Levee Combination Plans Investigated
An economic analysis was conducted to determine the benefits of placing a single levee along the eastbank of the river. Specifically, either 100-year or SPF levees along Lamar. The results of the analysis are shown below. These plans show significant net benefits, but would not be practical for implementation since damages to reaches 5 and 6 along the opposite bank would be incurred. The investigation showed that individual placement would not induce damages to the secondary study area. Table D-10 summarizes the results of this investigation.
Table D-10 Economic Summary of Various
Swale and Lamar Levee Combination Alternatives (Millions $, June 1993 prices and level of development, 8.0% interesQ
Investigated First Annual Annual BenefiUCost Alternative Cost Cost Benefit Ratio
300' BW & SPF $27.5 $2.6 $ 8.4 3.2 500' BW & SPF $29.6 $2.8 $12.4 4.4 600' BW & SPF $30.6 $2.9 $14.1 4.9 300' BW & 100-Yr $24.2 $2.2 $ 8.9 4.0 500' BW & 100-Yr $26.1 $2.4 $17.8 7.4 600' BW & 100-Yr $27.6 $2.5 $21.4 8.4
Recreation Plan
Net Benefits
$ 5.8 $ 1.8 $ 2.4 $ 6.7 $15.4 $18.9
Benefits for the initial recreation plan were derived based on Region 4 facility needs and carrying-capacity factors extracted from the Texas Outdoor Recreational Plan (TORP) . The TORP does not identify a net need for picnic facilities therefore, initial benefits were only calculated for the trail system. This project would generate at least $1.0 million in annual recreation benefits. The total estimated project first cost for the recreation plan is about $8.9 million, with a resulting BCR of 1.2 to 1.0. This plan could be adapted to either of the proposed swale alternatives. See Recreation Appendix for plan details.
Dallas F/oodway Extension Reevaluation Report - Page D - 18
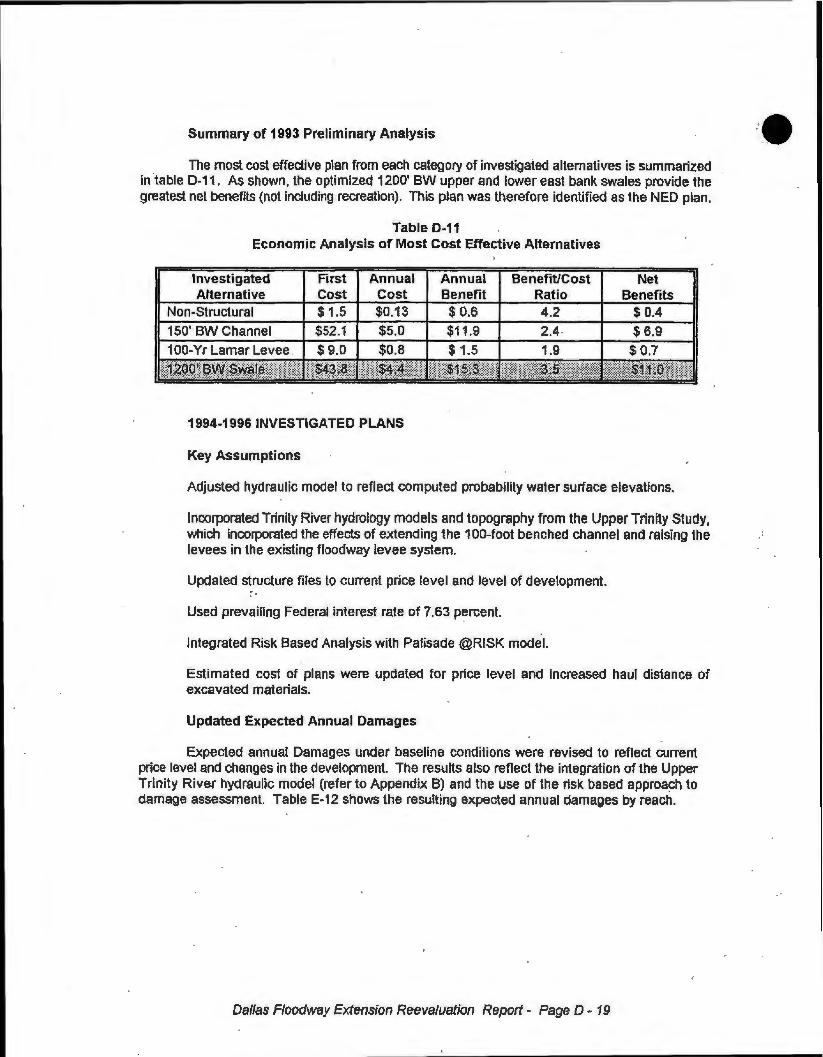
Summary of 1993 Preliminary Analysis
The most cost effective plan from each category of investigated alternatives is summarized in table D-11. As shown, the optimized 1200' BW upper and lower east bank swales provide the greatest net benefits (not including recreation). This plan was therefore identified as the NED plan.
Table D-11 Economic Analysis of Most Cost Effective Alternatives
Investigated First Annual Annual Benefit/Cost Net Alternative Cost Cost Benefit Ratio Benefits
Non-Structural $1.5 $0.13 $ 0.6 4.2 $ 0.4 150'·BW Channel $52.1 $5.0 $11.9 2.4 $ 6.9 100-Yr Lamar Levee , $9.0 $0.8 $ 1.5 1.9 $ 0.7
1994-1996 INVESTIGATED PLANS
Key Assumptions
Adjusted hydraulic model to reflect computed probability water surface elevations.
Incorporated Trinity River hydrology models and topography from the Upper Trinity Study, which incollJOrated the effects of extending the 100-foot benched channel and raising the levees in the existing floodway levee system.
Updated structure files to current price level and level of development.
Used prevailing Federal interest rate of 7.63 percent.
Integrated Risk Based Analysis with Palisade @RISK model.
Estimated cost of plans were updated for price level and increased haul distance of excavated materials.
Updated Expected Annual Damages
Expected annual Damages under baseline conditions were revised to reflect current price level and changes in the development. The results also reflect the integration of the Upper Trinity River hydraulic model (refer to Appendix B) and the use of the risk based approach to damage assessment. Table E·12 shows the resulting expected annual damages by reach.
Dallas Floodway Extension Reevaluation Report• Page D- 19

Table 0-12 Updated Expected Annual Damages
Under Baseline Conditions
Annual
Reach Direct Incidental Total Benefits -
1 $338,200 $35,200 $373,400
2 $58,400 $6,100 $64,500 hite "Rock 3 $168,000 $17,500 $185,500
· 4 $1,853,800 $192,800 $2,046,600 Lamar Area 5 $986,000 $102,500 $1,088,500 Cadillac Heights 6 $1 254 200 $130,400 $1,384,600 reatment Plant
rlliiitil~ wft~~tfl.tmi __ 1 ti11tlmll :ililff.ili1l.ll et7111Illii!titliilliti1l; 7 $12,131,000 $1,261,600 $13,392,600 East Levee
· 8 $1102,400 $114,700 $1,217,100 estLevee
11111. !:J.t1;]Il~ii.ili11tf :1:l!iz.tl1illr: :1;1u:(1.iiil!I~1: 111111Biiull11tl Total $17,892,000 $1,860,800 $19 752,800
Realigned Swale Alternative
The community's environmental concerns with regard to the impacts of the 1200' BW swales prompted the city to request an evaluation of a west bank alignment for the lower swale paired with the 300' BW upper swale from the original analysis. The Corps presented two alignment options-one through the Linfield Landfill and the other through the Joppa community. The selected alignment would be the basis for the Chain of Wetlands alternative. A description of the preliminary alignments and the selected alternative is shown below.
Linfield Bypass Swale: In conjunction with the 300' BW upper swale this alignment would place a 500' Channel between Loop 12 at the golf course, and the Linfield landfill. The maximum depth would be about 30 feet, with a minimum depth of about 9 feet. HTRW investigations showed manageable levels of contaminants within the landfill.
Joppa Bypass Swale: This plan would place a 500' BW Channel between Loop 12 at the golf course, and the Joppa neighborhood. This alignment would avoid the Linfield landfill and instead go through the Joppa neighborhood. This alignment would displace approximately 17 residents and impact about 68 properties. The alignment would also traverse a large pond, which was previously a gravel pit and a parcel of S&P railroad property that, has been cited as an illegal dumping area. This neighborhood is located outside the floodplain.
Chain of Wetlands: The resulting alignment consists of an undulating swale with connecting wetlands· and pockets of sparsely treed areas within an open grassy area. The average depth is about 2 feet and the wetland areas are approximately 2 to 4 feet in depth. Vegetated areas would contain about 10 trees per acre. ·
Dallas Floodway Extension Reevaluation Report - Page D - 20

Both alignments reduce damages within the study area by more than 30 percent and in the existing floodway by abo_ut 12 percent. Costs associated with the Linfield alignment were on par with the cost to relocate and abate contaminated areas associated with the Joppa alignment. Therefore, both plans were considered cost effective. The cost difference was insignificant and HTRW concerns were minimal for the two alignments. However, the residents i_n the Joppa neighborhood are not situated in the floodplain. Therefore, the plan formulation team used the Linfield alignment to develop the Chain of Wetlands alternative. The final design served to double the preliminary economic benefits. Overall, the economic analysis of the Chain of Wetlands design shows a redu~tion of damages in the primary study area by over 30 percent with net benefits of $4.1 million. A summary of the economic analysis is presented in table D-13.
Table D-13 Summary of Revised Swale Alternatives
(Millions of Dollars, 7. 63 interest, Oct' 1995 prices)
Investigated First Annual Annual Benefit/Cost Net Benefits Alternative Cost Cost Benefit Ratio
Linfield Swale · $35.0 $2.9 $7.2 2.5 $4.4
Joppa Swale $33.4 $2.8 $6.3 2.3 $3.5
Chain of Wetlands $50.6 $4.2 $9.4 2.2 $5.2
Evaluation of Combination Plans
The three plans considered above were combined with either the 1 percent ACE (100-year) or .125 percent ACE (SPF) levee to determine the economic efficiency of providing a higher level of protection and facilitate the local sponsor in selecting a plan. Each plan was combined with addiflg .125 ACE levees to both the East and West banks or adding an .125 ACE height east levee and extending the existing 1 percent ACE levee height around the treatment plant to include the Cadillac Heights neighborhood. The re~;ults of this analysis are presented below. As shown in table D-14 the plan with the greatest net benefits is the 1200' BW swale. This plan, not including recreation generates net benefits of $8.6 million and was designated as the NED plan. However, the Chain of Wetlands along with SPF Lamar and Cadillac Heights levees is preferred by the local sponsor. Accordingly, the final array of alternatives to be investigated in detail includes the Authorized Plan (for comparison purposes), the 1200' Swale (NED), the Chain of Wetlands (COW), and the COW plus SPF levees. ·
Table D-14 Summary of NED Plan Determination
(MIiiions of Dollars) (Oct 1995 prices and level of development, 7.63% Interest)
Investigated Alternative First Cost
Annual Annual Benefit to Net
Chain of Wetlands Chain of Wetlands w\SPF
t:.evees
$166.7
$50.6 $82.6
*Based on interest rate of 3.25 percent.
Cost Benefit Cost Ratio Benefits
$6,3 $10.2 1.6 S4.0
$4.2 $9.4 2.2 $5.2 $7.2 $11.5 1.6 $4.3
Dallas Floodway Extension Reevaluation Report - Page D - 21

•
INVESTI.GATED STRUCTURAL PLANS 1996-1997
Key Assumptions and Methodology
Without project conditions assume the locally constructed levees are not in-place. The Rochester Park Levee (reach 3) and the Central Wastewater Treatment Plant Levee (reach 6) each offer a 0.0067 percent ACE flood level. Both levees were constructed by the city of Dallas during the study investigation. The WRDA 1996 document grants the-city of Dallas credit for the portions of these levees that are compatible with the authorized plan. Therefore, the revised without project conditions reflect the pre-1991 floodplain (no Rochester levee and the treatment plant at a 2 percent ACE levee height).
Supplemented the structure file data gathered through survey and Dallas County Appraisal District with information from Upper Trinity Study.
Further divided Reach 4, located in the primary study .area into reaches 4A and 48 to account for unique hydrological characteristics.
Further divided Reach 7, located in the secondary study area into reaches 7 and 8 to account for unique hydrological and economic characteristics.
Interest rate of 7.375 percent.
Revised Investment Value
Table D-15 displays the numbers and estimated total values of properties (structures and contents) located within the primary study area after applying the revised hydrology model. A total of 2,550 structures was identified within the SPF limits. As shown, the total flood plain investment within the SPF limit of the primary study area was valued at over $840.0 million based on January 1997 prices .
Dallas Floodway _Extension Reevaluation Report - Page D - 22 ·

••• Table D-15
Total Floodplain Investments by Reach Under Existing Conditions
(January 1997 Prices and Level of Development) (1,000's $)
Slngle..f'amlly Multi-Family Commercial\ Total Reach Residential Residential Industrial Public Vehicles Rall Investment
No. No.
~+~i~~fW.:t~r~tttl~~~\\1t~-1 73 1,768.3 0 0.0 26 22,876.1 3 2,558.B 102 27,203.2 192.9 4,443.B 31,839.9
2 6B 4,339.9 3 476.1 19 1,707.7 0 0.0 90 6,523.7 430.9 0.0 6,954.6
3 247 6,463.4 112 9,234.0 B 199.0 4 36,651 .5 371 52,547.9 2,021.0 0.0 54,568.9
4A 107 2,715.3 6 382.0 6B 34,194.2 0 0.0 181 37,291.5 345.3 7,063.1 44,699.9
48 1,432 34,189.1 0 0.0 61 5,1 02.8 4 177,768.0 1497 217,059.9 0.0 0.0 217,059.9
5 228 6,630.1 0 0.0 66 18,006.2 0 0.0 294 24,636.3 742.8 1,623.0 27,002.1
6 0 0.0 0 0.0 0 0.0 15 458,878.6 15 458,878.6 0 .0 0.0 458,87B.6
Area Total
2,155 $56,106.1 121 $10,092.1 248 $82,086.0 26 $675,856.9 2,550 $824,141 .1 $3,732.9 $13,129.9 $841 ,003.9
% 84.5% 6.7% 4.7% 1.2% 9.7% 9.8% 1.0% 80.4% 100.0% 0.4% 1.6% 100.0%
7 869 75,871 .6 3 1,691 .3 1,982 4,553,940.5 31 $220,968.8 2,885 $4,852,472.2 $5,058.1 NIA $4,857 .530.3
a 6,493 $297,262.5 474 $110,933.0 642 $440,403.4 94 $58,497.6 7,703 $907,096.5 $27,221.7 N/A $934,318.2
Area Total
7,362 $373,134.1 4TT $112,624.3 2,624 $4,994.343. 125 $279,466.4 10,588 $5,759,568.7 $32,279.8 $0.0 $5,791 ,848.5
•1, 69.5% 6.4% 4.5% 1.9% 24.8% 86.2% 1.2% 4.8% 100.0% 0.6% 0.0% 100.0%
Dallas Floodway Extension Reevaluation Report ~ Page D - 23

••
Risk Assessment Assumptions and Values
In the evaluation of levee projects an element of risk is associated with levee failure. Damage calculations and risk assessment require integration of hydrological, hydraulic and economic data. Table D-16 details each element of data used to assess damages with the FDA program.
Calculations of potential flood losses were extracted from the STOMA model and used to approximate property damages by depth in the primary study area and transferred to the HEC- . FDA program to calculate average annual and equivalent annual damages. Hydrological input values included a 40-year period of record for the stream gauges.
The GIS database for the Upper Trinity River was used to estimate potential flood losses in the secondary study area. The estimates were calculated based on water surface elevations with one foot increments. The Dallas Floodway Levee System was constructed to Federal standards. However, failure of the East Levee could occur first since the lowest point is at an elevation of 423', while the West Levee's lowest elevation is 428'.
The hydraulic rating curve was combined with the economic damages to derive the depth-damage curves with a 1 O percent margin of error. Since the risk approach was integrated late into the study effort, primary damages were not disaggregated by category.
Table D-17 summarizes the parameters used to model the effects of each levee by condition and plan of improvement. Geotechnical investigations concluded that the top of the . levee and the potential failure and non failure points were equal. This conclusion was based on the assumption that all levees were constructed to Federal standards.
Dallas Floodway Extension Reevaluation Report - Page D - 24

ldx# 76824 (134200)
392."0
393.7 396.1
398.2 400.3 402.3 404.2
409 .. 8 413.1
419.7
ldx # 99800 (157060)
400.4
402.0 404.6
406.4 408.9
410.7
412.7 418.6
422.2 429.4
ldx # 99800 (157060)
399.9
401.4 404.0
405.7 408.3
410.0
412.1 418.1
421.8 429.1
Tabl.e D-16 Hydrologic, Hydraulic and Economic Parameters
by Reach and Elevation
Sleepy Hollow Area ldx #.85916 White Rock Creek Area (143280)
Reach 1 S01 Reach 2 SD2
$10,710 $1,071 395.7 $0 $0 $15,960 $1,596 398.0 $0 $0
$245,110 $24,511 400.3 $0 $0 $362,347 $36,235 401.4 $16,482 $1,648 $580,205 $58,021 403.6 $130,545 $13,055
$1,542,6TT $154,268 405.7 $346,016 $34,602 $4,216,900 $421,690 407.6. $662,373 .$66,237 $16,255,5TT $1,625,558 413.0 $3,309,568 $330,957 $19,786,841 $1,978,684 416.3 $4,209,974 $420,997
$30135 850 $3 013 585 423.2 $6 579 634 $657 963
Rochester Park Area
Reach 3 S03
$0 $0
$15,231 $1,523
$273,530 $27,353
$1,549,743 $154,974 $7,005,213 $700,521
$.10,297,280 $1,029,728
$14,-523,630 $1,452,363
$33,622,060 $3,362,206
$43,019,190 $4,301,919 $51 197 260 $5119726
Lamar Street Area Jdx # 99800 Oakland Channel Area (157060)
Reach 4A S04 Reach 4B S04
$114,255 $11,426 399.9 $0 $0 $180,642 $18,064 401.4 $0 $0 $826,621 $82,662 404.0 $0 $0
$2,391,595 $239,160 405.7 $2,269 $227 $7,681,784 $768,178 408.3 $210,268 $21,027
$10,487,711 $1,048,771 410.0 $433,059 $43,306 $13,511,957 $1,351,196 412.1 $1,287,991 $128,799 $23,889,189 $2,388,919 418.1 $27,358,890 $2,735,889 $26,680,326 $2,-668,033 421.6 $58,756,050 $5,675,605 $37 636 890 $3 763 689 429.1 $177 768 100 s11ns 810
Dallas Floodway Extension Reevaluation Report - Page D - 25
•

-• Table D-16 Continued Hydrologi_c, Hydraulic and Economic Parameters
by Reach and Elevation
ldx # 101138 Cadillac Heights Area (158420)
Reach 5 S05.
400.4 $26,410 $2,641 402.0 $61,761 $6,176 404.6 $1,468,049 $146.805 406.4 $2,491,248 $249,125 408.9 $4,396,107 $439,611
410.7 . $6,209,722 $620,972 412.7 $8,108,719 $810,872 418.6 $14,237,124 $1,423,712 422.2 $16,934,474 $1,693,447 429.4 $25 568600 $2 556 860
ldx # 108380 Dallas Floodway East Lev.ee
Elev Reach 7 S07
423.0 $ 3,485,628 $348,563 424.0 $3,961,690 $396,169 425.0 $4,299,849 $429,985 426.0 $4,381,467 $438,147 427.0 $4,476,384 $447,638 428.0 $4,591,795 $459,180 429.0 $4,684,571 $468,457 430.0 $4,802,384 $480,238 433.0 $5155,962 $515,596
PMF Values based on total zone value. SD band assumed to be=/· 10%. Numbers in () are DFE original stations and index points Reach 7 and 8 calculated using GIS
ldx # 101138 Central Wastewater (156420) Treatment Plant
Reach 6 S06
400.4 $0 $0 402.0 $0 $0 404.6 $0 $0 406.4 $0 $0 408.9 $0 $0 410.7 $39,432,230 $3,943,223
412.7 $52,375,320 $5,237,532
418.6 $167,461,000 $16,746,100
422.2 $286,604,600 $28,660,460
429.4 $434,133,000 $43 413,300
ldx # 118000 Dallas Floodway West Levee
-· Elev Reach 8 S08
427.0 $618,269 $61,827
428.0 $683,911 $68,391
429.0 .$732,957 $73,296 430.0 $TT7,231 $TT,723
431.0 $806,637 $80,664
432.0 $842,322 $84,232
433.0 $886,892 $88,689
434.0 $924,980 $92,498
438.0 $1,034,088 $103 409
Dallas Floodway Extension Reevaluation Reporl - Page D - 26

Levee
Rochester Park Treatment Plant
Lamar4A Lamar4B Cadillac Heights
East Levee West Levee
Table D-17 Summary of Levee Assumptions
by Condition and Alternative
Existing (Pre '91) Current (Post '91) COW+SPF+SPF NED
Chain of Wetlands
Top PFP PNP Top PFP PNP Top PFP PNP
415.00 415.00 413.00 421.02 421.02 421.02 413.40 413.40 412.40 415.00 415.00 415.00 415.00 415.00 415.00
421.02 421.02 421.02
421.85 421.85 421.85 423.00 423.00 423.00 423.00 423.00 423.00 425.20 425.20 425.20 428.00 428.00 428.00 428.00 428.00 428.00 428.00 428 .00 428.00
Dallas Floodway Extension Reevaluation Report - Page D - 27
··•
COW+SPF+100-Yr
Top PFP PNP 421.02 421.02 421.02
415.00 415.00 415.00
421.02 421.02 421.02
418.00 418.00 418.00
425.20 425.20 425.20 428.00 428.00 428.00

•
•
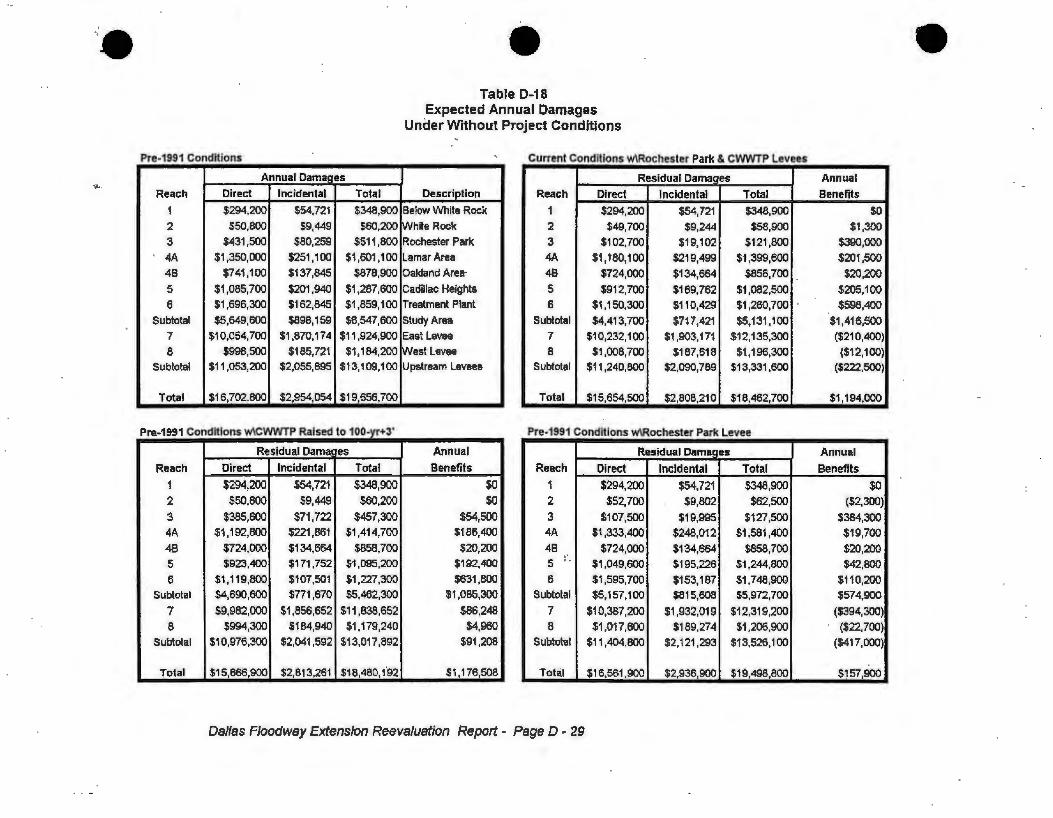
Expected Annual Damages
Expected annual damages were tabulated for the final plan fonnulation phase based on the aforementioned assumptions. The NexGen FDA program was utilized to perfonn these calculations. Incidental damages (comprising transportation, communications, and utilities facilities, and public health and relief operations) were added to the results to obtain the total expected annual damages by reach for the primary and secondary study areas.
Damages for two without-project conditions were calculated. The existing conditions model assumes a pre-1991 scenario (prior to construction of the Rochester Park and CWWTP levees). The current conditions model assumes that both local levees are in-place. The expected annual damages are shown in table D-18
Under pre~1991 conditions the annual damages were estimated at $19.7 million. Under current conditions the annual damages would be about $18.5 million. Raising the CWWTP levee reduced damages by $1.1 million and construction of the Rochester levee about $.2 million. As shown, these levee improvements produced a negative impact in the secondary study area by increasing the expected annual damages to the area by $222,000. This equates to a 2 percent increase compared to damages before construction. In either case the level of protection in the secondary study area remained above the .25 percent ACE (400-year} flood event.
Economic Analysis of Local Levees
An evaluation of the local levees was conducted to detennine the hydraulic impacts to the primary and secondary study areas and the economic effectiveness of the projects. The projects were evaluated assuming a SO-year project life and an interest rate of 7.38 percent. The result of the economic analysis is shown in table D-19. Total benefits include floodplain user benefits as described in a later section.
From an economic standpoint, construction of the Rochester Park levee was not feasible. The $574,900 in annual benefits to the primary study area were significantly reduced by inducements of $417,000 in the secondary study area. Initial evaluation of this project only included the primary study area which showed a benefit-to-cost ratio of .6 to 1.0. After Inclusion of the affects on the Floodway Levee System the ratio fell to 0.2 to 1.0.
The second construction phase of the local levees raised the level of protection for the CWWTP from a 2 percent ACE (SO-year) event to a 1 percent ACE (1 OO-year+3') event. The design of the levee raise also included mitigation swales that offset some of the negative impacts to the Floodway Levee System. The benefit to cost ratio was 1.02 to 1.0. As a combined project the levees produce a BC ratio of 0.55 to 1.0.
The inclusion of about $400,000 in floodplain user benefits would improve the benefit cost ratio for the Rochester levee, but it would remain below unity. Intangible benefits derived from the improvements include a significant reduction in the potential for loss of life and mental and financial stress to over 600 residents in the Rochester Park area. Additional benefits from the treatment plant levee raise are. generated from the financial costs incurred from environmental fines. These fines are levied by the Environmental Protection Agency when a levee is not constructed to the 1 percent ACE (100-year) flood event.
Dallas F/oodway Extension Reevaluation Report - Page D - 28
Pre-1991 Conditions
Annual Damaoes
Reach Direct Incidental Total
1 $294,200 $54,721 $348,900
2 $50,800 $9,449 $60,200
3 $431,500 $80,259 $511,800
4A $1,350,000 $251,100 $1,601,100
4B $741,100 $137,845 $878,900
5 $1,085,700 $201,940 $1,287,600
6 $1,696,300 $162,845 $1,859,100
Subtotal $5,649,600 $898,159 $6,547,600
7 $10,054,700 $1,870,174 $11 ,924,900
8 $998,500 $185,721 $1,184,200 Subtotal $11,053,200 $2,055,895 $13,109,100
Total $16,702,800 $2,954,054 $19,656,700
Pre-1991 Conditions W\CWWTP Raised to 100-vr+3'
Residual Dama, es
Reach Direct Incidental Total
1 $294,200 $54,721 $348,900
2 $50,800 $9,449 $60,200
3 $385,600 $71,722 $457,300 4A $1,192,800 $221,861 $1,414,700
4B $724,000 $134,664 $858,700
5 $923,400 $171,752 $1,095,200
6 $1,119,800 $107,501 $1,227,300
Subtotal $4,690,600 $771,670 $5,462,300
7 $9,982,000 $1,856,652 $11,838,652
8 $994,300 $184,940 $1,179,240
Subtotal $10,976,300 $2,041,592 $13,017,892
Total $15,666,900 $2,813,261 $18,480,192
Table 0-18 Expected Annual Damages
Under Without Project Conditions
Current Conditions W\Rochester Park & CWWTP Levees
Residual Damaaes Description Reach Direct Incidental Total
Below While Rock 1 $294,200 $54,721 $348,900 !while Rock 2 $49,700 $9,244 $58,900 Rochester Park 3 $102,700 $19,102 $121,800 Lamar Area 4A $1,180,100 $219,499 $1,399,600 Oakland Area· 4B $724,000 $134,664 $858,700 Cadillac Heights 5 $912,700 $169,762 $1,082,500 Treatment Plant 6 $1,150,300 $110,429 $1,260,700 Study Area Subtotal $4,413,700 $717,421 $5,131,100 East Levee 7 $10,232,100 $1,903,171 $12,135,300 West Levee 8 $1,008,700 $187,618 $1,196,300 Upstream Levees Subtotal $11,240,800 $2,090,789 $13,331,600
Total $15,654,500 $2,808,210 $18,462,700
Pre-1991 Conditions W\Rochester Park Levee
Annual Residual Dama, es Benefits Reach Direct Incidental Total
$0 1 $294,200 $54,721 $348,900 $0 2 $52,700 $9,802 $62,500
$54,500 3 $107,500 $19,995 $127,500 $186,400 4A $1,333,400 $248,012 $1,581,400
$20,200 4B $724,000 $134,664 $858,700 $192,400 5
,. $1,049,600 $195,226 $1,244,800
$631,800 6 $1,595,700 $153,187 $1,748,900 $1,085,300 Subtotal $5,157,100 $815,608 $5,972,700
$86,248 7 $10,387,200 $1,932,019 $12,319,200 $4,960 8 $1,017,600 $189,274 $1,206,900
$91,208 Subtotal $11 ,404,800 $2,121,293 $13,526,100
$1,176,508 Total $16,561,900 $2,936,900 $19,498,800
Dallas Floodway Extension Reevaluation Report - Page D - 29
Annual
Benefits
$0
$1,300
$390,000
$201,500
$20,200
$205,100
$598,400
$1,416,500 ($210,400}
($12,100) ($222,500)
$1,194,000
Annual
Benefits
$0
($2,300)
$384,300 $19;700
$20,200 $42,800
$110,200 $574,900
($394,300) ($22,700)
($417,000)
$157,900

•
Table D-19 Economic Analysis of Local Levees
INVESTMENT ESTIMATED FIRST COST
ANNUAL INTEREST RA TE PROJECT LIFE (years)
CONSTRUCTION PERIOD (months) COMPOUND INTEREST FACTOR
CAPITAL RECOVERY FACTOR INTEREST DURING CONSTRUCTION
INVESTMENT COST
ANNUAL CHARGES INTEREST
AMORTIZATION
OPERATION/MAINTENANCE ($/year) REPLACEMENTS
fl:iri filWAm :: ANNUAL BE
$12,738,000 $14,220,000 $26,958,000
0.0738 0.0738 0.0738 50 50 50 24 24 24
25.77523 25.77523 25.77523
0.0759135 0.0759135 0.0759135
$0 $0 $0
12 738 000 ·14 220 000 26 958 000
$939.428 $1,048,725 $1,988,153
$27,559 $30,765 $58,324 $50,000 $75,000 $125,000
$0 $0 $0
INUNDATION REDUCTION 085,300 $1,416,500
EXISTING DALLAS FLOODWAY $91,208 ($222,500)
}ffilntEaitisilffi.-®ii~filif ,,: :iff.i il8.iI HEt{]Vjfl:~'ii'!ndi1
INVESTIGATED NONSTRUCTURAL PLANS 1996-1997
An additional aggregated evaluation of the acquisition and removal of frequently flooded structures was conducted for the primary study area. This generalized approach was used to determine feasibility of a 1 percent chance exceedance flood buyout plan for the entire study area. The evaluation used finished floor elevations and included the 50 to 1 percent ACE flood frequency zones. Eligibility is dependant on economic criteria and flood frequency. The results of this analysis are shown in table D-20.
As shown, no structures were identified in the 50 percent chance exceedance flood zone. In the 20 percent chance exceedance flood frequency zone 13 structures were identified. The first cost was estimated at aboLit $13.0 million with a BCR of 0.8 to 1.0. Both plans result in negative net benefits. Although these negative benefits could be offset with the incorporation of a recreation plan, the identified structures are scattered throughout the floodplain and a recreation plan could not be designed to meet the study area needs. Implementation of this plan would not significantly reduce damages in the study area.
Dallas Floodway Extension Reevaf uation Report - Page D - 30

. . ,
The evaluation of the 1 O percent and 1 percent ACE flood zones also resulted in negative net benefits. Development of an economically feasible plan would require a recreation plan expected to increase the first cost of the plan altemattve by more than 50 percent while Jhe maximum annual benefits would be limited to the total flood control benefits claimed. Further, removal of the 1 percent ACE flood zone would eliminate about 20 percent of the study area property. The majority of which are of commercial use. This plan could have a significant negative economic impact on the community. Non-structural measures may be more beneficial on a last added basis.
Flood Number Frequency of
Zone Structures
0-2 0
0-5 13
0-10 37
0-100 508
Table D-20 Investigated Evacuation Plans
(October 1996 prices, 7.66 percent interest rate) (In thousands of dollars)
Total First Annual Annual Benefit to Costs Costs Benefits Cost
Ratio
$0.0 $0.0 $0.0 0.0
$13,000.0 $1,075.2 $880.0 0.8
$24,000.3 $2,005.0 $1 ,230.0 0.6
$60,000.3 $125.1 $1,275.0 0.2
Annual Net Benefits
$0.0
($ 195.2)
($ 775.0)
($4,499.0)
Residual expected annual damages and the resulting annual benefits for each are presented in table D-21 by reach. The plans include the:
0
0
0
0
0
0
National Economic Development Plan
Chain of Wetlands Only
Chain of Wetlands with SPF Lamar and 100-Year Cadillac Heights Levees
Chain of Wetlands with SPF Lamar and SPF Cadillac Heights Levees
Chain of Wetlands with SPF Lamar Levee
Chain of Wetlands with SPF Cadillac Heights Levee
Benefit-to-Cost Analysis
A comparison of the results of the economic analysis shows the 1200' BW swale provides the greatest net benefits and remains to. be the NED plan. Among the combination chain of wetland alternatives, construction of the chain of wetlands along with SPF Lamar Levee would provide the greatest net benefits. The ranking of each alternative is shown in table D-22 below. A complete economic analysis of the alternatives is shown in table 0-23.
Dallas Floodway Extension Reevaluation Report - Page D - 31
•••• . ,

Table 0-21 Expected Annual Damages and Benefits
(January 1997 prices, 7.376¾ Interest. 50-year period of analysis) Chain of Wetlands Onl
~~!!!!J!!!!~~~l'-!'!'!~~~!!!!.!!!'
1 $209.600 $38,986 $248,600 $100,300 $269,700 $50,164 $319,900 $29,000
2 $20,500 $3,813 $24,300 $35,900 2 $29,800 $5,543 $35,300 $24,900
3 $32,300 $6,008 $38,300 $473,500 3 $47,400 $8,816 $56,200 $455,600
4A $524,500 $97,557 $622,100 $979,000 4A $631 ,200 $117,403 $748,600 $852,500
48 $306,600 $57,028 $363,600 $515,300 4B $420,300 $78,176 $498,500 $380,400 5 $384,400 $71,498 $455,900 $831,700 5 $459,200 $85,411 $544,600 $743,000
6 $361,100 $34,666 $395,800 $1,463,300 6 $538,400 $51,686 $590,100 $1,269,000 Subtotal $1 ,839,000 . $309,555 $2,148,600 $4,399,000 Subtotal $2,396,000 $397,200 $2,793,200 .$3,754,400
7 $2,544,900 $473,351 $3,018,300 $8,906,600 7 $4,449,800 $827,663 $5,277,500 $6,647,400
8 $433,300 $80,594 $513,900 $670,300 8 $602,700 $112,102 $714,800 $469,400
Subtotal $2,978,200 $553,945 $3,532,200 $9,576,900 Subtotal $5,052,500 $939,765 $5,992,300 $7,116,800
Chain of Wetlands w\SPF Lamar Stree.t Levee
{~iiiff~~=::i<t:-~~=· -~ ~ail' .... --·- -- ------ -·
$269,700 $50,164 $319,900 $29,000 $269,700 $50,164 $319,900 $29,000
2 $27,700 $5,152 $32,900 $27,300 2 $27,700 $5,152 $32,900 $27,300
3 $47,400 $8,816 $56,200 $455,600 3 $15,200 $2,827 $18,000 $493,800
4A $631 ,200 $117,403 $748,600 $852,500 4A $17,100 $3,181 $20,300 $1,580,800
4B $420,300 $78,176 $498,500 $380,400 48 $132,200 $24,589 $156,800 $722,1 00 5 $9,800 $1,823 $11,600 $1,276,000 5 $467,400 $86,936 $554,300 $733,300
6 $538,400 $51,686 $590,100 $1,269,000 6 $574,200 $55,123 $629,300 $1 ,229,800
Subtotal $1 ,944,500 $313,221 $2,257,800 $4,289,800 Subtotal $1,503,500 $227,973 $1,731,500 $4,816,100
7 $4,449,800 $827,663 $5,277,463 $6,617,437 7 $3,158,800 $587,537 $3,746,300 $8,178,600
8 $602,700 $112,102 $714,802 $469,398 8 $671,000 $124,806 $795,800 $388,400
Subtotal $5,052,500 $939,765 $5,992,265 $7,116,835 Subtotal $3,829,800 $712,343 $4,542,100 $8,567,000
Dallas F/oodway Extension Reevaluation Report - Page D - 32

1
2 3 4A
48
5
6
Subtotal
7 8
Subtotal
Table 0.21 Continued Expected Annual Damages and Benefits
(January 1997 prices, 7.315¾ Interest, 50-year period of analysis) Chain or Wetlands w\SPF Lamar & 100-Year Cadlllac Levees
,.;• • . •-.... -.----------- ·
$269,700
$29,800
$16,600
$18,400 $132,200
$13,800
$688,900
$1,169,400
$4,737,000 $873,9GO
$5,610,900
$50,164
$5,543
$3,088
$3,422
$24,589
$2,567
$66,134
$155,507
$881,082 $162,545
$1,043,627
$319,900
$35,300 $19,700
$21,800 $156,800
$16,400
$755,000
$1 ,324,900
$5,618,082 $1,036,445
$6,654,527
$29,000 1 $24,900 2
$492,1QO 3 $1,579,300 4A
$722,100 4B $1,271,200 5 $1,104,100 6 $5,222,700 Subtotal
$6,306,818 7 $147,755 8
$6,454,573 Subtotal
Table DR22 Alternative Rankings
Based on Net Benefits
$269,700
$27,700 $15,200
$17,100
$132,200 $82,700
$574,200
$1,118,800
$3,158,800 $671,000
$3,829,800
(January 1997 prices, 7.376¾ Inter-est, 60-year period of analysis)
Rank Alternative
1 National Economic Development Plan
2 Chain of Wetlands with SPF Lamar
· 3 Chain of Wetlands+SPF Lamar & 100.Year Cadillac Levees
4 Chain .of Wetlands
5 Chain of Wetlands with SPF Cadillac Heiahts Levee
6 Chain of Wetlands+SPF Lamar & SPF Cadillac Levees
Dallas Floodway Extension Reevaluation Report • Page D - 33
i
$50,164
$5,152 $2,827
$3,181
$24,589
$15,382
$55,123
$156,419
$587,537 $124,806
$712,343
Net Benefits
$7,446,300
$6,008,300
$5,134,600
$4,661,300
$4,057,500
$2,929,600
$319,900
$32,900 $18,000
$20,300 . $156,800
$98,100
$629,300
$1,275,300
$3,746,300 $795,800
$4,542,100
$29,000
$27,300 $493,800
$1,580,800
$722,100 $1,189,500
$1,229,800
$5,272,300
$8,178,600 $388,400
$8,567,000

Project Alternatives Include
ESTIMATED FIRST COST
ANNUAL INTEREST RATE
PROJECT LIFE (years)
CONSTRUCTION PERIOD (months)
COMPOUND INTEREST FACTOR
CAPITAL RECOVERY FACTOR
INTEREST DURING CONSTRUCTION
COST OF LOCAL LEVEES
INVESTMENT COST
INTEREST
AMORTIZATION
OPERATION/MAINTENANCE ($/year)
REPLACEMENTS p-.. ~~- ~,!:
!NUNDATION REDUCTION
EXISTING DALLAS FLOODWA
-Jr:~ .. , . . »
Table D-23 · Economic Analysis of Flood Control Benefits
(January 1997 prices, 7.375¾ Interest, 50-year period of analysis)
Chain Of Chain Of Chain Of Wetlands Wetlands
Authorized Auth_orlzed 1200· Swale Wetlands SPF Levees & SPF Lamar
(original rate) (FY 97 rate)
$194,108,302 $194,108,302 $50,022,200 $48,889,300 $76,780,800 $64,520,500 0.0325 0.0738 0.0738 0.0738 0.0738 0.0738
100 50 50 50 50 50 36 36 36 24 36 24
37.75981 40.15579 40.15579 2s.n523 40.15579 2s.n523 0.0339 0.0759 0.0759 0.0759 0.0759 0.0759
$9,617,320 $22,274,403 $5,740,170 $3,649,820 $8,810,785 $4,816,764
$26,958,000 $26,958,000 $23,120,000 $23,120,000 $203,725,622 $216,382,705 $82,720,370 $79,497,120 $108,711,585 $92,457,264
$6,621,083 $15,958,225 $6,100,627 $5,862,913 $8,017.479 $6,818,723 $281,854 $468,144 $178,966 $171,992 $235,198 $200,031 $250,000 $250,000 $250,000 $175,000 $495,000 $356,000
$0 $0 $0 $0 ' "' '-;..
$5,222,700 $4,816,100 6,800 $6,454,600 $8,567000
"'·~ I ❖-•· • .. :-;~: . _. ; .. B.11 =· ··.:,.
Dallas Floodway Extension Reevaluation Report - Page D - 34
..
••••
Chain Of Chain Of Wetlands Wetlands & SPF\100
&SPF Levees Cadillac
$61,149,600 $67,225,000 0.0738 0.0738
50 50
24 24
2s.ns23 2s.ns23 0.0759 0.0759
$4,565,110 $5,018,668
$26,958,000 $26,958,000 $92,672,710 $99,201,668
$6,834,612 $7,316,123 $200,497 $214,623 $314,000 $370,000
$0
$4,289,800 $4,245,800 $7,116,800 $8,789,500
}~llflilI --;.:(,.(..« :-:.ci.: 9'.- ~i-_ ,_: .... .: . ~

Incremental Cost Analysis
Although all of the structural plans are feasible, an incremental analysis was done to delennine the added benefits for the addition of each portion of the plan. The results of adding SPF levees to the Chain of Wetlands plan are presented in table D-24. Costs do not include the cost of the local levees. The incremental analysis reveals that the addition of the SPF Lamar levee is incrementally justified. However, the addition of the SPF Cadillac Heights Levee as a first or a last-added piece is not incrementally justified. This addition is not justified as a first-
. added piece due because the additional annual costs are not offset by inundation reduction benefits to the primary study area. The addition is not justified as a last-added due to the $2.1 million decrease in benefits to the secondary study area as well as the disproportionate amount of be~efits to cost in the primary study area.
The results of adding the 1 percent ACE (100-year) Cadi1lac Heights levee to the Chain of Wetlands plan are presented in table D-23. The analysis shows that the addition is incrementally justified with net benefits of $96,600. The analysis shows that construction of the 1 percent ACE (100-year) Cadillac levee will not reduce the benefits to the secondary study area derived from the chain of wetlands and SPF Lamar Levee.
Dallas Floodway Extension Reevaluation Report - Page D - 35

PROJECT COSTS
Estimated First Cosl
Annual Interest Rate Project life (years)
Construction Period (months)
Compound Interest Factor
Capital Recovery Factor
Interest During Construction
Investment Cost
ANNUALIZED COSTS
Interest
Amortization
O&M ($/year)
Replacements
TOTAL ANN AL
ANNUAL BENEFITS
Inundation Reduction
Existing Dallas Floodway
TOTAL BENEFITS
BENEFIT/COST RATIO
NET ANNUAL BENEFITS
Table D-24 Incremental Analysis of
Chain of Wetlands and
SPF Lamar and SPF Cadillac Heights Levees 'Janua 1997 rices, 7.315¾ Interest, 60- ar erlod of anal Is
$48,889,300 $61 ,149,593 $12,260,293 $64,520,500 $15,631,200 0.073750 0.07375 0.07375 0.073750 0.073750
50 50 50 50 50 24 24 24 24 24
25.77523 25.77523 25.77523 25.77523 25.77523 0.0759135 0.0759135 0.0759135 0.0759135 0.0759135 $3,649,820 $4,565,110 $915,290 $4,816,764 $1,166,944
52 539120 65 714 703 13175 583 337264 $16798144
$3,874,760 $4,846,459 $971,699 $5,1 13,623 $1 ,238,863 $1 13,668 $142,174 $28,505 $150,011 $36,343
$50,000 $189,000 $139,000 $231 ,000 $181 ,000 $0 $0 $0 $0 $0
$4038428 $5.177 633 1 139 205 1456206
S2,n7,900 $3,263,300 $535,400 $3,789,600 $1,061 ,700
$7,339,300 $7,339,300 $0 $8,789,500 $1 ,450,200
$10,067,200 $10;602,600 $535,400 $12,579,100 $2,511 ,900
2.49 2.05 0.47 2.29 1.72
$6,028,800 $5,425,000 ($603,800 $7,084,500 $1 ,055,700
Dallas Floodway Extension Reevaluation Report - Page D - 36
$76,780,782 $12,260,282
0.073750 0.073750
50 50 36 36
40.15579 40.15579
0.0759135 0.0759135
$8,810,783 $3,994,019
591 565 $16 254 301
$6,312,378 $1 ,198,755
$185,177 $35,166
$370,000 $139,000
$0 $0
867555 1 372921
$4,196,200 $406,600
$6,677,100 ($2,112,400)
$10,873 300 $1 ,705,800
. 1.58 -1. 4
$4,005,700 $3,078,700)

Table D-25 Incremental Analysis of Chain of Wetlands and
SPF Lamar and 100-Year Cadillac Heights Levees
PROJECT COSTS
Estimated First Cost $48,889,300 $64,520,500 $15,631 ,200 Annual Interest Rate 0.073750 0.073750 0.073750 Project Life (years) 50 50 50 Construction Period (months) 24 24 24 Compound Interest Factor 25.77523 25.77523 25.77523 Capital Recovery Factor 0.0759135 0.0759135 0.0759135 Interest During Construction $3,649,820 $4,816,764 $1,166,944
I vestment Cost 52 539 120 69 337 264 $16 798144
ANNUALIZED COSTS
Interest $3,874,760 $5,113,623 $1,238,863 Amortization $113,668 $150,011 $36,343 O&M ($/year) $50,000 $231,000 $181,000 Replacements $0 $0 $0 TOTAL ANNUAL CHARGES $4,038,428 $5,494,634 $1,456,206
ANNUAL BENEFITS
Inundation Reduction $2,727,900 $3,789,600 $1,061,700 Existing Dallas Floodway $7,339,300 $8,789,500 $1,450,200 TOT AL BENEFITS $10,067,200 $12,579,100 $2,511,900
BENEFIT COST RATIO 2.49 2.29 1.72
ANNUAL NET BENEFITS $6,028,800 $7,084,500 $1,055,700
Dallas Floodway Extension Reevaluation Report - Page D - 37
·•
$67,225,000 $2,704,500 0.073750 0.073750
50 50 24 24
25.77523 25.77523 0.0759135 0.0759135
$5,018,668 $201,904 $72 243 668 2 906 404 .
$5,327,970 $214,347 $156,299 $6,288 $370,000 $139,000
$0 $0 $5,854,270 $359,635
$4,245,800 $456,200 $8,789,500 $0
$13,035,300 $456,200
2.23 1.27
$7,181,000 $96,600

Cadillac Heights Nonstructural Analysis
An evaluation of reach 5 was conducted with a focus on the feasibility of nonstructural plans. The results of the evaluation are shown in table D-26. In plans 2 and 3 nonstructural measures are evaluated on a last added basis. Plan 1 assumes current hydrologic and economic conditions with a total of 235 structures identified within the 1 percent ACE flood zone. As shown, 6 structures were identified in the 50 percent chance exceedance flood· zone, 9 structures in the 20 percent ACE flood zone and 17 structures within the 10 percent ACE flood zone. A permanent evacuation plan would be feasible up to the 1 O percent ACE event. Within the 4 percent ACE flood zone a buyout of 117 structures would yield a benefit to cost ratio of 0.8 to 1.0 with ($216,800) in net benefits. The economic cost to permanently evacuate the 1 percent ACE flood zone is estimated at almost $24.0 million or $1.9 million annually. This plan generates · estimated benefits of about $677,000 which results in a BCR of 0.4 to 1.0. As shown, implementation of Plan 1 is only feasible up through the 1 O percent ACE flood zone which a BCR of 1.4 to 1.0.
In Plan 2 construction of the chain of wetlands and Lamar Street is assumed. Following construction, about 160 structures would remain within the 1 percent ACE flood zone. The economic cost to permanently evacuate the area is estimated at almost $16.0 million or $1 .3 million annually. Comparatively, benefits are estimated at about $404,900, resulting in a BCR of 0.3 to 1.0. As shown in table D-26, implementation of Plan 2 is feasible up through the 4 percent ACE flood zone which has a BCR of 1.1 to 1 .0 and would evacuate 24 of the structures remaining in the 1 percent ACE flood zone. ·
Plan 3 evaluates the feasibility of permanent evacuation to remaining structures following construction of the chain of wetlands, the Lamar Street levee, and a 1 percent ACE Cadillac Heights levee. The plan would remove over 85 percent of the threatened structures from the 1 percent ACE flood frequency zone. Under this scenario 32 structures would remain in the 1 percent ACE flood plain. The remaining structures are located near Moore Park with several located southwest of the CWWTP. The lowest structures begin to receive damages with less than a 4 percent ACE flood event. The analysis for the purchase of these structures results in a BCR below unity for each flood zone. Therefore, as a last added measure, Plan 3 is not economically feasible. ·
Dallas Floodway Extension Reevaluation Report - Page D - 38

Table 0-26 Analysis of Cadillac Heights (Reach 5} Permanent Evacuation
(January 1997 prices, 7.376'¼ interest, 50-year period of analysis}
# of Strs. · Annual Costs
Annual Benefits Eco. Costs Fin. Costs Total Costs
BC Ratio Net Benefits 1:.:: ..... ~. : . ,::{, .. ,4-,, ·-<"-'~"" L~: ...... ~ .;::··. ... J&! # of Strs. Annual Costs Annual Benefits Eco. Costs Fin. Costs Total Costs BC Ratio
# of Strs. Annual Costs Annual Benefits Eco. Costs Fin. Costs Total Costs
BC Ratio
# of Strs. Annual Costs
Annual Benefits Eco. Costs
Fin. Costs Total Costs
BC Ratio Net Benefits
Pta·n 2 COW+SPF Lamar Levee
& Gadil/ac Heights · Buyout
(fl ilii1ifiiiii 6 0
$146,500 N\A. $538,900 N\A.
$1,810,100 N\A. $372,100 N\A.
$2,182,200 $0 3.7 N\A.
$392,400 N\A.
'1%:llit 'l'@.'f'1;:~:>.:f:W'@"Zi~i'[f.ffl"~<'">P.1jim"'..<':
iMI@ltl~iMJi~ijlm-~~ 9 3
$362,900 $79,100 $594,600 $194,100
$4,502,200 $977,500 $688,300 $198,500
$5,190,500 $1,176,000
1.6 2.5
17 7 $451,100 $165,300
$638,600 $179,700 $5,577,300 $2,041,200 $1,131,700 $421,900 $6,709,000 $2,463,100
1.4 2.1
117 24 $946,300 $334,900 $729,500 $365,900
$11 ,447,600 $4,105,000 $3,143,800 $947,700
$14,591,400 $5,052,700
0.8 1.1 ($216,800) $31,000
Plan 3 COW+SPF Lamar &
Ca.di/lac Levees & Moore Park Buyout
N\A. N\.A. N\.A. N\.A.
N\A. N\A.
N\A. N\A. N\.A. N\.A.
N\.A.
N\A. N\A. N\.A. N\A.
N\.A.
0
$0
0
$0
0
$0
3 $5,332 $1,200
$57,200 -$66,000
$123,200 0.23
($4,132)
Dallas F/oodway Extension Reevaluation Report - Page D - 39

• # of Strs. Annual Costs Annual Benefits Eco. Costs Fin. Costs Total Costs BC Ratio
Table 0-26 continued
Plan 1 COW+SPF Lamar Levee COW+SPF Lamar &
Cadillac Heights & Cadillac Heights Cadillac Levees & Moore Buyout Buyout Park Buyout
J§_~d~Alon~- ,,,, (!!,u,r.guf l~frem'!.nt 9ntr-J [BtJ¥_.'!ut l_n,cr~mer,t Qr].!KJ., m~ia111a1w i1~a&ir&t~ IIIY~~~~
164 126 17 $1,264,346 $823,600 $60,529
$746,500 $401,100 $4,700 $15,270,300 $9,887,000 $702,500 $3,608,000 $2,964,600 $374,000
$18,878,300 $12,851,600 $1,076,500 0.59 0.5 0.08
# of Strs. 235 160 32 $107,724
$5,900 $1,244,800
$704,000 $1,948,800
0.05 $101 ,824
Annual Costs $1,942,410 $1,311 ,230 Annual Benefits $752,700 $404,943 Eco. Costs $23,512,600 $15,868,000 Fin. Costs $5,170,000 $3,520,000 Total Costs $28,682,600 $19,388,000 BC Ratio 0.39 0.3 Net Benefits $1,189,710 $906,28
ECONOMIC ANALYSIS UNDER WRDA '96
General
The structural plans previously evaluated were revised to reflect project conditions under the authority of WRDA'96. Under this authority portions of the costs to construct the local levees would be credited to the local sponsor. Therefore, the baseline conditions of the analysis of various plans were revised. Table D-27 shows the expected annual damages for the NED and Chain of Wetlands plans along with improvement to the CWWTP levee. The remaining plans include all the costs for the CWWTP and the compatible portion of the Rochester Park Levee.
· All the benefits associated with the Rochester levee are included because the levee would be an integral part of the Lamar Street levee design and therefore cannot be separated.
Floodplain User Benefits
Implementation of either plan would produce an annual savings in administration of the flood insurance program operating expenses. The current average operating cost per policy is $131 .00. The annual benefit that would accrue to each plan Is determined by multiplying the number of structures removed from the 1 percent ACE flood frequency zone by the operating cost per policy. Under without project (pre-1991) conditions 794 structures were identified within the 1 percent ACE flood zone. The amount of the benefit was determined by subtracting the number of structures remaining in the 1 percent ACE zone from the number assuming pre-1991 conditions. The total estimated flood insurance savings attributable to each alternative are shown in table D-28.
Dallas F/oodway Extension Reevaluation Report - Page D - 40
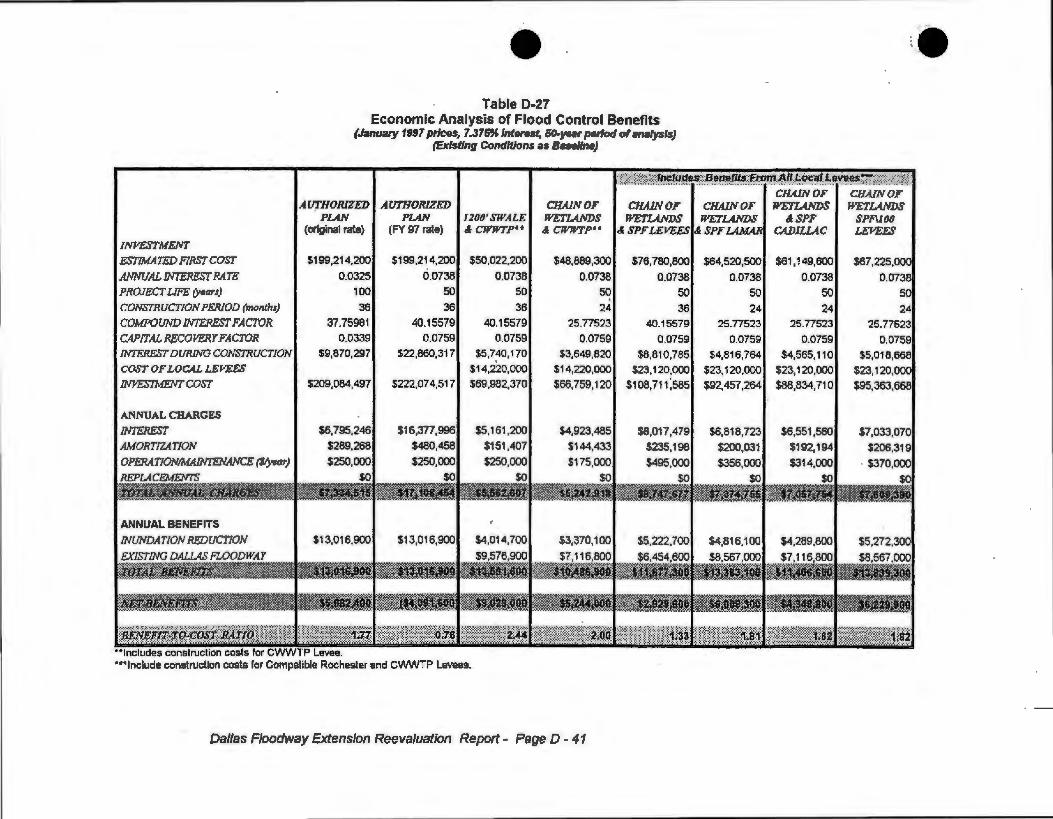
• Table D-27
Economic Analysis of Flood Control Benefits (January 1997 prices, 7.375¾ Interest. 50-year period of analysis)
(Existing Conditions as Basellne)
:•·:·· ,,
~ ~-1MMf.t!I~i~r!fti~~~!!~Y!)'.im; .· ' '·
INVESTMENT ESTIMATED FIRST COST
ANNUAL INTEREST RATE PROJECT UFE (years)
CONSTRUCTION PERIOD (months) COMPOUND INTEREST FACTOR CAPITAL ~COVERY FACTOR INTEREST DURING CONSTRUCTION COST OF LOCU. LEVEES lNJ/ESTMENr COST
ANNUAL CHARGES
INrEREST AMORITlA.TION OPERATION/MAINTENANCE (Jlyeqr)
AUTHORIZED AlnHORJZED PLAN PLAN 1200'SWALE
( original rate) (FY 97 rate) & CWWTP••
$199,214,200 $199,214,200 $50,022,200
0.0325 0.0738 0.0738 100 50 50
36 36 36 37.75981 40.15579 40.15579
0.0339 0.0759 0.0759 $9,870,297 $22,860,317 $5,7~0,170
$14,220,000 $209,084,497 $222,074,517 $69,982,370
$6,795,246 $16,377,996 $5,161,200 $289,268 $480,458
$250,000 $250,000
$0 . "' $0
• • ••• •✓--~ -_: . • •
$13,016,900
$151 ,407 $250,000
$0
••includes construction costs for CWVvTP Levee . ... Include construction costs for Compatible Rochester and CWVvTP Levees.
CHAINOF CHAJNOF CHA.JNOF CHAINOF WETLANDS
WETLANDS WETUNDS WETLANDS &SPF cl CWWTP" &SPF LEVEES &SPF CADILU.C
$48,889,300 $76,780,800 $64,520,500 $61,149,600
0.0738 0.0738 0.0738 0.0738 50 50 50 50
' 24 36 24 24 25,77523 40.15579 25.77523 25.77523
0.0759 0 .0759 0.0759 0.0759 $3,649,820 $8,810,785 $4,816,764 $4,565,110
$14,220,000 $23,120,000 $23, 120,000 $23,120,000 $66,759,120 s1oa,111 ;sas $92,457,264 $88,834,710
$4,923,485 $8,017,479 $6,818,723 $6,551,560 $144,433 $235,1 98 $200,031 $192,194 $175,000 $495,000 $356,000 $314,000
$0 0 $0 $0 -~~:,:, .
-~:d l~; .. .-.-.,:ww,;,
Dallas Floodway Extension Reevaluation Reporl - Page D - 41
CHAJNOF WETLANDS
SPFlI00 LEVEES
$67,225,000
0,0738
50 24
25.77523 0.0759
$5,018,668
$23,120,000 $95,363,668
$7,033,070 $206,319
· $370,000 $0

••
••
Table D·28 Flood Insurance Savings
By Alternative
Investigated Structures No Longer at Plan 1 Percent ACE Flood Risk
NED+CWWTP 403 COW+SPF Lamar & Cadillac Levees 719
COW+SPF Lamar\1% Cadillac Levees 719 cow 511
Rochester Levee 276 COW+CWWTP 233
Recreation Benefits
. Benefrt.s for the recreation plan developed for the final array of alternatives were derived using the unit day value method. This method of benefit calculation was selected based on the criteria set forth in ER 1105-2-100. Specifically, the regional model available is more than seven years old, annual visits are not expected to exceed 750,000, and recreation costs are not expected to exceed 25 percent of the total project costs.
A score of 40 points was assessed for the plan based on the professional judgement of both Federal and local recreation planners. Applying the Planning Guidance Memorandum, a score of 40 points converts to $5.00 per visitor day, at April 1998 price levels, for quantifiable features. The complete recreation master plan would provide 50 miles of trails and 7 picnic pavilions. However, benefits were derived based on those portions located on project lands. Specifically, 31 .5 miles of trails and 34 picnic type sites are proposed. Refer to Appendix I for complete details on the recreation plan. Table D-29 details the benefits calculated for the recreation plan by feature. The participation rate in the Dallas-Fort Worth area for multipurpose trails and pavilions exceeds the facility capacity. Therefore, it is ·assumed that participation equals capacity and a value of one was applied. Annual visitors per miles of equestrian and nature trails were adjusted by the participation rate for the local area.
Hike\Bike Trail
Equestrian Trail
Nature Trall
Pavilions
Picnic Tables
Table D-29 Dallas Floodway Extension Recreation Benefits
Unit Day Value Method (Aprll 1998 price levels, 7.126¾ Interest, 60-year period of analysts)
18 miles
a.Smiles
Smiles
6sites
34 sites
1.0
0.2
0.6
1.0
1.0
57,662 $5.00
6,999 $5.00
7,402 $5.00
1,665 $5.00
1,575 $5.00
Total Benefits
Dallas F/oodway Extension Reevaluation Report - Page D - 42
$5,189,580
$59,492
$111,030
$49,950
$267,750
$5,677,802

CHANNEL REALIGNMENT PROPOSAL AT IH-45 BRIDGE
During the Environmental Impact Statement (EIS) scoping process, the Texas Department of Transportation (TxDOl) submitted a proposal to realign the Trinity River at IH·45 as a part of the Dallas Floodway Extension project. TxDOT provided documentation that the bridge at lH~S was constructed in 1972 to complement the authorized navigation channel of the Dallas Floodway Extension portion of the Trinity River Project. The bridge, which consists of 23 spans, varying in length from 78' to 480' was constructed with the longer spans to be located over the proposed navigation Channel. Currently, three of the shorter 78 foot spans span the existing Trinity River at the lH-45 location. In the years following construction, the constricted flows through the existing 78 foot spans have resulted in a blockage due to debris and · subsequent damage to the existing piers. TxDOT cited a 1984 flood event in which massive accumulations of driftwood precipitated a fracture in one of the bridge columns within the existing Trinity River channel. The narrow bridge span was cited as the cause of the debris blockage.
TxDOT's proposal was to relocate a section of the existing Trinity River to a new site beneath a 1,120 foot plate girder structure that was originally designed and constructed for the river in anticipation of a federal navigation channel. This 1,120 foot continuous plate girder unit which consists of two 320 foot end spans and a 480 foot center span have considerably stronger columns and drill shafts designed specifically for lateral forces in anticipation of possible boat or debris impacts.
ALTERNATIVES
Three alternatives were investigated to detennine the economic feasibility of a solution to the problem. Federal participation was not addressed. The alternatives were: ·
• No Action • Columns/Piers Armoring existing • River Realignment
"No Action" Plan
· In the absence of a project to reroute the Trinity River, the "no action" plan alternative, TxDOT indicated that the three 78 foot spans spanning the existing river would be. replaced by a single 320 foot span which would span the existing river in its entirety. This would be done at a future date in a planned replacement scenario, or as a reaction lo a catastrophic or partial failure of the bridge during a flood event. This is to remove the possibility of loss of lives due to bridge failure, extensive and expensive repairs if the bridge experiences partial failure, and the significant costs associated with rerouting of traffic and lost of potential wages due to delays should the this major thoroughfare between Dallas and Houston require lengthy maintenance. The cost associated with traffic rerouting was estimated to be $1 .3 million. The first cost was estimated to be about $12.4 million with an annualized cost of about $1 .0 million.
Columns/Piers Armoring
In lieu of replacing the 78 foot spans to a wider 320 foot section, a less costly alternative of providing additional protection to the existing columns against impacts similar to the 1984 occurrence. This alternative would involve armoring the six sets of ·columns in the existing Trinity River with concrete. The first cost of this alternative was estimated to be about $4.9 million with an annualized cost of $454,700. There exists an element of risk associated with this alternative. It would still be possible to have a large flood event carrying sufficient debris to cause the bridge to fail. ·
Dallas F/oodway Extension Reevaluation Report - Page D • 43
••
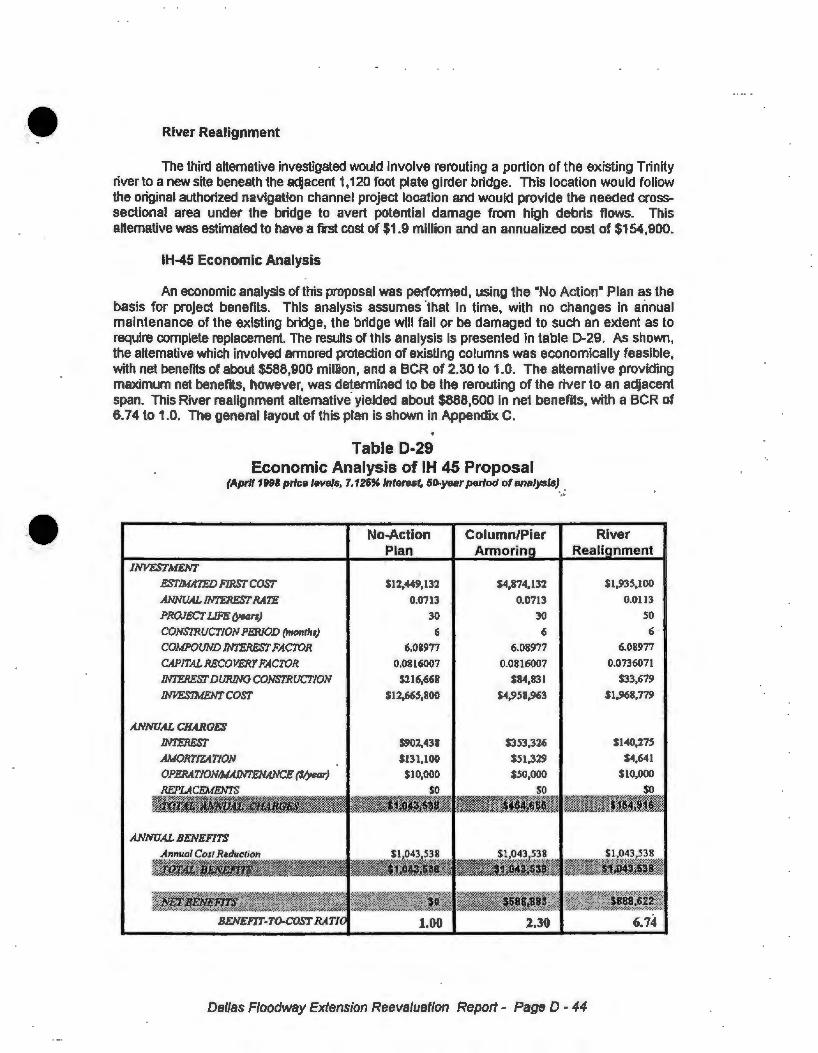
··•
River Realignment
The third alternative investigated would Involve rerouting a portion of the existing Trinity river to a new site beneath the adjacent 1,120 foot plate girder bridge. This location would follow the original authorized navigation channel project location and would provide the needed cross-sectional area under the bridge to avert potential damage from high debris flows. This alternative was estimated to have a first cost of $1.9 million and an annualized cost of $154,900.
IH-45 Economic Analysis
An economic analysis of this proposal was performed, using the •No Actionft Plan as the basis for project benefits. This analysis assumes ·that in time, with no changes in annual maintenance of the existing bridge, the bridge will fail or be damaged to such an extent as to require complete replacement. The results of this analysis is presented in table ·D-29. As shown, the alternative which involved armored protection of existing columns was economically feasible, with net benefits of about $588,900 million, and a BCR of 2.30 to 1.0. The alternative providing maximum net benefits, however, was determined to be the rerouting of the river to an adjacent span. This River realignment alternative· yielded about $888,600 in net benefits, with a BCR of 6.74 to 1.0. The general layout of this plan is shown in Appendix. C.
Table D-29 Economic Analysis of IH 45 Proposal
{Aprll 1998 price leve(s, 7.125¾ Interest, 50-year period of analysts) __ :
No-Action Column/Pier River Plan Armorin Reali nment
INVESTMENT
ESTIMATED FIRST COST $12,449,132 $4,874,132 Sl,93S,100
ANNUAL INTEREST RATE 0.0713 0.0713 0.0113
PROJECT UFE (ye4r.r) 30 30 so CONSTRUCT/ON PERJOD (monrlis) 6 6 6
COMPOUND lNTERES'I' FAC'IOR 6.08977 6.08977 6.08977
CAPITAL RECOVERY FACTOR 0.0816007 0.0816007 0.0736071
INTEREST DURING CONSTRUCT/ON $216,668 $84,831 $33,679
INVESTMENT COST Sl2,66S,800 $4,.9S8,963 $1,968,779
ANNUAL CHARGF:S
INTEREST $902,438 $353,326 Sl40,27S
AMORTJ'ZA.TJON $131,100 SSl,329 $4,641
OPERATJONIMAINTENANCE 11,year)
REPLACEMENTS
iff~~Blliillllti. · ANNUAL BENEFITS
BENEFIT-TO-COST 2.30 6.74
Dallas F/oodway Extension Reevaluation Report - Page D - 44

. l
Equivalent Annual Damages of Investigated Plans
Equivalent annual damages (EAD) were calculated for the recommended plan to account for future changes in urbanization and hydrology. The analysis was performed over a 50 year period (2000 to 2050) using April 1996 prices and level of development with an interest rate of 7 .125 percent. Table 0-30 summarizes the damages under existing conditions and the residual damages for the federally supportable and locally preferred plans. Table 0-31 summarizes the number of structures remaining in each flood zone under the investigated alternatives. The total benefits derived for each plan are shown in table 0-32. Tables D-33, D-34, and 0-35 show the project performance of the NED Plan, the Chain of Wetlands Plus SPF Lamar Levee and 100-Year Cadillac Heights Levee Plan, and the Recommended Plan, respectively. Finally, the cumulative single event damages with minimum facility sumps for the Lamar Street levee is shown in table 0-36.
Reach
2 3
4A
4B 5
- 6
S4blolal
7 8
Reach
1 2 3 ·
4A 4B 5 6
Subtotal
7
Table D-30 Equivalent Annual Damages and Benefits
(April 1998 Prices and Level of Development)
$9,449 $431 ,500 $80,259
$1,350,000 $251 ,100 $741 ,100 $137,845
$1 ,085,700 $201 ,940 $1,696,300 $162,645
$5,649,600 $898,159
$10,054,700 $1,870,174 $998,500 $185,721
uivalent Annual
$64,800 $539,000
$1 ,398,400 $1,658,500 $807,000 $150,102 $957,100
$1 ,116,600 $207,688 $1 ,324,300 · $1,856,400 $178,214 $2,034,600 $6,011 ,500 $951 ,063 $6,962,600
$11,264,800 $2,095,253 $13,360,100 8 $1,135,900 $211,277 $1,347,200
Subtotal $12,400,700 $2,306,530 $14 707 300
)l~
Dallas Floodway Extension Reevaluation Report - Page D • 45
•

.-.• 2000
Reach
1
2 3 4A 48 5 6
Subtotal
7 8
Subtotal
- :..- ...... :
2000
Reach
1
2
3 4A 4B 6
6
Subtotal
7 8
Subtotal
$269,700 $50,164
$27,700 $5,152 $15,200 $2,827 $17,100 $3,181
$132,200 $24,589
$82,700 $15,382 $574,200 $55,123
$1,118,800 $156,419
$3,168,800 $587,537 $671,000 $124,806
$3 829 800 $712 343
$269,700 '$50,164
$29,800 $5,543
$16,600 $3,088 $18,400 $3,422
$132,200 $24,589 $13,800 $2,567
$688,900 $66,134
$1,169,400 $165,507
$4,737,000 $881,082 $873,900 $162,545 5 610 900 1 043,627 -~~-
..• -.-.· · . ..
Table D-30 continued Equivalent Annual Damages and Benefits
2050
Annual Benefits Reach
$319,900 $29,000 1 $298,200 $55,465 $32,900 $27,300 2 $30,200 $5,617 $18,000 $493,800 3 $18,600 $3,460 $20,300 $1,580,800 4A $20,000 $3,720
$156;800 $722,100 48 $148,800 $27,677 $98,100 $1,189,500 5 $91,100 $16,945
$629,300 $1,229,800 6 $646,200 $62,035 $1,275,300 $5,272,300 Subtotal $1.253,100 $174,919
S3l46,3oo $8,178,600 7 $3,634,000 $676,924 $795,800 $388,400 B $778,600 $144,820 4 542100 $8 567 000 Subtotal $4 412 600 82_0'.7~ ~~
.. . ·. I -2050
Annual Benefits Reach
$319,900 $29,000 1 $298,200 $55,465 $35,300 $24,900 2 $30,200 $6,617 $19,700 $492,100 3 $18,600 $3,460 $21,800 $1,579,300 4A $21,500 $3,999
$156,800 $722,100 -4B $148,800 _._ $27,677 $16,400 $1,271,200 5 $16,100 $2,995
$755,000 $1,104,100 6 $773,400 $74,246 $1,324,900 $5,222,700 Subtotal $1,306,800 $173,459
$5,618,100 $6,306,800 7 $5,374,200 $999,601 $1,036,400 $147,800 8 $997,400 $185,516 $6,65~,SO? _ssi!~;4.~~o Subtotal 6 371 600 $1,185,118
: {1.~· ffii\l .. .... .... ·--·· -· . _.,.._ .. • -.v. . ... . . . ..• ~-" _:.,__..., , . ...
Dallas Floodway Extension Reevaluation Report - Page D - 46
Annual Equivalent Benefits Annual Benefits
$353,700 $30,600 $29,400 $35,800 $29,000 $27,700 $22,100 $516,9,00 $499,600 $23,700 $1,634,800 $1,594,400
$176,500 $780,600 $736,900 $108,000 $1,216,300 $1,196,300 $708,200 $1,326,400 $1,254,200
$1,428,000 $5,534,600 $5,338,500
$4,309,900 $9,050,200 $8,393,800 $923,400 $423,800 $397,300
$5,233,300 $9,474,000
Mfi,:., .. ·.:.~« .. ,· ........................
Annual Equivalent Benefrts Annual Benefits
$353,700 $30,600 $29,400 $35,800 $29,000 $25,900 $22,100 $516,900 $498,400 $25,500 $1,633,000 $1,592,900
$176,500 $780,600 $736,900 $19,100 $1,305,200 $1,279,800
$847,600 $1,187,000 $1,125,000 $1,.480,300 $5,482,300 $6,288,300
$6,373,800 $6,986,300 $6,478,500 $1,182,900 $164,300 $152,000
$7_,~~J,i!_~O $7,150J_OO $6,630,500 ~----,----~:··· ,.

Table D-31 Number of Structures By Flood Zone
For Selected Alternatives
Cumulative Flood Zone 0N1 0-2 0--5 0-10 0-25 0-50 ' 0-100
Pre-1991 Conditions 0 2 30 112
NED 0 0 3 16
Chain of Wetlands (COW} 0 .,
0 2 10
COW+SPF & 100-Year Levees 0 0 1 7 COW +SPF Levees 0 0 1 7
Table D-32 Benefits of Levee Plans
(April 1998 Prices and Level of Development) (Based on Equivalent Annual Damages)
Benefit T e Inundation Reduction Insurance Subsidy Existing Dallas F1oodway
Total Flood Reduction
Restoration Recreation . .
Cha.in of Wetlands SPFLamnr&
100-Yr Cadillac Levees $5;338,500
$94,200 $8,796,100
$14,228,800
Dallas Floodway Extension Reevaluation Report - Page D - 47
•
334 504 794
56 221 39·1
·57 201 283
21 48 75 21 48 75
Cha.in of Wetlands SPF Lamar & SPF
Cadillac Levees $5,288,300
$94,200 $6,630,500
$12,013,000
o..soo 0-SPF
1804 2550
1250 1970
1542 2232
1036 2046 1232 1862

Reach
1
2
3
4A
48
5
6
7
8
Table 0-33 Project Performance by Reach For
1200' BW Swale Alternative (April 1998 Prices and Level of Development)
Expected Annual Target Stage Long Term Risk Conditional Non-Exceedance Probability Exceedance (Years} by Event Probability
Target Stage Median Expected 10 25 50 10% 4% 2% 1% .4% .2%
395.7 0.145 0.154 0.8131 0.9849 0.9998 0.1748 0.0054 0.0001 0.0000 0.0000 0.0000
401.9 0.031 0.039 0.3267 0.6280 0.8616 0.9801 0.6089 0.2254 0.0290 0.0054 0.0006
levee 0.001 0.003 0.0249 0.0611 0.1184 1.000 0.9998 0.9939 0.9180 0.7829 0.5737
403.14 0.090 0.099 0.6484 0.9267 0.9946 0.5571 0.0627 0.0062 0.0002 0.0000 0.0000
407.03 0.005 0.008 0.0729 0.1724 0.3152 1.000 0.9947 0.9377 0.6376 0.3868 0.1797
402.15 0.114 0.154 0.8125 0.9848 0.9998 0.1753 0.0055 0.0001 0.0000 0.0000 0.0000
levee 0.001 0.002 0.0216 0.0531 0.9998 0.17.53 0.0055 0.0001 0.0000 - 0.0000 0.0000
levee 0.000 0.000 0.0028 0.0069 0.0138 1.0000 1.0000 0.9999 0.9957 0.9806 0.9313
levee 0.000 0.000 0.0023 0.0057 0.0113 1.0000 1.0000 1.0000 0.9965 0.9835 0.9395
Dallas Floodway Extension Reevaluation Report - Page D - 48
•

Reach
1
2
3
4A
4B
5
6
7
8
Table D-34 Project Performance by Reach For
Chain of Wetlands with SPF Lamar and 100-Year Cadillac Levees (Aprll 199B Prlc~ and Level of Development)
,·
Expected Annual Targe~ Stage Long Term Risk Conditional Non-Exceedance Probability Exceed a nee (Years) by Event Probability
Target Stage Median Expected 10 25 50 10% 4% 2% 1% .4% .2%
395.70 0.193 0.201 0.8935 0.9849 0.9998 0.1748 0.0054 0.0001 0.0000 0.0000 0.0000
401 .88 0.044 0.052 0.4112 0.6280 0.8616 0.9801 0.6089 0.2254 0.0290 0.0054 0.0006
levee 0.000 0.000 0.0721 0.0026 0.1184 1.000 0.9998 0.9939 0.9180 0.7829 0.5737
levee 0.000 0.000 0.0032 0.0079 0.0157 1.0000 1.0000 0.9999 0.9952 0.9783 0.9244
levee 0.005 o.ooi 0.0721 0.1705 0.3119 1.0000 0.9950 0.9387 0.6397 0.3867 0.1802
levee 0.000 0.000 0.0034 0.0085 0.0168 1.0000 1.0000 0.9999 0.9941 0.9735 0.9109
levee 0.002 0.004 0.0399 0.0969 0.1844 1.0000 0.9993 0.9855 0.8436 0.6451 0.4001
levee 0.000 0.000 0.0022 0.0054 0.0109 1.0000 1.0000 0.9996 0.9886 0.9531 0.8597
levee 0.000 0.001 0.0067 0.0167 0.0330 . 1.0000 1.0000 0.9996 0.9885 0.9524 0.8567
Dallas F/oodway Extension Reevaluation Report - Page D - 49

Reach
1
2
3
4A
48
5
6
7
8
Table D-35 Project Performance by Reach For
Chain of Wetlands with SPF Lamar and Cadillac Levees (Aprlf 1998 Prices and Level of Development)
Expected Annual Target Stage Long Term Risk Conditional Non-Exceedance Probability Exceedance (Years) · by Event Probability
Target Stage Median Expected 10 25 50 10% 4% 2% 1% .4% ~
395.70 0.193 0.201 0,8935 0.9849 0.9998 0.1748 0.0054 0.0001 0.0000 0.0000
401.88 0.044 0.052 0.4112 0.6280 0.8616 0.9801 0.6089• 0.2254 0.0290 0.0054
levee 0.000 0.000 0.0721 0.0026 0.1184 1.000 0.9998 0.9939 0.9180 0.7829
levee 0.000 0.000 0.0032 0.0079 0.0157 1.0000 1.0000 0.9999 0.9952 0.9783
levee 0.005 0.007 0.0721 0.1705 0.3119 1.0000 0.9950 0.9387 0.6397 0.3867
levee 0.000 0.000 0.0034 0.0085 0.0168 1.0000 1.0000 0.9999 0.9941 0.9735
levee 0.002 0.004 0.0399 0.0969 0.1844 1.0000 0.9993 0.9855 0.8436 0.6451 , .
levee 0.000 0.000 0.0022 0.0054 0.0109 1.0000 1.0000 0.9996 0.9886 0.9531
levee 0.000 0.001 0.0067 0.0167 0.0330 1.0000 1.0000 0.9996 0,9885 0.9524
Dallas Floodway Extension Reevaluation Repo,t - Page D - 50
3 . .....
.2%
0.0000
0.0006
0.5737
0.9244
0.1802
0.9109
0.4001
0.8597
0.8567

•
%ACE Event <100
50 20 10 4
2 -1 .4
.2
Tabl D-36 Cumulative Single-Event Damages
For Lamar Street Sumps (without risk) ·
1 2 3 4
$0 $0 $0 $0 $0 $0 $0" $0 .
$0 $0 $0 $0
$0 $0 $0 $0 $0 $0 $0 $0 $0 $0 $0 $0 $0 $0 $0 $0
$43 396 $11411 $223 538 $0 $60,344 $119,551 $331,458 $0
Socioeconomic Effects of Plan Implementation .
5 Total
$0 $0
.$0 $0 $0 $0 $0 $0
$0 $0
$0 $0 $0 $0 $0 $278 345
$0 $511,353
The potential economic and social effects of implementation of the investigated plan on the study area comprise the value of the long-term reduction in periodic flood damages, and direct and indirect short-term income and employment impact of project construction. The permanent reduction in periodic flood damages would effectively increase the income· available to flood plain property owners for other purposes, such as (for example) improvements to homes, yards or personal property. Construction of SPF levees could encourage growth of existing business and entice new business to the area. This would improve employment conditions and expand the tax base of the area.
To the extent that this additional disposable income is spent within the surrounding area, it would result in a local "multiplier effect": increases in business revenues, employment, and personal income rippling through the local economy as each new dollar brought in is spent and respent. Property values, and local tax revenues, would also be expected to increase as a general result.
Short-term impacts associated with project construction results from the temporary presence of construction workers and expenditures for construction materials and services, as well as spending by the construction work force for food and other personal needs. These expenditures would be expected to result in a positive multiplier effect on the local economy and wouid last for about three years. The lasting economic and social effects of projeqt implementation would be the benefits resulting from the permanent reduction in flood damages, as described above. ·
Dallas Floodway Extension Reevaluation Report- Page D - 51

Financial Capability
A financial capability analysis of the City of Dallas was conducted in accordance with ER 1105-2-100 to ascertain the community's financial condition and its ability to meet the cost sharing responsibilities for the Floodway Extension Project. The assessment involved the calculation and analysis of nine key financial indicators. A number of interrelated economic, fiscal, and management factors support a .local government's capacity to finance desired capital improvement projects. Those factors include the health of the local economy, the structure of its revenue base, the management of the community's operations, and the debt history of the community.
The Municipal Fiscal Officers Association has developed a number of financial warning indicators useful in determining the financial health of a community. These indicators are used to help determine the sponsor's current debt position and financial health. Financial indicator ratings are calculated for the city of Dallas and are compared to national averages as outlined in the Environmental Protection Agency's Financial Capability Guidebook, dated March 1984. The financial data used to calculate these ratings were obtained from the city of Dallas Office of Budget and Management. Other relevant facts and data which play a role in the analysis include population, per capita income and property tax information. Table D-~7 provides a key of the financial indicator ratings and limits. Table D-38 shows the indicator values and rating for the city of Dallas. The indicators, calculated values and corresponding rating have been updated to reflect the city's capability as of September 1997 and are summarized in table D-39.
Table 0-37 Financial Indicator Rating Key
Indicator Weak Average Strong
1. Annual rate of change in population . < 1% 1% to 1% > 1%
2. Current surplus/deficit as a percent of total current expenditures < 0% 0% to 5% > 5%
3. Real property tax collection rate <96% 96% to 98% >98%
4. Property tax revenue as a percent of full market value of real property > 4 11/11 2% to 4% < 2%
5. Overall net debt as a percent of full market yalue of real property > 5% 3% to 5% < 3%
6. Overall net debt outstanding as a percent of personal income >12% 4% to 12% < 12%
7. Direct net debt per·capita > $750 $250 to $750 < $250
8. Overall net debt per capita > $1,200 $500 to $1,200 < $500
9. Percent direct net debt outstanding due within next 5 years <10% 10% to 30% > 30%
Dallas Ftoodway Extension Reevaluation Report - Page D - 52
.,.
•
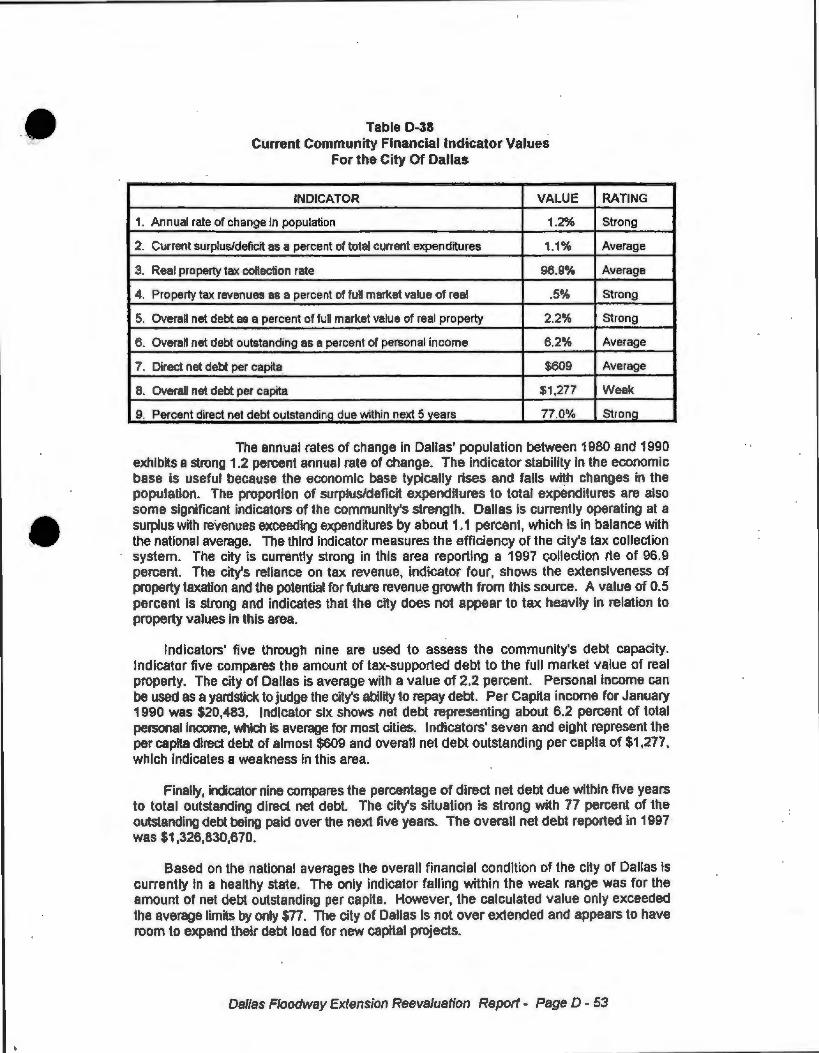
•
Table 0-38 Current Community Financial Indicator Values
For the City Of Dallas
INDICATOR VALUE
1. Annual rate of change in population 1.2%
2. Current surplus/deficit as a percent of total current expenditures 1.1%
3. Real property tax collection rate 96.9%
4. Property tax revenues as a percent of full market value of real .5%
5. Overall net debt as a percent of full market value of real property 2.2%
6. Overall net debt outstanding as a percent of personal income 6.2%
7. Direct net debt per capita $609
8. Overall net debt per capita $1,277
9. Percent direct net debt outstanding due within next 5 vears 77.0%
RATING
Strong
Average
Average
Strong
Strong
Average
Average
Weak
Strong
The annual rates of change In Dallas' populat ion between 1980 and 1990 exhibits a strong 1.2 percent annual rate of change. The indicator stability in the economic base is useful because the economic base typically rises and falls wi~h changes in the population. The proportion of surplus/deficit expenditures to total expenditures are also some significant indicators of the community's strength. Dallas is currently operating at a surplus with revenues exceeding expenditures by about 1.1 percent, which is in balance with the national average. The third indicator measures the efficiency of the city's tax collection system. The city is currently strong in this area reporting a 1997 co_llection rte of 96.9 percent. The city's reliance on tax revenue, indicator four, shows the extensiveness of property taxation and the potential for Mure revenue growth from this source. A value of 0.5 percent is strong and indicates that the city does not appear to tax heavily in relation to property values in this area.
Indicators' five through nine are used to assess the community's debt capacity. Indicator five compares the amount of tax-supported debt to the full market value of real property. The city of Dallas is average with a value of 2.2 percent. Personal income can be used as a yardstick to judge the city's ability to repay debt. Per Capita income for January 1990 was $20,483. Indicator six shows net debt representing about 6.2 percent of total personal income, which is average for most cities. Indicators' seven and eight represent the per capita direct debt of almost $609 and overall net debt outstanding per capita of $1,277, which indicates a weakness in this area.
Finally, indicator nine compares the percentage of direct net debt due within five years to total outstanding direct net debt. The city's situation is strong with 77 percent of the outstanding debt being paid over the next five years. The overall net debt reported in 1997 was $1 ,326,830,670.
Based on the national averages the overall financial condition of the city of Dallas is currently in a healthy state. The only indicator falling within the weak range was for the amount of net debt outstanding per capita. However, the calculated value only exceeded the average limits by only $77. The city of Dallas is not over extended and appears to have room to expand their debt load for new capital projects.
Dallas F/oodway Extension Reevaluation Report - Page D - 53
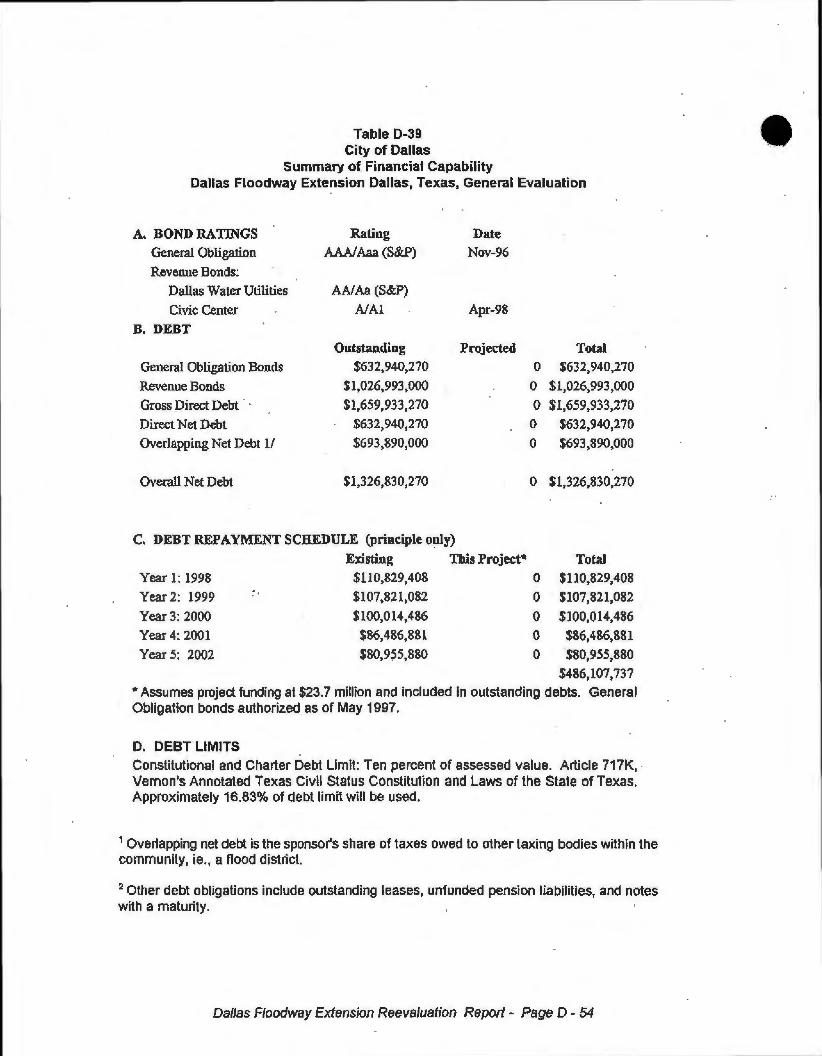
Table D-39 City of Dallas
Summary of. Financial Capability Dallas Floodway Extension Dallas, Texas, General Evaluation
A. BOND RA TINGS Rating Date
General Obligation AANAaa (S&P) Nov-96
Revenue Bonds:
Dallas Water Utilities AA/Aa (S&P)
Civic Center A/Al Apr-98
B. DEBT Outstanding Projected Total
General Obligation Bonds $632,940,270 0 $632,940,270
Revenue Bonds $1,026,993,000 0 $1,026,993,000
Gross Direct Debt · - $1,659,933,270 0 $1,659,933,270
Direct Net Debt $632,940,270 0 $632,940,270
Overlapping Net Debt 1/ $693,890,000 0 $693,890,000
Overall Net Debt $1,326,830,270 0 $1,326,830,270
C. DEBT REPAYMENT SCHEDULE (principle only) Existing This Project* Total
Year 1: 1998 $110,829,408 0 $110,829,408
Year 2: 1999 $107,821,082 0 $107,821,082
Year 3: 2000 $100,014,486 0 $100,014,486
Year 4: 2001 $86,486,881 0 $86,486,881
Year 5: 2002 $80,955,880 0 ·sso,955,sso
$486,107,737
"Assumes project funding at $23.7 millron and included in outstanding debts. General Obligation bonds authorized as of May 1997.
D. DEBT LIMITS Constitutional and Charter Debt Limit: Ten percent of assessed value. Article 717K, -Vernon's Annotated Texas Civil Status Constitution and Laws of the State of Texas. Approximately 16.83% of debt limit will be used.
1 Overlapping net debt is the sponsor's share of taxes owed to other taxing bodies within the community, ie., a flood district.
2 Other debt obligations include outstanding leases, unfunded pension liabilities, and notes with a maturity.
Dallas Floodway Extension Reevaluation Report - Page D - 54
•

•
Non-Federal Financial Planning
The purpose of strategic financial planning is to optimize the use of capital over time in response to long term financial goals. The three principal elements involved include cost recovery alternatives, if neeqed; selection of the preferred financing alternative; and implementation of the cost recovery approach. Although financing decisions are ultimately the sponsors', the Corps of Engineers can assist in the decision making through the provision of timely information on costs, benefits and cost recovery opportunities. The sponsor is responsible for making arrangements to finance the project sufficiently in advance of construction to enable the project schedule to be met.
Ability-to Pay Analysis
Based on ER 1165-2-121 an ability-to-pay test should be applied to all flood control projects. The test determines the eligibility of the study area to qualify for a reduction in the amount to be cost shared by the Non-Federal interest. To qualify for a reduction the results of both the benefit and income portions of the twofold ability-to-pay test must fall within the specified guidelines.
The benefits' test determines the maximum reduction, called the "benefits based floor" (BBF), in the level of non-Federal cost sharing for any project. The factor is determined by dividing the project B/C ratio by four. If the factor (expressed as a percentage) is less than the standard level of cost sharing; the project may be eligible for a reduction in the non-Federal share to this BBF. The WRDA 86 authorized cost share level for the Flood Protection project is 25 percent. The recommended plan's B/C ratio of 2.06 was divided by four to yield a BBF of .515 or 51.5 percent.
The income test determines qualification for the reduction calculated in the benefit step. Qualification depends on a measure of the current economic resources of both the project area and the State in which the project is located.
In accordance with factors released in Economic Guidance 96-4, the income index factors for the state of Texas and Dallas County are 90.81 and 102.77, respectively. The Eligibility Factor (EF) for a flood control project is calculated according to the following formula: ·
EF = a • b1 • (State factor) - b2 • (area factor)
where: a = 15.86794
b1 = 0.06771
b2 = 0.13543
Utilizing the above formula, an EF of -4.2 was calculated for the City of Dallas. An EF less than zero indicates ineligipility for a reduction in construction cost sharing. As stated previously, a BBF factor for the investigated plan was calculated at 51.5 percent. To qualify for a reduction, the BBF factor must be less than the standard level of cost sharing in accordance with ER-1165-2-121 paragraph 5a(2}. The City of Dallas does not meet the criteria for a reduction in construction cost because this project meets neither test, therefore, the City of Dallas must pay the standard 25 percent level of the total project cost as authorized in WRDA 86.
Dallas Floodway Extension Reevaluation Report - Page D - 55