Appendix C - TransLink · 2014 Bus Service Performance Review Appendix C 2014 Route Summaries ......
118
TransLink 2014 Bus Service Performance Review Appendix C 2014 Route Summaries Routes 100 – 299
Transcript of Appendix C - TransLink · 2014 Bus Service Performance Review Appendix C 2014 Route Summaries ......

1
TransLink 2014 Bus Service Performance Review
Appendix C2014 Route Summaries Routes 100 – 299

Table of Contents
Route 100 . . . . . . . . . . . . . . . . . . 3
Route 101 . . . . . . . . . . . . . . . . . . .5
Route 104 . . . . . . . . . . . . . . . . . . 7
Route 106 . . . . . . . . . . . . . . . . . . 9
Route 110 . . . . . . . . . . . . . . . . . . 11
Route 112 . . . . . . . . . . . . . . . . . . .13
Route 116 . . . . . . . . . . . . . . . . . . 15
Route 123 . . . . . . . . . . . . . . . . . .17
Route 125 . . . . . . . . . . . . . . . . . .19
Route 128 . . . . . . . . . . . . . . . . . .21
Route 129 . . . . . . . . . . . . . . . . . 23
Route 130 . . . . . . . . . . . . . . . . . 25
Route 134 . . . . . . . . . . . . . . . . . 27
Route 135 . . . . . . . . . . . . . . . . . 29
Route 136 . . . . . . . . . . . . . . . . . .31
Route 143 . . . . . . . . . . . . . . . . . 33
Route 144 . . . . . . . . . . . . . . . . . .35
Route 145 . . . . . . . . . . . . . . . . . 37
Route 151 . . . . . . . . . . . . . . . . . . 39
Route 152 . . . . . . . . . . . . . . . . . .41
Route 153 . . . . . . . . . . . . . . . . . 43
Route 155 . . . . . . . . . . . . . . . . . 45
Route 156 . . . . . . . . . . . . . . . . . 47
Route 157 . . . . . . . . . . . . . . . . . 49
Route 159 . . . . . . . . . . . . . . . . . . 51
Route 160 . . . . . . . . . . . . . . . . . .53
Route 169 . . . . . . . . . . . . . . . . . .55
Route 178 . . . . . . . . . . . . . . . . . .57
Route 188 . . . . . . . . . . . . . . . . . 59
Route 190 . . . . . . . . . . . . . . . . . .61
Route 209 . . . . . . . . . . . . . . . . . 63
Route 210 . . . . . . . . . . . . . . . . . 65
Route 211 . . . . . . . . . . . . . . . . . . 67
Route 212 . . . . . . . . . . . . . . . . . 69
Route 214 . . . . . . . . . . . . . . . . . .71
Route 227 . . . . . . . . . . . . . . . . . 73
Route 228 . . . . . . . . . . . . . . . . . .75
Route 229 . . . . . . . . . . . . . . . . . 77
Route 230 . . . . . . . . . . . . . . . . . 79
Route 231 . . . . . . . . . . . . . . . . . .81
Route 232 . . . . . . . . . . . . . . . . . 83
Route 236 . . . . . . . . . . . . . . . . . 85
Route 239 . . . . . . . . . . . . . . . . . 87
Route 240 . . . . . . . . . . . . . . . . . 89
Route 241 . . . . . . . . . . . . . . . . . .91
Route 242 . . . . . . . . . . . . . . . . . 93
Route 246 . . . . . . . . . . . . . . . . . 95
Route 247 . . . . . . . . . . . . . . . . . 97
Route 250 . . . . . . . . . . . . . . . . . 99
Route 251 . . . . . . . . . . . . . . . . . 101
Route 252 . . . . . . . . . . . . . . . . .103
Route 253 . . . . . . . . . . . . . . . . .105
Route 254 . . . . . . . . . . . . . . . . .107
Route 255 . . . . . . . . . . . . . . . . 109
Route 256 . . . . . . . . . . . . . . . . . 111
Route 257 . . . . . . . . . . . . . . . . . 113
Route 258 . . . . . . . . . . . . . . . . . 115
Route 259 . . . . . . . . . . . . . . . . . 117

100Key Characteristics
Subregion of Primary Service: Predominant Vehicle Type:
Population (People, 400m Buffer): Employment (Jobs, 400m Buffer): Walkability (intersection density):
Contributes to FTN (Y/N):
Cost & Performance2012 2013 2014 Rank (2014)
Annual Boardings: 2,637,000 3,019,000 3,180,000 22 of 212Annual Service Cost: $3,794,000 $3,913,000 $3,977,000 29 of 219
Annual Revenue Hours: 38,300 39,500 40,200 29 of 219Cost /Boarded Passenger: $1.44 $1.30 $1.25 29 of 212
Avg. Boardings / Rev. Hour: 69 76 79 28 of 212Avg. Daily Boardings (Mon-Fri): 8,050 9,200 9,800 22 of 210
Avg. Daily Boardings (Saturdays): 5,350 6,500 7,100 24 of 179Avg. Daily Boardings (Sun & Holidays): 5,300 6,150 5,750 23 of 171
Peak Passenger Load (Bi-directional Avg.): 28 30 30 32 of 212Peak Load Factor (Vehicle Occupancy): 0.56 0.59 0.59 26 of 212
Average Capacity Utilization (Passenger Turnover): 90% 101% 108% 21 of 212Annual Revenue Hours Above Guidelines (Crowding): 4% 3% 6% 193 of 212
Service Changes Since 2012
Route 100
Vancouver/UBC
17,500High (0.26 int./hect.)
Std. Bus38,000
Yes
- Summer 2012, Reduce freq from 15 to 20m: Sat WB from 6-7hr, EB from 5-7hr; S/H WB 6-8hr, EB 5-8hr
Productivity
15%
30%
49%
7% 6%
38%
45%
12%
18%
42%
34%
5%
18%
43%
31%
8%
25%
45%
25%
5%
18%
49%
25%
7%
0%
10%
20%
30%
40%
50%
60%
70%
80%
90%
100%
Top 25% Middle High 25% Middle Low 25% Bottom 25% Top 25% Middle High 25% Middle Low 25% Bottom 25%
Boardings Per Revenue Hour Capacity Utilization
Perc
ent o
f Rev
enue
Hou
rs w
ithin
gi
ven
Prod
uctiv
ity B
and
3

Performance by Day of Week, Route 100
2013 2014 2013 2014 2013 2014 2013 2014 2013 2014 2013 2014
2013 2014 2013 2014 2013 2014 2013 2014 2013 2014 2013 2014
2013 2014 2013 2014 2013 2014 2013 2014 2013 2014 2013 2014
Data collected Sept. to mid-Dec. of the given year
Time Annual Revenue Hours
Average Trips per Hour
Average Boardings per Hour
Average Boardings per Trip
Average Capacity Utilization
Average Peak Passenger LoadVehicle Type
(EB / WB)
Std. Bus Std. Bus
06:00 - 09:00
5742 5772 6 6 77 86 58 64 116% 129% 27 / 49 27 / 50 Std. Bus
2013 2014
Mon
-Fri
01:00 - 06:00
1629 1650 4 4 52 51 33 32 69% 69% 14 / 31 14 / 31
18:00 - 21:00
3905
15:00 - 18:00
6079 6446 6 6 89 86 69 72 139% 145% 46 / 31 48 / 29 Std. Bus Std. Bus
Std. Bus
09:00 - 15:00
9839 9943 5 5 58 64 47 50 94% 101% 23 / 29 23 / 29 Std. Bus Std. Bus
Time Annual Revenue Hours
Average Trips per Hour
Average Boardings per Hour
Average Boardings per Trip
Average Capacity Utilization
Average Peak Passenger LoadVehicle Type
(EB / WB)
21:00 - 01:00
2567 2559 3 3 44 51 28 33 58% 69% 23 / 15 26 / 15 Std. Bus Std. Bus
35 / 20 31 / 21 Std. Bus Std. Bus3918 4 4 60 66 45 48 91% 96%
Std. Bus Std. Bus
06:00 - 09:00
670 679 4 4 45 54 32 40 65% 79% 16 / 30 18 / 32 Std. Bus Std. Bus
2013 2014
4 4 86 97 63
09:00 - 15:00
1616 1671 4 4 82 76 60 60 121% 121% 28 / 38 29 / 36 Std. Bus Std. Bus
Std. BusStd. Bus
29 40 / 38 Std. Bus Std. Bus
21:00 - 01:00
477 475 2 2 49 53 34 37 70% 75% 37 / 14 40 / 15 Std. Bus
41 90% 82% 33 / 19 28 / 1918:00 - 21:00
773 763 4 4 62 57 45
Satu
rday
01:00 - 06:00
169 168 2 2 22 15 15 9 32% 19% 9 / 16 8 / 6
80 126% 160% 44 /15:00 - 18:00
792 867
2013 2014
Sund
ay/H
olid
ay
01:00 - 06:00
198 198 2 2 20 22 13 15 28% 31% 4 / 15 6 / 16
15:00 - 18:00
960 960 4
Std. Bus
TimeAnnual Revenue
HoursAverage Trips
per HourAverage Boardings
per Hour Average Boardings
per TripAverage Capacity
Utilization
Average Peak Passenger LoadVehicle Type(EB / WB)
09:00 - 15:00
1893 1893 4 4 66 70 49 52 98% 103% 21 / 29 24 / 31 Std. Bus Std. Bus
Std. Bus Std. Bus
06:00 - 09:00
730 730 4 4 43 47 30 32 60% 64% 15 / 23 14 / 24 Std. Bus Std. Bus
24 32 / 26 Std. Bus Std. Bus
18:00 - 21:00
888 888 4 4 52 54 36 38 73% 76% 23 / 19 26 /
4 72 74 52 53 104% 105% 31 /
17 Std. Bus Std. Bus
21:00 - 01:00
600 600 2 2 29 37 19 25 38% 50% 19 / 10 19 / 12 Std. Bus Std. Bus
4

101Key Characteristics
Subregion of Primary Service: Predominant Vehicle Type:
Population (People, 400m Buffer): Employment (Jobs, 400m Buffer): Walkability (intersection density):
Contributes to FTN (Y/N):
Cost & Performance2012 2013 2014 Rank (2014)
Annual Boardings: 977,000 922,000 896,000 71 of 212Annual Service Cost: $1,503,000 $1,489,000 $1,476,000 75 of 219
Annual Revenue Hours: 15,200 15,000 14,900 78 of 219Cost /Boarded Passenger: $1.54 $1.61 $1.65 73 of 212
Avg. Boardings / Rev. Hour: 64 61 60 67 of 212Avg. Daily Boardings (Mon-Fri): 3,150 2,950 2,850 72 of 210
Avg. Daily Boardings (Saturdays): 1,700 1,750 1,750 73 of 179Avg. Daily Boardings (Sun & Holidays): 1,500 1,450 1,450 70 of 171
Peak Passenger Load (Bi-directional Avg.): 22 22 22 88 of 212Peak Load Factor (Vehicle Occupancy): 0.44 0.44 0.43 89 of 212
Average Capacity Utilization (Passenger Turnover): 73% 72% 71% 64 of 212Annual Revenue Hours Above Guidelines (Crowding): 0% 0% 0% 1 of 212
Service Changes Since 2012
Route 101
Burnaby/New Westminster
12,000High (0.3 int./hect.)
Std. Bus35,500
2013 ridership totals must be complemented with route 128
No
- Fall 2013, New route alignment to operate along 6th Ave instead of 8th Ave
Productivity
9%
33%
45%
13%
0%
26%
51%
23%
0%
32%
51%
16%
0%
25%
56%
19%
0%
19%
63%
18%
0%
21%
61%
18%
0%
10%
20%
30%
40%
50%
60%
70%
80%
90%
100%
Top 25% Middle High 25% Middle Low 25% Bottom 25% Top 25% Middle High 25% Middle Low 25% Bottom 25%
Boardings Per Revenue Hour Capacity Utilization
Perc
ent o
f Rev
enue
Hou
rs w
ithin
gi
ven
Prod
uctiv
ity B
and
5
Performance by Day of Week, Route 101
2013 2014 2013 2014 2013 2014 2013 2014 2013 2014 2013 2014
2013 2014 2013 2014 2013 2014 2013 2014 2013 2014 2013 2014
2013 2014 2013 2014 2013 2014 2013 2014 2013 2014 2013 2014
Data collected Sept. to mid-Dec. of the given year
Time Annual Revenue Hours
Average Trips per Hour
Average Boardings per Hour
Average Boardings per Trip
Average Capacity Utilization
Average Peak Passenger LoadVehicle Type
(EB / WB)
Std. Bus Std. Bus
06:00 - 09:00
2313 2192 3 3 61 54 38 39 77% 80% 25 / 25 25 / 25 Std. Bus
2013 2014
Mon
-Fri
01:00 - 06:00
358 321 2 2 43 26 22 18 45% 35% 12 / 27 13 / 17
18:00 - 21:00
1549
15:00 - 18:00
2929 2970 4 3 57 60 48 48 96% 96% 31 / 25 31 / 24 Std. Bus Std. Bus
Std. Bus
09:00 - 15:00
3505 3551 2 2 57 57 39 38 78% 76% 20 / 23 20 / 21 Std. Bus Std. Bus
Time Annual Revenue Hours
Average Trips per Hour
Average Boardings per Hour
Average Boardings per Trip
Average Capacity Utilization
Average Peak Passenger LoadVehicle Type
(EB / WB)
21:00 - 01:00
932 932 1 1 36 36 21 21 42% 42% 18 / 13 19 / 12 Std. Bus Std. Bus
24 / 24 26 / 24 Std. Bus Std. Bus1549 2 2 55 52 36 35 72% 70%
Std. Bus Std. Bus
06:00 - 09:00
250 250 2 2 21 29 14 18 30% 38% 8 / 12 9 / 19 Std. Bus Std. Bus
2013 2014
2 2 53 51 35
09:00 - 15:00
630 625 2 2 45 45 30 30 61% 61% 16 / 20 15 / 19 Std. Bus Std. Bus
Std. BusStd. Bus
17 21 / 17 Std. Bus Std. Bus
21:00 - 01:00
181 181 1 1 35 34 20 19 39% 38% 15 / 11 16 / 12 Std. Bus
28 55% 57% 17 / 16 19 / 1318:00 - 21:00
265 262 2 2 43 47 27
Satu
rday
01:00 - 06:00
23 23 1 1 12 12 9 8 18% 17% / 7 / 6
34 71% 68% 24 /15:00 - 18:00
327 318
2013 2014
Sund
ay/H
olid
ay
01:00 - 06:00
15:00 - 18:00
370 359 2
Std. Bus
TimeAnnual Revenue
HoursAverage Trips
per HourAverage Boardings
per Hour Average Boardings
per TripAverage Capacity
Utilization
Average Peak Passenger LoadVehicle Type(EB / WB)
09:00 - 15:00
713 701 2 2 41 42 28 29 56% 57% 15 / 19 14 / 20 Std. Bus Std. Bus
06:00 - 09:00
170 167 2 2 29 37 16 21 31% 41% 8 / 12 12 / 15 Std. Bus Std. Bus
18 16 / 19 Std. Bus Std. Bus
18:00 - 21:00
308 303 2 2 33 33 20 20 40% 41% 14 / 11 15 /
2 45 45 31 31 62% 62% 18 /
12 Std. Bus Std. Bus
21:00 - 01:00
211 210 1 1 21 25 13 15 25% 30% 9 / 8 15 / 8 Std. Bus Std. Bus
6
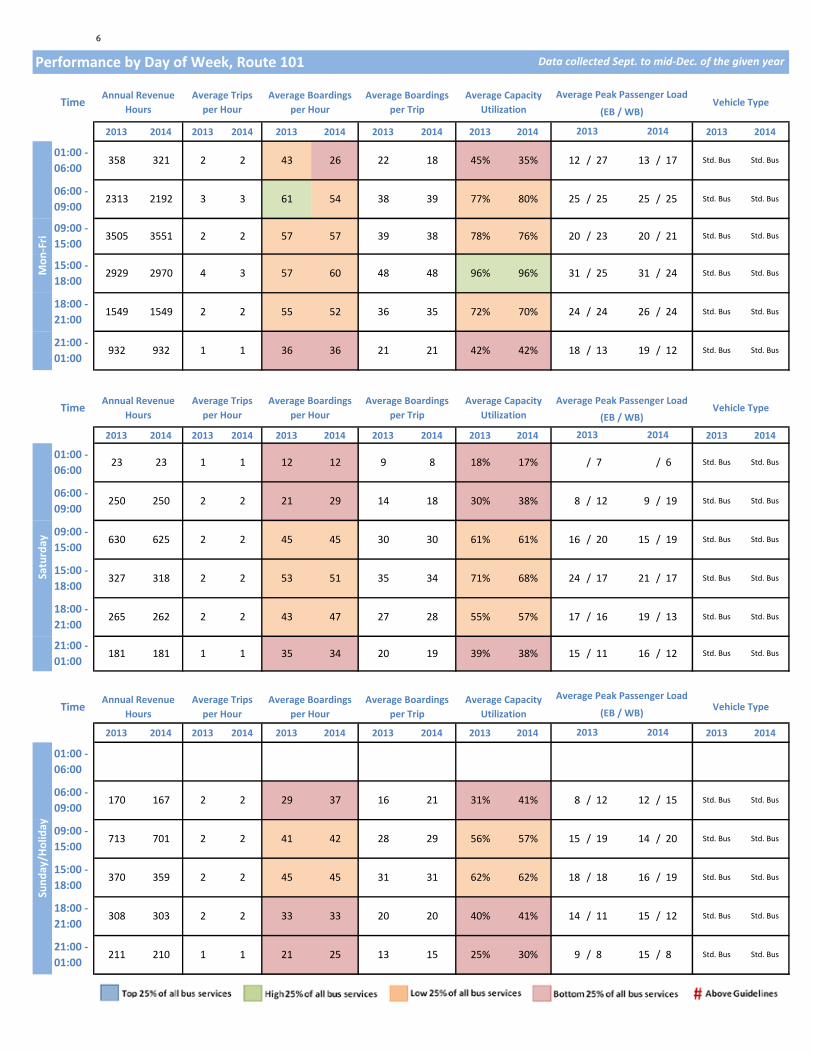
104Key Characteristics
Subregion of Primary Service: Predominant Vehicle Type:
Population (People, 400m Buffer): Employment (Jobs, 400m Buffer): Walkability (intersection density):
Contributes to FTN (Y/N):
Cost & Performance2012 2013 2014 Rank (2014)
Annual Boardings: 649,000 651,000 678,000 89 of 212Annual Service Cost: $1,120,000 $1,160,000 $1,160,000 94 of 219
Annual Revenue Hours: 11,300 11,700 11,700 102 of 219Cost /Boarded Passenger: $1.73 $1.78 $1.71 80 of 212
Avg. Boardings / Rev. Hour: 57 56 58 71 of 212Avg. Daily Boardings (Mon-Fri): 2,300 2,350 2,450 81 of 210
Avg. Daily Boardings (Saturdays): 700 700 750 98 of 179Avg. Daily Boardings (Sun & Holidays): 500 500 500 106 of 171
Peak Passenger Load (Bi-directional Avg.): 21 22 22 83 of 212Peak Load Factor (Vehicle Occupancy): 0.43 0.44 0.45 82 of 212
Average Capacity Utilization (Passenger Turnover): 47% 47% 47% 121 of 212Annual Revenue Hours Above Guidelines (Crowding): 0% 0% 0% 1 of 212
Service Changes Since 2012
Route 104
N.Delta/Surrey/Langley/W.Rock
12,500Low (0.1 int./hect.)
Std. Bus6,000
No
- Summer 2012, M-F: introduce early AM trip leaving from 22nd St Stn at 5:50 AM
Productivity
19% 22%
25%
34%
0% 5%
30%
65%
14%
33%
22%
32%
0% 4%
38%
57%
19%
26% 26% 30%
0% 4%
36%
60%
0%
10%
20%
30%
40%
50%
60%
70%
80%
90%
100%
Top 25% Middle High 25% Middle Low 25% Bottom 25% Top 25% Middle High 25% Middle Low 25% Bottom 25%
Boardings Per Revenue Hour Capacity Utilization
Perc
ent o
f Rev
enue
Hou
rs w
ithin
gi
ven
Prod
uctiv
ity B
and
7

Performance by Day of Week, Route 104
2013 2014 2013 2014 2013 2014 2013 2014 2013 2014 2013 2014
2013 2014 2013 2014 2013 2014 2013 2014 2013 2014 2013 2014
2013 2014 2013 2014 2013 2014 2013 2014 2013 2014 2013 2014
Data collected Sept. to mid-Dec. of the given year
Time Annual Revenue Hours
Average Trips per Hour
Average Boardings per Hour
Average Boardings per Trip
Average Capacity Utilization
Average Peak Passenger LoadVehicle Type
(NB / SB)
Std. Bus Std. Bus
06:00 - 09:00
2825 2825 5 5 74 74 33 34 66% 68% 27 / 33 26 / 36 Std. Bus
2013 2014
Mon
-Fri
01:00 - 06:00
192 192 2 2 71 68 27 25 53% 51% / 29 / 25
18:00 - 21:00
1308
15:00 - 18:00
2454 2454 4 4 67 69 31 30 61% 60% 35 / 24 32 / 24 Std. Bus Std. Bus
Std. Bus
09:00 - 15:00
2593 2589 2 2 42 43 19 19 38% 39% 19 / 17 20 / 16 Std. Bus Std. Bus
Time Annual Revenue Hours
Average Trips per Hour
Average Boardings per Hour
Average Boardings per Trip
Average Capacity Utilization
Average Peak Passenger LoadVehicle Type
(NB / SB)
21:00 - 01:00
572 572 1 1 41 44 13 13 25% 26% 9 / 15 10 / 16 Std. Bus Std. Bus
12 / 24 13 / 27 Std. Bus Std. Bus1308 3 3 47 51 19 20 36% 40%
06:00 - 09:00
162 161 2 2 37 39 13 13 25% 26% 12 / 13 11 / 16 Std. Bus Std. Bus
2013 2014
2 2 41 44 16
09:00 - 15:00
358 363 2 2 31 39 12 14 25% 29% 14 / 9 17 / 12 Std. Bus Std. Bus
Std. BusStd. Bus
15 24 / 12 Std. Bus Std. Bus
21:00 - 01:00
113 111 1 1 32 41 10 12 19% 23% 5 / 12 4 / 14 Std. Bus
15 24% 29% 12 / 12 12 / 1718:00 - 21:00
103 104 1 1 28 47 12
Satu
rday
01:00 - 06:00
18 31% 37% 16 /15:00 - 18:00
183 185
2013 2014
Sund
ay/H
olid
ay
01:00 - 06:00
15:00 - 18:00
216 216 2
Std. Bus
TimeAnnual Revenue
HoursAverage Trips
per HourAverage Boardings
per Hour Average Boardings
per TripAverage Capacity
Utilization
Average Peak Passenger LoadVehicle Type(NB / SB)
09:00 - 15:00
363 363 2 2 35 32 11 11 22% 22% 9 / 11 13 / 8 Std. Bus Std. Bus
06:00 - 09:00
35 35 1 1 24 34 9 12 17% 23% 10 / 8 16 / 14 Std. Bus Std. Bus
11 16 / 15 Std. Bus Std. Bus
18:00 - 21:00
110 110 1 1 40 38 13 12 26% 23% 9 / 17 7 /
2 46 48 15 16 30% 31% 19 /
17 Std. Bus Std. Bus
21:00 - 01:00
137 137 1 1 3 / 8 3 / 11 Std. Bus Std. Bus
8
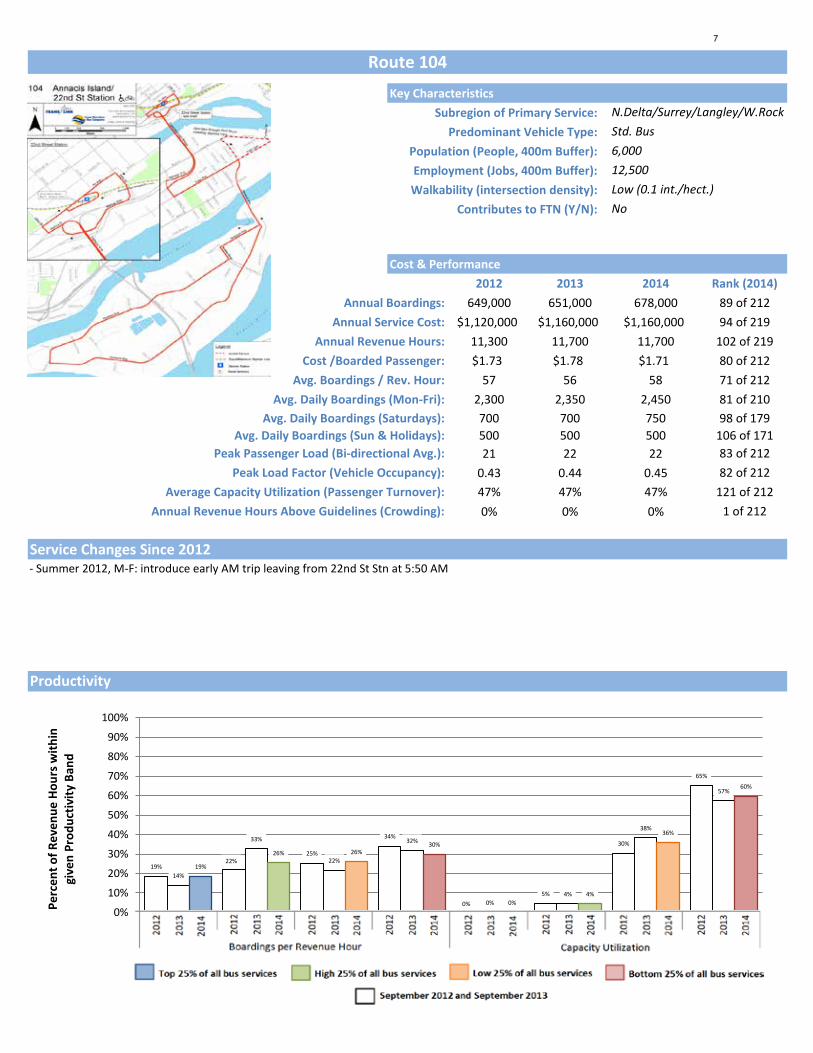
106Key Characteristics
Subregion of Primary Service: Predominant Vehicle Type:
Population (People, 400m Buffer): Employment (Jobs, 400m Buffer): Walkability (intersection density):
Contributes to FTN (Y/N):
Cost & Performance2012 2013 2014 Rank (2014)
Annual Boardings: 5,288,000 5,500,000 5,473,000 12 of 212Annual Service Cost: $5,229,000 $5,273,000 $5,487,000 16 of 219
Annual Revenue Hours: 52,800 53,300 55,400 16 of 219Cost /Boarded Passenger: $0.99 $0.96 $1.00 9 of 212
Avg. Boardings / Rev. Hour: 100 103 99 9 of 212Avg. Daily Boardings (Mon-Fri): 16,100 17,000 16,650 12 of 210
Avg. Daily Boardings (Saturdays): 12,150 12,500 13,000 11 of 179Avg. Daily Boardings (Sun & Holidays): 9,500 9,500 10,100 13 of 171
Peak Passenger Load (Bi-directional Avg.): 31 31 30 30 of 212Peak Load Factor (Vehicle Occupancy): 0.61 0.61 0.61 24 of 212
Average Capacity Utilization (Passenger Turnover): 160% 159% 163% 10 of 212Annual Revenue Hours Above Guidelines (Crowding): 4% 1% 0% 1 of 212
Service Changes Since 2012
Route 106
Burnaby/New Westminster
34,000High (0.38 int./hect.)
Std. Bus57,500
Yes
- Summer 2012, Improve Sat freq from 12 to 10mbtw 11-18hr
- Winter 2013, Increase EB freq from 10 to 7.5m to match WB freq during PM peak (M-F)- Summer 2012, M-F discontinue 4:54 & 5:14 AM & Sat 4:53 AM trips from Edmonds Stn
- Spring 2012, Reduce freq from 15 to 20m: Sat btw 6-7hr; S/H btw 6-8hr
Productivity
67%
22%
7% 5%
67%
22%
4% 6%
68%
24%
6% 3%
71%
21%
5% 3%
76%
17%
4% 3%
75%
18%
4% 3%
0%
10%
20%
30%
40%
50%
60%
70%
80%
90%
100%
Top 25% Middle High 25% Middle Low 25% Bottom 25% Top 25% Middle High 25% Middle Low 25% Bottom 25%
Boardings Per Revenue Hour Capacity Utilization
Perc
ent o
f Rev
enue
Hou
rs w
ithin
gi
ven
Prod
uctiv
ity B
and
9

Performance by Day of Week, Route 106
2013 2014 2013 2014 2013 2014 2013 2014 2013 2014 2013 2014
2013 2014 2013 2014 2013 2014 2013 2014 2013 2014 2013 2014
2013 2014 2013 2014 2013 2014 2013 2014 2013 2014 2013 2014
Data collected Sept. to mid-Dec. of the given year
Time Annual Revenue Hours
Average Trips per Hour
Average Boardings per Hour
Average Boardings per Trip
Average Capacity Utilization
Average Peak Passenger LoadVehicle Type
(EB / WB)
Std. Bus Std. Bus
06:00 - 09:00
7145 7204 7 7 88 90 74 77 150% 156% 28 / 42 27 / 41 Std. Bus
2013 2014
Mon
-Fri
01:00 - 06:00
1626 1630 3 3 38 41 24 24 52% 53% 15 / 16 14 / 16
18:00 - 21:00
5063
15:00 - 18:00
8812 10242 7 8 105 102 98 97 196% 193% 38 / 37 39 / 30 Std. Bus Std. Bus
Std. Bus
09:00 - 15:00
14639 14689 6 6 96 97 91 92 181% 184% 28 / 34 28 / 33 Std. Bus Std. Bus
Time Annual Revenue Hours
Average Trips per Hour
Average Boardings per Hour
Average Boardings per Trip
Average Capacity Utilization
Average Peak Passenger LoadVehicle Type
(EB / WB)
21:00 - 01:00
3075 3112 3 3 67 67 49 51 98% 102% 26 / 20 24 / 20 Std. Bus Std. Bus
32 / 24 30 / 31 Std. Bus Std. Bus4930 5 5 84 93 70 76 141% 153%
Std. Bus Std. Bus
06:00 - 09:00
684 746 4 4 55 60 44 45 88% 92% 16 / 24 16 / 24 Std. Bus Std. Bus
2013 2014
6 6 92 92 86
09:00 - 15:00
2761 2943 6 6 91 102 85 92 170% 185% 25 / 36 30 / 37 Std. Bus Std. Bus
Std. BusStd. Bus
33 36 / 26 Std. Bus Std. Bus
21:00 - 01:00
645 688 3 3 65 68 50 50 98% 99% 24 / 10 35 / 20 Std. Bus
74 126% 148% 25 / 24 35 / 2418:00 - 21:00
879 952 4 4 73 87 63
Satu
rday
01:00 - 06:00
212 217 3 3 22 20 15 12 31% 25% 10 / 12 11 / 10
87 172% 174% 33 /15:00 - 18:00
1499 1606
2013 2014
Sund
ay/H
olid
ay
01:00 - 06:00
105 106 2 2 21 47 10 21 22% 45% 3 / 24 14 / 33
15:00 - 18:00
1385 1427 5
Std. Bus
TimeAnnual Revenue
HoursAverage Trips
per HourAverage Boardings
per Hour Average Boardings
per TripAverage Capacity
Utilization
Average Peak Passenger LoadVehicle Type(EB / WB)
09:00 - 15:00
2482 2581 5 5 101 105 85 88 171% 176% 27 / 35 26 / 34 Std. Bus Std. Bus
Std. Bus Std. Bus
06:00 - 09:00
682 701 3 3 52 56 37 39 76% 80% 16 / 20 19 / 20 Std. Bus Std. Bus
27 36 / 30 Std. Bus Std. Bus
18:00 - 21:00
992 1048 4 4 77 84 56 59 113% 119% 25 / 17 32 /
5 91 99 82 87 165% 174% 28 /
19 Std. Bus Std. Bus
21:00 - 01:00
584 607 2 2 55 61 38 43 76% 87% 18 / 17 18 / 19 Std. Bus Std. Bus
10

110Key Characteristics
Subregion of Primary Service: Predominant Vehicle Type:
Population (People, 400m Buffer): Employment (Jobs, 400m Buffer): Walkability (intersection density):
Contributes to FTN (Y/N):
Cost & Performance2012 2013 2014 Rank (2014)
Annual Boardings: 737,000 749,000 790,000 76 of 212Annual Service Cost: $2,102,000 $2,148,000 $2,199,000 53 of 219
Annual Revenue Hours: 21,200 21,700 22,200 55 of 219Cost /Boarded Passenger: $2.85 $2.87 $2.78 145 of 212
Avg. Boardings / Rev. Hour: 35 35 36 128 of 212Avg. Daily Boardings (Mon-Fri): 2,500 2,550 2,650 75 of 210
Avg. Daily Boardings (Saturdays): 950 1,000 1,300 83 of 179Avg. Daily Boardings (Sun & Holidays): 900 950 1,000 83 of 171
Peak Passenger Load (Bi-directional Avg.): 14 15 15 122 of 212Peak Load Factor (Vehicle Occupancy): 0.28 0.30 0.31 137 of 212
Average Capacity Utilization (Passenger Turnover): 55% 58% 62% 82 of 212Annual Revenue Hours Above Guidelines (Crowding): 2% 0% 0% 1 of 212
Service Changes Since 2012
Route 110
Burnaby/New Westminster
29,500Medium (0.2 int./hect.)
Std. Bus36,500
No
- No service change between 2012 and September 2014
Productivity
3% 4%
29%
64%
5% 8%
32%
55%
0%
18% 13%
68%
3%
12%
35%
50%
0%
14%
25%
61%
3%
23% 28%
46%
0%
10%
20%
30%
40%
50%
60%
70%
80%
90%
100%
Top 25% Middle High 25% Middle Low 25% Bottom 25% Top 25% Middle High 25% Middle Low 25% Bottom 25%
Boardings Per Revenue Hour Capacity Utilization
Perc
ent o
f Rev
enue
Hou
rs w
ithin
gi
ven
Prod
uctiv
ity B
and
11

Performance by Day of Week, Route 110
2013 2014 2013 2014 2013 2014 2013 2014 2013 2014 2013 2014
2013 2014 2013 2014 2013 2014 2013 2014 2013 2014 2013 2014
2013 2014 2013 2014 2013 2014 2013 2014 2013 2014 2013 2014
Data collected Sept. to mid-Dec. of the given year
Time Annual Revenue Hours
Average Trips per Hour
Average Boardings per Hour
Average Boardings per Trip
Average Capacity Utilization
Average Peak Passenger LoadVehicle Type
(EB / WB)
Std. Bus Std. Bus
06:00 - 09:00
3438 3529 4 4 56 57 45 47 92% 95% 19 / 26 21 / 25 Std. Bus
2013 2014
Mon
-Fri
01:00 - 06:00
705 713 1 1 18 19 11 11 25% 25% 6 / 10 8 / 9
18:00 - 21:00
2079
15:00 - 18:00
3891 3979 3 3 51 52 46 44 91% 89% 17 / 28 20 / 20 Std. Bus Std. Bus
Std. Bus
09:00 - 15:00
4625 4737 2 2 34 39 30 34 59% 68% 10 / 19 14 / 18 Std. Bus Std. Bus
Time Annual Revenue Hours
Average Trips per Hour
Average Boardings per Hour
Average Boardings per Trip
Average Capacity Utilization
Average Peak Passenger LoadVehicle Type
(EB / WB)
21:00 - 01:00
1697 1725 2 2 13 20 9 13 17% 26% 7 / 5 9 / 8 Std. Bus Std. Bus
11 / 8 12 / 10 Std. Bus Std. Bus2146 2 2 20 26 18 22 37% 44%
Std. Bus Std. Bus
06:00 - 09:00
390 390 2 2 13 14 11 12 23% 24% 6 / 8 5 / 10 Std. Bus Std. Bus
2013 2014
2 2 27 35 24
09:00 - 15:00
881 881 2 2 23 32 21 28 41% 56% 10 / 12 11 / 17 Std. Bus Std. Bus
Std. BusStd. Bus
13 15 / 14 Std. Bus Std. Bus
21:00 - 01:00
368 368 2 2 8 6 11% 3 / 4 13 / 6 Std. Bus
19 30% 38% 12 / 8 15 / 718:00 - 21:00
426 426 2 2 16 22 15
Satu
rday
01:00 - 06:00
16 16 1 1
31 48% 61% 8 /15:00 - 18:00
447 447
2013 2014
Sund
ay/H
olid
ay
01:00 - 06:00
18 18 1 1
15:00 - 18:00
540 559 2
Std. Bus
TimeAnnual Revenue
HoursAverage Trips
per HourAverage Boardings
per Hour Average Boardings
per TripAverage Capacity
Utilization
Average Peak Passenger LoadVehicle Type(EB / WB)
09:00 - 15:00
1046 1093 2 2 20 27 19 24 37% 48% 10 / 11 9 / 17 Std. Bus Std. Bus
Std. Bus Std. Bus
06:00 - 09:00
240 246 2 2 17 17 13 14 25% 28% 7 / 9 6 / 11 Std. Bus Std. Bus
12 13 / 9 Std. Bus Std. Bus
18:00 - 21:00
485 511 2 2 16 14 14 12 29% 25% 8 / 8 10 /
2 20 22 18 20 36% 40% 9 /
6 Std. Bus Std. Bus
21:00 - 01:00
413 425 2 2 11 12 8 8 15% 16% 5 / 6 6 / 4 Std. Bus Std. Bus
12
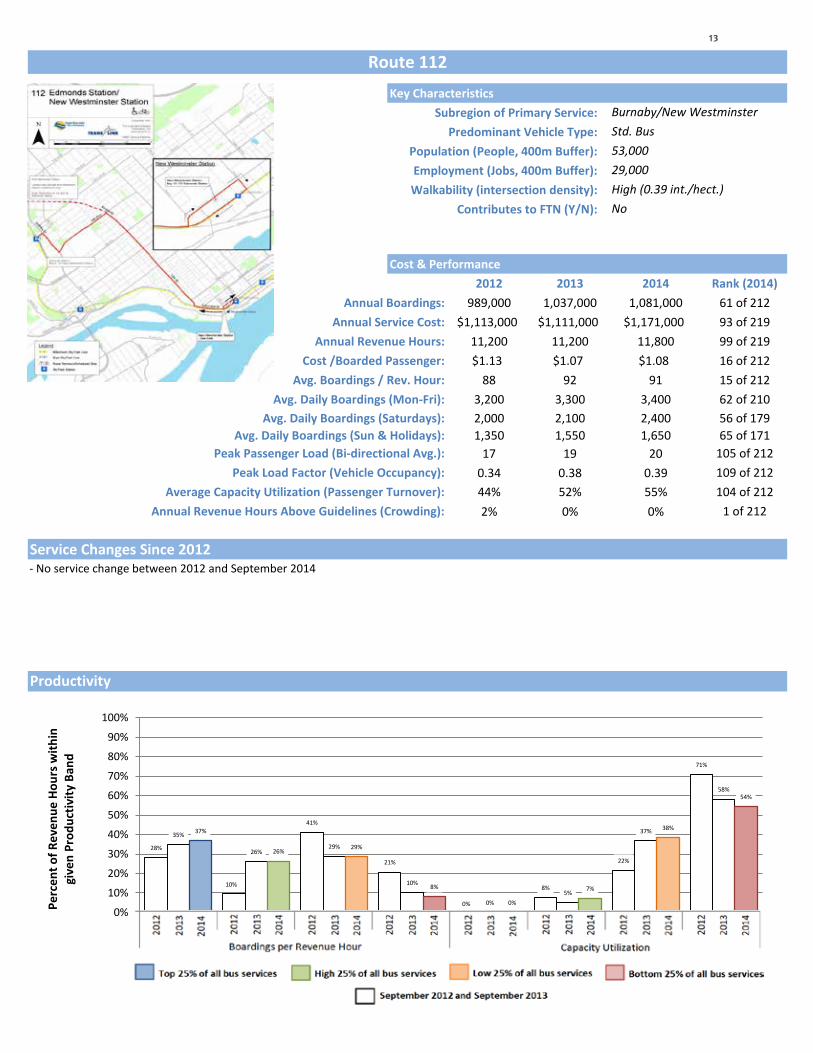
112Key Characteristics
Subregion of Primary Service: Predominant Vehicle Type:
Population (People, 400m Buffer): Employment (Jobs, 400m Buffer): Walkability (intersection density):
Contributes to FTN (Y/N):
Cost & Performance2012 2013 2014 Rank (2014)
Annual Boardings: 989,000 1,037,000 1,081,000 61 of 212Annual Service Cost: $1,113,000 $1,111,000 $1,171,000 93 of 219
Annual Revenue Hours: 11,200 11,200 11,800 99 of 219Cost /Boarded Passenger: $1.13 $1.07 $1.08 16 of 212
Avg. Boardings / Rev. Hour: 88 92 91 15 of 212Avg. Daily Boardings (Mon-Fri): 3,200 3,300 3,400 62 of 210
Avg. Daily Boardings (Saturdays): 2,000 2,100 2,400 56 of 179Avg. Daily Boardings (Sun & Holidays): 1,350 1,550 1,650 65 of 171
Peak Passenger Load (Bi-directional Avg.): 17 19 20 105 of 212Peak Load Factor (Vehicle Occupancy): 0.34 0.38 0.39 109 of 212
Average Capacity Utilization (Passenger Turnover): 44% 52% 55% 104 of 212Annual Revenue Hours Above Guidelines (Crowding): 2% 0% 0% 1 of 212
Service Changes Since 2012
Route 112
Burnaby/New Westminster
29,000High (0.39 int./hect.)
Std. Bus53,000
No
- No service change between 2012 and September 2014
Productivity
28%
10%
41%
21%
0%
8%
22%
71%
35%
26% 29%
10%
0% 5%
37%
58%
37%
26% 29%
8%
0%
7%
38%
54%
0%
10%
20%
30%
40%
50%
60%
70%
80%
90%
100%
Top 25% Middle High 25% Middle Low 25% Bottom 25% Top 25% Middle High 25% Middle Low 25% Bottom 25%
Boardings Per Revenue Hour Capacity Utilization
Perc
ent o
f Rev
enue
Hou
rs w
ithin
gi
ven
Prod
uctiv
ity B
and
13
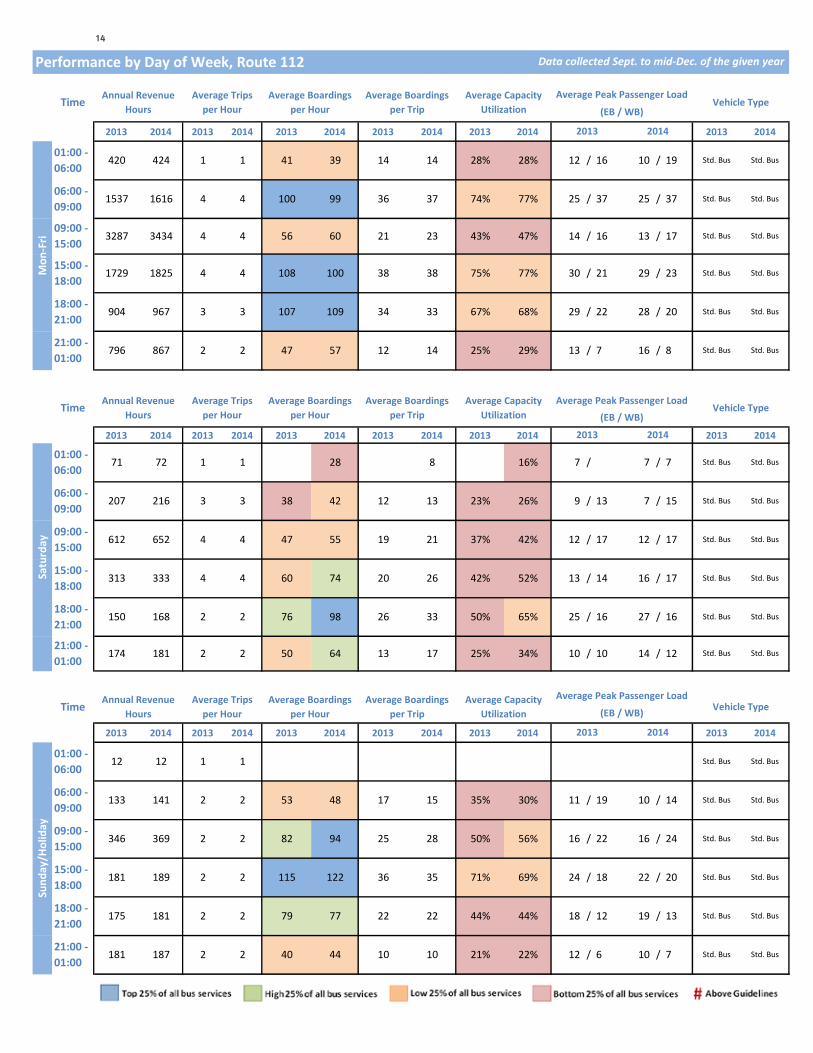
Performance by Day of Week, Route 112
2013 2014 2013 2014 2013 2014 2013 2014 2013 2014 2013 2014
2013 2014 2013 2014 2013 2014 2013 2014 2013 2014 2013 2014
2013 2014 2013 2014 2013 2014 2013 2014 2013 2014 2013 2014
Data collected Sept. to mid-Dec. of the given year
Time Annual Revenue Hours
Average Trips per Hour
Average Boardings per Hour
Average Boardings per Trip
Average Capacity Utilization
Average Peak Passenger LoadVehicle Type
(EB / WB)
Std. Bus Std. Bus
06:00 - 09:00
1537 1616 4 4 100 99 36 37 74% 77% 25 / 37 25 / 37 Std. Bus
2013 2014
Mon
-Fri
01:00 - 06:00
420 424 1 1 41 39 14 14 28% 28% 12 / 16 10 / 19
18:00 - 21:00
904
15:00 - 18:00
1729 1825 4 4 108 100 38 38 75% 77% 30 / 21 29 / 23 Std. Bus Std. Bus
Std. Bus
09:00 - 15:00
3287 3434 4 4 56 60 21 23 43% 47% 14 / 16 13 / 17 Std. Bus Std. Bus
Time Annual Revenue Hours
Average Trips per Hour
Average Boardings per Hour
Average Boardings per Trip
Average Capacity Utilization
Average Peak Passenger LoadVehicle Type
(EB / WB)
21:00 - 01:00
796 867 2 2 47 57 12 14 25% 29% 13 / 7 16 / 8 Std. Bus Std. Bus
29 / 22 28 / 20 Std. Bus Std. Bus967 3 3 107 109 34 33 67% 68%
Std. Bus Std. Bus
06:00 - 09:00
207 216 3 3 38 42 12 13 23% 26% 9 / 13 7 / 15 Std. Bus Std. Bus
2013 2014
4 4 60 74 20
09:00 - 15:00
612 652 4 4 47 55 19 21 37% 42% 12 / 17 12 / 17 Std. Bus Std. Bus
Std. BusStd. Bus
14 16 / 17 Std. Bus Std. Bus
21:00 - 01:00
174 181 2 2 50 64 13 17 25% 34% 10 / 10 14 / 12 Std. Bus
33 50% 65% 25 / 16 27 / 1618:00 - 21:00
150 168 2 2 76 98 26
Satu
rday
01:00 - 06:00
71 72 1 1 28 8 16% 7 / 7 / 7
26 42% 52% 13 /15:00 - 18:00
313 333
2013 2014
Sund
ay/H
olid
ay
01:00 - 06:00
12 12 1 1
15:00 - 18:00
181 189 2
Std. Bus
TimeAnnual Revenue
HoursAverage Trips
per HourAverage Boardings
per Hour Average Boardings
per TripAverage Capacity
Utilization
Average Peak Passenger LoadVehicle Type(EB / WB)
09:00 - 15:00
346 369 2 2 82 94 25 28 50% 56% 16 / 22 16 / 24 Std. Bus Std. Bus
Std. Bus Std. Bus
06:00 - 09:00
133 141 2 2 53 48 17 15 35% 30% 11 / 19 10 / 14 Std. Bus Std. Bus
18 22 / 20 Std. Bus Std. Bus
18:00 - 21:00
175 181 2 2 79 77 22 22 44% 44% 18 / 12 19 /
2 115 122 36 35 71% 69% 24 /
13 Std. Bus Std. Bus
21:00 - 01:00
181 187 2 2 40 44 10 10 21% 22% 12 / 6 10 / 7 Std. Bus Std. Bus
14
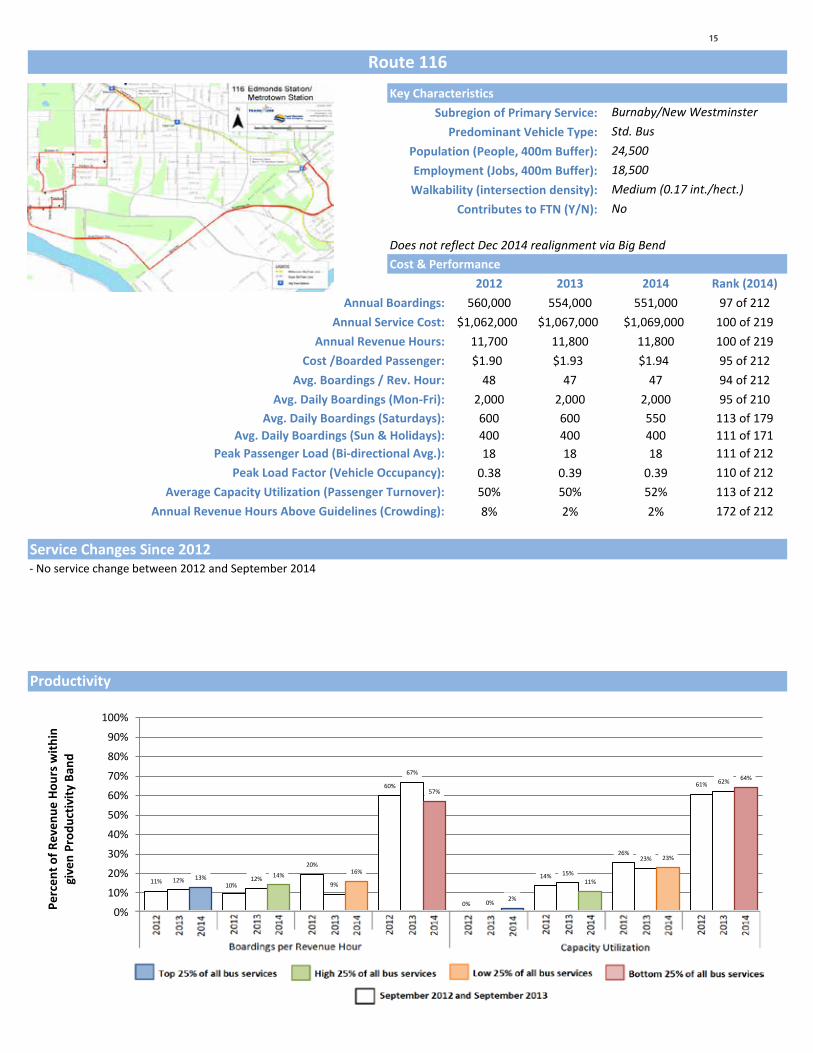
116Key Characteristics
Subregion of Primary Service: Predominant Vehicle Type:
Population (People, 400m Buffer): Employment (Jobs, 400m Buffer): Walkability (intersection density):
Contributes to FTN (Y/N):
Cost & Performance2012 2013 2014 Rank (2014)
Annual Boardings: 560,000 554,000 551,000 97 of 212Annual Service Cost: $1,062,000 $1,067,000 $1,069,000 100 of 219
Annual Revenue Hours: 11,700 11,800 11,800 100 of 219Cost /Boarded Passenger: $1.90 $1.93 $1.94 95 of 212
Avg. Boardings / Rev. Hour: 48 47 47 94 of 212Avg. Daily Boardings (Mon-Fri): 2,000 2,000 2,000 95 of 210
Avg. Daily Boardings (Saturdays): 600 600 550 113 of 179Avg. Daily Boardings (Sun & Holidays): 400 400 400 111 of 171
Peak Passenger Load (Bi-directional Avg.): 18 18 18 111 of 212Peak Load Factor (Vehicle Occupancy): 0.38 0.39 0.39 110 of 212
Average Capacity Utilization (Passenger Turnover): 50% 50% 52% 113 of 212Annual Revenue Hours Above Guidelines (Crowding): 8% 2% 2% 172 of 212
Service Changes Since 2012
Route 116
Burnaby/New Westminster
18,500Medium (0.17 int./hect.)
Std. Bus24,500
Does not reflect Dec 2014 realignment via Big Bend
No
- No service change between 2012 and September 2014
Productivity
11% 10%
20%
60%
0%
14%
26%
61%
12% 12% 9%
67%
0%
15%
23%
62%
13% 14% 16%
57%
2%
11%
23%
64%
0%
10%
20%
30%
40%
50%
60%
70%
80%
90%
100%
Top 25% Middle High 25% Middle Low 25% Bottom 25% Top 25% Middle High 25% Middle Low 25% Bottom 25%
Boardings Per Revenue Hour Capacity Utilization
Perc
ent o
f Rev
enue
Hou
rs w
ithin
gi
ven
Prod
uctiv
ity B
and
15

Performance by Day of Week, Route 116
2013 2014 2013 2014 2013 2014 2013 2014 2013 2014 2013 2014
2013 2014 2013 2014 2013 2014 2013 2014 2013 2014 2013 2014
2013 2014 2013 2014 2013 2014 2013 2014 2013 2014 2013 2014
Data collected Sept. to mid-Dec. of the given year
Time Annual Revenue Hours
Average Trips per Hour
Average Boardings per Hour
Average Boardings per Trip
Average Capacity Utilization
Average Peak Passenger LoadVehicle Type
(EB / WB)
Std. Bus Std. Bus
06:00 - 09:00
2063 2063 3 3 75 69 41 40 85% 83% 26 / 44 24 / 44 Std. Bus
2013 2014
Mon
-Fri
01:00 - 06:00
204 204 1 1 17 23 10 14 21% 28% 5 / 10 4 / 13
18:00 - 21:00
1296
15:00 - 18:00
2259 2284 3 3 60 65 37 40 73% 80% 40 / 21 39 / 22 Std. Bus Std. Bus
Std. Bus
09:00 - 15:00
2763 2763 2 2 30 31 19 19 37% 38% 11 / 15 10 / 15 Std. Bus Std. Bus
Time Annual Revenue Hours
Average Trips per Hour
Average Boardings per Hour
Average Boardings per Trip
Average Capacity Utilization
Average Peak Passenger LoadVehicle Type
(EB / WB)
21:00 - 01:00
600 600 2 2 15 14 7 7 14% 14% 8 / 3 6 / 5 Std. Bus Std. Bus
9 / 5 10 / 8 Std. Bus Std. Bus1296 2 2 21 27 10 12 20% 25%
06:00 - 09:00
99 99 2 2 24 25 14 14 51% 54% 4 / 14 5 / 11 Mini- Bus Mini- Bus
2013 2014
2 2 28 25 14
09:00 - 15:00
520 520 2 2 21 22 10 11 43% 45% 5 / 8 5 / 8 Mini- Bus Mini- Bus
Mini- BusMini- Bus
10 10 / 7 Mini- Bus Mini- Bus
21:00 - 01:00
120 120 2 2 8 10 3 5 14% 19% 3 / 1 3 / 3 Mini- Bus
7 29% 30% 5 / 4 6 / 518:00 - 21:00
255 255 2 2 14 15 7
Satu
rday
01:00 - 06:00
13 58% 53% 8 /15:00 - 18:00
248 248
2013 2014
Sund
ay/H
olid
ay
01:00 - 06:00
15:00 - 18:00
292 292 2
Mini- Bus
TimeAnnual Revenue
HoursAverage Trips
per HourAverage Boardings
per Hour Average Boardings
per TripAverage Capacity
Utilization
Average Peak Passenger LoadVehicle Type(EB / WB)
09:00 - 15:00
614 614 2 2 18 17 9 8 36% 34% 5 / 6 4 / 6 Mini- Bus Mini- Bus
06:00 - 09:00
4 8 / 7 Mini- Bus Mini- Bus
18:00 - 21:00
296 296 2 2 12 14 6 7 25% 30% 6 / 2 6 /
2 19 24 9 12 38% 50% 7 /
3 Mini- Bus Mini- Bus
21:00 - 01:00
138 138 2 2 9 9 4 4 16% 17% 4 / 2 3 / 2 Mini- Bus Mini- Bus
16

123Key Characteristics
Subregion of Primary Service: Predominant Vehicle Type:
Population (People, 400m Buffer): Employment (Jobs, 400m Buffer): Walkability (intersection density):
Contributes to FTN (Y/N):
Cost & Performance2012 2013 2014 Rank (2014)
Annual Boardings: 1,597,000 1,811,000 1,968,000 39 of 212Annual Service Cost: $2,827,000 $2,859,000 $2,822,000 41 of 219
Annual Revenue Hours: 28,600 28,900 28,500 41 of 219Cost /Boarded Passenger: $1.77 $1.58 $1.43 50 of 212
Avg. Boardings / Rev. Hour: 56 63 69 47 of 212Avg. Daily Boardings (Mon-Fri): 5,100 6,000 6,300 38 of 210
Avg. Daily Boardings (Saturdays): 3,050 3,200 3,600 37 of 179Avg. Daily Boardings (Sun & Holidays): 2,350 2,300 3,200 36 of 171
Peak Passenger Load (Bi-directional Avg.): 19 23 25 70 of 212Peak Load Factor (Vehicle Occupancy): 0.39 0.46 0.50 66 of 212
Average Capacity Utilization (Passenger Turnover): 63% 74% 83% 46 of 212Annual Revenue Hours Above Guidelines (Crowding): 0% 2% 2% 170 of 212
Service Changes Since 2012
Route 123
Burnaby/New Westminster
24,500High (0.33 int./hect.)
Std. Bus34,000
Yes
- Winter 2013, Relocation of off-street transit facility at Brentwood Station during redevelopment
Productivity
7%
20%
45%
28%
0%
18%
44%
38%
13%
24%
36%
27%
4%
28%
35% 34%
23% 25%
38%
14%
8%
34% 34%
25%
0%
10%
20%
30%
40%
50%
60%
70%
80%
90%
100%
Top 25% Middle High 25% Middle Low 25% Bottom 25% Top 25% Middle High 25% Middle Low 25% Bottom 25%
Boardings Per Revenue Hour Capacity Utilization
Perc
ent o
f Rev
enue
Hou
rs w
ithin
gi
ven
Prod
uctiv
ity B
and
17
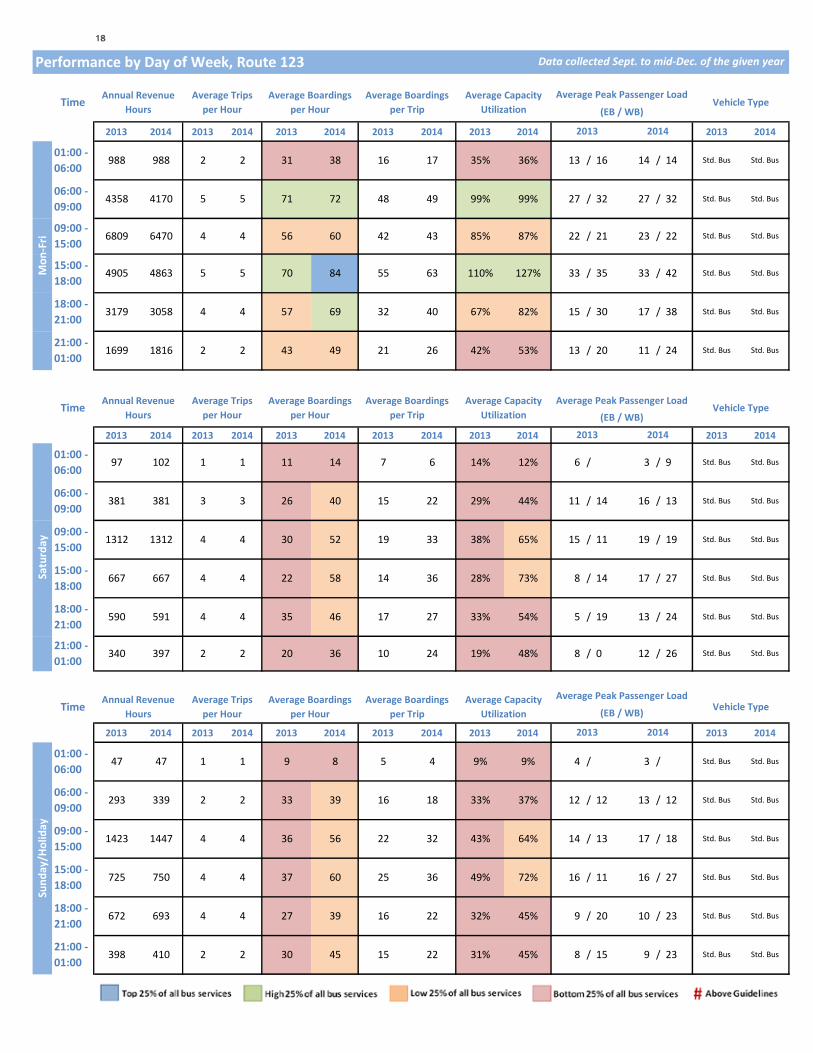
Performance by Day of Week, Route 123
2013 2014 2013 2014 2013 2014 2013 2014 2013 2014 2013 2014
2013 2014 2013 2014 2013 2014 2013 2014 2013 2014 2013 2014
2013 2014 2013 2014 2013 2014 2013 2014 2013 2014 2013 2014
Data collected Sept. to mid-Dec. of the given year
Time Annual Revenue Hours
Average Trips per Hour
Average Boardings per Hour
Average Boardings per Trip
Average Capacity Utilization
Average Peak Passenger LoadVehicle Type
(EB / WB)
Std. Bus Std. Bus
06:00 - 09:00
4358 4170 5 5 71 72 48 49 99% 99% 27 / 32 27 / 32 Std. Bus
2013 2014
Mon
-Fri
01:00 - 06:00
988 988 2 2 31 38 16 17 35% 36% 13 / 16 14 / 14
18:00 - 21:00
3179
15:00 - 18:00
4905 4863 5 5 70 84 55 63 110% 127% 33 / 35 33 / 42 Std. Bus Std. Bus
Std. Bus
09:00 - 15:00
6809 6470 4 4 56 60 42 43 85% 87% 22 / 21 23 / 22 Std. Bus Std. Bus
Time Annual Revenue Hours
Average Trips per Hour
Average Boardings per Hour
Average Boardings per Trip
Average Capacity Utilization
Average Peak Passenger LoadVehicle Type
(EB / WB)
21:00 - 01:00
1699 1816 2 2 43 49 21 26 42% 53% 13 / 20 11 / 24 Std. Bus Std. Bus
15 / 30 17 / 38 Std. Bus Std. Bus3058 4 4 57 69 32 40 67% 82%
Std. Bus Std. Bus
06:00 - 09:00
381 381 3 3 26 40 15 22 29% 44% 11 / 14 16 / 13 Std. Bus Std. Bus
2013 2014
4 4 22 58 14
09:00 - 15:00
1312 1312 4 4 30 52 19 33 38% 65% 15 / 11 19 / 19 Std. Bus Std. Bus
Std. BusStd. Bus
14 17 / 27 Std. Bus Std. Bus
21:00 - 01:00
340 397 2 2 20 36 10 24 19% 48% 8 / 0 12 / 26 Std. Bus
27 33% 54% 5 / 19 13 / 2418:00 - 21:00
590 591 4 4 35 46 17
Satu
rday
01:00 - 06:00
97 102 1 1 11 14 7 6 14% 12% 6 / 3 / 9
36 28% 73% 8 /15:00 - 18:00
667 667
2013 2014
Sund
ay/H
olid
ay
01:00 - 06:00
47 47 1 1 9 8 5 4 9% 9% 4 / 3 /
15:00 - 18:00
725 750 4
Std. Bus
TimeAnnual Revenue
HoursAverage Trips
per HourAverage Boardings
per Hour Average Boardings
per TripAverage Capacity
Utilization
Average Peak Passenger LoadVehicle Type(EB / WB)
09:00 - 15:00
1423 1447 4 4 36 56 22 32 43% 64% 14 / 13 17 / 18 Std. Bus Std. Bus
Std. Bus Std. Bus
06:00 - 09:00
293 339 2 2 33 39 16 18 33% 37% 12 / 12 13 / 12 Std. Bus Std. Bus
11 16 / 27 Std. Bus Std. Bus
18:00 - 21:00
672 693 4 4 27 39 16 22 32% 45% 9 / 20 10 /
4 37 60 25 36 49% 72% 16 /
23 Std. Bus Std. Bus
21:00 - 01:00
398 410 2 2 30 45 15 22 31% 45% 8 / 15 9 / 23 Std. Bus Std. Bus
18
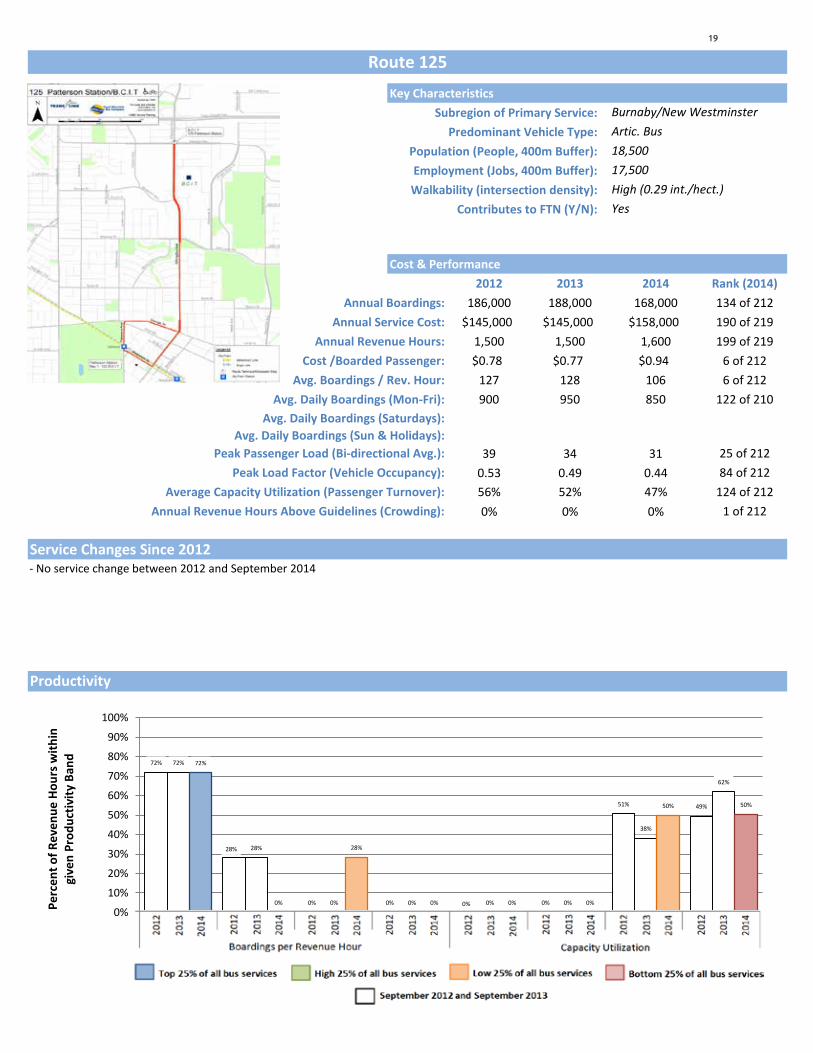
125Key Characteristics
Subregion of Primary Service: Predominant Vehicle Type:
Population (People, 400m Buffer): Employment (Jobs, 400m Buffer): Walkability (intersection density):
Contributes to FTN (Y/N):
Cost & Performance2012 2013 2014 Rank (2014)
Annual Boardings: 186,000 188,000 168,000 134 of 212Annual Service Cost: $145,000 $145,000 $158,000 190 of 219
Annual Revenue Hours: 1,500 1,500 1,600 199 of 219Cost /Boarded Passenger: $0.78 $0.77 $0.94 6 of 212
Avg. Boardings / Rev. Hour: 127 128 106 6 of 212Avg. Daily Boardings (Mon-Fri): 900 950 850 122 of 210
Avg. Daily Boardings (Saturdays): #VALUE! #VALUE! #VALUE!Avg. Daily Boardings (Sun & Holidays): #VALUE! #VALUE! #VALUE!
Peak Passenger Load (Bi-directional Avg.): 39 34 31 25 of 212Peak Load Factor (Vehicle Occupancy): 0.53 0.49 0.44 84 of 212
Average Capacity Utilization (Passenger Turnover): 56% 52% 47% 124 of 212Annual Revenue Hours Above Guidelines (Crowding): 0% 0% 0% 1 of 212
Service Changes Since 2012
Route 125
Burnaby/New Westminster
17,500High (0.29 int./hect.)
Artic. Bus18,500
Yes
- No service change between 2012 and September 2014
Productivity
72%
28%
0% 0% 0% 0%
51% 49%
72%
28%
0% 0% 0% 0%
38%
62%
72%
0%
28%
0% 0% 0%
50% 50%
0%
10%
20%
30%
40%
50%
60%
70%
80%
90%
100%
Top 25% Middle High 25% Middle Low 25% Bottom 25% Top 25% Middle High 25% Middle Low 25% Bottom 25%
Boardings Per Revenue Hour Capacity Utilization
Perc
ent o
f Rev
enue
Hou
rs w
ithin
gi
ven
Prod
uctiv
ity B
and
19
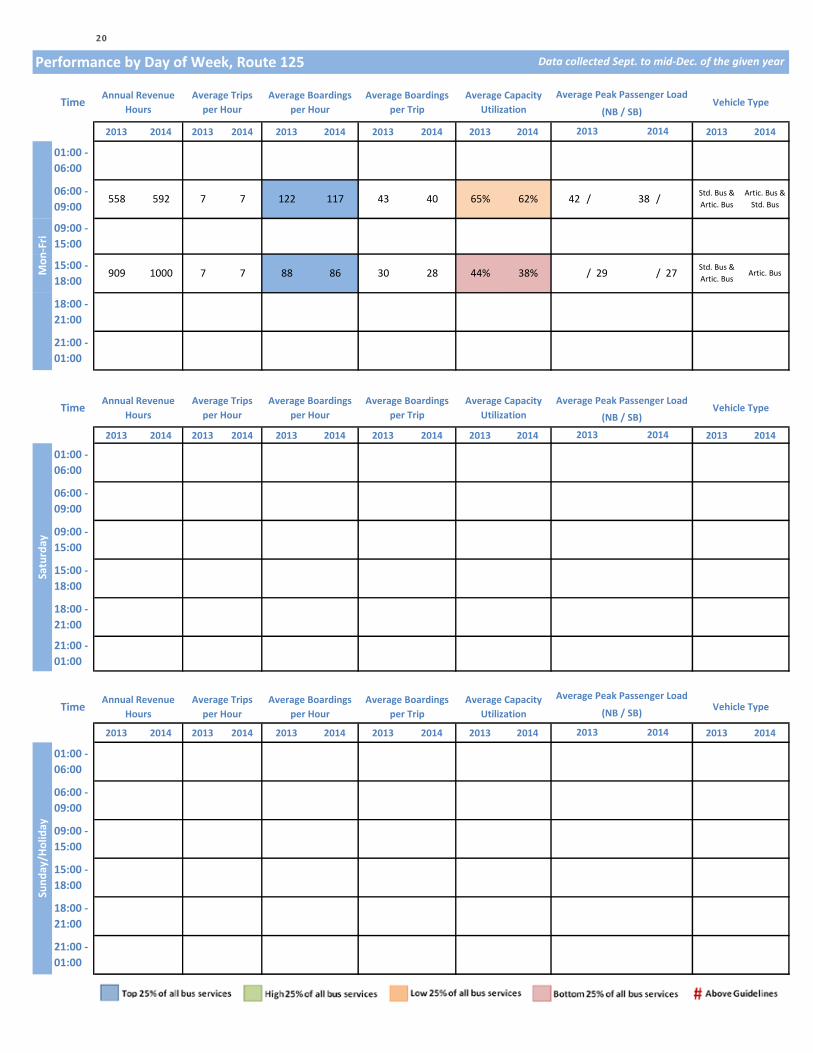
Performance by Day of Week, Route 125
2013 2014 2013 2014 2013 2014 2013 2014 2013 2014 2013 2014
2013 2014 2013 2014 2013 2014 2013 2014 2013 2014 2013 2014
2013 2014 2013 2014 2013 2014 2013 2014 2013 2014 2013 2014
Data collected Sept. to mid-Dec. of the given year
Time Annual Revenue Hours
Average Trips per Hour
Average Boardings per Hour
Average Boardings per Trip
Average Capacity Utilization
Average Peak Passenger LoadVehicle Type
(NB / SB)
06:00 - 09:00
558 592 7 7 122 117 43 40 65% 62% 42 / 38 / Std. Bus & Artic. Bus
2013 2014
Mon
-Fri
01:00 - 06:00
18:00 - 21:00
15:00 - 18:00
909 1000 7 7 88 86 30 28 44% 38% / 29 / 27 Std. Bus & Artic. Bus
Artic. Bus
Artic. Bus & Std. Bus
09:00 - 15:00
Time Annual Revenue Hours
Average Trips per Hour
Average Boardings per Hour
Average Boardings per Trip
Average Capacity Utilization
Average Peak Passenger LoadVehicle Type
(NB / SB)
21:00 - 01:00
06:00 - 09:00
2013 2014
09:00 - 15:00
21:00 - 01:00
18:00 - 21:00
Satu
rday
01:00 - 06:00
15:00 - 18:00
2013 2014
Sund
ay/H
olid
ay
01:00 - 06:00
15:00 - 18:00
TimeAnnual Revenue
HoursAverage Trips
per HourAverage Boardings
per Hour Average Boardings
per TripAverage Capacity
Utilization
Average Peak Passenger LoadVehicle Type(NB / SB)
09:00 - 15:00
06:00 - 09:00
18:00 - 21:00
21:00 - 01:00
20
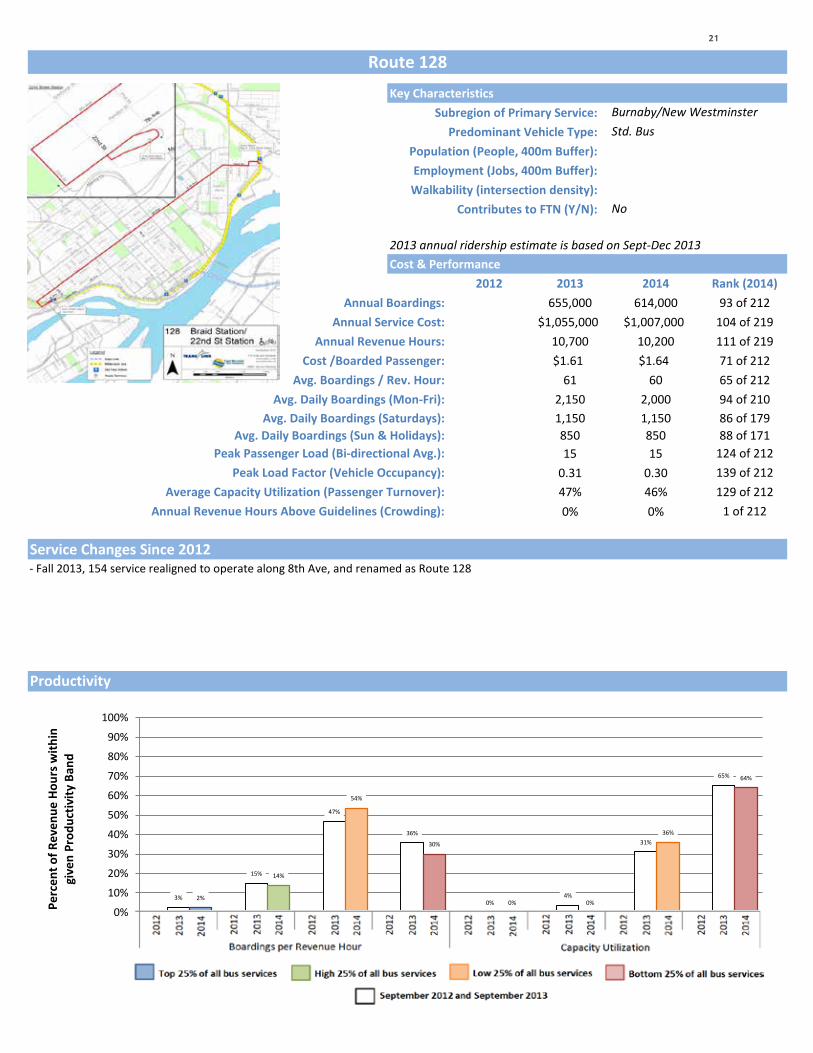
128Key Characteristics
Subregion of Primary Service: Predominant Vehicle Type:
Population (People, 400m Buffer): Employment (Jobs, 400m Buffer): Walkability (intersection density):
Contributes to FTN (Y/N):
Cost & Performance2012 2013 2014 Rank (2014)
Annual Boardings: #VALUE! 655,000 614,000 93 of 212Annual Service Cost: #VALUE! $1,055,000 $1,007,000 104 of 219
Annual Revenue Hours: #VALUE! 10,700 10,200 111 of 219Cost /Boarded Passenger: $1.61 $1.64 71 of 212
Avg. Boardings / Rev. Hour: 61 60 65 of 212Avg. Daily Boardings (Mon-Fri): #VALUE! 2,150 2,000 94 of 210
Avg. Daily Boardings (Saturdays): #VALUE! 1,150 1,150 86 of 179Avg. Daily Boardings (Sun & Holidays): #VALUE! 850 850 88 of 171
Peak Passenger Load (Bi-directional Avg.): 15 15 124 of 212Peak Load Factor (Vehicle Occupancy): 0.31 0.30 139 of 212
Average Capacity Utilization (Passenger Turnover): 47% 46% 129 of 212Annual Revenue Hours Above Guidelines (Crowding): 0% 0% 1 of 212
Service Changes Since 2012
Route 128
Burnaby/New WestminsterStd. Bus
2013 annual ridership estimate is based on Sept-Dec 2013
No
- Fall 2013, 154 service realigned to operate along 8th Ave, and renamed as Route 128
Productivity
3%
15%
47%
36%
0% 4%
31%
65%
2%
14%
54%
30%
0% 0%
36%
64%
0%
10%
20%
30%
40%
50%
60%
70%
80%
90%
100%
Top 25% Middle High 25% Middle Low 25% Bottom 25% Top 25% Middle High 25% Middle Low 25% Bottom 25%
Boardings Per Revenue Hour Capacity Utilization
Perc
ent o
f Rev
enue
Hou
rs w
ithin
gi
ven
Prod
uctiv
ity B
and
21

Performance by Day of Week, Route 128
2013 2014 2013 2014 2013 2014 2013 2014 2013 2014 2013 2014
2013 2014 2013 2014 2013 2014 2013 2014 2013 2014 2013 2014
2013 2014 2013 2014 2013 2014 2013 2014 2013 2014 2013 2014
Data collected Sept. to mid-Dec. of the given year
Time Annual Revenue Hours
Average Trips per Hour
Average Boardings per Hour
Average Boardings per Trip
Average Capacity Utilization
Average Peak Passenger LoadVehicle Type
(EB / WB)
Std. Bus Std. Bus
06:00 - 09:00
1813 1617 3 3 58 56 29 28 58% 56% 20 / 19 20 / 18 Std. Bus
2013 2014
Mon
-Fri
01:00 - 06:00
313 384 1 2 22 23 10 9 22% 17% 7 / 8 6 / 7
18:00 - 21:00
1150
15:00 - 18:00
2045 1996 3 4 58 59 35 33 69% 66% 27 / 20 25 / 19 Std. Bus Std. Bus
Std. Bus
09:00 - 15:00
2358 2333 2 2 44 44 22 24 44% 47% 11 / 14 15 / 13 Std. Bus Std. Bus
Time Annual Revenue Hours
Average Trips per Hour
Average Boardings per Hour
Average Boardings per Trip
Average Capacity Utilization
Average Peak Passenger LoadVehicle Type
(EB / WB)
21:00 - 01:00
584 584 1 1 33 27 13 11 26% 23% 13 / 8 11 / 6 Std. Bus Std. Bus
19 / 11 19 / 10 Std. Bus Std. Bus1059 2 2 43 47 21 20 43% 40%
Std. Bus Std. Bus
06:00 - 09:00
187 171 2 2 21 23 9 10 18% 20% 5 / 6 6 / 7 Std. Bus Std. Bus
2013 2014
2 2 51 55 23
09:00 - 15:00
443 401 2 2 43 45 19 20 38% 39% 10 / 13 11 / 12 Std. Bus Std. Bus
Std. BusStd. Bus
11 18 / 13 Std. Bus Std. Bus
21:00 - 01:00
122 115 1 1 39 31 13 11 25% 21% 12 / 7 11 / 6 Std. Bus
18 29% 36% 13 / 7 17 / 918:00 - 21:00
193 194 2 2 35 44 14
Satu
rday
01:00 - 06:00
58 52 1 1 15 18 6 8 11% 14% 6 / 4 5 / 7
26 46% 51% 17 /15:00 - 18:00
217 207
2013 2014
Sund
ay/H
olid
ay
01:00 - 06:00
15:00 - 18:00
252 228 2
Std. Bus
TimeAnnual Revenue
HoursAverage Trips
per HourAverage Boardings
per Hour Average Boardings
per TripAverage Capacity
Utilization
Average Peak Passenger LoadVehicle Type(EB / WB)
09:00 - 15:00
494 444 2 2 35 35 16 16 32% 33% 9 / 10 10 / 10 Std. Bus Std. Bus
06:00 - 09:00
57 53 2 2 15 28 8 15 16% 29% 5 / 6 9 / 9 Std. Bus Std. Bus
10 13 / 9 Std. Bus Std. Bus
18:00 - 21:00
213 200 2 2 25 33 10 14 22% 28% 10 / 6 12 /
2 41 39 19 18 38% 36% 14 /
7 Std. Bus Std. Bus
21:00 - 01:00
163 136 1 1 26 21 10 9 20% 18% 9 / 6 9 / 6 Std. Bus Std. Bus
22

129Key Characteristics
Subregion of Primary Service: Predominant Vehicle Type:
Population (People, 400m Buffer): Employment (Jobs, 400m Buffer): Walkability (intersection density):
Contributes to FTN (Y/N):
Cost & Performance2012 2013 2014 Rank (2014)
Annual Boardings: 1,814,000 2,085,000 2,120,000 37 of 212Annual Service Cost: $3,525,000 $3,603,000 $3,467,000 33 of 219
Annual Revenue Hours: 35,600 36,400 35,000 33 of 219Cost /Boarded Passenger: $1.94 $1.73 $1.64 69 of 212
Avg. Boardings / Rev. Hour: 51 57 61 63 of 212Avg. Daily Boardings (Mon-Fri): 6,050 7,000 7,000 35 of 210
Avg. Daily Boardings (Saturdays): 2,500 3,050 3,450 38 of 179Avg. Daily Boardings (Sun & Holidays): 2,600 2,800 3,050 37 of 171
Peak Passenger Load (Bi-directional Avg.): 20 26 25 71 of 212Peak Load Factor (Vehicle Occupancy): 0.41 0.51 0.50 67 of 212
Average Capacity Utilization (Passenger Turnover): 109% 133% 138% 13 of 212Annual Revenue Hours Above Guidelines (Crowding): 0% 0% 0% 1 of 212
Service Changes Since 2012
Route 129
Burnaby/New Westminster
38,500High (0.28 int./hect.)
Std. Bus66,000
Very low sampling in 2012
No
- Spring 2014, Reduce freq from 12 to 15m during AM/PM peak (M-F)
Productivity
7%
25%
35% 34%
28%
38%
15% 20%
4%
43% 38%
15%
45%
39%
13%
4% 3%
32%
50%
15%
54%
30%
13%
3%
0%
10%
20%
30%
40%
50%
60%
70%
80%
90%
100%
Top 25% Middle High 25% Middle Low 25% Bottom 25% Top 25% Middle High 25% Middle Low 25% Bottom 25%
Boardings Per Revenue Hour Capacity Utilization
Perc
ent o
f Rev
enue
Hou
rs w
ithin
gi
ven
Prod
uctiv
ity B
and
23

Performance by Day of Week, Route 129
2013 2014 2013 2014 2013 2014 2013 2014 2013 2014 2013 2014
2013 2014 2013 2014 2013 2014 2013 2014 2013 2014 2013 2014
2013 2014 2013 2014 2013 2014 2013 2014 2013 2014 2013 2014
Data collected Sept. to mid-Dec. of the given year
Time Annual Revenue Hours
Average Trips per Hour
Average Boardings per Hour
Average Boardings per Trip
Average Capacity Utilization
Average Peak Passenger LoadVehicle Type
(EB / WB)
Std. Bus Std. Bus
06:00 - 09:00
7484 6221 5 4 65 67 73 83 148% 168% 29 / 27 35 / 27 Std. Bus
2013 2014
Mon
-Fri
01:00 - 06:00
675 683 2 2 45 38 46 42 92% 84% 18 / 17 18 / 17
18:00 - 21:00
3209
15:00 - 18:00
8438 7188 5 4 68 68 81 86 163% 172% 28 / 34 25 / 33 Std. Bus Std. Bus
Std. Bus
09:00 - 15:00
6622 7213 2 2 61 54 76 79 150% 158% 28 / 28 25 / 28 Std. Bus Std. Bus
Time Annual Revenue Hours
Average Trips per Hour
Average Boardings per Hour
Average Boardings per Trip
Average Capacity Utilization
Average Peak Passenger LoadVehicle Type
(EB / WB)
21:00 - 01:00
2674 2808 2 2 30 32 33 35 65% 70% 15 / 12 18 / 12 Std. Bus Std. Bus
22 / 24 26 / 20 Std. Bus Std. Bus3308 2 2 51 52 58 62 116% 123%
06:00 - 09:00
535 567 2 2 33 39 77% 14 / 22 15 / 14 Std. Bus Std. Bus
2013 2014
2 2 44 59 53
09:00 - 15:00
1225 1323 2 2 52 55 64 66 129% 132% 20 / 27 25 / 22 Std. Bus Std. Bus
Std. BusStd. Bus
17 28 / 22 Std. Bus Std. Bus
21:00 - 01:00
544 546 2 2 30 32 64% 19 / 22 20 / 15 Std. Bus
49 105% 99% 15 / 18 25 / 1918:00 - 21:00
585 598 2 2 45 43 52
Satu
rday
01:00 - 06:00
70 106% 141% 32 /15:00 - 18:00
631 662
2013 2014
Sund
ay/H
olid
ay
01:00 - 06:00
15:00 - 18:00
726 741 2
Std. Bus
TimeAnnual Revenue
HoursAverage Trips
per HourAverage Boardings
per Hour Average Boardings
per TripAverage Capacity
Utilization
Average Peak Passenger LoadVehicle Type(EB / WB)
09:00 - 15:00
1392 1443 2 2 47 46 56 54 113% 109% 17 / 24 18 / 22 Std. Bus Std. Bus
06:00 - 09:00
418 428 2 2 28 31 32 36 63% 70% 17 / 16 12 / 15 Std. Bus Std. Bus
19 25 / 19 Std. Bus Std. Bus
18:00 - 21:00
667 692 2 2 33 36 38 42 76% 85% 28 / 11 20 /
2 44 54 53 64 106% 128% 20 /
12 Std. Bus Std. Bus
21:00 - 01:00
576 605 2 2 21 23 23 24 47% 49% 14 / 10 13 / 9 Std. Bus Std. Bus
24
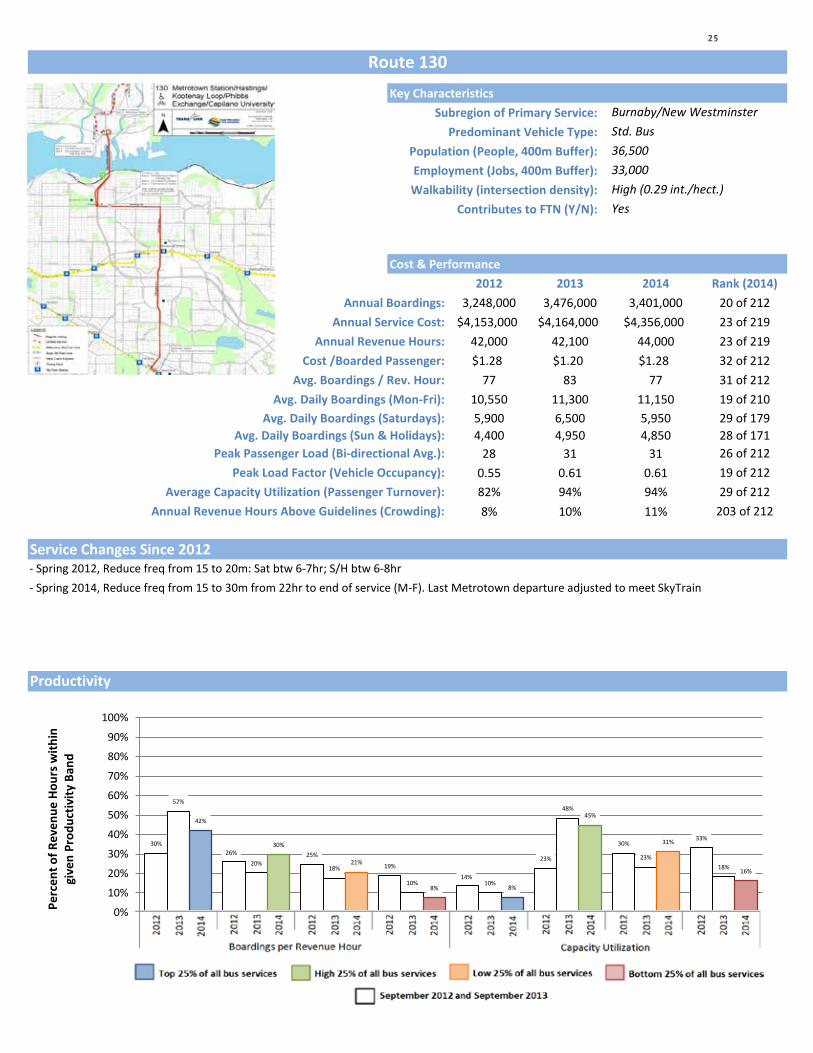
130Key Characteristics
Subregion of Primary Service: Predominant Vehicle Type:
Population (People, 400m Buffer): Employment (Jobs, 400m Buffer): Walkability (intersection density):
Contributes to FTN (Y/N):
Cost & Performance2012 2013 2014 Rank (2014)
Annual Boardings: 3,248,000 3,476,000 3,401,000 20 of 212Annual Service Cost: $4,153,000 $4,164,000 $4,356,000 23 of 219
Annual Revenue Hours: 42,000 42,100 44,000 23 of 219Cost /Boarded Passenger: $1.28 $1.20 $1.28 32 of 212
Avg. Boardings / Rev. Hour: 77 83 77 31 of 212Avg. Daily Boardings (Mon-Fri): 10,550 11,300 11,150 19 of 210
Avg. Daily Boardings (Saturdays): 5,900 6,500 5,950 29 of 179Avg. Daily Boardings (Sun & Holidays): 4,400 4,950 4,850 28 of 171
Peak Passenger Load (Bi-directional Avg.): 28 31 31 26 of 212Peak Load Factor (Vehicle Occupancy): 0.55 0.61 0.61 19 of 212
Average Capacity Utilization (Passenger Turnover): 82% 94% 94% 29 of 212Annual Revenue Hours Above Guidelines (Crowding): 8% 10% 11% 203 of 212
Service Changes Since 2012
Route 130
Burnaby/New Westminster
33,000High (0.29 int./hect.)
Std. Bus36,500
Yes
- Spring 2014, Reduce freq from 15 to 30m from 22hr to end of service (M-F). Last Metrotown departure adjusted to meet SkyTrain- Spring 2012, Reduce freq from 15 to 20m: Sat btw 6-7hr; S/H btw 6-8hr
Productivity
30% 26% 25%
19%
14%
23%
30% 33%
52%
20% 18%
10% 10%
48%
23% 18%
42%
30%
21%
8% 8%
45%
31%
16%
0%
10%
20%
30%
40%
50%
60%
70%
80%
90%
100%
Top 25% Middle High 25% Middle Low 25% Bottom 25% Top 25% Middle High 25% Middle Low 25% Bottom 25%
Boardings Per Revenue Hour Capacity Utilization
Perc
ent o
f Rev
enue
Hou
rs w
ithin
gi
ven
Prod
uctiv
ity B
and
25
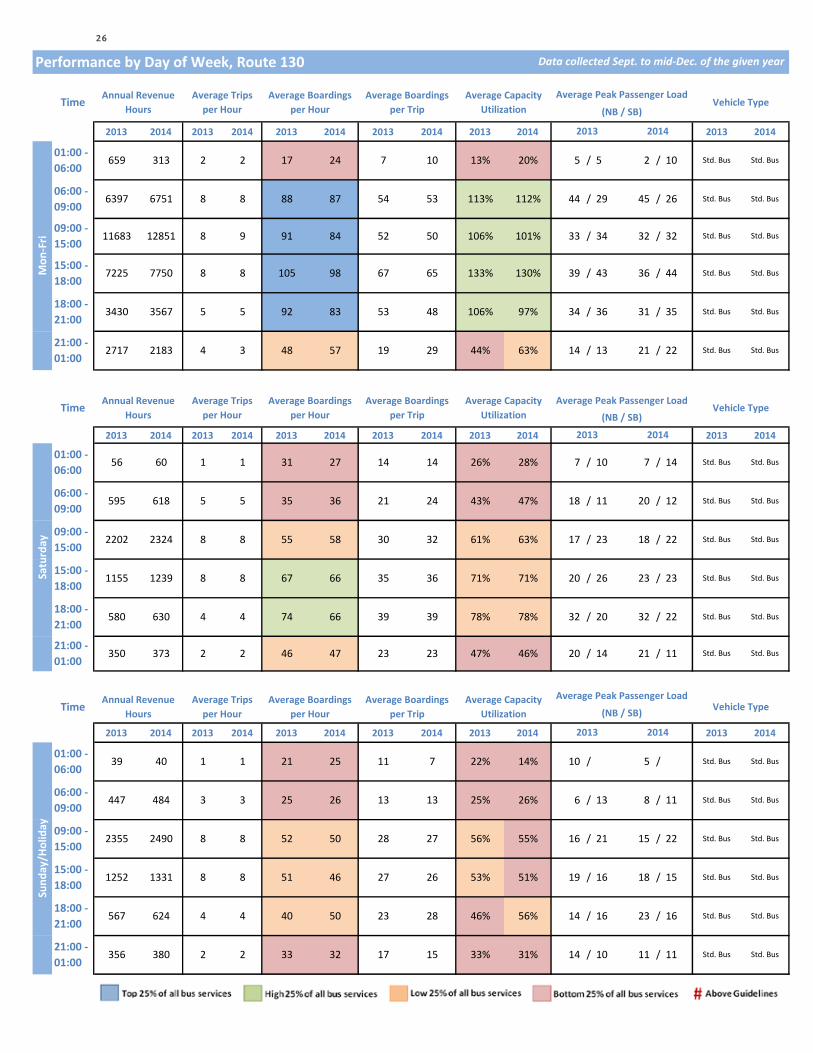
Performance by Day of Week, Route 130
2013 2014 2013 2014 2013 2014 2013 2014 2013 2014 2013 2014
2013 2014 2013 2014 2013 2014 2013 2014 2013 2014 2013 2014
2013 2014 2013 2014 2013 2014 2013 2014 2013 2014 2013 2014
Data collected Sept. to mid-Dec. of the given year
Time Annual Revenue Hours
Average Trips per Hour
Average Boardings per Hour
Average Boardings per Trip
Average Capacity Utilization
Average Peak Passenger LoadVehicle Type
(NB / SB)
Std. Bus Std. Bus
06:00 - 09:00
6397 6751 8 8 88 87 54 53 113% 112% 44 / 29 45 / 26 Std. Bus
2013 2014
Mon
-Fri
01:00 - 06:00
659 313 2 2 17 24 7 10 13% 20% 5 / 5 2 / 10
18:00 - 21:00
3430
15:00 - 18:00
7225 7750 8 8 105 98 67 65 133% 130% 39 / 43 36 / 44 Std. Bus Std. Bus
Std. Bus
09:00 - 15:00
11683 12851 8 9 91 84 52 50 106% 101% 33 / 34 32 / 32 Std. Bus Std. Bus
Time Annual Revenue Hours
Average Trips per Hour
Average Boardings per Hour
Average Boardings per Trip
Average Capacity Utilization
Average Peak Passenger LoadVehicle Type
(NB / SB)
21:00 - 01:00
2717 2183 4 3 48 57 19 29 44% 63% 14 / 13 21 / 22 Std. Bus Std. Bus
34 / 36 31 / 35 Std. Bus Std. Bus3567 5 5 92 83 53 48 106% 97%
Std. Bus Std. Bus
06:00 - 09:00
595 618 5 5 35 36 21 24 43% 47% 18 / 11 20 / 12 Std. Bus Std. Bus
2013 2014
8 8 67 66 35
09:00 - 15:00
2202 2324 8 8 55 58 30 32 61% 63% 17 / 23 18 / 22 Std. Bus Std. Bus
Std. BusStd. Bus
26 23 / 23 Std. Bus Std. Bus
21:00 - 01:00
350 373 2 2 46 47 23 23 47% 46% 20 / 14 21 / 11 Std. Bus
39 78% 78% 32 / 20 32 / 2218:00 - 21:00
580 630 4 4 74 66 39
Satu
rday
01:00 - 06:00
56 60 1 1 31 27 14 14 26% 28% 7 / 10 7 / 14
36 71% 71% 20 /15:00 - 18:00
1155 1239
2013 2014
Sund
ay/H
olid
ay
01:00 - 06:00
39 40 1 1 21 25 11 7 22% 14% 10 / 5 /
15:00 - 18:00
1252 1331 8
Std. Bus
TimeAnnual Revenue
HoursAverage Trips
per HourAverage Boardings
per Hour Average Boardings
per TripAverage Capacity
Utilization
Average Peak Passenger LoadVehicle Type(NB / SB)
09:00 - 15:00
2355 2490 8 8 52 50 28 27 56% 55% 16 / 21 15 / 22 Std. Bus Std. Bus
Std. Bus Std. Bus
06:00 - 09:00
447 484 3 3 25 26 13 13 25% 26% 6 / 13 8 / 11 Std. Bus Std. Bus
16 18 / 15 Std. Bus Std. Bus
18:00 - 21:00
567 624 4 4 40 50 23 28 46% 56% 14 / 16 23 /
8 51 46 27 26 53% 51% 19 /
16 Std. Bus Std. Bus
21:00 - 01:00
356 380 2 2 33 32 17 15 33% 31% 14 / 10 11 / 11 Std. Bus Std. Bus
26

134Key Characteristics
Subregion of Primary Service: Predominant Vehicle Type:
Population (People, 400m Buffer): Employment (Jobs, 400m Buffer): Walkability (intersection density):
Contributes to FTN (Y/N):
Cost & Performance2012 2013 2014 Rank (2014)
Annual Boardings: 391,000 418,000 398,000 109 of 212Annual Service Cost: $1,102,000 $1,100,000 $1,072,000 99 of 219
Annual Revenue Hours: 12,500 12,400 12,400 95 of 219Cost /Boarded Passenger: $2.82 $2.63 $2.70 140 of 212
Avg. Boardings / Rev. Hour: 31 34 32 142 of 212Avg. Daily Boardings (Mon-Fri): 1,200 1,350 1,250 112 of 210
Avg. Daily Boardings (Saturdays): 900 800 800 97 of 179Avg. Daily Boardings (Sun & Holidays): 600 650 650 96 of 171
Peak Passenger Load (Bi-directional Avg.): 10 11 10 148 of 212Peak Load Factor (Vehicle Occupancy): 0.23 0.24 0.24 160 of 212
Average Capacity Utilization (Passenger Turnover): 36% 41% 43% 134 of 212Annual Revenue Hours Above Guidelines (Crowding): 0% 0% 0% 1 of 212
Service Changes Since 2012
Route 134
Burnaby/New Westminster
8,000Medium (0.2 int./hect.)
Mini- Bus19,500
No
- Winter 2013, Relocation to off-street transit facility at Brentwood Station during redevelopment- Fall 2012, Convert weekend & holiday vehicles to mini-bus all-day
Productivity
4% 3%
16%
78%
0% 4%
19%
77%
0% 2%
23%
75%
0% 3%
29%
67%
2% 2%
25%
71%
0% 3%
32%
66%
0%
10%
20%
30%
40%
50%
60%
70%
80%
90%
100%
Top 25% Middle High 25% Middle Low 25% Bottom 25% Top 25% Middle High 25% Middle Low 25% Bottom 25%
Boardings Per Revenue Hour Capacity Utilization
Perc
ent o
f Rev
enue
Hou
rs w
ithin
gi
ven
Prod
uctiv
ity B
and
27
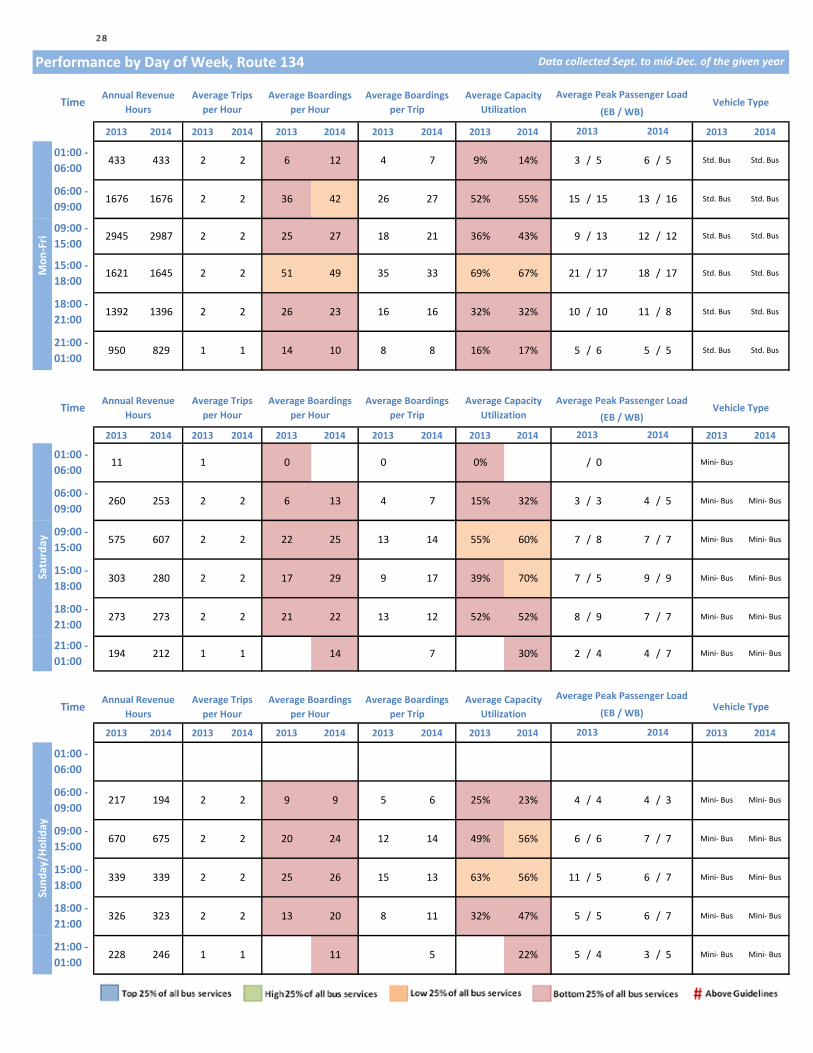
Performance by Day of Week, Route 134
2013 2014 2013 2014 2013 2014 2013 2014 2013 2014 2013 2014
2013 2014 2013 2014 2013 2014 2013 2014 2013 2014 2013 2014
2013 2014 2013 2014 2013 2014 2013 2014 2013 2014 2013 2014
Data collected Sept. to mid-Dec. of the given year
Time Annual Revenue Hours
Average Trips per Hour
Average Boardings per Hour
Average Boardings per Trip
Average Capacity Utilization
Average Peak Passenger LoadVehicle Type
(EB / WB)
Std. Bus Std. Bus
06:00 - 09:00
1676 1676 2 2 36 42 26 27 52% 55% 15 / 15 13 / 16 Std. Bus
2013 2014
Mon
-Fri
01:00 - 06:00
433 433 2 2 6 12 4 7 9% 14% 3 / 5 6 / 5
18:00 - 21:00
1392
15:00 - 18:00
1621 1645 2 2 51 49 35 33 69% 67% 21 / 17 18 / 17 Std. Bus Std. Bus
Std. Bus
09:00 - 15:00
2945 2987 2 2 25 27 18 21 36% 43% 9 / 13 12 / 12 Std. Bus Std. Bus
Time Annual Revenue Hours
Average Trips per Hour
Average Boardings per Hour
Average Boardings per Trip
Average Capacity Utilization
Average Peak Passenger LoadVehicle Type
(EB / WB)
21:00 - 01:00
950 829 1 1 14 10 8 8 16% 17% 5 / 6 5 / 5 Std. Bus Std. Bus
10 / 10 11 / 8 Std. Bus Std. Bus1396 2 2 26 23 16 16 32% 32%
Mini- Bus
06:00 - 09:00
260 253 2 2 6 13 4 7 15% 32% 3 / 3 4 / 5 Mini- Bus Mini- Bus
2013 2014
2 2 17 29 9
09:00 - 15:00
575 607 2 2 22 25 13 14 55% 60% 7 / 8 7 / 7 Mini- Bus Mini- Bus
Mini- BusMini- Bus
5 9 / 9 Mini- Bus Mini- Bus
21:00 - 01:00
194 212 1 1 14 7 30% 2 / 4 4 / 7 Mini- Bus
12 52% 52% 8 / 9 7 / 718:00 - 21:00
273 273 2 2 21 22 13
Satu
rday
01:00 - 06:00
11 1 0 0 0% / 0
17 39% 70% 7 /15:00 - 18:00
303 280
2013 2014
Sund
ay/H
olid
ay
01:00 - 06:00
15:00 - 18:00
339 339 2
Mini- Bus
TimeAnnual Revenue
HoursAverage Trips
per HourAverage Boardings
per Hour Average Boardings
per TripAverage Capacity
Utilization
Average Peak Passenger LoadVehicle Type(EB / WB)
09:00 - 15:00
670 675 2 2 20 24 12 14 49% 56% 6 / 6 7 / 7 Mini- Bus Mini- Bus
06:00 - 09:00
217 194 2 2 9 9 5 6 25% 23% 4 / 4 4 / 3 Mini- Bus Mini- Bus
5 6 / 7 Mini- Bus Mini- Bus
18:00 - 21:00
326 323 2 2 13 20 8 11 32% 47% 5 / 5 6 /
2 25 26 15 13 63% 56% 11 /
7 Mini- Bus Mini- Bus
21:00 - 01:00
228 246 1 1 11 5 22% 5 / 4 3 / 5 Mini- Bus Mini- Bus
28
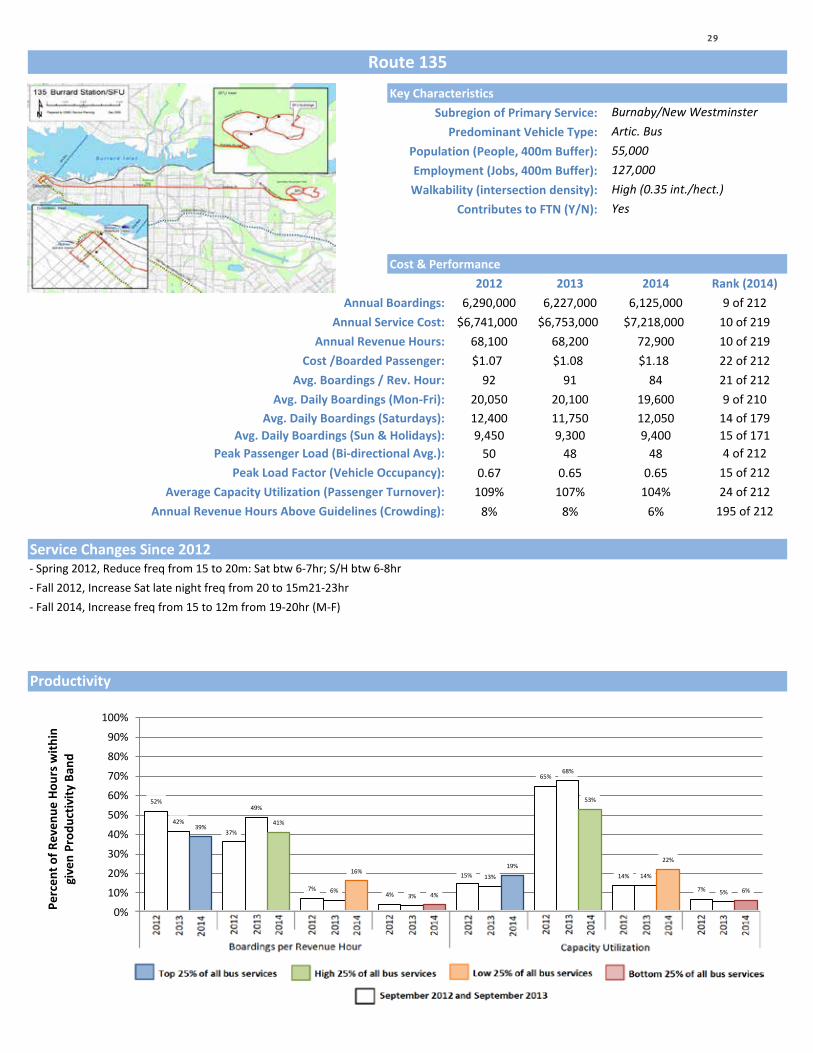
135Key Characteristics
Subregion of Primary Service: Predominant Vehicle Type:
Population (People, 400m Buffer): Employment (Jobs, 400m Buffer): Walkability (intersection density):
Contributes to FTN (Y/N):
Cost & Performance2012 2013 2014 Rank (2014)
Annual Boardings: 6,290,000 6,227,000 6,125,000 9 of 212Annual Service Cost: $6,741,000 $6,753,000 $7,218,000 10 of 219
Annual Revenue Hours: 68,100 68,200 72,900 10 of 219Cost /Boarded Passenger: $1.07 $1.08 $1.18 22 of 212
Avg. Boardings / Rev. Hour: 92 91 84 21 of 212Avg. Daily Boardings (Mon-Fri): 20,050 20,100 19,600 9 of 210
Avg. Daily Boardings (Saturdays): 12,400 11,750 12,050 14 of 179Avg. Daily Boardings (Sun & Holidays): 9,450 9,300 9,400 15 of 171
Peak Passenger Load (Bi-directional Avg.): 50 48 48 4 of 212Peak Load Factor (Vehicle Occupancy): 0.67 0.65 0.65 15 of 212
Average Capacity Utilization (Passenger Turnover): 109% 107% 104% 24 of 212Annual Revenue Hours Above Guidelines (Crowding): 8% 8% 6% 195 of 212
Service Changes Since 2012
Route 135
Burnaby/New Westminster
127,000High (0.35 int./hect.)
Artic. Bus55,000
Yes
- Fall 2012, Increase Sat late night freq from 20 to 15m21-23hr- Fall 2014, Increase freq from 15 to 12m from 19-20hr (M-F)
- Spring 2012, Reduce freq from 15 to 20m: Sat btw 6-7hr; S/H btw 6-8hr
Productivity
52%
37%
7% 4%
15%
65%
14%
7%
42%
49%
6% 3%
13%
68%
14%
5%
39% 41%
16%
4%
19%
53%
22%
6%
0%
10%
20%
30%
40%
50%
60%
70%
80%
90%
100%
Top 25% Middle High 25% Middle Low 25% Bottom 25% Top 25% Middle High 25% Middle Low 25% Bottom 25%
Boardings Per Revenue Hour Capacity Utilization
Perc
ent o
f Rev
enue
Hou
rs w
ithin
gi
ven
Prod
uctiv
ity B
and
29
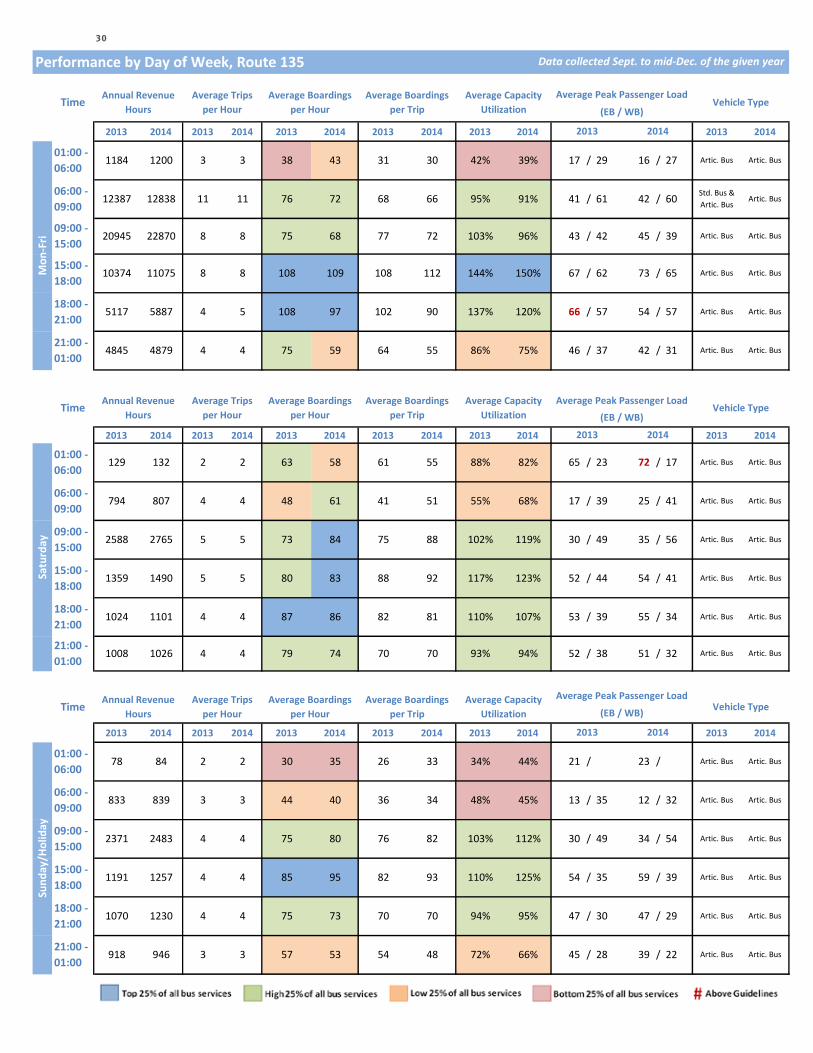
Performance by Day of Week, Route 135
2013 2014 2013 2014 2013 2014 2013 2014 2013 2014 2013 2014
2013 2014 2013 2014 2013 2014 2013 2014 2013 2014 2013 2014
2013 2014 2013 2014 2013 2014 2013 2014 2013 2014 2013 2014
Data collected Sept. to mid-Dec. of the given year
Time Annual Revenue Hours
Average Trips per Hour
Average Boardings per Hour
Average Boardings per Trip
Average Capacity Utilization
Average Peak Passenger LoadVehicle Type
(EB / WB)
Artic. Bus Artic. Bus
06:00 - 09:00
12387 12838 11 11 76 72 68 66 95% 91% 41 / 61 42 / 60 Std. Bus & Artic. Bus
2013 2014
Mon
-Fri
01:00 - 06:00
1184 1200 3 3 38 43 31 30 42% 39% 17 / 29 16 / 27
18:00 - 21:00
5117
15:00 - 18:00
10374 11075 8 8 108 109 108 112 144% 150% 67 / 62 73 / 65 Artic. Bus Artic. Bus
Artic. Bus
09:00 - 15:00
20945 22870 8 8 75 68 77 72 103% 96% 43 / 42 45 / 39 Artic. Bus Artic. Bus
Time Annual Revenue Hours
Average Trips per Hour
Average Boardings per Hour
Average Boardings per Trip
Average Capacity Utilization
Average Peak Passenger LoadVehicle Type
(EB / WB)
21:00 - 01:00
4845 4879 4 4 75 59 64 55 86% 75% 46 / 37 42 / 31 Artic. Bus Artic. Bus
66 / 57 54 / 57 Artic. Bus Artic. Bus5887 4 5 108 97 102 90 137% 120%
Artic. Bus Artic. Bus
06:00 - 09:00
794 807 4 4 48 61 41 51 55% 68% 17 / 39 25 / 41 Artic. Bus Artic. Bus
2013 2014
5 5 80 83 88
09:00 - 15:00
2588 2765 5 5 73 84 75 88 102% 119% 30 / 49 35 / 56 Artic. Bus Artic. Bus
Artic. BusArtic. Bus
44 54 / 41 Artic. Bus Artic. Bus
21:00 - 01:00
1008 1026 4 4 79 74 70 70 93% 94% 52 / 38 51 / 32 Artic. Bus
81 110% 107% 53 / 39 55 / 3418:00 - 21:00
1024 1101 4 4 87 86 82
Satu
rday
01:00 - 06:00
129 132 2 2 63 58 61 55 88% 82% 65 / 23 72 / 17
92 117% 123% 52 /15:00 - 18:00
1359 1490
2013 2014
Sund
ay/H
olid
ay
01:00 - 06:00
78 84 2 2 30 35 26 33 34% 44% 21 / 23 /
15:00 - 18:00
1191 1257 4
Artic. Bus
TimeAnnual Revenue
HoursAverage Trips
per HourAverage Boardings
per Hour Average Boardings
per TripAverage Capacity
Utilization
Average Peak Passenger LoadVehicle Type(EB / WB)
09:00 - 15:00
2371 2483 4 4 75 80 76 82 103% 112% 30 / 49 34 / 54 Artic. Bus Artic. Bus
Artic. Bus Artic. Bus
06:00 - 09:00
833 839 3 3 44 40 36 34 48% 45% 13 / 35 12 / 32 Artic. Bus Artic. Bus
35 59 / 39 Artic. Bus Artic. Bus
18:00 - 21:00
1070 1230 4 4 75 73 70 70 94% 95% 47 / 30 47 /
4 85 95 82 93 110% 125% 54 /
29 Artic. Bus Artic. Bus
21:00 - 01:00
918 946 3 3 57 53 54 48 72% 66% 45 / 28 39 / 22 Artic. Bus Artic. Bus
30

136Key Characteristics
Subregion of Primary Service: Predominant Vehicle Type:
Population (People, 400m Buffer): Employment (Jobs, 400m Buffer): Walkability (intersection density):
Contributes to FTN (Y/N):
Cost & Performance2012 2013 2014 Rank (2014)
Annual Boardings: 506,000 554,000 487,000 102 of 212Annual Service Cost: $1,481,000 $1,303,000 $1,340,000 84 of 219
Annual Revenue Hours: 16,500 14,800 15,100 77 of 219Cost /Boarded Passenger: $2.93 $2.35 $2.75 143 of 212
Avg. Boardings / Rev. Hour: 31 37 32 141 of 212Avg. Daily Boardings (Mon-Fri): 1,650 1,800 1,550 103 of 210
Avg. Daily Boardings (Saturdays): 950 1,000 900 92 of 179Avg. Daily Boardings (Sun & Holidays): 750 800 800 90 of 171
Peak Passenger Load (Bi-directional Avg.): 12 16 14 129 of 212Peak Load Factor (Vehicle Occupancy): 0.29 0.38 0.33 131 of 212
Average Capacity Utilization (Passenger Turnover): 43% 55% 47% 127 of 212Annual Revenue Hours Above Guidelines (Crowding): 0% 0% 0% 1 of 212
Service Changes Since 2012
Route 136
Burnaby/New Westminster
18,000Medium (0.18 int./hect.)
Std. Bus28,000
No
- Winter 2012, Reduce freq from 20 to 30m - AM peak 6-9hr & PM 15-19hr- Winter 2013, Relocation to off-street transit facility at Brentwood Station during redevelopment
- Fall 2012, Convert Sat/S/H service to mini-bus all day
Productivity
0% 0%
17%
83%
0%
7%
19%
74%
0%
12%
30%
59%
0%
16%
33%
51%
0% 0%
25%
75%
0% 0%
38%
62%
0%
10%
20%
30%
40%
50%
60%
70%
80%
90%
100%
Top 25% Middle High 25% Middle Low 25% Bottom 25% Top 25% Middle High 25% Middle Low 25% Bottom 25%
Boardings Per Revenue Hour Capacity Utilization
Perc
ent o
f Rev
enue
Hou
rs w
ithin
gi
ven
Prod
uctiv
ity B
and
31
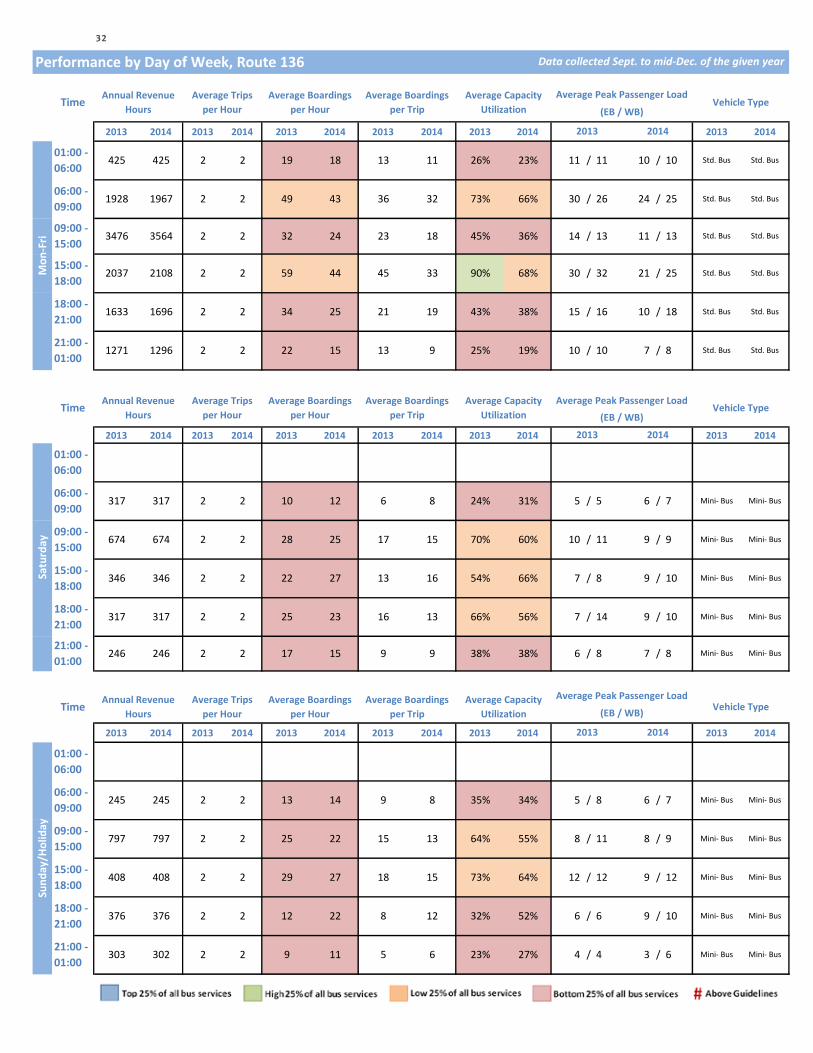
Performance by Day of Week, Route 136
2013 2014 2013 2014 2013 2014 2013 2014 2013 2014 2013 2014
2013 2014 2013 2014 2013 2014 2013 2014 2013 2014 2013 2014
2013 2014 2013 2014 2013 2014 2013 2014 2013 2014 2013 2014
Data collected Sept. to mid-Dec. of the given year
Time Annual Revenue Hours
Average Trips per Hour
Average Boardings per Hour
Average Boardings per Trip
Average Capacity Utilization
Average Peak Passenger LoadVehicle Type
(EB / WB)
Std. Bus Std. Bus
06:00 - 09:00
1928 1967 2 2 49 43 36 32 73% 66% 30 / 26 24 / 25 Std. Bus
2013 2014
Mon
-Fri
01:00 - 06:00
425 425 2 2 19 18 13 11 26% 23% 11 / 11 10 / 10
18:00 - 21:00
1633
15:00 - 18:00
2037 2108 2 2 59 44 45 33 90% 68% 30 / 32 21 / 25 Std. Bus Std. Bus
Std. Bus
09:00 - 15:00
3476 3564 2 2 32 24 23 18 45% 36% 14 / 13 11 / 13 Std. Bus Std. Bus
Time Annual Revenue Hours
Average Trips per Hour
Average Boardings per Hour
Average Boardings per Trip
Average Capacity Utilization
Average Peak Passenger LoadVehicle Type
(EB / WB)
21:00 - 01:00
1271 1296 2 2 22 15 13 9 25% 19% 10 / 10 7 / 8 Std. Bus Std. Bus
15 / 16 10 / 18 Std. Bus Std. Bus1696 2 2 34 25 21 19 43% 38%
06:00 - 09:00
317 317 2 2 10 12 6 8 24% 31% 5 / 5 6 / 7 Mini- Bus Mini- Bus
2013 2014
2 2 22 27 13
09:00 - 15:00
674 674 2 2 28 25 17 15 70% 60% 10 / 11 9 / 9 Mini- Bus Mini- Bus
Mini- BusMini- Bus
8 9 / 10 Mini- Bus Mini- Bus
21:00 - 01:00
246 246 2 2 17 15 9 9 38% 38% 6 / 8 7 / 8 Mini- Bus
13 66% 56% 7 / 14 9 / 1018:00 - 21:00
317 317 2 2 25 23 16
Satu
rday
01:00 - 06:00
16 54% 66% 7 /15:00 - 18:00
346 346
2013 2014
Sund
ay/H
olid
ay
01:00 - 06:00
15:00 - 18:00
408 408 2
Mini- Bus
TimeAnnual Revenue
HoursAverage Trips
per HourAverage Boardings
per Hour Average Boardings
per TripAverage Capacity
Utilization
Average Peak Passenger LoadVehicle Type(EB / WB)
09:00 - 15:00
797 797 2 2 25 22 15 13 64% 55% 8 / 11 8 / 9 Mini- Bus Mini- Bus
06:00 - 09:00
245 245 2 2 13 14 9 8 35% 34% 5 / 8 6 / 7 Mini- Bus Mini- Bus
12 9 / 12 Mini- Bus Mini- Bus
18:00 - 21:00
376 376 2 2 12 22 8 12 32% 52% 6 / 6 9 /
2 29 27 18 15 73% 64% 12 /
10 Mini- Bus Mini- Bus
21:00 - 01:00
303 302 2 2 9 11 5 6 23% 27% 4 / 4 3 / 6 Mini- Bus Mini- Bus
32
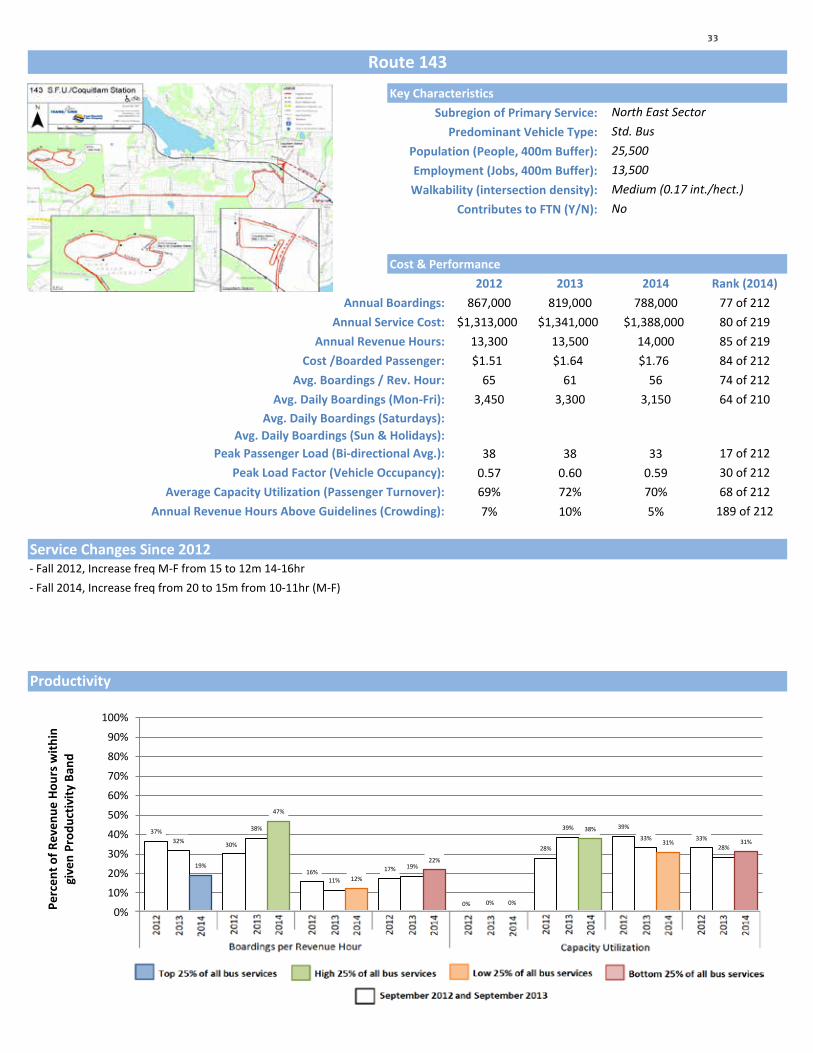
143Key Characteristics
Subregion of Primary Service: Predominant Vehicle Type:
Population (People, 400m Buffer): Employment (Jobs, 400m Buffer): Walkability (intersection density):
Contributes to FTN (Y/N):
Cost & Performance2012 2013 2014 Rank (2014)
Annual Boardings: 867,000 819,000 788,000 77 of 212Annual Service Cost: $1,313,000 $1,341,000 $1,388,000 80 of 219
Annual Revenue Hours: 13,300 13,500 14,000 85 of 219Cost /Boarded Passenger: $1.51 $1.64 $1.76 84 of 212
Avg. Boardings / Rev. Hour: 65 61 56 74 of 212Avg. Daily Boardings (Mon-Fri): 3,450 3,300 3,150 64 of 210
Avg. Daily Boardings (Saturdays): #VALUE! #VALUE! #VALUE!Avg. Daily Boardings (Sun & Holidays): #VALUE! #VALUE! #VALUE!
Peak Passenger Load (Bi-directional Avg.): 38 38 33 17 of 212Peak Load Factor (Vehicle Occupancy): 0.57 0.60 0.59 30 of 212
Average Capacity Utilization (Passenger Turnover): 69% 72% 70% 68 of 212Annual Revenue Hours Above Guidelines (Crowding): 7% 10% 5% 189 of 212
Service Changes Since 2012
Route 143
North East Sector
13,500Medium (0.17 int./hect.)
Std. Bus25,500
No
- Fall 2014, Increase freq from 20 to 15m from 10-11hr (M-F)- Fall 2012, Increase freq M-F from 15 to 12m 14-16hr
Productivity
37%
30%
16% 17%
0%
28%
39%
33% 32%
38%
11%
19%
0%
39% 33%
28%
19%
47%
12%
22%
0%
38%
31% 31%
0%
10%
20%
30%
40%
50%
60%
70%
80%
90%
100%
Top 25% Middle High 25% Middle Low 25% Bottom 25% Top 25% Middle High 25% Middle Low 25% Bottom 25%
Boardings Per Revenue Hour Capacity Utilization
Perc
ent o
f Rev
enue
Hou
rs w
ithin
gi
ven
Prod
uctiv
ity B
and
33

Performance by Day of Week, Route 143
2013 2014 2013 2014 2013 2014 2013 2014 2013 2014 2013 2014
2013 2014 2013 2014 2013 2014 2013 2014 2013 2014 2013 2014
2013 2014 2013 2014 2013 2014 2013 2014 2013 2014 2013 2014
Data collected Sept. to mid-Dec. of the given year
Time Annual Revenue Hours
Average Trips per Hour
Average Boardings per Hour
Average Boardings per Trip
Average Capacity Utilization
Average Peak Passenger LoadVehicle Type
(EB / WB)
06:00 - 09:00
2425 2442 3 3 65 57 47 42 74% 71% 20 / 57 16 / 53 Std. Bus & Artic. Bus
2013 2014
Mon
-Fri
01:00 - 06:00
18:00 - 21:00
1958
15:00 - 18:00
3408 3437 5 5 65 54 45 35 71% 64% 50 / 20 41 / 16 Std. Bus & Artic. Bus
Artic. Bus & Std. Bus
Artic. Bus & Std. Bus
09:00 - 15:00
5413 5830 4 4 71 62 46 40 68% 70% 31 / 45 27 / 39 Std. Bus & Artic. Bus
Artic. Bus & Std. Bus
Time Annual Revenue Hours
Average Trips per Hour
Average Boardings per Hour
Average Boardings per Trip
Average Capacity Utilization
Average Peak Passenger LoadVehicle Type
(EB / WB)
21:00 - 01:00
338 338 2 2 43 37 20 19 37% 39% 31 / 5 30 / 5 Std. Bus & Artic. Bus
Std. Bus
36 / 6 34 / 6 Std. Bus & Artic. Bus
Artic. Bus & Std. Bus1975 3 3 42 41 24 23 41% 41%
06:00 - 09:00
2013 2014
09:00 - 15:00
21:00 - 01:00
18:00 - 21:00
Satu
rday
01:00 - 06:00
15:00 - 18:00
2013 2014
Sund
ay/H
olid
ay
01:00 - 06:00
15:00 - 18:00
TimeAnnual Revenue
HoursAverage Trips
per HourAverage Boardings
per Hour Average Boardings
per TripAverage Capacity
Utilization
Average Peak Passenger LoadVehicle Type(EB / WB)
09:00 - 15:00
06:00 - 09:00
18:00 - 21:00
21:00 - 01:00
34

144Key Characteristics
Subregion of Primary Service: Predominant Vehicle Type:
Population (People, 400m Buffer): Employment (Jobs, 400m Buffer): Walkability (intersection density):
Contributes to FTN (Y/N):
Cost & Performance2012 2013 2014 Rank (2014)
Annual Boardings: 1,662,000 1,733,000 1,754,000 43 of 212Annual Service Cost: $3,166,000 $3,243,000 $3,383,000 34 of 219
Annual Revenue Hours: 32,000 32,800 34,200 34 of 219Cost /Boarded Passenger: $1.90 $1.87 $1.93 93 of 212
Avg. Boardings / Rev. Hour: 52 53 51 83 of 212Avg. Daily Boardings (Mon-Fri): 5,600 5,850 5,800 41 of 210
Avg. Daily Boardings (Saturdays): 2,400 2,500 2,900 47 of 179Avg. Daily Boardings (Sun & Holidays): 2,000 2,150 2,350 50 of 171
Peak Passenger Load (Bi-directional Avg.): 29 30 28 40 of 212Peak Load Factor (Vehicle Occupancy): 0.58 0.59 0.57 35 of 212
Average Capacity Utilization (Passenger Turnover): 91% 97% 94% 30 of 212Annual Revenue Hours Above Guidelines (Crowding): 4% 3% 1% 164 of 212
Service Changes Since 2012
Route 144
Burnaby/New Westminster
18,000Medium (0.18 int./hect.)
Std. Bus34,500
No
- No service change between 2012 and September 2014
Productivity
0%
41% 39%
20%
9%
40% 38%
13%
3%
37% 41%
19%
3%
69%
17%
11%
3%
30%
49%
18%
5%
58%
26%
10%
0%
10%
20%
30%
40%
50%
60%
70%
80%
90%
100%
Top 25% Middle High 25% Middle Low 25% Bottom 25% Top 25% Middle High 25% Middle Low 25% Bottom 25%
Boardings Per Revenue Hour Capacity Utilization
Perc
ent o
f Rev
enue
Hou
rs w
ithin
gi
ven
Prod
uctiv
ity B
and
35
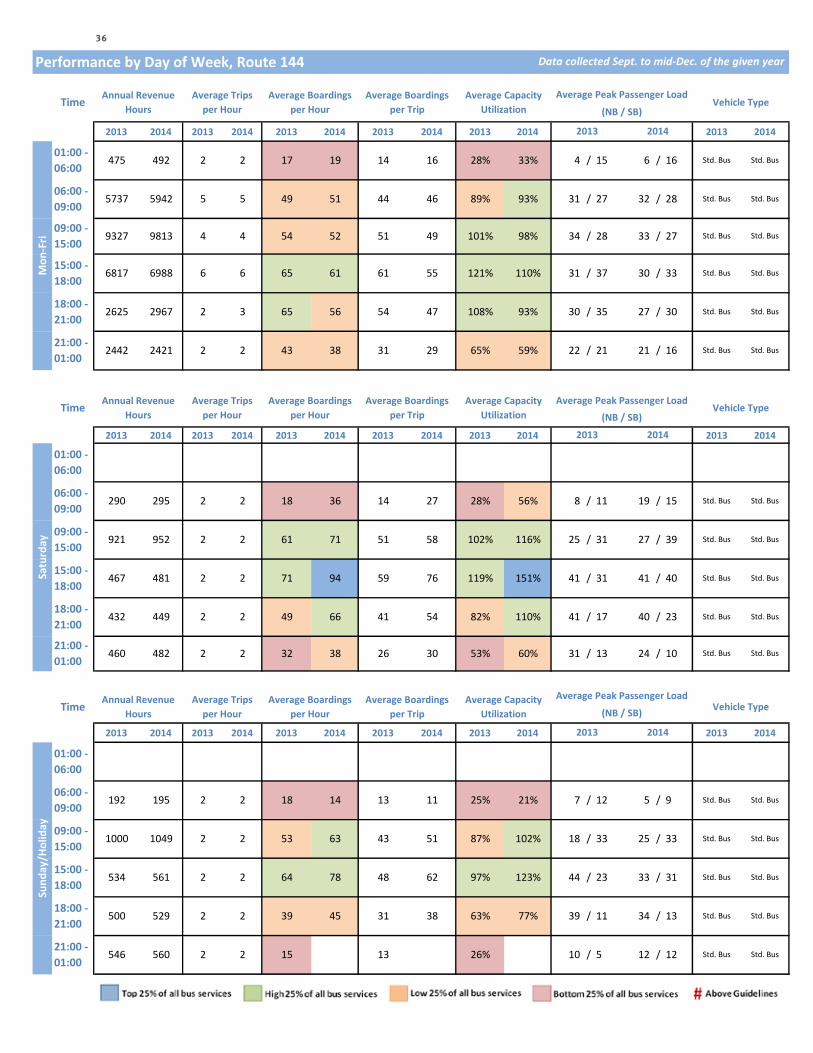
Performance by Day of Week, Route 144
2013 2014 2013 2014 2013 2014 2013 2014 2013 2014 2013 2014
2013 2014 2013 2014 2013 2014 2013 2014 2013 2014 2013 2014
2013 2014 2013 2014 2013 2014 2013 2014 2013 2014 2013 2014
Data collected Sept. to mid-Dec. of the given year
Time Annual Revenue Hours
Average Trips per Hour
Average Boardings per Hour
Average Boardings per Trip
Average Capacity Utilization
Average Peak Passenger LoadVehicle Type
(NB / SB)
Std. Bus Std. Bus
06:00 - 09:00
5737 5942 5 5 49 51 44 46 89% 93% 31 / 27 32 / 28 Std. Bus
2013 2014
Mon
-Fri
01:00 - 06:00
475 492 2 2 17 19 14 16 28% 33% 4 / 15 6 / 16
18:00 - 21:00
2625
15:00 - 18:00
6817 6988 6 6 65 61 61 55 121% 110% 31 / 37 30 / 33 Std. Bus Std. Bus
Std. Bus
09:00 - 15:00
9327 9813 4 4 54 52 51 49 101% 98% 34 / 28 33 / 27 Std. Bus Std. Bus
Time Annual Revenue Hours
Average Trips per Hour
Average Boardings per Hour
Average Boardings per Trip
Average Capacity Utilization
Average Peak Passenger LoadVehicle Type
(NB / SB)
21:00 - 01:00
2442 2421 2 2 43 38 31 29 65% 59% 22 / 21 21 / 16 Std. Bus Std. Bus
30 / 35 27 / 30 Std. Bus Std. Bus2967 2 3 65 56 54 47 108% 93%
06:00 - 09:00
290 295 2 2 18 36 14 27 28% 56% 8 / 11 19 / 15 Std. Bus Std. Bus
2013 2014
2 2 71 94 59
09:00 - 15:00
921 952 2 2 61 71 51 58 102% 116% 25 / 31 27 / 39 Std. Bus Std. Bus
Std. BusStd. Bus
31 41 / 40 Std. Bus Std. Bus
21:00 - 01:00
460 482 2 2 32 38 26 30 53% 60% 31 / 13 24 / 10 Std. Bus
54 82% 110% 41 / 17 40 / 2318:00 - 21:00
432 449 2 2 49 66 41
Satu
rday
01:00 - 06:00
76 119% 151% 41 /15:00 - 18:00
467 481
2013 2014
Sund
ay/H
olid
ay
01:00 - 06:00
15:00 - 18:00
534 561 2
Std. Bus
TimeAnnual Revenue
HoursAverage Trips
per HourAverage Boardings
per Hour Average Boardings
per TripAverage Capacity
Utilization
Average Peak Passenger LoadVehicle Type(NB / SB)
09:00 - 15:00
1000 1049 2 2 53 63 43 51 87% 102% 18 / 33 25 / 33 Std. Bus Std. Bus
06:00 - 09:00
192 195 2 2 18 14 13 11 25% 21% 7 / 12 5 / 9 Std. Bus Std. Bus
23 33 / 31 Std. Bus Std. Bus
18:00 - 21:00
500 529 2 2 39 45 31 38 63% 77% 39 / 11 34 /
2 64 78 48 62 97% 123% 44 /
13 Std. Bus Std. Bus
21:00 - 01:00
546 560 2 2 15 13 26% 10 / 5 12 / 12 Std. Bus Std. Bus
36

145Key Characteristics
Subregion of Primary Service: Predominant Vehicle Type:
Population (People, 400m Buffer): Employment (Jobs, 400m Buffer): Walkability (intersection density):
Contributes to FTN (Y/N):
Cost & Performance2012 2013 2014 Rank (2014)
Annual Boardings: 2,841,000 2,767,000 2,572,000 32 of 212Annual Service Cost: $1,929,000 $1,929,000 $2,175,000 54 of 219
Annual Revenue Hours: 19,500 19,500 22,000 56 of 219Cost /Boarded Passenger: $0.68 $0.70 $0.85 3 of 212
Avg. Boardings / Rev. Hour: 146 142 117 3 of 212Avg. Daily Boardings (Mon-Fri): 10,200 10,100 9,250 25 of 210
Avg. Daily Boardings (Saturdays): 2,600 2,350 2,600 53 of 179Avg. Daily Boardings (Sun & Holidays): 2,000 1,950 1,950 54 of 171
Peak Passenger Load (Bi-directional Avg.): 43 41 39 8 of 212Peak Load Factor (Vehicle Occupancy): 0.57 0.55 0.52 58 of 212
Average Capacity Utilization (Passenger Turnover): 60% 58% 54% 107 of 212Annual Revenue Hours Above Guidelines (Crowding): 8% 9% 5% 191 of 212
Service Changes Since 2012
Route 145
Burnaby/New WestminsterArtic. Bus6,5005,500Low (0.11 int./hect.)Yes
- Spring 2012, Increase freq to FTN levels all days- Fall 2012, Increase SB freq from 15 to 12m from 16-21hr
Productivity
67%
15% 13%
6%
0%
17%
44% 39%
74%
10% 7% 9%
0%
16%
41% 43%
72%
8% 9% 11%
0%
15%
37%
48%
0%
10%
20%
30%
40%
50%
60%
70%
80%
90%
100%
Top 25% Middle High 25% Middle Low 25% Bottom 25% Top 25% Middle High 25% Middle Low 25% Bottom 25%
Boardings Per Revenue Hour Capacity Utilization
Perc
ent o
f Rev
enue
Hou
rs w
ithin
gi
ven
Prod
uctiv
ity B
and
37
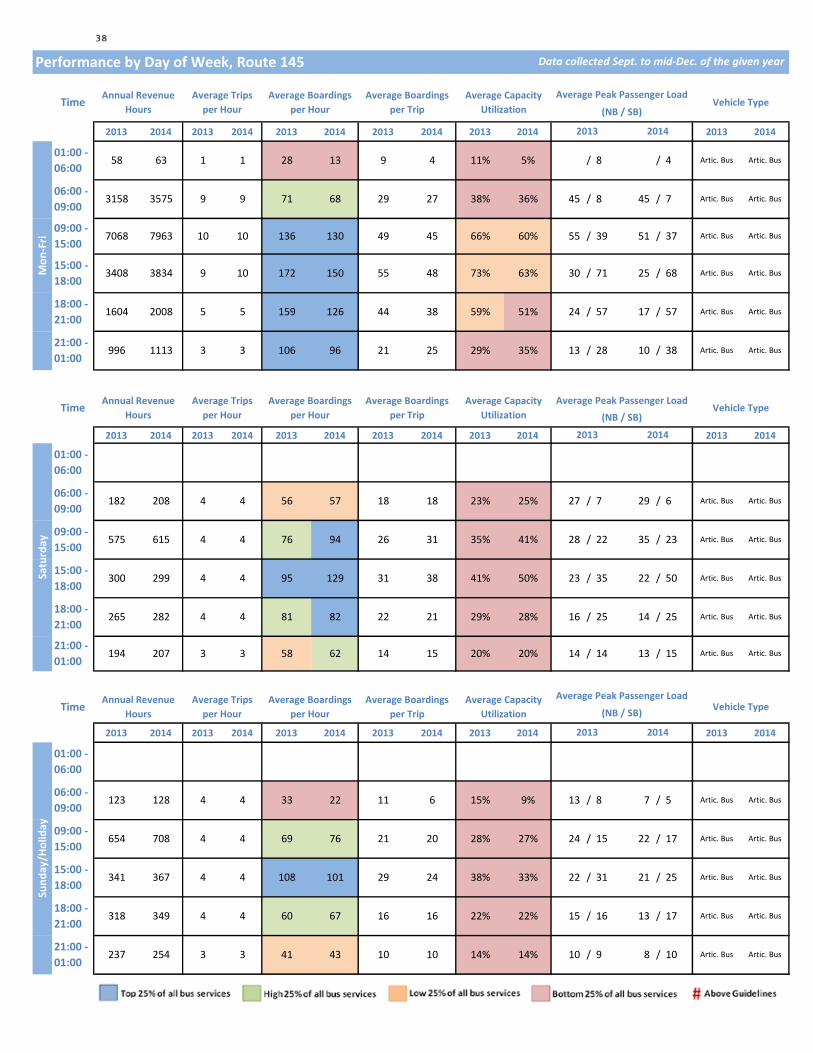
Performance by Day of Week, Route 145
2013 2014 2013 2014 2013 2014 2013 2014 2013 2014 2013 2014
2013 2014 2013 2014 2013 2014 2013 2014 2013 2014 2013 2014
2013 2014 2013 2014 2013 2014 2013 2014 2013 2014 2013 2014
Data collected Sept. to mid-Dec. of the given year
Time Annual Revenue Hours
Average Trips per Hour
Average Boardings per Hour
Average Boardings per Trip
Average Capacity Utilization
Average Peak Passenger LoadVehicle Type
(NB / SB)
2013 2014
Mon
-Fri
01:00 - 06:00
58 63 1 1 28 13 9 4 11% 5% / 8 / 4
18:00 - 21:00
1604
15:00 - 18:00
3408 3834 9 10 172 150 55 48 73% 63% 30 / 71
29% 35% 13 / 28 10 / 38 Artic. Bus Artic. Bus
24
Artic. Bus Artic. Bus
06:00 - 09:00
3158 3575 9 9 71 68 29 27 38% 36% 45 / 8 45 / 7 Artic. Bus
Artic. Bus Artic. Bus
2013 2014
35 22 / 50 Artic. Bus Artic. Bus
25 / 68 Artic. Bus Artic. Bus
Artic. Bus
09:00 - 15:00
7068 7963 10 10 136 130 49 45 66% 60% 55 / 39 51 / 37 Artic. Bus Artic. Bus
Time Annual Revenue Hours
Average Trips per Hour
Average Boardings per Hour
Average Boardings per Trip
Average Capacity Utilization
Average Peak Passenger LoadVehicle Type
(NB / SB)
21:00 - 01:00
996 1113 3 3 106 96 21 25
09:00 - 15:00
575 615 4 4 76 94 26 31 35% 41% 28 / 22 35 / 23 Artic. Bus Artic. Bus
Artic. BusArtic. Bus
/ 57 17 / 57 Artic. Bus Artic. Bus2008 5 5 159 126 44 38 59% 51%
06:00 - 09:00
182 208 4 4 56 57 18 18 23% 25% 27 / 7 29 /
21 29% 28% 16 / 25 14 / 2518:00 - 21:00
265 282 4 4 81 82 22
Satu
rday
01:00 - 06:00
38 41% 50% 23 /15:00 - 18:00
300 299 4 4 95 129 31
6
Artic. Bus
TimeAnnual Revenue
HoursAverage Trips
per HourAverage Boardings
per Hour Average Boardings
per TripAverage Capacity
Utilization
Average Peak Passenger LoadVehicle Type(NB / SB)
09:00 - 15:00
654 708 4 4 69 76 21 20 28% 27% 24 / 15 22 / 17 Artic. Bus Artic. Bus
21:00 - 01:00
194 207 3 3 58 62 14 15 20% 20% 14 / 14 13 / 15 Artic. Bus
16 13 /
4 108 101 29 24 38% 33% 22 /
06:00 - 09:00
123 128
2013 2014
Sund
ay/H
olid
ay
01:00 - 06:00
15:00 - 18:00
341 367 4
4 4 33 22 11 6 15% 9% 13 / 8 7 / 5 Artic. Bus Artic. Bus
17 Artic. Bus Artic. Bus
21:00 - 01:00
237 254 3 3 41 43 10 10 14% 14% 10 / 9 8 / 10 Artic. Bus Artic. Bus
31 21 / 25 Artic. Bus Artic. Bus
18:00 - 21:00
318 349 4 4 60 67 16 16 22% 22% 15 /
38

151Key Characteristics
Subregion of Primary Service: Predominant Vehicle Type:
Population (People, 400m Buffer): Employment (Jobs, 400m Buffer): Walkability (intersection density):
Contributes to FTN (Y/N):
Cost & Performance2012 2013 2014 Rank (2014)
Annual Boardings: 769,000 741,000 683,000 88 of 212Annual Service Cost: $1,365,000 $1,374,000 $1,380,000 81 of 219
Annual Revenue Hours: 13,800 13,900 13,900 86 of 219Cost /Boarded Passenger: $1.77 $1.85 $2.02 103 of 212
Avg. Boardings / Rev. Hour: 56 53 49 90 of 212Avg. Daily Boardings (Mon-Fri): 2,400 2,350 2,150 90 of 210
Avg. Daily Boardings (Saturdays): 1,550 1,550 1,350 80 of 179Avg. Daily Boardings (Sun & Holidays): 1,300 1,250 1,200 79 of 171
Peak Passenger Load (Bi-directional Avg.): 20 20 18 108 of 212Peak Load Factor (Vehicle Occupancy): 0.40 0.40 0.37 117 of 212
Average Capacity Utilization (Passenger Turnover): 58% 58% 53% 110 of 212Annual Revenue Hours Above Guidelines (Crowding): 0% 0% 0% 1 of 212
Service Changes Since 2012
Productivity
- No service change between 2012 and September 2014
No
27,000
High (0.23 int./hect.)
Route 151
North East SectorStd. Bus
12,000
4%
12%
48%
37%
0%
5%
52%
43%
2%
16%
50%
33%
0%
9%
50%
40%
2%
12%
36%
50%
0% 5%
39%
56%
0%
10%
20%
30%
40%
50%
60%
70%
80%
90%
100%
Top 25% Middle High 25% Middle Low 25% Bottom 25% Top 25% Middle High 25% Middle Low 25% Bottom 25%
Boardings Per Revenue Hour Capacity Utilization
Perc
ent o
f Rev
enue
Hou
rs w
ithin
gi
ven
Prod
uctiv
ity B
and
39
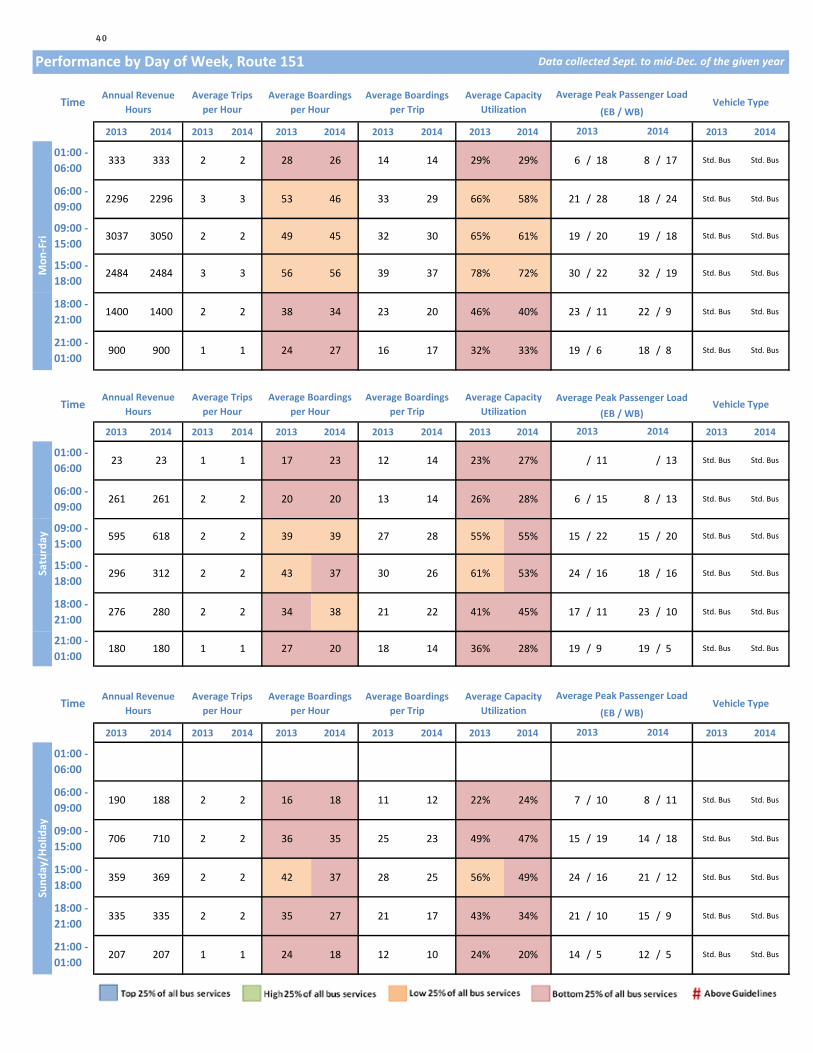
2013 2014 2013 2014 2013 2014 2013 2014 2013 2014 2013 2014
2013 2014 2013 2014 2013 2014 2013 2014 2013 2014 2013 2014
2013 2014 2013 2014 2013 2014 2013 2014 2013 2014 2013 2014
09:00 - 15:00
595 618 2
18:00 - 21:00
276 280 2
Time
21:00 - 01:00
2
/ /
Satu
rday 55% 55% 15 22 15 20 Std. Bus Std. Bus
2
37 30 26 61% 53%
2 39 39 27 28
06:00 - 09:00
180 1 1 27 20 18 14 36%
296
TimeAnnual Revenue
HoursAverage Trips
per HourAverage Boardings
per Hour
18 /28
Std. Bus/ 19 Std. Bus
/ 9
22 32
Data collected Sept. to mid-Dec. of the given year
09:00 - 15:00
3037
06:00 - 09:00
2296
Performance by Day of Week, Route 151
33 29
333 2 14 14 17
32 30 65%
Mon
-Fri
01:00 - 06:00
333
2296
Std. Bus
66% 58% 21 /
Std. Bus
72%
Std. Bus
Std. BusStd. Bus
/
01:00 - 06:00
23 / 11
2014
8/ Std. Bus19 / 6
Average Peak Passenger Load
29%
46% 11 22
Time Annual Revenue Hours
Average Trips per Hour
Average Boardings per Hour
Average Boardings per Trip
Average Capacity Utilization
Average Peak Passenger LoadVehicle Type
(EB / WB)
2013 2014
29% 6 / 18 82 28
24
/
49
Std. Bus Std. Bus
Std. Bus
45 61% 19 / 20 19 / 18 Std. Bus
26
32% 33%
39 30
312
41% 45% 17 /
53 46
3050 2 2
3 3
18
15:00 - 18:00
2484 2484 3 3 56 56
21:00 - 01:00
900 900
15:00 - 18:00
2 2 43
34
261 261 2
24 /
Average Boardings per Trip
Average Capacity Utilization
40% 23 /18:00 - 21:00
1400 34 23 201400 2 2 38
1 1 24 27 16 17
(EB / WB)
2013
37 78%
23 1 14 23%
2 20 20 13 14 26% 28% 6 / 15 8 / 13 Std. Bus Std. Bus
1 17 23 12 27% /
16 18 /
Std. Bus
13 Std. Bus Std. Bus
Vehicle Type
24 / 16 21
49% 47% 15 Std. Bus
16 Std. Bus Std. Bus
Average Capacity Utilization
Average Peak Passenger Load
20142013
(EB / WB)
Std. Bus
11 23 / 10 Std. Bus38 21 22
/ 9 1928% 19 / 5 Std. Bus180
16
15:00 - 18:00
359 369 2
12
2 42 37 28
23
Std. Bus
Sund
ay/H
olid
ay
01:00 - 06:00
Std. Bus
18:00 - 21:00
335 335 2 2 35 27 21 17 43% 34% 21 / 10 15 /
56% 49%
Annual Revenue Hours
Average Trips per Hour
Average Boardings per Hour
Average Boardings per Trip
Vehicle Type
06:00 - 09:00
190 188
9 Std. Bus
/ 19 14 / 18 Std. Bus
/ 12 Std. Bus
Std. Bus
5 1220% 14 /
22% 24% / 10 8 / 11 Std. Bus
12 10
18 11
25
21:00 - 01:00
207 207 1
09:00 - 15:00
706 710 2 2 36 35 25
7
Std. Bus/1 24 18 24% Std. Bus5
2
40

152Key Characteristics
Subregion of Primary Service: Predominant Vehicle Type:
Population (People, 400m Buffer): Employment (Jobs, 400m Buffer): Walkability (intersection density):
Contributes to FTN (Y/N):
Cost & Performance2012 2013 2014 Rank (2014)
Annual Boardings: 1,012,000 974,000 921,000 69 of 212Annual Service Cost: $1,491,000 $1,464,000 $1,454,000 77 of 219
Annual Revenue Hours: 15,100 14,800 14,700 81 of 219Cost /Boarded Passenger: $1.47 $1.50 $1.58 64 of 212
Avg. Boardings / Rev. Hour: 67 66 63 58 of 212Avg. Daily Boardings (Mon-Fri): 3,200 3,100 2,950 69 of 210
Avg. Daily Boardings (Saturdays): 2,050 2,000 1,850 68 of 179Avg. Daily Boardings (Sun & Holidays): 1,550 1,600 1,400 72 of 171
Peak Passenger Load (Bi-directional Avg.): 26 25 23 78 of 212Peak Load Factor (Vehicle Occupancy): 0.52 0.50 0.47 77 of 212
Average Capacity Utilization (Passenger Turnover): 71% 69% 65% 76 of 212Annual Revenue Hours Above Guidelines (Crowding): 0% 0% 0% 1 of 212
Service Changes Since 2012- No service change between 2012 and September 2014
Route 152
13,000
Std. BusNorth East Sector
No
30,500
High (0.21 int./hect.)
Productivity
1%
36%
48%
15%
0%
20%
59%
21%
0%
33%
48%
19%
0%
23%
55%
22%
1%
24%
53%
22%
0%
10%
58%
32%
0%
10%
20%
30%
40%
50%
60%
70%
80%
90%
100%
Top 25% Middle High 25% Middle Low 25% Bottom 25% Top 25% Middle High 25% Middle Low 25% Bottom 25%
Boardings Per Revenue Hour Capacity Utilization
Perc
ent o
f Rev
enue
Hou
rs w
ithin
gi
ven
Prod
uctiv
ity B
and
41

Performance by Day of Week, Route 152
2013 2014 2013 2014 2013 2014 2013 2014 2013 2014 2013 2014
2013 2014 2013 2014 2013 2014 2013 2014 2013 2014 2013 2014
2013 2014 2013 2014 2013 2014 2013 2014 2013 2014 2013 2014
3233
18:00 - 21:00
1396 13 Std. Bus Std. Bus
18
32 Std. Bus Std. Bus
Std. Bus Std. Bus
Std. Bus Std. Bus53
/
2637 76% 74% 24 / 27
(EB / WB)
2013
06:00 - 09:00
2663 2638
21:00 - 01:00
850
Average Trips per Hour
Average Boardings per Hour
Average Boardings per Trip
Average Capacity Utilization
34
51
29 69% 58% /
63%
1396 2 53
57 41
30 65%
38 82%59 75% 37
2014
Time Annual Revenue Hours
Data collected Sept. to mid-Dec. of the given year
Average Peak Passenger LoadVehicle Type
32 /
34
59% 15 / 33 13
/20
/
60% 34 / 15
42% 40% 10 / 23
850
3216 4 4
2
2
4
54 23 /
Std. Bus
11 Std. Bus Std. Bus
/
09:00 - 15:00
3284 3229 2
4
54 32
49 43 34
29
/
Std. Bus
282
15:00 - 18:00
38
49 31
Mon
-Fri
01:00 - 06:00
217 217 2
/ 28 20 /
25 Std. Bus Std. Bus
Average Peak Passenger Load
1 12 22
34 36 67%
Vehicle Type(EB / WB)
2013 2014
28 Std. Bus Std. Bus
1 37 36 23 22 46% 45% 24 /
Average Boardings per Hour
9 /
25 23 49% 47% 18
34
40
41 30 15 22 / 13
36
Std. Bus
65 68
23 60% 45% 29
Time Annual Revenue Hours
Average Trips per Hour
22 32 /
20 Std. Bus Std. Bus
72% 1909:00 - 15:00
587 587
21 20
Average Boardings per Trip
Average Capacity Utilization
2
01:00 - 06:00
19 23 /21:00 - 01:00
176 176 1 1
Sund
ay/H
olid
ay
01:00 - 06:00
21:00 - 01:00
208 208 1
15:00 - 18:00
2 2
36 36
/41 80% 83% 36
/
Satu
rday
48
2 2 55 59
06:00 - 09:00
196
15:00 - 18:00
303 303 2
196 2 2
50
18:00 - 21:00
238 238 2 2
33%104
1
24 16 / 22 Std. Bus
29 /
17 Std. Bus
Vehicle Type
/
19 2964% 62%
TimeAnnual Revenue
HoursAverage Trips
per HourAverage Boardings
per Hour
Std. Bus
18 9 /
Std. Bus
Average Peak Passenger Load
(EB / WB)
2013
Std. Bus
Std. Bus
Average Boardings per Trip
06:00 - 09:00
104
Average Capacity Utilization
30%
14
1 1 27
2014
32 15 17
Std. Bus
17 18 34% Std. Bus
57% 56% 18 /
44% 27 / 10 25 / 10
32 31
47 48 29 2809:00 - 15:00
705 705 2 2
350 350 51
8
/ 16 Std. Bus
/
Std. Bus
35% 18
18:00 - 21:00
277
/ 8 18 9 Std. Bus/
Std. Bus Std. Bus277 2 2 33 34 23 22 45%
24 24
42
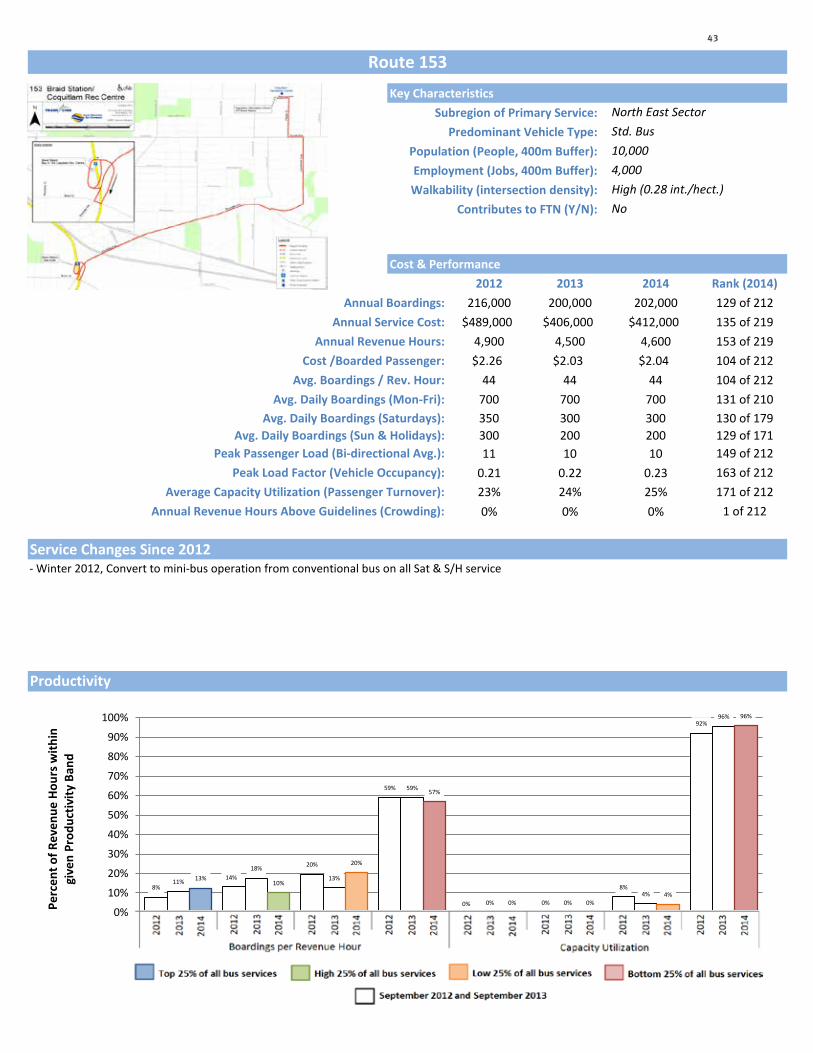
153Key Characteristics
Subregion of Primary Service: Predominant Vehicle Type:
Population (People, 400m Buffer): Employment (Jobs, 400m Buffer): Walkability (intersection density):
Contributes to FTN (Y/N):
Cost & Performance2012 2013 2014 Rank (2014)
Annual Boardings: 216,000 200,000 202,000 129 of 212Annual Service Cost: $489,000 $406,000 $412,000 135 of 219
Annual Revenue Hours: 4,900 4,500 4,600 153 of 219Cost /Boarded Passenger: $2.26 $2.03 $2.04 104 of 212
Avg. Boardings / Rev. Hour: 44 44 44 104 of 212Avg. Daily Boardings (Mon-Fri): 700 700 700 131 of 210
Avg. Daily Boardings (Saturdays): 350 300 300 130 of 179Avg. Daily Boardings (Sun & Holidays): 300 200 200 129 of 171
Peak Passenger Load (Bi-directional Avg.): 11 10 10 149 of 212Peak Load Factor (Vehicle Occupancy): 0.21 0.22 0.23 163 of 212
Average Capacity Utilization (Passenger Turnover): 23% 24% 25% 171 of 212Annual Revenue Hours Above Guidelines (Crowding): 0% 0% 0% 1 of 212
Service Changes Since 2012
Route 153
4,000High (0.28 int./hect.)
North East SectorStd. Bus10,000
No
- Winter 2012, Convert to mini-bus operation from conventional bus on all Sat & S/H service
Productivity
8% 14%
20%
59%
0% 0%
8%
92%
11%
18% 13%
59%
0% 0% 4%
96%
13% 10%
20%
57%
0% 0% 4%
96%
0%
10%
20%
30%
40%
50%
60%
70%
80%
90%
100%
Top 25% Middle High 25% Middle Low 25% Bottom 25% Top 25% Middle High 25% Middle Low 25% Bottom 25%
Boardings Per Revenue Hour Capacity Utilization
Perc
ent o
f Rev
enue
Hou
rs w
ithin
gi
ven
Prod
uctiv
ity B
and
43
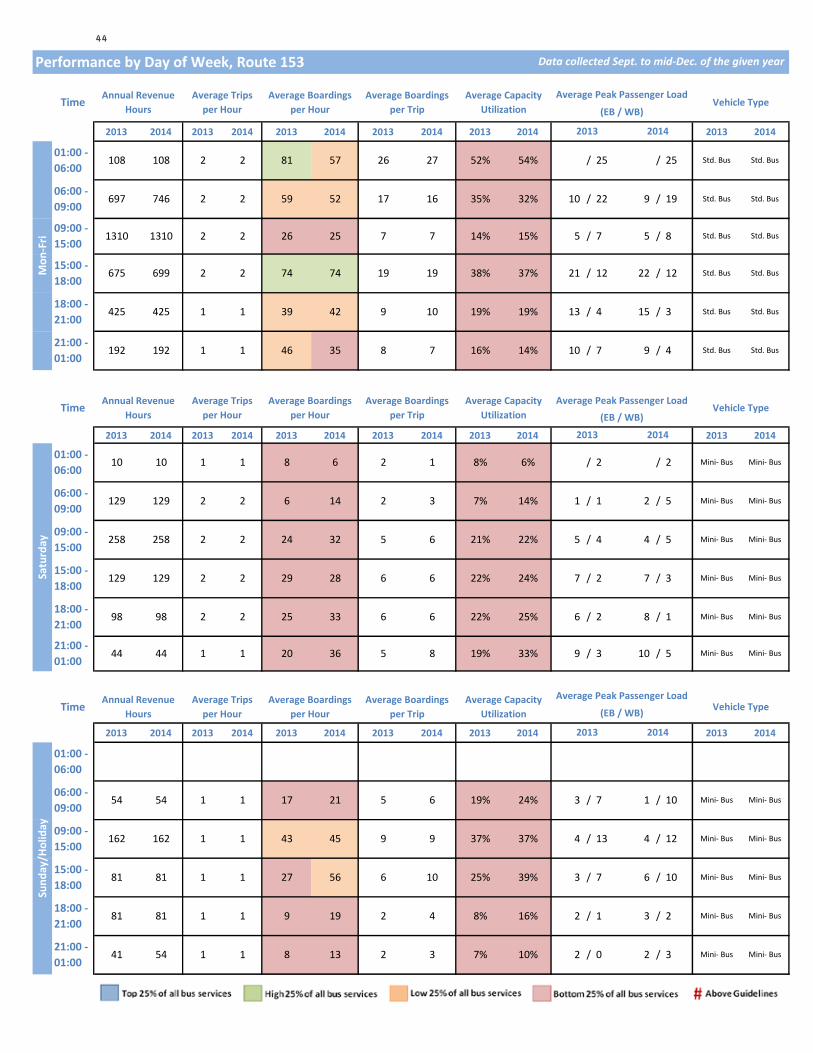
Performance by Day of Week, Route 153
2013 2014 2013 2014 2013 2014 2013 2014 2013 2014 2013 2014
2013 2014 2013 2014 2013 2014 2013 2014 2013 2014 2013 2014
2013 2014 2013 2014 2013 2014 2013 2014 2013 2014 2013 2014
Data collected Sept. to mid-Dec. of the given year
Time Annual Revenue Hours
Average Trips per Hour
Average Boardings per Hour
Average Boardings per Trip
Average Capacity Utilization
Average Peak Passenger LoadVehicle Type
25 Std. Bus Std. Bus
06:00 - 09:00
697 746 2 2 59 52 17 16 35% 32% 10 / 22 9 / 19
(EB / WB)
2013 2014
Mon
-Fri
01:00 - 06:00
108 108 2 2 81 57 26 27 52% 54% / 25 /
15:00 - 18:00
675 699 2 2 74 74 19 19 38% 37% 21 / 12 22 / 12 Std. Bus Std. Bus
Std. Bus Std. Bus
09:00 - 15:00
1310 1310 2 2 26 25 7 7 14% 15% 5 / 7 5 / 8 Std. Bus Std. Bus
Time Annual Revenue Hours
Average Trips per Hour
Average Boardings per Hour
Average Boardings per Trip
Average Capacity Utilization
Average Peak Passenger LoadVehicle Type
(EB / WB)
Std. Bus
21:00 - 01:00
192 192 1 1 46 35 8 7 16% 14% 10 / 7 9 / 4 Std. Bus Std. Bus
19% 19% 13 / 4 15 / 3 Std. Bus18:00 - 21:00
425 425 1 1 39 42 9 10
Mini- Bus Mini- Bus
06:00 - 09:00
129 129 2 2 6 14 2 3 7% 14% 1 / 1 2 / 5 Mini- Bus Mini- Bus
2013 2014
2 2 29 28 6
09:00 - 15:00
258 258 2 2 24 32 5 6 21% 22% 5 / 4 4 / 5 Mini- Bus Mini- Bus
Mini- BusMini- Bus
2 7 / 3 Mini- Bus Mini- Bus
21:00 - 01:00
44 44 1 1 20 36 5 8 19% 33% 9 / 3 10 / 5 Mini- Bus
6 22% 25% 6 / 2 8 / 118:00 - 21:00
98 98 2 2 25 33 6
Satu
rday
01:00 - 06:00
10 10 1 1 8 6 2 1 8% 6% / 2 / 2
6 22% 24% 7 /15:00 - 18:00
129 129
2013 2014
Sund
ay/H
olid
ay
01:00 - 06:00
15:00 - 18:00
81 81 1
Mini- Bus
TimeAnnual Revenue
HoursAverage Trips
per HourAverage Boardings
per Hour Average Boardings
per TripAverage Capacity
Utilization
Average Peak Passenger LoadVehicle Type(EB / WB)
09:00 - 15:00
162 162 1 1 43 45 9 9 37% 37% 4 / 13 4 / 12 Mini- Bus Mini- Bus
06:00 - 09:00
54 54 1 1 17 21 5 6 19% 24% 3 / 7 1 / 10 Mini- Bus Mini- Bus
7 6 / 10 Mini- Bus Mini- Bus
18:00 - 21:00
81 81 1 1 9 19 2 4 8% 16% 2 / 1 3 /
1 27 56 6 10 25% 39% 3 /
2 Mini- Bus Mini- Bus
21:00 - 01:00
41 54 1 1 8 13 2 3 7% 10% 2 / 0 2 / 3 Mini- Bus Mini- Bus
44
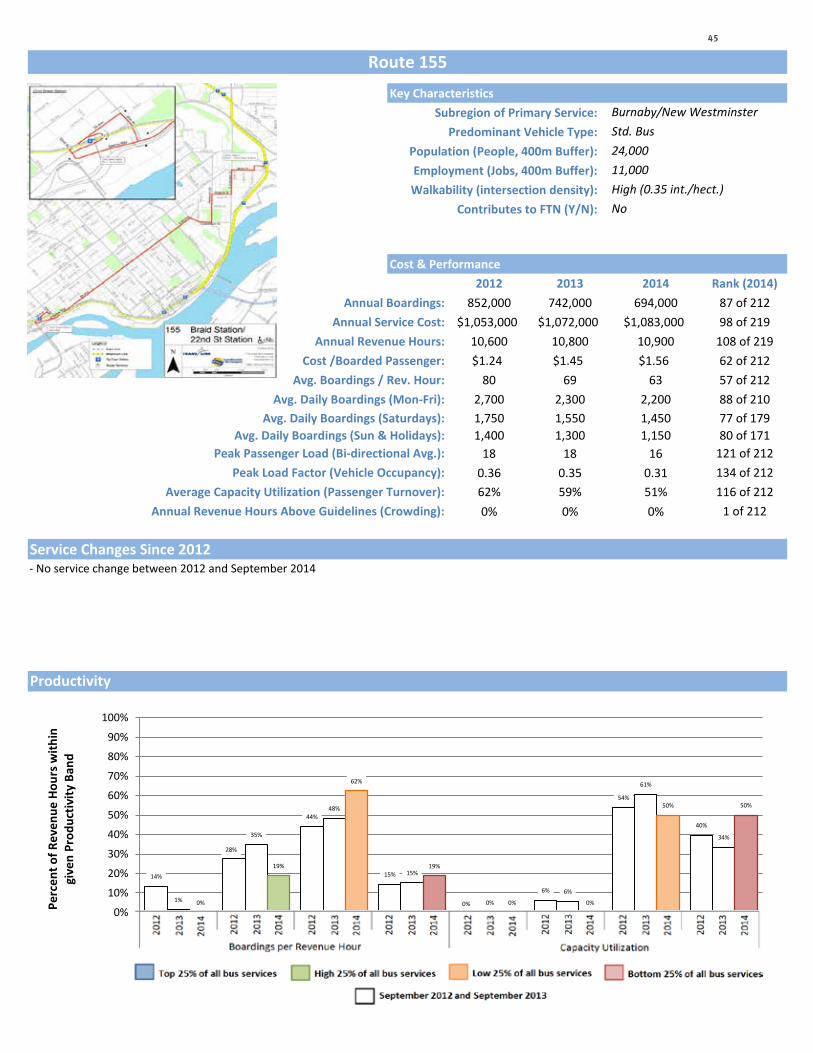
155Key Characteristics
Subregion of Primary Service: Predominant Vehicle Type:
Population (People, 400m Buffer): Employment (Jobs, 400m Buffer): Walkability (intersection density):
Contributes to FTN (Y/N):
Cost & Performance2012 2013 2014 Rank (2014)
Annual Boardings: 852,000 742,000 694,000 87 of 212Annual Service Cost: $1,053,000 $1,072,000 $1,083,000 98 of 219
Annual Revenue Hours: 10,600 10,800 10,900 108 of 219Cost /Boarded Passenger: $1.24 $1.45 $1.56 62 of 212
Avg. Boardings / Rev. Hour: 80 69 63 57 of 212Avg. Daily Boardings (Mon-Fri): 2,700 2,300 2,200 88 of 210
Avg. Daily Boardings (Saturdays): 1,750 1,550 1,450 77 of 179Avg. Daily Boardings (Sun & Holidays): 1,400 1,300 1,150 80 of 171
Peak Passenger Load (Bi-directional Avg.): 18 18 16 121 of 212Peak Load Factor (Vehicle Occupancy): 0.36 0.35 0.31 134 of 212
Average Capacity Utilization (Passenger Turnover): 62% 59% 51% 116 of 212Annual Revenue Hours Above Guidelines (Crowding): 0% 0% 0% 1 of 212
Service Changes Since 2012
Route 155
Burnaby/New Westminster
11,000High (0.35 int./hect.)
Std. Bus24,000
No
- No service change between 2012 and September 2014
Productivity
14%
28%
44%
15%
0%
6%
54%
40%
1%
35%
48%
15%
0%
6%
61%
34%
0%
19%
62%
19%
0% 0%
50% 50%
0%
10%
20%
30%
40%
50%
60%
70%
80%
90%
100%
Top 25% Middle High 25% Middle Low 25% Bottom 25% Top 25% Middle High 25% Middle Low 25% Bottom 25%
Boardings Per Revenue Hour Capacity Utilization
Perc
ent o
f Rev
enue
Hou
rs w
ithin
gi
ven
Prod
uctiv
ity B
and
45

Performance by Day of Week, Route 155
2013 2014 2013 2014 2013 2014 2013 2014 2013 2014 2013 2014
2013 2014 2013 2014 2013 2014 2013 2014 2013 2014 2013 2014
2013 2014 2013 2014 2013 2014 2013 2014 2013 2014 2013 2014
Data collected Sept. to mid-Dec. of the given year
Time Annual Revenue Hours
Average Trips per Hour
Average Boardings per Hour
Average Boardings per Trip
Average Capacity Utilization
Average Peak Passenger LoadVehicle Type
(EB / WB)
Std. Bus Std. Bus
06:00 - 09:00
1876 1917 3 3 50 44 27 25 55% 49% 19 / 18 14 / 18 Std. Bus
2013 2014
Mon
-Fri
01:00 - 06:00
79 171 1 2 85 73 29 29 59% 58% / 27 / 27
18:00 - 21:00
1237
15:00 - 18:00
2058 2083 3 3 63 54 39 32 77% 64% 28 / 19 23 / 16 Std. Bus Std. Bus
Std. Bus
09:00 - 15:00
2504 2462 2 2 61 59 34 31 68% 62% 21 / 17 18 / 16 Std. Bus Std. Bus
Time Annual Revenue Hours
Average Trips per Hour
Average Boardings per Hour
Average Boardings per Trip
Average Capacity Utilization
Average Peak Passenger LoadVehicle Type
(EB / WB)
21:00 - 01:00
679 679 1 1 31 33 15 15 28% 29% 10 / 8 12 / 8 Std. Bus Std. Bus
21 / 12 17 / 11 Std. Bus Std. Bus1237 2 2 53 42 26 22 51% 44%
06:00 - 09:00
190 190 2 2 28 28 11 11 22% 23% 7 / 9 8 / 9 Std. Bus Std. Bus
2013 2014
2 2 76 54 38
09:00 - 15:00
452 452 2 2 63 53 32 28 65% 56% 17 / 19 13 / 17 Std. Bus Std. Bus
Std. BusStd. Bus
18 18 / 12 Std. Bus Std. Bus
21:00 - 01:00
108 108 1 1 19 20 10 10 18% 20% 8 / 4 10 / 5 Std. Bus
18 40% 36% 16 / 10 14 / 818:00 - 21:00
213 208 2 2 35 33 20
Satu
rday
01:00 - 06:00
27 76% 54% 22 /15:00 - 18:00
240 240
2013 2014
Sund
ay/H
olid
ay
01:00 - 06:00
15:00 - 18:00
260 260 2
Std. Bus
TimeAnnual Revenue
HoursAverage Trips
per HourAverage Boardings
per Hour Average Boardings
per TripAverage Capacity
Utilization
Average Peak Passenger LoadVehicle Type(EB / WB)
09:00 - 15:00
509 509 2 2 52 48 24 23 48% 45% 14 / 13 14 / 12 Std. Bus Std. Bus
06:00 - 09:00
54 54 1 1 36 41 16 18 31% 36% 10 / 8 11 / 11 Std. Bus Std. Bus
13 17 / 11 Std. Bus Std. Bus
18:00 - 21:00
232 232 2 2 40 33 18 16 36% 31% 17 / 7 15 /
2 61 54 28 24 56% 49% 19 /
7 Std. Bus Std. Bus
21:00 - 01:00
144 144 1 1 23 20 12 11 23% 21% 8 / 9 7 / 6 Std. Bus Std. Bus
46
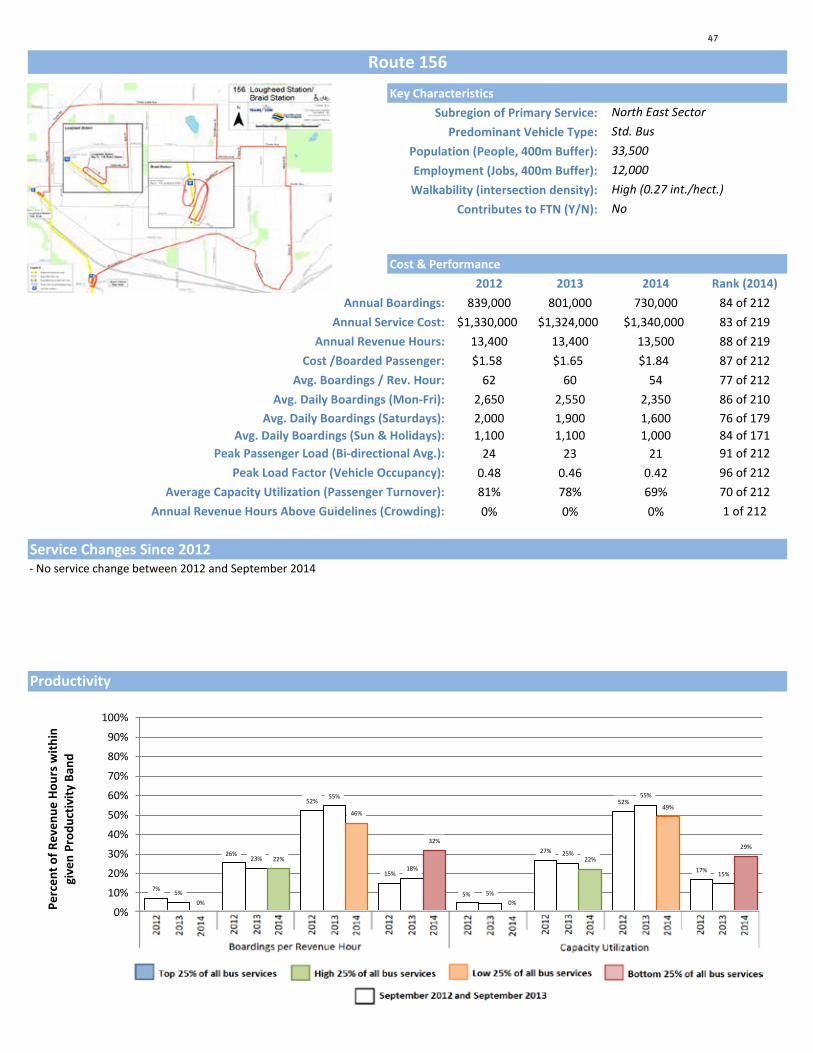
156Key Characteristics
Subregion of Primary Service: Predominant Vehicle Type:
Population (People, 400m Buffer): Employment (Jobs, 400m Buffer): Walkability (intersection density):
Contributes to FTN (Y/N):
Cost & Performance2012 2013 2014 Rank (2014)
Annual Boardings: 839,000 801,000 730,000 84 of 212Annual Service Cost: $1,330,000 $1,324,000 $1,340,000 83 of 219
Annual Revenue Hours: 13,400 13,400 13,500 88 of 219Cost /Boarded Passenger: $1.58 $1.65 $1.84 87 of 212
Avg. Boardings / Rev. Hour: 62 60 54 77 of 212Avg. Daily Boardings (Mon-Fri): 2,650 2,550 2,350 86 of 210
Avg. Daily Boardings (Saturdays): 2,000 1,900 1,600 76 of 179Avg. Daily Boardings (Sun & Holidays): 1,100 1,100 1,000 84 of 171
Peak Passenger Load (Bi-directional Avg.): 24 23 21 91 of 212Peak Load Factor (Vehicle Occupancy): 0.48 0.46 0.42 96 of 212
Average Capacity Utilization (Passenger Turnover): 81% 78% 69% 70 of 212Annual Revenue Hours Above Guidelines (Crowding): 0% 0% 0% 1 of 212
Service Changes Since 2012
Route 156
North East Sector
12,000High (0.27 int./hect.)
Std. Bus33,500
No
- No service change between 2012 and September 2014
Productivity
7%
26%
52%
15%
5%
27%
52%
17%
5%
23%
55%
18%
5%
25%
55%
15%
0%
22%
46%
32%
0%
22%
49%
29%
0%
10%
20%
30%
40%
50%
60%
70%
80%
90%
100%
Top 25% Middle High 25% Middle Low 25% Bottom 25% Top 25% Middle High 25% Middle Low 25% Bottom 25%
Boardings Per Revenue Hour Capacity Utilization
Perc
ent o
f Rev
enue
Hou
rs w
ithin
gi
ven
Prod
uctiv
ity B
and
47
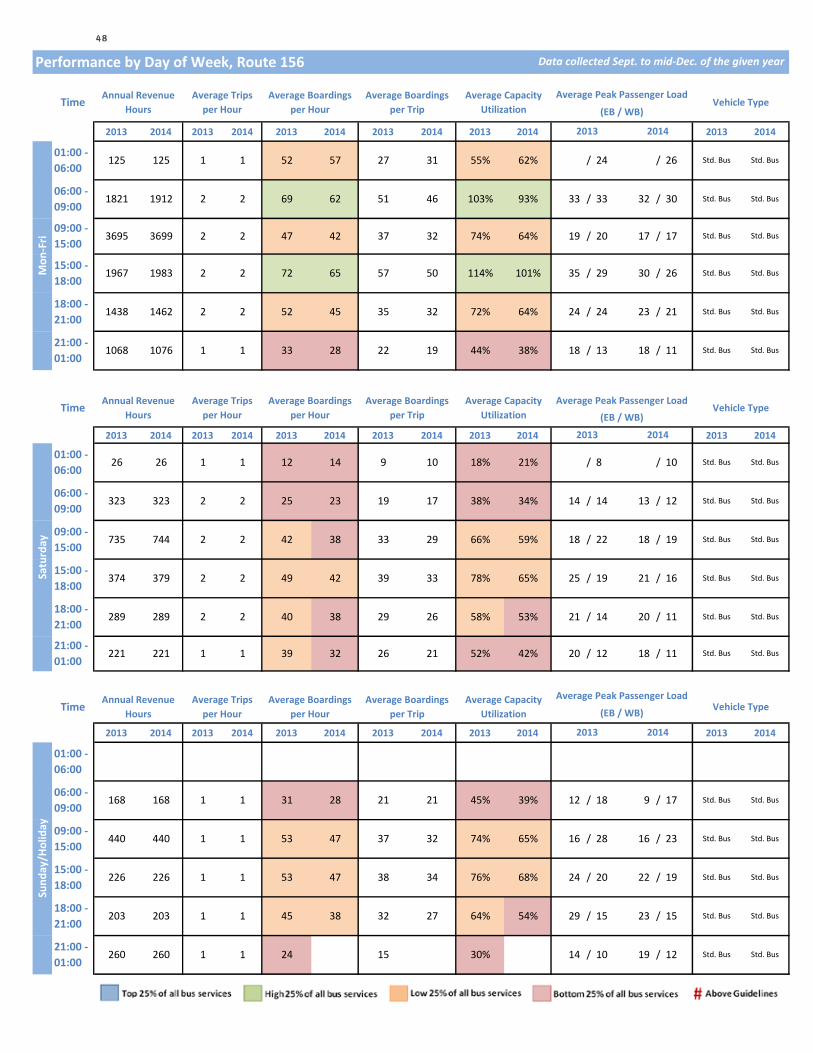
Performance by Day of Week, Route 156
2013 2014 2013 2014 2013 2014 2013 2014 2013 2014 2013 2014
2013 2014 2013 2014 2013 2014 2013 2014 2013 2014 2013 2014
2013 2014 2013 2014 2013 2014 2013 2014 2013 2014 2013 2014
Data collected Sept. to mid-Dec. of the given year
Time Annual Revenue Hours
Average Trips per Hour
Average Boardings per Hour
Average Boardings per Trip
Average Capacity Utilization
Average Peak Passenger LoadVehicle Type
(EB / WB)
Std. Bus Std. Bus
06:00 - 09:00
1821 1912 2 2 69 62 51 46 103% 93% 33 / 33 32 / 30 Std. Bus
2013 2014
Mon
-Fri
01:00 - 06:00
125 125 1 1 52 57 27 31 55% 62% / 24 / 26
18:00 - 21:00
1438
15:00 - 18:00
1967 1983 2 2 72 65 57 50 114% 101% 35 / 29 30 / 26 Std. Bus Std. Bus
Std. Bus
09:00 - 15:00
3695 3699 2 2 47 42 37 32 74% 64% 19 / 20 17 / 17 Std. Bus Std. Bus
Time Annual Revenue Hours
Average Trips per Hour
Average Boardings per Hour
Average Boardings per Trip
Average Capacity Utilization
Average Peak Passenger LoadVehicle Type
(EB / WB)
21:00 - 01:00
1068 1076 1 1 33 28 22 19 44% 38% 18 / 13 18 / 11 Std. Bus Std. Bus
24 / 24 23 / 21 Std. Bus Std. Bus1462 2 2 52 45 35 32 72% 64%
Std. Bus Std. Bus
06:00 - 09:00
323 323 2 2 25 23 19 17 38% 34% 14 / 14 13 / 12 Std. Bus Std. Bus
2013 2014
2 2 49 42 39
09:00 - 15:00
735 744 2 2 42 38 33 29 66% 59% 18 / 22 18 / 19 Std. Bus Std. Bus
Std. BusStd. Bus
19 21 / 16 Std. Bus Std. Bus
21:00 - 01:00
221 221 1 1 39 32 26 21 52% 42% 20 / 12 18 / 11 Std. Bus
26 58% 53% 21 / 14 20 / 1118:00 - 21:00
289 289 2 2 40 38 29
Satu
rday
01:00 - 06:00
26 26 1 1 12 14 9 10 18% 21% / 8 / 10
33 78% 65% 25 /15:00 - 18:00
374 379
2013 2014
Sund
ay/H
olid
ay
01:00 - 06:00
15:00 - 18:00
226 226 1
Std. Bus
TimeAnnual Revenue
HoursAverage Trips
per HourAverage Boardings
per Hour Average Boardings
per TripAverage Capacity
Utilization
Average Peak Passenger LoadVehicle Type(EB / WB)
09:00 - 15:00
440 440 1 1 53 47 37 32 74% 65% 16 / 28 16 / 23 Std. Bus Std. Bus
06:00 - 09:00
168 168 1 1 31 28 21 21 45% 39% 12 / 18 9 / 17 Std. Bus Std. Bus
20 22 / 19 Std. Bus Std. Bus
18:00 - 21:00
203 203 1 1 45 38 32 27 64% 54% 29 / 15 23 /
1 53 47 38 34 76% 68% 24 /
15 Std. Bus Std. Bus
21:00 - 01:00
260 260 1 1 24 15 30% 14 / 10 19 / 12 Std. Bus Std. Bus
48

157Key Characteristics
Subregion of Primary Service: Predominant Vehicle Type:
Population (People, 400m Buffer): Employment (Jobs, 400m Buffer): Walkability (intersection density):
Contributes to FTN (Y/N):
Cost & Performance2012 2013 2014 Rank (2014)
Annual Boardings: 299,000 268,000 233,000 126 of 212Annual Service Cost: $570,000 $508,000 $505,000 125 of 219
Annual Revenue Hours: 5,800 5,600 5,600 135 of 219Cost /Boarded Passenger: $1.91 $1.89 $2.17 115 of 212
Avg. Boardings / Rev. Hour: 52 48 42 110 of 212Avg. Daily Boardings (Mon-Fri): 1,000 950 800 125 of 210
Avg. Daily Boardings (Saturdays): 600 400 400 122 of 179Avg. Daily Boardings (Sun & Holidays): 300 200 250 125 of 171
Peak Passenger Load (Bi-directional Avg.): 14 13 11 145 of 212Peak Load Factor (Vehicle Occupancy): 0.27 0.28 0.24 156 of 212
Average Capacity Utilization (Passenger Turnover): 31% 32% 28% 168 of 212Annual Revenue Hours Above Guidelines (Crowding): 0% 0% 0% 1 of 212
Service Changes Since 2012
Route 157
North East Sector
7,500High (0.31 int./hect.)
Std. Bus16,500
No
- No service change between 2012 and September 2014
Productivity
14% 9%
22%
55%
0% 0%
16%
84%
13%
21% 16%
51%
0% 0%
14%
86%
4%
17%
23%
56%
0% 0% 3%
97%
0%
10%
20%
30%
40%
50%
60%
70%
80%
90%
100%
Top 25% Middle High 25% Middle Low 25% Bottom 25% Top 25% Middle High 25% Middle Low 25% Bottom 25%
Boardings Per Revenue Hour Capacity Utilization
Perc
ent o
f Rev
enue
Hou
rs w
ithin
gi
ven
Prod
uctiv
ity B
and
49

Performance by Day of Week, Route 157
2013 2014 2013 2014 2013 2014 2013 2014 2013 2014 2013 2014
2013 2014 2013 2014 2013 2014 2013 2014 2013 2014 2013 2014
2013 2014 2013 2014 2013 2014 2013 2014 2013 2014 2013 2014
Data collected Sept. to mid-Dec. of the given year
Time Annual Revenue Hours
Average Trips per Hour
Average Boardings per Hour
Average Boardings per Trip
Average Capacity Utilization
Average Peak Passenger LoadVehicle Type
(EB / WB)
Std. Bus Std. Bus
06:00 - 09:00
871 871 2 2 59 48 21 17 42% 34% 14 / 23 11 / 19 Std. Bus
2013 2014
Mon
-Fri
01:00 - 06:00
129 129 1 1 17 15 7 7 15% 14% 1 / 12 1 / 13
18:00 - 21:00
600
15:00 - 18:00
791 791 2 2 75 58 24 18 50% 36% 23 / 18 17 / 15 Std. Bus Std. Bus
Std. Bus
09:00 - 15:00
1640 1640 2 2 44 39 13 12 26% 24% 9 / 14 8 / 12 Std. Bus Std. Bus
Time Annual Revenue Hours
Average Trips per Hour
Average Boardings per Hour
Average Boardings per Trip
Average Capacity Utilization
Average Peak Passenger LoadVehicle Type
(EB / WB)
21:00 - 01:00
258 258 1 1 41 31 11 9 22% 18% 17 / 5 13 / 4 Std. Bus Std. Bus
18 / 5 19 / 5 Std. Bus Std. Bus600 2 2 44 47 13 13 27% 26%
Mini- Bus Mini- Bus
06:00 - 09:00
143 143 2 2 10 13 3 4 13% 16% 1 / 4 2 / 5 Mini- Bus Mini- Bus
2013 2014
2 2 40 30 10
09:00 - 15:00
317 317 2 2 27 28 8 7 33% 30% 5 / 10 5 / 8 Mini- Bus Mini- Bus
Mini- BusMini- Bus
7 9 / 4 Mini- Bus Mini- Bus
21:00 - 01:00
37 48 1 1 18 30 5 7 19% 30% 5 / 9 / 5 Mini- Bus
6 33% 27% 9 / 6 7 / 418:00 - 21:00
93 117 1 2 27 25 8
Satu
rday
01:00 - 06:00
23 23 1 1 7 8 3 2 11% 10% 0 / 5 1 / 4
7 42% 32% 11 /15:00 - 18:00
166 166
2013 2014
Sund
ay/H
olid
ay
01:00 - 06:00
15:00 - 18:00
102 102 1
Mini- Bus
TimeAnnual Revenue
HoursAverage Trips
per HourAverage Boardings
per Hour Average Boardings
per TripAverage Capacity
Utilization
Average Peak Passenger LoadVehicle Type(EB / WB)
09:00 - 15:00
188 188 1 1 17 25 6 8 26% 35% 5 / 6 5 / 10 Mini- Bus Mini- Bus
06:00 - 09:00
41 41 1 1 8 11 2 3 9% 13% 2 / 5 2 / 4 Mini- Bus Mini- Bus
11 10 / 8 Mini- Bus Mini- Bus
18:00 - 21:00
96 96 1 1 16 26 5 6 20% 25% 4 / 4 7 /
1 30 35 11 10 43% 41% 8 /
3 Mini- Bus Mini- Bus
21:00 - 01:00
79 79 1 1 7 12 3 3 10% 13% 2 / 2 5 / 2 Mini- Bus Mini- Bus
50

159Key Characteristics
Subregion of Primary Service: Predominant Vehicle Type:
Population (People, 400m Buffer): Employment (Jobs, 400m Buffer): Walkability (intersection density):
Contributes to FTN (Y/N):
Cost & Performance2012 2013 2014 Rank (2014)
Annual Boardings: 676,000 722,000 722,000 85 of 212Annual Service Cost: $1,327,000 $1,602,000 $1,606,000 68 of 219
Annual Revenue Hours: 13,400 16,200 16,200 70 of 219Cost /Boarded Passenger: $1.96 $2.22 $2.22 120 of 212
Avg. Boardings / Rev. Hour: 50 45 44 103 of 212Avg. Daily Boardings (Mon-Fri): 2,250 2,400 2,400 82 of 210
Avg. Daily Boardings (Saturdays): 1,250 1,400 1,350 79 of 179Avg. Daily Boardings (Sun & Holidays): 700 850 850 86 of 171
Peak Passenger Load (Bi-directional Avg.): 25 28 25 68 of 212Peak Load Factor (Vehicle Occupancy): 0.49 0.55 0.50 65 of 212
Average Capacity Utilization (Passenger Turnover): 59% 69% 61% 85 of 212Annual Revenue Hours Above Guidelines (Crowding): 0% 0% 0% 1 of 212
Service Changes Since 2012
Route 159
North East Sector
18,500Medium (0.17 int./hect.)
Std. Bus22,000
New alignment includes portion of former 177 service
No
- Fall 2013, New route alignment to cover western portion of discontinued 177- Winter 2013, Discontinue service along Glacier St and Golden Dr to address schedule adherence concerns
- Summer 2012, Add one trip leaving Port Coquitlam Stn at 5:13, arriving at Braid Stn at approx. 5:51
Productivity
2%
14%
41% 44%
0% 0%
65%
35%
0% 5%
57%
38%
0%
21%
54%
25%
0%
8%
46% 46%
0%
12%
47%
41%
0%
10%
20%
30%
40%
50%
60%
70%
80%
90%
100%
Top 25% Middle High 25% Middle Low 25% Bottom 25% Top 25% Middle High 25% Middle Low 25% Bottom 25%
Boardings Per Revenue Hour Capacity Utilization
Perc
ent o
f Rev
enue
Hou
rs w
ithin
gi
ven
Prod
uctiv
ity B
and
51

Performance by Day of Week, Route 159
2013 2014 2013 2014 2013 2014 2013 2014 2013 2014 2013 2014
2013 2014 2013 2014 2013 2014 2013 2014 2013 2014 2013 2014
2013 2014 2013 2014 2013 2014 2013 2014 2013 2014 2013 2014
Data collected Sept. to mid-Dec. of the given year
Time Annual Revenue Hours
Average Trips per Hour
Average Boardings per Hour
Average Boardings per Trip
Average Capacity Utilization
Average Peak Passenger LoadVehicle Type
(EB / WB)
Std. Bus Std. Bus
06:00 - 09:00
2691 2716 3 3 50 43 45 39 89% 78% 40 / 35 36 / 30 Std. Bus
2013 2014
Mon
-Fri
01:00 - 06:00
792 792 2 2 25 23 14 13 33% 31% 8 / 29 8 / 26
18:00 - 21:00
1258
15:00 - 18:00
3334 3350 3 3 57 53 47 45 94% 90% 37 / 39 35 / 38 Std. Bus Std. Bus
Std. Bus
09:00 - 15:00
3816 3816 2 2 34 32 31 27 61% 53% 22 / 25 18 / 22 Std. Bus Std. Bus
Time Annual Revenue Hours
Average Trips per Hour
Average Boardings per Hour
Average Boardings per Trip
Average Capacity Utilization
Average Peak Passenger LoadVehicle Type
(EB / WB)
21:00 - 01:00
1120 1120 1 1 31 30 19 18 37% 35% 22 / 9 20 / 10 Std. Bus Std. Bus
29 / 21 23 / 15 Std. Bus Std. Bus1246 1 1 49 41 31 25 62% 50%
Std. Bus Std. Bus
06:00 - 09:00
236 236 2 2 31 26 22 19 44% 37% 20 / 19 18 / 15 Std. Bus Std. Bus
2013 2014
2 2 41 38 30
09:00 - 15:00
729 729 2 2 37 32 28 24 55% 48% 21 / 22 17 / 21 Std. Bus Std. Bus
Std. BusStd. Bus
27 24 / 21 Std. Bus Std. Bus
21:00 - 01:00
237 237 1 1 28 23 20 16 40% 33% 20 / 13 19 / 8 Std. Bus
27 57% 54% 27 / 21 25 / 2018:00 - 21:00
247 247 1 1 41 39 29
Satu
rday
01:00 - 06:00
60 60 1 1 13 15 8 8 15% 17% 8 / 8 /
28 61% 56% 23 /15:00 - 18:00
375 375
2013 2014
Sund
ay/H
olid
ay
01:00 - 06:00
15:00 - 18:00
232 232 1
Std. Bus
TimeAnnual Revenue
HoursAverage Trips
per HourAverage Boardings
per Hour Average Boardings
per TripAverage Capacity
Utilization
Average Peak Passenger LoadVehicle Type(EB / WB)
09:00 - 15:00
438 448 1 1 43 35 33 27 66% 54% 23 / 28 21 / 21 Std. Bus Std. Bus
06:00 - 09:00
134 134 1 1 20 24 13 16 27% 33% 5 / 18 8 / 20 Std. Bus Std. Bus
24 27 / 27 Std. Bus Std. Bus
18:00 - 21:00
252 250 1 1 38 29 27 21 56% 44% 28 / 16 18 /
1 43 43 34 33 67% 66% 27 /
15 Std. Bus Std. Bus
21:00 - 01:00
231 235 1 1 25 17 14 10 31% 21% 17 / 7 10 / 7 Std. Bus Std. Bus
52
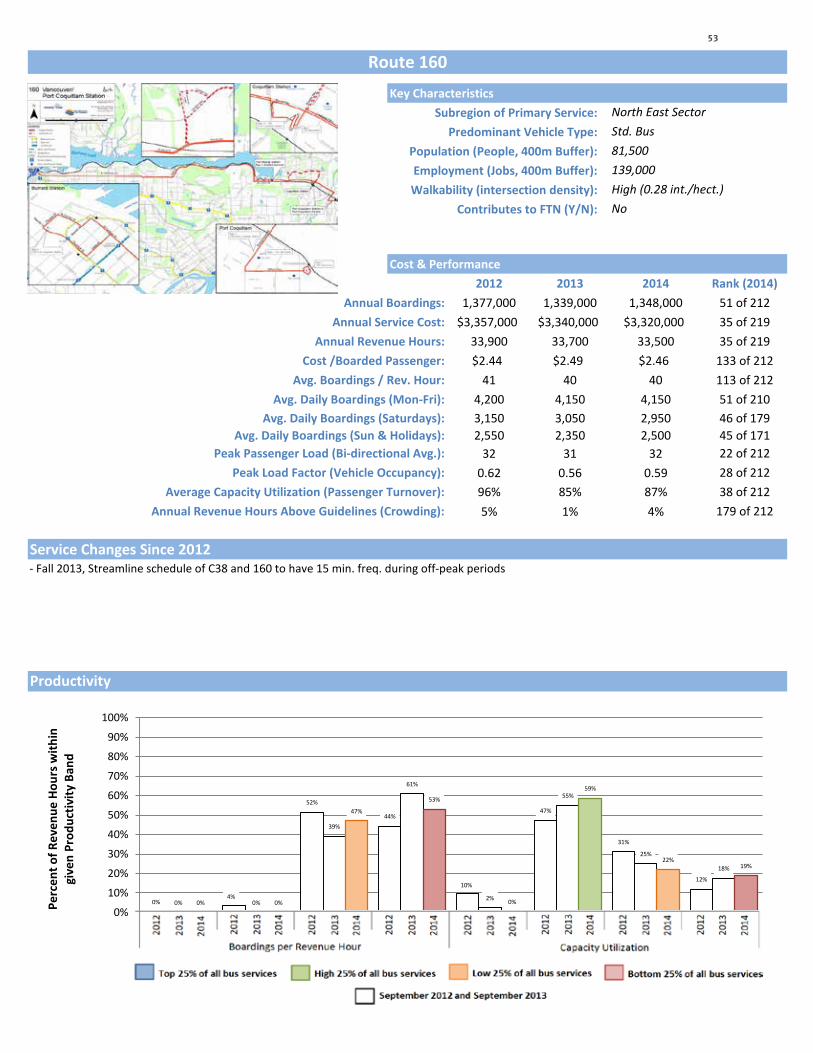
160Key Characteristics
Subregion of Primary Service: Predominant Vehicle Type:
Population (People, 400m Buffer): Employment (Jobs, 400m Buffer): Walkability (intersection density):
Contributes to FTN (Y/N):
Cost & Performance2012 2013 2014 Rank (2014)
Annual Boardings: 1,377,000 1,339,000 1,348,000 51 of 212Annual Service Cost: $3,357,000 $3,340,000 $3,320,000 35 of 219
Annual Revenue Hours: 33,900 33,700 33,500 35 of 219Cost /Boarded Passenger: $2.44 $2.49 $2.46 133 of 212
Avg. Boardings / Rev. Hour: 41 40 40 113 of 212Avg. Daily Boardings (Mon-Fri): 4,200 4,150 4,150 51 of 210
Avg. Daily Boardings (Saturdays): 3,150 3,050 2,950 46 of 179Avg. Daily Boardings (Sun & Holidays): 2,550 2,350 2,500 45 of 171
Peak Passenger Load (Bi-directional Avg.): 32 31 32 22 of 212Peak Load Factor (Vehicle Occupancy): 0.62 0.56 0.59 28 of 212
Average Capacity Utilization (Passenger Turnover): 96% 85% 87% 38 of 212Annual Revenue Hours Above Guidelines (Crowding): 5% 1% 4% 179 of 212
Service Changes Since 2012
Route 160
North East Sector
139,000High (0.28 int./hect.)
Std. Bus81,500
No
- Fall 2013, Streamline schedule of C38 and 160 to have 15 min. freq. during off-peak periods
Productivity
0% 4%
52%
44%
10%
47%
31%
12%
0% 0%
39%
61%
2%
55%
25%
18%
0% 0%
47%
53%
0%
59%
22% 19%
0%
10%
20%
30%
40%
50%
60%
70%
80%
90%
100%
Top 25% Middle High 25% Middle Low 25% Bottom 25% Top 25% Middle High 25% Middle Low 25% Bottom 25%
Boardings Per Revenue Hour Capacity Utilization
Perc
ent o
f Rev
enue
Hou
rs w
ithin
gi
ven
Prod
uctiv
ity B
and
53

Performance by Day of Week, Route 160
2013 2014 2013 2014 2013 2014 2013 2014 2013 2014 2013 2014
2013 2014 2013 2014 2013 2014 2013 2014 2013 2014 2013 2014
2013 2014 2013 2014 2013 2014 2013 2014 2013 2014 2013 2014
Data collected Sept. to mid-Dec. of the given year
Time Annual Revenue Hours
Average Trips per Hour
Average Boardings per Hour
Average Boardings per Trip
Average Capacity Utilization
Average Peak Passenger LoadVehicle Type
(EB / WB)
Std. Bus & Artic. Bus
Artic. Bus & Std. Bus
06:00 - 09:00
6179 6196 4 4 34 38 46 51 82% 90% 20 / 46 24 / 49 Std. Bus & Artic. Bus
2013 2014
Mon
-Fri
01:00 - 06:00
800 779 2 2 41 40 51 48 86% 81% / 44 / 42
18:00 - 21:00
3375
15:00 - 18:00
4684 4679 3 3 40 44 56 61 103% 111% 38 / 32 40 / 36 Std. Bus & Artic. Bus
Artic. Bus & Std. Bus
Artic. Bus & Std. Bus
09:00 - 15:00
7374 7208 2 2 35 34 53 50 96% 96% 27 / 34 26 / 33 Std. Bus & Artic. Bus
Std. Bus
Time Annual Revenue Hours
Average Trips per Hour
Average Boardings per Hour
Average Boardings per Trip
Average Capacity Utilization
Average Peak Passenger LoadVehicle Type
(EB / WB)
21:00 - 01:00
3109 3042 2 2 23 21 25 24 45% 45% 27 / 9 27 / 8 Std. Bus & Artic. Bus
Std. Bus
33 / 18 36 / 17 Std. Bus & Artic. Bus
Artic. Bus & Std. Bus3359 2 2 30 33 36 38 63% 66%
06:00 - 09:00
481 481 2 2 30 29 41 41 82% 82% 16 / 40 18 / 41 Std. Bus Std. Bus
2013 2014
2 2 38 37 54
09:00 - 15:00
1512 1517 2 2 36 34 52 50 103% 99% 33 / 32 25 / 37 Std. Bus Std. Bus
Std. BusStd. Bus
32 39 / 33 Std. Bus Std. Bus
21:00 - 01:00
600 662 2 2 21 22 24 24 48% 49% 23 / 13 25 / 10 Std. Bus
38 76% 76% 29 / 22 28 / 2918:00 - 21:00
644 600 2 2 30 31 38
Satu
rday
01:00 - 06:00
55 109% 109% 37 /15:00 - 18:00
759 759
2013 2014
Sund
ay/H
olid
ay
01:00 - 06:00
15:00 - 18:00
841 843 2
Std. Bus
TimeAnnual Revenue
HoursAverage Trips
per HourAverage Boardings
per Hour Average Boardings
per TripAverage Capacity
Utilization
Average Peak Passenger LoadVehicle Type(EB / WB)
09:00 - 15:00
1682 1682 2 2 31 30 49 45 84% 90% 22 / 33 26 / 33 Std. Bus Std. Bus
06:00 - 09:00
434 434 2 2 23 26 37 41 68% 81% / 30 / 34 Std. Bus Std. Bus
24 48 / 29 Std. Bus Std. Bus
18:00 - 21:00
734 754 2 2 20 23 26 29 46% 59% 22 / 18 36 /
2 30 36 46 53 84% 105% 36 /
17 Std. Bus & Artic. Bus
Std. Bus
21:00 - 01:00
534 544 2 2 23 24 49% 17 / 8 33 / 9 Std. Bus Std. Bus
54

169Key Characteristics
Subregion of Primary Service: Predominant Vehicle Type:
Population (People, 400m Buffer): Employment (Jobs, 400m Buffer): Walkability (intersection density):
Contributes to FTN (Y/N):
Cost & Performance2012 2013 2014 Rank (2014)
Annual Boardings: 1,268,000 1,346,000 1,348,000 50 of 212Annual Service Cost: $1,503,000 $1,510,000 $1,531,000 70 of 219
Annual Revenue Hours: 15,200 15,300 15,500 73 of 219Cost /Boarded Passenger: $1.19 $1.12 $1.14 18 of 212
Avg. Boardings / Rev. Hour: 83 88 87 17 of 212Avg. Daily Boardings (Mon-Fri): 3,650 3,900 3,900 54 of 210
Avg. Daily Boardings (Saturdays): 3,450 3,700 3,650 36 of 179Avg. Daily Boardings (Sun & Holidays): 2,650 2,900 2,900 39 of 171
Peak Passenger Load (Bi-directional Avg.): 26 28 26 57 of 212Peak Load Factor (Vehicle Occupancy): 0.52 0.56 0.53 56 of 212
Average Capacity Utilization (Passenger Turnover): 56% 61% 58% 98 of 212Annual Revenue Hours Above Guidelines (Crowding): 0% 1% 0% 1 of 212
Service Changes Since 2012
Route 169
North East Sector
14,000Medium (0.18 int./hect.)
Std. Bus12,500
New alignment includes portion of former 177 service
Yes
- Fall 2013, New route alignment to cover eastern portion of discontinued 177
Productivity
10%
32%
46%
11%
0%
9%
39%
52%
34% 32% 30%
5% 0%
13%
51%
36%
22%
28%
44%
5% 0%
5%
50% 45%
0%
10%
20%
30%
40%
50%
60%
70%
80%
90%
100%
Top 25% Middle High 25% Middle Low 25% Bottom 25% Top 25% Middle High 25% Middle Low 25% Bottom 25%
Boardings Per Revenue Hour Capacity Utilization
Perc
ent o
f Rev
enue
Hou
rs w
ithin
gi
ven
Prod
uctiv
ity B
and
55

Performance by Day of Week, Route 169
2013 2014 2013 2014 2013 2014 2013 2014 2013 2014 2013 2014
2013 2014 2013 2014 2013 2014 2013 2014 2013 2014 2013 2014
2013 2014 2013 2014 2013 2014 2013 2014 2013 2014 2013 2014
Data collected Sept. to mid-Dec. of the given year
Time Annual Revenue Hours
Average Trips per Hour
Average Boardings per Hour
Average Boardings per Trip
Average Capacity Utilization
Average Peak Passenger LoadVehicle Type
(EB / WB)
Std. Bus Std. Bus
06:00 - 09:00
2159 2313 5 5 73 61 31 28 63% 56% 19 / 40 21 / 32 Std. Bus
2013 2014
Mon
-Fri
01:00 - 06:00
400 400 2 2 27 32 10 11 20% 21% 7 / 12 7 / 13
18:00 - 21:00
1771
15:00 - 18:00
2503 2525 5 5 91 87 43 40 87% 81% 44 / 32 40 / 31 Std. Bus Std. Bus
Std. Bus
09:00 - 15:00
3841 3883 4 4 65 61 27 26 54% 53% 23 / 26 23 / 25 Std. Bus Std. Bus
Time Annual Revenue Hours
Average Trips per Hour
Average Boardings per Hour
Average Boardings per Trip
Average Capacity Utilization
Average Peak Passenger LoadVehicle Type
(EB / WB)
21:00 - 01:00
587 587 1 1 63 53 24 21 47% 42% 30 / 13 27 / 11 Std. Bus Std. Bus
34 / 18 31 / 16 Std. Bus Std. Bus1754 4 4 65 60 28 25 57% 51%
Std. Bus Std. Bus
06:00 - 09:00
269 269 3 3 49 47 20 19 41% 37% 15 / 23 15 / 20 Std. Bus Std. Bus
2013 2014
4 4 92 93 41
09:00 - 15:00
746 746 4 4 69 72 33 33 66% 67% 26 / 33 26 / 35 Std. Bus Std. Bus
Std. BusStd. Bus
33 41 / 35 Std. Bus Std. Bus
21:00 - 01:00
116 116 1 1 56 43 27 20 54% 41% 29 / 18 24 / 12 Std. Bus
28 61% 57% 31 / 23 29 / 2118:00 - 21:00
335 335 4 4 76 71 29
Satu
rday
01:00 - 06:00
38 38 2 2 16 16 5 5 11% 11% 7 / 2 9 / 1
43 82% 86% 40 /15:00 - 18:00
400 400
2013 2014
Sund
ay/H
olid
ay
01:00 - 06:00
15:00 - 18:00
457 457 4
Std. Bus
TimeAnnual Revenue
HoursAverage Trips
per HourAverage Boardings
per Hour Average Boardings
per TripAverage Capacity
Utilization
Average Peak Passenger LoadVehicle Type(EB / WB)
09:00 - 15:00
869 878 4 4 63 57 27 26 54% 52% 22 / 27 23 / 24 Std. Bus Std. Bus
06:00 - 09:00
244 244 3 3 40 42 15 15 30% 31% 12 / 16 12 / 17 Std. Bus Std. Bus
29 34 / 25 Std. Bus Std. Bus
18:00 - 21:00
402 402 4 4 61 56 24 23 48% 46% 26 / 17 24 /
4 84 72 35 34 70% 67% 33 /
18 Std. Bus Std. Bus
21:00 - 01:00
115 115 1 1 41 35 18 16 37% 33% 18 / 16 18 / 13 Std. Bus Std. Bus
56

178Key Characteristics
Subregion of Primary Service: Predominant Vehicle Type:
Population (People, 400m Buffer): Employment (Jobs, 400m Buffer): Walkability (intersection density):
Contributes to FTN (Y/N):
Cost & Performance2012 2013 2014 Rank (2014)
Annual Boardings: #VALUE! #VALUE! 45,000 189 of 212Annual Service Cost: #VALUE! #VALUE! $212,000 179 of 219
Annual Revenue Hours: #VALUE! #VALUE! 2,100 190 of 219Cost /Boarded Passenger: $4.77 194 of 212
Avg. Boardings / Rev. Hour: 21 171 of 212Avg. Daily Boardings (Mon-Fri): #VALUE! #VALUE! 200 182 of 210
Avg. Daily Boardings (Saturdays): #VALUE! #VALUE! #VALUE!Avg. Daily Boardings (Sun & Holidays): #VALUE! #VALUE! #VALUE!
Peak Passenger Load (Bi-directional Avg.): 8 155 of 212Peak Load Factor (Vehicle Occupancy): 0.17 178 of 212
Average Capacity Utilization (Passenger Turnover): 19% 176 of 212Annual Revenue Hours Above Guidelines (Crowding): 0% 1 of 212
Service Changes Since 2012
Route 178
North East SectorStd. Bus
No
- Spring 2014, Add trip leaving Coquitlam Station at 19hr to connect with West Coast Express (M-F)- Summer 2014, Re-route 178 along Panorama Drive to increase demand on 178 and alleviate crowding along C28
- Winter 2013, Service introduction, #178 will operate along busiest segments of C28 & C29 routes during AM/PM peak periods
Productivity
0% 0% 5%
95%
0% 0% 0%
100%
0%
10%
20%
30%
40%
50%
60%
70%
80%
90%
100%
Top 25% Middle High 25% Middle Low 25% Bottom 25% Top 25% Middle High 25% Middle Low 25% Bottom 25%
Boardings Per Revenue Hour Capacity Utilization
Perc
ent o
f Rev
enue
Hou
rs w
ithin
gi
ven
Prod
uctiv
ity B
and
57

Performance by Day of Week, Route 178
2013 2014 2013 2014 2013 2014 2013 2014 2013 2014 2013 2014
2013 2014 2013 2014 2013 2014 2013 2014 2013 2014 2013 2014
2013 2014 2013 2014 2013 2014 2013 2014 2013 2014 2013 2014
Data collected Sept. to mid-Dec. of the given year
Time Annual Revenue Hours
Average Trips per Hour
Average Boardings per Hour
Average Boardings per Trip
Average Capacity Utilization
Average Peak Passenger LoadVehicle Type
(EB / WB)
Std. Bus
06:00 - 09:00
796 2 19 10 19% 6 / 10
2013 2014
Mon
-Fri
01:00 - 06:00
262 2 3 1 3% 2 / 1
18:00 - 21:00
15:00 - 18:00
608 2 24 13 26% 14 / 9 Std. Bus
Std. Bus
09:00 - 15:00
Time Annual Revenue Hours
Average Trips per Hour
Average Boardings per Hour
Average Boardings per Trip
Average Capacity Utilization
Average Peak Passenger LoadVehicle Type
(EB / WB)
21:00 - 01:00
14 / 5 Std. Bus479 3 19 11 22%
06:00 - 09:00
2013 2014
09:00 - 15:00
21:00 - 01:00
18:00 - 21:00
Satu
rday
01:00 - 06:00
15:00 - 18:00
2013 2014
Sund
ay/H
olid
ay
01:00 - 06:00
15:00 - 18:00
TimeAnnual Revenue
HoursAverage Trips
per HourAverage Boardings
per Hour Average Boardings
per TripAverage Capacity
Utilization
Average Peak Passenger LoadVehicle Type(EB / WB)
09:00 - 15:00
06:00 - 09:00
18:00 - 21:00
21:00 - 01:00
58
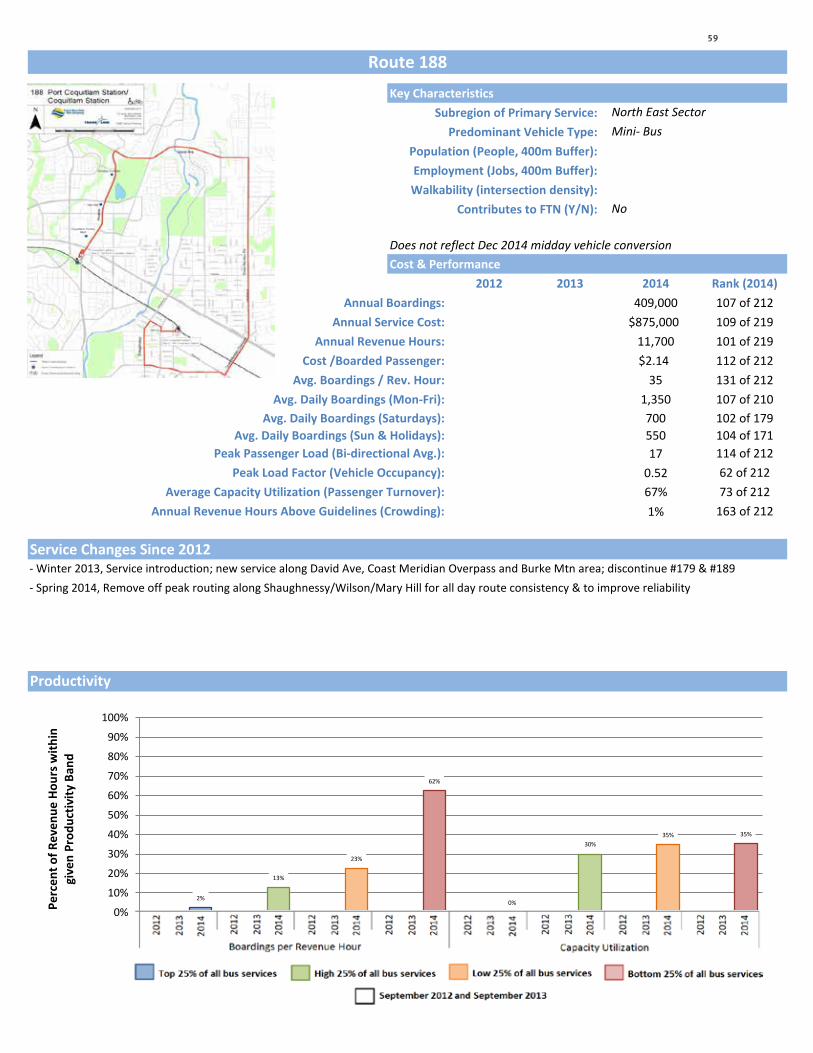
188Key Characteristics
Subregion of Primary Service: Predominant Vehicle Type:
Population (People, 400m Buffer): Employment (Jobs, 400m Buffer): Walkability (intersection density):
Contributes to FTN (Y/N):
Cost & Performance2012 2013 2014 Rank (2014)
Annual Boardings: #VALUE! #VALUE! 409,000 107 of 212Annual Service Cost: #VALUE! #VALUE! $875,000 109 of 219
Annual Revenue Hours: #VALUE! #VALUE! 11,700 101 of 219Cost /Boarded Passenger: $2.14 112 of 212
Avg. Boardings / Rev. Hour: 35 131 of 212Avg. Daily Boardings (Mon-Fri): #VALUE! #VALUE! 1,350 107 of 210
Avg. Daily Boardings (Saturdays): #VALUE! #VALUE! 700 102 of 179Avg. Daily Boardings (Sun & Holidays): #VALUE! #VALUE! 550 104 of 171
Peak Passenger Load (Bi-directional Avg.): 17 114 of 212Peak Load Factor (Vehicle Occupancy): 0.52 62 of 212
Average Capacity Utilization (Passenger Turnover): 67% 73 of 212Annual Revenue Hours Above Guidelines (Crowding): 1% 163 of 212
Service Changes Since 2012
Route 188
North East SectorMini- Bus
Does not reflect Dec 2014 midday vehicle conversion
No
- Spring 2014, Remove off peak routing along Shaughnessy/Wilson/Mary Hill for all day route consistency & to improve reliability- Winter 2013, Service introduction; new service along David Ave, Coast Meridian Overpass and Burke Mtn area; discontinue #179 & #189
Productivity
2%
13%
23%
62%
0%
30% 35% 35%
0%
10%
20%
30%
40%
50%
60%
70%
80%
90%
100%
Top 25% Middle High 25% Middle Low 25% Bottom 25% Top 25% Middle High 25% Middle Low 25% Bottom 25%
Boardings Per Revenue Hour Capacity Utilization
Perc
ent o
f Rev
enue
Hou
rs w
ithin
gi
ven
Prod
uctiv
ity B
and
59

Performance by Day of Week, Route 188
2013 2014 2013 2014 2013 2014 2013 2014 2013 2014 2013 2014
2013 2014 2013 2014 2013 2014 2013 2014 2013 2014 2013 2014
2013 2014 2013 2014 2013 2014 2013 2014 2013 2014 2013 2014
Data collected Sept. to mid-Dec. of the given year
Time Annual Revenue Hours
Average Trips per Hour
Average Boardings per Hour
Average Boardings per Trip
Average Capacity Utilization
Average Peak Passenger LoadVehicle Type
(EB / WB)
Std. Bus
06:00 - 09:00
1658 2 44 28 58% 14 / 29
2013 2014
Mon
-Fri
01:00 - 06:00
233 1 19 11 23% 4 / 16
18:00 - 21:00
15:00 - 18:00
1546 2 65 41 82% 34 / 27 Std. Bus
Std. Bus
09:00 - 15:00
3388 2 34 22 86% 14 / 19 Mini- Bus
Time Annual Revenue Hours
Average Trips per Hour
Average Boardings per Hour
Average Boardings per Trip
Average Capacity Utilization
Average Peak Passenger LoadVehicle Type
(EB / WB)
21:00 - 01:00
117 1 6 3 14% / 3 Mini- Bus
23 / 6 Mini- Bus1754 2 34 18 53%
06:00 - 09:00
159 2 15 10 42% 4 / 13 Mini- Bus
2013 2014
2 29
09:00 - 15:00
654 2 22 15 63% 8 / 17 Mini- Bus
Mini- Bus
19 / 11 Mini- Bus
21:00 - 01:00
24 1 17 8 33% / 6
11 46% 12 / 718:00 - 21:00
311 2 19
Satu
rday
01:00 - 06:00
18 77%15:00 - 18:00
302
2013 2014
Sund
ay/H
olid
ay
01:00 - 06:00
15:00 - 18:00
353
Mini- Bus
TimeAnnual Revenue
HoursAverage Trips
per HourAverage Boardings
per Hour Average Boardings
per TripAverage Capacity
Utilization
Average Peak Passenger LoadVehicle Type(EB / WB)
09:00 - 15:00
799 2 17 12 51% 6 / 13 Mini- Bus
06:00 - 09:00
52 1 12 8 35% 3 / 13 Mini- Bus
18 / 9 Mini- Bus
18:00 - 21:00
367 2 16 10 40% 11 /
2 24 16 66%
4 Mini- Bus
21:00 - 01:00
27 1 11 5 21% / 4 Mini- Bus
60

190Key Characteristics
Subregion of Primary Service: Predominant Vehicle Type:
Population (People, 400m Buffer): Employment (Jobs, 400m Buffer): Walkability (intersection density):
Contributes to FTN (Y/N):
Cost & Performance2012 2013 2014 Rank (2014)
Annual Boardings: 48,000 55,000 54,000 185 of 212Annual Service Cost: $169,000 $154,000 $155,000 192 of 219
Annual Revenue Hours: 1,700 1,600 1,600 201 of 219Cost /Boarded Passenger: $3.53 $2.81 $2.88 148 of 212
Avg. Boardings / Rev. Hour: 28 35 34 133 of 212Avg. Daily Boardings (Mon-Fri): 200 200 200 175 of 210
Avg. Daily Boardings (Saturdays): #VALUE! #VALUE! #VALUE!Avg. Daily Boardings (Sun & Holidays): #VALUE! #VALUE! #VALUE!
Peak Passenger Load (Bi-directional Avg.): 27 28 30 31 of 212Peak Load Factor (Vehicle Occupancy): 0.55 0.55 0.54 47 of 212
Average Capacity Utilization (Passenger Turnover): 60% 62% 59% 95 of 212Annual Revenue Hours Above Guidelines (Crowding): 0% 0% 0% 1 of 212
Service Changes Since 2012
Route 190
North East Sector
129,500High (0.29 int./hect.)
Std. Bus65,000
No
- No service change between 2012 and September 2014
Productivity
0% 0%
13%
87%
0%
13%
33%
54%
0% 0%
29%
71%
0%
15%
56%
28%
0% 0%
15%
85%
0%
15%
43% 42%
0%
10%
20%
30%
40%
50%
60%
70%
80%
90%
100%
Top 25% Middle High 25% Middle Low 25% Bottom 25% Top 25% Middle High 25% Middle Low 25% Bottom 25%
Boardings Per Revenue Hour Capacity Utilization
Perc
ent o
f Rev
enue
Hou
rs w
ithin
gi
ven
Prod
uctiv
ity B
and
61

Performance by Day of Week, Route 190
2013 2014 2013 2014 2013 2014 2013 2014 2013 2014 2013 2014
2013 2014 2013 2014 2013 2014 2013 2014 2013 2014 2013 2014
2013 2014 2013 2014 2013 2014 2013 2014 2013 2014 2013 2014
Data collected Sept. to mid-Dec. of the given year
Time Annual Revenue Hours
Average Trips per Hour
Average Boardings per Hour
Average Boardings per Trip
Average Capacity Utilization
Average Peak Passenger LoadVehicle Type
(EB / WB)
06:00 - 09:00
213 225 1 1 38 37 32 34 65% 67% / 31 / 33 Std. Bus
2013 2014
Mon
-Fri
01:00 - 06:00
18:00 - 21:00
213
15:00 - 18:00
1129 1129 2 2 29 32 30 33 62% 60% 27 / 29 / Std. BusArtic. Bus &
Std. Bus
Std. Bus
09:00 - 15:00
Time Annual Revenue Hours
Average Trips per Hour
Average Boardings per Hour
Average Boardings per Trip
Average Capacity Utilization
Average Peak Passenger LoadVehicle Type
(EB / WB)
21:00 - 01:00
28 / 29 / Std. Bus Artic. Bus213 1 1 35 31 31 32 61% 42%
06:00 - 09:00
2013 2014
09:00 - 15:00
21:00 - 01:00
18:00 - 21:00
Satu
rday
01:00 - 06:00
15:00 - 18:00
2013 2014
Sund
ay/H
olid
ay
01:00 - 06:00
15:00 - 18:00
TimeAnnual Revenue
HoursAverage Trips
per HourAverage Boardings
per Hour Average Boardings
per TripAverage Capacity
Utilization
Average Peak Passenger LoadVehicle Type(EB / WB)
09:00 - 15:00
06:00 - 09:00
18:00 - 21:00
21:00 - 01:00
62
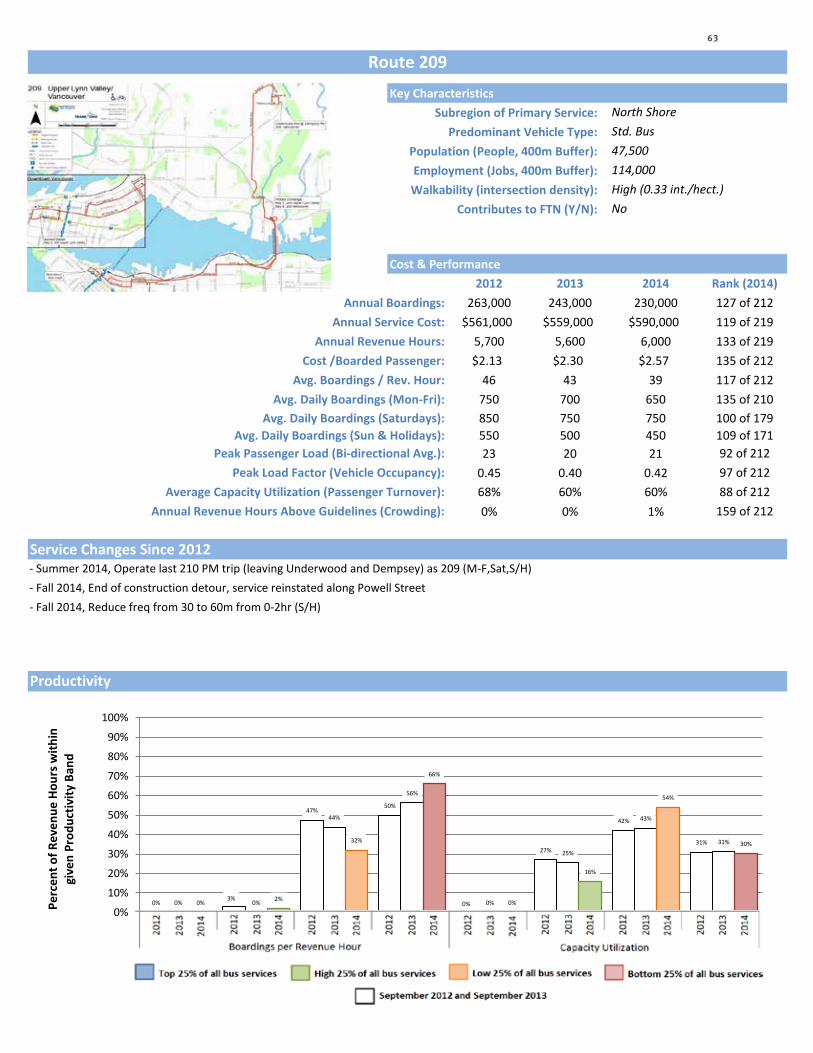
209Key Characteristics
Subregion of Primary Service: Predominant Vehicle Type:
Population (People, 400m Buffer): Employment (Jobs, 400m Buffer): Walkability (intersection density):
Contributes to FTN (Y/N):
Cost & Performance2012 2013 2014 Rank (2014)
Annual Boardings: 263,000 243,000 230,000 127 of 212Annual Service Cost: $561,000 $559,000 $590,000 119 of 219
Annual Revenue Hours: 5,700 5,600 6,000 133 of 219Cost /Boarded Passenger: $2.13 $2.30 $2.57 135 of 212
Avg. Boardings / Rev. Hour: 46 43 39 117 of 212Avg. Daily Boardings (Mon-Fri): 750 700 650 135 of 210
Avg. Daily Boardings (Saturdays): 850 750 750 100 of 179Avg. Daily Boardings (Sun & Holidays): 550 500 450 109 of 171
Peak Passenger Load (Bi-directional Avg.): 23 20 21 92 of 212Peak Load Factor (Vehicle Occupancy): 0.45 0.40 0.42 97 of 212
Average Capacity Utilization (Passenger Turnover): 68% 60% 60% 88 of 212Annual Revenue Hours Above Guidelines (Crowding): 0% 0% 1% 159 of 212
Service Changes Since 2012
Route 209
North Shore
114,000High (0.33 int./hect.)
Std. Bus47,500
No
- Fall 2014, End of construction detour, service reinstated along Powell Street- Fall 2014, Reduce freq from 30 to 60m from 0-2hr (S/H)
- Summer 2014, Operate last 210 PM trip (leaving Underwood and Dempsey) as 209 (M-F,Sat,S/H)
Productivity
0% 3%
47% 50%
0%
27%
42%
31%
0% 0%
44%
56%
0%
25%
43%
31%
0% 2%
32%
66%
0%
16%
54%
30%
0%
10%
20%
30%
40%
50%
60%
70%
80%
90%
100%
Top 25% Middle High 25% Middle Low 25% Bottom 25% Top 25% Middle High 25% Middle Low 25% Bottom 25%
Boardings Per Revenue Hour Capacity Utilization
Perc
ent o
f Rev
enue
Hou
rs w
ithin
gi
ven
Prod
uctiv
ity B
and
63

Performance by Day of Week, Route 209
2013 2014 2013 2014 2013 2014 2013 2014 2013 2014 2013 2014
2013 2014 2013 2014 2013 2014 2013 2014 2013 2014 2013 2014
2013 2014 2013 2014 2013 2014 2013 2014 2013 2014 2013 2014
Data collected Sept. to mid-Dec. of the given year
Time Annual Revenue Hours
Average Trips per Hour
Average Boardings per Hour
Average Boardings per Trip
Average Capacity Utilization
Average Peak Passenger LoadVehicle Type
(EB / WB)
Std. Bus Std. Bus
06:00 - 09:00
2013 2014
Mon
-Fri
01:00 - 06:00
154 171 2 2 9 7 5 3 9% 6% / 3 / 3
18:00 - 21:00
946
15:00 - 18:00
09:00 - 15:00
Time Annual Revenue Hours
Average Trips per Hour
Average Boardings per Hour
Average Boardings per Trip
Average Capacity Utilization
Average Peak Passenger LoadVehicle Type
(EB / WB)
21:00 - 01:00
2791 2833 2 2 30 29 28 27 56% 55% 26 / 10 26 / 10 Std. Bus Std. Bus
33 / 21 32 / 26 Std. Bus Std. Bus1146 2 2 40 42 36 37 76% 79%
Std. Bus Std. Bus
06:00 - 09:00
2013 2014
09:00 - 15:00
Std. BusStd. Bus
21:00 - 01:00
579 527 2 2 34 35 32 33 66% 67% 29 / 13 34 / 12 Std. Bus
40 81% 80% 22 / 32 25 / 2718:00 - 21:00
197 236 2 2 44 42 40
Satu
rday
01:00 - 06:00
33 35 2 2 7 9 2 4 3% 8% / 2 / 3
15:00 - 18:00
2013 2014
Sund
ay/H
olid
ay
01:00 - 06:00
38 42 2 2 10 5 4 2 9% 4% / 3 / 2
15:00 - 18:00
Std. Bus
TimeAnnual Revenue
HoursAverage Trips
per HourAverage Boardings
per Hour Average Boardings
per TripAverage Capacity
Utilization
Average Peak Passenger LoadVehicle Type(EB / WB)
09:00 - 15:00
Std. Bus Std. Bus
06:00 - 09:00
18:00 - 21:00
235 290 2 2 29 36 30 38 60% 71% 29 / 11 26 / 23 Std. Bus Std. Bus
21:00 - 01:00
677 685 2 2 20 23 19 20 39% 43% 17 / 9 19 / 8 Std. Bus Std. Bus
64
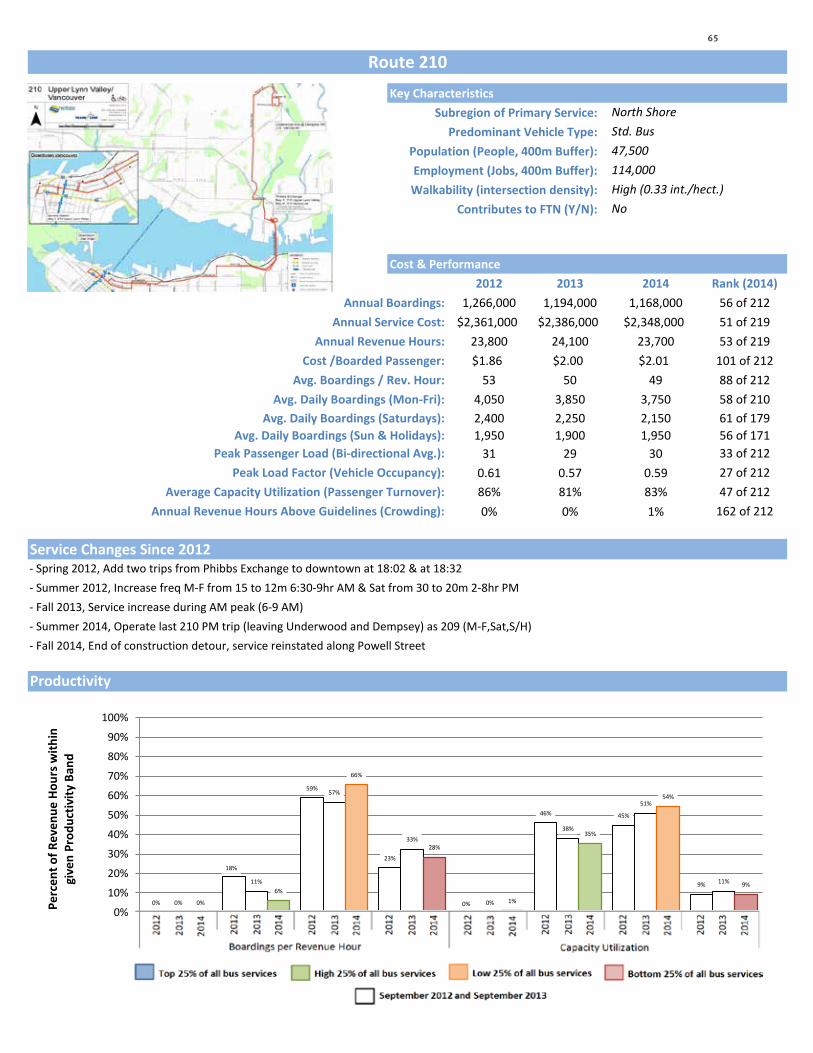
210Key Characteristics
Subregion of Primary Service: Predominant Vehicle Type:
Population (People, 400m Buffer): Employment (Jobs, 400m Buffer): Walkability (intersection density):
Contributes to FTN (Y/N):
Cost & Performance2012 2013 2014 Rank (2014)
Annual Boardings: 1,266,000 1,194,000 1,168,000 56 of 212Annual Service Cost: $2,361,000 $2,386,000 $2,348,000 51 of 219
Annual Revenue Hours: 23,800 24,100 23,700 53 of 219Cost /Boarded Passenger: $1.86 $2.00 $2.01 101 of 212
Avg. Boardings / Rev. Hour: 53 50 49 88 of 212Avg. Daily Boardings (Mon-Fri): 4,050 3,850 3,750 58 of 210
Avg. Daily Boardings (Saturdays): 2,400 2,250 2,150 61 of 179Avg. Daily Boardings (Sun & Holidays): 1,950 1,900 1,950 56 of 171
Peak Passenger Load (Bi-directional Avg.): 31 29 30 33 of 212Peak Load Factor (Vehicle Occupancy): 0.61 0.57 0.59 27 of 212
Average Capacity Utilization (Passenger Turnover): 86% 81% 83% 47 of 212Annual Revenue Hours Above Guidelines (Crowding): 0% 0% 1% 162 of 212
Service Changes Since 2012
Route 210
North Shore
114,000High (0.33 int./hect.)
Std. Bus47,500
No
- Summer 2012, Increase freq M-F from 15 to 12m 6:30-9hr AM & Sat from 30 to 20m 2-8hr PM
- Summer 2014, Operate last 210 PM trip (leaving Underwood and Dempsey) as 209 (M-F,Sat,S/H)- Fall 2014, End of construction detour, service reinstated along Powell Street
- Fall 2013, Service increase during AM peak (6-9 AM)
- Spring 2012, Add two trips from Phibbs Exchange to downtown at 18:02 & at 18:32
Productivity
0%
18%
59%
23%
0%
46% 45%
9%
0%
11%
57%
33%
0%
38%
51%
11%
0%
6%
66%
28%
1%
35%
54%
9%
0%
10%
20%
30%
40%
50%
60%
70%
80%
90%
100%
Top 25% Middle High 25% Middle Low 25% Bottom 25% Top 25% Middle High 25% Middle Low 25% Bottom 25%
Boardings Per Revenue Hour Capacity Utilization
Perc
ent o
f Rev
enue
Hou
rs w
ithin
gi
ven
Prod
uctiv
ity B
and
65

Performance by Day of Week, Route 210
2013 2014 2013 2014 2013 2014 2013 2014 2013 2014 2013 2014
2013 2014 2013 2014 2013 2014 2013 2014 2013 2014 2013 2014
2013 2014 2013 2014 2013 2014 2013 2014 2013 2014 2013 2014
Data collected Sept. to mid-Dec. of the given year
Time Annual Revenue Hours
Average Trips per Hour
Average Boardings per Hour
Average Boardings per Trip
Average Capacity Utilization
Average Peak Passenger LoadVehicle Type
(NB / SB)
Std. Bus Std. Bus
06:00 - 09:00
5842 5854 6 6 42 45 39 40 79% 81% 23 / 36 25 / 39 Std. Bus
2013 2014
Mon
-Fri
01:00 - 06:00
429 429 2 2 26 24 22 21 44% 42% 3 / 35 2 / 34
18:00 - 21:00
2246
15:00 - 18:00
5254 5271 5 5 55 53 49 49 101% 99% 34 / 35 33 / 35 Std. Bus Std. Bus
Std. Bus
09:00 - 15:00
5066 5066 2 2 42 42 42 42 83% 84% 23 / 30 23 / 30 Std. Bus Std. Bus
Time Annual Revenue Hours
Average Trips per Hour
Average Boardings per Hour
Average Boardings per Trip
Average Capacity Utilization
Average Peak Passenger LoadVehicle Type
(NB / SB)
21:00 - 01:00
28 / 22 26 / 20 Std. Bus Std. Bus2116 4 4 41 39 33 33 66% 65%
Std. Bus Std. Bus
06:00 - 09:00
479 476 2 2 26 25 25 24 52% 51% 12 / 26 15 / 21 Std. Bus Std. Bus
2013 2014
3 3 33 44 33
09:00 - 15:00
1067 1067 2 2 35 33 35 33 70% 65% 20 / 27 19 / 26 Std. Bus Std. Bus
Std. BusStd. Bus
25 21 / 42 Std. Bus Std. Bus
21:00 - 01:00
48 71% 100% 20 / 33 26 / 5618:00 - 21:00
520 275 2 3 37 49 34
Satu
rday
01:00 - 06:00
16 16 1 1 2 2 1 1 2% 2% 1 / 1 /
43 66% 86% 20 /15:00 - 18:00
741 741
2013 2014
Sund
ay/H
olid
ay
01:00 - 06:00
15:00 - 18:00
551 554 2
TimeAnnual Revenue
HoursAverage Trips
per HourAverage Boardings
per Hour Average Boardings
per TripAverage Capacity
Utilization
Average Peak Passenger LoadVehicle Type(NB / SB)
09:00 - 15:00
1118 1118 2 2 32 38 32 38 64% 76% 16 / 28 23 / 27 Std. Bus Std. Bus
06:00 - 09:00
454 453 2 2 21 24 19 22 41% 48% 12 / 17 16 / 19 Std. Bus Std. Bus
29 27 / 37 Std. Bus Std. Bus
18:00 - 21:00
321 275 2 2 42 43 41 44 83% 89% 30 / 32 33 /
2 41 47 41 46 82% 93% 25 /
28 Std. Bus Std. Bus
21:00 - 01:00
66
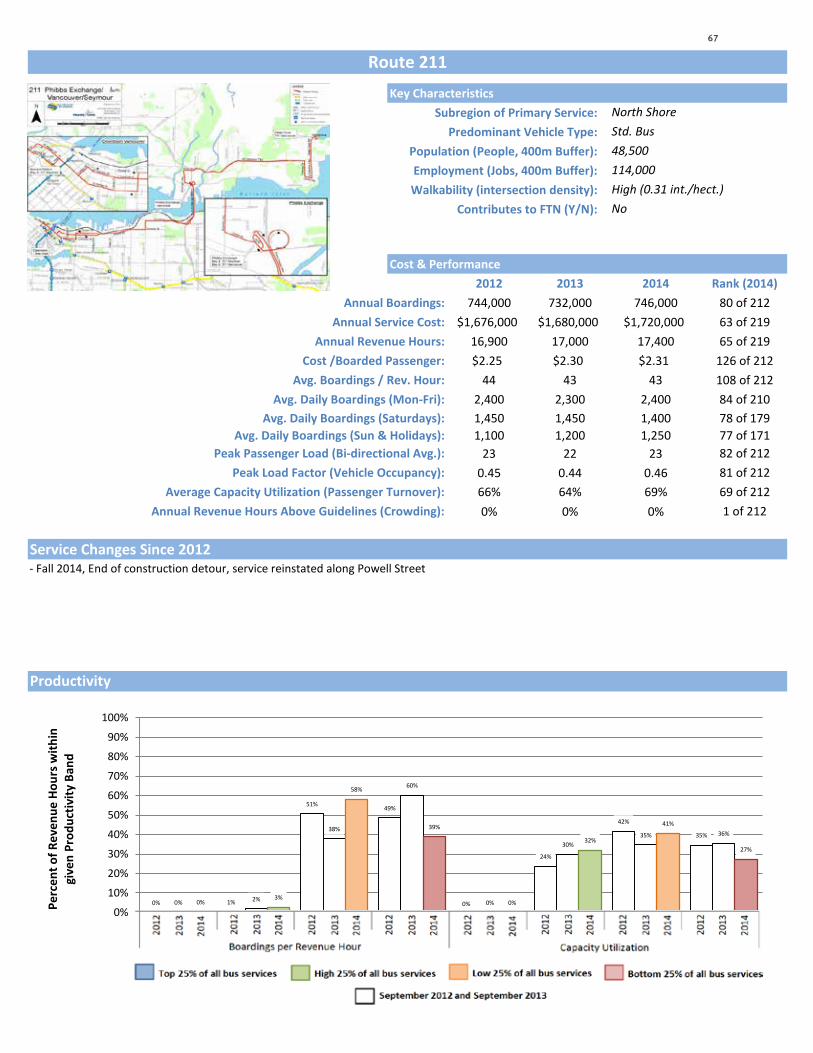
211Key Characteristics
Subregion of Primary Service: Predominant Vehicle Type:
Population (People, 400m Buffer): Employment (Jobs, 400m Buffer): Walkability (intersection density):
Contributes to FTN (Y/N):
Cost & Performance2012 2013 2014 Rank (2014)
Annual Boardings: 744,000 732,000 746,000 80 of 212Annual Service Cost: $1,676,000 $1,680,000 $1,720,000 63 of 219
Annual Revenue Hours: 16,900 17,000 17,400 65 of 219Cost /Boarded Passenger: $2.25 $2.30 $2.31 126 of 212
Avg. Boardings / Rev. Hour: 44 43 43 108 of 212Avg. Daily Boardings (Mon-Fri): 2,400 2,300 2,400 84 of 210
Avg. Daily Boardings (Saturdays): 1,450 1,450 1,400 78 of 179Avg. Daily Boardings (Sun & Holidays): 1,100 1,200 1,250 77 of 171
Peak Passenger Load (Bi-directional Avg.): 23 22 23 82 of 212Peak Load Factor (Vehicle Occupancy): 0.45 0.44 0.46 81 of 212
Average Capacity Utilization (Passenger Turnover): 66% 64% 69% 69 of 212Annual Revenue Hours Above Guidelines (Crowding): 0% 0% 0% 1 of 212
Service Changes Since 2012
Route 211
North Shore
114,000High (0.31 int./hect.)
Std. Bus48,500
No
- Fall 2014, End of construction detour, service reinstated along Powell Street
Productivity
0% 1%
51% 49%
0%
24%
42%
35%
0% 2%
38%
60%
0%
30% 35% 36%
0% 3%
58%
39%
0%
32%
41%
27%
0%
10%
20%
30%
40%
50%
60%
70%
80%
90%
100%
Top 25% Middle High 25% Middle Low 25% Bottom 25% Top 25% Middle High 25% Middle Low 25% Bottom 25%
Boardings Per Revenue Hour Capacity Utilization
Perc
ent o
f Rev
enue
Hou
rs w
ithin
gi
ven
Prod
uctiv
ity B
and
67
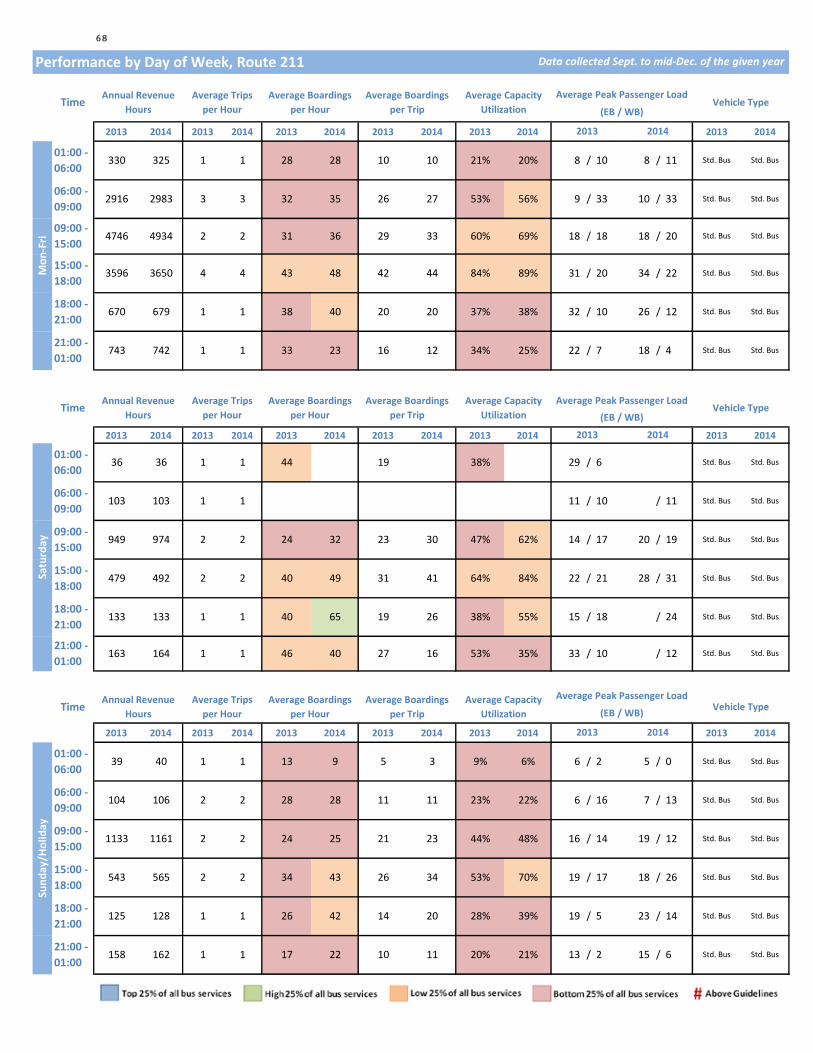
Performance by Day of Week, Route 211
2013 2014 2013 2014 2013 2014 2013 2014 2013 2014 2013 2014
2013 2014 2013 2014 2013 2014 2013 2014 2013 2014 2013 2014
2013 2014 2013 2014 2013 2014 2013 2014 2013 2014 2013 2014
Data collected Sept. to mid-Dec. of the given year
Time Annual Revenue Hours
Average Trips per Hour
Average Boardings per Hour
Average Boardings per Trip
Average Capacity Utilization
Average Peak Passenger LoadVehicle Type
(EB / WB)
Std. Bus Std. Bus
06:00 - 09:00
2916 2983 3 3 32 35 26 27 53% 56% 9 / 33 10 / 33 Std. Bus
2013 2014
Mon
-Fri
01:00 - 06:00
330 325 1 1 28 28 10 10 21% 20% 8 / 10 8 / 11
18:00 - 21:00
670
15:00 - 18:00
3596 3650 4 4 43 48 42 44 84% 89% 31 / 20 34 / 22 Std. Bus Std. Bus
Std. Bus
09:00 - 15:00
4746 4934 2 2 31 36 29 33 60% 69% 18 / 18 18 / 20 Std. Bus Std. Bus
Time Annual Revenue Hours
Average Trips per Hour
Average Boardings per Hour
Average Boardings per Trip
Average Capacity Utilization
Average Peak Passenger LoadVehicle Type
(EB / WB)
21:00 - 01:00
743 742 1 1 33 23 16 12 34% 25% 22 / 7 18 / 4 Std. Bus Std. Bus
32 / 10 26 / 12 Std. Bus Std. Bus679 1 1 38 40 20 20 37% 38%
Std. Bus Std. Bus
06:00 - 09:00
103 103 1 1 11 / 10 / 11 Std. Bus Std. Bus
2013 2014
2 2 40 49 31
09:00 - 15:00
949 974 2 2 24 32 23 30 47% 62% 14 / 17 20 / 19 Std. Bus Std. Bus
Std. BusStd. Bus
21 28 / 31 Std. Bus Std. Bus
21:00 - 01:00
163 164 1 1 46 40 27 16 53% 35% 33 / 10 / 12 Std. Bus
26 38% 55% 15 / 18 / 2418:00 - 21:00
133 133 1 1 40 65 19
Satu
rday
01:00 - 06:00
36 36 1 1 44 19 38% 29 / 6
41 64% 84% 22 /15:00 - 18:00
479 492
2013 2014
Sund
ay/H
olid
ay
01:00 - 06:00
39 40 1 1 13 9 5 3 9% 6% 6 / 2 5 / 0
15:00 - 18:00
543 565 2
Std. Bus
TimeAnnual Revenue
HoursAverage Trips
per HourAverage Boardings
per Hour Average Boardings
per TripAverage Capacity
Utilization
Average Peak Passenger LoadVehicle Type(EB / WB)
09:00 - 15:00
1133 1161 2 2 24 25 21 23 44% 48% 16 / 14 19 / 12 Std. Bus Std. Bus
Std. Bus Std. Bus
06:00 - 09:00
104 106 2 2 28 28 11 11 23% 22% 6 / 16 7 / 13 Std. Bus Std. Bus
17 18 / 26 Std. Bus Std. Bus
18:00 - 21:00
125 128 1 1 26 42 14 20 28% 39% 19 / 5 23 /
2 34 43 26 34 53% 70% 19 /
14 Std. Bus Std. Bus
21:00 - 01:00
158 162 1 1 17 22 10 11 20% 21% 13 / 2 15 / 6 Std. Bus Std. Bus
68

212Key Characteristics
Subregion of Primary Service: Predominant Vehicle Type:
Population (People, 400m Buffer): Employment (Jobs, 400m Buffer): Walkability (intersection density):
Contributes to FTN (Y/N):
Cost & Performance2012 2013 2014 Rank (2014)
Annual Boardings: 319,000 288,000 274,000 120 of 212Annual Service Cost: $569,000 $586,000 $586,000 120 of 219
Annual Revenue Hours: 5,700 5,900 5,900 134 of 219Cost /Boarded Passenger: $1.79 $2.03 $2.14 110 of 212
Avg. Boardings / Rev. Hour: 55 49 46 97 of 212Avg. Daily Boardings (Mon-Fri): 950 850 800 124 of 210
Avg. Daily Boardings (Saturdays): 700 700 600 109 of 179Avg. Daily Boardings (Sun & Holidays): 600 550 700 93 of 171
Peak Passenger Load (Bi-directional Avg.): 13 12 12 140 of 212Peak Load Factor (Vehicle Occupancy): 0.26 0.24 0.23 161 of 212
Average Capacity Utilization (Passenger Turnover): 28% 26% 25% 172 of 212Annual Revenue Hours Above Guidelines (Crowding): 0% 0% 0% 1 of 212
Service Changes Since 2012
Route 212
North Shore
5,000Low (0.15 int./hect.)
Std. Bus8,000
No
- No service change between 2012 and September 2014
Productivity
0% 5%
28%
68%
0% 0% 0%
100%
0%
6%
14%
80%
0% 0% 0%
100%
0% 0%
26%
74%
0% 0% 0%
100%
0%
10%
20%
30%
40%
50%
60%
70%
80%
90%
100%
Top 25% Middle High 25% Middle Low 25% Bottom 25% Top 25% Middle High 25% Middle Low 25% Bottom 25%
Boardings Per Revenue Hour Capacity Utilization
Perc
ent o
f Rev
enue
Hou
rs w
ithin
gi
ven
Prod
uctiv
ity B
and
69

Performance by Day of Week, Route 212
2013 2014 2013 2014 2013 2014 2013 2014 2013 2014 2013 2014
2013 2014 2013 2014 2013 2014 2013 2014 2013 2014 2013 2014
2013 2014 2013 2014 2013 2014 2013 2014 2013 2014 2013 2014
Data collected Sept. to mid-Dec. of the given year
Time Annual Revenue Hours
Average Trips per Hour
Average Boardings per Hour
Average Boardings per Trip
Average Capacity Utilization
Average Peak Passenger LoadVehicle Type
(EB / WB)
06:00 - 09:00
851 851 2 2 40 39 16 14 31% 28% 15 / 15 13 / 13 Std. Bus
2013 2014
Mon
-Fri
01:00 - 06:00
18:00 - 21:00
541
15:00 - 18:00
875 875 2 2 43 38 17 15 33% 31% 15 / 16 13 / 16 Std. Bus Std. Bus
Std. Bus
09:00 - 15:00
1675 1675 2 2 25 29 12 13 24% 26% 10 / 11 11 / 13 Std. Bus Std. Bus
Time Annual Revenue Hours
Average Trips per Hour
Average Boardings per Hour
Average Boardings per Trip
Average Capacity Utilization
Average Peak Passenger LoadVehicle Type
(EB / WB)
21:00 - 01:00
383 383 1 1 24 15 11 7 23% 14% 15 / 7 9 / 4 Std. Bus Std. Bus
12 / 9 14 / 7 Std. Bus Std. Bus541 1 1 26 26 12 11 23% 22%
06:00 - 09:00
79 79 1 1 9 11 6 4 12% 8% 6 / 1 / 16 Std. Bus Std. Bus
2013 2014
2 2 33 34 14
09:00 - 15:00
320 320 2 2 26 32 12 13 23% 26% 11 / 10 15 / 9 Std. Bus Std. Bus
Std. BusStd. Bus
14 11 / 13 Std. Bus Std. Bus
21:00 - 01:00
81 81 1 1 25 19 12 11 23% 21% 17 / 5 10 / Std. Bus
15 25% 30% 13 / 10 13 / 1118:00 - 21:00
108 108 1 1 30 34 13
Satu
rday
01:00 - 06:00
13 28% 27% 12 /15:00 - 18:00
169 169
2013 2014
Sund
ay/H
olid
ay
01:00 - 06:00
15:00 - 18:00
195 195 2
Std. Bus
TimeAnnual Revenue
HoursAverage Trips
per HourAverage Boardings
per Hour Average Boardings
per TripAverage Capacity
Utilization
Average Peak Passenger LoadVehicle Type(EB / WB)
09:00 - 15:00
394 394 2 2 27 29 12 13 23% 25% 12 / 9 14 / 10 Std. Bus Std. Bus
06:00 - 09:00
47 47 2 2 8 22 5 8 10% 17% 5 / 8 / 9 Std. Bus Std. Bus
13 14 / 14 Std. Bus Std. Bus
18:00 - 21:00
121 121 1 1 19 37 9 17 17% 34% 11 / 6 17 /
2 36 31 15 14 30% 28% 15 /
17 Std. Bus Std. Bus
21:00 - 01:00
75 75 1 1 24 13 6 6 13% 11% 9 / 2 7 / 5 Std. Bus Std. Bus
70

214Key Characteristics
Subregion of Primary Service: Predominant Vehicle Type:
Population (People, 400m Buffer): Employment (Jobs, 400m Buffer): Walkability (intersection density):
Contributes to FTN (Y/N):
Cost & Performance2012 2013 2014 Rank (2014)
Annual Boardings: 291,000 250,000 238,000 125 of 212Annual Service Cost: $608,000 $607,000 $543,000 122 of 219
Annual Revenue Hours: 7,600 7,600 6,900 124 of 219Cost /Boarded Passenger: $2.09 $2.42 $2.28 124 of 212
Avg. Boardings / Rev. Hour: 38 33 34 132 of 212Avg. Daily Boardings (Mon-Fri): 950 850 800 126 of 210
Avg. Daily Boardings (Saturdays): 550 400 400 121 of 179Avg. Daily Boardings (Sun & Holidays): 400 350 350 121 of 171
Peak Passenger Load (Bi-directional Avg.): 12 10 11 142 of 212Peak Load Factor (Vehicle Occupancy): 0.31 0.27 0.31 135 of 212
Average Capacity Utilization (Passenger Turnover): 36% 31% 35% 150 of 212Annual Revenue Hours Above Guidelines (Crowding): 0% 0% 0% 1 of 212
Service Changes Since 2012
Route 214
North Shore
113,000High (0.32 int./hect.)
Mini- Bus42,000
No
- Fall 2014, End of construction detour, service reinstated along Powell Street- Fall 2014, Reduce freq from 20 to 30m from 6-7hr & 15-19hr (M-F)
- Summer 2012, Discontinue the #214 Vancouver trip leaving Sechelt/Hyannis at 7:59 AM M-F
Productivity
0%
16%
33%
51%
0%
10%
4%
86%
0%
6%
35%
58%
0% 0%
13%
87%
2% 6%
21%
71%
0% 0%
20%
80%
0%
10%
20%
30%
40%
50%
60%
70%
80%
90%
100%
Top 25% Middle High 25% Middle Low 25% Bottom 25% Top 25% Middle High 25% Middle Low 25% Bottom 25%
Boardings Per Revenue Hour Capacity Utilization
Perc
ent o
f Rev
enue
Hou
rs w
ithin
gi
ven
Prod
uctiv
ity B
and
71
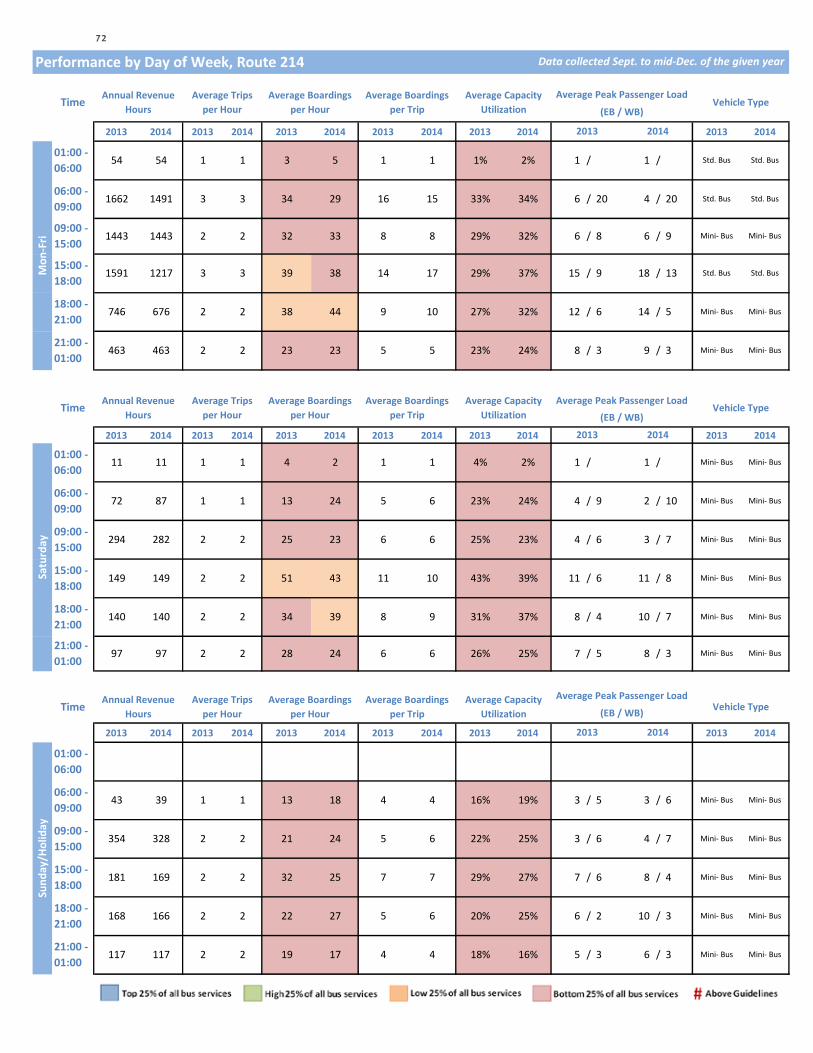
Performance by Day of Week, Route 214
2013 2014 2013 2014 2013 2014 2013 2014 2013 2014 2013 2014
2013 2014 2013 2014 2013 2014 2013 2014 2013 2014 2013 2014
2013 2014 2013 2014 2013 2014 2013 2014 2013 2014 2013 2014
Data collected Sept. to mid-Dec. of the given year
Time Annual Revenue Hours
Average Trips per Hour
Average Boardings per Hour
Average Boardings per Trip
Average Capacity Utilization
Average Peak Passenger LoadVehicle Type
(EB / WB)
Std. Bus Std. Bus
06:00 - 09:00
1662 1491 3 3 34 29 16 15 33% 34% 6 / 20 4 / 20 Std. Bus
2013 2014
Mon
-Fri
01:00 - 06:00
54 54 1 1 3 5 1 1 1% 2% 1 / 1 /
18:00 - 21:00
746
15:00 - 18:00
1591 1217 3 3 39 38 14 17 29% 37% 15 / 9 18 / 13 Std. Bus Std. Bus
Std. Bus
09:00 - 15:00
1443 1443 2 2 32 33 8 8 29% 32% 6 / 8 6 / 9 Mini- Bus Mini- Bus
Time Annual Revenue Hours
Average Trips per Hour
Average Boardings per Hour
Average Boardings per Trip
Average Capacity Utilization
Average Peak Passenger LoadVehicle Type
(EB / WB)
21:00 - 01:00
463 463 2 2 23 23 5 5 23% 24% 8 / 3 9 / 3 Mini- Bus Mini- Bus
12 / 6 14 / 5 Mini- Bus Mini- Bus676 2 2 38 44 9 10 27% 32%
Mini- Bus Mini- Bus
06:00 - 09:00
72 87 1 1 13 24 5 6 23% 24% 4 / 9 2 / 10 Mini- Bus Mini- Bus
2013 2014
2 2 51 43 11
09:00 - 15:00
294 282 2 2 25 23 6 6 25% 23% 4 / 6 3 / 7 Mini- Bus Mini- Bus
Mini- BusMini- Bus
6 11 / 8 Mini- Bus Mini- Bus
21:00 - 01:00
97 97 2 2 28 24 6 6 26% 25% 7 / 5 8 / 3 Mini- Bus
9 31% 37% 8 / 4 10 / 718:00 - 21:00
140 140 2 2 34 39 8
Satu
rday
01:00 - 06:00
11 11 1 1 4 2 1 1 4% 2% 1 / 1 /
10 43% 39% 11 /15:00 - 18:00
149 149
2013 2014
Sund
ay/H
olid
ay
01:00 - 06:00
15:00 - 18:00
181 169 2
Mini- Bus
TimeAnnual Revenue
HoursAverage Trips
per HourAverage Boardings
per Hour Average Boardings
per TripAverage Capacity
Utilization
Average Peak Passenger LoadVehicle Type(EB / WB)
09:00 - 15:00
354 328 2 2 21 24 5 6 22% 25% 3 / 6 4 / 7 Mini- Bus Mini- Bus
06:00 - 09:00
43 39 1 1 13 18 4 4 16% 19% 3 / 5 3 / 6 Mini- Bus Mini- Bus
6 8 / 4 Mini- Bus Mini- Bus
18:00 - 21:00
168 166 2 2 22 27 5 6 20% 25% 6 / 2 10 /
2 32 25 7 7 29% 27% 7 /
3 Mini- Bus Mini- Bus
21:00 - 01:00
117 117 2 2 19 17 4 4 18% 16% 5 / 3 6 / 3 Mini- Bus Mini- Bus
72

227Key Characteristics
Subregion of Primary Service: Predominant Vehicle Type:
Population (People, 400m Buffer): Employment (Jobs, 400m Buffer): Walkability (intersection density):
Contributes to FTN (Y/N):
Cost & Performance2012 2013 2014 Rank (2014)
Annual Boardings: #VALUE! #VALUE! 138,000 145 of 212Annual Service Cost: #VALUE! #VALUE! $317,000 152 of 219
Annual Revenue Hours: #VALUE! #VALUE! 5,200 143 of 219Cost /Boarded Passenger: $2.29 125 of 212
Avg. Boardings / Rev. Hour: 27 156 of 212Avg. Daily Boardings (Mon-Fri): #VALUE! #VALUE! 350 153 of 210
Avg. Daily Boardings (Saturdays): #VALUE! #VALUE! 400 123 of 179Avg. Daily Boardings (Sun & Holidays): #VALUE! #VALUE! 400 113 of 171
Peak Passenger Load (Bi-directional Avg.): 5 173 of 212Peak Load Factor (Vehicle Occupancy): 0.22 168 of 212
Average Capacity Utilization (Passenger Turnover): 28% 167 of 212Annual Revenue Hours Above Guidelines (Crowding): 0% 1 of 212
Service Changes Since 2012
Route 227
North ShoreMini- Bus
Ridership may be impacted by truncation of 229 and opening of 227
No
- Winter 2013, Add year-round 30m service (S/H) to serve Lynn Canyon Park- Winter 2013, Service introduction, operate former eastern end of #229 as new #227 from Lynn Valley Centre to Phibbs Exchange
Productivity
0% 1% 4%
96%
0% 1%
6%
93%
0%
10%
20%
30%
40%
50%
60%
70%
80%
90%
100%
Top 25% Middle High 25% Middle Low 25% Bottom 25% Top 25% Middle High 25% Middle Low 25% Bottom 25%
Boardings Per Revenue Hour Capacity Utilization
Perc
ent o
f Rev
enue
Hou
rs w
ithin
gi
ven
Prod
uctiv
ity B
and
73
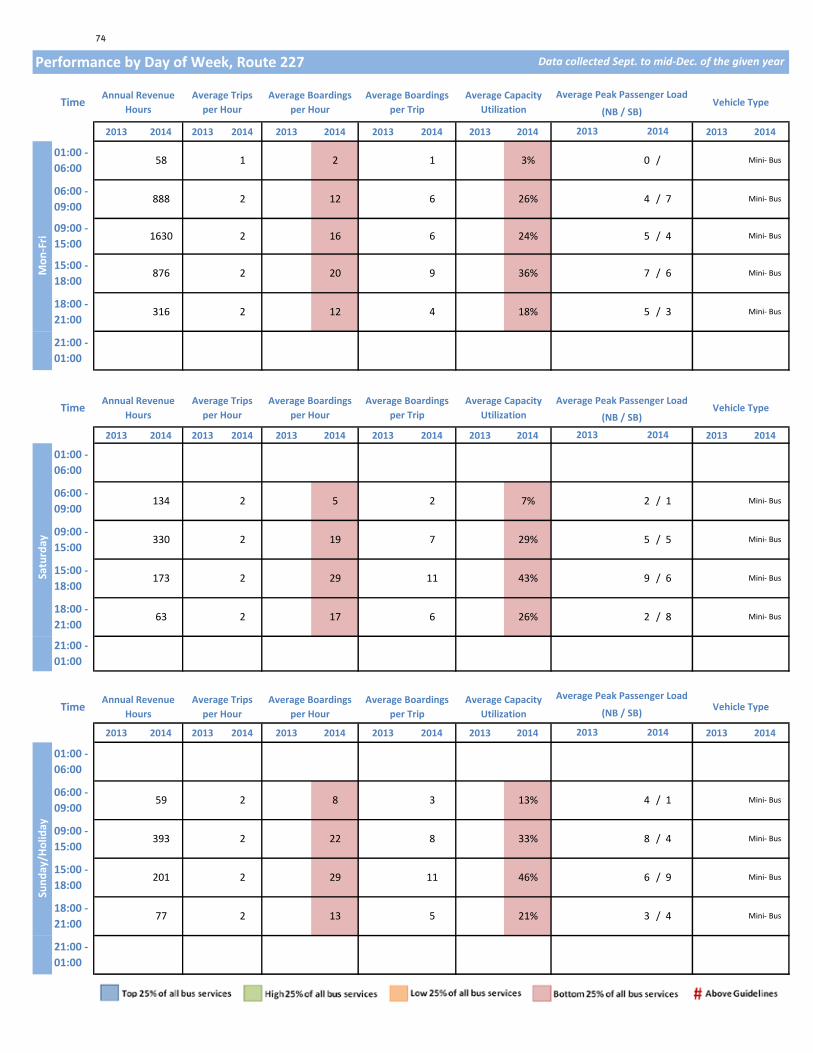
Performance by Day of Week, Route 227
2013 2014 2013 2014 2013 2014 2013 2014 2013 2014 2013 2014
2013 2014 2013 2014 2013 2014 2013 2014 2013 2014 2013 2014
2013 2014 2013 2014 2013 2014 2013 2014 2013 2014 2013 2014
Data collected Sept. to mid-Dec. of the given year
Time Annual Revenue Hours
Average Trips per Hour
Average Boardings per Hour
Average Boardings per Trip
Average Capacity Utilization
Average Peak Passenger LoadVehicle Type
(NB / SB)
Mini- Bus
06:00 - 09:00
888 2 12 6 26% 4 / 7
2013 2014
Mon
-Fri
01:00 - 06:00
58 1 2 1 3% 0 /
18:00 - 21:00
15:00 - 18:00
876 2 20 9 36% 7 / 6 Mini- Bus
Mini- Bus
09:00 - 15:00
1630 2 16 6 24% 5 / 4 Mini- Bus
Time Annual Revenue Hours
Average Trips per Hour
Average Boardings per Hour
Average Boardings per Trip
Average Capacity Utilization
Average Peak Passenger LoadVehicle Type
(NB / SB)
21:00 - 01:00
5 / 3 Mini- Bus316 2 12 4 18%
06:00 - 09:00
134 2 5 2 7% 2 / 1 Mini- Bus
2013 2014
2 29
09:00 - 15:00
330 2 19 7 29% 5 / 5 Mini- Bus
Mini- Bus
9 / 6 Mini- Bus
21:00 - 01:00
6 26% 2 / 818:00 - 21:00
63 2 17
Satu
rday
01:00 - 06:00
11 43%15:00 - 18:00
173
2013 2014
Sund
ay/H
olid
ay
01:00 - 06:00
15:00 - 18:00
201
TimeAnnual Revenue
HoursAverage Trips
per HourAverage Boardings
per Hour Average Boardings
per TripAverage Capacity
Utilization
Average Peak Passenger LoadVehicle Type(NB / SB)
09:00 - 15:00
393 2 22 8 33% 8 / 4 Mini- Bus
06:00 - 09:00
59 2 8 3 13% 4 / 1 Mini- Bus
6 / 9 Mini- Bus
18:00 - 21:00
77 2 13 5 21% 3 /
2 29 11 46%
4 Mini- Bus
21:00 - 01:00
74
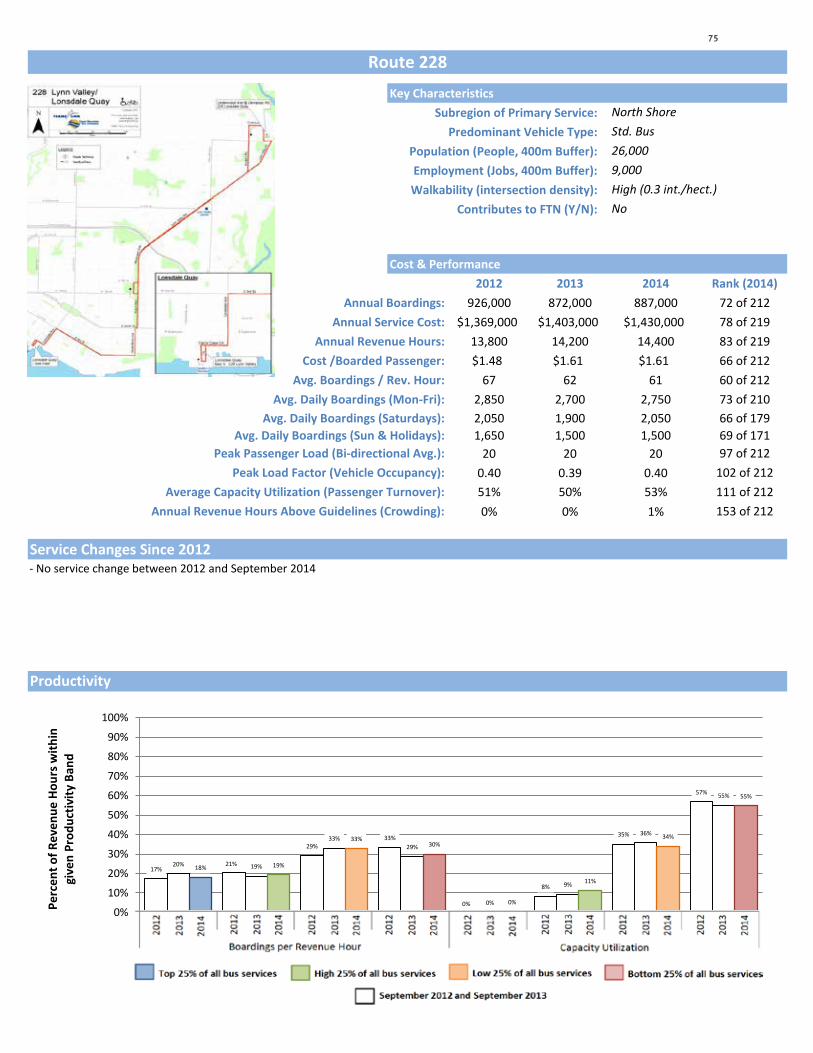
228Key Characteristics
Subregion of Primary Service: Predominant Vehicle Type:
Population (People, 400m Buffer): Employment (Jobs, 400m Buffer): Walkability (intersection density):
Contributes to FTN (Y/N):
Cost & Performance2012 2013 2014 Rank (2014)
Annual Boardings: 926,000 872,000 887,000 72 of 212Annual Service Cost: $1,369,000 $1,403,000 $1,430,000 78 of 219
Annual Revenue Hours: 13,800 14,200 14,400 83 of 219Cost /Boarded Passenger: $1.48 $1.61 $1.61 66 of 212
Avg. Boardings / Rev. Hour: 67 62 61 60 of 212Avg. Daily Boardings (Mon-Fri): 2,850 2,700 2,750 73 of 210
Avg. Daily Boardings (Saturdays): 2,050 1,900 2,050 66 of 179Avg. Daily Boardings (Sun & Holidays): 1,650 1,500 1,500 69 of 171
Peak Passenger Load (Bi-directional Avg.): 20 20 20 97 of 212Peak Load Factor (Vehicle Occupancy): 0.40 0.39 0.40 102 of 212
Average Capacity Utilization (Passenger Turnover): 51% 50% 53% 111 of 212Annual Revenue Hours Above Guidelines (Crowding): 0% 0% 1% 153 of 212
Service Changes Since 2012
Route 228
North Shore
9,000High (0.3 int./hect.)
Std. Bus26,000
No
- No service change between 2012 and September 2014
Productivity
17% 21%
29% 33%
0%
8%
35%
57%
20% 19%
33% 29%
0%
9%
36%
55%
18% 19%
33% 30%
0%
11%
34%
55%
0%
10%
20%
30%
40%
50%
60%
70%
80%
90%
100%
Top 25% Middle High 25% Middle Low 25% Bottom 25% Top 25% Middle High 25% Middle Low 25% Bottom 25%
Boardings Per Revenue Hour Capacity Utilization
Perc
ent o
f Rev
enue
Hou
rs w
ithin
gi
ven
Prod
uctiv
ity B
and
75

Performance by Day of Week, Route 228
2013 2014 2013 2014 2013 2014 2013 2014 2013 2014 2013 2014
2013 2014 2013 2014 2013 2014 2013 2014 2013 2014 2013 2014
2013 2014 2013 2014 2013 2014 2013 2014 2013 2014 2013 2014
Data collected Sept. to mid-Dec. of the given year
Time Annual Revenue Hours
Average Trips per Hour
Average Boardings per Hour
Average Boardings per Trip
Average Capacity Utilization
Average Peak Passenger LoadVehicle Type
(NB / SB)
Std. Bus Std. Bus
06:00 - 09:00
2276 2222 4 4 55 57 27 27 55% 56% 14 / 28 13 / 31 Std. Bus
2013 2014
Mon
-Fri
01:00 - 06:00
846 845 2 2 18 14 6 5 13% 13% 8 / 4 4 / 5
18:00 - 21:00
1625
15:00 - 18:00
2337 2396 4 4 75 75 36 38 72% 76% 35 / 20 37 / 21 Std. Bus Std. Bus
Std. Bus
09:00 - 15:00
2465 2551 2 2 53 51 25 27 50% 55% 19 / 17 19 / 19 Std. Bus Std. Bus
Time Annual Revenue Hours
Average Trips per Hour
Average Boardings per Hour
Average Boardings per Trip
Average Capacity Utilization
Average Peak Passenger LoadVehicle Type
(NB / SB)
21:00 - 01:00
1525 1558 2 2 37 33 17 16 36% 34% 24 / 5 20 / 5 Std. Bus Std. Bus
31 / 8 30 / 8 Std. Bus Std. Bus1701 3 3 54 53 25 24 50% 49%
Std. Bus Std. Bus
06:00 - 09:00
240 242 2 2 23 26 11 13 22% 25% 7 / 11 7 / 13 Std. Bus Std. Bus
2013 2014
2 2 67 81 33
09:00 - 15:00
481 521 2 2 56 62 27 33 54% 65% 19 / 21 24 / 23 Std. Bus Std. Bus
Std. BusStd. Bus
22 27 / 41 Std. Bus Std. Bus
21:00 - 01:00
319 328 2 2 43 48 20 23 42% 47% 28 / 7 29 / 9 Std. Bus
27 51% 55% 27 / 14 25 / 1618:00 - 21:00
234 245 2 2 58 58 25
Satu
rday
01:00 - 06:00
123 122 2 2 22 14 9 7 21% 15% 14 / 4 10 / 4
42 67% 84% 28 /15:00 - 18:00
243 264
2013 2014
Sund
ay/H
olid
ay
01:00 - 06:00
15:00 - 18:00
304 304 2
Std. Bus
TimeAnnual Revenue
HoursAverage Trips
per HourAverage Boardings
per Hour Average Boardings
per TripAverage Capacity
Utilization
Average Peak Passenger LoadVehicle Type(NB / SB)
09:00 - 15:00
493 493 2 2 56 58 26 28 53% 57% 21 / 18 21 / 21 Std. Bus Std. Bus
06:00 - 09:00
111 111 1 1 31 31 13 13 29% 30% 9 / 13 7 / 15 Std. Bus Std. Bus
16 30 / 21 Std. Bus Std. Bus
18:00 - 21:00
280 280 2 2 42 45 21 22 41% 45% 27 / 7 27 /
2 64 63 30 31 61% 62% 30 /
9 Std. Bus Std. Bus
21:00 - 01:00
266 266 2 2 34 34 14 15 30% 32% 20 / 5 18 / 6 Std. Bus Std. Bus
76

229Key Characteristics
Subregion of Primary Service: Predominant Vehicle Type:
Population (People, 400m Buffer): Employment (Jobs, 400m Buffer): Walkability (intersection density):
Contributes to FTN (Y/N):
Cost & Performance2012 2013 2014 Rank (2014)
Annual Boardings: 1,018,000 1,100,000 988,000 66 of 212Annual Service Cost: $1,374,000 $1,395,000 $986,000 105 of 219
Annual Revenue Hours: 13,900 14,100 10,000 113 of 219Cost /Boarded Passenger: $1.35 $1.27 $1.00 8 of 212
Avg. Boardings / Rev. Hour: 73 78 99 8 of 212Avg. Daily Boardings (Mon-Fri): 3,150 3,300 2,950 68 of 210
Avg. Daily Boardings (Saturdays): 2,100 2,450 2,350 58 of 179Avg. Daily Boardings (Sun & Holidays): 1,750 2,300 1,950 55 of 171
Peak Passenger Load (Bi-directional Avg.): 17 19 28 44 of 212Peak Load Factor (Vehicle Occupancy): 0.35 0.37 0.55 41 of 212
Average Capacity Utilization (Passenger Turnover): 49% 51% 78% 54 of 212Annual Revenue Hours Above Guidelines (Crowding): 2% 1% 3% 175 of 212
Service Changes Since 2012
Route 229
North Shore
19,500High (0.27 int./hect.)
Std. Bus36,000
Ridership may be impacted by truncation of 229 and opening of 227
Yes
- Summer 2012, Add 1 trip Sat AM from Lonsdale to Phibbs. Increase freq on S/H from 60 to 30m AM- Winter 2013, Truncate service at Lynn Valley Centre; replace service to Phibbs Exchange with new #227 community shuttle route
- Spring 2012, Increase PM freq from 60 to 30m until 21hr Mon-Sat blend HW with #230 for 15m freq on Lonsdale corridor
Productivity
24%
15%
29% 32%
0%
11%
27%
62%
26% 24% 22%
28%
0%
12%
32%
55%
41%
30%
16% 13%
1%
43%
30% 26%
0%
10%
20%
30%
40%
50%
60%
70%
80%
90%
100%
Top 25% Middle High 25% Middle Low 25% Bottom 25% Top 25% Middle High 25% Middle Low 25% Bottom 25%
Boardings Per Revenue Hour Capacity Utilization
Perc
ent o
f Rev
enue
Hou
rs w
ithin
gi
ven
Prod
uctiv
ity B
and
77

Performance by Day of Week, Route 229
2013 2014 2013 2014 2013 2014 2013 2014 2013 2014 2013 2014
2013 2014 2013 2014 2013 2014 2013 2014 2013 2014 2013 2014
2013 2014 2013 2014 2013 2014 2013 2014 2013 2014 2013 2014
Data collected Sept. to mid-Dec. of the given year
Time Annual Revenue Hours
Average Trips per Hour
Average Boardings per Hour
Average Boardings per Trip
Average Capacity Utilization
Average Peak Passenger LoadVehicle Type
(EB / WB)
Std. Bus Std. Bus
06:00 - 09:00
2022 1271 3 3 55 67 22 30 45% 64% 13 / 22 19 / 27 Std. Bus
2013 2014
Mon
-Fri
01:00 - 06:00
146 154 1 1 66 68 22 23 45% 47% 18 / 22 26 / 14
18:00 - 21:00
1684
15:00 - 18:00
2450 1704 2 2 98 92 36 47 72% 94% 22 / 31 32 / 30 Std. Bus Std. Bus
Std. Bus
09:00 - 15:00
3788 2338 2 2 50 82 20 50 41% 100% 7 / 21 32 / 35 Std. Bus Std. Bus
Time Annual Revenue Hours
Average Trips per Hour
Average Boardings per Hour
Average Boardings per Trip
Average Capacity Utilization
Average Peak Passenger LoadVehicle Type
(EB / WB)
21:00 - 01:00
700 625 1 1 55 43 24 22 47% 43% 30 / 7 29 / 7 Std. Bus Std. Bus
24 / 11 32 / 10 Std. Bus Std. Bus1384 2 2 58 54 24 28 47% 55%
Std. Bus Std. Bus
06:00 - 09:00
240 139 2 2 18 49 7 23 14% 46% 3 / 8 10 / 25 Std. Bus Std. Bus
2013 2014
2 2 56 103 23
09:00 - 15:00
766 461 2 2 43 78 18 41 37% 83% 5 / 21 29 / 27 Std. Bus Std. Bus
Std. BusStd. Bus
28 43 / 37 Std. Bus Std. Bus
21:00 - 01:00
144 141 1 1 59 59 28 30 56% 59% 29 / 14 34 / 13 Std. Bus
24 43% 46% 13 / 18 27 / 818:00 - 21:00
284 231 2 2 48 50 22
Satu
rday
01:00 - 06:00
16 19 1 1 152 38 44 21 87% 42% 41 / 19 /
58 46% 117% 7 /15:00 - 18:00
390 234
2013 2014
Sund
ay/H
olid
ay
01:00 - 06:00
15:00 - 18:00
280 274 2
Std. Bus
TimeAnnual Revenue
HoursAverage Trips
per HourAverage Boardings
per Hour Average Boardings
per TripAverage Capacity
Utilization
Average Peak Passenger LoadVehicle Type(EB / WB)
09:00 - 15:00
635 528 2 2 80 75 38 36 78% 72% 23 / 26 26 / 24 Std. Bus Std. Bus
06:00 - 09:00
97 76 2 2 30 53 15 22 30% 43% 8 / 14 / 17 Std. Bus Std. Bus
30 48 / 23 Std. Bus Std. Bus
18:00 - 21:00
285 245 2 2 73 68 33 34 67% 69% 38 / 14 45 /
2 119 98 54 48 108% 96% 47 /
12 Std. Bus Std. Bus
21:00 - 01:00
160 136 1 1 52 46 25 25 50% 50% 24 / 7 26 / 9 Std. Bus Std. Bus
78
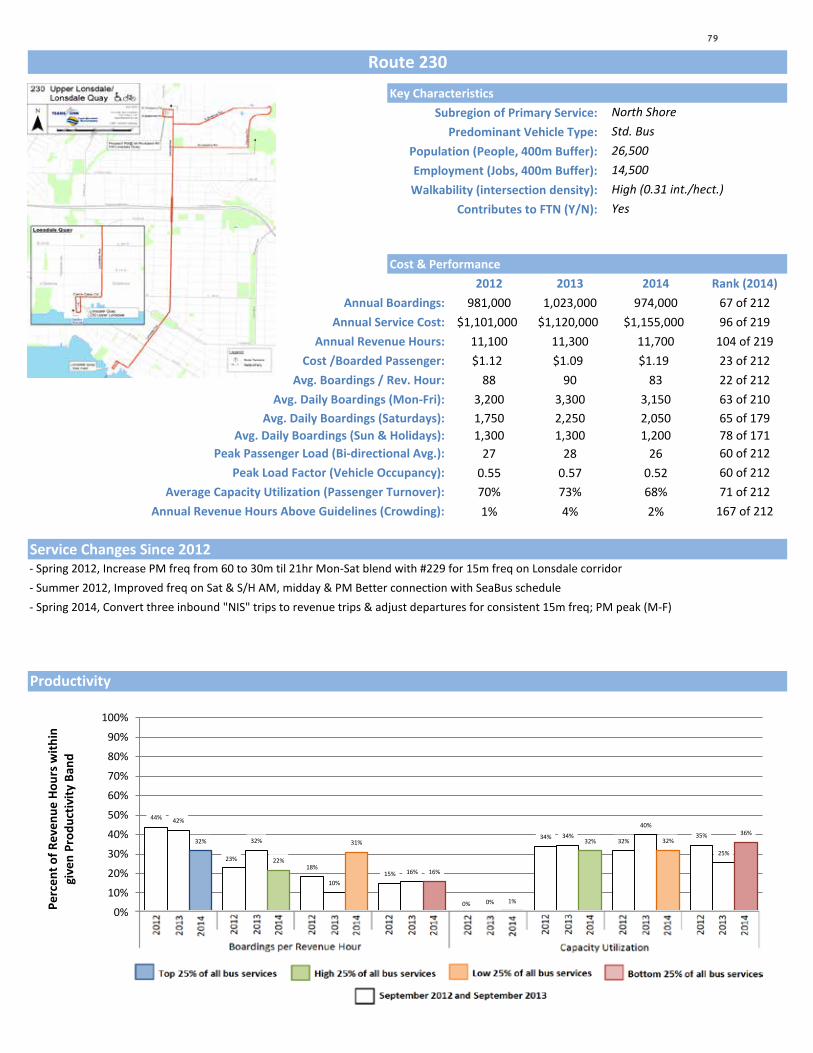
230Key Characteristics
Subregion of Primary Service: Predominant Vehicle Type:
Population (People, 400m Buffer): Employment (Jobs, 400m Buffer): Walkability (intersection density):
Contributes to FTN (Y/N):
Cost & Performance2012 2013 2014 Rank (2014)
Annual Boardings: 981,000 1,023,000 974,000 67 of 212Annual Service Cost: $1,101,000 $1,120,000 $1,155,000 96 of 219
Annual Revenue Hours: 11,100 11,300 11,700 104 of 219Cost /Boarded Passenger: $1.12 $1.09 $1.19 23 of 212
Avg. Boardings / Rev. Hour: 88 90 83 22 of 212Avg. Daily Boardings (Mon-Fri): 3,200 3,300 3,150 63 of 210
Avg. Daily Boardings (Saturdays): 1,750 2,250 2,050 65 of 179Avg. Daily Boardings (Sun & Holidays): 1,300 1,300 1,200 78 of 171
Peak Passenger Load (Bi-directional Avg.): 27 28 26 60 of 212Peak Load Factor (Vehicle Occupancy): 0.55 0.57 0.52 60 of 212
Average Capacity Utilization (Passenger Turnover): 70% 73% 68% 71 of 212Annual Revenue Hours Above Guidelines (Crowding): 1% 4% 2% 167 of 212
Service Changes Since 2012
Route 230
North Shore
14,500High (0.31 int./hect.)
Std. Bus26,500
Yes
- Summer 2012, Improved freq on Sat & S/H AM, midday & PM Better connection with SeaBus schedule- Spring 2014, Convert three inbound "NIS" trips to revenue trips & adjust departures for consistent 15m freq; PM peak (M-F)
- Spring 2012, Increase PM freq from 60 to 30m til 21hr Mon-Sat blend with #229 for 15m freq on Lonsdale corridor
Productivity
44%
23% 18%
15%
0%
34% 32%
35%
42%
32%
10%
16%
0%
34%
40%
25%
32%
22%
31%
16%
1%
32% 32% 36%
0%
10%
20%
30%
40%
50%
60%
70%
80%
90%
100%
Top 25% Middle High 25% Middle Low 25% Bottom 25% Top 25% Middle High 25% Middle Low 25% Bottom 25%
Boardings Per Revenue Hour Capacity Utilization
Perc
ent o
f Rev
enue
Hou
rs w
ithin
gi
ven
Prod
uctiv
ity B
and
79
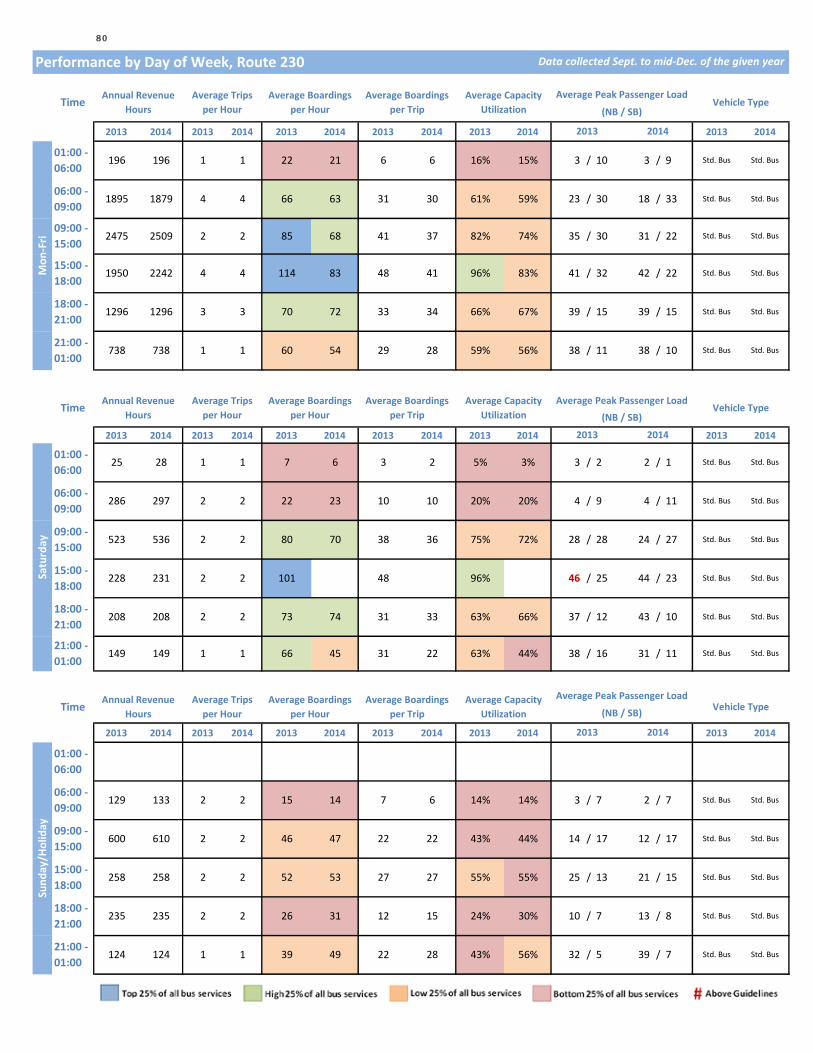
Performance by Day of Week, Route 230
2013 2014 2013 2014 2013 2014 2013 2014 2013 2014 2013 2014
2013 2014 2013 2014 2013 2014 2013 2014 2013 2014 2013 2014
2013 2014 2013 2014 2013 2014 2013 2014 2013 2014 2013 2014
Data collected Sept. to mid-Dec. of the given year
Time Annual Revenue Hours
Average Trips per Hour
Average Boardings per Hour
Average Boardings per Trip
Average Capacity Utilization
Average Peak Passenger LoadVehicle Type
(NB / SB)
Std. Bus Std. Bus
06:00 - 09:00
1895 1879 4 4 66 63 31 30 61% 59% 23 / 30 18 / 33 Std. Bus
2013 2014
Mon
-Fri
01:00 - 06:00
196 196 1 1 22 21 6 6 16% 15% 3 / 10 3 / 9
18:00 - 21:00
1296
15:00 - 18:00
1950 2242 4 4 114 83 48 41 96% 83% 41 / 32 42 / 22 Std. Bus Std. Bus
Std. Bus
09:00 - 15:00
2475 2509 2 2 85 68 41 37 82% 74% 35 / 30 31 / 22 Std. Bus Std. Bus
Time Annual Revenue Hours
Average Trips per Hour
Average Boardings per Hour
Average Boardings per Trip
Average Capacity Utilization
Average Peak Passenger LoadVehicle Type
(NB / SB)
21:00 - 01:00
738 738 1 1 60 54 29 28 59% 56% 38 / 11 38 / 10 Std. Bus Std. Bus
39 / 15 39 / 15 Std. Bus Std. Bus1296 3 3 70 72 33 34 66% 67%
Std. Bus Std. Bus
06:00 - 09:00
286 297 2 2 22 23 10 10 20% 20% 4 / 9 4 / 11 Std. Bus Std. Bus
2013 2014
2 2 101 48
09:00 - 15:00
523 536 2 2 80 70 38 36 75% 72% 28 / 28 24 / 27 Std. Bus Std. Bus
Std. BusStd. Bus
25 44 / 23 Std. Bus Std. Bus
21:00 - 01:00
149 149 1 1 66 45 31 22 63% 44% 38 / 16 31 / 11 Std. Bus
33 63% 66% 37 / 12 43 / 1018:00 - 21:00
208 208 2 2 73 74 31
Satu
rday
01:00 - 06:00
25 28 1 1 7 6 3 2 5% 3% 3 / 2 2 / 1
96% 46 /15:00 - 18:00
228 231
2013 2014
Sund
ay/H
olid
ay
01:00 - 06:00
15:00 - 18:00
258 258 2
Std. Bus
TimeAnnual Revenue
HoursAverage Trips
per HourAverage Boardings
per Hour Average Boardings
per TripAverage Capacity
Utilization
Average Peak Passenger LoadVehicle Type(NB / SB)
09:00 - 15:00
600 610 2 2 46 47 22 22 43% 44% 14 / 17 12 / 17 Std. Bus Std. Bus
06:00 - 09:00
129 133 2 2 15 14 7 6 14% 14% 3 / 7 2 / 7 Std. Bus Std. Bus
13 21 / 15 Std. Bus Std. Bus
18:00 - 21:00
235 235 2 2 26 31 12 15 24% 30% 10 / 7 13 /
2 52 53 27 27 55% 55% 25 /
8 Std. Bus Std. Bus
21:00 - 01:00
124 124 1 1 39 49 22 28 43% 56% 32 / 5 39 / 7 Std. Bus Std. Bus
80
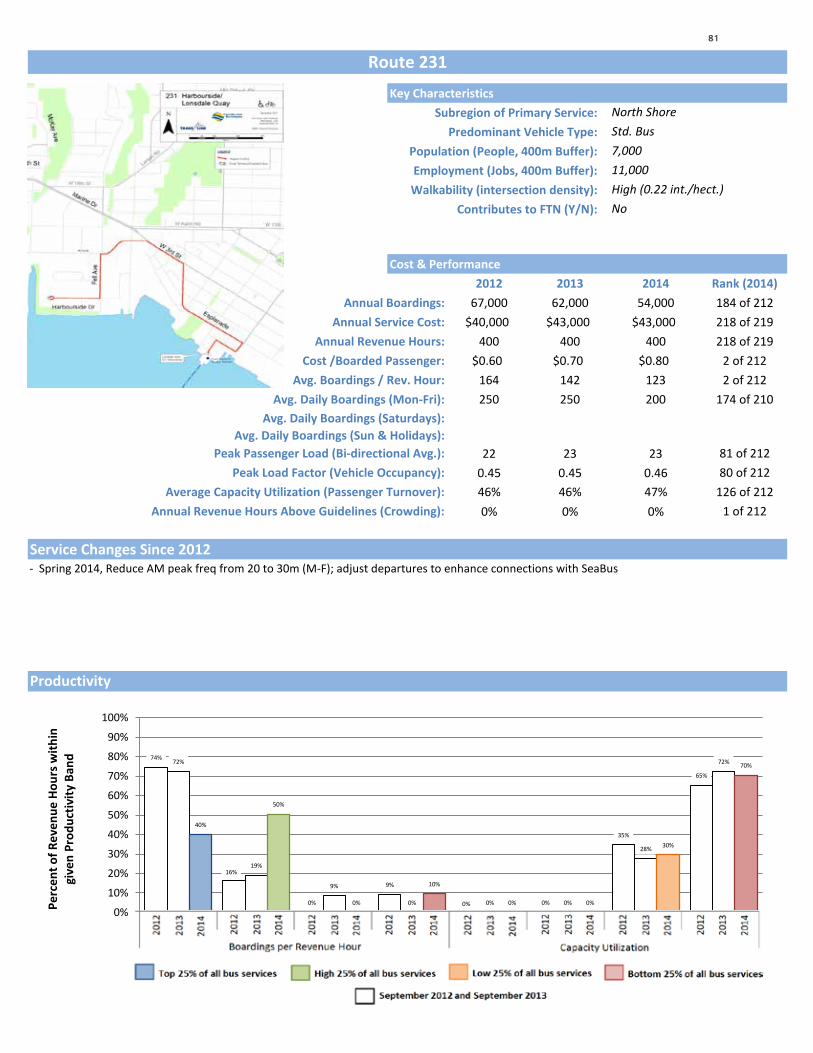
231Key Characteristics
Subregion of Primary Service: Predominant Vehicle Type:
Population (People, 400m Buffer): Employment (Jobs, 400m Buffer): Walkability (intersection density):
Contributes to FTN (Y/N):
Cost & Performance2012 2013 2014 Rank (2014)
Annual Boardings: 67,000 62,000 54,000 184 of 212Annual Service Cost: $40,000 $43,000 $43,000 218 of 219
Annual Revenue Hours: 400 400 400 218 of 219Cost /Boarded Passenger: $0.60 $0.70 $0.80 2 of 212
Avg. Boardings / Rev. Hour: 164 142 123 2 of 212Avg. Daily Boardings (Mon-Fri): 250 250 200 174 of 210
Avg. Daily Boardings (Saturdays): #VALUE! #VALUE! #VALUE!Avg. Daily Boardings (Sun & Holidays): #VALUE! #VALUE! #VALUE!
Peak Passenger Load (Bi-directional Avg.): 22 23 23 81 of 212Peak Load Factor (Vehicle Occupancy): 0.45 0.45 0.46 80 of 212
Average Capacity Utilization (Passenger Turnover): 46% 46% 47% 126 of 212Annual Revenue Hours Above Guidelines (Crowding): 0% 0% 0% 1 of 212
Service Changes Since 2012
Route 231
North Shore
11,000High (0.22 int./hect.)
Std. Bus7,000
No
- Spring 2014, Reduce AM peak freq from 20 to 30m (M-F); adjust departures to enhance connections with SeaBus
Productivity
74%
16%
0%
9%
0% 0%
35%
65%
72%
19%
9%
0% 0% 0%
28%
72%
40%
50%
0%
10%
0% 0%
30%
70%
0%
10%
20%
30%
40%
50%
60%
70%
80%
90%
100%
Top 25% Middle High 25% Middle Low 25% Bottom 25% Top 25% Middle High 25% Middle Low 25% Bottom 25%
Boardings Per Revenue Hour Capacity Utilization
Perc
ent o
f Rev
enue
Hou
rs w
ithin
gi
ven
Prod
uctiv
ity B
and
81
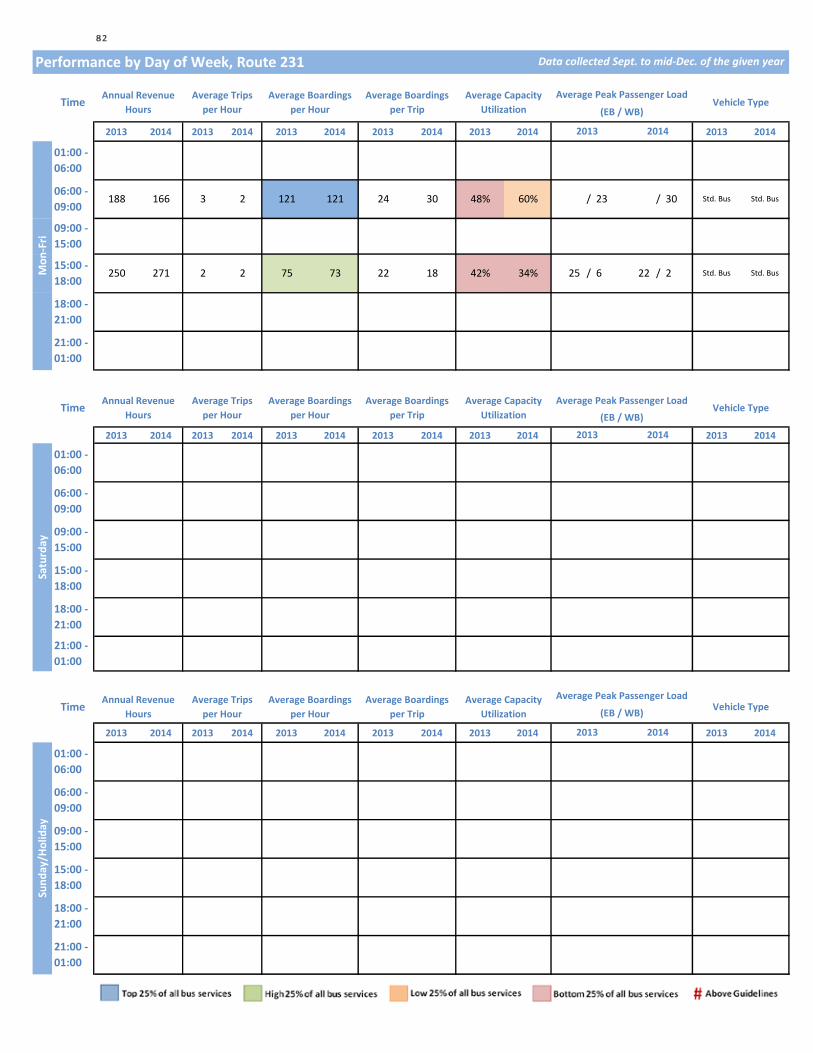
Performance by Day of Week, Route 231
2013 2014 2013 2014 2013 2014 2013 2014 2013 2014 2013 2014
2013 2014 2013 2014 2013 2014 2013 2014 2013 2014 2013 2014
2013 2014 2013 2014 2013 2014 2013 2014 2013 2014 2013 2014
Data collected Sept. to mid-Dec. of the given year
Time Annual Revenue Hours
Average Trips per Hour
Average Boardings per Hour
Average Boardings per Trip
Average Capacity Utilization
Average Peak Passenger LoadVehicle Type
(EB / WB)
06:00 - 09:00
188 166 3 2 121 121 24 30 48% 60% / 23 / 30 Std. Bus
2013 2014
Mon
-Fri
01:00 - 06:00
18:00 - 21:00
15:00 - 18:00
250 271 2 2 75 73 22 18 42% 34% 25 / 6 22 / 2 Std. Bus Std. Bus
Std. Bus
09:00 - 15:00
Time Annual Revenue Hours
Average Trips per Hour
Average Boardings per Hour
Average Boardings per Trip
Average Capacity Utilization
Average Peak Passenger LoadVehicle Type
(EB / WB)
21:00 - 01:00
06:00 - 09:00
2013 2014
09:00 - 15:00
21:00 - 01:00
18:00 - 21:00
Satu
rday
01:00 - 06:00
15:00 - 18:00
2013 2014
Sund
ay/H
olid
ay
01:00 - 06:00
15:00 - 18:00
TimeAnnual Revenue
HoursAverage Trips
per HourAverage Boardings
per Hour Average Boardings
per TripAverage Capacity
Utilization
Average Peak Passenger LoadVehicle Type(EB / WB)
09:00 - 15:00
06:00 - 09:00
18:00 - 21:00
21:00 - 01:00
82

232Key Characteristics
Subregion of Primary Service: Predominant Vehicle Type:
Population (People, 400m Buffer): Employment (Jobs, 400m Buffer): Walkability (intersection density):
Contributes to FTN (Y/N):
Cost & Performance2012 2013 2014 Rank (2014)
Annual Boardings: 849,000 798,000 787,000 78 of 212Annual Service Cost: $1,501,000 $1,493,000 $1,498,000 74 of 219
Annual Revenue Hours: 15,200 15,100 15,100 76 of 219Cost /Boarded Passenger: $1.77 $1.87 $1.90 92 of 212
Avg. Boardings / Rev. Hour: 56 53 52 82 of 212Avg. Daily Boardings (Mon-Fri): 2,650 2,500 2,450 80 of 210
Avg. Daily Boardings (Saturdays): 1,750 1,700 1,700 74 of 179Avg. Daily Boardings (Sun & Holidays): 1,400 1,450 1,350 73 of 171
Peak Passenger Load (Bi-directional Avg.): 22 21 22 87 of 212Peak Load Factor (Vehicle Occupancy): 0.43 0.41 0.43 87 of 212
Average Capacity Utilization (Passenger Turnover): 71% 69% 70% 67 of 212Annual Revenue Hours Above Guidelines (Crowding): 2% 0% 2% 171 of 212
Service Changes Since 2012
Route 232
North Shore
17,000High (0.27 int./hect.)
Std. Bus34,000
No
- Summer 2012, Discontinued short-turns btw Phibbs & 15th St/Lonsdale during the AM & PM peak
Productivity
4%
26%
42%
28%
2%
29%
39%
30%
2%
16%
51%
32%
2%
22%
42%
34%
4%
26%
41%
29%
2%
24%
43%
31%
0%
10%
20%
30%
40%
50%
60%
70%
80%
90%
100%
Top 25% Middle High 25% Middle Low 25% Bottom 25% Top 25% Middle High 25% Middle Low 25% Bottom 25%
Boardings Per Revenue Hour Capacity Utilization
Perc
ent o
f Rev
enue
Hou
rs w
ithin
gi
ven
Prod
uctiv
ity B
and
83

Performance by Day of Week, Route 232
2013 2014 2013 2014 2013 2014 2013 2014 2013 2014 2013 2014
2013 2014 2013 2014 2013 2014 2013 2014 2013 2014 2013 2014
2013 2014 2013 2014 2013 2014 2013 2014 2013 2014 2013 2014
Data collected Sept. to mid-Dec. of the given year
Time Annual Revenue Hours
Average Trips per Hour
Average Boardings per Hour
Average Boardings per Trip
Average Capacity Utilization
Average Peak Passenger LoadVehicle Type
(EB / WB)
Std. Bus Std. Bus
06:00 - 09:00
1983 1975 2 2 62 63 41 41 86% 87% 29 / 26 30 / 28 Std. Bus
2013 2014
Mon
-Fri
01:00 - 06:00
225 225 1 1 25 17 15 11 31% 22% 21 / 3 16 / 2
18:00 - 21:00
1759
15:00 - 18:00
2208 2255 2 2 62 70 51 52 101% 103% 30 / 29 30 / 33 Std. Bus Std. Bus
Std. Bus
09:00 - 15:00
4084 4101 2 2 50 54 39 39 77% 77% 21 / 24 22 / 22 Std. Bus Std. Bus
Time Annual Revenue Hours
Average Trips per Hour
Average Boardings per Hour
Average Boardings per Trip
Average Capacity Utilization
Average Peak Passenger LoadVehicle Type
(EB / WB)
21:00 - 01:00
842 842 2 2 26 29 15 17 33% 36% 10 / 13 11 / 14 Std. Bus Std. Bus
16 / 15 17 / 17 Std. Bus Std. Bus1759 2 2 38 41 26 28 52% 56%
06:00 - 09:00
246 246 2 2 26 34 17 23 36% 48% 11 / 11 12 / 20 Std. Bus Std. Bus
2013 2014
2 2 48 50 35
09:00 - 15:00
751 751 2 2 37 39 27 28 54% 57% 15 / 15 14 / 18 Std. Bus Std. Bus
Std. BusStd. Bus
18 23 / 20 Std. Bus Std. Bus
21:00 - 01:00
164 164 2 2 30 34 17 21 34% 41% 13 / 10 14 / 9 Std. Bus
25 49% 50% 16 / 13 21 / 1118:00 - 21:00
350 350 2 2 34 36 24
Satu
rday
01:00 - 06:00
37 70% 74% 19 /15:00 - 18:00
381 381
2013 2014
Sund
ay/H
olid
ay
01:00 - 06:00
15:00 - 18:00
434 434 2
Std. Bus
TimeAnnual Revenue
HoursAverage Trips
per HourAverage Boardings
per Hour Average Boardings
per TripAverage Capacity
Utilization
Average Peak Passenger LoadVehicle Type(EB / WB)
09:00 - 15:00
855 855 2 2 38 36 26 25 53% 50% 16 / 16 15 / 16 Std. Bus Std. Bus
06:00 - 09:00
201 201 2 2 22 21 17 17 33% 31% 11 / 10 / 11 Std. Bus Std. Bus
16 21 / 17 Std. Bus Std. Bus
18:00 - 21:00
406 406 2 2 31 32 21 22 42% 44% 14 / 12 17 /
2 44 44 30 30 59% 59% 20 /
11 Std. Bus Std. Bus
21:00 - 01:00
197 197 2 2 19 29 11 17 22% 35% 7 / 9 11 / 10 Std. Bus Std. Bus
84
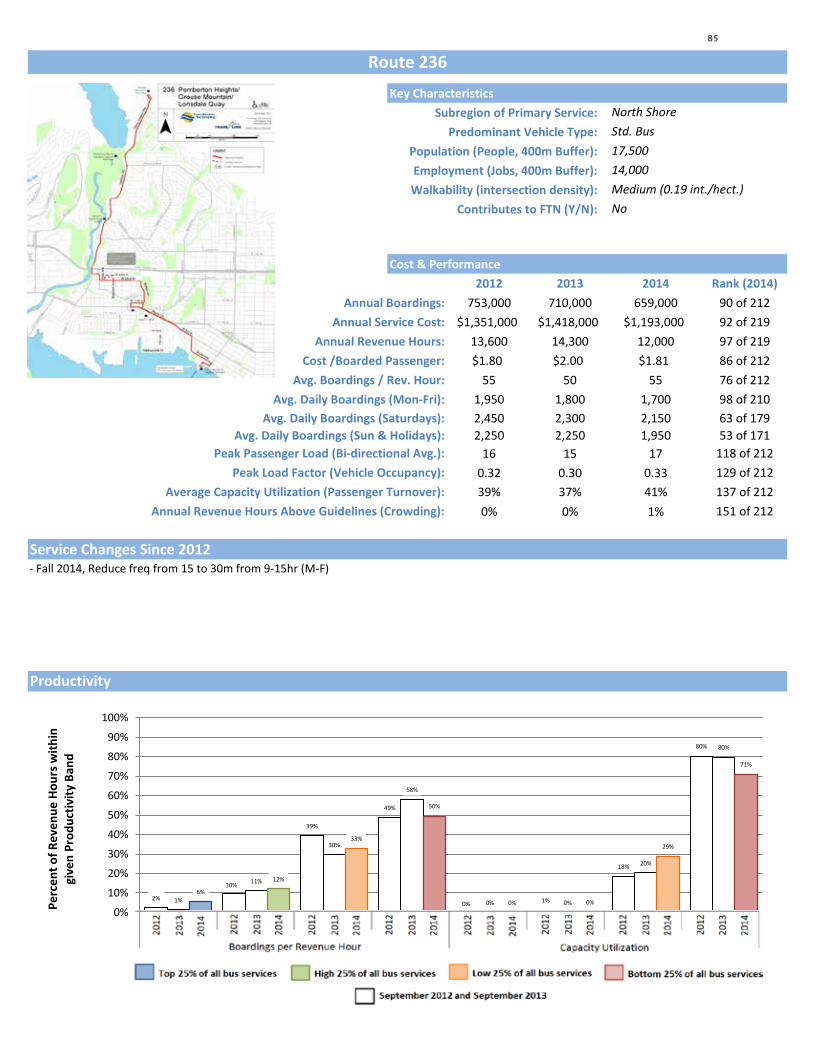
236Key Characteristics
Subregion of Primary Service: Predominant Vehicle Type:
Population (People, 400m Buffer): Employment (Jobs, 400m Buffer): Walkability (intersection density):
Contributes to FTN (Y/N):
Cost & Performance2012 2013 2014 Rank (2014)
Annual Boardings: 753,000 710,000 659,000 90 of 212Annual Service Cost: $1,351,000 $1,418,000 $1,193,000 92 of 219
Annual Revenue Hours: 13,600 14,300 12,000 97 of 219Cost /Boarded Passenger: $1.80 $2.00 $1.81 86 of 212
Avg. Boardings / Rev. Hour: 55 50 55 76 of 212Avg. Daily Boardings (Mon-Fri): 1,950 1,800 1,700 98 of 210
Avg. Daily Boardings (Saturdays): 2,450 2,300 2,150 63 of 179Avg. Daily Boardings (Sun & Holidays): 2,250 2,250 1,950 53 of 171
Peak Passenger Load (Bi-directional Avg.): 16 15 17 118 of 212Peak Load Factor (Vehicle Occupancy): 0.32 0.30 0.33 129 of 212
Average Capacity Utilization (Passenger Turnover): 39% 37% 41% 137 of 212Annual Revenue Hours Above Guidelines (Crowding): 0% 0% 1% 151 of 212
Service Changes Since 2012
Route 236
North Shore
14,000Medium (0.19 int./hect.)
Std. Bus17,500
No
- Fall 2014, Reduce freq from 15 to 30m from 9-15hr (M-F)
Productivity
2%
10%
39%
49%
0% 1%
18%
80%
1%
11%
30%
58%
0% 0%
20%
80%
6%
12%
33%
50%
0% 0%
29%
71%
0%
10%
20%
30%
40%
50%
60%
70%
80%
90%
100%
Top 25% Middle High 25% Middle Low 25% Bottom 25% Top 25% Middle High 25% Middle Low 25% Bottom 25%
Boardings Per Revenue Hour Capacity Utilization
Perc
ent o
f Rev
enue
Hou
rs w
ithin
gi
ven
Prod
uctiv
ity B
and
85
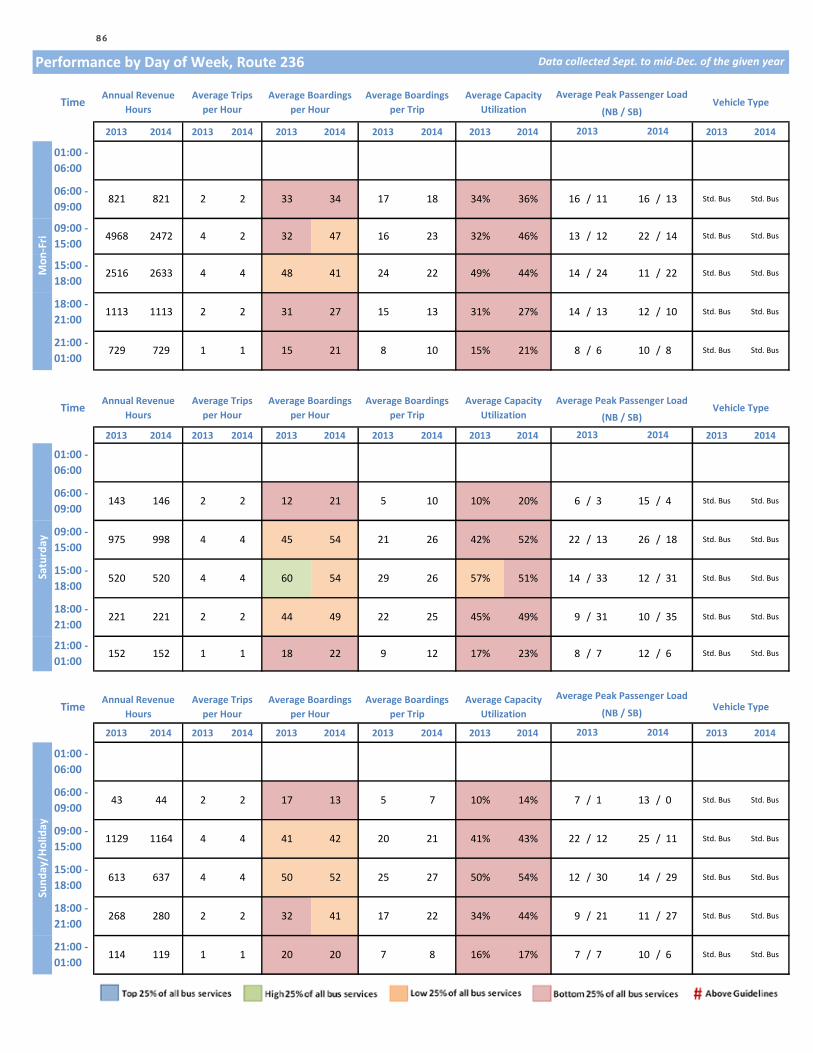
Performance by Day of Week, Route 236
2013 2014 2013 2014 2013 2014 2013 2014 2013 2014 2013 2014
2013 2014 2013 2014 2013 2014 2013 2014 2013 2014 2013 2014
2013 2014 2013 2014 2013 2014 2013 2014 2013 2014 2013 2014
Data collected Sept. to mid-Dec. of the given year
Time Annual Revenue Hours
Average Trips per Hour
Average Boardings per Hour
Average Boardings per Trip
Average Capacity Utilization
Average Peak Passenger LoadVehicle Type
(NB / SB)
06:00 - 09:00
821 821 2 2 33 34 17 18 34% 36% 16 / 11 16 / 13 Std. Bus
2013 2014
Mon
-Fri
01:00 - 06:00
18:00 - 21:00
1113
15:00 - 18:00
2516 2633 4 4 48 41 24 22 49% 44% 14 / 24 11 / 22 Std. Bus Std. Bus
Std. Bus
09:00 - 15:00
4968 2472 4 2 32 47 16 23 32% 46% 13 / 12 22 / 14 Std. Bus Std. Bus
Time Annual Revenue Hours
Average Trips per Hour
Average Boardings per Hour
Average Boardings per Trip
Average Capacity Utilization
Average Peak Passenger LoadVehicle Type
(NB / SB)
21:00 - 01:00
729 729 1 1 15 21 8 10 15% 21% 8 / 6 10 / 8 Std. Bus Std. Bus
14 / 13 12 / 10 Std. Bus Std. Bus1113 2 2 31 27 15 13 31% 27%
06:00 - 09:00
143 146 2 2 12 21 5 10 10% 20% 6 / 3 15 / 4 Std. Bus Std. Bus
2013 2014
4 4 60 54 29
09:00 - 15:00
975 998 4 4 45 54 21 26 42% 52% 22 / 13 26 / 18 Std. Bus Std. Bus
Std. BusStd. Bus
33 12 / 31 Std. Bus Std. Bus
21:00 - 01:00
152 152 1 1 18 22 9 12 17% 23% 8 / 7 12 / 6 Std. Bus
25 45% 49% 9 / 31 10 / 3518:00 - 21:00
221 221 2 2 44 49 22
Satu
rday
01:00 - 06:00
26 57% 51% 14 /15:00 - 18:00
520 520
2013 2014
Sund
ay/H
olid
ay
01:00 - 06:00
15:00 - 18:00
613 637 4
Std. Bus
TimeAnnual Revenue
HoursAverage Trips
per HourAverage Boardings
per Hour Average Boardings
per TripAverage Capacity
Utilization
Average Peak Passenger LoadVehicle Type(NB / SB)
09:00 - 15:00
1129 1164 4 4 41 42 20 21 41% 43% 22 / 12 25 / 11 Std. Bus Std. Bus
06:00 - 09:00
43 44 2 2 17 13 5 7 10% 14% 7 / 1 13 / 0 Std. Bus Std. Bus
30 14 / 29 Std. Bus Std. Bus
18:00 - 21:00
268 280 2 2 32 41 17 22 34% 44% 9 / 21 11 /
4 50 52 25 27 50% 54% 12 /
27 Std. Bus Std. Bus
21:00 - 01:00
114 119 1 1 20 20 7 8 16% 17% 7 / 7 10 / 6 Std. Bus Std. Bus
86
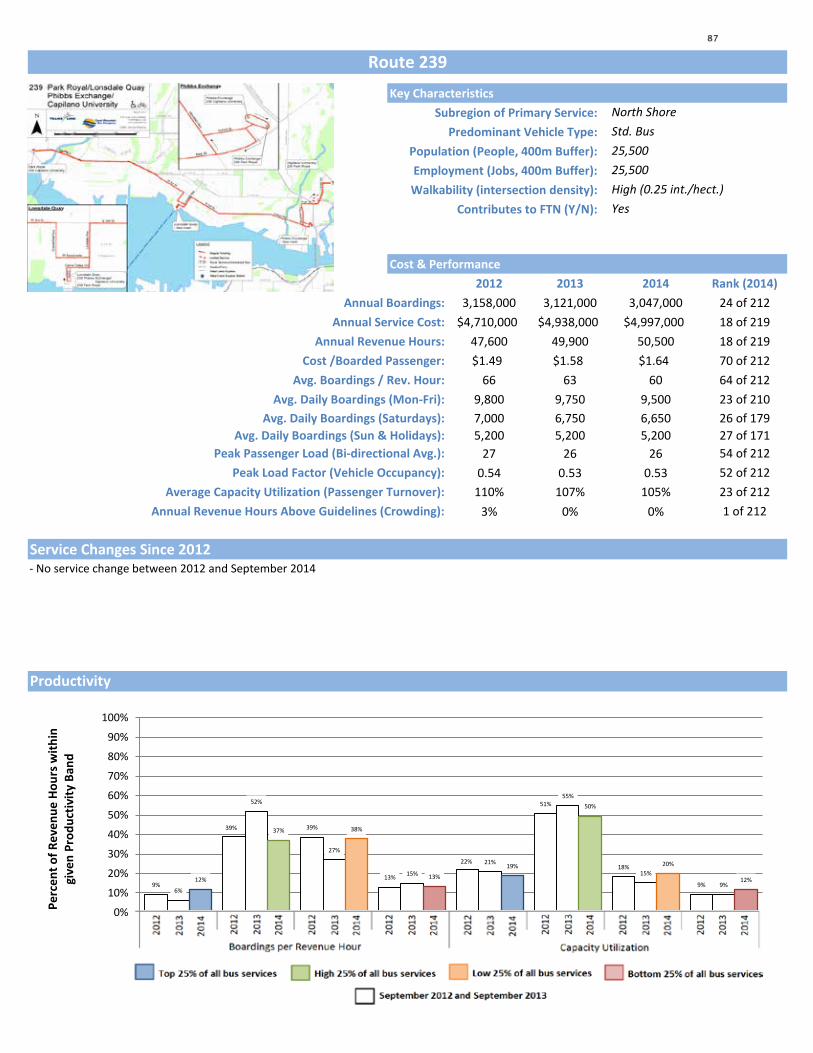
239Key Characteristics
Subregion of Primary Service: Predominant Vehicle Type:
Population (People, 400m Buffer): Employment (Jobs, 400m Buffer): Walkability (intersection density):
Contributes to FTN (Y/N):
Cost & Performance2012 2013 2014 Rank (2014)
Annual Boardings: 3,158,000 3,121,000 3,047,000 24 of 212Annual Service Cost: $4,710,000 $4,938,000 $4,997,000 18 of 219
Annual Revenue Hours: 47,600 49,900 50,500 18 of 219Cost /Boarded Passenger: $1.49 $1.58 $1.64 70 of 212
Avg. Boardings / Rev. Hour: 66 63 60 64 of 212Avg. Daily Boardings (Mon-Fri): 9,800 9,750 9,500 23 of 210
Avg. Daily Boardings (Saturdays): 7,000 6,750 6,650 26 of 179Avg. Daily Boardings (Sun & Holidays): 5,200 5,200 5,200 27 of 171
Peak Passenger Load (Bi-directional Avg.): 27 26 26 54 of 212Peak Load Factor (Vehicle Occupancy): 0.54 0.53 0.53 52 of 212
Average Capacity Utilization (Passenger Turnover): 110% 107% 105% 23 of 212Annual Revenue Hours Above Guidelines (Crowding): 3% 0% 0% 1 of 212
Service Changes Since 2012
Route 239
North ShoreStd. Bus25,50025,500High (0.25 int./hect.)Yes
- No service change between 2012 and September 2014
Productivity
9%
39% 39%
13%
22%
51%
18%
9% 6%
52%
27%
15%
21%
55%
15%
9% 12%
37% 38%
13%
19%
50%
20%
12%
0%
10%
20%
30%
40%
50%
60%
70%
80%
90%
100%
Top 25% Middle High 25% Middle Low 25% Bottom 25% Top 25% Middle High 25% Middle Low 25% Bottom 25%
Boardings Per Revenue Hour Capacity Utilization
Perc
ent o
f Rev
enue
Hou
rs w
ithin
gi
ven
Prod
uctiv
ity B
and
87
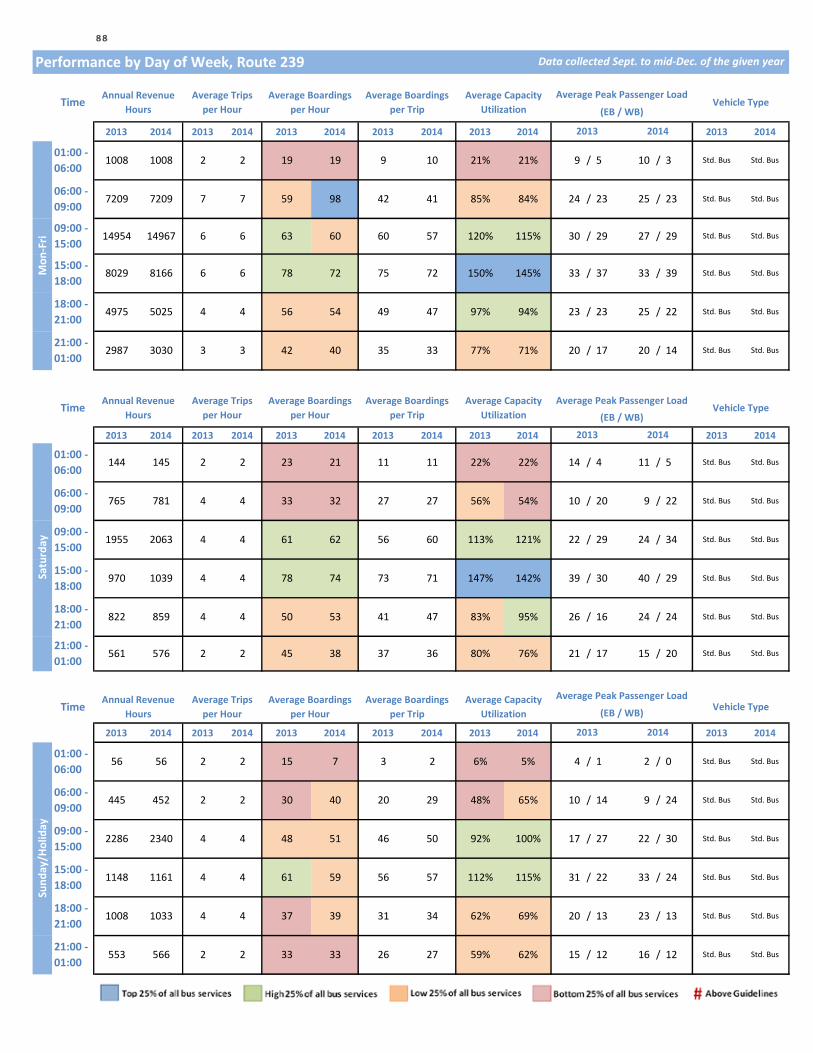
Performance by Day of Week, Route 239
2013 2014 2013 2014 2013 2014 2013 2014 2013 2014 2013 2014
2013 2014 2013 2014 2013 2014 2013 2014 2013 2014 2013 2014
2013 2014 2013 2014 2013 2014 2013 2014 2013 2014 2013 2014
Data collected Sept. to mid-Dec. of the given year
Time Annual Revenue Hours
Average Trips per Hour
Average Boardings per Hour
Average Boardings per Trip
Average Capacity Utilization
Average Peak Passenger LoadVehicle Type
(EB / WB)
2013 2014
Mon
-Fri
01:00 - 06:00
1008 1008 2 2 19 19 9 10 21% 21% 9 / 5 10 / 3
18:00 - 21:00
4975
15:00 - 18:00
8029 8166 6 6 78 72 75 72 150% 145% 33 / 37
77% 71% 20 / 17 20 / 14 Std. Bus Std. Bus
23
Std. Bus Std. Bus
06:00 - 09:00
7209 7209 7 7 59 98 42 41 85% 84% 24 / 23 25 / 23 Std. Bus
Std. Bus Std. Bus
2013 2014
30 40 / 29 Std. Bus Std. Bus
33 / 39 Std. Bus Std. Bus
Std. Bus
09:00 - 15:00
14954 14967 6 6 63 60 60 57 120% 115% 30 / 29 27 / 29 Std. Bus Std. Bus
Time Annual Revenue Hours
Average Trips per Hour
Average Boardings per Hour
Average Boardings per Trip
Average Capacity Utilization
Average Peak Passenger LoadVehicle Type
(EB / WB)
21:00 - 01:00
2987 3030 3 3 42 40 35 33
09:00 - 15:00
1955 2063 4 4 61 62 56 60 113% 121% 22 / 29 24 / 34 Std. Bus Std. Bus
Std. BusStd. Bus
/ 23 25 / 22 Std. Bus Std. Bus5025 4 4 56 54 49 47 97% 94%
Std. Bus Std. Bus
06:00 - 09:00
765 781 4 4 33 32 27 27 56% 54% 10 / 20 9 /
47 83% 95% 26 / 16 24 / 2418:00 - 21:00
822 859 4 4 50 53 41
Satu
rday
01:00 - 06:00
144 145 2 2 23 21 11 11 22% 22% 14 / 4 11 / 5
71 147% 142% 39 /15:00 - 18:00
970 1039 4 4 78 74 73
22
Std. Bus
TimeAnnual Revenue
HoursAverage Trips
per HourAverage Boardings
per Hour Average Boardings
per TripAverage Capacity
Utilization
Average Peak Passenger LoadVehicle Type(EB / WB)
09:00 - 15:00
2286 2340 4 4 48 51 46 50 92% 100% 17 / 27 22 / 30 Std. Bus Std. Bus
Std. Bus Std. Bus
21:00 - 01:00
561 576 2 2 45 38 37 36 80% 76% 21 / 17 15 / 20 Std. Bus
13 23 /
4 61 59 56 57 112% 115% 31 /
06:00 - 09:00
445 452
2013 2014
Sund
ay/H
olid
ay
01:00 - 06:00
56 56 2 2 15 7 3 2 6% 5% 4 / 1 2 / 0
15:00 - 18:00
1148 1161 4
2 2 30 40 20 29 48% 65% 10 / 14 9 / 24 Std. Bus Std. Bus
13 Std. Bus Std. Bus
21:00 - 01:00
553 566 2 2 33 33 26 27 59% 62% 15 / 12 16 / 12 Std. Bus Std. Bus
22 33 / 24 Std. Bus Std. Bus
18:00 - 21:00
1008 1033 4 4 37 39 31 34 62% 69% 20 /
88
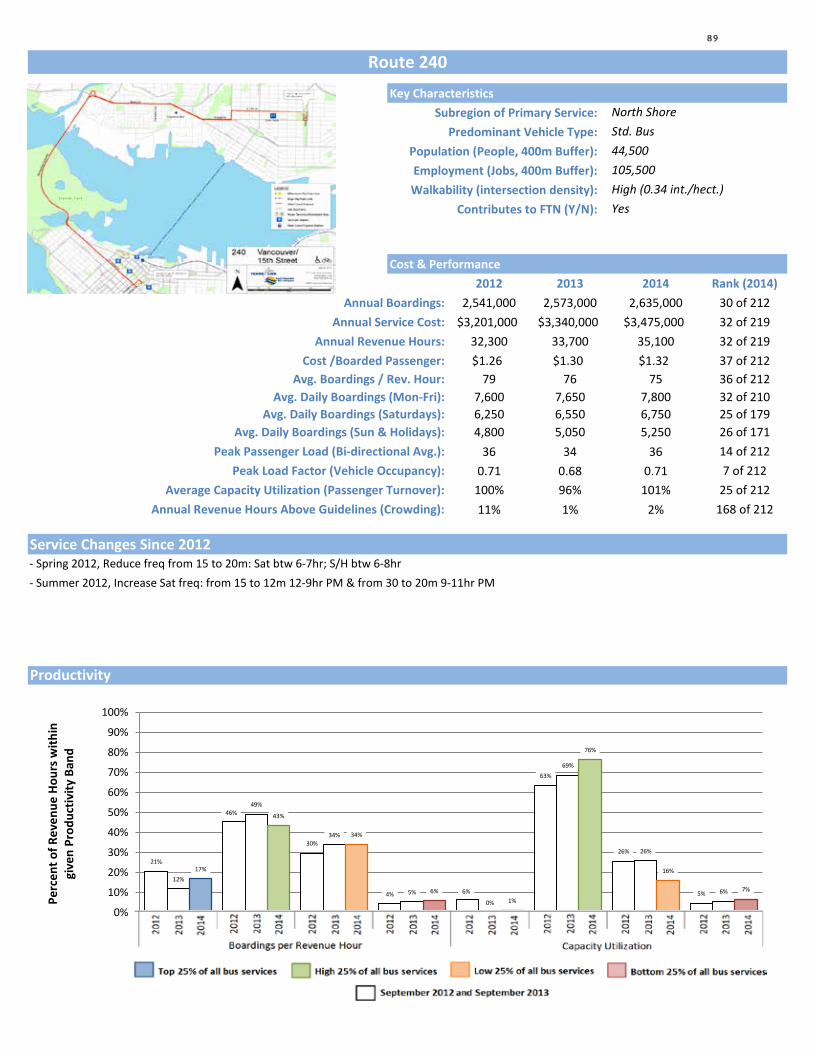
240Key Characteristics
Subregion of Primary Service: Predominant Vehicle Type:
Population (People, 400m Buffer): Employment (Jobs, 400m Buffer): Walkability (intersection density):
Contributes to FTN (Y/N):
Cost & Performance2012 2013 2014 Rank (2014)
Annual Boardings: 2,541,000 2,573,000 2,635,000 30 of 212Annual Service Cost: $3,201,000 $3,340,000 $3,475,000 32 of 219
Annual Revenue Hours: 32,300 33,700 35,100 32 of 219Cost /Boarded Passenger: $1.26 $1.30 $1.32 37 of 212
Avg. Boardings / Rev. Hour: 79 76 75 36 of 212Avg. Daily Boardings (Mon-Fri): 7,600 7,650 7,800 32 of 210
Avg. Daily Boardings (Saturdays): 6,250 6,550 6,750 25 of 179Avg. Daily Boardings (Sun & Holidays): 4,800 5,050 5,250 26 of 171
Peak Passenger Load (Bi-directional Avg.): 36 34 36 14 of 212Peak Load Factor (Vehicle Occupancy): 0.71 0.68 0.71 7 of 212
Average Capacity Utilization (Passenger Turnover): 100% 96% 101% 25 of 212Annual Revenue Hours Above Guidelines (Crowding): 11% 1% 2% 168 of 212
Service Changes Since 2012
Productivity
- Spring 2012, Reduce freq from 15 to 20m: Sat btw 6-7hr; S/H btw 6-8hr
Yes
44,500
High (0.34 int./hect.)
Route 240
North ShoreStd. Bus
105,500
- Summer 2012, Increase Sat freq: from 15 to 12m 12-9hr PM & from 30 to 20m 9-11hr PM
21%
46%
30%
4% 6%
63%
26%
5%
12%
49%
34%
5% 0%
69%
26%
6%
17%
43%
34%
6% 1%
76%
16%
7%
0%
10%
20%
30%
40%
50%
60%
70%
80%
90%
100%
Top 25% Middle High 25% Middle Low 25% Bottom 25% Top 25% Middle High 25% Middle Low 25% Bottom 25%
Boardings Per Revenue Hour Capacity Utilization
Perc
ent o
f Rev
enue
Hou
rs w
ithin
gi
ven
Prod
uctiv
ity B
and
89

2013 2014 2013 2014 2013 2014 2013 2014 2013 2014 2013 2014
2013 2014 2013 2014 2013 2014 2013 2014 2013 2014 2013 2014
2013 2014 2013 2014 2013 2014 2013 2014 2013 2014 2013 2014
09:00 - 15:00
1734 1929 5
18:00 - 21:00
846 883 5
Time
21:00 - 01:00
3
/ /
Satu
rday 94% 106% 27 34 30 39 Std. Bus Std. Bus
5
71 54 55 107% 111%
5 63 69 46 52
06:00 - 09:00
549 3 3 49 53 34 38 68%
1040
TimeAnnual Revenue
HoursAverage Trips
per HourAverage Boardings
per Hour
42 /45
Std. Bus/ 43 Std. Bus
/ 29
42 45
Data collected Sept. to mid-Dec. of the given year
09:00 - 15:00
8568
06:00 - 09:00
4530
Performance by Day of Week, Route 240
54 57
404 2 43 63 52
49 51 98%
Mon
-Fri
01:00 - 06:00
388
4701
Std. Bus
109% 114% 39 /
Std. Bus
126%
Std. Bus
Std. BusStd. Bus
/
01:00 - 06:00
2014
21/ Std. Bus31 / 21
Average Peak Passenger Load
86%
86% 28 37
Time Annual Revenue Hours
Average Trips per Hour
Average Boardings per Hour
Average Boardings per Trip
Average Capacity Utilization
Average Peak Passenger LoadVehicle Type
(EB / WB)
2013 2014
127% 24 / 422 67
48
/
58
Std. Bus Std. Bus
Std. Bus
60 101% 31 / 33 31 / 36 Std. Bus
110
67% 67%
61 42
1093
71% 84% 24 /
78 81
8951 4 4
5 5
30
15:00 - 18:00
5342 5467 5 5 78 76
21:00 - 01:00
2163 2171
15:00 - 18:00
5 5 72
56
585 610 4
30 /
Average Boardings per Trip
Average Capacity Utilization
90% 35 /18:00 - 21:00
3530 65 42 453634 4 4 62
2 2 48 49 33 33
(EB / WB)
2013
63 124%
4 50 49 31 31 63% 62% 23 / 25 23 / 26 Std. Bus Std. Bus
41 34 /
Std. Bus
Vehicle Type
35 / 32 40
82% 99% 25 Std. Bus
41 Std. Bus Std. Bus
Average Capacity Utilization
Average Peak Passenger Load
20142013
(EB / WB)
Std. Bus
28 28 / 32 Std. Bus59 36 42
/ 21 3376% 32 / 25 Std. Bus542
38
15:00 - 18:00
925 985 4
27
4 72 79 51
49
Std. Bus
Sund
ay/H
olid
ay
01:00 - 06:00
Std. Bus
18:00 - 21:00
792 847 4 4 50 53 33 37 66% 75% 28 / 21 32 /
101% 112%
Annual Revenue Hours
Average Trips per Hour
Average Boardings per Hour
Average Boardings per Trip
Vehicle Type
06:00 - 09:00
642 650
22 Std. Bus
/ 31 31 / 35 Std. Bus
/ 36 Std. Bus
Std. Bus
13 3467% 22 /
49% 55% / 19 19 / 22 Std. Bus
23 31
42 25
56
21:00 - 01:00
331 336 2
09:00 - 15:00
1780 1892 4 4 57 70 41
19
Std. Bus/2 38 55 50% Std. Bus16
3
90

241Key Characteristics
Subregion of Primary Service: Predominant Vehicle Type:
Population (People, 400m Buffer): Employment (Jobs, 400m Buffer): Walkability (intersection density):
Contributes to FTN (Y/N):
Cost & Performance2012 2013 2014 Rank (2014)
Annual Boardings: 341,000 344,000 325,000 117 of 212Annual Service Cost: $455,000 $467,000 $478,000 127 of 219
Annual Revenue Hours: 4,600 4,700 4,800 150 of 219Cost /Boarded Passenger: $1.33 $1.36 $1.47 52 of 212
Avg. Boardings / Rev. Hour: 74 73 67 49 of 212Avg. Daily Boardings (Mon-Fri): 1,350 1,350 1,300 110 of 210
Avg. Daily Boardings (Saturdays): #VALUE! #VALUE! #VALUE!Avg. Daily Boardings (Sun & Holidays): #VALUE! #VALUE! #VALUE!
Peak Passenger Load (Bi-directional Avg.): 41 40 42 7 of 212Peak Load Factor (Vehicle Occupancy): 0.82 0.79 0.84 2 of 212
Average Capacity Utilization (Passenger Turnover): 109% 109% 111% 19 of 212Annual Revenue Hours Above Guidelines (Crowding): 0% 0% 13% 205 of 212
Service Changes Since 2012- No service change between 2012 and September 2014
Route 241
107,000
Std. BusNorth Shore
No
48,500
High (0.36 int./hect.)
Productivity
0%
62%
36%
2% 0%
76%
21%
3% 0%
66%
18% 16% 16%
71%
10%
3%
24% 25% 29%
22%
0%
86%
11%
3%
0%
10%
20%
30%
40%
50%
60%
70%
80%
90%
100%
Top 25% Middle High 25% Middle Low 25% Bottom 25% Top 25% Middle High 25% Middle Low 25% Bottom 25%
Boardings Per Revenue Hour Capacity Utilization
Perc
ent o
f Rev
enue
Hou
rs w
ithin
gi
ven
Prod
uctiv
ity B
and
91
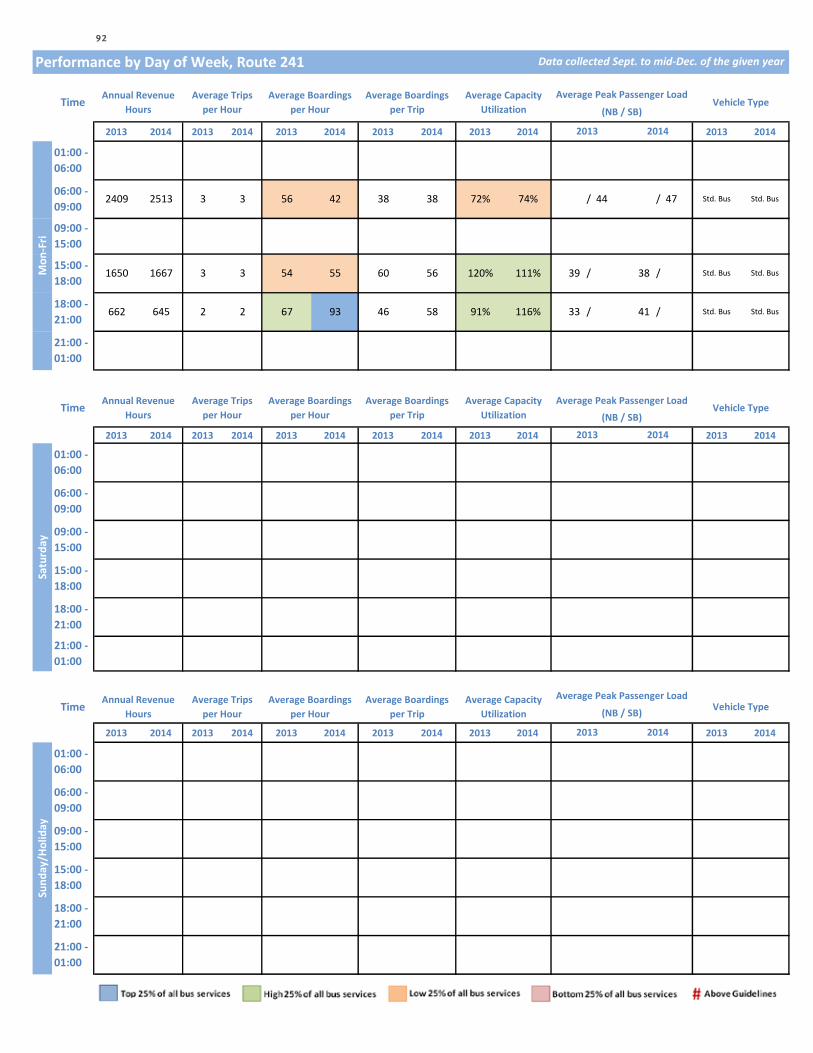
Performance by Day of Week, Route 241
2013 2014 2013 2014 2013 2014 2013 2014 2013 2014 2013 2014
2013 2014 2013 2014 2013 2014 2013 2014 2013 2014 2013 2014
2013 2014 2013 2014 2013 2014 2013 2014 2013 2014 2013 2014
1650
18:00 - 21:00
662 Std. Bus Std. Bus
47 Std. Bus Std. Bus
/
(NB / SB)
2013
06:00 - 09:00
2409 2513
21:00 - 01:00
Average Trips per Hour
Average Boardings per Hour
Average Boardings per Trip
Average Capacity Utilization
56 72%
645 2 67
55 60
58 91%
56 120%54 111% 39
2014
Time Annual Revenue Hours
Data collected Sept. to mid-Dec. of the given year
Average Peak Passenger LoadVehicle Type
41 /
38
74% / 44
/
116% 33 /
1667 3 3
2
3
Std. Bus
/
09:00 - 15:00
3
93 46
38
Std. Bus15:00 - 18:00
42 38
Mon
-Fri
01:00 - 06:00
Average Peak Passenger LoadVehicle Type
(NB / SB)
2013 2014
Average Boardings per Hour
Time Annual Revenue Hours
Average Trips per Hour
09:00 - 15:00
Average Boardings per Trip
Average Capacity Utilization
01:00 - 06:00
21:00 - 01:00
Sund
ay/H
olid
ay
01:00 - 06:00
21:00 - 01:00
15:00 - 18:00
Satu
rday
06:00 - 09:00
15:00 - 18:00
18:00 - 21:00
Vehicle TypeTimeAnnual Revenue
HoursAverage Trips
per HourAverage Boardings
per Hour
Average Peak Passenger Load
(NB / SB)
2013
Average Boardings per Trip
06:00 - 09:00
Average Capacity Utilization
2014
09:00 - 15:00
18:00 - 21:00
92

242Key Characteristics
Subregion of Primary Service: Predominant Vehicle Type:
Population (People, 400m Buffer): Employment (Jobs, 400m Buffer): Walkability (intersection density):
Contributes to FTN (Y/N):
Cost & Performance2012 2013 2014 Rank (2014)
Annual Boardings: 10,000 10,000 12,000 204 of 212Annual Service Cost: $34,000 $35,000 $35,000 219 of 219
Annual Revenue Hours: 300 400 400 219 of 219Cost /Boarded Passenger: $3.43 $3.36 $3.00 156 of 212
Avg. Boardings / Rev. Hour: 29 29 33 138 of 212Avg. Daily Boardings (Mon-Fri): #VALUE! #VALUE! #VALUE!
Avg. Daily Boardings (Saturdays): 20 20 30 177 of 179Avg. Daily Boardings (Sun & Holidays): 150 150 150 133 of 171
Peak Passenger Load (Bi-directional Avg.): 11 12 14 130 of 212Peak Load Factor (Vehicle Occupancy): 0.23 0.25 0.28 146 of 212
Average Capacity Utilization (Passenger Turnover): 32% 33% 37% 147 of 212Annual Revenue Hours Above Guidelines (Crowding): 0% 0% 0% 1 of 212
Service Changes Since 2012
Route 242
114,000High (0.34 int./hect.)
North ShoreStd. Bus58,000
No
- No service change between 2012 and September 2014
Productivity
0% 0% 0%
100%
0% 0% 0%
100%
0% 0% 0%
100%
0% 0% 0%
100%
0% 0%
23%
77%
0% 0%
46%
54%
0%
10%
20%
30%
40%
50%
60%
70%
80%
90%
100%
Top 25% Middle High 25% Middle Low 25% Bottom 25% Top 25% Middle High 25% Middle Low 25% Bottom 25%
Boardings Per Revenue Hour Capacity Utilization
Perc
ent o
f Rev
enue
Hou
rs w
ithin
gi
ven
Prod
uctiv
ity B
and
93
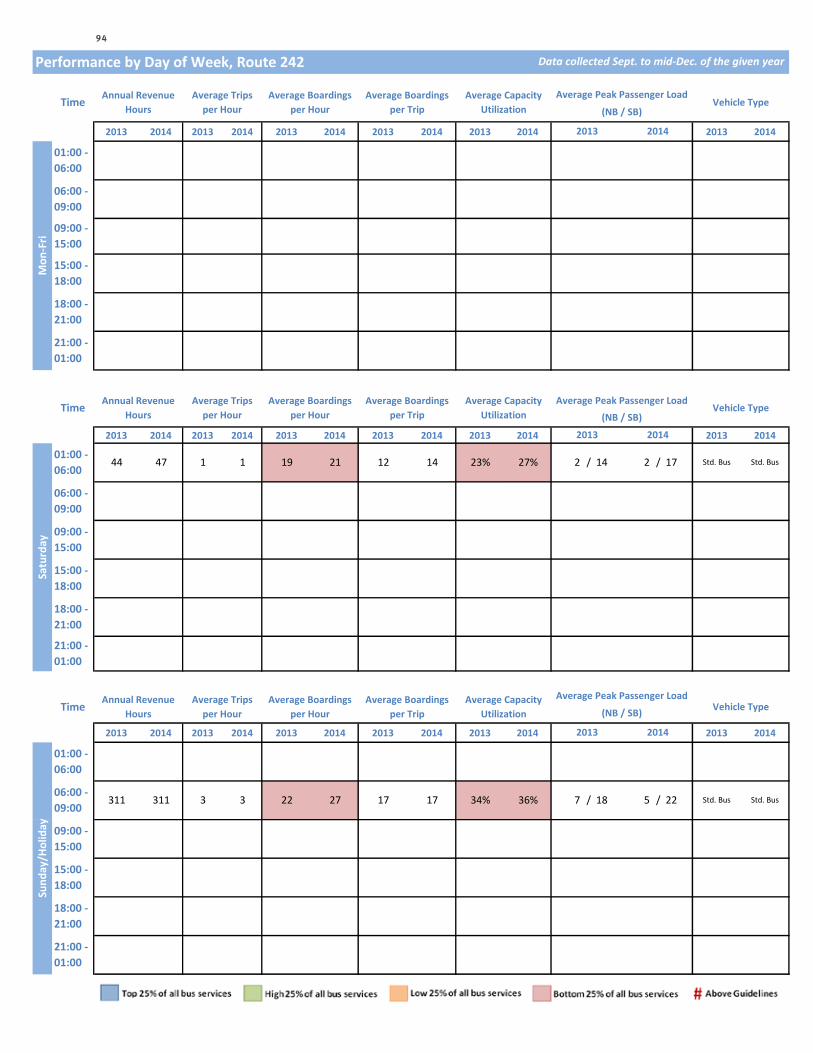
Performance by Day of Week, Route 242
2013 2014 2013 2014 2013 2014 2013 2014 2013 2014 2013 2014
2013 2014 2013 2014 2013 2014 2013 2014 2013 2014 2013 2014
2013 2014 2013 2014 2013 2014 2013 2014 2013 2014 2013 2014
Data collected Sept. to mid-Dec. of the given year
Time Annual Revenue Hours
Average Trips per Hour
Average Boardings per Hour
Average Boardings per Trip
Average Capacity Utilization
Average Peak Passenger LoadVehicle Type
06:00 - 09:00
(NB / SB)
2013 2014
Mon
-Fri
01:00 - 06:00
15:00 - 18:00
09:00 - 15:00
Time Annual Revenue Hours
Average Trips per Hour
Average Boardings per Hour
Average Boardings per Trip
Average Capacity Utilization
Average Peak Passenger LoadVehicle Type
(NB / SB)
21:00 - 01:00
18:00 - 21:00
Std. Bus Std. Bus
06:00 - 09:00
2013 2014
09:00 - 15:00
21:00 - 01:00
18:00 - 21:00
Satu
rday
01:00 - 06:00
44 47 1 1 19 21 12 14 23% 27% 2 / 14 2 / 17
15:00 - 18:00
2013 2014
Sund
ay/H
olid
ay
01:00 - 06:00
15:00 - 18:00
TimeAnnual Revenue
HoursAverage Trips
per HourAverage Boardings
per Hour Average Boardings
per TripAverage Capacity
Utilization
Average Peak Passenger LoadVehicle Type(NB / SB)
09:00 - 15:00
06:00 - 09:00
311 311 3 3 22 27 17 17 34% 36% 7 / 18 5 / 22 Std. Bus Std. Bus
18:00 - 21:00
21:00 - 01:00
94

246Key Characteristics
Subregion of Primary Service: Predominant Vehicle Type:
Population (People, 400m Buffer): Employment (Jobs, 400m Buffer): Walkability (intersection density):
Contributes to FTN (Y/N):
Cost & Performance2012 2013 2014 Rank (2014)
Annual Boardings: 1,150,000 1,159,000 1,149,000 58 of 212Annual Service Cost: $2,607,000 $2,652,000 $2,657,000 44 of 219
Annual Revenue Hours: 26,300 26,800 26,800 44 of 219Cost /Boarded Passenger: $2.27 $2.29 $2.31 127 of 212
Avg. Boardings / Rev. Hour: 44 43 43 109 of 212Avg. Daily Boardings (Mon-Fri): 3,750 3,700 3,700 59 of 210
Avg. Daily Boardings (Saturdays): 2,000 2,200 2,200 60 of 179Avg. Daily Boardings (Sun & Holidays): 1,600 1,900 1,800 60 of 171
Peak Passenger Load (Bi-directional Avg.): 15 14 14 128 of 212Peak Load Factor (Vehicle Occupancy): 0.30 0.29 0.29 144 of 212
Average Capacity Utilization (Passenger Turnover): 41% 40% 40% 140 of 212Annual Revenue Hours Above Guidelines (Crowding): 0% 0% 0% 1 of 212
Service Changes Since 2012
Route 246
North Shore
104,000High (0.3 int./hect.)
Std. Bus55,500
No
- Summer 2012, Discontinue short-turn #246 Vancouver trip that leaves Montroyal at Glencanyon at 8:06
Productivity
0%
11%
46% 43%
0% 4%
24%
72%
0% 0%
52% 48%
0% 0%
21%
79%
0% 5%
43%
52%
0% 4%
13%
83%
0%
10%
20%
30%
40%
50%
60%
70%
80%
90%
100%
Top 25% Middle High 25% Middle Low 25% Bottom 25% Top 25% Middle High 25% Middle Low 25% Bottom 25%
Boardings Per Revenue Hour Capacity Utilization
Perc
ent o
f Rev
enue
Hou
rs w
ithin
gi
ven
Prod
uctiv
ity B
and
95

Performance by Day of Week, Route 246
2013 2014 2013 2014 2013 2014 2013 2014 2013 2014 2013 2014
2013 2014 2013 2014 2013 2014 2013 2014 2013 2014 2013 2014
2013 2014 2013 2014 2013 2014 2013 2014 2013 2014 2013 2014
Data collected Sept. to mid-Dec. of the given year
Time Annual Revenue Hours
Average Trips per Hour
Average Boardings per Hour
Average Boardings per Trip
Average Capacity Utilization
Average Peak Passenger LoadVehicle Type
(EB / WB)
Std. Bus Std. Bus
06:00 - 09:00
4713 4730 4 4 41 48 25 27 51% 57% 11 / 28 14 / 29 Std. Bus
2013 2014
Mon
-Fri
01:00 - 06:00
592 592 2 2 12 10 3 3 7% 7% 4 / 3 5 / 2
18:00 - 21:00
2512
15:00 - 18:00
6183 6183 5 5 46 41 26 24 51% 49% 17 / 19 17 / 17 Std. Bus Std. Bus
Std. Bus
09:00 - 15:00
5642 5642 2 2 33 35 19 21 37% 41% 11 / 14 11 / 16 Std. Bus Std. Bus
Time Annual Revenue Hours
Average Trips per Hour
Average Boardings per Hour
Average Boardings per Trip
Average Capacity Utilization
Average Peak Passenger LoadVehicle Type
(EB / WB)
21:00 - 01:00
1530 1554 1 1 30 24 12 10 24% 21% 9 / 8 8 / 8 Std. Bus Std. Bus
9 / 14 11 / 13 Std. Bus Std. Bus2520 2 2 32 33 16 16 31% 32%
Std. Bus Std. Bus
06:00 - 09:00
442 442 2 2 17 20 8 9 17% 18% 6 / 6 7 / 6 Std. Bus Std. Bus
2013 2014
2 2 38 21
09:00 - 15:00
1086 1086 2 2 31 46 15 16 30% 32% 9 / 12 7 / 21 Std. Bus Std. Bus
Std. BusStd. Bus
19 3 / 18 Std. Bus Std. Bus
21:00 - 01:00
307 307 1 1 22 8 17% 6 / 5 / 11 Std. Bus
40% 13 / 11 19 / 2718:00 - 21:00
366 366 1 1 35 19
Satu
rday
01:00 - 06:00
61 61 1 1 2 3 1 1 1% 1% 1 / 1 / 0
41% 8 /15:00 - 18:00
575 575
2013 2014
Sund
ay/H
olid
ay
01:00 - 06:00
15:00 - 18:00
656 655 2
Std. Bus
TimeAnnual Revenue
HoursAverage Trips
per HourAverage Boardings
per Hour Average Boardings
per TripAverage Capacity
Utilization
Average Peak Passenger LoadVehicle Type(EB / WB)
09:00 - 15:00
1194 1194 2 2 36 37 18 20 36% 41% 11 / 14 11 / 19 Std. Bus Std. Bus
06:00 - 09:00
142 142 2 2 18 23 8 11 17% 23% 7 / 7 11 / 7 Std. Bus Std. Bus
13 6 / 18 Std. Bus Std. Bus
18:00 - 21:00
425 425 1 1 34 31 15 14 30% 29% 9 / 12 12 /
2 37 33 19 18 37% 36% 12 /
8 Std. Bus Std. Bus
21:00 - 01:00
364 364 1 1 23 20 7 7 15% 14% 4 / 7 4 / 7 Std. Bus Std. Bus
96
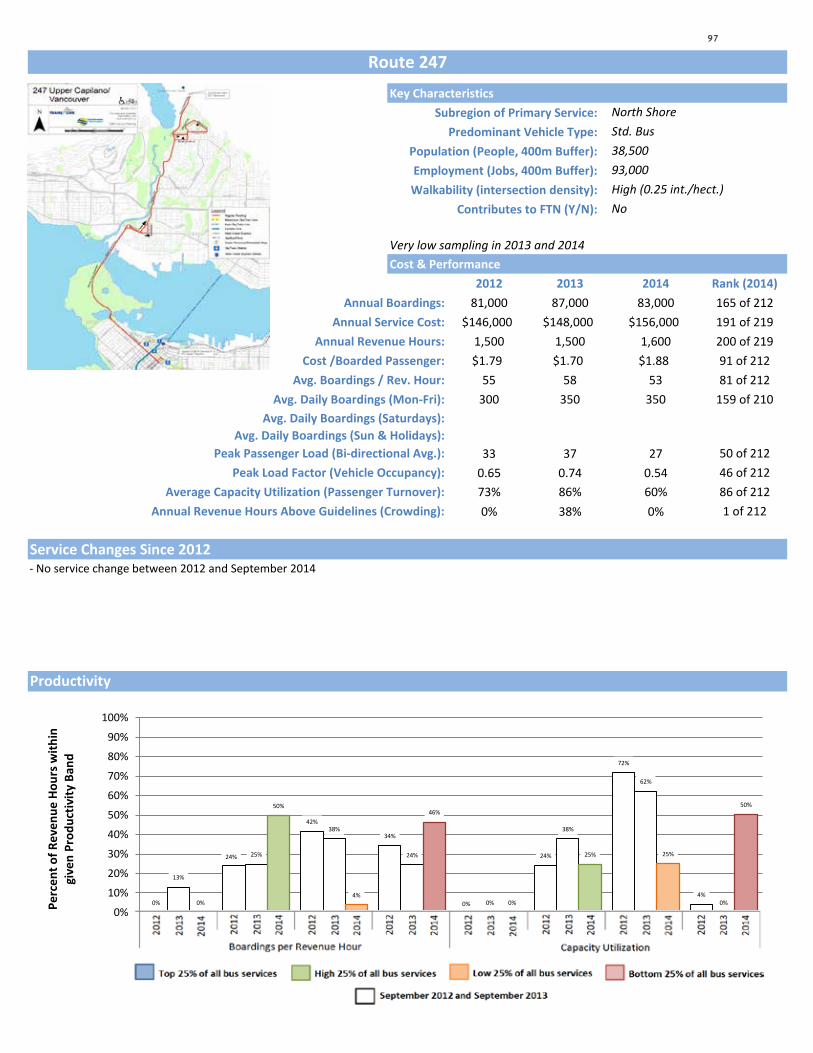
247Key Characteristics
Subregion of Primary Service: Predominant Vehicle Type:
Population (People, 400m Buffer): Employment (Jobs, 400m Buffer): Walkability (intersection density):
Contributes to FTN (Y/N):
Cost & Performance2012 2013 2014 Rank (2014)
Annual Boardings: 81,000 87,000 83,000 165 of 212Annual Service Cost: $146,000 $148,000 $156,000 191 of 219
Annual Revenue Hours: 1,500 1,500 1,600 200 of 219Cost /Boarded Passenger: $1.79 $1.70 $1.88 91 of 212
Avg. Boardings / Rev. Hour: 55 58 53 81 of 212Avg. Daily Boardings (Mon-Fri): 300 350 350 159 of 210
Avg. Daily Boardings (Saturdays): #VALUE! #VALUE! #VALUE!Avg. Daily Boardings (Sun & Holidays): #VALUE! #VALUE! #VALUE!
Peak Passenger Load (Bi-directional Avg.): 33 37 27 50 of 212Peak Load Factor (Vehicle Occupancy): 0.65 0.74 0.54 46 of 212
Average Capacity Utilization (Passenger Turnover): 73% 86% 60% 86 of 212Annual Revenue Hours Above Guidelines (Crowding): 0% 38% 0% 1 of 212
Service Changes Since 2012
Route 247
North Shore
93,000High (0.25 int./hect.)
Std. Bus38,500
Very low sampling in 2013 and 2014
No
- No service change between 2012 and September 2014
Productivity
0%
24%
42%
34%
0%
24%
72%
4%
13%
25%
38%
24%
0%
38%
62%
0% 0%
50%
4%
46%
0%
25% 25%
50%
0%
10%
20%
30%
40%
50%
60%
70%
80%
90%
100%
Top 25% Middle High 25% Middle Low 25% Bottom 25% Top 25% Middle High 25% Middle Low 25% Bottom 25%
Boardings Per Revenue Hour Capacity Utilization
Perc
ent o
f Rev
enue
Hou
rs w
ithin
gi
ven
Prod
uctiv
ity B
and
97

Performance by Day of Week, Route 247
2013 2014 2013 2014 2013 2014 2013 2014 2013 2014 2013 2014
2013 2014 2013 2014 2013 2014 2013 2014 2013 2014 2013 2014
2013 2014 2013 2014 2013 2014 2013 2014 2013 2014 2013 2014
Data collected Sept. to mid-Dec. of the given year
Time Annual Revenue Hours
Average Trips per Hour
Average Boardings per Hour
Average Boardings per Trip
Average Capacity Utilization
Average Peak Passenger LoadVehicle Type
(NB / SB)
06:00 - 09:00
688 729 1 1 76 58 54 36 110% 69% / 48 13 / 41 Std. Bus
2013 2014
Mon
-Fri
01:00 - 06:00
18:00 - 21:00
162
15:00 - 18:00
646 683 2 2 40 43 32 32 65% 65% 26 / 28 / Std. Bus Std. Bus
Std. Bus
09:00 - 15:00
Time Annual Revenue Hours
Average Trips per Hour
Average Boardings per Hour
Average Boardings per Trip
Average Capacity Utilization
Average Peak Passenger LoadVehicle Type
(NB / SB)
21:00 - 01:00
16 / Std. Bus Std. Bus167 1 1 26 18 35%
06:00 - 09:00
2013 2014
09:00 - 15:00
21:00 - 01:00
18:00 - 21:00
Satu
rday
01:00 - 06:00
15:00 - 18:00
2013 2014
Sund
ay/H
olid
ay
01:00 - 06:00
15:00 - 18:00
TimeAnnual Revenue
HoursAverage Trips
per HourAverage Boardings
per Hour Average Boardings
per TripAverage Capacity
Utilization
Average Peak Passenger LoadVehicle Type(NB / SB)
09:00 - 15:00
06:00 - 09:00
18:00 - 21:00
21:00 - 01:00
98
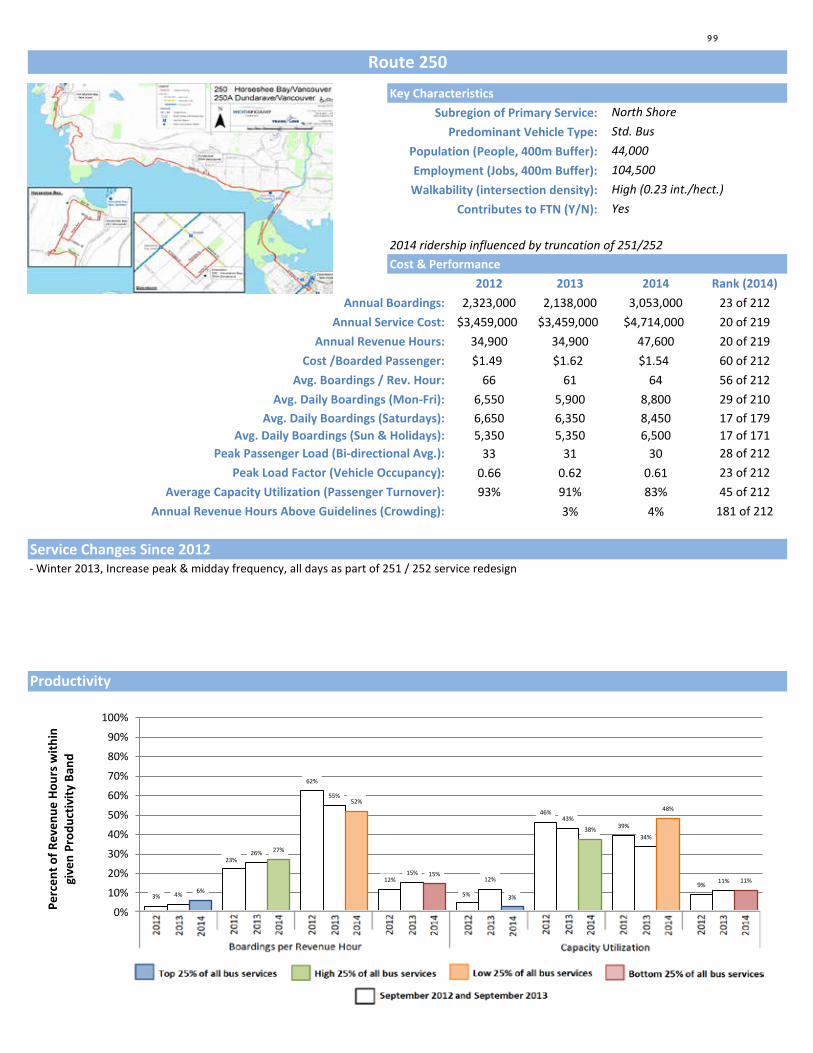
250Key Characteristics
Subregion of Primary Service: Predominant Vehicle Type:
Population (People, 400m Buffer): Employment (Jobs, 400m Buffer): Walkability (intersection density):
Contributes to FTN (Y/N):
Cost & Performance2012 2013 2014 Rank (2014)
Annual Boardings: 2,323,000 2,138,000 3,053,000 23 of 212Annual Service Cost: $3,459,000 $3,459,000 $4,714,000 20 of 219
Annual Revenue Hours: 34,900 34,900 47,600 20 of 219Cost /Boarded Passenger: $1.49 $1.62 $1.54 60 of 212
Avg. Boardings / Rev. Hour: 66 61 64 56 of 212Avg. Daily Boardings (Mon-Fri): 6,550 5,900 8,800 29 of 210
Avg. Daily Boardings (Saturdays): 6,650 6,350 8,450 17 of 179Avg. Daily Boardings (Sun & Holidays): 5,350 5,350 6,500 17 of 171
Peak Passenger Load (Bi-directional Avg.): 33 31 30 28 of 212Peak Load Factor (Vehicle Occupancy): 0.66 0.62 0.61 23 of 212
Average Capacity Utilization (Passenger Turnover): 93% 91% 83% 45 of 212Annual Revenue Hours Above Guidelines (Crowding): 3% 4% 181 of 212
Service Changes Since 2012
Route 250
North Shore
104,500High (0.23 int./hect.)
Std. Bus44,000
2014 ridership influenced by truncation of 251/252
Yes
- Winter 2013, Increase peak & midday frequency, all days as part of 251 / 252 service redesign
Productivity
3%
23%
62%
12%
5%
46%
39%
9% 4%
26%
55%
15% 12%
43%
34%
11% 6%
27%
52%
15%
3%
38%
48%
11%
0%
10%
20%
30%
40%
50%
60%
70%
80%
90%
100%
Top 25% Middle High 25% Middle Low 25% Bottom 25% Top 25% Middle High 25% Middle Low 25% Bottom 25%
Boardings Per Revenue Hour Capacity Utilization
Perc
ent o
f Rev
enue
Hou
rs w
ithin
gi
ven
Prod
uctiv
ity B
and
99

Performance by Day of Week, Route 250
2013 2014 2013 2014 2013 2014 2013 2014 2013 2014 2013 2014
2013 2014 2013 2014 2013 2014 2013 2014 2013 2014 2013 2014
2013 2014 2013 2014 2013 2014 2013 2014 2013 2014 2013 2014
Data collected Sept. to mid-Dec. of the given year
Time Annual Revenue Hours
Average Trips per Hour
Average Boardings per Hour
Average Boardings per Trip
Average Capacity Utilization
Average Peak Passenger LoadVehicle Type
(EB / WB)
Std. Bus Std. Bus
06:00 - 09:00
4479 6788 5 8 57 58 51 42 105% 84% 37 / 38 35 / 32 Std. Bus
2013 2014
Mon
-Fri
01:00 - 06:00
612 612 2 2 25 22 15 12 30% 25% 18 / 6 22 / 3
18:00 - 21:00
3913
15:00 - 18:00
4796 8075 4 8 63 59 59 48 117% 97% 45 / 30 39 / 31 Std. Bus Std. Bus
Std. Bus
09:00 - 15:00
8446 12012 5 6 54 51 47 41 95% 83% 29 / 32 29 / 28 Std. Bus Std. Bus
Time Annual Revenue Hours
Average Trips per Hour
Average Boardings per Hour
Average Boardings per Trip
Average Capacity Utilization
Average Peak Passenger LoadVehicle Type
(EB / WB)
21:00 - 01:00
2884 3176 3 3 43 41 33 30 65% 60% 22 / 27 21 / 27 Std. Bus Std. Bus
29 / 30 31 / 31 Std. Bus Std. Bus4688 4 5 50 49 42 40 85% 81%
Std. Bus Std. Bus
06:00 - 09:00
580 625 3 3 44 52 34 44 74% 90% 20 / 26 31 / 38 Std. Bus Std. Bus
2013 2014
5 6 79 89 58
09:00 - 15:00
1719 2339 4 6 56 71 48 51 95% 103% 33 / 32 34 / 38 Std. Bus Std. Bus
Std. BusStd. Bus
45 44 / 49 Std. Bus Std. Bus
21:00 - 01:00
570 571 3 2 43 36 71% 32 / 24 27 / 26 Std. Bus
74% 31 / 26 48 / 3518:00 - 21:00
815 935 5 5 41 37
Satu
rday
01:00 - 06:00
90 96 2 2 22 6 14 3 23% 7% 5 / 12 5 / 1
65 117% 132% 37 /15:00 - 18:00
907 1209
2013 2014
Sund
ay/H
olid
ay
01:00 - 06:00
24 33 1 1 11 4 7% / 3
15:00 - 18:00
1074 1544 5
Std. Bus
TimeAnnual Revenue
HoursAverage Trips
per HourAverage Boardings
per Hour Average Boardings
per TripAverage Capacity
Utilization
Average Peak Passenger LoadVehicle Type(EB / WB)
09:00 - 15:00
2101 2766 5 6 42 62 36 45 73% 90% 26 / 17 29 / 32 Std. Bus Std. Bus
Std. Bus Std. Bus
06:00 - 09:00
515 515 3 2 36 33 34 25 69% 58% 9 / 24 20 / 19 Std. Bus Std. Bus
36 35 / 31 Std. Bus Std. Bus
18:00 - 21:00
838 1010 4 5 48 45 38 35 79% 72% 32 / 26 30 /
7 85 64 67 45 136% 90% 51 /
23 Std. Bus Std. Bus
21:00 - 01:00
579 618 3 2 33 28 57% 26 / 17 29 / 30 Std. Bus Std. Bus
100

251Key Characteristics
Subregion of Primary Service: Predominant Vehicle Type:
Population (People, 400m Buffer): Employment (Jobs, 400m Buffer): Walkability (intersection density):
Contributes to FTN (Y/N):
Cost & Performance2012 2013 2014 Rank (2014)
Annual Boardings: 382,000 348,000 #VALUE!Annual Service Cost: $698,000 $698,000 $371,000 141 of 219
Annual Revenue Hours: 7,100 7,100 6,100 131 of 219Cost /Boarded Passenger: $1.83 $2.01
Avg. Boardings / Rev. Hour: 54 49Avg. Daily Boardings (Mon-Fri): 1,300 1,150 #VALUE!
Avg. Daily Boardings (Saturdays): 550 600 #VALUE!Avg. Daily Boardings (Sun & Holidays): 300 450 #VALUE!
Peak Passenger Load (Bi-directional Avg.): 23 28Peak Load Factor (Vehicle Occupancy): 0.46 0.55
Average Capacity Utilization (Passenger Turnover): 62% 79%Annual Revenue Hours Above Guidelines (Crowding): 5%
Service Changes Since 2012
Route 251
North Shore
103,500High (0.31 int./hect.)
Mini- Bus43,500
Ridership change potentially influenced by service truncation
No
- Winter 2013, Truncate service at Park Royal and convert vehicle from 40' bus to community shuttle and introduce two-way service
Productivity
17%
33%
20%
29%
0%
22%
42%
36% 31%
24% 27%
19%
3%
41% 38%
18%
0% 0% 0% 0% 0% 0% 0% 0%
0%
10%
20%
30%
40%
50%
60%
70%
80%
90%
100%
Top 25% Middle High 25% Middle Low 25% Bottom 25% Top 25% Middle High 25% Middle Low 25% Bottom 25%
Boardings Per Revenue Hour Capacity Utilization
Perc
ent o
f Rev
enue
Hou
rs w
ithin
gi
ven
Prod
uctiv
ity B
and
101

Performance by Day of Week, Route 251
2013 2014 2013 2014 2013 2014 2013 2014 2013 2014 2013 2014
2013 2014 2013 2014 2013 2014 2013 2014 2013 2014 2013 2014
2013 2014 2013 2014 2013 2014 2013 2014 2013 2014 2013 2014
Data collected Sept. to mid-Dec. of the given year
Time Annual Revenue Hours
Average Trips per Hour
Average Boardings per Hour
Average Boardings per Trip
Average Capacity Utilization
Average Peak Passenger LoadVehicle Type
(EB / WB)
06:00 - 09:00
1400 1154 2 2 36 / 36 Std. Bus
2013 2014
Mon
-Fri
01:00 - 06:00
18:00 - 21:00
359
15:00 - 18:00
1751 1200 2 2 79 46 94% 36 / 33 Std. Bus Mini- Bus
Mini- Bus
09:00 - 15:00
1950 1400 1 1 57 38 75% 22 / 27 Std. Bus Mini- Bus
Time Annual Revenue Hours
Average Trips per Hour
Average Boardings per Hour
Average Boardings per Trip
Average Capacity Utilization
Average Peak Passenger LoadVehicle Type
(EB / WB)
21:00 - 01:00
283 379 1 1 39 6 14% 4 / 11 Std. Bus Mini- Bus
11 / 9 Std. Bus Mini- Bus595 1 1 51 8 16%
06:00 - 09:00
72 63 1 1 51 30 60% / 21 Std. Bus Mini- Bus
2013 2014
1 1
09:00 - 15:00
401 252 1 1 50 34 67% 17 / 18 Std. Bus Mini- Bus
Mini- BusStd. Bus
Std. Bus Mini- Bus
21:00 - 01:00
59 104 1 1 30 6 13% 4 / 8 Std. Bus
8 / 1518:00 - 21:00
70 126 1 1
Satu
rday
01:00 - 06:00
57 /15:00 - 18:00
103 126
2013 2014
Sund
ay/H
olid
ay
01:00 - 06:00
15:00 - 18:00
91 150 1
Mini- Bus
TimeAnnual Revenue
HoursAverage Trips
per HourAverage Boardings
per Hour Average Boardings
per TripAverage Capacity
Utilization
Average Peak Passenger LoadVehicle Type(EB / WB)
09:00 - 15:00
364 275 1 1 48 33 65% 30 / 19 Std. Bus Mini- Bus
06:00 - 09:00
18 Std. Bus Mini- Bus
18:00 - 21:00
103 150 1 1 5 / 15
1 7 /
Std. Bus Mini- Bus
21:00 - 01:00
45 107 1 1 Std. Bus Mini- Bus
102

252Key Characteristics
Subregion of Primary Service: Predominant Vehicle Type:
Population (People, 400m Buffer): Employment (Jobs, 400m Buffer): Walkability (intersection density):
Contributes to FTN (Y/N):
Cost & Performance2012 2013 2014 Rank (2014)
Annual Boardings: 363,000 249,000 #VALUE!Annual Service Cost: $670,000 $670,000 $318,000 151 of 219
Annual Revenue Hours: 6,800 6,800 5,200 142 of 219Cost /Boarded Passenger: $1.85 $2.69
Avg. Boardings / Rev. Hour: 54 37Avg. Daily Boardings (Mon-Fri): 1,250 850 #VALUE!
Avg. Daily Boardings (Saturdays): 500 450 #VALUE!Avg. Daily Boardings (Sun & Holidays): 350 300 #VALUE!
Peak Passenger Load (Bi-directional Avg.): 23 20Peak Load Factor (Vehicle Occupancy): 0.45 0.41
Average Capacity Utilization (Passenger Turnover): 59% 58%Annual Revenue Hours Above Guidelines (Crowding): 0%
Service Changes Since 2012
Route 252
North Shore
103,000High (0.32 int./hect.)
Mini- Bus41,000
Ridership change potentially influenced by service truncation
No
- Winter 2013, Truncate service at Park Royal and convert vehicle from 40' bus to community shuttle and introduce two-way service
Productivity
22% 19%
31% 27%
0%
23%
33%
45%
5%
32% 28%
35%
0%
11%
46% 43%
0% 0% 0% 0% 0% 0% 0% 0%
0%
10%
20%
30%
40%
50%
60%
70%
80%
90%
100%
Top 25% Middle High 25% Middle Low 25% Bottom 25% Top 25% Middle High 25% Middle Low 25% Bottom 25%
Boardings Per Revenue Hour Capacity Utilization
Perc
ent o
f Rev
enue
Hou
rs w
ithin
gi
ven
Prod
uctiv
ity B
and
103

Performance by Day of Week, Route 252
2013 2014 2013 2014 2013 2014 2013 2014 2013 2014 2013 2014
2013 2014 2013 2014 2013 2014 2013 2014 2013 2014 2013 2014
2013 2014 2013 2014 2013 2014 2013 2014 2013 2014 2013 2014
Data collected Sept. to mid-Dec. of the given year
Time Annual Revenue Hours
Average Trips per Hour
Average Boardings per Hour
Average Boardings per Trip
Average Capacity Utilization
Average Peak Passenger LoadVehicle Type
(EB / WB)
06:00 - 09:00
1309 959 2 2 49 30 58% 25 / 22 Std. Bus
2013 2014
Mon
-Fri
01:00 - 06:00
18:00 - 21:00
562
15:00 - 18:00
1626 1020 2 2 68 42 87% 29 / 29 Std. Bus Mini- Bus
Mini- Bus
09:00 - 15:00
1800 1168 1 1 37 25 49% 15 / 17 Std. Bus Mini- Bus
Time Annual Revenue Hours
Average Trips per Hour
Average Boardings per Hour
Average Boardings per Trip
Average Capacity Utilization
Average Peak Passenger LoadVehicle Type
(EB / WB)
21:00 - 01:00
300 333 1 1 31 5 9% 3 / 6 Std. Bus Mini- Bus
8 / 23 Std. Bus Mini- Bus613 1 1
06:00 - 09:00
39 35 1 1 35 10 19% 12 / 5 Std. Bus Mini- Bus
2013 2014
1 1
09:00 - 15:00
370 210 1 1 19 / 21 Std. Bus Mini- Bus
Mini- BusStd. Bus
Std. Bus Mini- Bus
21:00 - 01:00
66 91 1 1 3 / 6 Std. Bus
18:00 - 21:00
66 105 1 1
Satu
rday
01:00 - 06:00
15:00 - 18:00
66 105
2013 2014
Sund
ay/H
olid
ay
01:00 - 06:00
15:00 - 18:00
81 126 1
Mini- Bus
TimeAnnual Revenue
HoursAverage Trips
per HourAverage Boardings
per Hour Average Boardings
per TripAverage Capacity
Utilization
Average Peak Passenger LoadVehicle Type(EB / WB)
09:00 - 15:00
376 210 1 1 15 / 16 Std. Bus Mini- Bus
06:00 - 09:00
8 Std. Bus Mini- Bus
18:00 - 21:00
81 126 1 1 29 7 12% 6 / 5
1 4 /
Std. Bus Mini- Bus
21:00 - 01:00
25 110 1 1 18 8 15% 11 / 3 Std. Bus Mini- Bus
104

253Key Characteristics
Subregion of Primary Service: Predominant Vehicle Type:
Population (People, 400m Buffer): Employment (Jobs, 400m Buffer): Walkability (intersection density):
Contributes to FTN (Y/N):
Cost & Performance2012 2013 2014 Rank (2014)
Annual Boardings: 413,000 363,000 418,000 106 of 212Annual Service Cost: $802,000 $802,000 $823,000 110 of 219
Annual Revenue Hours: 8,100 8,100 8,300 116 of 219Cost /Boarded Passenger: $1.94 $2.21 $1.97 99 of 212
Avg. Boardings / Rev. Hour: 51 45 50 86 of 212Avg. Daily Boardings (Mon-Fri): 1,600 1,350 1,600 102 of 210
Avg. Daily Boardings (Saturdays): 150 300 250 136 of 179Avg. Daily Boardings (Sun & Holidays): 100 100 150 136 of 171
Peak Passenger Load (Bi-directional Avg.): 24 26 21 89 of 212Peak Load Factor (Vehicle Occupancy): 0.49 0.51 0.42 92 of 212
Average Capacity Utilization (Passenger Turnover): 70% 71% 57% 99 of 212Annual Revenue Hours Above Guidelines (Crowding): 10% 0% 1 of 212
Service Changes Since 2012
Route 253
North Shore
103,500High (0.24 int./hect.)
Std. Bus41,500
No
- Information not available
Productivity
0%
28%
43%
30%
0%
45%
8%
48%
8%
25%
37%
30%
3%
40%
23%
34%
3%
14%
45%
37%
0%
44%
17%
39%
0%
10%
20%
30%
40%
50%
60%
70%
80%
90%
100%
Top 25% Middle High 25% Middle Low 25% Bottom 25% Top 25% Middle High 25% Middle Low 25% Bottom 25%
Boardings Per Revenue Hour Capacity Utilization
Perc
ent o
f Rev
enue
Hou
rs w
ithin
gi
ven
Prod
uctiv
ity B
and
105

Performance by Day of Week, Route 253
2013 2014 2013 2014 2013 2014 2013 2014 2013 2014 2013 2014
2013 2014 2013 2014 2013 2014 2013 2014 2013 2014 2013 2014
2013 2014 2013 2014 2013 2014 2013 2014 2013 2014 2013 2014
Data collected Sept. to mid-Dec. of the given year
Time Annual Revenue Hours
Average Trips per Hour
Average Boardings per Hour
Average Boardings per Trip
Average Capacity Utilization
Average Peak Passenger LoadVehicle Type
(EB / WB)
06:00 - 09:00
1354 1567 2 2 69 59 49 37 93% 75% 44 / 33 27 / 35 Std. Bus
2013 2014
Mon
-Fri
01:00 - 06:00
18:00 - 21:00
1213
15:00 - 18:00
2205 2301 1 2 55 53 42 42 86% 90% 27 / 29 34 / 25 Std. Bus Std. Bus
Std. Bus
09:00 - 15:00
2087 2004 1 1 35 22 48% 17 / 15 11 / 16 Std. Bus Std. Bus
Time Annual Revenue Hours
Average Trips per Hour
Average Boardings per Hour
Average Boardings per Trip
Average Capacity Utilization
Average Peak Passenger LoadVehicle Type
(EB / WB)
21:00 - 01:00
183 183 1 1 13 33 5 11 9% 21% 4 / 3 7 / 14 Std. Bus Std. Bus
26 / 26 32 / 23 Std. Bus Std. Bus1213 2 2 55 47 27 32 76% 75%
06:00 - 09:00
75 75 1 1 Std. Bus Std. Bus
2013 2014
1 1
09:00 - 15:00
266 252 1 1 12 / 8 Std. Bus Std. Bus
Std. BusStd. Bus
9 / 6 Std. Bus Std. Bus
21:00 - 01:00
37 37 1 1 Std. Bus
12 23% 8 / 6 7 / 1118:00 - 21:00
169 169 2 2 25
Satu
rday
01:00 - 06:00
15:00 - 18:00
126 126
2013 2014
Sund
ay/H
olid
ay
01:00 - 06:00
15:00 - 18:00
50 50 1
Std. Bus
TimeAnnual Revenue
HoursAverage Trips
per HourAverage Boardings
per Hour Average Boardings
per TripAverage Capacity
Utilization
Average Peak Passenger LoadVehicle Type(EB / WB)
09:00 - 15:00
145 145 1 1 / 6 Std. Bus Std. Bus
06:00 - 09:00
45 45 1 1 16 7 14% 6 / 8 Std. Bus Std. Bus
18 Std. Bus Std. Bus
18:00 - 21:00
99 99 1 1 5 /
1 35 15 29% 7 /
14 Std. Bus Std. Bus
21:00 - 01:00
46 48 1 1 12 4 8% / 4 Std. Bus Std. Bus
106

254Key Characteristics
Subregion of Primary Service: Predominant Vehicle Type:
Population (People, 400m Buffer): Employment (Jobs, 400m Buffer): Walkability (intersection density):
Contributes to FTN (Y/N):
Cost & Performance2012 2013 2014 Rank (2014)
Annual Boardings: 141,000 101,000 198,000 130 of 212Annual Service Cost: $498,000 $498,000 $514,000 124 of 219
Annual Revenue Hours: 5,000 5,000 5,200 145 of 219Cost /Boarded Passenger: $3.53 $4.95 $2.60 136 of 212
Avg. Boardings / Rev. Hour: 28 20 38 118 of 212Avg. Daily Boardings (Mon-Fri): 500 350 700 129 of 210
Avg. Daily Boardings (Saturdays): 100 150 200 147 of 179Avg. Daily Boardings (Sun & Holidays): 100 50 150 144 of 171
Peak Passenger Load (Bi-directional Avg.): 17 23 17 115 of 212Peak Load Factor (Vehicle Occupancy): 0.35 0.46 0.34 127 of 212
Average Capacity Utilization (Passenger Turnover): 44% 57% 40% 143 of 212Annual Revenue Hours Above Guidelines (Crowding): 0% 0% 1 of 212
Service Changes Since 2012
Route 254
North Shore
100,500High (0.23 int./hect.)
Std. Bus39,000
Very low sampling in 2012, 2013 and 2014
No
- Information not available
Productivity
10% 10%
30%
50%
0%
10%
25%
65%
7%
22%
42%
30%
0%
21% 19%
60%
17%
5%
41% 36%
0% 4%
38%
58%
0%
10%
20%
30%
40%
50%
60%
70%
80%
90%
100%
Top 25% Middle High 25% Middle Low 25% Bottom 25% Top 25% Middle High 25% Middle Low 25% Bottom 25%
Boardings Per Revenue Hour Capacity Utilization
Perc
ent o
f Rev
enue
Hou
rs w
ithin
gi
ven
Prod
uctiv
ity B
and
107

Performance by Day of Week, Route 254
2013 2014 2013 2014 2013 2014 2013 2014 2013 2014 2013 2014
2013 2014 2013 2014 2013 2014 2013 2014 2013 2014 2013 2014
2013 2014 2013 2014 2013 2014 2013 2014 2013 2014 2013 2014
Data collected Sept. to mid-Dec. of the given year
Time Annual Revenue Hours
Average Trips per Hour
Average Boardings per Hour
Average Boardings per Trip
Average Capacity Utilization
Average Peak Passenger LoadVehicle Type
(NB / SB)
06:00 - 09:00
1062 1154 1 2 79 91 34 28 74% 61% 31 / 27 23 / 29 Std. Bus
2013 2014
Mon
-Fri
01:00 - 06:00
18:00 - 21:00
396
15:00 - 18:00
1550 1591 2 3 47 44 28 24 59% 50% 22 / 23 19 / 22 Std. Bus Std. Bus
Std. Bus
09:00 - 15:00
933 1012 1 1 41 17 34% 17 / 17 / 14 Std. Bus Std. Bus
Time Annual Revenue Hours
Average Trips per Hour
Average Boardings per Hour
Average Boardings per Trip
Average Capacity Utilization
Average Peak Passenger LoadVehicle Type
(NB / SB)
21:00 - 01:00
301 301 1 1 15 7 13% 9 / 6 11 / Std. Bus Std. Bus
16 / 7 14 / 6 Std. Bus Std. Bus338 2 2 24 24 10 9 20% 19%
06:00 - 09:00
56 56 1 1 25 34 12 15 23% 29% 9 / 9 16 / 4 Std. Bus Std. Bus
2013 2014
1 1 42
09:00 - 15:00
194 194 1 1 28 27 12 13 24% 24% 8 / 15 11 / 12 Std. Bus Std. Bus
Std. BusStd. Bus
21 / 14 Std. Bus Std. Bus
21:00 - 01:00
62 62 1 1 12 5 10% 4 / Std. Bus
15 / 818:00 - 21:00
70 70 2 2
Satu
rday
01:00 - 06:00
17 34%15:00 - 18:00
101 101
2013 2014
Sund
ay/H
olid
ay
01:00 - 06:00
15:00 - 18:00
78 78 1
Std. Bus
TimeAnnual Revenue
HoursAverage Trips
per HourAverage Boardings
per Hour Average Boardings
per TripAverage Capacity
Utilization
Average Peak Passenger LoadVehicle Type(NB / SB)
09:00 - 15:00
117 117 1 1 19 / 29 Std. Bus Std. Bus
06:00 - 09:00
30 / 5 Std. Bus Std. Bus
18:00 - 21:00
38 38 1 1 86 37 74% 34 /
1
Std. Bus Std. Bus
21:00 - 01:00
75 76 1 1 26 11 22% 9 / Std. Bus Std. Bus
108

255Key Characteristics
Subregion of Primary Service: Predominant Vehicle Type:
Population (People, 400m Buffer): Employment (Jobs, 400m Buffer): Walkability (intersection density):
Contributes to FTN (Y/N):
Cost & Performance2012 2013 2014 Rank (2014)
Annual Boardings: 1,190,000 1,145,000 1,159,000 57 of 212Annual Service Cost: $1,796,000 $1,796,000 $1,940,000 57 of 219
Annual Revenue Hours: 18,100 18,100 19,600 59 of 219Cost /Boarded Passenger: $1.51 $1.57 $1.67 75 of 212
Avg. Boardings / Rev. Hour: 66 63 59 68 of 212Avg. Daily Boardings (Mon-Fri): 3,750 3,650 3,750 57 of 210
Avg. Daily Boardings (Saturdays): 2,500 2,300 2,300 59 of 179Avg. Daily Boardings (Sun & Holidays): 1,800 1,750 1,700 64 of 171
Peak Passenger Load (Bi-directional Avg.): 32 26 24 74 of 212Peak Load Factor (Vehicle Occupancy): 0.64 0.52 0.49 70 of 212
Average Capacity Utilization (Passenger Turnover): 119% 106% 89% 36 of 212Annual Revenue Hours Above Guidelines (Crowding): 0% 1% 156 of 212
Service Changes Since 2012
Route 255
North Shore
29,000High (0.28 int./hect.)
Std. Bus41,500
No
- Information not available
Productivity
16%
39%
30%
15%
32%
45%
15%
8%
0%
43% 39%
18% 23%
48%
17%
11% 6%
36% 35%
23% 19%
40%
26%
14%
0%
10%
20%
30%
40%
50%
60%
70%
80%
90%
100%
Top 25% Middle High 25% Middle Low 25% Bottom 25% Top 25% Middle High 25% Middle Low 25% Bottom 25%
Boardings Per Revenue Hour Capacity Utilization
Perc
ent o
f Rev
enue
Hou
rs w
ithin
gi
ven
Prod
uctiv
ity B
and
109

Performance by Day of Week, Route 255
2013 2014 2013 2014 2013 2014 2013 2014 2013 2014 2013 2014
2013 2014 2013 2014 2013 2014 2013 2014 2013 2014 2013 2014
2013 2014 2013 2014 2013 2014 2013 2014 2013 2014 2013 2014
Data collected Sept. to mid-Dec. of the given year
Time Annual Revenue Hours
Average Trips per Hour
Average Boardings per Hour
Average Boardings per Trip
Average Capacity Utilization
Average Peak Passenger LoadVehicle Type
(EB / WB)
06:00 - 09:00
2092 2317 2 2 56 55 50 52 109% 108% 26 / 33 25 / 37 Std. Bus
2013 2014
Mon
-Fri
01:00 - 06:00
18:00 - 21:00
2301
15:00 - 18:00
4283 4892 4 4 61 55 60 50 120% 101% 30 / 26 33 / 24 Std. Bus Std. Bus
Std. Bus
09:00 - 15:00
4879 4840 2 2 68 68 67 67 133% 134% 29 / 33 31 / 35 Std. Bus Std. Bus
Time Annual Revenue Hours
Average Trips per Hour
Average Boardings per Hour
Average Boardings per Trip
Average Capacity Utilization
Average Peak Passenger LoadVehicle Type
(EB / WB)
21:00 - 01:00
388 646 2 2 41 27 30 21 60% 43% 30 / 9 19 / 11 Std. Bus Std. Bus
15 / 10 32 / 14 Std. Bus Std. Bus2517 2 2 31 42 30 36 57% 72%
06:00 - 09:00
238 285 2 2 24 18 45% 5 / 15 14 / Std. Bus Std. Bus
2013 2014
2 2 54 52
09:00 - 15:00
1013 1011 2 2 48 55 47 55 95% 111% 19 / 26 23 / 43 Std. Bus Std. Bus
Std. BusStd. Bus
21 / 38 Std. Bus Std. Bus
21:00 - 01:00
66% 25 / 918:00 - 21:00
395 456 2 2 36 31
Satu
rday
01:00 - 06:00
105% 30 /15:00 - 18:00
522 519
2013 2014
Sund
ay/H
olid
ay
01:00 - 06:00
15:00 - 18:00
616 618 2
TimeAnnual Revenue
HoursAverage Trips
per HourAverage Boardings
per Hour Average Boardings
per TripAverage Capacity
Utilization
Average Peak Passenger LoadVehicle Type(EB / WB)
09:00 - 15:00
1040 1067 2 2 45 40 41 39 87% 79% 21 / 27 20 / 32 Std. Bus Std. Bus
06:00 - 09:00
22 32 / 17 Std. Bus Std. Bus
18:00 - 21:00
374 431 2 2 33 27 55% 23 / 10 16 /
2 50 33 49 33 98% 66% 32 /
Std. Bus Std. Bus
21:00 - 01:00
110

256Key Characteristics
Subregion of Primary Service: Predominant Vehicle Type:
Population (People, 400m Buffer): Employment (Jobs, 400m Buffer): Walkability (intersection density):
Contributes to FTN (Y/N):
Cost & Performance2012 2013 2014 Rank (2014)
Annual Boardings: 83,000 76,000 #VALUE!Annual Service Cost: $267,000 $267,000 $274,000 163 of 219
Annual Revenue Hours: 4,400 4,400 4,500 154 of 219Cost /Boarded Passenger: $3.22 $3.51
Avg. Boardings / Rev. Hour: 19 17Avg. Daily Boardings (Mon-Fri): 250 250 #VALUE!
Avg. Daily Boardings (Saturdays): 250 200 #VALUE!Avg. Daily Boardings (Sun & Holidays): 100 150 #VALUE!
Peak Passenger Load (Bi-directional Avg.): 5Peak Load Factor (Vehicle Occupancy): 0.23
Average Capacity Utilization (Passenger Turnover): 36%Annual Revenue Hours Above Guidelines (Crowding):
Service Changes Since 2012
Route 256
North Shore
10,000High (0.25 int./hect.)
Mini- Bus15,500
Very low sampling in 2012, 2013 and 2014
No
- Information not available
Productivity
0% 0%
9%
91%
0% 0%
18%
82%
0% 0% 0% 0% 0% 0% 0% 0%
0%
10%
20%
30%
40%
50%
60%
70%
80%
90%
100%
Top 25% Middle High 25% Middle Low 25% Bottom 25% Top 25% Middle High 25% Middle Low 25% Bottom 25%
Boardings Per Revenue Hour Capacity Utilization
Perc
ent o
f Rev
enue
Hou
rs w
ithin
gi
ven
Prod
uctiv
ity B
and
111

Performance by Day of Week, Route 256
2013 2014 2013 2014 2013 2014 2013 2014 2013 2014 2013 2014
2013 2014 2013 2014 2013 2014 2013 2014 2013 2014 2013 2014
2013 2014 2013 2014 2013 2014 2013 2014 2013 2014 2013 2014
Data collected Sept. to mid-Dec. of the given year
Time Annual Revenue Hours
Average Trips per Hour
Average Boardings per Hour
Average Boardings per Trip
Average Capacity Utilization
Average Peak Passenger LoadVehicle Type
(NB / SB)
06:00 - 09:00
721 721 1 1 Mini- Bus
2013 2014
Mon
-Fri
01:00 - 06:00
18:00 - 21:00
442
15:00 - 18:00
721 721 1 1 Mini- Bus Mini- Bus
Mini- Bus
09:00 - 15:00
1268 1205 1 1 Mini- Bus Mini- Bus
Time Annual Revenue Hours
Average Trips per Hour
Average Boardings per Hour
Average Boardings per Trip
Average Capacity Utilization
Average Peak Passenger LoadVehicle Type
(NB / SB)
21:00 - 01:00
0 142 1 1 Mini- Bus Mini- Bus
Mini- Bus Mini- Bus563 1 1
06:00 - 09:00
90 84 1 1 Mini- Bus Mini- Bus
2013 2014
1 1
09:00 - 15:00
248 226 1 1 Mini- Bus Mini- Bus
Mini- BusMini- Bus
Mini- Bus Mini- Bus
21:00 - 01:00
34 29 1 1 Mini- Bus
18:00 - 21:00
124 113 1 1
Satu
rday
01:00 - 06:00
15:00 - 18:00
124 113
2013 2014
Sund
ay/H
olid
ay
01:00 - 06:00
15:00 - 18:00
151 138 1
Mini- Bus
TimeAnnual Revenue
HoursAverage Trips
per HourAverage Boardings
per Hour Average Boardings
per TripAverage Capacity
Utilization
Average Peak Passenger LoadVehicle Type(NB / SB)
09:00 - 15:00
302 276 1 1 Mini- Bus Mini- Bus
06:00 - 09:00
Mini- Bus Mini- Bus
18:00 - 21:00
165 153 1 1
1
Mini- Bus Mini- Bus
21:00 - 01:00
112
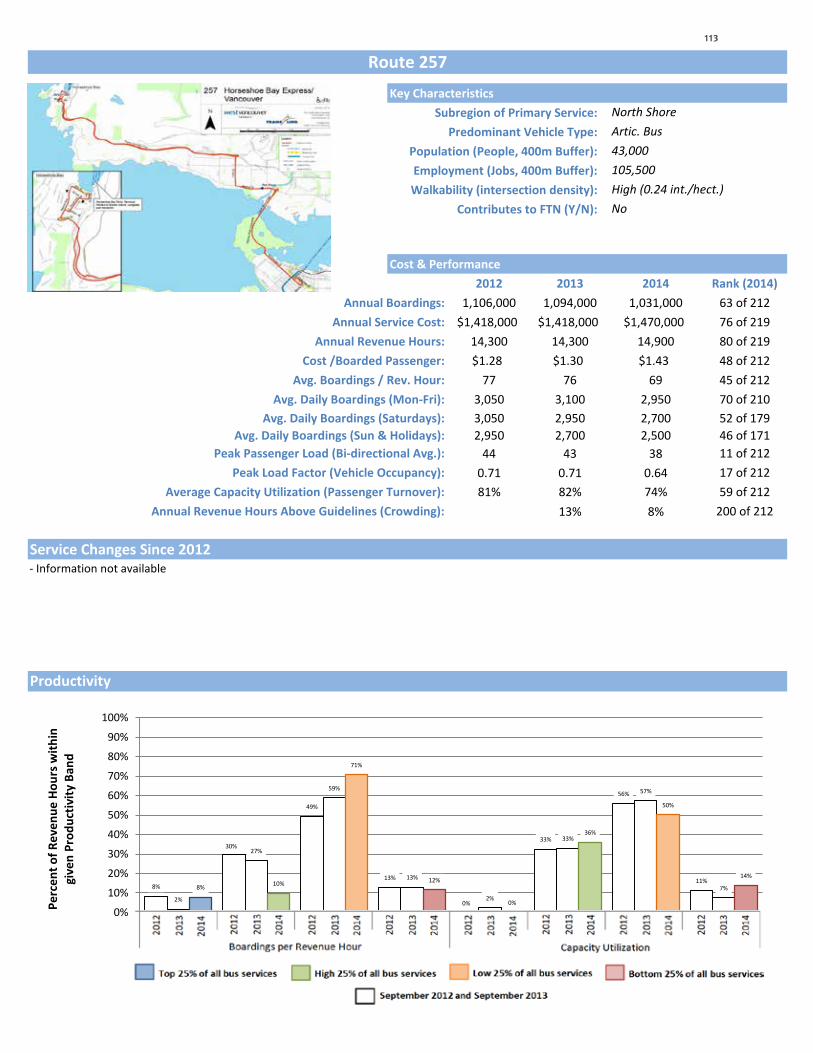
257Key Characteristics
Subregion of Primary Service: Predominant Vehicle Type:
Population (People, 400m Buffer): Employment (Jobs, 400m Buffer): Walkability (intersection density):
Contributes to FTN (Y/N):
Cost & Performance2012 2013 2014 Rank (2014)
Annual Boardings: 1,106,000 1,094,000 1,031,000 63 of 212Annual Service Cost: $1,418,000 $1,418,000 $1,470,000 76 of 219
Annual Revenue Hours: 14,300 14,300 14,900 80 of 219Cost /Boarded Passenger: $1.28 $1.30 $1.43 48 of 212
Avg. Boardings / Rev. Hour: 77 76 69 45 of 212Avg. Daily Boardings (Mon-Fri): 3,050 3,100 2,950 70 of 210
Avg. Daily Boardings (Saturdays): 3,050 2,950 2,700 52 of 179Avg. Daily Boardings (Sun & Holidays): 2,950 2,700 2,500 46 of 171
Peak Passenger Load (Bi-directional Avg.): 44 43 38 11 of 212Peak Load Factor (Vehicle Occupancy): 0.71 0.71 0.64 17 of 212
Average Capacity Utilization (Passenger Turnover): 81% 82% 74% 59 of 212Annual Revenue Hours Above Guidelines (Crowding): 13% 8% 200 of 212
Service Changes Since 2012
Route 257
North Shore
105,500High (0.24 int./hect.)
Artic. Bus43,000
No
- Information not available
Productivity
8%
30%
49%
13%
0%
33%
56%
11%
2%
27%
59%
13%
2%
33%
57%
7% 8% 10%
71%
12%
0%
36%
50%
14%
0%
10%
20%
30%
40%
50%
60%
70%
80%
90%
100%
Top 25% Middle High 25% Middle Low 25% Bottom 25% Top 25% Middle High 25% Middle Low 25% Bottom 25%
Boardings Per Revenue Hour Capacity Utilization
Perc
ent o
f Rev
enue
Hou
rs w
ithin
gi
ven
Prod
uctiv
ity B
and
113

Performance by Day of Week, Route 257
2013 2014 2013 2014 2013 2014 2013 2014 2013 2014 2013 2014
2013 2014 2013 2014 2013 2014 2013 2014 2013 2014 2013 2014
2013 2014 2013 2014 2013 2014 2013 2014 2013 2014 2013 2014
Data collected Sept. to mid-Dec. of the given year
Time Annual Revenue Hours
Average Trips per Hour
Average Boardings per Hour
Average Boardings per Trip
Average Capacity Utilization
Average Peak Passenger LoadVehicle Type
(EB / WB)
06:00 - 09:00
1642 1634 2 2 46 41 43 36 78% 62% 43 / 34 38 / 27 Std. Bus & Artic. Bus
2013 2014
Mon
-Fri
01:00 - 06:00
18:00 - 21:00
1209
15:00 - 18:00
3292 3292 4 4 52 59 45 54 83% 99% 33 / 45 38 / 54 Std. Bus & Artic. Bus
Artic. Bus & Std. Bus
Artic. Bus & Std. Bus
09:00 - 15:00
4335 4402 2 2 56 52 53 50 88% 83% 52 / 42 48 / 37 Std. Bus & Artic. Bus
Artic. Bus & Std. Bus
Time Annual Revenue Hours
Average Trips per Hour
Average Boardings per Hour
Average Boardings per Trip
Average Capacity Utilization
Average Peak Passenger LoadVehicle Type
(EB / WB)
21:00 - 01:00
0 92 1 1 16 8 10% / 7 Artic. Bus Artic. Bus
41 / 35 37 / 33 Artic. Bus Artic. Bus1358 2 2 47 44 40 38 64% 58%
06:00 - 09:00
211 211 2 2 54 50 52 50 76% 66% 32 / 62 37 / 49 Std. Bus & Artic. Bus
Artic. Bus
2013 2014
2 2 57 56
09:00 - 15:00
894 894 3 2 45 51 43 52 70% 81% 36 / 38 44 / 42 Std. Bus & Artic. Bus
Artic. Bus & Std. Bus
Artic. BusArtic. Bus
45 39 / 70 Artic. Bus Artic. Bus
21:00 - 01:00
33 52 1 2 36 22 29% 19 / Artic. Bus
46 62% 59% 39 / 38 42 / 3618:00 - 21:00
248 285 2 2 48 50 46
Satu
rday
01:00 - 06:00
84% 50 /15:00 - 18:00
357 357
2013 2014
Sund
ay/H
olid
ay
01:00 - 06:00
15:00 - 18:00
432 477 2
Artic. Bus
TimeAnnual Revenue
HoursAverage Trips
per HourAverage Boardings
per Hour Average Boardings
per TripAverage Capacity
Utilization
Average Peak Passenger LoadVehicle Type(EB / WB)
09:00 - 15:00
1081 1081 3 2 38 39 60% 41 / 47 27 / 40 Artic. BusArtic. Bus &
Std. Bus
06:00 - 09:00
255 255 2 2 38 28 43 28 56% 40% 15 / 41 17 / 32 Artic. BusArtic. Bus &
Std. Bus
67 50 / 48 Artic. Bus Artic. Bus
18:00 - 21:00
300 423 2 2 47 41 58% 40 / 39 49 /
2 79 63 71 58 108% 88% 55 /
24 Artic. Bus Artic. Bus
21:00 - 01:00
40 42 1 1 Artic. Bus Artic. Bus
114
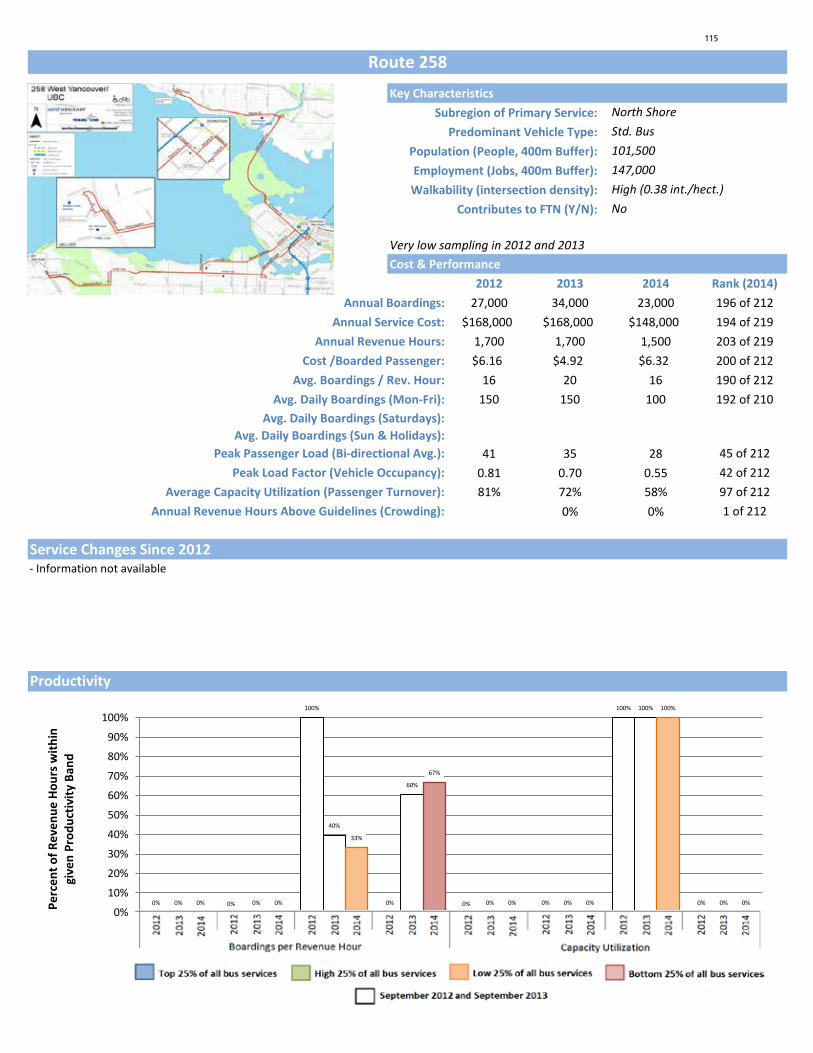
258Key Characteristics
Subregion of Primary Service: Predominant Vehicle Type:
Population (People, 400m Buffer): Employment (Jobs, 400m Buffer): Walkability (intersection density):
Contributes to FTN (Y/N):
Cost & Performance2012 2013 2014 Rank (2014)
Annual Boardings: 27,000 34,000 23,000 196 of 212Annual Service Cost: $168,000 $168,000 $148,000 194 of 219
Annual Revenue Hours: 1,700 1,700 1,500 203 of 219Cost /Boarded Passenger: $6.16 $4.92 $6.32 200 of 212
Avg. Boardings / Rev. Hour: 16 20 16 190 of 212Avg. Daily Boardings (Mon-Fri): 150 150 100 192 of 210
Avg. Daily Boardings (Saturdays): #VALUE! #VALUE! #VALUE!Avg. Daily Boardings (Sun & Holidays): #VALUE! #VALUE! #VALUE!
Peak Passenger Load (Bi-directional Avg.): 41 35 28 45 of 212Peak Load Factor (Vehicle Occupancy): 0.81 0.70 0.55 42 of 212
Average Capacity Utilization (Passenger Turnover): 81% 72% 58% 97 of 212Annual Revenue Hours Above Guidelines (Crowding): 0% 0% 1 of 212
Service Changes Since 2012
Route 258
North Shore
147,000High (0.38 int./hect.)
Std. Bus101,500
Very low sampling in 2012 and 2013
No
- Information not available
Productivity
0% 0%
100%
0% 0% 0%
100%
0% 0% 0%
40%
60%
0% 0%
100%
0% 0% 0%
33%
67%
0% 0%
100%
0%
0%
10%
20%
30%
40%
50%
60%
70%
80%
90%
100%
Top 25% Middle High 25% Middle Low 25% Bottom 25% Top 25% Middle High 25% Middle Low 25% Bottom 25%
Boardings Per Revenue Hour Capacity Utilization
Perc
ent o
f Rev
enue
Hou
rs w
ithin
gi
ven
Prod
uctiv
ity B
and
115

Performance by Day of Week, Route 258
2013 2014 2013 2014 2013 2014 2013 2014 2013 2014 2013 2014
2013 2014 2013 2014 2013 2014 2013 2014 2013 2014 2013 2014
2013 2014 2013 2014 2013 2014 2013 2014 2013 2014 2013 2014
Data collected Sept. to mid-Dec. of the given year
Time Annual Revenue Hours
Average Trips per Hour
Average Boardings per Hour
Average Boardings per Trip
Average Capacity Utilization
Average Peak Passenger LoadVehicle Type
(NB / SB)
06:00 - 09:00
1021 821 2 2 29 41 36 38 72% 75% / 35 / 36 Std. Bus
2013 2014
Mon
-Fri
01:00 - 06:00
18:00 - 21:00
15:00 - 18:00
276 276 1 1 Std. Bus Std. Bus
Std. Bus
09:00 - 15:00
404 396 2 2 37 32 63% / 29 Std. Bus Std. Bus
Time Annual Revenue Hours
Average Trips per Hour
Average Boardings per Hour
Average Boardings per Trip
Average Capacity Utilization
Average Peak Passenger LoadVehicle Type
(NB / SB)
21:00 - 01:00
06:00 - 09:00
2013 2014
09:00 - 15:00
21:00 - 01:00
18:00 - 21:00
Satu
rday
01:00 - 06:00
15:00 - 18:00
2013 2014
Sund
ay/H
olid
ay
01:00 - 06:00
15:00 - 18:00
TimeAnnual Revenue
HoursAverage Trips
per HourAverage Boardings
per Hour Average Boardings
per TripAverage Capacity
Utilization
Average Peak Passenger LoadVehicle Type(NB / SB)
09:00 - 15:00
06:00 - 09:00
18:00 - 21:00
21:00 - 01:00
116

259Key Characteristics
Subregion of Primary Service: Predominant Vehicle Type:
Population (People, 400m Buffer): Employment (Jobs, 400m Buffer): Walkability (intersection density):
Contributes to FTN (Y/N):
Cost & Performance2012 2013 2014 Rank (2014)
Annual Boardings: 2,000 1,000 3,000 212 of 212Annual Service Cost: $50,000 $50,000 $50,000 216 of 219
Annual Revenue Hours: 500 500 500 216 of 219Cost /Boarded Passenger: $29.86 $34.73 $19.43 212 of 212
Avg. Boardings / Rev. Hour: 3 3 5 211 of 212Avg. Daily Boardings (Mon-Fri): 10 10 10 210 of 210
Avg. Daily Boardings (Saturdays): #VALUE! #VALUE! #VALUE!Avg. Daily Boardings (Sun & Holidays): #VALUE! #VALUE! #VALUE!
Peak Passenger Load (Bi-directional Avg.): 6 10 3 188 of 212Peak Load Factor (Vehicle Occupancy): 0.12 0.20 0.07 204 of 212
Average Capacity Utilization (Passenger Turnover): 11% 15% 5% 209 of 212Annual Revenue Hours Above Guidelines (Crowding): 0% 0% 1 of 212
Service Changes Since 2012
Route 259
North Shore
1,000Low (0.07 int./hect.)
Std. Bus2,000
Very low sampling in 2012, 2013 and 2014
No
- Information not available
Productivity
0% 0%
20%
80%
0% 0% 0%
100%
0% 0%
35%
65%
0% 0% 0%
100%
0%
21%
0%
79%
0% 0% 0%
100%
0%
10%
20%
30%
40%
50%
60%
70%
80%
90%
100%
Top 25% Middle High 25% Middle Low 25% Bottom 25% Top 25% Middle High 25% Middle Low 25% Bottom 25%
Boardings Per Revenue Hour Capacity Utilization
Perc
ent o
f Rev
enue
Hou
rs w
ithin
gi
ven
Prod
uctiv
ity B
and
117
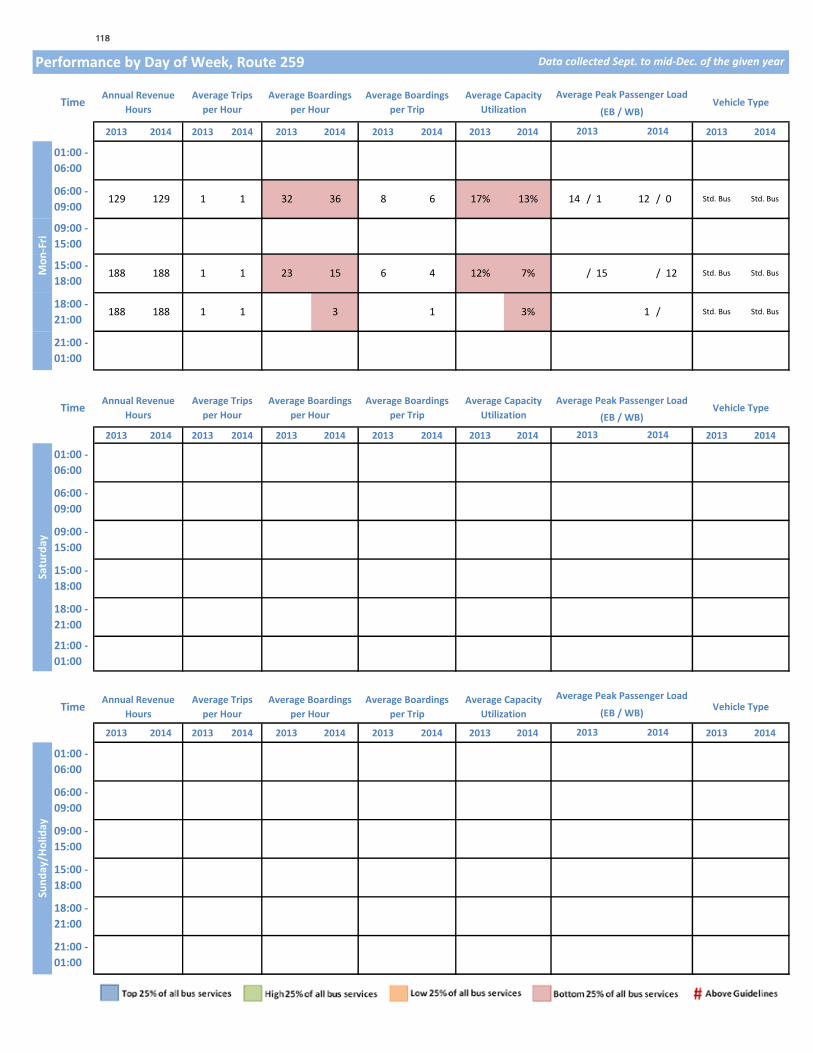
Performance by Day of Week, Route 259
2013 2014 2013 2014 2013 2014 2013 2014 2013 2014 2013 2014
2013 2014 2013 2014 2013 2014 2013 2014 2013 2014 2013 2014
2013 2014 2013 2014 2013 2014 2013 2014 2013 2014 2013 2014
Data collected Sept. to mid-Dec. of the given year
Time Annual Revenue Hours
Average Trips per Hour
Average Boardings per Hour
Average Boardings per Trip
Average Capacity Utilization
Average Peak Passenger LoadVehicle Type
(EB / WB)
06:00 - 09:00
129 129 1 1 32 36 8 6 17% 13% 14 / 1 12 / 0 Std. Bus
2013 2014
Mon
-Fri
01:00 - 06:00
18:00 - 21:00
188
15:00 - 18:00
188 188 1 1 23 15 6 4 12% 7% / 15 / 12 Std. Bus Std. Bus
Std. Bus
09:00 - 15:00
Time Annual Revenue Hours
Average Trips per Hour
Average Boardings per Hour
Average Boardings per Trip
Average Capacity Utilization
Average Peak Passenger LoadVehicle Type
(EB / WB)
21:00 - 01:00
1 / Std. Bus Std. Bus188 1 1 3 1 3%
06:00 - 09:00
2013 2014
09:00 - 15:00
21:00 - 01:00
18:00 - 21:00
Satu
rday
01:00 - 06:00
15:00 - 18:00
2013 2014
Sund
ay/H
olid
ay
01:00 - 06:00
15:00 - 18:00
TimeAnnual Revenue
HoursAverage Trips
per HourAverage Boardings
per Hour Average Boardings
per TripAverage Capacity
Utilization
Average Peak Passenger LoadVehicle Type(EB / WB)
09:00 - 15:00
06:00 - 09:00
18:00 - 21:00
21:00 - 01:00
118