Appendix C Technical Results Information - FasTracks Jeet Desai – RTD Denver : Page : 1 CC : Lee...
14
Southeast Extension Alternatives Analysis Appendix C Technical Results Information
Transcript of Appendix C Technical Results Information - FasTracks Jeet Desai – RTD Denver : Page : 1 CC : Lee...

Southeast Extension Alternatives Analysis
Appendix C Technical Results Information

\ AECOM 2101 Wilson Blvd, Suite 800 Arlington, VA 22201 www.aecom.com
703 340 3100 tel 703 340 3001 fax
Memorandum
To Jeet Desai – RTD Denver Page 1
CC Lee Cryer, Susan Wood
Subject
SE Corridor Extension – AECOM revisions to the model inputs and processes with zone split information from RTD
From Prasad Pulaguntla ,Jeffrey Roux, Manish Jain,– AECOM
Date May 25, 2012 The purpose of this technical memorandum is to document the revisions and enhancements made by AECOM to the model inputs and processes, to incorporate the refined zone splits and transit access networks provided by RTD. This memo documents changes made to the following files:
• Zone Bin and TAZ files • Transit Base and Highway Base Networks • Transit Route System Files • Other Input Files Revised • Compass model GISDK
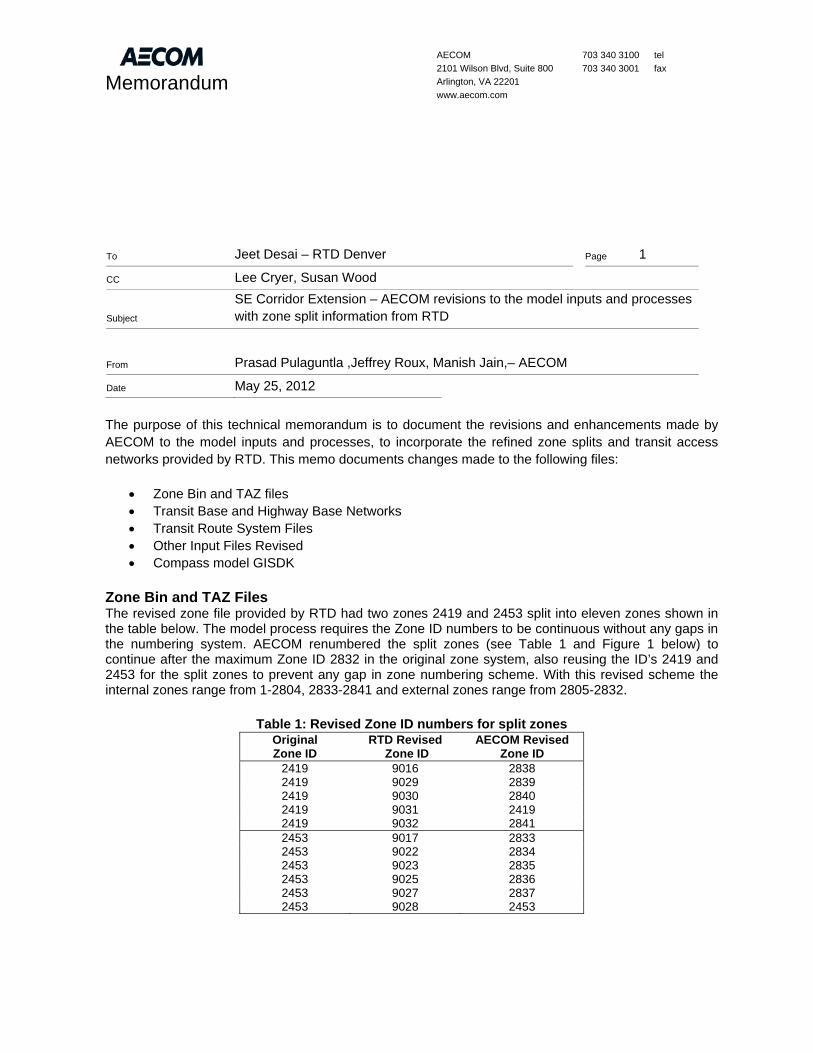
Zone Bin and TAZ Files The revised zone file provided by RTD had two zones 2419 and 2453 split into eleven zones shown in the table below. The model process requires the Zone ID numbers to be continuous without any gaps in the numbering system. AECOM renumbered the split zones (see Table 1 and Figure 1 below) to continue after the maximum Zone ID 2832 in the original zone system, also reusing the ID’s 2419 and 2453 for the split zones to prevent any gap in zone numbering scheme. With this revised scheme the internal zones range from 1-2804, 2833-2841 and external zones range from 2805-2832.
Table 1: Revised Zone ID numbers for split zones Original Zone ID
RTD Revised Zone ID
AECOM Revised Zone ID
2419 9016 2838 2419 9029 2839 2419 9030 2840 2419 9031 2419 2419 9032 2841 2453 9017 2833 2453 9022 2834 2453 9023 2835 2453 9025 2836 2453 9027 2837 2453 9028 2453

2
In addition AECOM made the following revisions to the Zone and TAZ files:
• Zone bin file was indexed and sorted using the “ZONE ID” field and missing attributes in the zone file were computed.
• The TAZ file attributes were updated accordingly with the revised zone numbers and corresponding geographic and demographic information for the split zones.
• A dangling polygon (ID=9015) in the TAZ layer was removed. • Also the area type on some of split zones was originally coded as 3 while most of zones were
coded with area type value 2. AECOM revised the area type values to 2 to be consistent across all the new split zones.

Fi
gure
1: R
evis
ed Z
one
ID’s
for t
he s
plit
zone
s
RTD
Spl
it Zo
ne ID
’s
AEC
OM
Rev
ised
S
plit
Zone
ID’s
3

Transit Base and Highway Base Networks The transit base network provided by RTD was updated with the above zone numbering scheme. The highway base network was revised with the changes to transit base network. AECOM reviewed accessibility to transit within 1-2 miles of the new rail stations and added few additional transit only links (TYPE=99) from zones (see Figure 2 below) either with no access or limited access. For example zones 2454 and 2459 had only one access (centroid connector) point to the highway network resulting in high walk access times to the rail stations; new transit walk access links were added in transit base network to more realistically represent the future growth pattern and accessibility from these zones. The distance on some of the transit access links from highway network to rail stations was also adjusted to better represent access times from future bus drop-off locations. Transit Route System Files With the updated transit base network the transit route system files for all the three alternatives were reloaded and corrected for missing links and stops. Other Input Files Revised In addition to the zone data and network files the following model input files have been revised to be consistent with new zone system:
• Intra_tb.bin (Intra-zonal travel time table) – Added the new split zones
• Smooth05mi.bin (Fraction of each TAZ within 0.5 miles of each centroid) – Added the centroids for the split zones and re-computed the percentage for all the centroids around split zones
• ParkingInputs.bin (2000 parking cost data for pivot point model) – Added the new split zones
• Pkg_TAZ.bin (Parking Cost results at TAZ level): The parking cost model was re-run to estimate the values for new split zones. The values for only new split zones were updated in the pk_taz.bin file. The attributes for rest of the zones were kept same as the original model before zone splits.
• NEWWKK.mtx (K-factor matrix for work trips) – Expanded the matrix to include new split zones
• NEWNWK.mtx( K-factor matrix for non-work trips) - Expanded the matrix to include new split zones
Compass Model GISDK The GISDK (COMPASS_ 4.1.rsc) has been revised to incorporate the new zone numbering scheme. The GISDK should be compiled before running the model with new inputs.
4
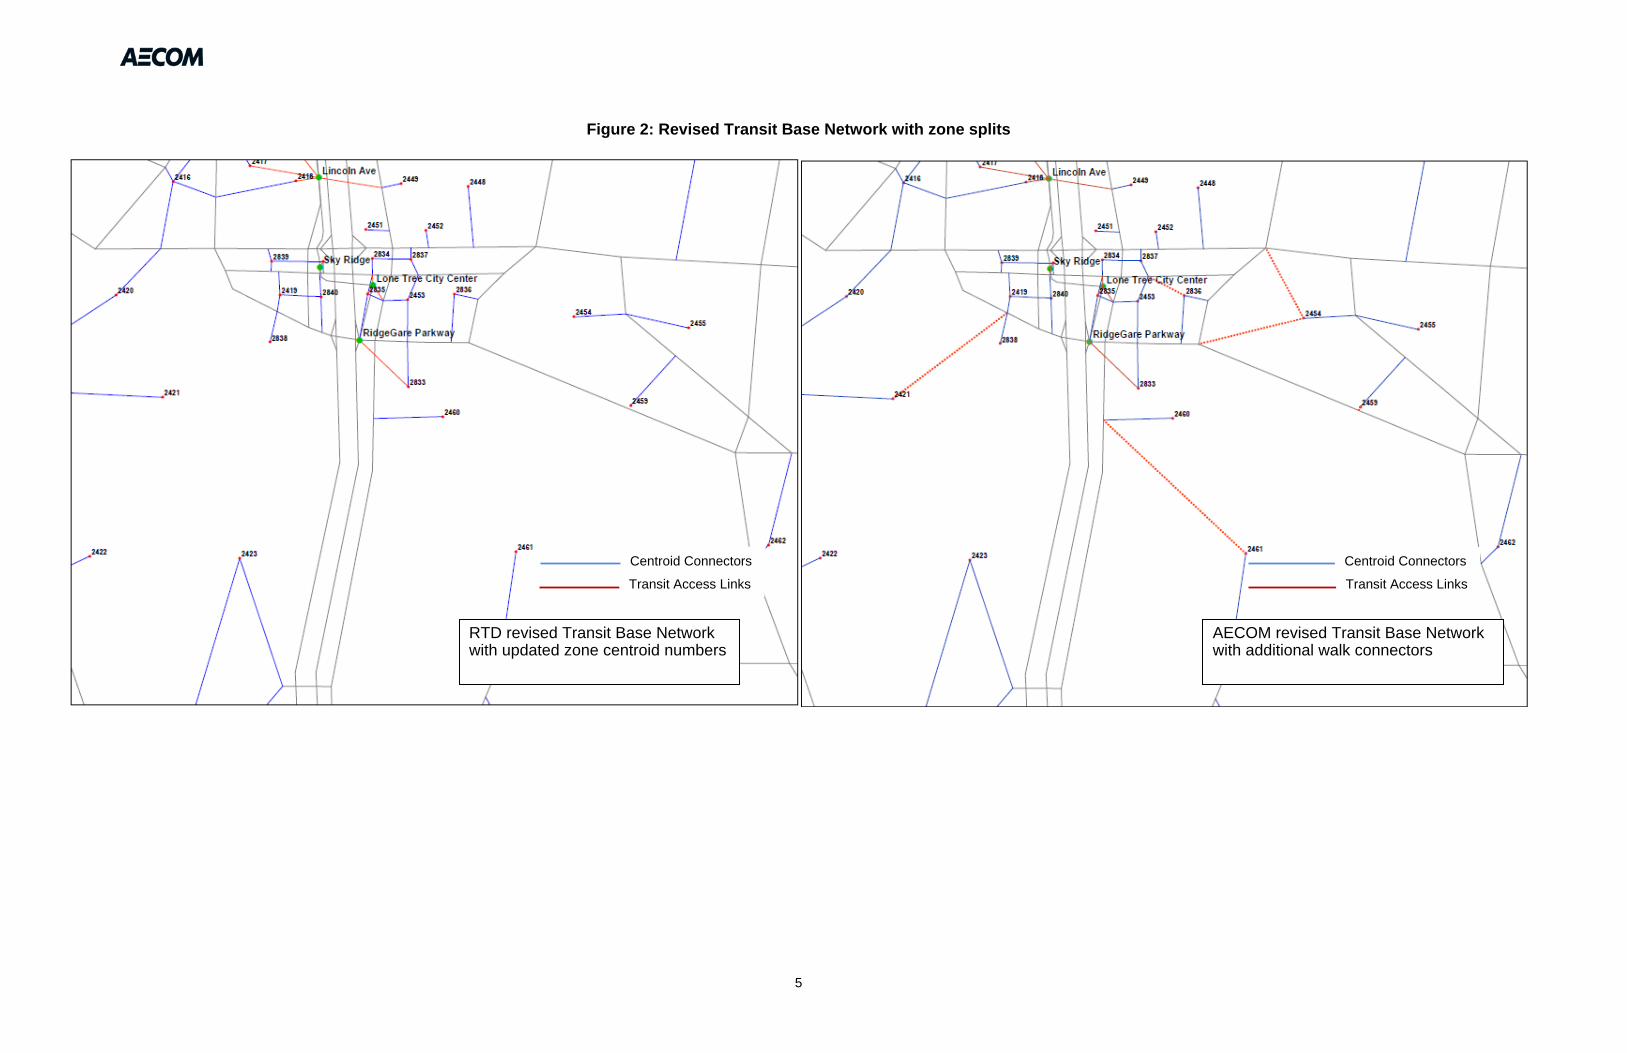
Figure 2: Revised Transit Base Network with zone splits
Centroid Connectors
Transit Access Links Transit Access Links
Centroid Connectors
RTD revised Transit Base Network with updated zone centroid numbers
AECOM revised Transit Base Network with additional walk connectors
5
\ AECOM 2101 Wilson Blvd, Suite 800 Arlington, VA 22201 www.aecom.com
703 340 3100 tel 703 340 3001 fax
Memorandum
To Jeet Desai – RTD Denver Page 1
CC Lee Cryer, Susan Wood
Subject
SE Corridor LRT Extension – Travel Demand Forecasting Methodology and New Starts Project Justification Measures
From Prasad Pulaguntla ,Jeffrey Roux, Manish Jain,– AECOM
Date June 01, 2012 This technical memorandum describes the process used to develop travel demand forecasts and FTA New/Small Starts project justification measures for the Southeast (SE) Corridor LRT extension project. During the development of these forecasts, the project team encountered challenges using the off-the-shelf DRCOG model (COMPASS 4.0) inputs and had to implement a number of methodological changes to properly quantify the benefits associated with the SE Corridor LRT extension. This memo documents the findings and changes implemented by project team for the following model forecast versions:
• Off-the-shelf DRCOG modeling inputs • Forecast Version #1: Ran off-the-shelf DRCOG model inputs • Forecast Version #2: Added highway capacity and centroid connector changes • Forecast Version #3: Zone splits, network updates, accessibility changes, area type changes
Off-the-shelf DRCOG model inputs RTD provided initial set of 2035 model inputs with SE corridor LRT extension build service plan. These inputs were taken from the model run “2035ReducedLRTWCBus_NWR_PK_20_OP_60” by RTD. Figure 1 below shows the zone system and highway network for this model. Forecast Version #1: Ran off-the-shelf DRCOG model inputs Based on the above 2035 model inputs, AECOM developed the service plan and modeled the following three alternatives:
• No-Build: No-Build service plan from initial 2035 model inputs used as a starting point and refinements made to optimize the service (bus routes 403, 411) in SE corridor based on discussion with the RTD service planning team.
• TSM/Baseline: Refinements to the No-Build alternative to replicate Build service in the SE corridor. Multiple variants of Baseline alternative were discussed/tested before finalizing the alternative:
1. Align the bus routing and increase the headway of the No-Build routes the southeast corridor so that the combined headway would match the Build service frequency and
the route stopping pattern matches the proposed light rail station locations. This option was discarded because 1) in the Build alternative these routes would operate at No-Build service frequency and terminate at Ridge Gate Parkway as the peak loads on these routes would not justify the high frequency service for entire length of the routes; 2) Increasing the frequency of these routes only in TSM alternative would create inconsistency in service between Build and TSM outside the corridor.
2. A new shuttle route coded as free premium service (similar to Mall Shuttle) between Ridge Gate Parkway and Lincoln Avenue with the same frequency as Build service. This would operate as a different (BRT type service) mode along with the No-Build local bus service in the southeast corridor. The alignment and stopping pattern of the No-Build routes optimized to mimic proposed Southeast rail extension.
3. Shuttle route coded as local bus to supplement the No-Build service between RidgeGate Parkway and Lincoln Avenue. The combined frequency of Shuttle route and No-Build service replicated the Build service in the SE Corridor. The alignment and stopping pattern of the No-Build routes optimized to mimic proposed Southeast rail extension.
The project team reviewed the results from options two and three above and the second option was not found to be optimal due to 1) The shuttle route would not combine headway with local bus within the modeling process 2) The peak loads on the local and shuttle routes did not justify the level of service as provided by local routes at No-Build frequency (since some riders shift from local to shuttle bus) and the loads on the shuttle service itself did not justify the operations at the same headway as the proposed rail line extension. 3) RTD does not plan to operate the shuttle service as a free service and the fares are expected to be comparable to local bus.
The third TSM option above, shuttle route as local bus supplementing service such that the combined headway on all buses in the corridor matches rail’s headway, is recommended as the most optimal TSM alternative.
• Build: Added three new stations and extended the LRT service in SE corridor with new end-of-line station at RidgeGate Parkway. The SE LRT extension operates at 14 trains per hour during the peak period and 12 trains per hour during the off-peak period. The existing bus routes in the corridor (routes 403, and 411) are terminated at new end of the line station Ridge Gate Parkway.
• Coded park-n-ride at RidgeGate Parkway in Build and TSM alternatives.
AECOM ran these three alternatives using off-the-shelf DRCOG modeling inputs and here is a brief summary of the model results:
• SE Extension Project Rail Ridership: 19,062 • User Benefits (Hours)
o TSM vs. No-Build – 1,100 o Build vs. TSM – 2,120
Attached spreadsheet shows detailed summaries including rail ridership (by station), southeast extension project ridership and transit user benefits. Version #1 QA/QC Review – Following the delivery of Forecast #1, AECOM did an extensive QA/QC of the results. From this review, we found that:
2
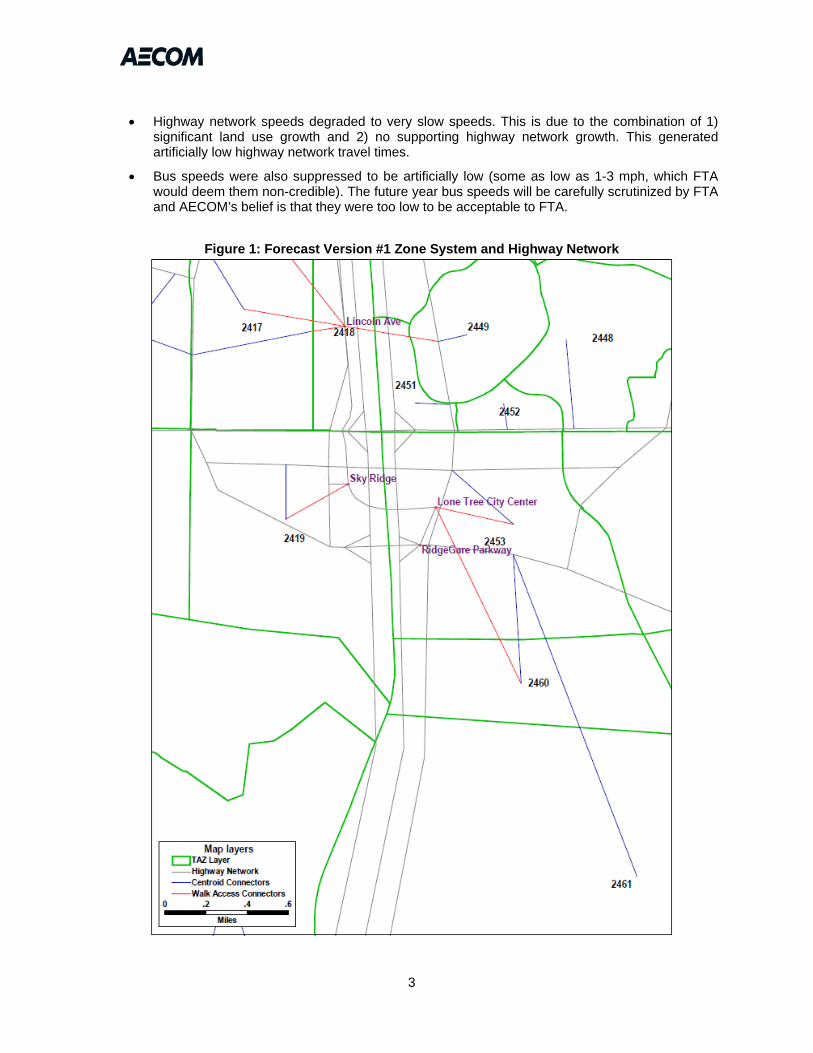
• Highway network speeds degraded to very slow speeds. This is due to the combination of 1)
significant land use growth and 2) no supporting highway network growth. This generated artificially low highway network travel times.
• Bus speeds were also suppressed to be artificially low (some as low as 1-3 mph, which FTA would deem them non-credible). The future year bus speeds will be carefully scrutinized by FTA and AECOM’s belief is that they were too low to be acceptable to FTA.
Figure 1: Forecast Version #1 Zone System and Highway Network
3

Next Step: RTD reviewed and updated the highway network detail and link capacity to simulate the likely highway improvements associated with the proposed land use intensity. This resulted in Forecast Version #2.
Forecast Version #2 – Added highway capacity and centroid connector changes These runs were identical to Forecast Version #1 except that additional highway capacity placed on the network with improved (see Figure 2 below) centroid connectors. This improved the highway and bus speeds but decreased the overall transit user benefits by 25% for Build vs. TSM as shown by the results below:
• SE Extension Project Rail Ridership: 17,494 • User Benefits (Hours)
o TSM vs. No-Build – 985 o Build vs. TSM – 1,625
Version #2 QA/QC Review – Following the delivery of Forecast #2, AECOM did another extensive QA/QC review. From this review, we found that:
• The large zones near the SE corridor extension did not allow the forecasting model to properly represent access (both walk and drive) to transit service. The large zones resulted in rather long centroid connectors that were non-representative of accessibility to transit with the refined land use.
• The large zones also led to “lumpy” highway loadings which meant that there were still some oscillations in highway speeds depending on the centroid loading location.
4

Figure 2: Forecast Version #2 Zone System and Highway Network
Next Step: RTD split the zones to more accurately represent accessibility to the transportation network.
5

6
Forecast Version #3 – Zone splits, Network updates, Accessibility changes, Area type changes AECOM made several revisions and enhancements to the model inputs and processes to incorporate the refined zone splits (see Figure 3 below) and transit access networks from RTD. Attached memo “Draft SE Ext Network and Model Changes” sent to RTD on May 25, 2012 provides detailed documentation of the changes made for this version. With these refinements AECOM ran the No-Build, TSM and Build alternatives and here is a summary of model results and market analysis results compared to No-Build alternative:
• SE Extension Project Rail Ridership: 19,927
o % of work Trips: 51% o % of non-Work Trips: 49% o % of walk/transfer access: 39% o % of drive access: 61%
o % of existing rail riders: 67%
o % of new rail riders: 33%
• New Rail Riders (Linked): 6,600
o % Riders shifting from bus mode: 34% o % Riders that are new transit trips: 66%
• User Benefits (Hours) o TSM vs. No-Build – 975 o Build vs. TSM – 1,950
Version #3 QA/QC Review – Following the delivery of Forecast #3, AECOM did an exhaustive QA/QC review. From this review, we found that:
• This represents a reasonable assessment of highway and bus system performance
• Properly represents accessibility to highway network and transit system, especially in areas with transformative land use changes.
• Area type values are consistent across all the zones in the SE corridor region.
• Provides a solid foundation to begin the discussion with FTA on baseline alternative definition.
Next Step: Discuss with FTA about forecasting methodology/baseline alternative definition.
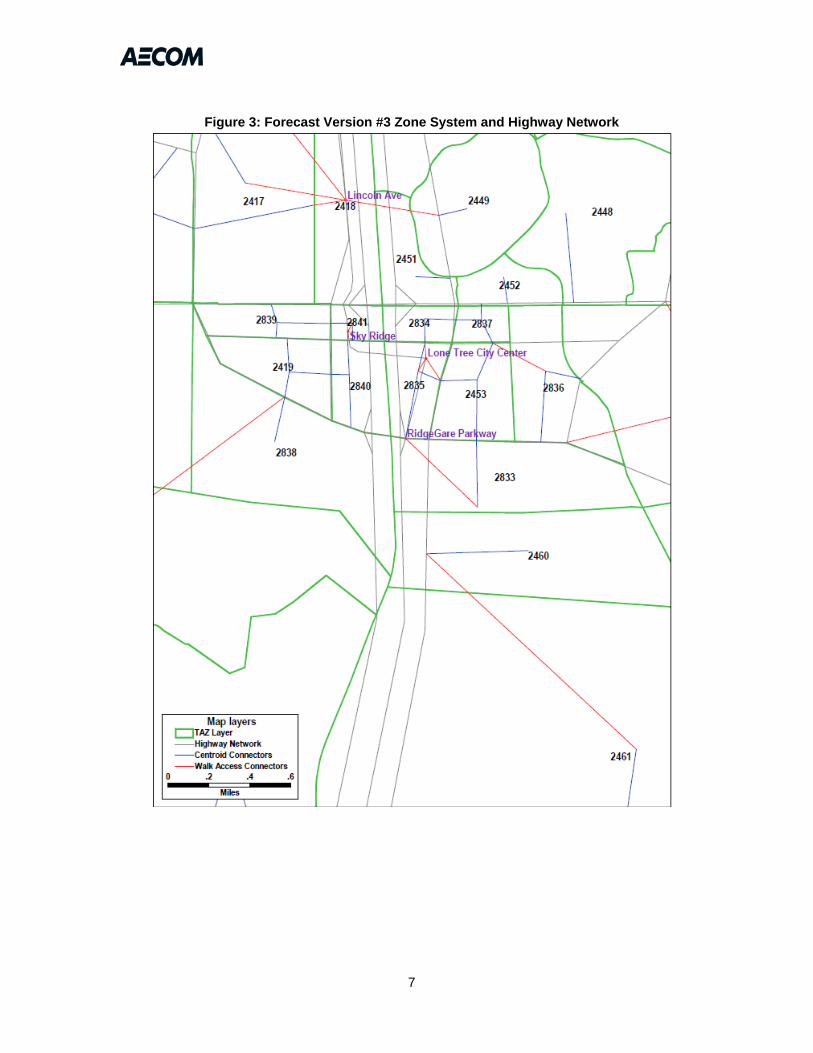
Figure 3: Forecast Version #3 Zone System and Highway Network
7