Appendix C-1 Stormwater Pollution Prevention Plan, … · · 2011-06-28This Stormwater Pollution...
284
Appendix C-1 Stormwater Pollution Prevention Plan, Conservation Plan
Transcript of Appendix C-1 Stormwater Pollution Prevention Plan, … · · 2011-06-28This Stormwater Pollution...

Appendix C-1
Stormwater Pollution Prevention Plan,Conservation Plan
November 1, 2010 Proposed Conservation Subdivision 23-Lot Residential Subdivision Harris Road Town of Bedford Westchester County, New York
STORMWATER POLLUTION PREVENTION PLAN
Prepared for: Mr. Cosimo Tripi
Prepared by: Petruccelli Engineering
392 Columbus Avenue Valhalla, NY 10595
November 1, 2010
I Rudolph C. Petruccelli, PE certifies that this Stormwater Pollution Prevention Plan has been prepared in accordance with NYSDEC rules and regulations and in accordance with the Town of Bedford Code Section 103.

THIS PAGE IS LEFT INTENTIONALLY BLANK
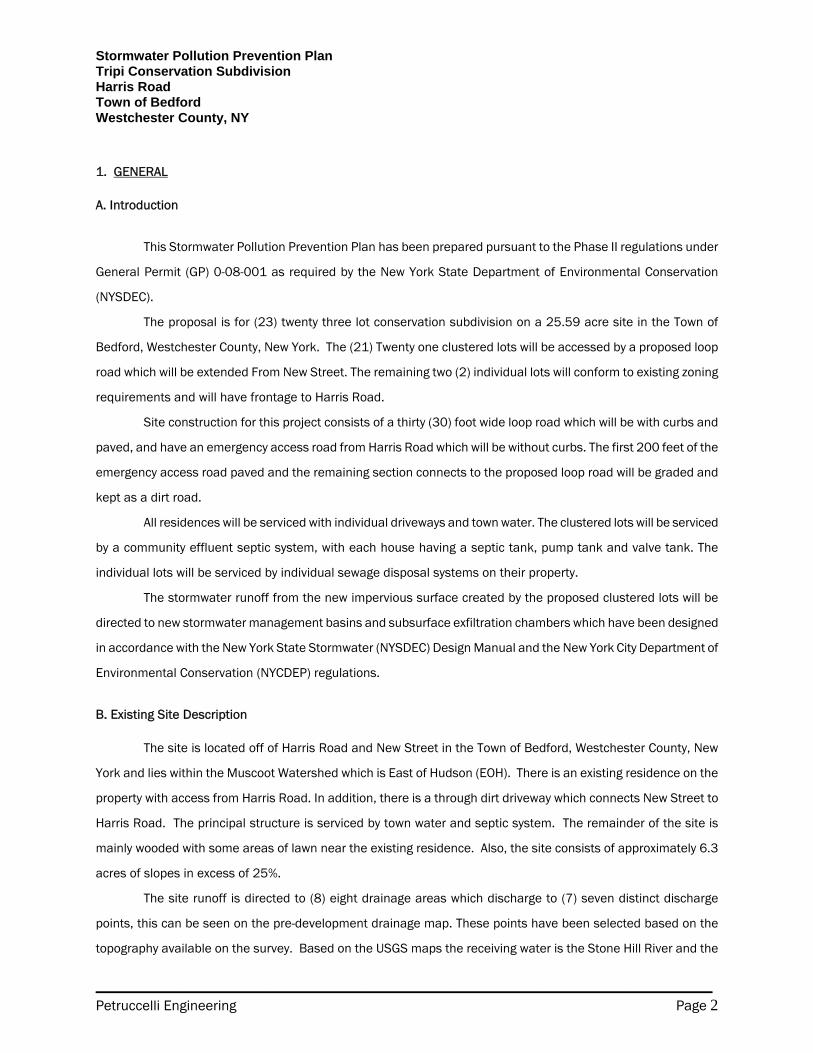
TRIPI CONSERVATION SUBDIVISION TOWN OF BEDFORD
WESTCHESTER COUNTY, NEW YORK
Stormwater Pollution Prevention Plan (SWPPP)
TABLE OF CONTENTS
1 GENERAL…....................................................................................................................
A. Introduction..................................................................................................................
B. Existing Site Description..............................................................................................
a. C. Project Description ..................................................................................................
i. I - Soils............................................................................................................
ii. II - Grading and Drainage................................................................................
C. Storm Water Management Methodology.....................................................................
iii. I - Standards...................................................................................................
iv. II - Results.......................................................................................................
2 Pre-Development and Post-Development Peak Flow Summary………………………….
3 CONSTRUCTION AND MAINTENANCE DESCRIPTION...........................................
A. Erosion and Sediment Control Plan.............................................................................
I. Temporary Control Measures...........................................................................
v. II. Permanent Control Measures…......................................................................
vi. III. Pollution Prevention Measures and Materials Storage/Disposal…………….
B. Narrative Report...........................................................................................................
C. Construction Sequencing.............................................................................................
D. Construction Inspection Stages………………………………………………………………………….
E. Storm Water Management Facilities Maintenance Program.......................................
F. Conclusions..................................................................................................................
4 APPENDIX A – Pollutant Loading Analysis
5 APPENDIX B - Soils Information, Fema map
6 APPENDIX C - Stormwater Management Report
A. Pre-Development Drainage Divide Map and Routings
B. Post-Development Drainage Divide Map and Routings
7 APPENDIX D - Operator and Contractor Certifications
8 APPENDIX E - Maintenance and Inspection Reports and Construction Checklist
Stormwater Pollution Prevention Plan Tripi Conservation Subdivision Harris Road Town of Bedford Westchester County, NY
____________________________________________________________________________________ Petruccelli Engineering Page 2
1. GENERAL A. Introduction
This Stormwater Pollution Prevention Plan has been prepared pursuant to the Phase II regulations under
General Permit (GP) 0-08-001 as required by the New York State Department of Environmental Conservation
(NYSDEC).
The proposal is for (23) twenty three lot conservation subdivision on a 25.59 acre site in the Town of
Bedford, Westchester County, New York. The (21) Twenty one clustered lots will be accessed by a proposed loop
road which will be extended From New Street. The remaining two (2) individual lots will conform to existing zoning
requirements and will have frontage to Harris Road.
Site construction for this project consists of a thirty (30) foot wide loop road which will be with curbs and
paved, and have an emergency access road from Harris Road which will be without curbs. The first 200 feet of the
emergency access road paved and the remaining section connects to the proposed loop road will be graded and
kept as a dirt road.
All residences will be serviced with individual driveways and town water. The clustered lots will be serviced
by a community effluent septic system, with each house having a septic tank, pump tank and valve tank. The
individual lots will be serviced by individual sewage disposal systems on their property.
The stormwater runoff from the new impervious surface created by the proposed clustered lots will be
directed to new stormwater management basins and subsurface exfiltration chambers which have been designed
in accordance with the New York State Stormwater (NYSDEC) Design Manual and the New York City Department of
Environmental Conservation (NYCDEP) regulations.
B. Existing Site Description
The site is located off of Harris Road and New Street in the Town of Bedford, Westchester County, New
York and lies within the Muscoot Watershed which is East of Hudson (EOH). There is an existing residence on the
property with access from Harris Road. In addition, there is a through dirt driveway which connects New Street to
Harris Road. The principal structure is serviced by town water and septic system. The remainder of the site is
mainly wooded with some areas of lawn near the existing residence. Also, the site consists of approximately 6.3
acres of slopes in excess of 25%.
The site runoff is directed to (8) eight drainage areas which discharge to (7) seven distinct discharge
points, this can be seen on the pre-development drainage map. These points have been selected based on the
topography available on the survey. Based on the USGS maps the receiving water is the Stone Hill River and the
Stormwater Pollution Prevention Plan Tripi Conservation Subdivision Harris Road Town of Bedford Westchester County, NY
____________________________________________________________________________________ Petruccelli Engineering Page 3
stormwater interactive map provided on the NYSDEC website illustrates that the site is in a TMDL watershed but
does not contain and is not adjacent to any 303d listed streams.
The stormwater runoff from the site is conveyed via overland flow to the discharge points illustrated on the
Pre-Development Map.
C. Project Description
The proposal is for (23) twenty three lot conservation subdivision of which (21) twenty one are
conservation lots and (2) two individual lots meeting existing zoning on a 25.59 acre site in the Town of Bedford,
Westchester County, New York. Site construction for this project consists of (1) one loop roadway which is
approximately 2,230 feet in length and connected to New Street, and an approximately 925 foot emergency access
roadway which begins at Harris Road and ends at sta. 8+50 of the loop roadway. There are (21) twenty one new
residences in the conservation development, one new individual house on a new conforming lot and one existing
residence. The conservation lots will be serviced by a community effluent septic system and the other two lots by
individual septic systems. All lots will be serviced by town water. Stormwater management facilities will be
constructed to satisfy NYSDEC and NYSDEP requirements. The total land disturbance associated with this
construction is approximately 13.06 acres.
I - Soils
The soils in the project area is mapped as CsD (Charlton-Chatfield) and CrC (Chatfield-Charlton Complex),
hilly and very rocky. These soils are classified as ‘B’ soil”. These soils are considered to have moderate
runoff potential and are moderately drained.
II - Grading and Drainage
The grading and drainage plan has been designed to capture and treat the stormwater runoff
from the new and existing impervious surfaces and disturbed areas at each improvement location.
Stormwater will be collected through catch basins and underground pipes and discharged into
stormwater basins, subsurface exfiltration chambers and/or detention ponds that have been designed
in accordance with the NYS Stormwater Management Design Manual, NYCDEP criteria, and the
Phosphorus Removal Section of the SWM. Basin designs have been included in this application and
are designated as NYSDEC I-2 Infiltration Basins and the exfiltration chamber are designed as NYSDEC
I-4 basins.
The ponds have been designed for Water Quality and Flood Control, mitigating the post-

Stormwater Pollution Prevention Plan Tripi Conservation Subdivision Harris Road Town of Bedford Westchester County, NY
____________________________________________________________________________________ Petruccelli Engineering Page 4
development rate of stormwater runoff to the pre-development rate.
Storm water runoff rates for the 1 (NYSDEC Stream Channel Protection and water quality volume),
2 year storm event, 10 (NYSDEC Overbank Protection), and 100-year (NYSDEC Extreme Flood) storm
events have been analyzed and routed in the pre-development and post-development condition utilizing
computer software “Hydrocad” The design assumptions are provided in the appendix of this report.
It is expected that the project will take approximately 48 months to construct from the time of
ground breaking to final completion, with work commencing shortly after the receipt of all necessary
approvals. Throughout the construction process strict adherence to the Erosion Control Plans and
Specifications will be maintained to ensure all sediment is contained within the improvement areas.
Storm water management design also provides for water quality treatment such that the project
areas will not represent a negative impact or degradation in water quality to any reservoir, stream,
wetlands or watercourses.
D. Storm Water Management Methodology
Storm water quality and quantity has been analyzed in accordance with the guidelines set forth in the
New York State General Permit for Storm Water Discharge, GP 0-08-001. The water quality volume was
computed from the runoff produced by the 1 year 24 hour event. Water Quality volume and invert elevations of
the low flow orifices have been calculated for each of the drainage areas and are included in the Appendix. The
low flow orifices in each basin have been sized to release the water quality volume over a 24 hour period.
Additional control devices are included in the outlet structures to control the rate of runoff from the 1, 2, 10,
and 100 year 24 hour storm events to the pre-construction runoff rate. Velocity dissipators are specified at
each inlet and outlet and shall be a riprap pad per “New York Guidelines for Urban Erosion & Sediment
Control”.
The proposed ponds are designed as Infiltration basins (NYSDEC I-2) and include hydrodynamic pre-
treatment separators at each basin that can accommodate the 1 year storm event.
The Pre and Post-Construction Drainage Divide Maps are included in the Appendix of this report. The
Times of Concentration, coverage types, and hydrograph/stormwater calculations for the pre and post
construction conditions are provided in the stormwater routings and are also provided in the Appendix.
Storm water quality and quantity computations are based upon the following publications.
• Soil Conservation Service (SCS) - TR-20
• Urban Hydrology for Small Watersheds - TR-55
• NYSDEC ‘New York State Stormwater Management Design Manual’, latest edition
Stormwater Pollution Prevention Plan Tripi Conservation Subdivision Harris Road Town of Bedford Westchester County, NY
____________________________________________________________________________________ Petruccelli Engineering Page 5
• Controlling Urban Runoff: A practical Manual for Planning and Designing Urban BMP’S, by the
Metropolitan Washington Council of Governments.
• Computer software Hydrocad has been utilized for the stormwater analysis. This program is on
USDA Soil Conservation Service (SCS) Technical Release 55 (TR 55)
Compliance with Better Site Design (BSD):
Chapter 10 ”Enhance Phosphorus Removal Standards” section 10.3.4 of the NYS Stromwater Manual
indicates (4) four goals to meet treatment performance based on a BSD. The goals and project
compliance are as follows:
Goal 1: Reduce Runoff Volumes:
The project has been designed to reduce the total amount of impervious surfaces and to promote
overland flow through vegetated areas. The subdivision layout, unlike standard subdivisions of today
incorporates some tuck-under garages and minimal driveway back up areas adjacent to the garages.
Additionally the driveways are proposed to have curbing so that run off from these impervious surfaces
is conveyed via pipe to stormwater basins.
Goal 2: Achieving Effluent Concentrations for Particulate Phosphorus:
By implementing the stormwater practices listed in section 10.4 of the NYS stormwater manual this
goal is achieved. Additionally hydrodynamic separators that are equipped with an internal bypass have
been incorporated into the design as pre-treatment devices. These chambers are allowed under the
NYSDEC regulations and have been sized based on the 1 year storm event.
Goal 3: Achieving Effluent Concentrations for Dissolved Phosphorus:
By implementing those stormwater practices listed in section 10.4 of the NYS stormwater manual this
goal has been achieved. Considering that infiltration basins and hydrodynamic separators have been
utilized for the proposed drainage areas, the concentration dissolved phosphorous will be reduced by
allowing the stormwater to come in contact with the substrate soils
Goal 4: Achieving Effluent Concentrations for Dissolved Phosphorus:
By implement those stormwater practices listed in section 10.4 of the NYS stormwater manual this goal is
achieved. Considering that gravel trenches and infiltration basins have been utilized for a majority of the
proposed drainage areas the concentration of dissolved phosphorous will be reduced by allowing the
Stormwater Pollution Prevention Plan Tripi Conservation Subdivision Harris Road Town of Bedford Westchester County, NY
____________________________________________________________________________________ Petruccelli Engineering Page 6
stormwater to come in contact with the substrate soils.
I - STANDARDS
• Peak flow rates have been controlled to ensure that the post-development rate of
runoff from the site will not exceed pre-development rates for 1, 10, and 100 year 24
hour storm events.
• Pollutant loading is controlled by means of detaining the runoff generated from the
water quality storm event for longer than 24 hours.
• The proposed structures will be constructed above the 100-year floodplain.
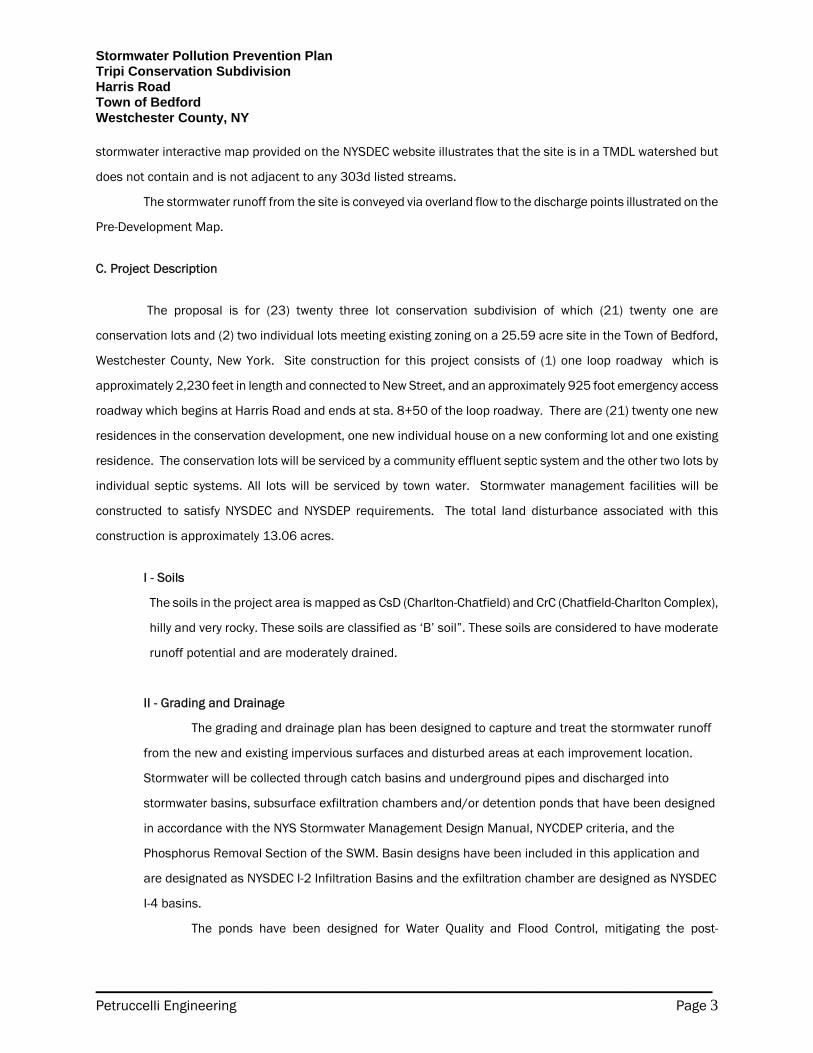
II - Summary of Results
The results of the hydrographs from the contributing watersheds were compared under pre and
post development conditions. The analysis consists of (5) five design points each noted on the pre
and post development drainage maps. The results are summarized in the following table:
2. Pre-Development & Post-Development Peak Flow Summary
Table 1. Summary of Flows DP-1
Design Storm (yr)
Pre-Development Peak runoff (cfs)
Post-Development Peak runoff (cfs)
Post-Development % Reduction w/
Mitigation
1 1.44 1.20 16.67%
2 3.94 3.27 17.01%
10 12.15 10.00 17.70%
100 30.24 24.82 17.92%

Stormwater Pollution Prevention Plan Tripi Conservation Subdivision Harris Road Town of Bedford Westchester County, NY
____________________________________________________________________________________ Petruccelli Engineering Page 7
Table 2. Summary of Flows DP-2
Table 3. Summary of Flows DP-3
Table 4. Summary of Flows DP-4
Design Storm (yr)
Pre-Development Peak runoff (cfs)
Post-Development Peak runoff (cfs)
Post-Development % Reduction w/
Mitigation
1 0.76 0.21 72.37%
2 1.89 0.50 73.54%
10 5.35 1.34 74.95%
100 12.69 3.10 75.57%
Design Storm (yr)
Pre-Development Peak runoff (cfs)
Post-Development Peak runoff (cfs)
Post-Development % Reduction w/
Mitigation
1 0.66 0.41 37.88%
2 1.38 0.94 31.88%
10 3.36 2.52 25.00%
100 7.30 5.81 20.41%
Design Storm (yr)
Pre-Development Peak runoff (cfs)
Post-Development Peak runoff (cfs)
Post-Development % Reduction w/
Mitigation
1 0.46 0.10 78.26%
2 1.25 0.40 68.00%
10 3.94 1.58 59.90%
100 9.81 4.41 55.05%
Stormwater Pollution Prevention Plan Tripi Conservation Subdivision Harris Road Town of Bedford Westchester County, NY
____________________________________________________________________________________ Petruccelli Engineering Page 8
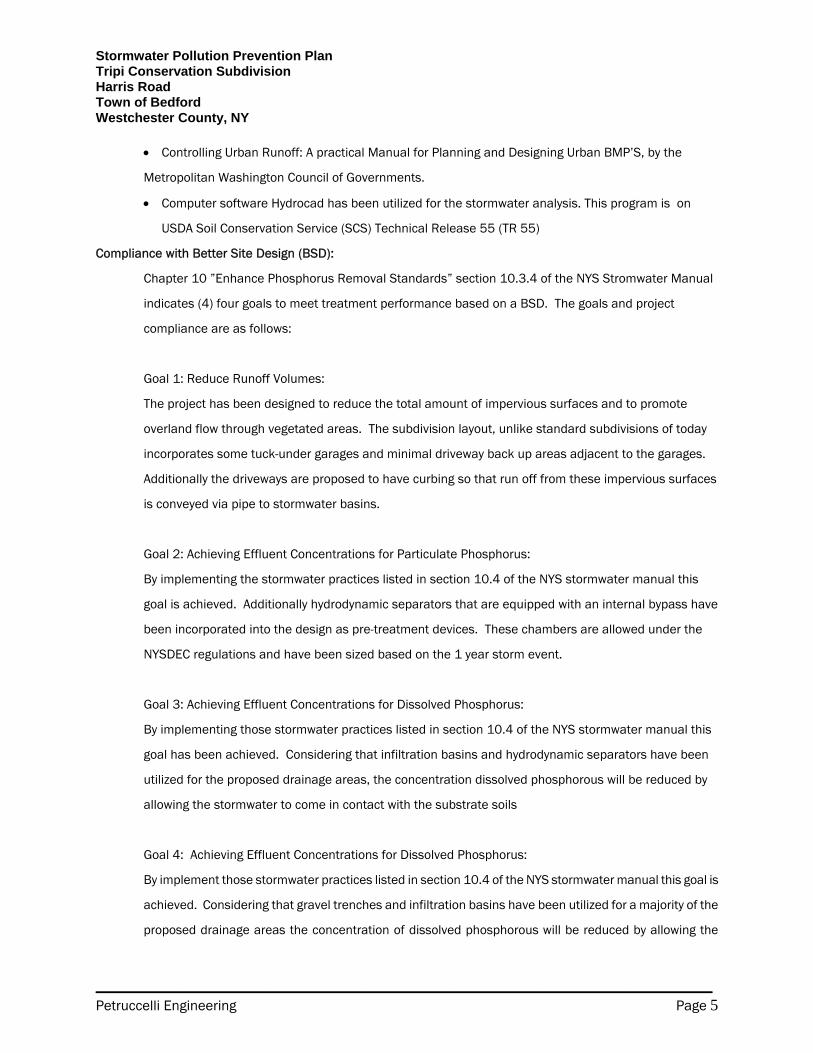
Table 5. Summary of Flows DP-5
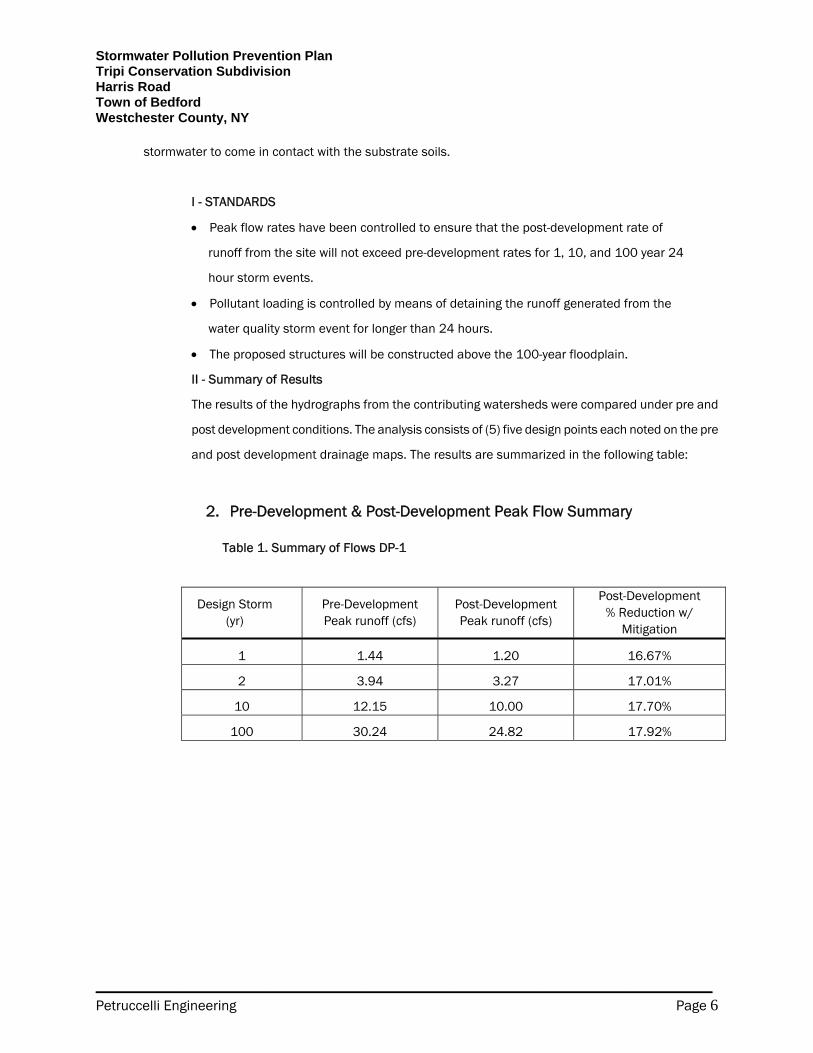
Table 6. Summary of Flows DP-6
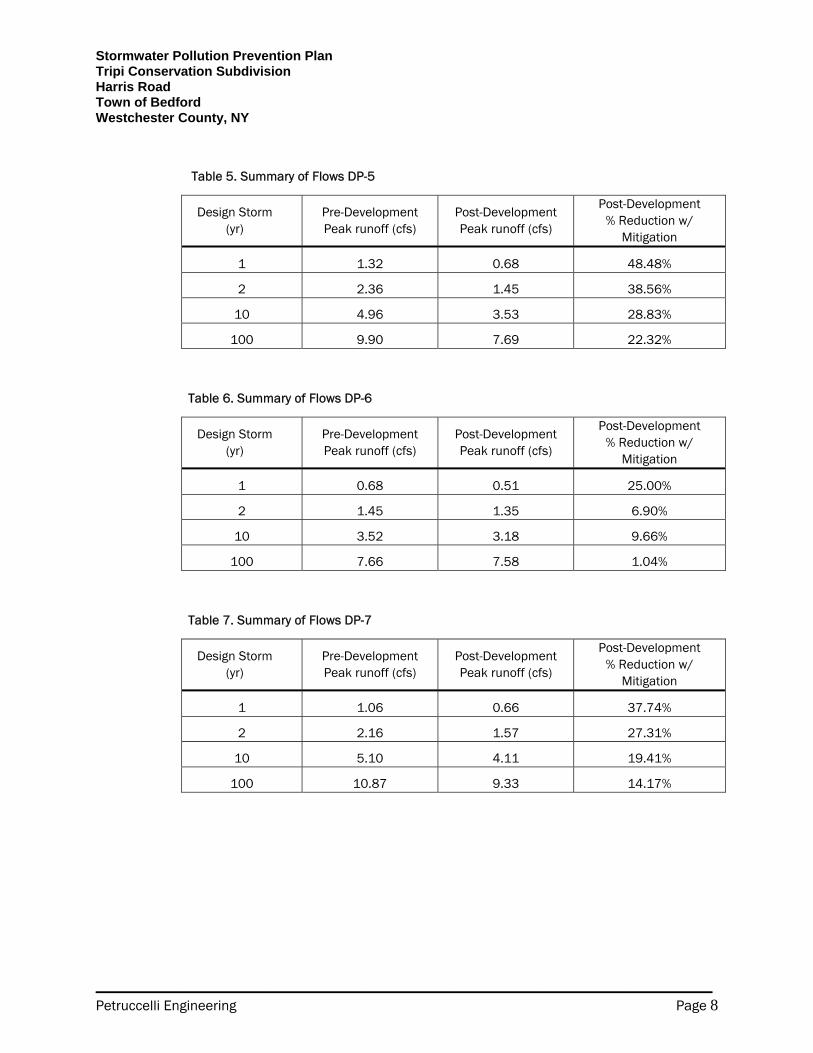
Table 7. Summary of Flows DP-7
Design Storm (yr)
Pre-Development Peak runoff (cfs)
Post-Development Peak runoff (cfs)
Post-Development % Reduction w/
Mitigation
1 1.32 0.68 48.48%
2 2.36 1.45 38.56%
10 4.96 3.53 28.83%
100 9.90 7.69 22.32%
Design Storm (yr)
Pre-Development Peak runoff (cfs)
Post-Development Peak runoff (cfs)
Post-Development % Reduction w/
Mitigation
1 0.68 0.51 25.00%
2 1.45 1.35 6.90%
10 3.52 3.18 9.66%
100 7.66 7.58 1.04%
Design Storm (yr)
Pre-Development Peak runoff (cfs)
Post-Development Peak runoff (cfs)
Post-Development % Reduction w/
Mitigation
1 1.06 0.66 37.74%
2 2.16 1.57 27.31%
10 5.10 4.11 19.41%
100 10.87 9.33 14.17%
Stormwater Pollution Prevention Plan Tripi Conservation Subdivision Harris Road Town of Bedford Westchester County, NY
____________________________________________________________________________________ Petruccelli Engineering Page 9
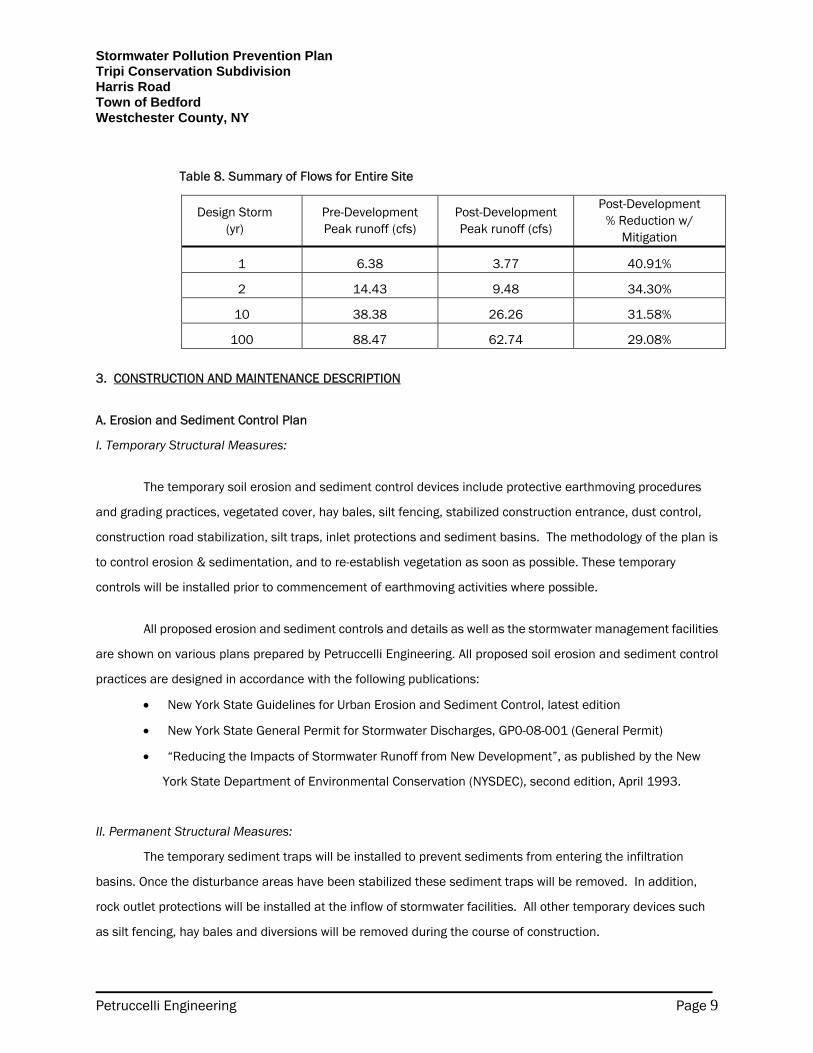
Table 8. Summary of Flows for Entire Site
3. CONSTRUCTION AND MAINTENANCE DESCRIPTION
A. Erosion and Sediment Control Plan
I. Temporary Structural Measures:
The temporary soil erosion and sediment control devices include protective earthmoving procedures
and grading practices, vegetated cover, hay bales, silt fencing, stabilized construction entrance, dust control,
construction road stabilization, silt traps, inlet protections and sediment basins. The methodology of the plan is
to control erosion & sedimentation, and to re-establish vegetation as soon as possible. These temporary
controls will be installed prior to commencement of earthmoving activities where possible.
All proposed erosion and sediment controls and details as well as the stormwater management facilities
are shown on various plans prepared by Petruccelli Engineering. All proposed soil erosion and sediment control
practices are designed in accordance with the following publications:
• New York State Guidelines for Urban Erosion and Sediment Control, latest edition
• New York State General Permit for Stormwater Discharges, GP0-08-001 (General Permit)
• “Reducing the Impacts of Stormwater Runoff from New Development”, as published by the New
York State Department of Environmental Conservation (NYSDEC), second edition, April 1993.
II. Permanent Structural Measures:
The temporary sediment traps will be installed to prevent sediments from entering the infiltration
basins. Once the disturbance areas have been stabilized these sediment traps will be removed. In addition,
rock outlet protections will be installed at the inflow of stormwater facilities. All other temporary devices such
as silt fencing, hay bales and diversions will be removed during the course of construction.
Design Storm (yr)
Pre-Development Peak runoff (cfs)
Post-Development Peak runoff (cfs)
Post-Development % Reduction w/
Mitigation
1 6.38 3.77 40.91%
2 14.43 9.48 34.30%
10 38.38 26.26 31.58%
100 88.47 62.74 29.08%
Stormwater Pollution Prevention Plan Tripi Conservation Subdivision Harris Road Town of Bedford Westchester County, NY
____________________________________________________________________________________ Petruccelli Engineering Page 10
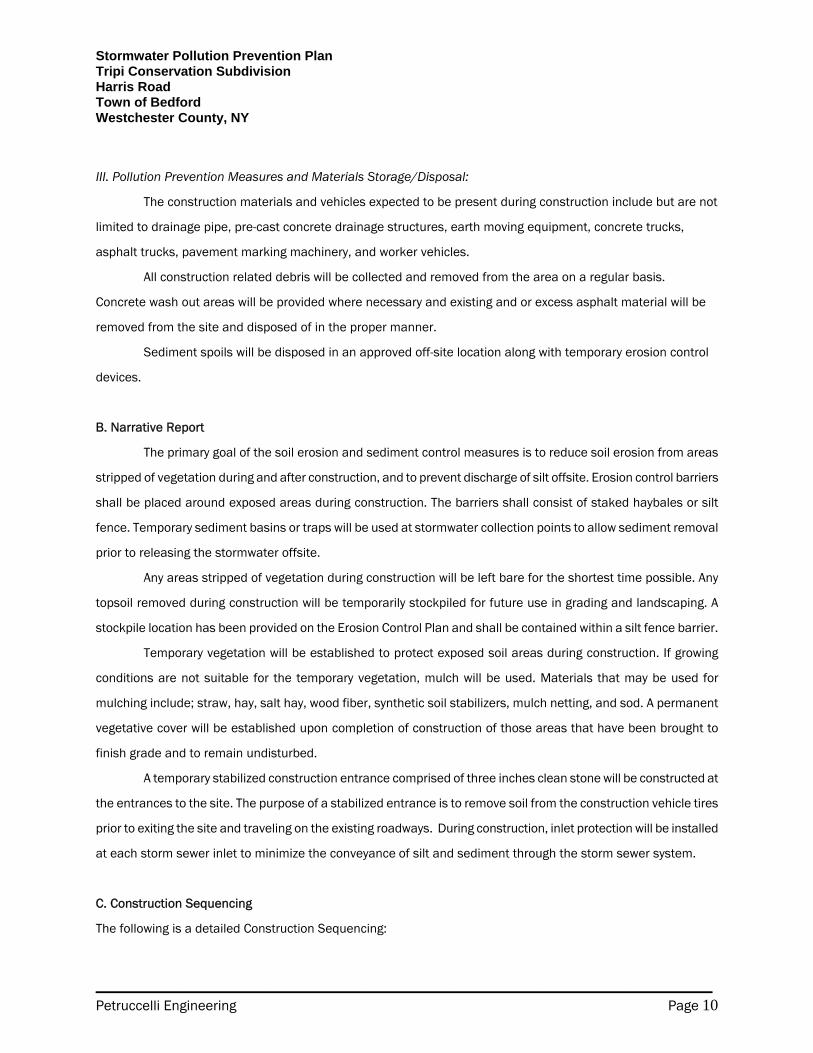
III. Pollution Prevention Measures and Materials Storage/Disposal:
The construction materials and vehicles expected to be present during construction include but are not
limited to drainage pipe, pre-cast concrete drainage structures, earth moving equipment, concrete trucks,
asphalt trucks, pavement marking machinery, and worker vehicles.
All construction related debris will be collected and removed from the area on a regular basis.
Concrete wash out areas will be provided where necessary and existing and or excess asphalt material will be
removed from the site and disposed of in the proper manner.
Sediment spoils will be disposed in an approved off-site location along with temporary erosion control
devices.
B. Narrative Report
The primary goal of the soil erosion and sediment control measures is to reduce soil erosion from areas
stripped of vegetation during and after construction, and to prevent discharge of silt offsite. Erosion control barriers
shall be placed around exposed areas during construction. The barriers shall consist of staked haybales or silt
fence. Temporary sediment basins or traps will be used at stormwater collection points to allow sediment removal
prior to releasing the stormwater offsite.
Any areas stripped of vegetation during construction will be left bare for the shortest time possible. Any
topsoil removed during construction will be temporarily stockpiled for future use in grading and landscaping. A
stockpile location has been provided on the Erosion Control Plan and shall be contained within a silt fence barrier.
Temporary vegetation will be established to protect exposed soil areas during construction. If growing
conditions are not suitable for the temporary vegetation, mulch will be used. Materials that may be used for
mulching include; straw, hay, salt hay, wood fiber, synthetic soil stabilizers, mulch netting, and sod. A permanent
vegetative cover will be established upon completion of construction of those areas that have been brought to
finish grade and to remain undisturbed.
A temporary stabilized construction entrance comprised of three inches clean stone will be constructed at
the entrances to the site. The purpose of a stabilized entrance is to remove soil from the construction vehicle tires
prior to exiting the site and traveling on the existing roadways. During construction, inlet protection will be installed
at each storm sewer inlet to minimize the conveyance of silt and sediment through the storm sewer system.
C. Construction Sequencing
The following is a detailed Construction Sequencing:
Stormwater Pollution Prevention Plan Tripi Conservation Subdivision Harris Road Town of Bedford Westchester County, NY
____________________________________________________________________________________ Petruccelli Engineering Page 11
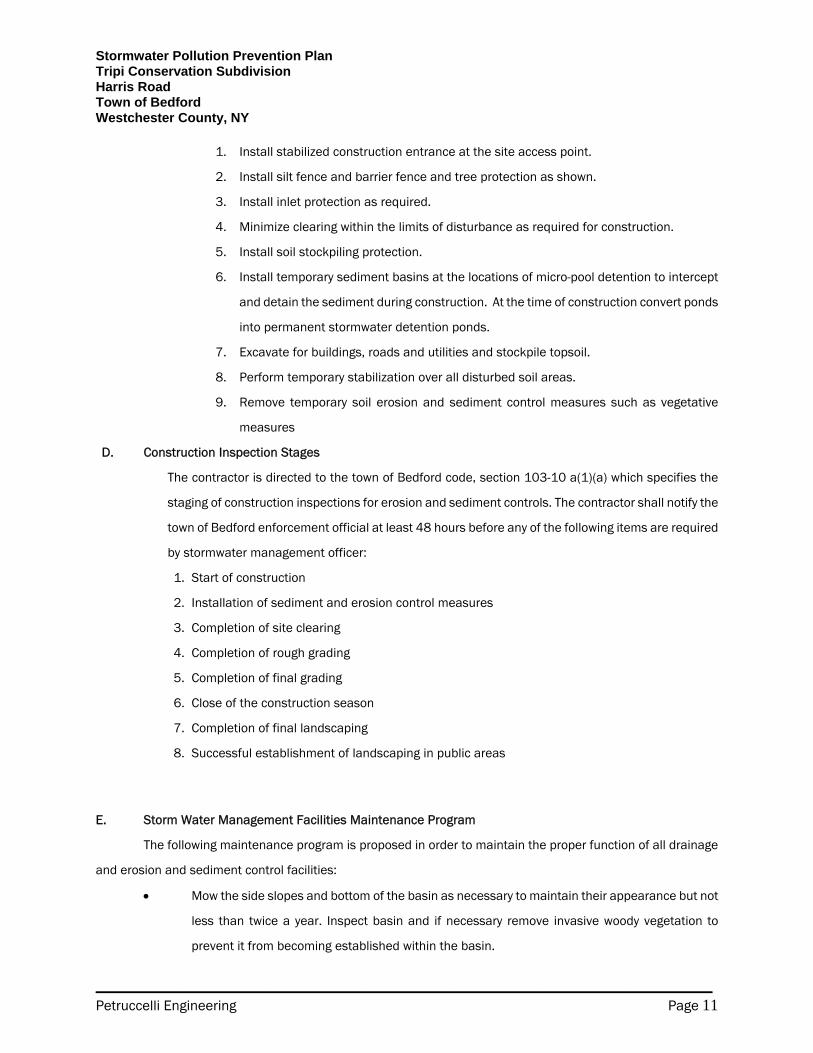
1. Install stabilized construction entrance at the site access point.
2. Install silt fence and barrier fence and tree protection as shown.
3. Install inlet protection as required.
4. Minimize clearing within the limits of disturbance as required for construction.
5. Install soil stockpiling protection.
6. Install temporary sediment basins at the locations of micro-pool detention to intercept
and detain the sediment during construction. At the time of construction convert ponds
into permanent stormwater detention ponds.
7. Excavate for buildings, roads and utilities and stockpile topsoil.
8. Perform temporary stabilization over all disturbed soil areas.
9. Remove temporary soil erosion and sediment control measures such as vegetative
measures
D. Construction Inspection Stages
The contractor is directed to the town of Bedford code, section 103-10 a(1)(a) which specifies the
staging of construction inspections for erosion and sediment controls. The contractor shall notify the
town of Bedford enforcement official at least 48 hours before any of the following items are required
by stormwater management officer:
1. Start of construction
2. Installation of sediment and erosion control measures
3. Completion of site clearing
4. Completion of rough grading
5. Completion of final grading
6. Close of the construction season
7. Completion of final landscaping
8. Successful establishment of landscaping in public areas
E. Storm Water Management Facilities Maintenance Program
The following maintenance program is proposed in order to maintain the proper function of all drainage
and erosion and sediment control facilities:
• Mow the side slopes and bottom of the basin as necessary to maintain their appearance but not
less than twice a year. Inspect basin and if necessary remove invasive woody vegetation to
prevent it from becoming established within the basin.

Stormwater Pollution Prevention Plan Tripi Conservation Subdivision Harris Road Town of Bedford Westchester County, NY
____________________________________________________________________________________ Petruccelli Engineering Page 12
• During mowing operations, litter and debris will be removed from vegetated swale, extended
detention basin and the outlet control structures.
• During the construction of the project, the site erosion and sediment control measures as well as
basin embankments and outlet structure will be inspected by the project superintendent once a
week and/or immediately following a rainstorm. Any repairs required will be performed in a timely
manner. All sediment removal and/or repairs will be followed immediately by re-vegetation.
• All disturbed areas will be stabilized and the sediment build up (50% of sediment basin) in the
basins removed before the basin is fined graded and landscaped. After the construction is
completed, any areas disturbed will be stabilized immediately after the required work is
completed.
• The Owner will inspect the facilities once a month, and once a year by a Professional Engineer. A
report by the Professional Engineer will be submitted to the Owner in the event deficiencies are
found. In addition, the Owner will inspect the system after each major storm event to ensure the
small orifices and inlets remain open. Specific attention will be paid to the following:
Evidence of clogging of outlet control device.
Erosion of the flow path through the detention facility.
Subsidence, erosion, cracking or tree growth on the embankments.
Accumulation of sediment.
• Clean catch basins and other drainage structures from silt regularly, but not less than twice a
year. Remove sediment build up in the basin as required, but a minimum of every five years. A
rubber-tired backhoe with a minimum reach of 25’ will be used to remove silt accumulation.
Laborers with shovel and wheelbarrows will be used to maintain the embankment slopes, to
repair minor erosion problems and remove minor accumulation of silt. The use of hand labor will
also minimize the disturbance of stabilized areas and the established vegetation. A rubber-tired
backhoe has the reach and maneuverability to maintain these basins from the adjacent areas.
• Tree growth on the downstream face of the detention ponds will also be monitored regularly.
Trees that develop shall be removed during routine maintenance of the basin.
• The owner will take all necessary measures to have seeps, leeks, and/or settlements on the
embankment of detention pond repaired. If seeps, leaks, and/or settlement are discovered the
owner will be obligated to contract a licensed engineer to assess the problem and offer solutions
to repair.
• Restore and re-seed any eroded areas and gullies as soon as possible.
Stormwater Pollution Prevention Plan Tripi Conservation Subdivision Harris Road Town of Bedford Westchester County, NY
____________________________________________________________________________________ Petruccelli Engineering Page 13
• The Stormwater Management facilities Maintenance Program will be managed by:
E. Conclusions
The incorporation of the Best Management Practices will significantly reduce the pollutant loadings in the post-
construction condition by capturing and treating the runoff from the new and existing impervious surfaces and
disturbed areas to the greatest extent possible. This plan meets the requirements of the NYSDEC & NYCDEP for
Water Quality and Quantity, providing minimal impact to downstream waters.

THIS PAGE IS LEFT INTENTIONALLY BLANK

APPENDIX A
- POLLUTANT LOADING ANALYSIS

THIS PAGE IS LEFT INTENTIONALLY BLANK
Tripi Conservation SubdivisionHarris Road
Town of BedfordWestchester County, NY
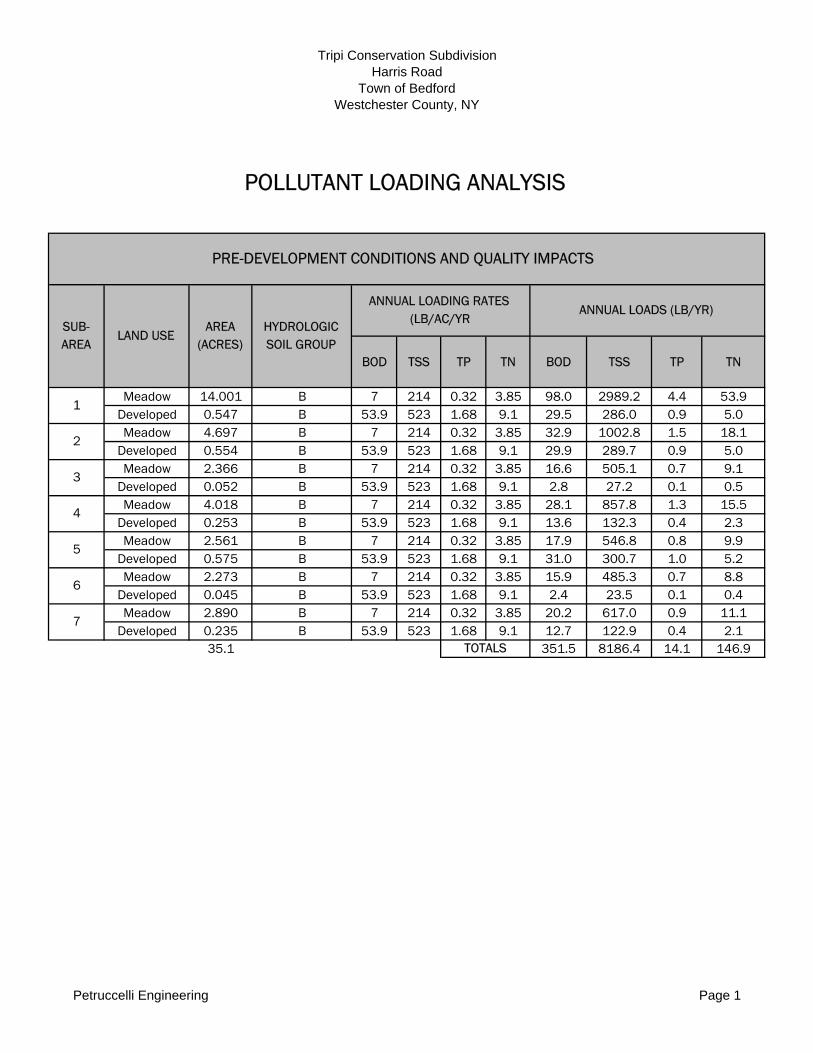
BOD TSS TP TN BOD TSS TP TN
Meadow 14.001 B 7 214 0.32 3.85 98.0 2989.2 4.4 53.9Developed 0.547 B 53.9 523 1.68 9.1 29.5 286.0 0.9 5.0Meadow 4.697 B 7 214 0.32 3.85 32.9 1002.8 1.5 18.1
Developed 0.554 B 53.9 523 1.68 9.1 29.9 289.7 0.9 5.0Meadow 2.366 B 7 214 0.32 3.85 16.6 505.1 0.7 9.1
Developed 0.052 B 53.9 523 1.68 9.1 2.8 27.2 0.1 0.5Meadow 4.018 B 7 214 0.32 3.85 28.1 857.8 1.3 15.5
Developed 0.253 B 53.9 523 1.68 9.1 13.6 132.3 0.4 2.3Meadow 2.561 B 7 214 0.32 3.85 17.9 546.8 0.8 9.9
Developed 0.575 B 53.9 523 1.68 9.1 31.0 300.7 1.0 5.2Meadow 2.273 B 7 214 0.32 3.85 15.9 485.3 0.7 8.8
Developed 0.045 B 53.9 523 1.68 9.1 2.4 23.5 0.1 0.4Meadow 2.890 B 7 214 0.32 3.85 20.2 617.0 0.9 11.1
Developed 0.235 B 53.9 523 1.68 9.1 12.7 122.9 0.4 2.135.1 351.5 8186.4 14.1 146.9
PRE-DEVELOPMENT CONDITIONS AND QUALITY IMPACTS
TOTALS
ANNUAL LOADING RATES (LB/AC/YR
ANNUAL LOADS (LB/YR)SUB-AREA
LAND USE HYDROLOGIC SOIL GROUP
AREA (ACRES)
1
2
7
3
POLLUTANT LOADING ANALYSIS
4
5
6
Petruccelli Engineering Page 1

Tripi Conservation SubdivisionHarris Road
Town of BedfordWestchester County, NY
BOD TSS TP TN BOD TSS TP TNMeadow 9.824 B 7 214 0.32 3.85 68.8 2097.4 3.1 37.8
Grass 2.770 B 7 214 0.32 3.85 19.4 591.4 0.9 10.7Developed 0.698 B 53.9 523 1.68 9.1 37.6 365.0 1.2 6.4
Grass 3.319 B 7 214 0.32 3.85 23.2 708.6 1.0 12.8Meadow 0.520 B 7 214 0.32 3.85 3.6 111.0 0.2 2.0
Developed 1.912 B 53.9 523 1.68 9.1 103.1 999.8 3.2 17.42B Developed 0.459 B 53.9 523 1.68 9.1 24.7 240.0 0.8 4.2
Meadow 1.297 B 7 214 0.32 3.85 9.1 276.9 0.4 5.0Grass 1.144 B 7 214 0.32 3.85 8.0 244.2 0.4 4.4
Developed 0.212 B 53.9 523 1.68 9.1 11.4 110.9 0.4 1.9Meadow 0.730 B 7 214 0.32 3.85 5.1 155.9 0.2 2.8
Grass 0.451 B 7 214 0.32 3.85 3.2 96.3 0.1 1.7Developed 0.093 B 53.9 523 1.68 9.1 5.0 48.6 0.2 0.8Meadow 2.327 B 7 214 0.32 3.85 16.3 496.8 0.7 9.0
Grass 0.545 B 7 214 0.32 3.85 3.8 116.4 0.2 2.1Developed 0.016 B 53.9 523 1.68 9.1 0.9 8.4 0.0 0.1Meadow 0.893 B 7 214 0.32 3.85 6.3 190.7 0.3 3.4
Developed 1.109 B 53.9 523 1.68 9.1 59.8 579.9 1.9 10.1Grass 0.935 B 7 214 0.32 3.85 6.5 199.6 0.3 3.6
6B Developed 0.231 B 53.9 523 1.68 9.1 12.5 120.8 0.4 2.16C Meadow 0.303 B 7 214 0.32 3.85 2.1 64.7 0.1 1.2
Meadow 1.340 B 7 214 0.32 3.85 9.4 286.1 0.4 5.2Grass 1.375 B 7 214 0.32 3.85 9.6 293.6 0.4 5.3
Developed 0.291 B 53.9 523 1.68 9.1 15.7 152.2 0.5 2.6Meadow 0.954 B 7 214 0.32 3.85 6.7 203.7 0.3 3.7
Grass 0.977 B 7 214 0.32 3.85 6.8 208.6 0.3 3.8Developed 0.362 B 53.9 523 1.68 9.1 19.5 189.3 0.6 3.3
35.1 498.1 9156.6 18.4 163.3
POST-DEVELOPMENT CONDITIONS AND QUALITY IMPACTS
TOTALS
LAND USE
6A
5
1
2A
ANNUAL LOADS (LB/YR)ANNUAL LOADING RATES HYDROLOGIC SOIL GROUP
7
8
AREA (ACRES)
3
4
SUB-AREA
Petruccelli Engineering Page 2
Tripi Conservation SubdivisionHarris Road
Town of BedfordWestchester County, NY
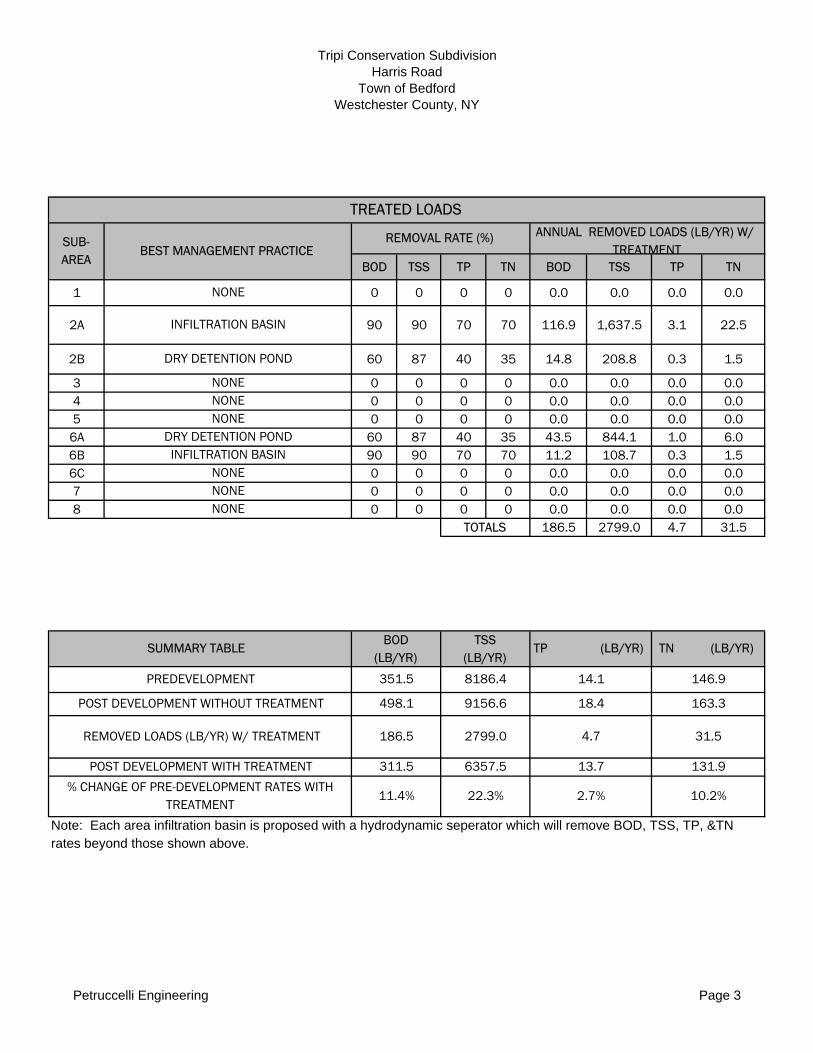
BOD TSS TP TN BOD TSS TP TN
1 0 0 0 0 0.0 0.0 0.0 0.0
2A 90 90 70 70 116.9 1,637.5 3.1 22.5
2B 60 87 40 35 14.8 208.8 0.3 1.5
3 0 0 0 0 0.0 0.0 0.0 0.04 0 0 0 0 0.0 0.0 0.0 0.05 0 0 0 0 0.0 0.0 0.0 0.0
6A 60 87 40 35 43.5 844.1 1.0 6.06B 90 90 70 70 11.2 108.7 0.3 1.56C 0 0 0 0 0.0 0.0 0.0 0.07 0 0 0 0 0.0 0.0 0.0 0.08 0 0 0 0 0.0 0.0 0.0 0.0
186.5 2799.0 4.7 31.5
rates beyond those shown above.
4.7 31.5
14.1 146.9
18.4 163.3
8186.4
2799.0
10.2%
BOD (LB/YR)
TSS (LB/YR)
9156.6
351.5
498.1
TP (LB/YR)
NONE
NONENONE
ANNUAL REMOVED LOADS (LB/YR) W/ TREATMENT
REMOVAL RATE (%)
Note: Each area infiltration basin is proposed with a hydrodynamic seperator which will remove BOD, TSS, TP, &TN
311.5 6357.5 13.7 131.9
TN (LB/YR)
186.5
11.4% 22.3% 2.7%
NONE
BEST MANAGEMENT PRACTICE
NONE
SUB-AREA
NONE
TREATED LOADS
INFILTRATION BASIN
DRY DETENTION POND
POST DEVELOPMENT WITH TREATMENT
% CHANGE OF PRE-DEVELOPMENT RATES WITH TREATMENT
POST DEVELOPMENT WITHOUT TREATMENT
REMOVED LOADS (LB/YR) W/ TREATMENT
SUMMARY TABLE
PREDEVELOPMENT
TOTALS
NONEDRY DETENTION PONDINFILTRATION BASIN
Petruccelli Engineering Page 3

THIS PAGE IS LEFT INTENTIONALLY BLANK
APPENDIX B
- SOILS INFORMATION - FEMA MAP

THIS PAGE IS LEFT INTENTIONALLY BLANK

HARRIS RD
BEDFORD RD
HWY 117
SAW MILL RIVER PKWY
RAILROAD AV
E
ADAMS STNOTTINGHAM RD
SUNRISE AVE
BEDFORD MEWS
SAW MILL RIVER PKWY
WestchesterNew York
RhB Pt
CsD
Uf
CrC
RhD
UhC
RhE
Ce
CtC HrF
RhE
CrC
UvC
ChB
SOIL SURVEY OF WESTCHESTER COUNTY, NEW YORK
Tripi Soils Map
0 200 400 600 800100Feet
0 80 16040Meters
Web Soil Survey 1.1National Cooperative Soil Survey
12/3/2006Page 1 of 3
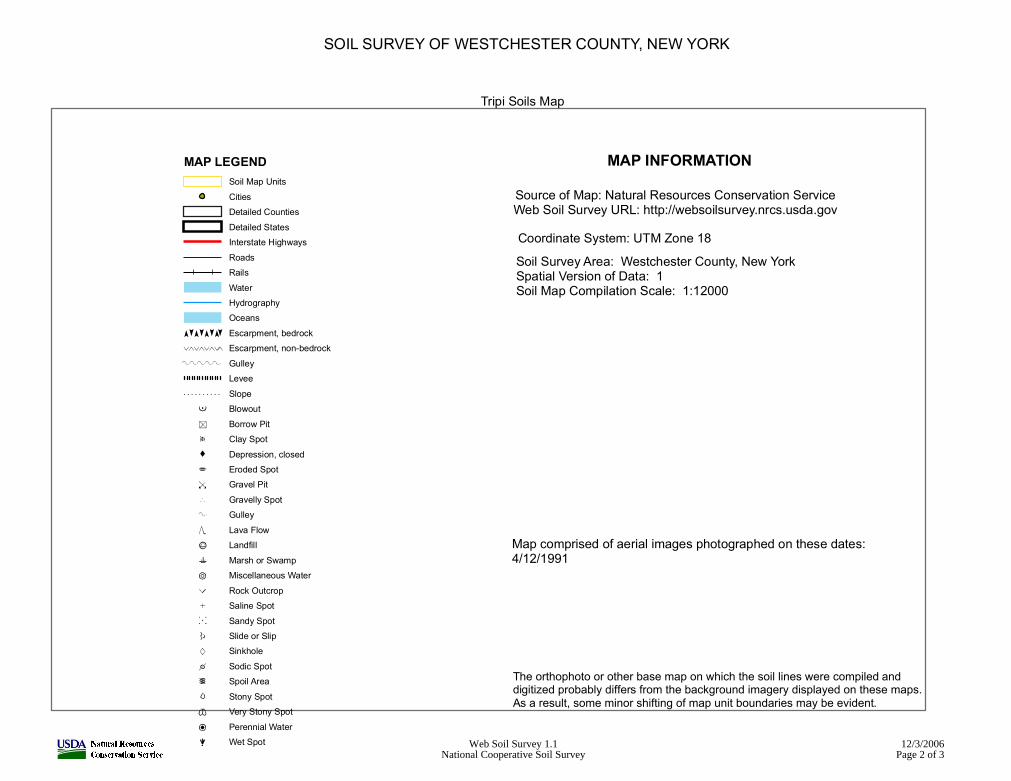
MAP INFORMATION
SOIL SURVEY OF WESTCHESTER COUNTY, NEW YORK
Tripi Soils Map
Source of Map: Natural Resources Conservation ServiceWeb Soil Survey URL: http://websoilsurvey.nrcs.usda.govCoordinate System: UTM Zone 18Soil Survey Area: Westchester County, New YorkSpatial Version of Data: 1Soil Map Compilation Scale: 1:12000
The orthophoto or other base map on which the soil lines were compiled anddigitized probably differs from the background imagery displayed on these maps. As a result, some minor shifting of map unit boundaries may be evident.
Map comprised of aerial images photographed on these dates: 4/12/1991
MAP LEGENDSoil Map UnitsCitiesDetailed CountiesDetailed StatesInterstate HighwaysRoadsRailsWaterHydrographyOceansEscarpment, bedrockEscarpment, non-bedrockGulleyLeveeSlopeBlowoutBorrow PitClay SpotDepression, closedEroded SpotGravel PitGravelly SpotGulleyLava FlowLandfillMarsh or SwampMiscellaneous WaterRock OutcropSaline SpotSandy SpotSlide or SlipSinkholeSodic SpotSpoil AreaStony SpotVery Stony SpotPerennial WaterWet Spot Web Soil Survey 1.1
National Cooperative Soil Survey12/3/2006
Page 2 of 3
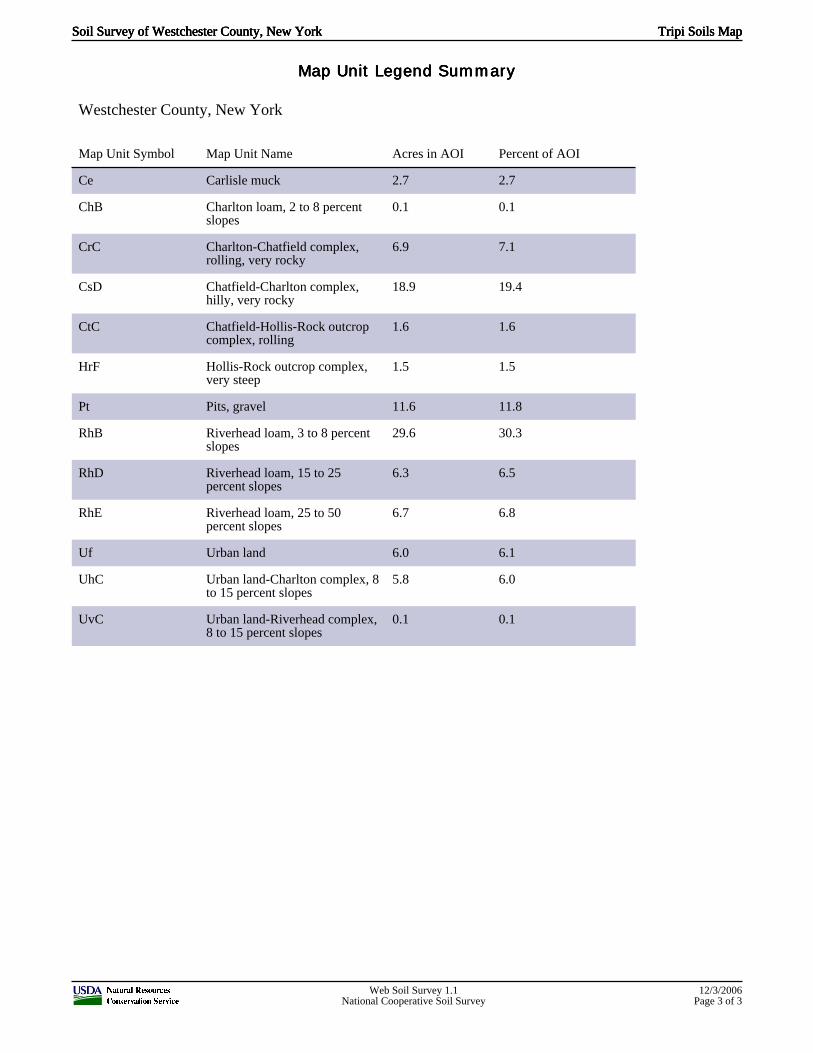
Map Unit Legend SummaryMap Unit Legend SummaryMap Unit Legend SummaryMap Unit Legend Summary
Westchester County, New York
Map Unit Symbol Map Unit Name Acres in AOI Percent of AOI
Ce Carlisle muck 2.7 2.7
ChB Charlton loam, 2 to 8 percentslopes
0.1 0.1
CrC Charlton-Chatfield complex,rolling, very rocky
6.9 7.1
CsD Chatfield-Charlton complex,hilly, very rocky
18.9 19.4
CtC Chatfield-Hollis-Rock outcropcomplex, rolling
1.6 1.6
HrF Hollis-Rock outcrop complex,very steep
1.5 1.5
Pt Pits, gravel 11.6 11.8
RhB Riverhead loam, 3 to 8 percentslopes
29.6 30.3
RhD Riverhead loam, 15 to 25percent slopes
6.3 6.5
RhE Riverhead loam, 25 to 50percent slopes
6.7 6.8
Uf Urban land 6.0 6.1
UhC Urban land-Charlton complex, 8to 15 percent slopes
5.8 6.0
UvC Urban land-Riverhead complex,8 to 15 percent slopes
0.1 0.1
Soil Survey of Westchester County, New YorkSoil Survey of Westchester County, New YorkSoil Survey of Westchester County, New YorkSoil Survey of Westchester County, New York Tripi Soils MapTripi Soils MapTripi Soils MapTripi Soils Map
Web Soil Survey 1.1National Cooperative Soil Survey
12/3/2006Page 3 of 3

THIS PAGE IS LEFT INTENTIONALLY BLANK

Michael Finan
Oval
Michael Finan
Text Box
SITE
Michael Finan
Line

THIS PAGE IS LEFT INTENTIONALLY BLANK
APPENDIX C
- PRE-DEVELOPMENT DRAINAGE DIVIDE MAP AND ROUTINGS
- POST-DEVELOPMENT DRAINAGE DIVIDE MAP AND ROUTINGS

THIS PAGE IS LEFT INTENTIONALLY BLANK


THIS PAGE IS LEFT INTENTIONALLY BLANK

1S
Subarea 12S
Subarea-2
3S
Subarea-3
4S
Subarea-4
5S
Subarea-56S
Subarea-6
7S
Subarea-7
DP-1
DP-1
DP-2
DP-2
DP-3
DP-3
DP-4
DP-4
DP-5
DP-5DP-6
DP-6
DP-7
DP-7
Drainage Diagram for Pre-Development - 2Prepared by Petruccelli Engineering, Printed 11/1/2010
HydroCAD® 9.10 s/n 05751 © 2009 HydroCAD Software Solutions LLC
Subcat Reach Pond Link

THIS PAGE IS LEFT INTENTIONALLY BLANK
Pre-Development - 2 Printed 11/1/2010Prepared by Petruccelli Engineering
Page 2HydroCAD® 9.10 s/n 05751 © 2009 HydroCAD Software Solutions LLC
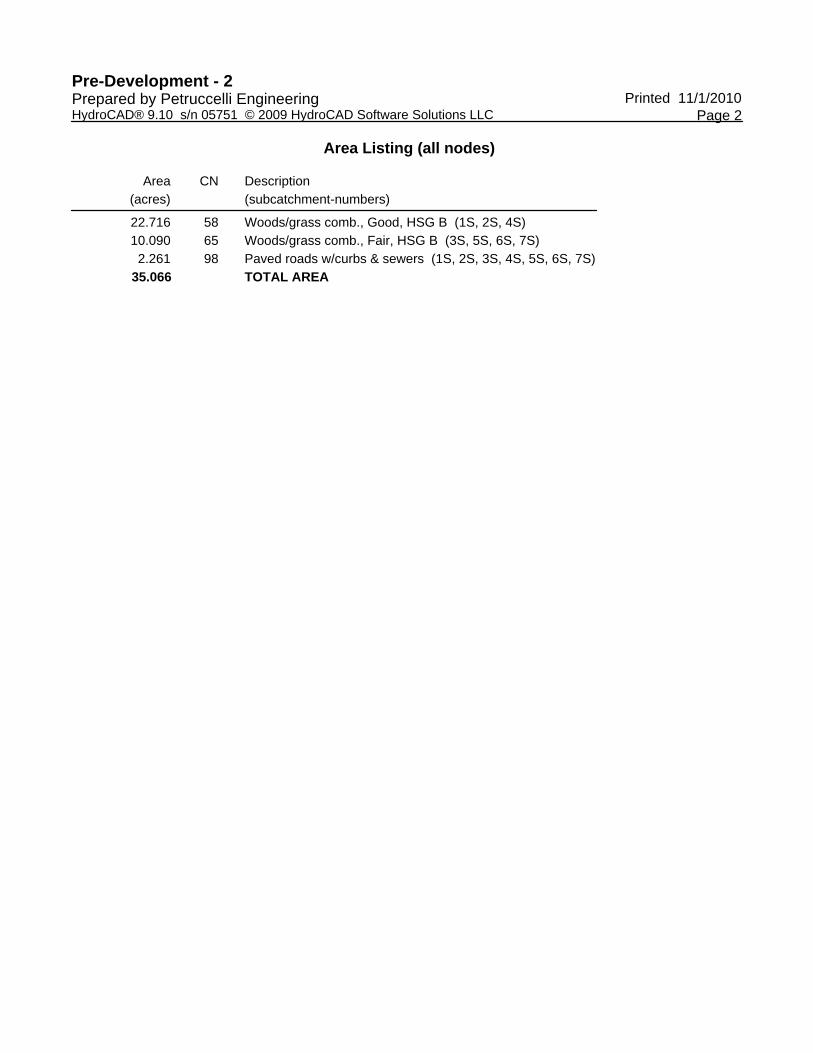
Area Listing (all nodes)
Area(acres)
CN Description(subcatchment-numbers)
22.716 58 Woods/grass comb., Good, HSG B (1S, 2S, 4S)10.090 65 Woods/grass comb., Fair, HSG B (3S, 5S, 6S, 7S)2.261 98 Paved roads w/curbs & sewers (1S, 2S, 3S, 4S, 5S, 6S, 7S)
35.066 TOTAL AREA

Pre-Development - 2 Printed 11/1/2010Prepared by Petruccelli Engineering
Page 3HydroCAD® 9.10 s/n 05751 © 2009 HydroCAD Software Solutions LLC
Soil Listing (all nodes)
Area(acres)
SoilGroup
SubcatchmentNumbers
0.000 HSG A32.806 HSG B 1S, 2S, 3S, 4S, 5S, 6S, 7S0.000 HSG C0.000 HSG D2.261 Other 1S, 2S, 3S, 4S, 5S, 6S, 7S
35.066 TOTAL AREA

Type III 24-hr 1 Year Rainfall=2.80"Pre-Development - 2 Printed 11/1/2010Prepared by Petruccelli Engineering
Page 4HydroCAD® 9.10 s/n 05751 © 2009 HydroCAD Software Solutions LLC
Time span=0.00-250.00 hrs, dt=0.01 hrs, 25001 pointsRunoff by SCS TR-20 method, UH=SCS
Reach routing by Stor-Ind method - Pond routing by Stor-Ind method
Runoff Area=14.548 ac 3.76% Impervious Runoff Depth=0.26"Subcatchment 1S: Subarea 1 Flow Length=1,389' Tc=25.0 min CN=60 Runoff=1.44 cfs 0.321 af
Runoff Area=228,729 sf 10.55% Impervious Runoff Depth=0.32"Subcatchment 2S: Subarea-2 Flow Length=821' Tc=21.0 min CN=62 Runoff=0.76 cfs 0.141 af
Runoff Area=105,316 sf 2.16% Impervious Runoff Depth=0.45"Subcatchment 3S: Subarea-3 Flow Length=634' Tc=17.0 min CN=66 Runoff=0.66 cfs 0.091 af
Runoff Area=186,025 sf 5.92% Impervious Runoff Depth=0.26"Subcatchment 4S: Subarea-4 Flow Length=680' Tc=19.6 min CN=60 Runoff=0.46 cfs 0.094 af
Runoff Area=136,628 sf 18.34% Impervious Runoff Depth=0.65"Subcatchment 5S: Subarea-5 Flow Length=877' Tc=21.9 min CN=71 Runoff=1.32 cfs 0.169 af
Runoff Area=100,951 sf 1.94% Impervious Runoff Depth=0.45"Subcatchment 6S: Subarea-6 Flow Length=504' Tc=13.5 min CN=66 Runoff=0.68 cfs 0.087 af
Runoff Area=136,133 sf 7.51% Impervious Runoff Depth=0.49"Subcatchment 7S: Subarea-7 Flow Length=594' Tc=12.8 min CN=67 Runoff=1.06 cfs 0.127 af
Inflow=1.44 cfs 0.321 afLink DP-1: DP-1 Primary=1.44 cfs 0.321 af
Inflow=0.76 cfs 0.141 afLink DP-2: DP-2 Primary=0.76 cfs 0.141 af
Inflow=0.66 cfs 0.091 afLink DP-3: DP-3 Primary=0.66 cfs 0.091 af
Inflow=0.46 cfs 0.094 afLink DP-4: DP-4 Primary=0.46 cfs 0.094 af
Inflow=1.32 cfs 0.169 afLink DP-5: DP-5 Primary=1.32 cfs 0.169 af
Inflow=0.68 cfs 0.087 afLink DP-6: DP-6 Primary=0.68 cfs 0.087 af
Inflow=1.06 cfs 0.127 afLink DP-7: DP-7 Primary=1.06 cfs 0.127 af
Total Runoff Area = 35.066 ac Runoff Volume = 1.031 af Average Runoff Depth = 0.35"93.55% Pervious = 32.806 ac 6.45% Impervious = 2.261 ac

Type III 24-hr 1 Year Rainfall=2.80"Pre-Development - 2 Printed 11/1/2010Prepared by Petruccelli Engineering
Page 5HydroCAD® 9.10 s/n 05751 © 2009 HydroCAD Software Solutions LLC
Summary for Subcatchment 1S: Subarea 1
Runoff = 1.44 cfs @ 12.58 hrs, Volume= 0.321 af, Depth= 0.26"
Runoff by SCS TR-20 method, UH=SCS, Time Span= 0.00-250.00 hrs, dt= 0.01 hrsType III 24-hr 1 Year Rainfall=2.80"
Area (ac) CN Description0.547 98 Paved roads w/curbs & sewers
14.001 58 Woods/grass comb., Good, HSG B14.548 60 Weighted Average14.001 96.24% Pervious Area
0.547 3.76% Impervious Area
Tc Length Slope Velocity Capacity Description(min) (feet) (ft/ft) (ft/sec) (cfs)10.8 100 0.1000 0.15 Sheet Flow, 1 to 2
Woods: Light underbrush n= 0.400 P2= 3.50"0.9 171 0.3600 3.00 Shallow Concentrated Flow, 2 to 3
Woodland Kv= 5.0 fps13.2 1,118 0.0800 1.41 Shallow Concentrated Flow, 3 to DP-1
Woodland Kv= 5.0 fps25.0 1,389 Total
Subcatchment 1S: Subarea 1
Runoff
Hydrograph
Time (hours)2502402302202102001901801701601501401301201101009080706050403020100
Flow
(cf
s)
1
0
Type III 24-hr 1 YearRainfall=2.80"
Runoff Area=14.548 acRunoff Volume=0.321 af
Runoff Depth=0.26"Flow Length=1,389'
Tc=25.0 minCN=60
1.44 cfs

Type III 24-hr 1 Year Rainfall=2.80"Pre-Development - 2 Printed 11/1/2010Prepared by Petruccelli Engineering
Page 6HydroCAD® 9.10 s/n 05751 © 2009 HydroCAD Software Solutions LLC
Summary for Subcatchment 2S: Subarea-2
Runoff = 0.76 cfs @ 12.48 hrs, Volume= 0.141 af, Depth= 0.32"
Runoff by SCS TR-20 method, UH=SCS, Time Span= 0.00-250.00 hrs, dt= 0.01 hrsType III 24-hr 1 Year Rainfall=2.80"
Area (sf) CN Description24,134 98 Paved roads w/curbs & sewers
204,595 58 Woods/grass comb., Good, HSG B228,729 62 Weighted Average204,595 89.45% Pervious Area
24,134 10.55% Impervious Area
Tc Length Slope Velocity Capacity Description(min) (feet) (ft/ft) (ft/sec) (cfs)
9.4 100 0.1400 0.18 Sheet Flow, 1 to 2Woods: Light underbrush n= 0.400 P2= 3.50"
11.6 721 0.0430 1.04 Shallow Concentrated Flow, 2 to 3Woodland Kv= 5.0 fps
21.0 821 Total
Subcatchment 2S: Subarea-2
Runoff
Hydrograph
Time (hours)2502402302202102001901801701601501401301201101009080706050403020100
Flow
(cf
s)
0.85
0.8
0.75
0.7
0.65
0.6
0.55
0.5
0.45
0.4
0.35
0.3
0.25
0.2
0.15
0.1
0.05
0
Type III 24-hr 1 YearRainfall=2.80"
Runoff Area=228,729 sfRunoff Volume=0.141 af
Runoff Depth=0.32"Flow Length=821'
Tc=21.0 minCN=62
0.76 cfs
Type III 24-hr 1 Year Rainfall=2.80"Pre-Development - 2 Printed 11/1/2010Prepared by Petruccelli Engineering
Page 7HydroCAD® 9.10 s/n 05751 © 2009 HydroCAD Software Solutions LLC
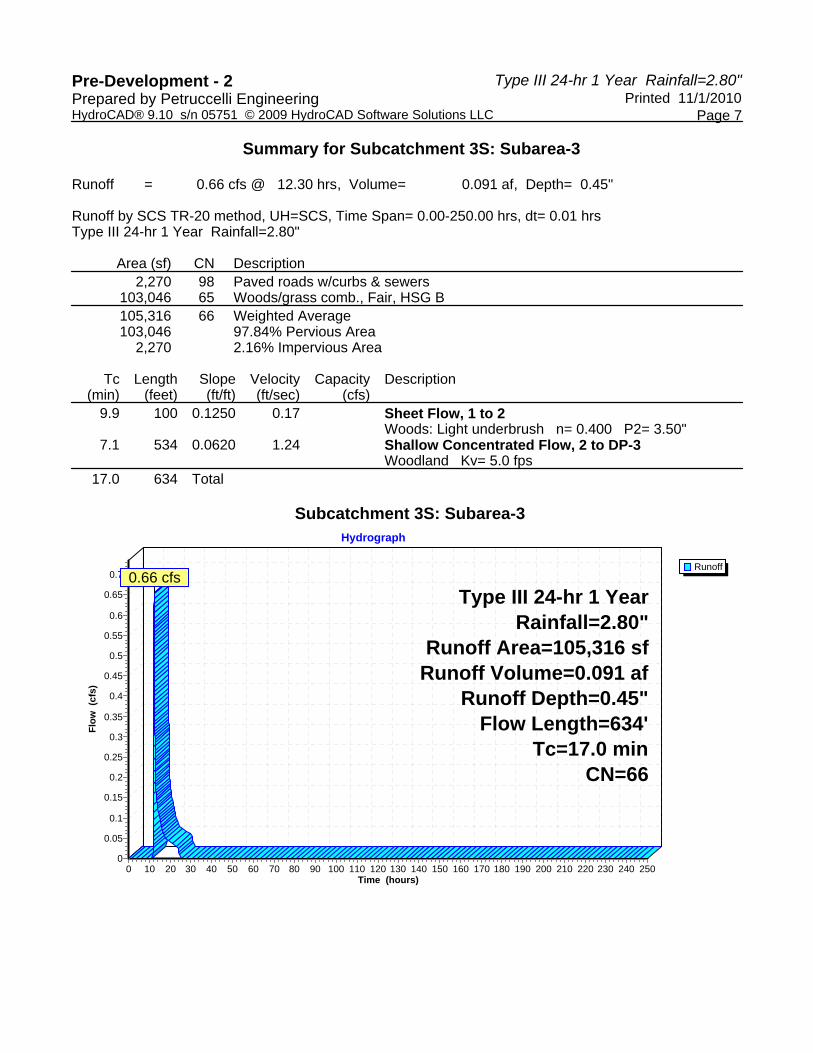
Summary for Subcatchment 3S: Subarea-3
Runoff = 0.66 cfs @ 12.30 hrs, Volume= 0.091 af, Depth= 0.45"
Runoff by SCS TR-20 method, UH=SCS, Time Span= 0.00-250.00 hrs, dt= 0.01 hrsType III 24-hr 1 Year Rainfall=2.80"
Area (sf) CN Description2,270 98 Paved roads w/curbs & sewers
103,046 65 Woods/grass comb., Fair, HSG B105,316 66 Weighted Average103,046 97.84% Pervious Area
2,270 2.16% Impervious Area
Tc Length Slope Velocity Capacity Description(min) (feet) (ft/ft) (ft/sec) (cfs)
9.9 100 0.1250 0.17 Sheet Flow, 1 to 2Woods: Light underbrush n= 0.400 P2= 3.50"
7.1 534 0.0620 1.24 Shallow Concentrated Flow, 2 to DP-3Woodland Kv= 5.0 fps
17.0 634 Total
Subcatchment 3S: Subarea-3
Runoff
Hydrograph
Time (hours)2502402302202102001901801701601501401301201101009080706050403020100
Flow
(cf
s)
0.7
0.65
0.6
0.55
0.5
0.45
0.4
0.35
0.3
0.25
0.2
0.15
0.1
0.05
0
Type III 24-hr 1 YearRainfall=2.80"
Runoff Area=105,316 sfRunoff Volume=0.091 af
Runoff Depth=0.45"Flow Length=634'
Tc=17.0 minCN=66
0.66 cfs
Type III 24-hr 1 Year Rainfall=2.80"Pre-Development - 2 Printed 11/1/2010Prepared by Petruccelli Engineering
Page 8HydroCAD® 9.10 s/n 05751 © 2009 HydroCAD Software Solutions LLC
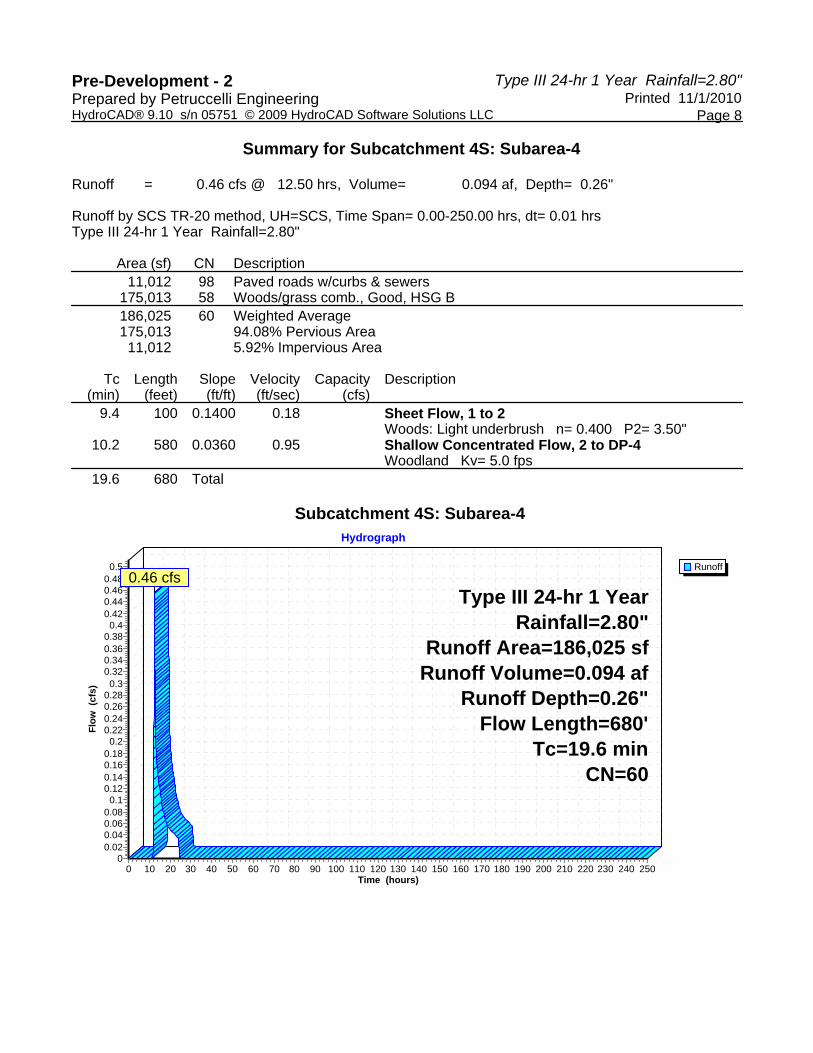
Summary for Subcatchment 4S: Subarea-4
Runoff = 0.46 cfs @ 12.50 hrs, Volume= 0.094 af, Depth= 0.26"
Runoff by SCS TR-20 method, UH=SCS, Time Span= 0.00-250.00 hrs, dt= 0.01 hrsType III 24-hr 1 Year Rainfall=2.80"
Area (sf) CN Description11,012 98 Paved roads w/curbs & sewers
175,013 58 Woods/grass comb., Good, HSG B186,025 60 Weighted Average175,013 94.08% Pervious Area
11,012 5.92% Impervious Area
Tc Length Slope Velocity Capacity Description(min) (feet) (ft/ft) (ft/sec) (cfs)
9.4 100 0.1400 0.18 Sheet Flow, 1 to 2Woods: Light underbrush n= 0.400 P2= 3.50"
10.2 580 0.0360 0.95 Shallow Concentrated Flow, 2 to DP-4Woodland Kv= 5.0 fps
19.6 680 Total
Subcatchment 4S: Subarea-4
Runoff
Hydrograph
Time (hours)2502402302202102001901801701601501401301201101009080706050403020100
Flow
(cf
s)
0.50.480.460.440.42
0.40.380.360.340.32
0.30.280.260.240.22
0.20.180.160.140.12
0.10.080.060.040.02
0
Type III 24-hr 1 YearRainfall=2.80"
Runoff Area=186,025 sfRunoff Volume=0.094 af
Runoff Depth=0.26"Flow Length=680'
Tc=19.6 minCN=60
0.46 cfs

Type III 24-hr 1 Year Rainfall=2.80"Pre-Development - 2 Printed 11/1/2010Prepared by Petruccelli Engineering
Page 9HydroCAD® 9.10 s/n 05751 © 2009 HydroCAD Software Solutions LLC
Summary for Subcatchment 5S: Subarea-5
Runoff = 1.32 cfs @ 12.35 hrs, Volume= 0.169 af, Depth= 0.65"
Runoff by SCS TR-20 method, UH=SCS, Time Span= 0.00-250.00 hrs, dt= 0.01 hrsType III 24-hr 1 Year Rainfall=2.80"
Area (sf) CN Description25,055 98 Paved roads w/curbs & sewers
111,573 65 Woods/grass comb., Fair, HSG B136,628 71 Weighted Average111,573 81.66% Pervious Area
25,055 18.34% Impervious Area
Tc Length Slope Velocity Capacity Description(min) (feet) (ft/ft) (ft/sec) (cfs)13.7 100 0.0550 0.12 Sheet Flow, 1 to 2
Woods: Light underbrush n= 0.400 P2= 3.50"8.2 777 0.0990 1.57 Shallow Concentrated Flow, 2 to DP-5
Woodland Kv= 5.0 fps21.9 877 Total
Subcatchment 5S: Subarea-5
Runoff
Hydrograph
Time (hours)2502402302202102001901801701601501401301201101009080706050403020100
Flow
(cf
s)
1
0
Type III 24-hr 1 YearRainfall=2.80"
Runoff Area=136,628 sfRunoff Volume=0.169 af
Runoff Depth=0.65"Flow Length=877'
Tc=21.9 minCN=71
1.32 cfs

Type III 24-hr 1 Year Rainfall=2.80"Pre-Development - 2 Printed 11/1/2010Prepared by Petruccelli Engineering
Page 10HydroCAD® 9.10 s/n 05751 © 2009 HydroCAD Software Solutions LLC
Summary for Subcatchment 6S: Subarea-6
Runoff = 0.68 cfs @ 12.24 hrs, Volume= 0.087 af, Depth= 0.45"
Runoff by SCS TR-20 method, UH=SCS, Time Span= 0.00-250.00 hrs, dt= 0.01 hrsType III 24-hr 1 Year Rainfall=2.80"
Area (sf) CN Description1,957 98 Paved roads w/curbs & sewers
98,994 65 Woods/grass comb., Fair, HSG B100,951 66 Weighted Average
98,994 98.06% Pervious Area1,957 1.94% Impervious Area
Tc Length Slope Velocity Capacity Description(min) (feet) (ft/ft) (ft/sec) (cfs)
9.7 100 0.1300 0.17 Sheet Flow, 1 to 2Woods: Light underbrush n= 0.400 P2= 3.50"
3.8 404 0.1260 1.77 Shallow Concentrated Flow, 2 to DP-6Woodland Kv= 5.0 fps
13.5 504 Total
Subcatchment 6S: Subarea-6
Runoff
Hydrograph
Time (hours)2502402302202102001901801701601501401301201101009080706050403020100
Flow
(cf
s)
0.75
0.7
0.65
0.6
0.55
0.5
0.45
0.4
0.35
0.3
0.25
0.2
0.15
0.1
0.05
0
Type III 24-hr 1 YearRainfall=2.80"
Runoff Area=100,951 sfRunoff Volume=0.087 af
Runoff Depth=0.45"Flow Length=504'
Tc=13.5 minCN=66
0.68 cfs

Type III 24-hr 1 Year Rainfall=2.80"Pre-Development - 2 Printed 11/1/2010Prepared by Petruccelli Engineering
Page 11HydroCAD® 9.10 s/n 05751 © 2009 HydroCAD Software Solutions LLC
Summary for Subcatchment 7S: Subarea-7
Runoff = 1.06 cfs @ 12.22 hrs, Volume= 0.127 af, Depth= 0.49"
Runoff by SCS TR-20 method, UH=SCS, Time Span= 0.00-250.00 hrs, dt= 0.01 hrsType III 24-hr 1 Year Rainfall=2.80"
Area (sf) CN Description10,223 98 Paved roads w/curbs & sewers
125,910 65 Woods/grass comb., Fair, HSG B136,133 67 Weighted Average125,910 92.49% Pervious Area
10,223 7.51% Impervious Area
Tc Length Slope Velocity Capacity Description(min) (feet) (ft/ft) (ft/sec) (cfs)
8.9 100 0.1600 0.19 Sheet Flow, 1 to 2Woods: Light underbrush n= 0.400 P2= 3.50"
3.9 494 0.1780 2.11 Shallow Concentrated Flow, 2 to DP-7Woodland Kv= 5.0 fps
12.8 594 Total
Subcatchment 7S: Subarea-7
Runoff
Hydrograph
Time (hours)2502402302202102001901801701601501401301201101009080706050403020100
Flow
(cf
s)
1
0
Type III 24-hr 1 YearRainfall=2.80"
Runoff Area=136,133 sfRunoff Volume=0.127 af
Runoff Depth=0.49"Flow Length=594'
Tc=12.8 minCN=67
1.06 cfs
Type III 24-hr 1 Year Rainfall=2.80"Pre-Development - 2 Printed 11/1/2010Prepared by Petruccelli Engineering
Page 12HydroCAD® 9.10 s/n 05751 © 2009 HydroCAD Software Solutions LLC
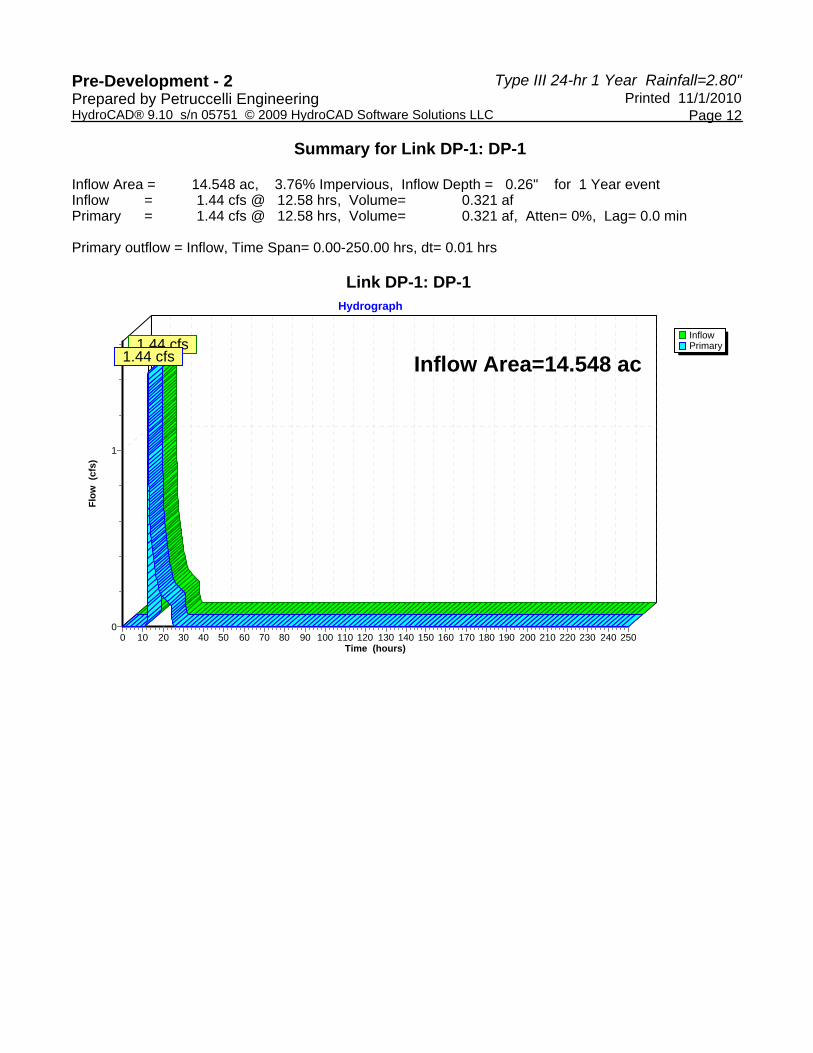
Summary for Link DP-1: DP-1
Inflow Area = 14.548 ac, 3.76% Impervious, Inflow Depth = 0.26" for 1 Year eventInflow = 1.44 cfs @ 12.58 hrs, Volume= 0.321 afPrimary = 1.44 cfs @ 12.58 hrs, Volume= 0.321 af, Atten= 0%, Lag= 0.0 min
Primary outflow = Inflow, Time Span= 0.00-250.00 hrs, dt= 0.01 hrs
Link DP-1: DP-1
InflowPrimary
Hydrograph
Time (hours)2502402302202102001901801701601501401301201101009080706050403020100
Flow
(cf
s)
1
0
Inflow Area=14.548 ac1.44 cfs
1.44 cfs

Type III 24-hr 1 Year Rainfall=2.80"Pre-Development - 2 Printed 11/1/2010Prepared by Petruccelli Engineering
Page 13HydroCAD® 9.10 s/n 05751 © 2009 HydroCAD Software Solutions LLC
Summary for Link DP-2: DP-2
Inflow Area = 5.251 ac, 10.55% Impervious, Inflow Depth = 0.32" for 1 Year eventInflow = 0.76 cfs @ 12.48 hrs, Volume= 0.141 afPrimary = 0.76 cfs @ 12.48 hrs, Volume= 0.141 af, Atten= 0%, Lag= 0.0 min
Primary outflow = Inflow, Time Span= 0.00-250.00 hrs, dt= 0.01 hrs
Link DP-2: DP-2
InflowPrimary
Hydrograph
Time (hours)2502402302202102001901801701601501401301201101009080706050403020100
Flow
(cf
s)
0.85
0.8
0.75
0.7
0.65
0.6
0.55
0.5
0.45
0.4
0.35
0.3
0.25
0.2
0.15
0.1
0.05
0
Inflow Area=5.251 ac0.76 cfs
0.76 cfs

Type III 24-hr 1 Year Rainfall=2.80"Pre-Development - 2 Printed 11/1/2010Prepared by Petruccelli Engineering
Page 14HydroCAD® 9.10 s/n 05751 © 2009 HydroCAD Software Solutions LLC
Summary for Link DP-3: DP-3
Inflow Area = 2.418 ac, 2.16% Impervious, Inflow Depth = 0.45" for 1 Year eventInflow = 0.66 cfs @ 12.30 hrs, Volume= 0.091 afPrimary = 0.66 cfs @ 12.30 hrs, Volume= 0.091 af, Atten= 0%, Lag= 0.0 min
Primary outflow = Inflow, Time Span= 0.00-250.00 hrs, dt= 0.01 hrs
Link DP-3: DP-3
InflowPrimary
Hydrograph
Time (hours)2502402302202102001901801701601501401301201101009080706050403020100
Flow
(cf
s)
0.7
0.65
0.6
0.55
0.5
0.45
0.4
0.35
0.3
0.25
0.2
0.15
0.1
0.05
0
Inflow Area=2.418 ac0.66 cfs
0.66 cfs
Type III 24-hr 1 Year Rainfall=2.80"Pre-Development - 2 Printed 11/1/2010Prepared by Petruccelli Engineering
Page 15HydroCAD® 9.10 s/n 05751 © 2009 HydroCAD Software Solutions LLC
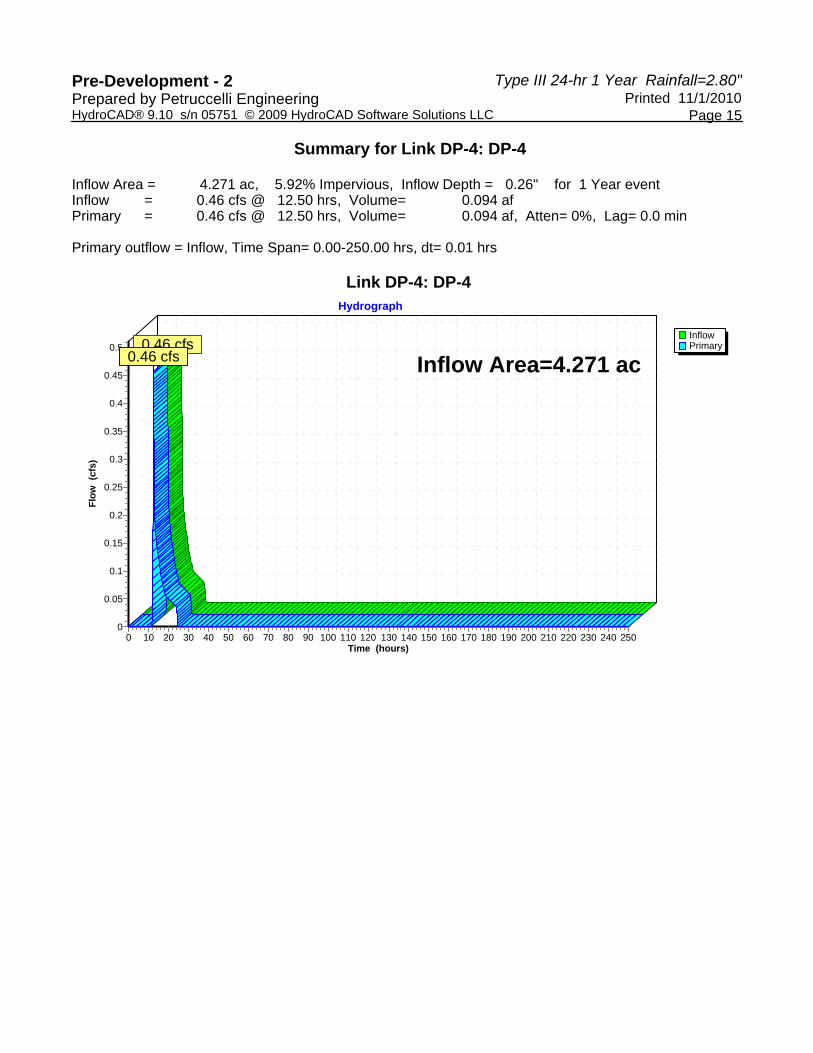
Summary for Link DP-4: DP-4
Inflow Area = 4.271 ac, 5.92% Impervious, Inflow Depth = 0.26" for 1 Year eventInflow = 0.46 cfs @ 12.50 hrs, Volume= 0.094 afPrimary = 0.46 cfs @ 12.50 hrs, Volume= 0.094 af, Atten= 0%, Lag= 0.0 min
Primary outflow = Inflow, Time Span= 0.00-250.00 hrs, dt= 0.01 hrs
Link DP-4: DP-4
InflowPrimary
Hydrograph
Time (hours)2502402302202102001901801701601501401301201101009080706050403020100
Flow
(cf
s)
0.5
0.45
0.4
0.35
0.3
0.25
0.2
0.15
0.1
0.05
0
Inflow Area=4.271 ac0.46 cfs
0.46 cfs

Type III 24-hr 1 Year Rainfall=2.80"Pre-Development - 2 Printed 11/1/2010Prepared by Petruccelli Engineering
Page 16HydroCAD® 9.10 s/n 05751 © 2009 HydroCAD Software Solutions LLC
Summary for Link DP-5: DP-5
Inflow Area = 3.137 ac, 18.34% Impervious, Inflow Depth = 0.65" for 1 Year eventInflow = 1.32 cfs @ 12.35 hrs, Volume= 0.169 afPrimary = 1.32 cfs @ 12.35 hrs, Volume= 0.169 af, Atten= 0%, Lag= 0.0 min
Primary outflow = Inflow, Time Span= 0.00-250.00 hrs, dt= 0.01 hrs
Link DP-5: DP-5
InflowPrimary
Hydrograph
Time (hours)2502402302202102001901801701601501401301201101009080706050403020100
Flow
(cf
s)
1
0
Inflow Area=3.137 ac1.32 cfs
1.32 cfs

Type III 24-hr 1 Year Rainfall=2.80"Pre-Development - 2 Printed 11/1/2010Prepared by Petruccelli Engineering
Page 17HydroCAD® 9.10 s/n 05751 © 2009 HydroCAD Software Solutions LLC
Summary for Link DP-6: DP-6
Inflow Area = 2.318 ac, 1.94% Impervious, Inflow Depth = 0.45" for 1 Year eventInflow = 0.68 cfs @ 12.24 hrs, Volume= 0.087 afPrimary = 0.68 cfs @ 12.24 hrs, Volume= 0.087 af, Atten= 0%, Lag= 0.0 min
Primary outflow = Inflow, Time Span= 0.00-250.00 hrs, dt= 0.01 hrs
Link DP-6: DP-6
InflowPrimary
Hydrograph
Time (hours)2502402302202102001901801701601501401301201101009080706050403020100
Flow
(cf
s)
0.75
0.7
0.65
0.6
0.55
0.5
0.45
0.4
0.35
0.3
0.25
0.2
0.15
0.1
0.05
0
Inflow Area=2.318 ac0.68 cfs
0.68 cfs

Type III 24-hr 1 Year Rainfall=2.80"Pre-Development - 2 Printed 11/1/2010Prepared by Petruccelli Engineering
Page 18HydroCAD® 9.10 s/n 05751 © 2009 HydroCAD Software Solutions LLC
Summary for Link DP-7: DP-7
Inflow Area = 3.125 ac, 7.51% Impervious, Inflow Depth = 0.49" for 1 Year eventInflow = 1.06 cfs @ 12.22 hrs, Volume= 0.127 afPrimary = 1.06 cfs @ 12.22 hrs, Volume= 0.127 af, Atten= 0%, Lag= 0.0 min
Primary outflow = Inflow, Time Span= 0.00-250.00 hrs, dt= 0.01 hrs
Link DP-7: DP-7
InflowPrimary
Hydrograph
Time (hours)2502402302202102001901801701601501401301201101009080706050403020100
Flow
(cf
s)
1
0
Inflow Area=3.125 ac1.06 cfs
1.06 cfs

Type III 24-hr 2 Year Rainfall=3.50"Pre-Development - 2 Printed 11/1/2010Prepared by Petruccelli Engineering
Page 19HydroCAD® 9.10 s/n 05751 © 2009 HydroCAD Software Solutions LLC
Time span=0.00-250.00 hrs, dt=0.01 hrs, 25001 pointsRunoff by SCS TR-20 method, UH=SCS
Reach routing by Stor-Ind method - Pond routing by Stor-Ind method
Runoff Area=14.548 ac 3.76% Impervious Runoff Depth=0.53"Subcatchment 1S: Subarea 1 Flow Length=1,389' Tc=25.0 min CN=60 Runoff=3.94 cfs 0.644 af
Runoff Area=228,729 sf 10.55% Impervious Runoff Depth=0.62"Subcatchment 2S: Subarea-2 Flow Length=821' Tc=21.0 min CN=62 Runoff=1.89 cfs 0.269 af
Runoff Area=105,316 sf 2.16% Impervious Runoff Depth=0.80"Subcatchment 3S: Subarea-3 Flow Length=634' Tc=17.0 min CN=66 Runoff=1.38 cfs 0.161 af
Runoff Area=186,025 sf 5.92% Impervious Runoff Depth=0.53"Subcatchment 4S: Subarea-4 Flow Length=680' Tc=19.6 min CN=60 Runoff=1.25 cfs 0.189 af
Runoff Area=136,628 sf 18.34% Impervious Runoff Depth=1.06"Subcatchment 5S: Subarea-5 Flow Length=877' Tc=21.9 min CN=71 Runoff=2.36 cfs 0.278 af
Runoff Area=100,951 sf 1.94% Impervious Runoff Depth=0.80"Subcatchment 6S: Subarea-6 Flow Length=504' Tc=13.5 min CN=66 Runoff=1.45 cfs 0.155 af
Runoff Area=136,133 sf 7.51% Impervious Runoff Depth=0.85"Subcatchment 7S: Subarea-7 Flow Length=594' Tc=12.8 min CN=67 Runoff=2.16 cfs 0.221 af
Inflow=3.94 cfs 0.644 afLink DP-1: DP-1 Primary=3.94 cfs 0.644 af
Inflow=1.89 cfs 0.269 afLink DP-2: DP-2 Primary=1.89 cfs 0.269 af
Inflow=1.38 cfs 0.161 afLink DP-3: DP-3 Primary=1.38 cfs 0.161 af
Inflow=1.25 cfs 0.189 afLink DP-4: DP-4 Primary=1.25 cfs 0.189 af
Inflow=2.36 cfs 0.278 afLink DP-5: DP-5 Primary=2.36 cfs 0.278 af
Inflow=1.45 cfs 0.155 afLink DP-6: DP-6 Primary=1.45 cfs 0.155 af
Inflow=2.16 cfs 0.221 afLink DP-7: DP-7 Primary=2.16 cfs 0.221 af
Total Runoff Area = 35.066 ac Runoff Volume = 1.918 af Average Runoff Depth = 0.66"93.55% Pervious = 32.806 ac 6.45% Impervious = 2.261 ac

Type III 24-hr 2 Year Rainfall=3.50"Pre-Development - 2 Printed 11/1/2010Prepared by Petruccelli Engineering
Page 20HydroCAD® 9.10 s/n 05751 © 2009 HydroCAD Software Solutions LLC
Summary for Subcatchment 1S: Subarea 1
Runoff = 3.94 cfs @ 12.47 hrs, Volume= 0.644 af, Depth= 0.53"
Runoff by SCS TR-20 method, UH=SCS, Time Span= 0.00-250.00 hrs, dt= 0.01 hrsType III 24-hr 2 Year Rainfall=3.50"
Area (ac) CN Description0.547 98 Paved roads w/curbs & sewers
14.001 58 Woods/grass comb., Good, HSG B14.548 60 Weighted Average14.001 96.24% Pervious Area
0.547 3.76% Impervious Area
Tc Length Slope Velocity Capacity Description(min) (feet) (ft/ft) (ft/sec) (cfs)10.8 100 0.1000 0.15 Sheet Flow, 1 to 2
Woods: Light underbrush n= 0.400 P2= 3.50"0.9 171 0.3600 3.00 Shallow Concentrated Flow, 2 to 3
Woodland Kv= 5.0 fps13.2 1,118 0.0800 1.41 Shallow Concentrated Flow, 3 to DP-1
Woodland Kv= 5.0 fps25.0 1,389 Total
Subcatchment 1S: Subarea 1
Runoff
Hydrograph
Time (hours)2502402302202102001901801701601501401301201101009080706050403020100
Flow
(cf
s)
4
3
2
1
0
Type III 24-hr 2 YearRainfall=3.50"
Runoff Area=14.548 acRunoff Volume=0.644 af
Runoff Depth=0.53"Flow Length=1,389'
Tc=25.0 minCN=60
3.94 cfs

Type III 24-hr 2 Year Rainfall=3.50"Pre-Development - 2 Printed 11/1/2010Prepared by Petruccelli Engineering
Page 21HydroCAD® 9.10 s/n 05751 © 2009 HydroCAD Software Solutions LLC
Summary for Subcatchment 2S: Subarea-2
Runoff = 1.89 cfs @ 12.37 hrs, Volume= 0.269 af, Depth= 0.62"
Runoff by SCS TR-20 method, UH=SCS, Time Span= 0.00-250.00 hrs, dt= 0.01 hrsType III 24-hr 2 Year Rainfall=3.50"
Area (sf) CN Description24,134 98 Paved roads w/curbs & sewers
204,595 58 Woods/grass comb., Good, HSG B228,729 62 Weighted Average204,595 89.45% Pervious Area
24,134 10.55% Impervious Area
Tc Length Slope Velocity Capacity Description(min) (feet) (ft/ft) (ft/sec) (cfs)
9.4 100 0.1400 0.18 Sheet Flow, 1 to 2Woods: Light underbrush n= 0.400 P2= 3.50"
11.6 721 0.0430 1.04 Shallow Concentrated Flow, 2 to 3Woodland Kv= 5.0 fps
21.0 821 Total
Subcatchment 2S: Subarea-2
Runoff
Hydrograph
Time (hours)2502402302202102001901801701601501401301201101009080706050403020100
Flow
(cf
s)
2
1
0
Type III 24-hr 2 YearRainfall=3.50"
Runoff Area=228,729 sfRunoff Volume=0.269 af
Runoff Depth=0.62"Flow Length=821'
Tc=21.0 minCN=62
1.89 cfs

Type III 24-hr 2 Year Rainfall=3.50"Pre-Development - 2 Printed 11/1/2010Prepared by Petruccelli Engineering
Page 22HydroCAD® 9.10 s/n 05751 © 2009 HydroCAD Software Solutions LLC
Summary for Subcatchment 3S: Subarea-3
Runoff = 1.38 cfs @ 12.27 hrs, Volume= 0.161 af, Depth= 0.80"
Runoff by SCS TR-20 method, UH=SCS, Time Span= 0.00-250.00 hrs, dt= 0.01 hrsType III 24-hr 2 Year Rainfall=3.50"
Area (sf) CN Description2,270 98 Paved roads w/curbs & sewers
103,046 65 Woods/grass comb., Fair, HSG B105,316 66 Weighted Average103,046 97.84% Pervious Area
2,270 2.16% Impervious Area
Tc Length Slope Velocity Capacity Description(min) (feet) (ft/ft) (ft/sec) (cfs)
9.9 100 0.1250 0.17 Sheet Flow, 1 to 2Woods: Light underbrush n= 0.400 P2= 3.50"
7.1 534 0.0620 1.24 Shallow Concentrated Flow, 2 to DP-3Woodland Kv= 5.0 fps
17.0 634 Total
Subcatchment 3S: Subarea-3
Runoff
Hydrograph
Time (hours)2502402302202102001901801701601501401301201101009080706050403020100
Flow
(cf
s)
1
0
Type III 24-hr 2 YearRainfall=3.50"
Runoff Area=105,316 sfRunoff Volume=0.161 af
Runoff Depth=0.80"Flow Length=634'
Tc=17.0 minCN=66
1.38 cfs

Type III 24-hr 2 Year Rainfall=3.50"Pre-Development - 2 Printed 11/1/2010Prepared by Petruccelli Engineering
Page 23HydroCAD® 9.10 s/n 05751 © 2009 HydroCAD Software Solutions LLC
Summary for Subcatchment 4S: Subarea-4
Runoff = 1.25 cfs @ 12.37 hrs, Volume= 0.189 af, Depth= 0.53"
Runoff by SCS TR-20 method, UH=SCS, Time Span= 0.00-250.00 hrs, dt= 0.01 hrsType III 24-hr 2 Year Rainfall=3.50"
Area (sf) CN Description11,012 98 Paved roads w/curbs & sewers
175,013 58 Woods/grass comb., Good, HSG B186,025 60 Weighted Average175,013 94.08% Pervious Area
11,012 5.92% Impervious Area
Tc Length Slope Velocity Capacity Description(min) (feet) (ft/ft) (ft/sec) (cfs)
9.4 100 0.1400 0.18 Sheet Flow, 1 to 2Woods: Light underbrush n= 0.400 P2= 3.50"
10.2 580 0.0360 0.95 Shallow Concentrated Flow, 2 to DP-4Woodland Kv= 5.0 fps
19.6 680 Total
Subcatchment 4S: Subarea-4
Runoff
Hydrograph
Time (hours)2502402302202102001901801701601501401301201101009080706050403020100
Flow
(cf
s)
1
0
Type III 24-hr 2 YearRainfall=3.50"
Runoff Area=186,025 sfRunoff Volume=0.189 af
Runoff Depth=0.53"Flow Length=680'
Tc=19.6 minCN=60
1.25 cfs

Type III 24-hr 2 Year Rainfall=3.50"Pre-Development - 2 Printed 11/1/2010Prepared by Petruccelli Engineering
Page 24HydroCAD® 9.10 s/n 05751 © 2009 HydroCAD Software Solutions LLC
Summary for Subcatchment 5S: Subarea-5
Runoff = 2.36 cfs @ 12.34 hrs, Volume= 0.278 af, Depth= 1.06"
Runoff by SCS TR-20 method, UH=SCS, Time Span= 0.00-250.00 hrs, dt= 0.01 hrsType III 24-hr 2 Year Rainfall=3.50"
Area (sf) CN Description25,055 98 Paved roads w/curbs & sewers
111,573 65 Woods/grass comb., Fair, HSG B136,628 71 Weighted Average111,573 81.66% Pervious Area
25,055 18.34% Impervious Area
Tc Length Slope Velocity Capacity Description(min) (feet) (ft/ft) (ft/sec) (cfs)13.7 100 0.0550 0.12 Sheet Flow, 1 to 2
Woods: Light underbrush n= 0.400 P2= 3.50"8.2 777 0.0990 1.57 Shallow Concentrated Flow, 2 to DP-5
Woodland Kv= 5.0 fps21.9 877 Total
Subcatchment 5S: Subarea-5
Runoff
Hydrograph
Time (hours)2502402302202102001901801701601501401301201101009080706050403020100
Flow
(cf
s)
2
1
0
Type III 24-hr 2 YearRainfall=3.50"
Runoff Area=136,628 sfRunoff Volume=0.278 af
Runoff Depth=1.06"Flow Length=877'
Tc=21.9 minCN=71
2.36 cfs

Type III 24-hr 2 Year Rainfall=3.50"Pre-Development - 2 Printed 11/1/2010Prepared by Petruccelli Engineering
Page 25HydroCAD® 9.10 s/n 05751 © 2009 HydroCAD Software Solutions LLC
Summary for Subcatchment 6S: Subarea-6
Runoff = 1.45 cfs @ 12.21 hrs, Volume= 0.155 af, Depth= 0.80"
Runoff by SCS TR-20 method, UH=SCS, Time Span= 0.00-250.00 hrs, dt= 0.01 hrsType III 24-hr 2 Year Rainfall=3.50"
Area (sf) CN Description1,957 98 Paved roads w/curbs & sewers
98,994 65 Woods/grass comb., Fair, HSG B100,951 66 Weighted Average
98,994 98.06% Pervious Area1,957 1.94% Impervious Area
Tc Length Slope Velocity Capacity Description(min) (feet) (ft/ft) (ft/sec) (cfs)
9.7 100 0.1300 0.17 Sheet Flow, 1 to 2Woods: Light underbrush n= 0.400 P2= 3.50"
3.8 404 0.1260 1.77 Shallow Concentrated Flow, 2 to DP-6Woodland Kv= 5.0 fps
13.5 504 Total
Subcatchment 6S: Subarea-6
Runoff
Hydrograph
Time (hours)2502402302202102001901801701601501401301201101009080706050403020100
Flow
(cf
s)
1
0
Type III 24-hr 2 YearRainfall=3.50"
Runoff Area=100,951 sfRunoff Volume=0.155 af
Runoff Depth=0.80"Flow Length=504'
Tc=13.5 minCN=66
1.45 cfs
Type III 24-hr 2 Year Rainfall=3.50"Pre-Development - 2 Printed 11/1/2010Prepared by Petruccelli Engineering
Page 26HydroCAD® 9.10 s/n 05751 © 2009 HydroCAD Software Solutions LLC
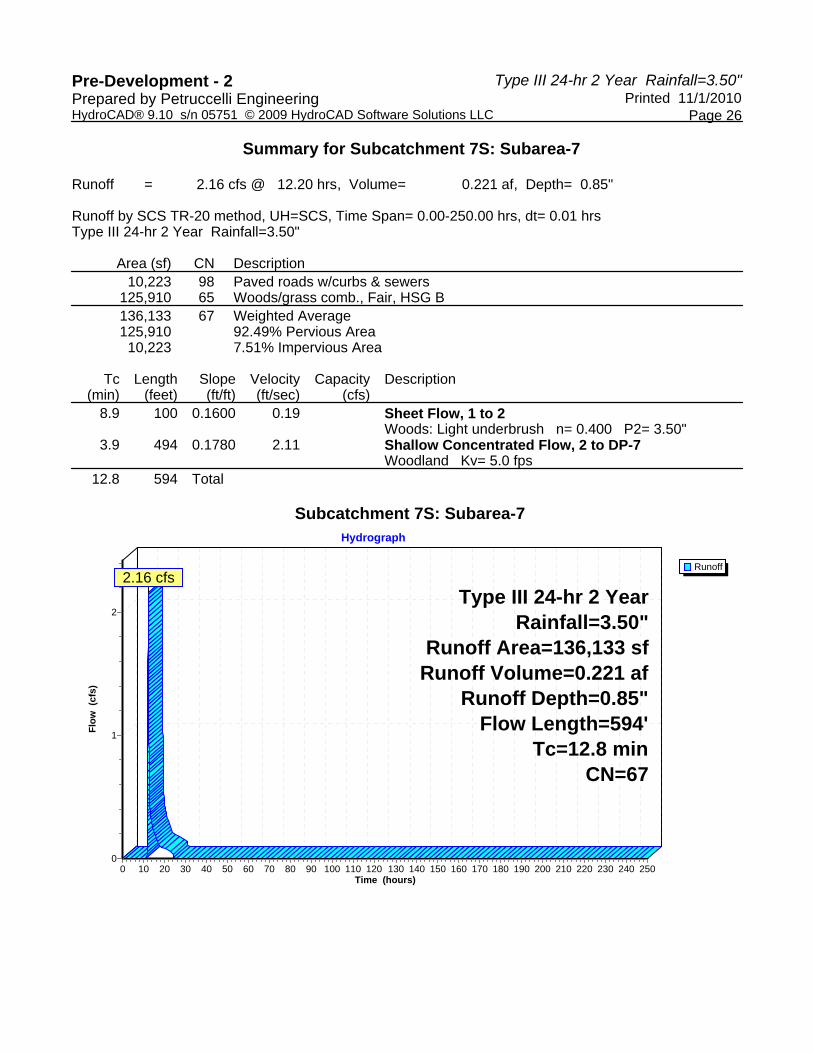
Summary for Subcatchment 7S: Subarea-7
Runoff = 2.16 cfs @ 12.20 hrs, Volume= 0.221 af, Depth= 0.85"
Runoff by SCS TR-20 method, UH=SCS, Time Span= 0.00-250.00 hrs, dt= 0.01 hrsType III 24-hr 2 Year Rainfall=3.50"
Area (sf) CN Description10,223 98 Paved roads w/curbs & sewers
125,910 65 Woods/grass comb., Fair, HSG B136,133 67 Weighted Average125,910 92.49% Pervious Area
10,223 7.51% Impervious Area
Tc Length Slope Velocity Capacity Description(min) (feet) (ft/ft) (ft/sec) (cfs)
8.9 100 0.1600 0.19 Sheet Flow, 1 to 2Woods: Light underbrush n= 0.400 P2= 3.50"
3.9 494 0.1780 2.11 Shallow Concentrated Flow, 2 to DP-7Woodland Kv= 5.0 fps
12.8 594 Total
Subcatchment 7S: Subarea-7
Runoff
Hydrograph
Time (hours)2502402302202102001901801701601501401301201101009080706050403020100
Flow
(cf
s)
2
1
0
Type III 24-hr 2 YearRainfall=3.50"
Runoff Area=136,133 sfRunoff Volume=0.221 af
Runoff Depth=0.85"Flow Length=594'
Tc=12.8 minCN=67
2.16 cfs

Type III 24-hr 2 Year Rainfall=3.50"Pre-Development - 2 Printed 11/1/2010Prepared by Petruccelli Engineering
Page 27HydroCAD® 9.10 s/n 05751 © 2009 HydroCAD Software Solutions LLC
Summary for Link DP-1: DP-1
Inflow Area = 14.548 ac, 3.76% Impervious, Inflow Depth = 0.53" for 2 Year eventInflow = 3.94 cfs @ 12.47 hrs, Volume= 0.644 afPrimary = 3.94 cfs @ 12.47 hrs, Volume= 0.644 af, Atten= 0%, Lag= 0.0 min
Primary outflow = Inflow, Time Span= 0.00-250.00 hrs, dt= 0.01 hrs
Link DP-1: DP-1
InflowPrimary
Hydrograph
Time (hours)2502402302202102001901801701601501401301201101009080706050403020100
Flow
(cf
s)
4
3
2
1
0
Inflow Area=14.548 ac3.94 cfs
3.94 cfs

Type III 24-hr 2 Year Rainfall=3.50"Pre-Development - 2 Printed 11/1/2010Prepared by Petruccelli Engineering
Page 28HydroCAD® 9.10 s/n 05751 © 2009 HydroCAD Software Solutions LLC
Summary for Link DP-2: DP-2
Inflow Area = 5.251 ac, 10.55% Impervious, Inflow Depth = 0.62" for 2 Year eventInflow = 1.89 cfs @ 12.37 hrs, Volume= 0.269 afPrimary = 1.89 cfs @ 12.37 hrs, Volume= 0.269 af, Atten= 0%, Lag= 0.0 min
Primary outflow = Inflow, Time Span= 0.00-250.00 hrs, dt= 0.01 hrs
Link DP-2: DP-2
InflowPrimary
Hydrograph
Time (hours)2502402302202102001901801701601501401301201101009080706050403020100
Flow
(cf
s)
2
1
0
Inflow Area=5.251 ac1.89 cfs
1.89 cfs

Type III 24-hr 2 Year Rainfall=3.50"Pre-Development - 2 Printed 11/1/2010Prepared by Petruccelli Engineering
Page 29HydroCAD® 9.10 s/n 05751 © 2009 HydroCAD Software Solutions LLC
Summary for Link DP-3: DP-3
Inflow Area = 2.418 ac, 2.16% Impervious, Inflow Depth = 0.80" for 2 Year eventInflow = 1.38 cfs @ 12.27 hrs, Volume= 0.161 afPrimary = 1.38 cfs @ 12.27 hrs, Volume= 0.161 af, Atten= 0%, Lag= 0.0 min
Primary outflow = Inflow, Time Span= 0.00-250.00 hrs, dt= 0.01 hrs
Link DP-3: DP-3
InflowPrimary
Hydrograph
Time (hours)2502402302202102001901801701601501401301201101009080706050403020100
Flow
(cf
s)
1
0
Inflow Area=2.418 ac1.38 cfs
1.38 cfs

Type III 24-hr 2 Year Rainfall=3.50"Pre-Development - 2 Printed 11/1/2010Prepared by Petruccelli Engineering
Page 30HydroCAD® 9.10 s/n 05751 © 2009 HydroCAD Software Solutions LLC
Summary for Link DP-4: DP-4
Inflow Area = 4.271 ac, 5.92% Impervious, Inflow Depth = 0.53" for 2 Year eventInflow = 1.25 cfs @ 12.37 hrs, Volume= 0.189 afPrimary = 1.25 cfs @ 12.37 hrs, Volume= 0.189 af, Atten= 0%, Lag= 0.0 min
Primary outflow = Inflow, Time Span= 0.00-250.00 hrs, dt= 0.01 hrs
Link DP-4: DP-4
InflowPrimary
Hydrograph
Time (hours)2502402302202102001901801701601501401301201101009080706050403020100
Flow
(cf
s)
1
0
Inflow Area=4.271 ac1.25 cfs
1.25 cfs

Type III 24-hr 2 Year Rainfall=3.50"Pre-Development - 2 Printed 11/1/2010Prepared by Petruccelli Engineering
Page 31HydroCAD® 9.10 s/n 05751 © 2009 HydroCAD Software Solutions LLC
Summary for Link DP-5: DP-5
Inflow Area = 3.137 ac, 18.34% Impervious, Inflow Depth = 1.06" for 2 Year eventInflow = 2.36 cfs @ 12.34 hrs, Volume= 0.278 afPrimary = 2.36 cfs @ 12.34 hrs, Volume= 0.278 af, Atten= 0%, Lag= 0.0 min
Primary outflow = Inflow, Time Span= 0.00-250.00 hrs, dt= 0.01 hrs
Link DP-5: DP-5
InflowPrimary
Hydrograph
Time (hours)2502402302202102001901801701601501401301201101009080706050403020100
Flow
(cf
s)
2
1
0
Inflow Area=3.137 ac2.36 cfs
2.36 cfs

Type III 24-hr 2 Year Rainfall=3.50"Pre-Development - 2 Printed 11/1/2010Prepared by Petruccelli Engineering
Page 32HydroCAD® 9.10 s/n 05751 © 2009 HydroCAD Software Solutions LLC
Summary for Link DP-6: DP-6
Inflow Area = 2.318 ac, 1.94% Impervious, Inflow Depth = 0.80" for 2 Year eventInflow = 1.45 cfs @ 12.21 hrs, Volume= 0.155 afPrimary = 1.45 cfs @ 12.21 hrs, Volume= 0.155 af, Atten= 0%, Lag= 0.0 min
Primary outflow = Inflow, Time Span= 0.00-250.00 hrs, dt= 0.01 hrs
Link DP-6: DP-6
InflowPrimary
Hydrograph
Time (hours)2502402302202102001901801701601501401301201101009080706050403020100
Flow
(cf
s)
1
0
Inflow Area=2.318 ac1.45 cfs
1.45 cfs

Type III 24-hr 2 Year Rainfall=3.50"Pre-Development - 2 Printed 11/1/2010Prepared by Petruccelli Engineering
Page 33HydroCAD® 9.10 s/n 05751 © 2009 HydroCAD Software Solutions LLC
Summary for Link DP-7: DP-7
Inflow Area = 3.125 ac, 7.51% Impervious, Inflow Depth = 0.85" for 2 Year eventInflow = 2.16 cfs @ 12.20 hrs, Volume= 0.221 afPrimary = 2.16 cfs @ 12.20 hrs, Volume= 0.221 af, Atten= 0%, Lag= 0.0 min
Primary outflow = Inflow, Time Span= 0.00-250.00 hrs, dt= 0.01 hrs
Link DP-7: DP-7
InflowPrimary
Hydrograph
Time (hours)2502402302202102001901801701601501401301201101009080706050403020100
Flow
(cf
s)
2
1
0
Inflow Area=3.125 ac2.16 cfs
2.16 cfs

Type III 24-hr 10 Year Rainfall=5.00"Pre-Development - 2 Printed 11/1/2010Prepared by Petruccelli Engineering
Page 34HydroCAD® 9.10 s/n 05751 © 2009 HydroCAD Software Solutions LLC
Time span=0.00-250.00 hrs, dt=0.01 hrs, 25001 pointsRunoff by SCS TR-20 method, UH=SCS
Reach routing by Stor-Ind method - Pond routing by Stor-Ind method
Runoff Area=14.548 ac 3.76% Impervious Runoff Depth=1.30"Subcatchment 1S: Subarea 1 Flow Length=1,389' Tc=25.0 min CN=60 Runoff=12.15 cfs 1.577 af
Runoff Area=228,729 sf 10.55% Impervious Runoff Depth=1.44"Subcatchment 2S: Subarea-2 Flow Length=821' Tc=21.0 min CN=62 Runoff=5.35 cfs 0.629 af
Runoff Area=105,316 sf 2.16% Impervious Runoff Depth=1.73"Subcatchment 3S: Subarea-3 Flow Length=634' Tc=17.0 min CN=66 Runoff=3.36 cfs 0.348 af
Runoff Area=186,025 sf 5.92% Impervious Runoff Depth=1.30"Subcatchment 4S: Subarea-4 Flow Length=680' Tc=19.6 min CN=60 Runoff=3.94 cfs 0.463 af
Runoff Area=136,628 sf 18.34% Impervious Runoff Depth=2.12"Subcatchment 5S: Subarea-5 Flow Length=877' Tc=21.9 min CN=71 Runoff=4.96 cfs 0.553 af
Runoff Area=100,951 sf 1.94% Impervious Runoff Depth=1.73"Subcatchment 6S: Subarea-6 Flow Length=504' Tc=13.5 min CN=66 Runoff=3.52 cfs 0.334 af
Runoff Area=136,133 sf 7.51% Impervious Runoff Depth=1.80"Subcatchment 7S: Subarea-7 Flow Length=594' Tc=12.8 min CN=67 Runoff=5.10 cfs 0.470 af
Inflow=12.15 cfs 1.577 afLink DP-1: DP-1 Primary=12.15 cfs 1.577 af
Inflow=5.35 cfs 0.629 afLink DP-2: DP-2 Primary=5.35 cfs 0.629 af
Inflow=3.36 cfs 0.348 afLink DP-3: DP-3 Primary=3.36 cfs 0.348 af
Inflow=3.94 cfs 0.463 afLink DP-4: DP-4 Primary=3.94 cfs 0.463 af
Inflow=4.96 cfs 0.553 afLink DP-5: DP-5 Primary=4.96 cfs 0.553 af
Inflow=3.52 cfs 0.334 afLink DP-6: DP-6 Primary=3.52 cfs 0.334 af
Inflow=5.10 cfs 0.470 afLink DP-7: DP-7 Primary=5.10 cfs 0.470 af
Total Runoff Area = 35.066 ac Runoff Volume = 4.374 af Average Runoff Depth = 1.50"93.55% Pervious = 32.806 ac 6.45% Impervious = 2.261 ac

Type III 24-hr 10 Year Rainfall=5.00"Pre-Development - 2 Printed 11/1/2010Prepared by Petruccelli Engineering
Page 35HydroCAD® 9.10 s/n 05751 © 2009 HydroCAD Software Solutions LLC
Summary for Subcatchment 1S: Subarea 1
Runoff = 12.15 cfs @ 12.39 hrs, Volume= 1.577 af, Depth= 1.30"
Runoff by SCS TR-20 method, UH=SCS, Time Span= 0.00-250.00 hrs, dt= 0.01 hrsType III 24-hr 10 Year Rainfall=5.00"
Area (ac) CN Description0.547 98 Paved roads w/curbs & sewers
14.001 58 Woods/grass comb., Good, HSG B14.548 60 Weighted Average14.001 96.24% Pervious Area
0.547 3.76% Impervious Area
Tc Length Slope Velocity Capacity Description(min) (feet) (ft/ft) (ft/sec) (cfs)10.8 100 0.1000 0.15 Sheet Flow, 1 to 2
Woods: Light underbrush n= 0.400 P2= 3.50"0.9 171 0.3600 3.00 Shallow Concentrated Flow, 2 to 3
Woodland Kv= 5.0 fps13.2 1,118 0.0800 1.41 Shallow Concentrated Flow, 3 to DP-1
Woodland Kv= 5.0 fps25.0 1,389 Total
Subcatchment 1S: Subarea 1
Runoff
Hydrograph
Time (hours)2502402302202102001901801701601501401301201101009080706050403020100
Flow
(cf
s)
13
12
11
10
9
8
7
6
5
4
3
2
1
0
Type III 24-hr 10 YearRainfall=5.00"
Runoff Area=14.548 acRunoff Volume=1.577 af
Runoff Depth=1.30"Flow Length=1,389'
Tc=25.0 minCN=60
12.15 cfs

Type III 24-hr 10 Year Rainfall=5.00"Pre-Development - 2 Printed 11/1/2010Prepared by Petruccelli Engineering
Page 36HydroCAD® 9.10 s/n 05751 © 2009 HydroCAD Software Solutions LLC
Summary for Subcatchment 2S: Subarea-2
Runoff = 5.35 cfs @ 12.32 hrs, Volume= 0.629 af, Depth= 1.44"
Runoff by SCS TR-20 method, UH=SCS, Time Span= 0.00-250.00 hrs, dt= 0.01 hrsType III 24-hr 10 Year Rainfall=5.00"
Area (sf) CN Description24,134 98 Paved roads w/curbs & sewers
204,595 58 Woods/grass comb., Good, HSG B228,729 62 Weighted Average204,595 89.45% Pervious Area
24,134 10.55% Impervious Area
Tc Length Slope Velocity Capacity Description(min) (feet) (ft/ft) (ft/sec) (cfs)
9.4 100 0.1400 0.18 Sheet Flow, 1 to 2Woods: Light underbrush n= 0.400 P2= 3.50"
11.6 721 0.0430 1.04 Shallow Concentrated Flow, 2 to 3Woodland Kv= 5.0 fps
21.0 821 Total
Subcatchment 2S: Subarea-2
Runoff
Hydrograph
Time (hours)2502402302202102001901801701601501401301201101009080706050403020100
Flow
(cf
s)
5
4
3
2
1
0
Type III 24-hr 10 YearRainfall=5.00"
Runoff Area=228,729 sfRunoff Volume=0.629 af
Runoff Depth=1.44"Flow Length=821'
Tc=21.0 minCN=62
5.35 cfs

Type III 24-hr 10 Year Rainfall=5.00"Pre-Development - 2 Printed 11/1/2010Prepared by Petruccelli Engineering
Page 37HydroCAD® 9.10 s/n 05751 © 2009 HydroCAD Software Solutions LLC
Summary for Subcatchment 3S: Subarea-3
Runoff = 3.36 cfs @ 12.25 hrs, Volume= 0.348 af, Depth= 1.73"
Runoff by SCS TR-20 method, UH=SCS, Time Span= 0.00-250.00 hrs, dt= 0.01 hrsType III 24-hr 10 Year Rainfall=5.00"
Area (sf) CN Description2,270 98 Paved roads w/curbs & sewers
103,046 65 Woods/grass comb., Fair, HSG B105,316 66 Weighted Average103,046 97.84% Pervious Area
2,270 2.16% Impervious Area
Tc Length Slope Velocity Capacity Description(min) (feet) (ft/ft) (ft/sec) (cfs)
9.9 100 0.1250 0.17 Sheet Flow, 1 to 2Woods: Light underbrush n= 0.400 P2= 3.50"
7.1 534 0.0620 1.24 Shallow Concentrated Flow, 2 to DP-3Woodland Kv= 5.0 fps
17.0 634 Total
Subcatchment 3S: Subarea-3
Runoff
Hydrograph
Time (hours)2502402302202102001901801701601501401301201101009080706050403020100
Flow
(cf
s)
3
2
1
0
Type III 24-hr 10 YearRainfall=5.00"
Runoff Area=105,316 sfRunoff Volume=0.348 af
Runoff Depth=1.73"Flow Length=634'
Tc=17.0 minCN=66
3.36 cfs
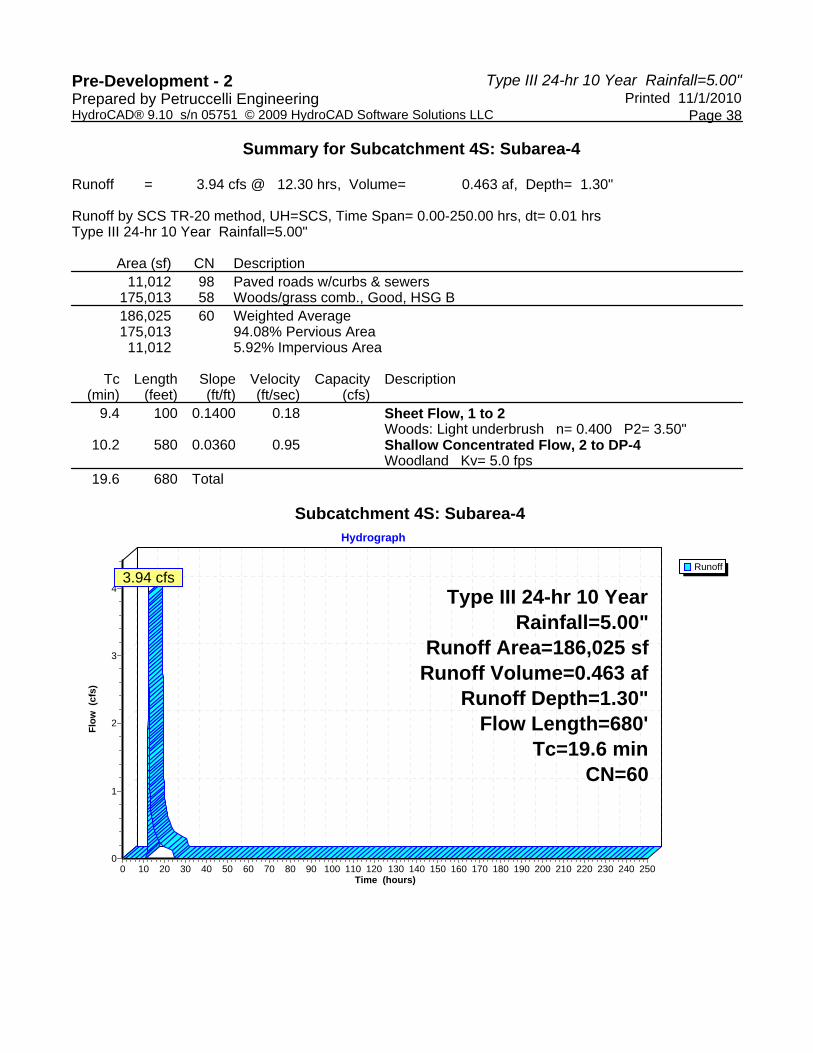
Type III 24-hr 10 Year Rainfall=5.00"Pre-Development - 2 Printed 11/1/2010Prepared by Petruccelli Engineering
Page 38HydroCAD® 9.10 s/n 05751 © 2009 HydroCAD Software Solutions LLC
Summary for Subcatchment 4S: Subarea-4
Runoff = 3.94 cfs @ 12.30 hrs, Volume= 0.463 af, Depth= 1.30"
Runoff by SCS TR-20 method, UH=SCS, Time Span= 0.00-250.00 hrs, dt= 0.01 hrsType III 24-hr 10 Year Rainfall=5.00"
Area (sf) CN Description11,012 98 Paved roads w/curbs & sewers
175,013 58 Woods/grass comb., Good, HSG B186,025 60 Weighted Average175,013 94.08% Pervious Area
11,012 5.92% Impervious Area
Tc Length Slope Velocity Capacity Description(min) (feet) (ft/ft) (ft/sec) (cfs)
9.4 100 0.1400 0.18 Sheet Flow, 1 to 2Woods: Light underbrush n= 0.400 P2= 3.50"
10.2 580 0.0360 0.95 Shallow Concentrated Flow, 2 to DP-4Woodland Kv= 5.0 fps
19.6 680 Total
Subcatchment 4S: Subarea-4
Runoff
Hydrograph
Time (hours)2502402302202102001901801701601501401301201101009080706050403020100
Flow
(cf
s)
4
3
2
1
0
Type III 24-hr 10 YearRainfall=5.00"
Runoff Area=186,025 sfRunoff Volume=0.463 af
Runoff Depth=1.30"Flow Length=680'
Tc=19.6 minCN=60
3.94 cfs

Type III 24-hr 10 Year Rainfall=5.00"Pre-Development - 2 Printed 11/1/2010Prepared by Petruccelli Engineering
Page 39HydroCAD® 9.10 s/n 05751 © 2009 HydroCAD Software Solutions LLC
Summary for Subcatchment 5S: Subarea-5
Runoff = 4.96 cfs @ 12.31 hrs, Volume= 0.553 af, Depth= 2.12"
Runoff by SCS TR-20 method, UH=SCS, Time Span= 0.00-250.00 hrs, dt= 0.01 hrsType III 24-hr 10 Year Rainfall=5.00"
Area (sf) CN Description25,055 98 Paved roads w/curbs & sewers
111,573 65 Woods/grass comb., Fair, HSG B136,628 71 Weighted Average111,573 81.66% Pervious Area
25,055 18.34% Impervious Area
Tc Length Slope Velocity Capacity Description(min) (feet) (ft/ft) (ft/sec) (cfs)13.7 100 0.0550 0.12 Sheet Flow, 1 to 2
Woods: Light underbrush n= 0.400 P2= 3.50"8.2 777 0.0990 1.57 Shallow Concentrated Flow, 2 to DP-5
Woodland Kv= 5.0 fps21.9 877 Total
Subcatchment 5S: Subarea-5
Runoff
Hydrograph
Time (hours)2502402302202102001901801701601501401301201101009080706050403020100
Flow
(cf
s)
5
4
3
2
1
0
Type III 24-hr 10 YearRainfall=5.00"
Runoff Area=136,628 sfRunoff Volume=0.553 af
Runoff Depth=2.12"Flow Length=877'
Tc=21.9 minCN=71
4.96 cfs

Type III 24-hr 10 Year Rainfall=5.00"Pre-Development - 2 Printed 11/1/2010Prepared by Petruccelli Engineering
Page 40HydroCAD® 9.10 s/n 05751 © 2009 HydroCAD Software Solutions LLC
Summary for Subcatchment 6S: Subarea-6
Runoff = 3.52 cfs @ 12.20 hrs, Volume= 0.334 af, Depth= 1.73"
Runoff by SCS TR-20 method, UH=SCS, Time Span= 0.00-250.00 hrs, dt= 0.01 hrsType III 24-hr 10 Year Rainfall=5.00"
Area (sf) CN Description1,957 98 Paved roads w/curbs & sewers
98,994 65 Woods/grass comb., Fair, HSG B100,951 66 Weighted Average
98,994 98.06% Pervious Area1,957 1.94% Impervious Area
Tc Length Slope Velocity Capacity Description(min) (feet) (ft/ft) (ft/sec) (cfs)
9.7 100 0.1300 0.17 Sheet Flow, 1 to 2Woods: Light underbrush n= 0.400 P2= 3.50"
3.8 404 0.1260 1.77 Shallow Concentrated Flow, 2 to DP-6Woodland Kv= 5.0 fps
13.5 504 Total
Subcatchment 6S: Subarea-6
Runoff
Hydrograph
Time (hours)2502402302202102001901801701601501401301201101009080706050403020100
Flow
(cf
s)
3
2
1
0
Type III 24-hr 10 YearRainfall=5.00"
Runoff Area=100,951 sfRunoff Volume=0.334 af
Runoff Depth=1.73"Flow Length=504'
Tc=13.5 minCN=66
3.52 cfs

Type III 24-hr 10 Year Rainfall=5.00"Pre-Development - 2 Printed 11/1/2010Prepared by Petruccelli Engineering
Page 41HydroCAD® 9.10 s/n 05751 © 2009 HydroCAD Software Solutions LLC
Summary for Subcatchment 7S: Subarea-7
Runoff = 5.10 cfs @ 12.19 hrs, Volume= 0.470 af, Depth= 1.80"
Runoff by SCS TR-20 method, UH=SCS, Time Span= 0.00-250.00 hrs, dt= 0.01 hrsType III 24-hr 10 Year Rainfall=5.00"
Area (sf) CN Description10,223 98 Paved roads w/curbs & sewers
125,910 65 Woods/grass comb., Fair, HSG B136,133 67 Weighted Average125,910 92.49% Pervious Area
10,223 7.51% Impervious Area
Tc Length Slope Velocity Capacity Description(min) (feet) (ft/ft) (ft/sec) (cfs)
8.9 100 0.1600 0.19 Sheet Flow, 1 to 2Woods: Light underbrush n= 0.400 P2= 3.50"
3.9 494 0.1780 2.11 Shallow Concentrated Flow, 2 to DP-7Woodland Kv= 5.0 fps
12.8 594 Total
Subcatchment 7S: Subarea-7
Runoff
Hydrograph
Time (hours)2502402302202102001901801701601501401301201101009080706050403020100
Flow
(cf
s)
5
4
3
2
1
0
Type III 24-hr 10 YearRainfall=5.00"
Runoff Area=136,133 sfRunoff Volume=0.470 af
Runoff Depth=1.80"Flow Length=594'
Tc=12.8 minCN=67
5.10 cfs

Type III 24-hr 10 Year Rainfall=5.00"Pre-Development - 2 Printed 11/1/2010Prepared by Petruccelli Engineering
Page 42HydroCAD® 9.10 s/n 05751 © 2009 HydroCAD Software Solutions LLC
Summary for Link DP-1: DP-1
Inflow Area = 14.548 ac, 3.76% Impervious, Inflow Depth = 1.30" for 10 Year eventInflow = 12.15 cfs @ 12.39 hrs, Volume= 1.577 afPrimary = 12.15 cfs @ 12.39 hrs, Volume= 1.577 af, Atten= 0%, Lag= 0.0 min
Primary outflow = Inflow, Time Span= 0.00-250.00 hrs, dt= 0.01 hrs
Link DP-1: DP-1
InflowPrimary
Hydrograph
Time (hours)2502402302202102001901801701601501401301201101009080706050403020100
Flow
(cf
s)
13
12
11
10
9
8
7
6
5
4
3
2
1
0
Inflow Area=14.548 ac12.15 cfs
12.15 cfs

Type III 24-hr 10 Year Rainfall=5.00"Pre-Development - 2 Printed 11/1/2010Prepared by Petruccelli Engineering
Page 43HydroCAD® 9.10 s/n 05751 © 2009 HydroCAD Software Solutions LLC
Summary for Link DP-2: DP-2
Inflow Area = 5.251 ac, 10.55% Impervious, Inflow Depth = 1.44" for 10 Year eventInflow = 5.35 cfs @ 12.32 hrs, Volume= 0.629 afPrimary = 5.35 cfs @ 12.32 hrs, Volume= 0.629 af, Atten= 0%, Lag= 0.0 min
Primary outflow = Inflow, Time Span= 0.00-250.00 hrs, dt= 0.01 hrs
Link DP-2: DP-2
InflowPrimary
Hydrograph
Time (hours)2502402302202102001901801701601501401301201101009080706050403020100
Flow
(cf
s)
5
4
3
2
1
0
Inflow Area=5.251 ac5.35 cfs
5.35 cfs
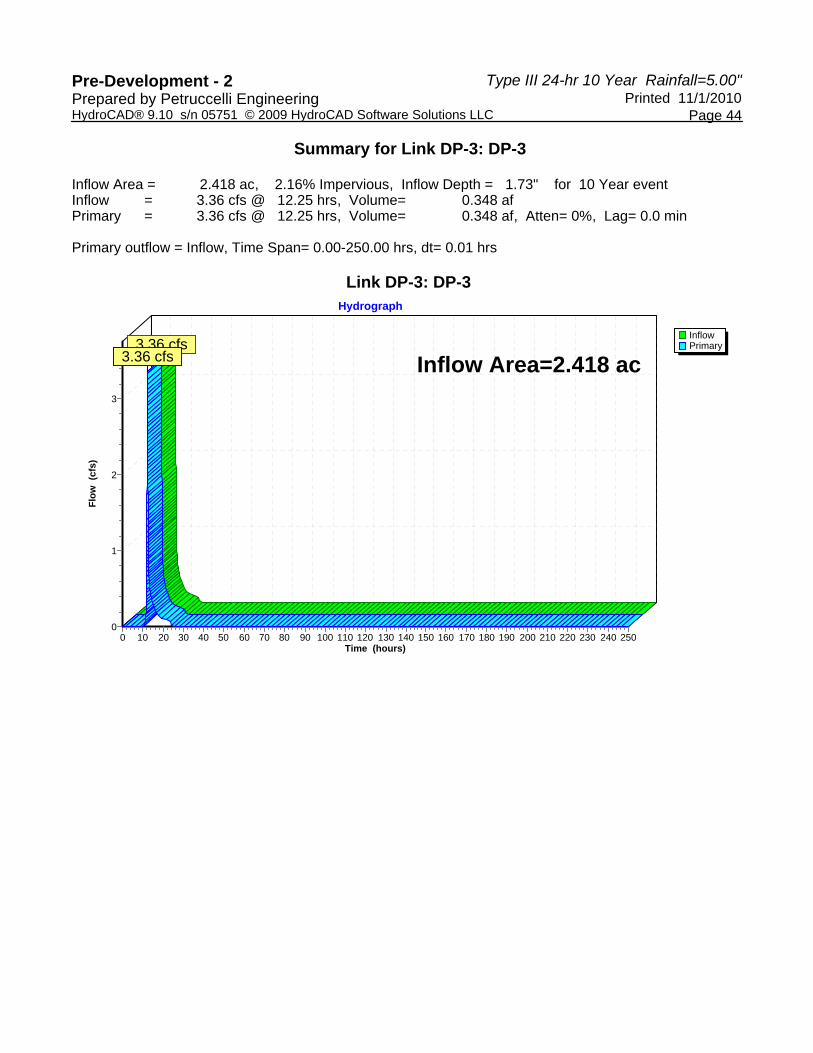
Type III 24-hr 10 Year Rainfall=5.00"Pre-Development - 2 Printed 11/1/2010Prepared by Petruccelli Engineering
Page 44HydroCAD® 9.10 s/n 05751 © 2009 HydroCAD Software Solutions LLC
Summary for Link DP-3: DP-3
Inflow Area = 2.418 ac, 2.16% Impervious, Inflow Depth = 1.73" for 10 Year eventInflow = 3.36 cfs @ 12.25 hrs, Volume= 0.348 afPrimary = 3.36 cfs @ 12.25 hrs, Volume= 0.348 af, Atten= 0%, Lag= 0.0 min
Primary outflow = Inflow, Time Span= 0.00-250.00 hrs, dt= 0.01 hrs
Link DP-3: DP-3
InflowPrimary
Hydrograph
Time (hours)2502402302202102001901801701601501401301201101009080706050403020100
Flow
(cf
s)
3
2
1
0
Inflow Area=2.418 ac3.36 cfs
3.36 cfs

Type III 24-hr 10 Year Rainfall=5.00"Pre-Development - 2 Printed 11/1/2010Prepared by Petruccelli Engineering
Page 45HydroCAD® 9.10 s/n 05751 © 2009 HydroCAD Software Solutions LLC
Summary for Link DP-4: DP-4
Inflow Area = 4.271 ac, 5.92% Impervious, Inflow Depth = 1.30" for 10 Year eventInflow = 3.94 cfs @ 12.30 hrs, Volume= 0.463 afPrimary = 3.94 cfs @ 12.30 hrs, Volume= 0.463 af, Atten= 0%, Lag= 0.0 min
Primary outflow = Inflow, Time Span= 0.00-250.00 hrs, dt= 0.01 hrs
Link DP-4: DP-4
InflowPrimary
Hydrograph
Time (hours)2502402302202102001901801701601501401301201101009080706050403020100
Flow
(cf
s)
4
3
2
1
0
Inflow Area=4.271 ac3.94 cfs
3.94 cfs

Type III 24-hr 10 Year Rainfall=5.00"Pre-Development - 2 Printed 11/1/2010Prepared by Petruccelli Engineering
Page 46HydroCAD® 9.10 s/n 05751 © 2009 HydroCAD Software Solutions LLC
Summary for Link DP-5: DP-5
Inflow Area = 3.137 ac, 18.34% Impervious, Inflow Depth = 2.12" for 10 Year eventInflow = 4.96 cfs @ 12.31 hrs, Volume= 0.553 afPrimary = 4.96 cfs @ 12.31 hrs, Volume= 0.553 af, Atten= 0%, Lag= 0.0 min
Primary outflow = Inflow, Time Span= 0.00-250.00 hrs, dt= 0.01 hrs
Link DP-5: DP-5
InflowPrimary
Hydrograph
Time (hours)2502402302202102001901801701601501401301201101009080706050403020100
Flow
(cf
s)
5
4
3
2
1
0
Inflow Area=3.137 ac4.96 cfs
4.96 cfs

Type III 24-hr 10 Year Rainfall=5.00"Pre-Development - 2 Printed 11/1/2010Prepared by Petruccelli Engineering
Page 47HydroCAD® 9.10 s/n 05751 © 2009 HydroCAD Software Solutions LLC
Summary for Link DP-6: DP-6
Inflow Area = 2.318 ac, 1.94% Impervious, Inflow Depth = 1.73" for 10 Year eventInflow = 3.52 cfs @ 12.20 hrs, Volume= 0.334 afPrimary = 3.52 cfs @ 12.20 hrs, Volume= 0.334 af, Atten= 0%, Lag= 0.0 min
Primary outflow = Inflow, Time Span= 0.00-250.00 hrs, dt= 0.01 hrs
Link DP-6: DP-6
InflowPrimary
Hydrograph
Time (hours)2502402302202102001901801701601501401301201101009080706050403020100
Flow
(cf
s)
3
2
1
0
Inflow Area=2.318 ac3.52 cfs
3.52 cfs

Type III 24-hr 10 Year Rainfall=5.00"Pre-Development - 2 Printed 11/1/2010Prepared by Petruccelli Engineering
Page 48HydroCAD® 9.10 s/n 05751 © 2009 HydroCAD Software Solutions LLC
Summary for Link DP-7: DP-7
Inflow Area = 3.125 ac, 7.51% Impervious, Inflow Depth = 1.80" for 10 Year eventInflow = 5.10 cfs @ 12.19 hrs, Volume= 0.470 afPrimary = 5.10 cfs @ 12.19 hrs, Volume= 0.470 af, Atten= 0%, Lag= 0.0 min
Primary outflow = Inflow, Time Span= 0.00-250.00 hrs, dt= 0.01 hrs
Link DP-7: DP-7
InflowPrimary
Hydrograph
Time (hours)2502402302202102001901801701601501401301201101009080706050403020100
Flow
(cf
s)
5
4
3
2
1
0
Inflow Area=3.125 ac5.10 cfs
5.10 cfs

Type III 24-hr 100 Year Rainfall=7.50"Pre-Development - 2 Printed 11/1/2010Prepared by Petruccelli Engineering
Page 49HydroCAD® 9.10 s/n 05751 © 2009 HydroCAD Software Solutions LLC
Time span=0.00-250.00 hrs, dt=0.01 hrs, 25001 pointsRunoff by SCS TR-20 method, UH=SCS
Reach routing by Stor-Ind method - Pond routing by Stor-Ind method
Runoff Area=14.548 ac 3.76% Impervious Runoff Depth=2.96"Subcatchment 1S: Subarea 1 Flow Length=1,389' Tc=25.0 min CN=60 Runoff=30.24 cfs 3.592 af
Runoff Area=228,729 sf 10.55% Impervious Runoff Depth=3.17"Subcatchment 2S: Subarea-2 Flow Length=821' Tc=21.0 min CN=62 Runoff=12.69 cfs 1.389 af
Runoff Area=105,316 sf 2.16% Impervious Runoff Depth=3.60"Subcatchment 3S: Subarea-3 Flow Length=634' Tc=17.0 min CN=66 Runoff=7.30 cfs 0.726 af
Runoff Area=186,025 sf 5.92% Impervious Runoff Depth=2.96"Subcatchment 4S: Subarea-4 Flow Length=680' Tc=19.6 min CN=60 Runoff=9.81 cfs 1.055 af
Runoff Area=136,628 sf 18.34% Impervious Runoff Depth=4.15"Subcatchment 5S: Subarea-5 Flow Length=877' Tc=21.9 min CN=71 Runoff=9.90 cfs 1.084 af
Runoff Area=100,951 sf 1.94% Impervious Runoff Depth=3.60"Subcatchment 6S: Subarea-6 Flow Length=504' Tc=13.5 min CN=66 Runoff=7.66 cfs 0.696 af
Runoff Area=136,133 sf 7.51% Impervious Runoff Depth=3.71"Subcatchment 7S: Subarea-7 Flow Length=594' Tc=12.8 min CN=67 Runoff=10.87 cfs 0.966 af
Inflow=30.24 cfs 3.592 afLink DP-1: DP-1 Primary=30.24 cfs 3.592 af
Inflow=12.69 cfs 1.389 afLink DP-2: DP-2 Primary=12.69 cfs 1.389 af
Inflow=7.30 cfs 0.726 afLink DP-3: DP-3 Primary=7.30 cfs 0.726 af
Inflow=9.81 cfs 1.055 afLink DP-4: DP-4 Primary=9.81 cfs 1.055 af
Inflow=9.90 cfs 1.084 afLink DP-5: DP-5 Primary=9.90 cfs 1.084 af
Inflow=7.66 cfs 0.696 afLink DP-6: DP-6 Primary=7.66 cfs 0.696 af
Inflow=10.87 cfs 0.966 afLink DP-7: DP-7 Primary=10.87 cfs 0.966 af
Total Runoff Area = 35.066 ac Runoff Volume = 9.507 af Average Runoff Depth = 3.25"93.55% Pervious = 32.806 ac 6.45% Impervious = 2.261 ac
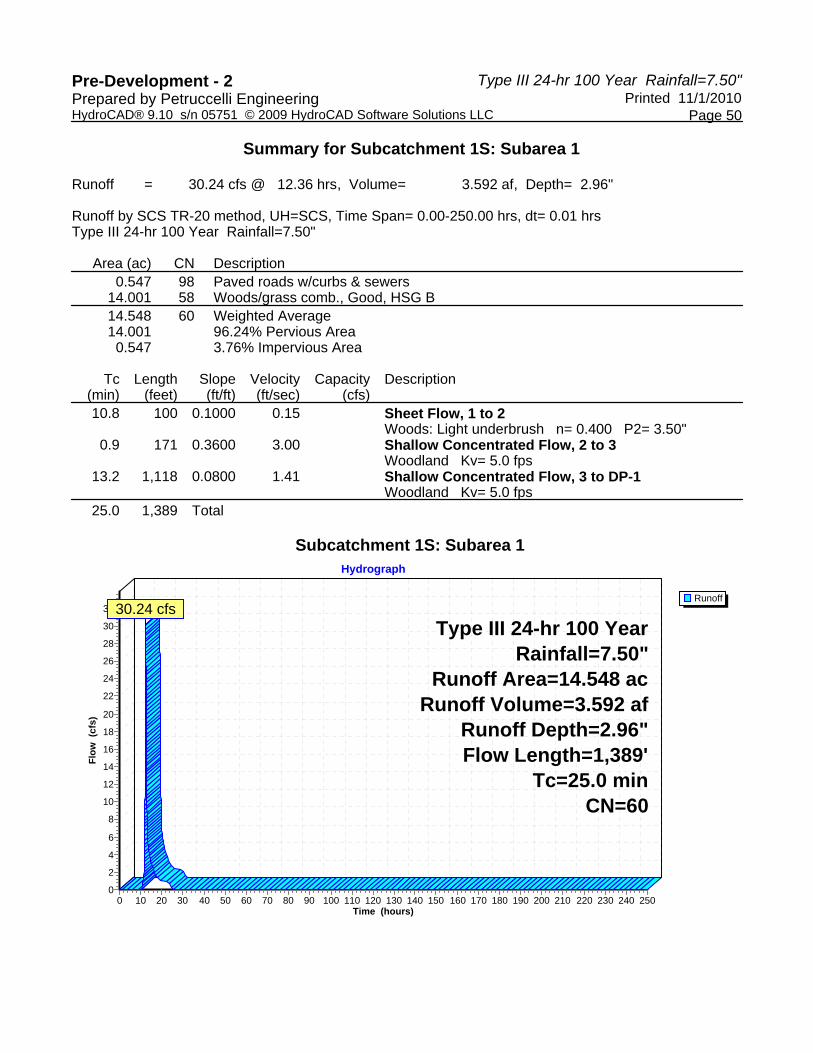
Type III 24-hr 100 Year Rainfall=7.50"Pre-Development - 2 Printed 11/1/2010Prepared by Petruccelli Engineering
Page 50HydroCAD® 9.10 s/n 05751 © 2009 HydroCAD Software Solutions LLC
Summary for Subcatchment 1S: Subarea 1
Runoff = 30.24 cfs @ 12.36 hrs, Volume= 3.592 af, Depth= 2.96"
Runoff by SCS TR-20 method, UH=SCS, Time Span= 0.00-250.00 hrs, dt= 0.01 hrsType III 24-hr 100 Year Rainfall=7.50"
Area (ac) CN Description0.547 98 Paved roads w/curbs & sewers
14.001 58 Woods/grass comb., Good, HSG B14.548 60 Weighted Average14.001 96.24% Pervious Area
0.547 3.76% Impervious Area
Tc Length Slope Velocity Capacity Description(min) (feet) (ft/ft) (ft/sec) (cfs)10.8 100 0.1000 0.15 Sheet Flow, 1 to 2
Woods: Light underbrush n= 0.400 P2= 3.50"0.9 171 0.3600 3.00 Shallow Concentrated Flow, 2 to 3
Woodland Kv= 5.0 fps13.2 1,118 0.0800 1.41 Shallow Concentrated Flow, 3 to DP-1
Woodland Kv= 5.0 fps25.0 1,389 Total
Subcatchment 1S: Subarea 1
Runoff
Hydrograph
Time (hours)2502402302202102001901801701601501401301201101009080706050403020100
Flow
(cf
s)
32
30
28
26
24
22
20
18
16
14
12
10
8
6
4
2
0
Type III 24-hr 100 YearRainfall=7.50"
Runoff Area=14.548 acRunoff Volume=3.592 af
Runoff Depth=2.96"Flow Length=1,389'
Tc=25.0 minCN=60
30.24 cfs

Type III 24-hr 100 Year Rainfall=7.50"Pre-Development - 2 Printed 11/1/2010Prepared by Petruccelli Engineering
Page 51HydroCAD® 9.10 s/n 05751 © 2009 HydroCAD Software Solutions LLC
Summary for Subcatchment 2S: Subarea-2
Runoff = 12.69 cfs @ 12.30 hrs, Volume= 1.389 af, Depth= 3.17"
Runoff by SCS TR-20 method, UH=SCS, Time Span= 0.00-250.00 hrs, dt= 0.01 hrsType III 24-hr 100 Year Rainfall=7.50"
Area (sf) CN Description24,134 98 Paved roads w/curbs & sewers
204,595 58 Woods/grass comb., Good, HSG B228,729 62 Weighted Average204,595 89.45% Pervious Area
24,134 10.55% Impervious Area
Tc Length Slope Velocity Capacity Description(min) (feet) (ft/ft) (ft/sec) (cfs)
9.4 100 0.1400 0.18 Sheet Flow, 1 to 2Woods: Light underbrush n= 0.400 P2= 3.50"
11.6 721 0.0430 1.04 Shallow Concentrated Flow, 2 to 3Woodland Kv= 5.0 fps
21.0 821 Total
Subcatchment 2S: Subarea-2
Runoff
Hydrograph
Time (hours)2502402302202102001901801701601501401301201101009080706050403020100
Flow
(cf
s)
14
13
12
11
10
9
8
7
6
5
4
3
2
1
0
Type III 24-hr 100 YearRainfall=7.50"
Runoff Area=228,729 sfRunoff Volume=1.389 af
Runoff Depth=3.17"Flow Length=821'
Tc=21.0 minCN=62
12.69 cfs

Type III 24-hr 100 Year Rainfall=7.50"Pre-Development - 2 Printed 11/1/2010Prepared by Petruccelli Engineering
Page 52HydroCAD® 9.10 s/n 05751 © 2009 HydroCAD Software Solutions LLC
Summary for Subcatchment 3S: Subarea-3
Runoff = 7.30 cfs @ 12.24 hrs, Volume= 0.726 af, Depth= 3.60"
Runoff by SCS TR-20 method, UH=SCS, Time Span= 0.00-250.00 hrs, dt= 0.01 hrsType III 24-hr 100 Year Rainfall=7.50"
Area (sf) CN Description2,270 98 Paved roads w/curbs & sewers
103,046 65 Woods/grass comb., Fair, HSG B105,316 66 Weighted Average103,046 97.84% Pervious Area
2,270 2.16% Impervious Area
Tc Length Slope Velocity Capacity Description(min) (feet) (ft/ft) (ft/sec) (cfs)
9.9 100 0.1250 0.17 Sheet Flow, 1 to 2Woods: Light underbrush n= 0.400 P2= 3.50"
7.1 534 0.0620 1.24 Shallow Concentrated Flow, 2 to DP-3Woodland Kv= 5.0 fps
17.0 634 Total
Subcatchment 3S: Subarea-3
Runoff
Hydrograph
Time (hours)2502402302202102001901801701601501401301201101009080706050403020100
Flow
(cf
s)
8
7
6
5
4
3
2
1
0
Type III 24-hr 100 YearRainfall=7.50"
Runoff Area=105,316 sfRunoff Volume=0.726 af
Runoff Depth=3.60"Flow Length=634'
Tc=17.0 minCN=66
7.30 cfs
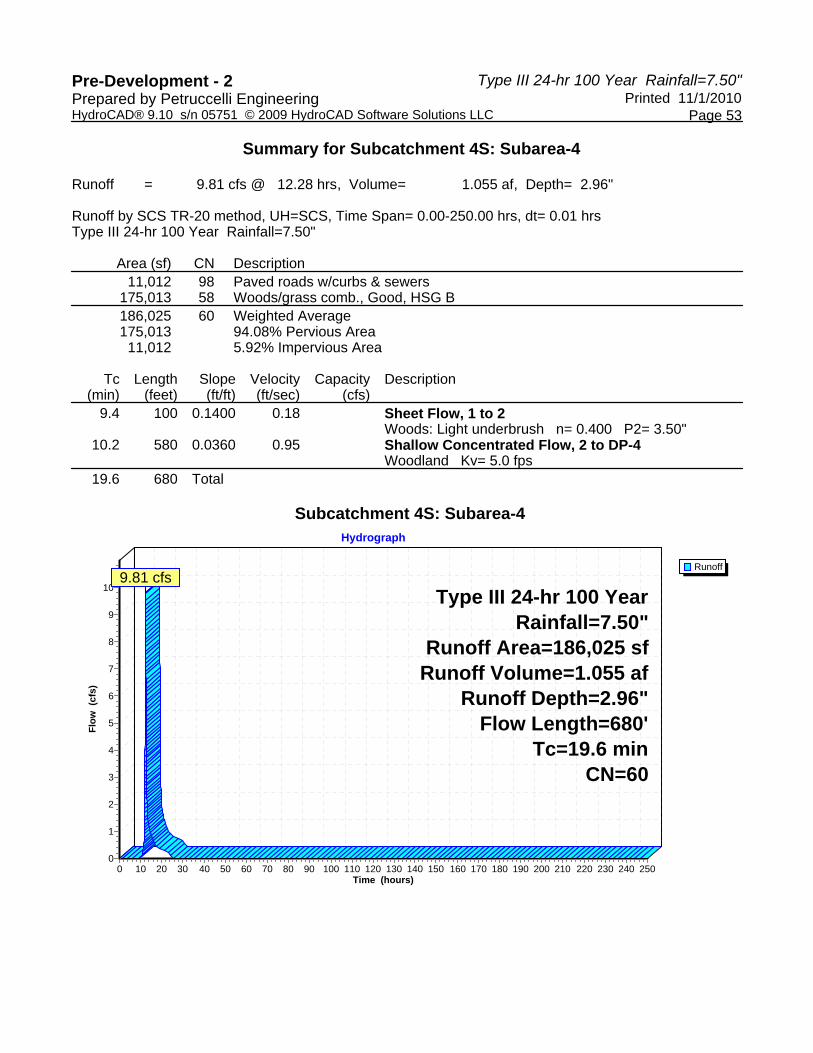
Type III 24-hr 100 Year Rainfall=7.50"Pre-Development - 2 Printed 11/1/2010Prepared by Petruccelli Engineering
Page 53HydroCAD® 9.10 s/n 05751 © 2009 HydroCAD Software Solutions LLC
Summary for Subcatchment 4S: Subarea-4
Runoff = 9.81 cfs @ 12.28 hrs, Volume= 1.055 af, Depth= 2.96"
Runoff by SCS TR-20 method, UH=SCS, Time Span= 0.00-250.00 hrs, dt= 0.01 hrsType III 24-hr 100 Year Rainfall=7.50"
Area (sf) CN Description11,012 98 Paved roads w/curbs & sewers
175,013 58 Woods/grass comb., Good, HSG B186,025 60 Weighted Average175,013 94.08% Pervious Area
11,012 5.92% Impervious Area
Tc Length Slope Velocity Capacity Description(min) (feet) (ft/ft) (ft/sec) (cfs)
9.4 100 0.1400 0.18 Sheet Flow, 1 to 2Woods: Light underbrush n= 0.400 P2= 3.50"
10.2 580 0.0360 0.95 Shallow Concentrated Flow, 2 to DP-4Woodland Kv= 5.0 fps
19.6 680 Total
Subcatchment 4S: Subarea-4
Runoff
Hydrograph
Time (hours)2502402302202102001901801701601501401301201101009080706050403020100
Flow
(cf
s)
10
9
8
7
6
5
4
3
2
1
0
Type III 24-hr 100 YearRainfall=7.50"
Runoff Area=186,025 sfRunoff Volume=1.055 af
Runoff Depth=2.96"Flow Length=680'
Tc=19.6 minCN=60
9.81 cfs

Type III 24-hr 100 Year Rainfall=7.50"Pre-Development - 2 Printed 11/1/2010Prepared by Petruccelli Engineering
Page 54HydroCAD® 9.10 s/n 05751 © 2009 HydroCAD Software Solutions LLC
Summary for Subcatchment 5S: Subarea-5
Runoff = 9.90 cfs @ 12.29 hrs, Volume= 1.084 af, Depth= 4.15"
Runoff by SCS TR-20 method, UH=SCS, Time Span= 0.00-250.00 hrs, dt= 0.01 hrsType III 24-hr 100 Year Rainfall=7.50"
Area (sf) CN Description25,055 98 Paved roads w/curbs & sewers
111,573 65 Woods/grass comb., Fair, HSG B136,628 71 Weighted Average111,573 81.66% Pervious Area
25,055 18.34% Impervious Area
Tc Length Slope Velocity Capacity Description(min) (feet) (ft/ft) (ft/sec) (cfs)13.7 100 0.0550 0.12 Sheet Flow, 1 to 2
Woods: Light underbrush n= 0.400 P2= 3.50"8.2 777 0.0990 1.57 Shallow Concentrated Flow, 2 to DP-5
Woodland Kv= 5.0 fps21.9 877 Total
Subcatchment 5S: Subarea-5
Runoff
Hydrograph
Time (hours)2502402302202102001901801701601501401301201101009080706050403020100
Flow
(cf
s)
11
10
9
8
7
6
5
4
3
2
1
0
Type III 24-hr 100 YearRainfall=7.50"
Runoff Area=136,628 sfRunoff Volume=1.084 af
Runoff Depth=4.15"Flow Length=877'
Tc=21.9 minCN=71
9.90 cfs

Type III 24-hr 100 Year Rainfall=7.50"Pre-Development - 2 Printed 11/1/2010Prepared by Petruccelli Engineering
Page 55HydroCAD® 9.10 s/n 05751 © 2009 HydroCAD Software Solutions LLC
Summary for Subcatchment 6S: Subarea-6
Runoff = 7.66 cfs @ 12.19 hrs, Volume= 0.696 af, Depth= 3.60"
Runoff by SCS TR-20 method, UH=SCS, Time Span= 0.00-250.00 hrs, dt= 0.01 hrsType III 24-hr 100 Year Rainfall=7.50"
Area (sf) CN Description1,957 98 Paved roads w/curbs & sewers
98,994 65 Woods/grass comb., Fair, HSG B100,951 66 Weighted Average
98,994 98.06% Pervious Area1,957 1.94% Impervious Area
Tc Length Slope Velocity Capacity Description(min) (feet) (ft/ft) (ft/sec) (cfs)
9.7 100 0.1300 0.17 Sheet Flow, 1 to 2Woods: Light underbrush n= 0.400 P2= 3.50"
3.8 404 0.1260 1.77 Shallow Concentrated Flow, 2 to DP-6Woodland Kv= 5.0 fps
13.5 504 Total
Subcatchment 6S: Subarea-6
Runoff
Hydrograph
Time (hours)2502402302202102001901801701601501401301201101009080706050403020100
Flow
(cf
s)
8
7
6
5
4
3
2
1
0
Type III 24-hr 100 YearRainfall=7.50"
Runoff Area=100,951 sfRunoff Volume=0.696 af
Runoff Depth=3.60"Flow Length=504'
Tc=13.5 minCN=66
7.66 cfs

Type III 24-hr 100 Year Rainfall=7.50"Pre-Development - 2 Printed 11/1/2010Prepared by Petruccelli Engineering
Page 56HydroCAD® 9.10 s/n 05751 © 2009 HydroCAD Software Solutions LLC
Summary for Subcatchment 7S: Subarea-7
Runoff = 10.87 cfs @ 12.18 hrs, Volume= 0.966 af, Depth= 3.71"
Runoff by SCS TR-20 method, UH=SCS, Time Span= 0.00-250.00 hrs, dt= 0.01 hrsType III 24-hr 100 Year Rainfall=7.50"
Area (sf) CN Description10,223 98 Paved roads w/curbs & sewers
125,910 65 Woods/grass comb., Fair, HSG B136,133 67 Weighted Average125,910 92.49% Pervious Area
10,223 7.51% Impervious Area
Tc Length Slope Velocity Capacity Description(min) (feet) (ft/ft) (ft/sec) (cfs)
8.9 100 0.1600 0.19 Sheet Flow, 1 to 2Woods: Light underbrush n= 0.400 P2= 3.50"
3.9 494 0.1780 2.11 Shallow Concentrated Flow, 2 to DP-7Woodland Kv= 5.0 fps
12.8 594 Total
Subcatchment 7S: Subarea-7
Runoff
Hydrograph
Time (hours)2502402302202102001901801701601501401301201101009080706050403020100
Flow
(cf
s)
12
11
10
9
8
7
6
5
4
3
2
1
0
Type III 24-hr 100 YearRainfall=7.50"
Runoff Area=136,133 sfRunoff Volume=0.966 af
Runoff Depth=3.71"Flow Length=594'
Tc=12.8 minCN=67
10.87 cfs
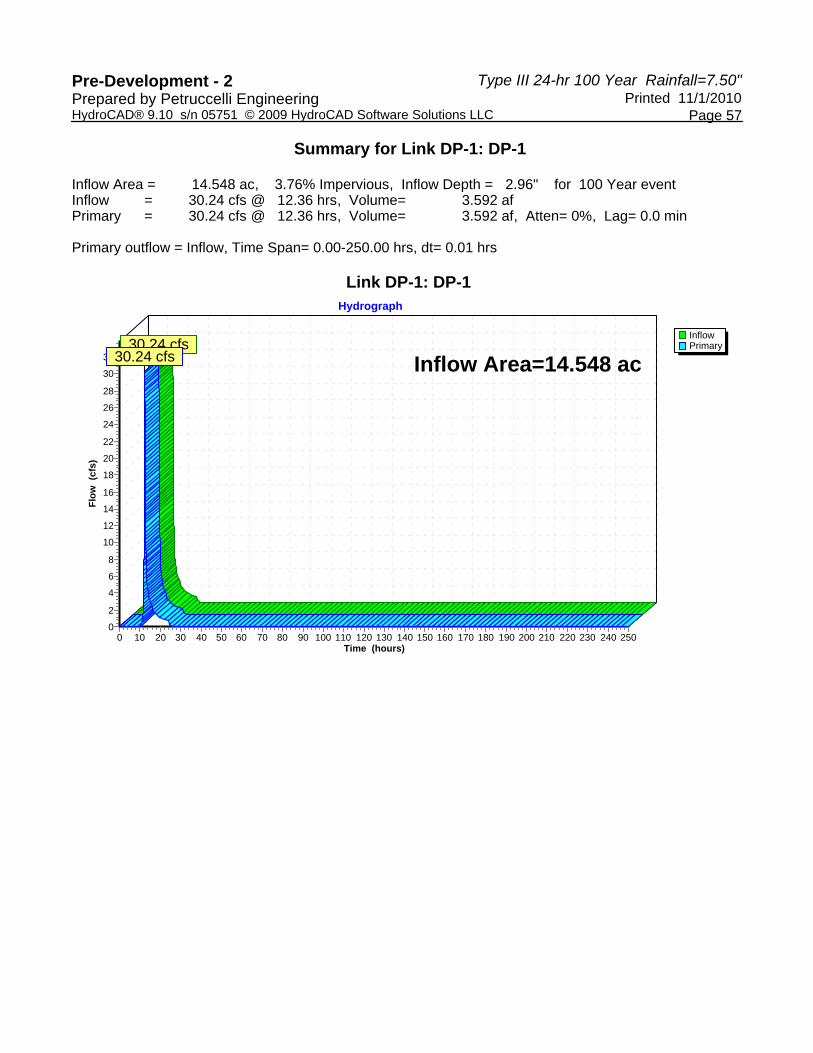
Type III 24-hr 100 Year Rainfall=7.50"Pre-Development - 2 Printed 11/1/2010Prepared by Petruccelli Engineering
Page 57HydroCAD® 9.10 s/n 05751 © 2009 HydroCAD Software Solutions LLC
Summary for Link DP-1: DP-1
Inflow Area = 14.548 ac, 3.76% Impervious, Inflow Depth = 2.96" for 100 Year eventInflow = 30.24 cfs @ 12.36 hrs, Volume= 3.592 afPrimary = 30.24 cfs @ 12.36 hrs, Volume= 3.592 af, Atten= 0%, Lag= 0.0 min
Primary outflow = Inflow, Time Span= 0.00-250.00 hrs, dt= 0.01 hrs
Link DP-1: DP-1
InflowPrimary
Hydrograph
Time (hours)2502402302202102001901801701601501401301201101009080706050403020100
Flow
(cf
s)
32
30
28
26
24
22
20
18
16
14
12
10
8
6
4
2
0
Inflow Area=14.548 ac30.24 cfs
30.24 cfs

Type III 24-hr 100 Year Rainfall=7.50"Pre-Development - 2 Printed 11/1/2010Prepared by Petruccelli Engineering
Page 58HydroCAD® 9.10 s/n 05751 © 2009 HydroCAD Software Solutions LLC
Summary for Link DP-2: DP-2
Inflow Area = 5.251 ac, 10.55% Impervious, Inflow Depth = 3.17" for 100 Year eventInflow = 12.69 cfs @ 12.30 hrs, Volume= 1.389 afPrimary = 12.69 cfs @ 12.30 hrs, Volume= 1.389 af, Atten= 0%, Lag= 0.0 min
Primary outflow = Inflow, Time Span= 0.00-250.00 hrs, dt= 0.01 hrs
Link DP-2: DP-2
InflowPrimary
Hydrograph
Time (hours)2502402302202102001901801701601501401301201101009080706050403020100
Flow
(cf
s)
14
13
12
11
10
9
8
7
6
5
4
3
2
1
0
Inflow Area=5.251 ac12.69 cfs
12.69 cfs

Type III 24-hr 100 Year Rainfall=7.50"Pre-Development - 2 Printed 11/1/2010Prepared by Petruccelli Engineering
Page 59HydroCAD® 9.10 s/n 05751 © 2009 HydroCAD Software Solutions LLC
Summary for Link DP-3: DP-3
Inflow Area = 2.418 ac, 2.16% Impervious, Inflow Depth = 3.60" for 100 Year eventInflow = 7.30 cfs @ 12.24 hrs, Volume= 0.726 afPrimary = 7.30 cfs @ 12.24 hrs, Volume= 0.726 af, Atten= 0%, Lag= 0.0 min
Primary outflow = Inflow, Time Span= 0.00-250.00 hrs, dt= 0.01 hrs
Link DP-3: DP-3
InflowPrimary
Hydrograph
Time (hours)2502402302202102001901801701601501401301201101009080706050403020100
Flow
(cf
s)
8
7
6
5
4
3
2
1
0
Inflow Area=2.418 ac7.30 cfs
7.30 cfs

Type III 24-hr 100 Year Rainfall=7.50"Pre-Development - 2 Printed 11/1/2010Prepared by Petruccelli Engineering
Page 60HydroCAD® 9.10 s/n 05751 © 2009 HydroCAD Software Solutions LLC
Summary for Link DP-4: DP-4
Inflow Area = 4.271 ac, 5.92% Impervious, Inflow Depth = 2.96" for 100 Year eventInflow = 9.81 cfs @ 12.28 hrs, Volume= 1.055 afPrimary = 9.81 cfs @ 12.28 hrs, Volume= 1.055 af, Atten= 0%, Lag= 0.0 min
Primary outflow = Inflow, Time Span= 0.00-250.00 hrs, dt= 0.01 hrs
Link DP-4: DP-4
InflowPrimary
Hydrograph
Time (hours)2502402302202102001901801701601501401301201101009080706050403020100
Flow
(cf
s)
10
9
8
7
6
5
4
3
2
1
0
Inflow Area=4.271 ac9.81 cfs
9.81 cfs

Type III 24-hr 100 Year Rainfall=7.50"Pre-Development - 2 Printed 11/1/2010Prepared by Petruccelli Engineering
Page 61HydroCAD® 9.10 s/n 05751 © 2009 HydroCAD Software Solutions LLC
Summary for Link DP-5: DP-5
Inflow Area = 3.137 ac, 18.34% Impervious, Inflow Depth = 4.15" for 100 Year eventInflow = 9.90 cfs @ 12.29 hrs, Volume= 1.084 afPrimary = 9.90 cfs @ 12.29 hrs, Volume= 1.084 af, Atten= 0%, Lag= 0.0 min
Primary outflow = Inflow, Time Span= 0.00-250.00 hrs, dt= 0.01 hrs
Link DP-5: DP-5
InflowPrimary
Hydrograph
Time (hours)2502402302202102001901801701601501401301201101009080706050403020100
Flow
(cf
s)
11
10
9
8
7
6
5
4
3
2
1
0
Inflow Area=3.137 ac9.90 cfs
9.90 cfs

Type III 24-hr 100 Year Rainfall=7.50"Pre-Development - 2 Printed 11/1/2010Prepared by Petruccelli Engineering
Page 62HydroCAD® 9.10 s/n 05751 © 2009 HydroCAD Software Solutions LLC
Summary for Link DP-6: DP-6
Inflow Area = 2.318 ac, 1.94% Impervious, Inflow Depth = 3.60" for 100 Year eventInflow = 7.66 cfs @ 12.19 hrs, Volume= 0.696 afPrimary = 7.66 cfs @ 12.19 hrs, Volume= 0.696 af, Atten= 0%, Lag= 0.0 min
Primary outflow = Inflow, Time Span= 0.00-250.00 hrs, dt= 0.01 hrs
Link DP-6: DP-6
InflowPrimary
Hydrograph
Time (hours)2502402302202102001901801701601501401301201101009080706050403020100
Flow
(cf
s)
8
7
6
5
4
3
2
1
0
Inflow Area=2.318 ac7.66 cfs
7.66 cfs

Type III 24-hr 100 Year Rainfall=7.50"Pre-Development - 2 Printed 11/1/2010Prepared by Petruccelli Engineering
Page 63HydroCAD® 9.10 s/n 05751 © 2009 HydroCAD Software Solutions LLC
Summary for Link DP-7: DP-7
Inflow Area = 3.125 ac, 7.51% Impervious, Inflow Depth = 3.71" for 100 Year eventInflow = 10.87 cfs @ 12.18 hrs, Volume= 0.966 afPrimary = 10.87 cfs @ 12.18 hrs, Volume= 0.966 af, Atten= 0%, Lag= 0.0 min
Primary outflow = Inflow, Time Span= 0.00-250.00 hrs, dt= 0.01 hrs
Link DP-7: DP-7
InflowPrimary
Hydrograph
Time (hours)2502402302202102001901801701601501401301201101009080706050403020100
Flow
(cf
s)
12
11
10
9
8
7
6
5
4
3
2
1
0
Inflow Area=3.125 ac10.87 cfs
10.87 cfs


1
Drainage Area 1
2A
Drainage Area 2A
2B
Drainage Area 2B
3
Drainage Area 3
4
Drainage Area 4
5
Drainage Area 5
6A
Drainage Area 6
6B
Drainage Area 6
6c
Drainage Area 6
7
Drainage Area 7
8
Drainage Area 8
1R
18" 1PCB
Pond - D
3P
Detention Pond
4P
Detention Pond
6P
Drywells
7P
Stormwater Treatment Pond #2
8P
Stormwater Treatment Pond #1
9P
Drywells
DP-1
Design Point 1 DP-2
Design Point 2
DP-3
Design Point 3
DP-4
Design Point 4
DP-5
Design Point 5
DP-6
Design Point 6 DP-7
Design Point 7
Drainage Diagram for Post-Development3Prepared by Petruccelli Engineering, Printed 11/1/2010
HydroCAD® 9.10 s/n 05751 © 2009 HydroCAD Software Solutions LLC
Subcat Reach Pond Link

Post-Development3 Printed 11/1/2010Prepared by Petruccelli Engineering
Page 2HydroCAD® 9.10 s/n 05751 © 2009 HydroCAD Software Solutions LLC
Area Listing (all nodes)
Area(acres)
CN Description(subcatchment-numbers)
13.564 55 Woods, Good, HSG B (1, 2A, 5, 6A)4.624 60 Woods, Fair, HSG B (3, 4, 6c, 7, 8)8.746 61 >75% Grass cover, Good, HSG B (2A, 3, 4, 5, 6A, 7, 8)2.770 69 50-75% Grass cover, Fair, HSG B (1)0.263 82 Dirt roads, HSG B (1)0.016 98 Paved parking, HSG B (5)5.103 98 Paved roads w/curbs & sewers (1, 2A, 2B, 3, 4, 6A, 6B, 7, 8)
35.087 TOTAL AREA

Post-Development3 Printed 11/1/2010Prepared by Petruccelli Engineering
Page 3HydroCAD® 9.10 s/n 05751 © 2009 HydroCAD Software Solutions LLC
Soil Listing (all nodes)
Area(acres)
SoilGroup
SubcatchmentNumbers
0.000 HSG A29.984 HSG B 1, 2A, 3, 4, 5, 6A, 6c, 7, 80.000 HSG C0.000 HSG D5.103 Other 1, 2A, 2B, 3, 4, 6A, 6B, 7, 8
35.087 TOTAL AREA
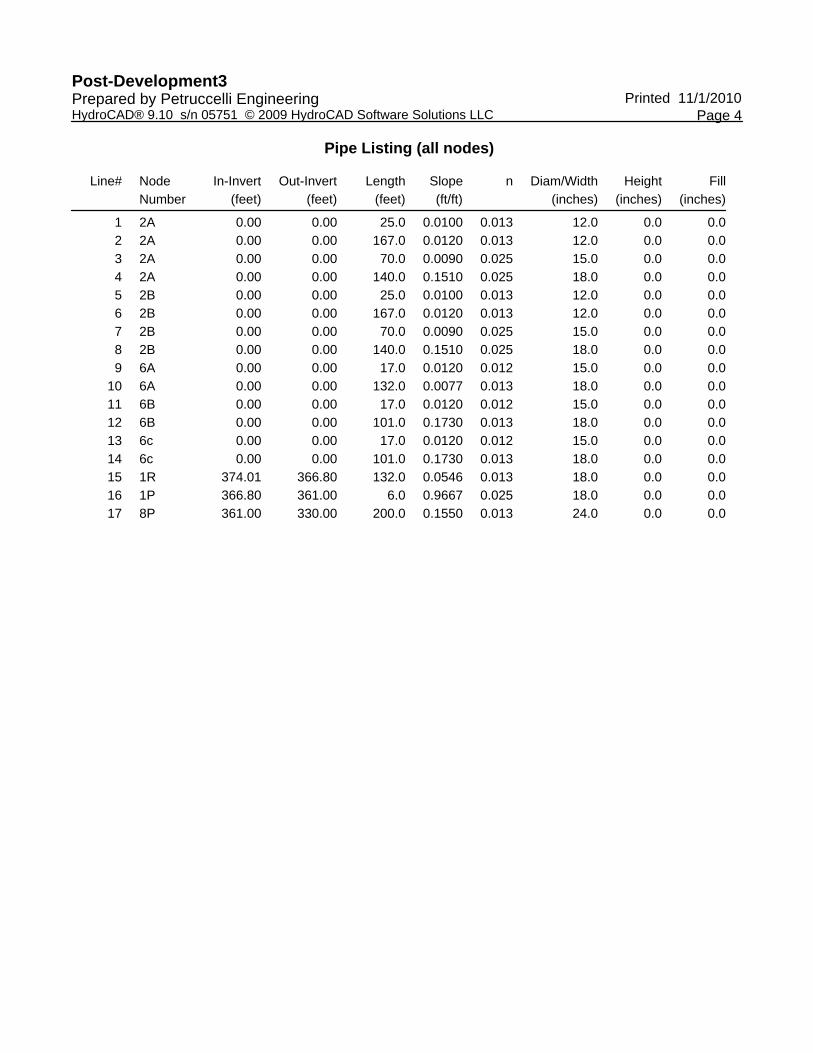
Post-Development3 Printed 11/1/2010Prepared by Petruccelli Engineering
Page 4HydroCAD® 9.10 s/n 05751 © 2009 HydroCAD Software Solutions LLC
Pipe Listing (all nodes)
Line# NodeNumber
In-Invert(feet)
Out-Invert(feet)
Length(feet)
Slope(ft/ft)
n Diam/Width(inches)
Height(inches)
Fill(inches)
1 2A 0.00 0.00 25.0 0.0100 0.013 12.0 0.0 0.02 2A 0.00 0.00 167.0 0.0120 0.013 12.0 0.0 0.03 2A 0.00 0.00 70.0 0.0090 0.025 15.0 0.0 0.04 2A 0.00 0.00 140.0 0.1510 0.025 18.0 0.0 0.05 2B 0.00 0.00 25.0 0.0100 0.013 12.0 0.0 0.06 2B 0.00 0.00 167.0 0.0120 0.013 12.0 0.0 0.07 2B 0.00 0.00 70.0 0.0090 0.025 15.0 0.0 0.08 2B 0.00 0.00 140.0 0.1510 0.025 18.0 0.0 0.09 6A 0.00 0.00 17.0 0.0120 0.012 15.0 0.0 0.0
10 6A 0.00 0.00 132.0 0.0077 0.013 18.0 0.0 0.011 6B 0.00 0.00 17.0 0.0120 0.012 15.0 0.0 0.012 6B 0.00 0.00 101.0 0.1730 0.013 18.0 0.0 0.013 6c 0.00 0.00 17.0 0.0120 0.012 15.0 0.0 0.014 6c 0.00 0.00 101.0 0.1730 0.013 18.0 0.0 0.015 1R 374.01 366.80 132.0 0.0546 0.013 18.0 0.0 0.016 1P 366.80 361.00 6.0 0.9667 0.025 18.0 0.0 0.017 8P 361.00 330.00 200.0 0.1550 0.013 24.0 0.0 0.0

Type III 24-hr 1 Year Rainfall=2.80"Post-Development3 Printed 11/1/2010Prepared by Petruccelli Engineering
Page 5HydroCAD® 9.10 s/n 05751 © 2009 HydroCAD Software Solutions LLC
Time span=0.00-250.00 hrs, dt=0.01 hrs, 25001 pointsRunoff by SCS TR-20 method, UH=SCS
Reach routing by Stor-Ind method - Pond routing by Stor-Ind method
Runoff Area=13.292 ac 3.27% Impervious Runoff Depth=0.26"Subcatchment 1: Drainage Area 1 Flow Length=1,455' Tc=31.8 min CN=60 Runoff=1.20 cfs 0.293 af
Runoff Area=5.751 ac 33.25% Impervious Runoff Depth=0.74"Subcatchment 2A: Drainage Area 2A Flow Length=999' Tc=19.1 min CN=73 Runoff=3.05 cfs 0.353 af
Runoff Area=19,994 sf 100.00% Impervious Runoff Depth=2.57"Subcatchment 2B: Drainage Area 2B Flow Length=999' Tc=19.1 min CN=98 Runoff=0.86 cfs 0.098 af
Runoff Area=115,560 sf 7.97% Impervious Runoff Depth=0.35"Subcatchment 3: Drainage Area 3 Flow Length=552' Tc=28.6 min CN=63 Runoff=0.41 cfs 0.078 af
Runoff Area=55,457 sf 7.29% Impervious Runoff Depth=0.35"Subcatchment 4: Drainage Area 4 Flow Length=284' Tc=22.5 min CN=63 Runoff=0.21 cfs 0.037 af
Runoff Area=125,820 sf 0.56% Impervious Runoff Depth=0.17"Subcatchment 5: Drainage Area 5 Flow Length=497' Tc=33.7 min CN=56 Runoff=0.10 cfs 0.040 af
Runoff Area=2.937 ac 37.76% Impervious Runoff Depth=0.74"Subcatchment 6A: Drainage Area 6 Flow Length=578' Tc=32.3 min CN=73 Runoff=1.25 cfs 0.180 af
Runoff Area=10,050 sf 100.00% Impervious Runoff Depth=2.57"Subcatchment 6B: Drainage Area 6 Flow Length=540' Tc=29.9 min CN=98 Runoff=0.36 cfs 0.049 af
Runoff Area=13,208 sf 0.00% Impervious Runoff Depth=0.26"Subcatchment 6c: Drainage Area 6 Flow Length=540' Tc=29.9 min CN=60 Runoff=0.03 cfs 0.007 af
Runoff Area=3.006 ac 9.68% Impervious Runoff Depth=0.38"Subcatchment 7: Drainage Area 7 Flow Length=527' Tc=13.4 min CN=64 Runoff=0.66 cfs 0.096 af
Runoff Area=99,910 sf 15.79% Impervious Runoff Depth=0.45"Subcatchment 8: Drainage Area 8 Flow Length=558' Tc=13.0 min CN=66 Runoff=0.68 cfs 0.086 af
Avg. Flow Depth=0.23' Max Vel=7.28 fps Inflow=1.25 cfs 0.180 afReach 1R: 18"18.0" Round Pipe n=0.013 L=132.0' S=0.0546 '/' Capacity=24.55 cfs Outflow=1.25 cfs 0.180 af
Peak Elev=367.37' Inflow=1.25 cfs 0.180 afPond 1P: Pond - D Primary=1.25 cfs 0.180 af Secondary=0.00 cfs 0.000 af Outflow=1.25 cfs 0.180 af
Peak Elev=363.00' Storage=0 cf Inflow=0.00 cfs 0.000 afPond 3P: Detention Pond Primary=0.00 cfs 0.000 af Secondary=0.00 cfs 0.000 af Outflow=0.00 cfs 0.000 af
Peak Elev=369.34' Storage=6,164 cf Inflow=3.05 cfs 0.353 afPond 4P: Detention Pond Primary=0.44 cfs 0.353 af Secondary=0.00 cfs 0.000 af Outflow=0.44 cfs 0.353 af
Peak Elev=386.63' Storage=309 cf Inflow=0.36 cfs 0.049 afPond 6P: Drywells Primary=0.18 cfs 0.049 af Secondary=0.00 cfs 0.000 af Outflow=0.18 cfs 0.049 af

Type III 24-hr 1 Year Rainfall=2.80"Post-Development3 Printed 11/1/2010Prepared by Petruccelli Engineering
Page 6HydroCAD® 9.10 s/n 05751 © 2009 HydroCAD Software Solutions LLC
Peak Elev=363.79' Storage=1,109 cf Inflow=1.25 cfs 0.180 afPond 7P: Stormwater Treatment Pond #2 Primary=0.17 cfs 0.119 af Secondary=1.03 cfs 0.061 af Tertiary=0.00 cfs 0.000 af Outflow=1.20 cfs 0.180 af
Peak Elev=362.12' Storage=674 cf Inflow=1.03 cfs 0.061 afPond 8P: Stormwater Treatment Pond #1 Primary=0.21 cfs 0.032 af Secondary=0.49 cfs 0.029 af Outflow=0.70 cfs 0.061 af
Peak Elev=387.14' Storage=950 cf Inflow=0.86 cfs 0.098 afPond 9P: Drywells Primary=0.25 cfs 0.098 af Secondary=0.00 cfs 0.000 af Outflow=0.25 cfs 0.098 af
Inflow=1.20 cfs 0.293 afLink DP-1: Design Point 1 Primary=1.20 cfs 0.293 af
Inflow=0.21 cfs 0.037 afLink DP-2: Design Point 2 Primary=0.21 cfs 0.037 af
Inflow=0.41 cfs 0.078 afLink DP-3: Design Point 3 Primary=0.41 cfs 0.078 af
Inflow=0.10 cfs 0.040 afLink DP-4: Design Point 4 Primary=0.10 cfs 0.040 af
Inflow=0.68 cfs 0.086 afLink DP-5: Design Point 5 Primary=0.68 cfs 0.086 af
Inflow=0.51 cfs 0.036 afLink DP-6: Design Point 6 Primary=0.51 cfs 0.036 af
Inflow=0.66 cfs 0.096 afLink DP-7: Design Point 7 Primary=0.66 cfs 0.096 af
Total Runoff Area = 35.087 ac Runoff Volume = 1.319 af Average Runoff Depth = 0.45"85.41% Pervious = 29.968 ac 14.59% Impervious = 5.119 ac

Type III 24-hr 1 Year Rainfall=2.80"Post-Development3 Printed 11/1/2010Prepared by Petruccelli Engineering
Page 7HydroCAD® 9.10 s/n 05751 © 2009 HydroCAD Software Solutions LLC
Summary for Subcatchment 1: Drainage Area 1
Runoff = 1.20 cfs @ 12.68 hrs, Volume= 0.293 af, Depth= 0.26"
Runoff by SCS TR-20 method, UH=SCS, Time Span= 0.00-250.00 hrs, dt= 0.01 hrsType III 24-hr 1 Year Rainfall=2.80"
Area (ac) CN Description2.770 69 50-75% Grass cover, Fair, HSG B0.435 98 Paved roads w/curbs & sewers9.824 55 Woods, Good, HSG B0.263 82 Dirt roads, HSG B
13.292 60 Weighted Average12.857 96.73% Pervious Area
0.435 3.27% Impervious Area
Tc Length Slope Velocity Capacity Description(min) (feet) (ft/ft) (ft/sec) (cfs)18.9 100 0.0260 0.09 Sheet Flow, 1 to 2
Grass: Bermuda n= 0.410 P2= 3.50"1.7 216 0.1830 2.14 Shallow Concentrated Flow, 2 to 3
Woodland Kv= 5.0 fps0.3 78 0.0450 4.31 Shallow Concentrated Flow, 3 to 4
Paved Kv= 20.3 fps1.2 121 0.1150 1.70 Shallow Concentrated Flow, 4 to 5
Woodland Kv= 5.0 fps5.8 679 0.0770 1.94 Shallow Concentrated Flow, 5 to 6
Short Grass Pasture Kv= 7.0 fps3.9 261 0.0500 1.12 Shallow Concentrated Flow, 6 to DP1
Woodland Kv= 5.0 fps31.8 1,455 Total

Type III 24-hr 1 Year Rainfall=2.80"Post-Development3 Printed 11/1/2010Prepared by Petruccelli Engineering
Page 8HydroCAD® 9.10 s/n 05751 © 2009 HydroCAD Software Solutions LLC
Subcatchment 1: Drainage Area 1
Runoff
Hydrograph
Time (hours)2502402302202102001901801701601501401301201101009080706050403020100
Flow
(cf
s)
1
0
Type III 24-hr 1 YearRainfall=2.80"
Runoff Area=13.292 acRunoff Volume=0.293 af
Runoff Depth=0.26"Flow Length=1,455'
Tc=31.8 minCN=60
1.20 cfs

Type III 24-hr 1 Year Rainfall=2.80"Post-Development3 Printed 11/1/2010Prepared by Petruccelli Engineering
Page 9HydroCAD® 9.10 s/n 05751 © 2009 HydroCAD Software Solutions LLC
Summary for Subcatchment 2A: Drainage Area 2A
Runoff = 3.05 cfs @ 12.29 hrs, Volume= 0.353 af, Depth= 0.74"
Runoff by SCS TR-20 method, UH=SCS, Time Span= 0.00-250.00 hrs, dt= 0.01 hrsType III 24-hr 1 Year Rainfall=2.80"
Area (ac) CN Description1.912 98 Paved roads w/curbs & sewers3.319 61 >75% Grass cover, Good, HSG B0.520 55 Woods, Good, HSG B5.751 73 Weighted Average3.839 66.75% Pervious Area1.912 33.25% Impervious Area
Tc Length Slope Velocity Capacity Description(min) (feet) (ft/ft) (ft/sec) (cfs)11.5 100 0.0900 0.15 Sheet Flow, 1 to 2
Grass: Bermuda n= 0.410 P2= 3.50"5.8 423 0.0300 1.21 Shallow Concentrated Flow, 2 to 3
Short Grass Pasture Kv= 7.0 fps0.5 74 0.0140 2.40 Shallow Concentrated Flow, 3 to 4 (Road)
Paved Kv= 20.3 fps0.1 25 0.0100 4.54 3.56 Pipe Channel, 4 to 5
12.0" Round Area= 0.8 sf Perim= 3.1' r= 0.25'n= 0.013 Corrugated PE, smooth interior
0.6 167 0.0120 4.97 3.90 Pipe Channel, 5 to 612.0" Round Area= 0.8 sf Perim= 3.1' r= 0.25'n= 0.013 Corrugated PE, smooth interior
0.4 70 0.0090 2.60 3.19 Pipe Channel, 6 to 715.0" Round Area= 1.2 sf Perim= 3.9' r= 0.31'n= 0.025 Corrugated metal
0.2 140 0.1510 12.01 21.23 Pipe Channel, 7 to 818.0" Round Area= 1.8 sf Perim= 4.7' r= 0.38'n= 0.025 Corrugated metal
19.1 999 Total

Type III 24-hr 1 Year Rainfall=2.80"Post-Development3 Printed 11/1/2010Prepared by Petruccelli Engineering
Page 10HydroCAD® 9.10 s/n 05751 © 2009 HydroCAD Software Solutions LLC
Subcatchment 2A: Drainage Area 2A
Runoff
Hydrograph
Time (hours)2502402302202102001901801701601501401301201101009080706050403020100
Flow
(cf
s)
3
2
1
0
Type III 24-hr 1 YearRainfall=2.80"
Runoff Area=5.751 acRunoff Volume=0.353 af
Runoff Depth=0.74"Flow Length=999'
Tc=19.1 minCN=73
3.05 cfs

Type III 24-hr 1 Year Rainfall=2.80"Post-Development3 Printed 11/1/2010Prepared by Petruccelli Engineering
Page 11HydroCAD® 9.10 s/n 05751 © 2009 HydroCAD Software Solutions LLC
Summary for Subcatchment 2B: Drainage Area 2B
Runoff = 0.86 cfs @ 12.25 hrs, Volume= 0.098 af, Depth= 2.57"
Runoff by SCS TR-20 method, UH=SCS, Time Span= 0.00-250.00 hrs, dt= 0.01 hrsType III 24-hr 1 Year Rainfall=2.80"
Area (sf) CN Description19,994 98 Paved roads w/curbs & sewers19,994 100.00% Impervious Area
Tc Length Slope Velocity Capacity Description(min) (feet) (ft/ft) (ft/sec) (cfs)11.5 100 0.0900 0.15 Sheet Flow, 1 to 2
Grass: Bermuda n= 0.410 P2= 3.50"5.8 423 0.0300 1.21 Shallow Concentrated Flow, 2 to 3
Short Grass Pasture Kv= 7.0 fps0.5 74 0.0140 2.40 Shallow Concentrated Flow, 3 to 4 (Road)
Paved Kv= 20.3 fps0.1 25 0.0100 4.54 3.56 Pipe Channel, 4 to 5
12.0" Round Area= 0.8 sf Perim= 3.1' r= 0.25'n= 0.013 Corrugated PE, smooth interior
0.6 167 0.0120 4.97 3.90 Pipe Channel, 5 to 612.0" Round Area= 0.8 sf Perim= 3.1' r= 0.25'n= 0.013 Corrugated PE, smooth interior
0.4 70 0.0090 2.60 3.19 Pipe Channel, 6 to 715.0" Round Area= 1.2 sf Perim= 3.9' r= 0.31'n= 0.025 Corrugated metal
0.2 140 0.1510 12.01 21.23 Pipe Channel, 7 to 818.0" Round Area= 1.8 sf Perim= 4.7' r= 0.38'n= 0.025 Corrugated metal
19.1 999 Total

Type III 24-hr 1 Year Rainfall=2.80"Post-Development3 Printed 11/1/2010Prepared by Petruccelli Engineering
Page 12HydroCAD® 9.10 s/n 05751 © 2009 HydroCAD Software Solutions LLC
Subcatchment 2B: Drainage Area 2B
Runoff
Hydrograph
Time (hours)2502402302202102001901801701601501401301201101009080706050403020100
Flow
(cf
s)
0.950.9
0.850.8
0.750.7
0.650.6
0.550.5
0.450.4
0.350.3
0.250.2
0.150.1
0.050
Type III 24-hr 1 YearRainfall=2.80"
Runoff Area=19,994 sfRunoff Volume=0.098 af
Runoff Depth=2.57"Flow Length=999'
Tc=19.1 minCN=98
0.86 cfs
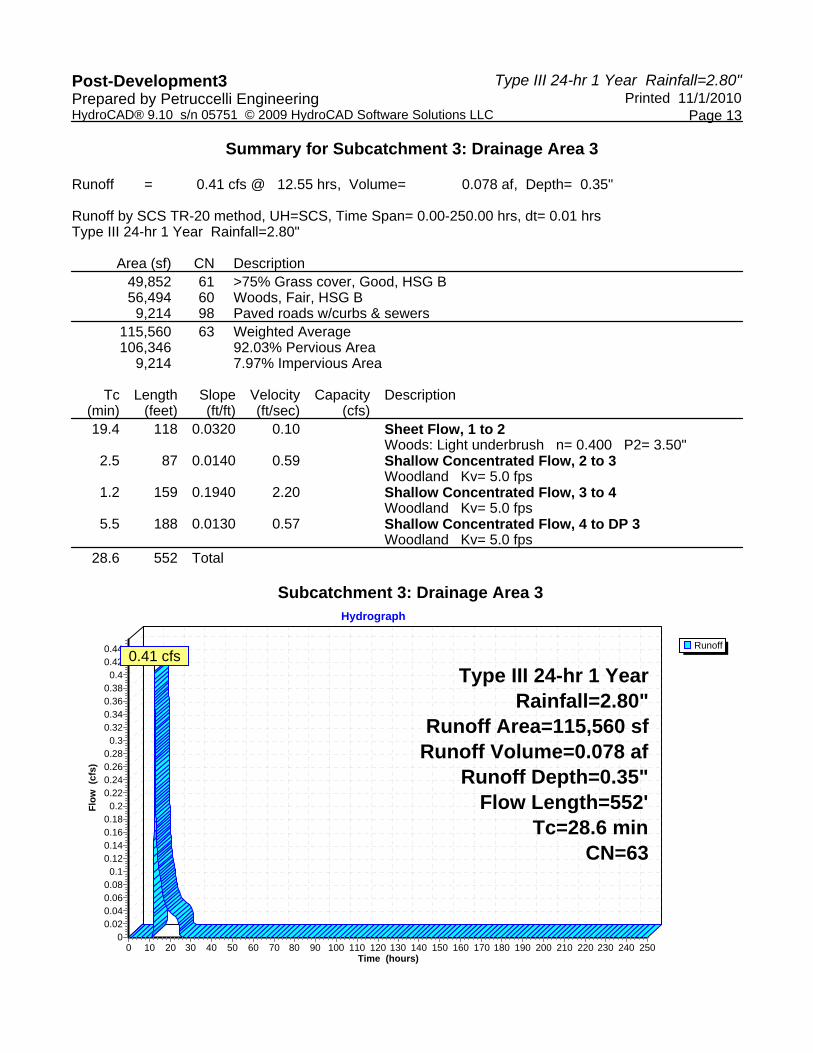
Type III 24-hr 1 Year Rainfall=2.80"Post-Development3 Printed 11/1/2010Prepared by Petruccelli Engineering
Page 13HydroCAD® 9.10 s/n 05751 © 2009 HydroCAD Software Solutions LLC
Summary for Subcatchment 3: Drainage Area 3
Runoff = 0.41 cfs @ 12.55 hrs, Volume= 0.078 af, Depth= 0.35"
Runoff by SCS TR-20 method, UH=SCS, Time Span= 0.00-250.00 hrs, dt= 0.01 hrsType III 24-hr 1 Year Rainfall=2.80"
Area (sf) CN Description49,852 61 >75% Grass cover, Good, HSG B56,494 60 Woods, Fair, HSG B
9,214 98 Paved roads w/curbs & sewers115,560 63 Weighted Average106,346 92.03% Pervious Area
9,214 7.97% Impervious Area
Tc Length Slope Velocity Capacity Description(min) (feet) (ft/ft) (ft/sec) (cfs)19.4 118 0.0320 0.10 Sheet Flow, 1 to 2
Woods: Light underbrush n= 0.400 P2= 3.50"2.5 87 0.0140 0.59 Shallow Concentrated Flow, 2 to 3
Woodland Kv= 5.0 fps1.2 159 0.1940 2.20 Shallow Concentrated Flow, 3 to 4
Woodland Kv= 5.0 fps5.5 188 0.0130 0.57 Shallow Concentrated Flow, 4 to DP 3
Woodland Kv= 5.0 fps28.6 552 Total
Subcatchment 3: Drainage Area 3
Runoff
Hydrograph
Time (hours)2502402302202102001901801701601501401301201101009080706050403020100
Flow
(cf
s)
0.440.42
0.40.380.360.340.32
0.30.280.260.240.22
0.20.180.160.140.12
0.10.080.060.040.02
0
Type III 24-hr 1 YearRainfall=2.80"
Runoff Area=115,560 sfRunoff Volume=0.078 af
Runoff Depth=0.35"Flow Length=552'
Tc=28.6 minCN=63
0.41 cfs

Type III 24-hr 1 Year Rainfall=2.80"Post-Development3 Printed 11/1/2010Prepared by Petruccelli Engineering
Page 14HydroCAD® 9.10 s/n 05751 © 2009 HydroCAD Software Solutions LLC
Summary for Subcatchment 4: Drainage Area 4
Runoff = 0.21 cfs @ 12.47 hrs, Volume= 0.037 af, Depth= 0.35"
Runoff by SCS TR-20 method, UH=SCS, Time Span= 0.00-250.00 hrs, dt= 0.01 hrsType III 24-hr 1 Year Rainfall=2.80"
Area (sf) CN Description31,781 60 Woods, Fair, HSG B
4,042 98 Paved roads w/curbs & sewers19,634 61 >75% Grass cover, Good, HSG B55,457 63 Weighted Average51,415 92.71% Pervious Area
4,042 7.29% Impervious Area
Tc Length Slope Velocity Capacity Description(min) (feet) (ft/ft) (ft/sec) (cfs)20.9 207 0.0860 0.16 Sheet Flow, 1 to 2
Grass: Bermuda n= 0.410 P2= 3.50"1.6 77 0.0130 0.80 Shallow Concentrated Flow, 2 to DP 4
Short Grass Pasture Kv= 7.0 fps22.5 284 Total
Subcatchment 4: Drainage Area 4
Runoff
Hydrograph
Time (hours)2502402302202102001901801701601501401301201101009080706050403020100
Flow
(cf
s)
0.230.220.21
0.20.190.180.170.160.150.140.130.120.11
0.10.090.080.070.060.050.040.030.020.01
0
Type III 24-hr 1 YearRainfall=2.80"
Runoff Area=55,457 sfRunoff Volume=0.037 af
Runoff Depth=0.35"Flow Length=284'
Tc=22.5 minCN=63
0.21 cfs

Type III 24-hr 1 Year Rainfall=2.80"Post-Development3 Printed 11/1/2010Prepared by Petruccelli Engineering
Page 15HydroCAD® 9.10 s/n 05751 © 2009 HydroCAD Software Solutions LLC
Summary for Subcatchment 5: Drainage Area 5
Runoff = 0.10 cfs @ 12.84 hrs, Volume= 0.040 af, Depth= 0.17"
Runoff by SCS TR-20 method, UH=SCS, Time Span= 0.00-250.00 hrs, dt= 0.01 hrsType III 24-hr 1 Year Rainfall=2.80"
Area (sf) CN Description23,735 61 >75% Grass cover, Good, HSG B
101,385 55 Woods, Good, HSG B700 98 Paved parking, HSG B
125,820 56 Weighted Average125,120 99.44% Pervious Area
700 0.56% Impervious Area
Tc Length Slope Velocity Capacity Description(min) (feet) (ft/ft) (ft/sec) (cfs)29.9 135 0.0150 0.08 Sheet Flow, 1 to 2
Grass: Bermuda n= 0.410 P2= 3.50"3.8 362 0.1020 1.60 Shallow Concentrated Flow, 2 to DP 4
Woodland Kv= 5.0 fps33.7 497 Total
Subcatchment 5: Drainage Area 5
Runoff
Hydrograph
Time (hours)2502402302202102001901801701601501401301201101009080706050403020100
Flow
(cf
s)
0.1150.11
0.1050.1
0.0950.09
0.0850.08
0.0750.07
0.0650.06
0.0550.05
0.0450.04
0.0350.03
0.0250.02
0.0150.01
0.0050
Type III 24-hr 1 YearRainfall=2.80"
Runoff Area=125,820 sfRunoff Volume=0.040 af
Runoff Depth=0.17"Flow Length=497'
Tc=33.7 minCN=56
0.10 cfs

Type III 24-hr 1 Year Rainfall=2.80"Post-Development3 Printed 11/1/2010Prepared by Petruccelli Engineering
Page 16HydroCAD® 9.10 s/n 05751 © 2009 HydroCAD Software Solutions LLC
Summary for Subcatchment 6A: Drainage Area 6
Runoff = 1.25 cfs @ 12.52 hrs, Volume= 0.180 af, Depth= 0.74"
Runoff by SCS TR-20 method, UH=SCS, Time Span= 0.00-250.00 hrs, dt= 0.01 hrsType III 24-hr 1 Year Rainfall=2.80"
Area (ac) CN Description0.893 55 Woods, Good, HSG B1.109 98 Paved roads w/curbs & sewers0.935 61 >75% Grass cover, Good, HSG B2.937 73 Weighted Average1.828 62.24% Pervious Area1.109 37.76% Impervious Area
Tc Length Slope Velocity Capacity Description(min) (feet) (ft/ft) (ft/sec) (cfs)21.6 185 0.0600 0.14 Sheet Flow, 1 to 2
Woods: Light underbrush n= 0.400 P2= 3.50"0.5 214 0.1180 6.97 Shallow Concentrated Flow, 2 to 3
Paved Kv= 20.3 fps0.0 17 0.0120 6.25 7.67 Pipe Channel, 3 to 4 (Catchbasins)
15.0" Round Area= 1.2 sf Perim= 3.9' r= 0.31'n= 0.012 HDPE
0.4 132 0.0077 5.22 9.22 Pipe Channel, 4 to 5 (18" Culvert)18.0" Round Area= 1.8 sf Perim= 4.7' r= 0.38'n= 0.013 HDPE
9.8 30 0.0120 0.05 Sheet Flow, 5 to DP 6Grass: Bermuda n= 0.410 P2= 3.50"
32.3 578 Total

Type III 24-hr 1 Year Rainfall=2.80"Post-Development3 Printed 11/1/2010Prepared by Petruccelli Engineering
Page 17HydroCAD® 9.10 s/n 05751 © 2009 HydroCAD Software Solutions LLC
Subcatchment 6A: Drainage Area 6
Runoff
Hydrograph
Time (hours)2502402302202102001901801701601501401301201101009080706050403020100
Flow
(cf
s)
1
0
Type III 24-hr 1 YearRainfall=2.80"
Runoff Area=2.937 acRunoff Volume=0.180 af
Runoff Depth=0.74"Flow Length=578'
Tc=32.3 minCN=73
1.25 cfs
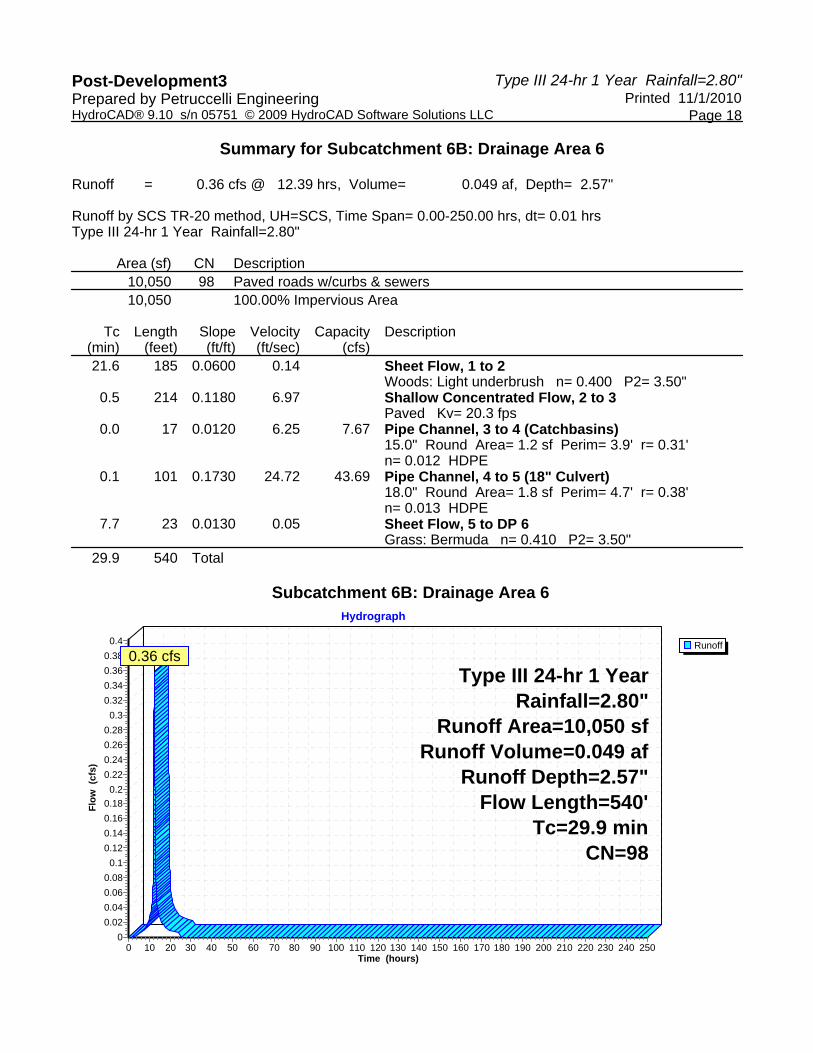
Type III 24-hr 1 Year Rainfall=2.80"Post-Development3 Printed 11/1/2010Prepared by Petruccelli Engineering
Page 18HydroCAD® 9.10 s/n 05751 © 2009 HydroCAD Software Solutions LLC
Summary for Subcatchment 6B: Drainage Area 6
Runoff = 0.36 cfs @ 12.39 hrs, Volume= 0.049 af, Depth= 2.57"
Runoff by SCS TR-20 method, UH=SCS, Time Span= 0.00-250.00 hrs, dt= 0.01 hrsType III 24-hr 1 Year Rainfall=2.80"
Area (sf) CN Description10,050 98 Paved roads w/curbs & sewers10,050 100.00% Impervious Area
Tc Length Slope Velocity Capacity Description(min) (feet) (ft/ft) (ft/sec) (cfs)21.6 185 0.0600 0.14 Sheet Flow, 1 to 2
Woods: Light underbrush n= 0.400 P2= 3.50"0.5 214 0.1180 6.97 Shallow Concentrated Flow, 2 to 3
Paved Kv= 20.3 fps0.0 17 0.0120 6.25 7.67 Pipe Channel, 3 to 4 (Catchbasins)
15.0" Round Area= 1.2 sf Perim= 3.9' r= 0.31'n= 0.012 HDPE
0.1 101 0.1730 24.72 43.69 Pipe Channel, 4 to 5 (18" Culvert)18.0" Round Area= 1.8 sf Perim= 4.7' r= 0.38'n= 0.013 HDPE
7.7 23 0.0130 0.05 Sheet Flow, 5 to DP 6Grass: Bermuda n= 0.410 P2= 3.50"
29.9 540 Total
Subcatchment 6B: Drainage Area 6
Runoff
Hydrograph
Time (hours)2502402302202102001901801701601501401301201101009080706050403020100
Flow
(cf
s)
0.40.380.360.340.32
0.30.280.260.240.22
0.20.180.160.140.12
0.10.080.060.040.02
0
Type III 24-hr 1 YearRainfall=2.80"
Runoff Area=10,050 sfRunoff Volume=0.049 af
Runoff Depth=2.57"Flow Length=540'
Tc=29.9 minCN=98
0.36 cfs
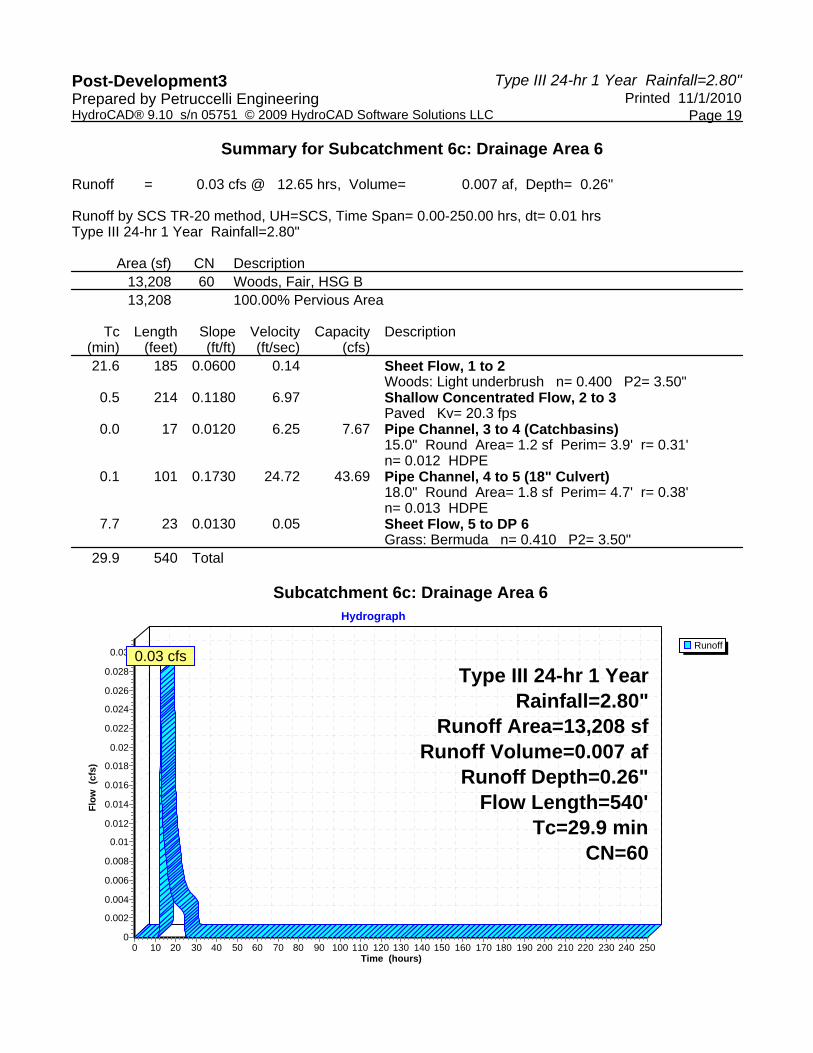
Type III 24-hr 1 Year Rainfall=2.80"Post-Development3 Printed 11/1/2010Prepared by Petruccelli Engineering
Page 19HydroCAD® 9.10 s/n 05751 © 2009 HydroCAD Software Solutions LLC
Summary for Subcatchment 6c: Drainage Area 6
Runoff = 0.03 cfs @ 12.65 hrs, Volume= 0.007 af, Depth= 0.26"
Runoff by SCS TR-20 method, UH=SCS, Time Span= 0.00-250.00 hrs, dt= 0.01 hrsType III 24-hr 1 Year Rainfall=2.80"
Area (sf) CN Description13,208 60 Woods, Fair, HSG B13,208 100.00% Pervious Area
Tc Length Slope Velocity Capacity Description(min) (feet) (ft/ft) (ft/sec) (cfs)21.6 185 0.0600 0.14 Sheet Flow, 1 to 2
Woods: Light underbrush n= 0.400 P2= 3.50"0.5 214 0.1180 6.97 Shallow Concentrated Flow, 2 to 3
Paved Kv= 20.3 fps0.0 17 0.0120 6.25 7.67 Pipe Channel, 3 to 4 (Catchbasins)
15.0" Round Area= 1.2 sf Perim= 3.9' r= 0.31'n= 0.012 HDPE
0.1 101 0.1730 24.72 43.69 Pipe Channel, 4 to 5 (18" Culvert)18.0" Round Area= 1.8 sf Perim= 4.7' r= 0.38'n= 0.013 HDPE
7.7 23 0.0130 0.05 Sheet Flow, 5 to DP 6Grass: Bermuda n= 0.410 P2= 3.50"
29.9 540 Total
Subcatchment 6c: Drainage Area 6
Runoff
Hydrograph
Time (hours)2502402302202102001901801701601501401301201101009080706050403020100
Flow
(cf
s)
0.03
0.028
0.026
0.024
0.022
0.02
0.018
0.016
0.014
0.012
0.01
0.008
0.006
0.004
0.002
0
Type III 24-hr 1 YearRainfall=2.80"
Runoff Area=13,208 sfRunoff Volume=0.007 af
Runoff Depth=0.26"Flow Length=540'
Tc=29.9 minCN=60
0.03 cfs

Type III 24-hr 1 Year Rainfall=2.80"Post-Development3 Printed 11/1/2010Prepared by Petruccelli Engineering
Page 20HydroCAD® 9.10 s/n 05751 © 2009 HydroCAD Software Solutions LLC
Summary for Subcatchment 7: Drainage Area 7
Runoff = 0.66 cfs @ 12.26 hrs, Volume= 0.096 af, Depth= 0.38"
Runoff by SCS TR-20 method, UH=SCS, Time Span= 0.00-250.00 hrs, dt= 0.01 hrsType III 24-hr 1 Year Rainfall=2.80"
Area (ac) CN Description1.340 60 Woods, Fair, HSG B0.291 98 Paved roads w/curbs & sewers1.375 61 >75% Grass cover, Good, HSG B3.006 64 Weighted Average2.715 90.32% Pervious Area0.291 9.68% Impervious Area
Tc Length Slope Velocity Capacity Description(min) (feet) (ft/ft) (ft/sec) (cfs)10.1 117 0.1620 0.19 Sheet Flow, 1 to 2
Woods: Light underbrush n= 0.400 P2= 3.50"0.7 100 0.2300 2.40 Shallow Concentrated Flow, 2 to 3
Woodland Kv= 5.0 fps1.2 164 0.2010 2.24 Shallow Concentrated Flow, 3 to 4
Woodland Kv= 5.0 fps1.4 146 0.1230 1.75 Shallow Concentrated Flow, 3 to DP 7
Woodland Kv= 5.0 fps13.4 527 Total
Subcatchment 7: Drainage Area 7
Runoff
Hydrograph
Time (hours)2502402302202102001901801701601501401301201101009080706050403020100
Flow
(cf
s)
0.7
0.65
0.6
0.55
0.5
0.45
0.4
0.35
0.3
0.25
0.2
0.15
0.1
0.05
0
Type III 24-hr 1 YearRainfall=2.80"
Runoff Area=3.006 acRunoff Volume=0.096 af
Runoff Depth=0.38"Flow Length=527'
Tc=13.4 minCN=64
0.66 cfs
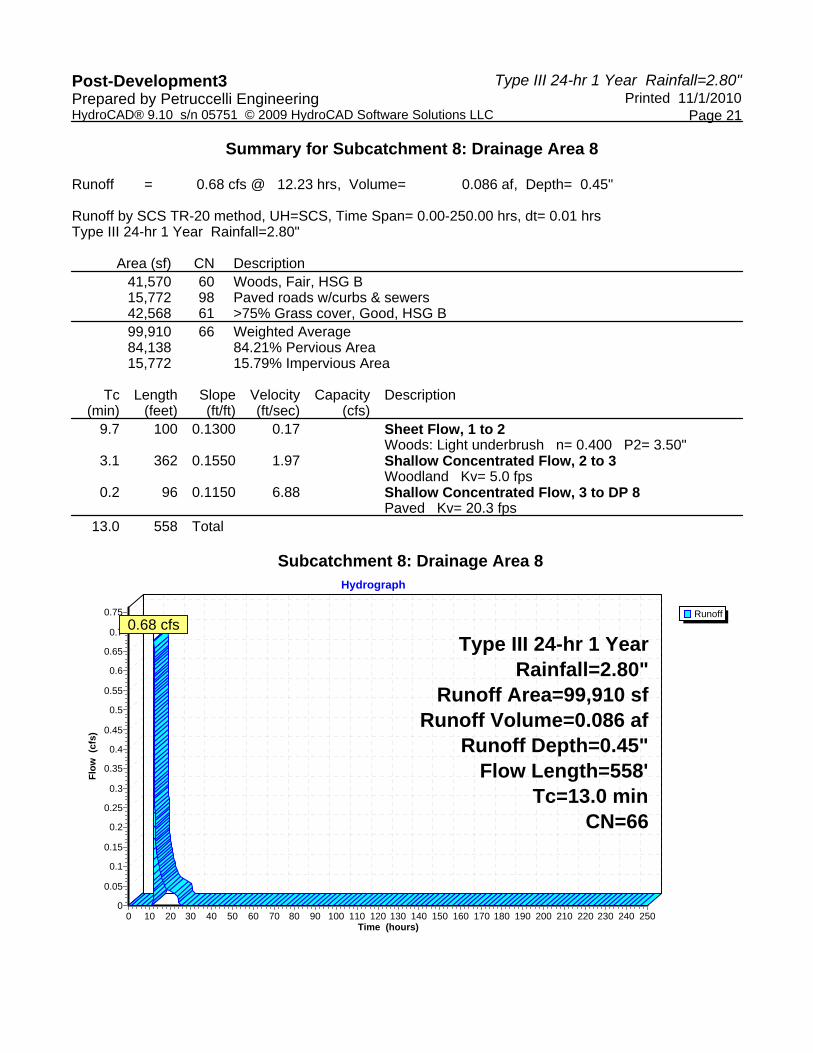
Type III 24-hr 1 Year Rainfall=2.80"Post-Development3 Printed 11/1/2010Prepared by Petruccelli Engineering
Page 21HydroCAD® 9.10 s/n 05751 © 2009 HydroCAD Software Solutions LLC
Summary for Subcatchment 8: Drainage Area 8
Runoff = 0.68 cfs @ 12.23 hrs, Volume= 0.086 af, Depth= 0.45"
Runoff by SCS TR-20 method, UH=SCS, Time Span= 0.00-250.00 hrs, dt= 0.01 hrsType III 24-hr 1 Year Rainfall=2.80"
Area (sf) CN Description41,570 60 Woods, Fair, HSG B15,772 98 Paved roads w/curbs & sewers42,568 61 >75% Grass cover, Good, HSG B99,910 66 Weighted Average84,138 84.21% Pervious Area15,772 15.79% Impervious Area
Tc Length Slope Velocity Capacity Description(min) (feet) (ft/ft) (ft/sec) (cfs)
9.7 100 0.1300 0.17 Sheet Flow, 1 to 2Woods: Light underbrush n= 0.400 P2= 3.50"
3.1 362 0.1550 1.97 Shallow Concentrated Flow, 2 to 3Woodland Kv= 5.0 fps
0.2 96 0.1150 6.88 Shallow Concentrated Flow, 3 to DP 8Paved Kv= 20.3 fps
13.0 558 Total
Subcatchment 8: Drainage Area 8
Runoff
Hydrograph
Time (hours)2502402302202102001901801701601501401301201101009080706050403020100
Flow
(cf
s)
0.75
0.7
0.65
0.6
0.55
0.5
0.45
0.4
0.35
0.3
0.25
0.2
0.15
0.1
0.05
0
Type III 24-hr 1 YearRainfall=2.80"
Runoff Area=99,910 sfRunoff Volume=0.086 af
Runoff Depth=0.45"Flow Length=558'
Tc=13.0 minCN=66
0.68 cfs

Type III 24-hr 1 Year Rainfall=2.80"Post-Development3 Printed 11/1/2010Prepared by Petruccelli Engineering
Page 22HydroCAD® 9.10 s/n 05751 © 2009 HydroCAD Software Solutions LLC
Summary for Reach 1R: 18"
Inflow Area = 2.937 ac, 37.76% Impervious, Inflow Depth = 0.74" for 1 Year eventInflow = 1.25 cfs @ 12.52 hrs, Volume= 0.180 afOutflow = 1.25 cfs @ 12.52 hrs, Volume= 0.180 af, Atten= 0%, Lag= 0.1 min
Routing by Stor-Ind method, Time Span= 0.00-250.00 hrs, dt= 0.01 hrsMax. Velocity= 7.28 fps, Min. Travel Time= 0.3 minAvg. Velocity = 3.38 fps, Avg. Travel Time= 0.7 min
Peak Storage= 23 cf @ 12.52 hrsAverage Depth at Peak Storage= 0.23'Bank-Full Depth= 1.50', Capacity at Bank-Full= 24.55 cfs
18.0" Round Pipen= 0.013 Corrugated PE, smooth interiorLength= 132.0' Slope= 0.0546 '/'Inlet Invert= 374.01', Outlet Invert= 366.80'
Reach 1R: 18"
InflowOutflow
Hydrograph
Time (hours)2502402302202102001901801701601501401301201101009080706050403020100
Flow
(cf
s)
1
0
Inflow Area=2.937 acAvg. Flow Depth=0.23'
Max Vel=7.28 fps18.0"
Round Pipen=0.013L=132.0'
S=0.0546 '/'Capacity=24.55 cfs
1.25 cfs1.25 cfs

Type III 24-hr 1 Year Rainfall=2.80"Post-Development3 Printed 11/1/2010Prepared by Petruccelli Engineering
Page 23HydroCAD® 9.10 s/n 05751 © 2009 HydroCAD Software Solutions LLC
Summary for Pond 1P: Pond - D
Inflow Area = 2.937 ac, 37.76% Impervious, Inflow Depth = 0.74" for 1 Year eventInflow = 1.25 cfs @ 12.52 hrs, Volume= 0.180 afOutflow = 1.25 cfs @ 12.52 hrs, Volume= 0.180 af, Atten= 0%, Lag= 0.0 minPrimary = 1.25 cfs @ 12.52 hrs, Volume= 0.180 afSecondary = 0.00 cfs @ 0.00 hrs, Volume= 0.000 af
Routing by Stor-Ind method, Time Span= 0.00-250.00 hrs, dt= 0.01 hrsPeak Elev= 367.37' @ 12.52 hrs
Device Routing Invert Outlet Devices#1 Primary 366.80' 18.0" Round Culvert
L= 6.0' CMP, projecting, no headwall, Ke= 0.900 Inlet / Outlet Invert= 366.80' / 361.00' S= 0.9667 '/' Cc= 0.900 n= 0.025 Corrugated metal
#2 Secondary 371.19' 57.0" W x 57.0" H Vert. Orifice/Grate C= 0.600
Primary OutFlow Max=1.24 cfs @ 12.52 hrs HW=367.37' (Free Discharge)1=Culvert (Inlet Controls 1.24 cfs @ 2.03 fps)
Secondary OutFlow Max=0.00 cfs @ 0.00 hrs HW=366.80' (Free Discharge)2=Orifice/Grate ( Controls 0.00 cfs)
Pond 1P: Pond - D
InflowOutflowPrimarySecondary
Hydrograph
Time (hours)2502402302202102001901801701601501401301201101009080706050403020100
Flow
(cf
s)
1
0
Inflow Area=2.937 acPeak Elev=367.37'
1.25 cfs1.25 cfs
1.25 cfs
0.00 cfs

Type III 24-hr 1 Year Rainfall=2.80"Post-Development3 Printed 11/1/2010Prepared by Petruccelli Engineering
Page 24HydroCAD® 9.10 s/n 05751 © 2009 HydroCAD Software Solutions LLC
Summary for Pond 3P: Detention Pond
Inflow = 0.00 cfs @ 0.00 hrs, Volume= 0.000 afOutflow = 0.00 cfs @ 0.00 hrs, Volume= 0.000 af, Atten= 0%, Lag= 0.0 minPrimary = 0.00 cfs @ 0.00 hrs, Volume= 0.000 afSecondary = 0.00 cfs @ 0.00 hrs, Volume= 0.000 af
Routing by Stor-Ind method, Time Span= 0.00-250.00 hrs, dt= 0.01 hrsPeak Elev= 363.00' @ 0.00 hrs Surf.Area= 0 sf Storage= 0 cf
Plug-Flow detention time= (not calculated: initial storage excedes outflow)Center-of-Mass det. time= (not calculated: no inflow)
Volume Invert Avail.Storage Storage Description#1 363.00' 39,443 cf Custom Stage Data (Prismatic) Listed below (Recalc)
Elevation Surf.Area Inc.Store Cum.Store(feet) (sq-ft) (cubic-feet) (cubic-feet)
363.00 0 0 0364.00 1,137 569 569366.00 2,172 3,309 3,878368.00 3,441 5,613 9,491370.00 5,233 8,674 18,165372.00 7,184 12,417 30,582373.00 7,500 7,342 37,924373.20 7,700 1,520 39,443
Device Routing Invert Outlet Devices#1 Primary 363.00' 10.000 in/hr Exfiltration over Surface area #2 Secondary 373.00' 208.0' long x 10.0' breadth Broad-Crested Rectangular Weir
Head (feet) 0.20 0.40 0.60 0.80 1.00 1.20 1.40 1.60 Coef. (English) 2.49 2.56 2.70 2.69 2.68 2.69 2.67 2.64
Primary OutFlow Max=0.00 cfs @ 0.00 hrs HW=363.00' (Free Discharge)1=Exfiltration ( Controls 0.00 cfs)
Secondary OutFlow Max=0.00 cfs @ 0.00 hrs HW=363.00' (Free Discharge)2=Broad-Crested Rectangular Weir ( Controls 0.00 cfs)
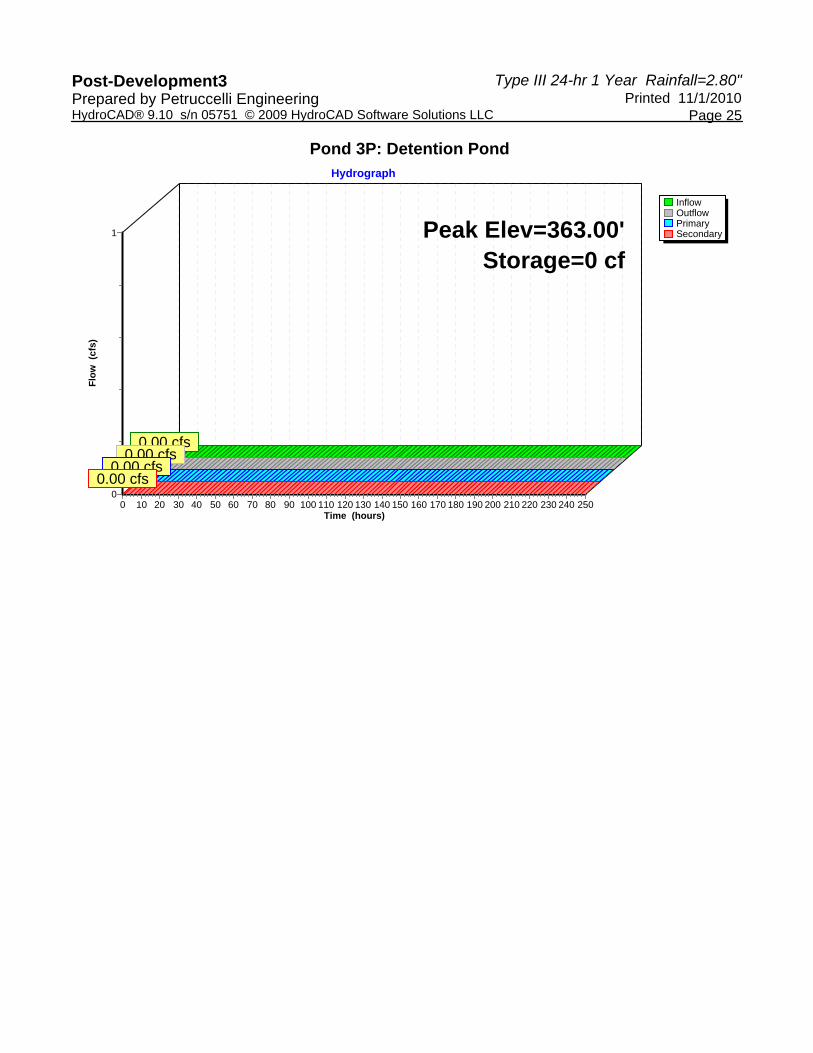
Type III 24-hr 1 Year Rainfall=2.80"Post-Development3 Printed 11/1/2010Prepared by Petruccelli Engineering
Page 25HydroCAD® 9.10 s/n 05751 © 2009 HydroCAD Software Solutions LLC
Pond 3P: Detention Pond
InflowOutflowPrimarySecondary
Hydrograph
Time (hours)2502402302202102001901801701601501401301201101009080706050403020100
Flow
(cf
s)
1
0
Peak Elev=363.00'Storage=0 cf
0.00 cfs0.00 cfs
0.00 cfs0.00 cfs

Type III 24-hr 1 Year Rainfall=2.80"Post-Development3 Printed 11/1/2010Prepared by Petruccelli Engineering
Page 26HydroCAD® 9.10 s/n 05751 © 2009 HydroCAD Software Solutions LLC
Summary for Pond 4P: Detention Pond
Inflow Area = 5.751 ac, 33.25% Impervious, Inflow Depth = 0.74" for 1 Year eventInflow = 3.05 cfs @ 12.29 hrs, Volume= 0.353 afOutflow = 0.44 cfs @ 14.06 hrs, Volume= 0.353 af, Atten= 86%, Lag= 106.3 minPrimary = 0.44 cfs @ 14.06 hrs, Volume= 0.353 afSecondary = 0.00 cfs @ 0.00 hrs, Volume= 0.000 af
Routing by Stor-Ind method, Time Span= 0.00-250.00 hrs, dt= 0.01 hrsPeak Elev= 369.34' @ 14.06 hrs Surf.Area= 1,886 sf Storage= 6,164 cf
Plug-Flow detention time= 184.5 min calculated for 0.353 af (100% of inflow)Center-of-Mass det. time= 184.5 min ( 1,071.3 - 886.9 )
Volume Invert Avail.Storage Storage Description#1 363.00' 12,557 cf Custom Stage Data (Prismatic) Listed below (Recalc)
Elevation Surf.Area Inc.Store Cum.Store(feet) (sq-ft) (cubic-feet) (cubic-feet)
363.00 0 0 0364.00 448 224 224366.00 893 1,341 1,565368.00 1,459 2,352 3,917370.00 2,095 3,554 7,471372.00 2,739 4,834 12,305372.09 2,850 252 12,557
Device Routing Invert Outlet Devices#1 Primary 363.00' 10.000 in/hr Exfiltration over Surface area #2 Device 3 372.00' 54.0' long x 1.5' breadth Broad-Crested Rectangular Weir
Head (feet) 0.20 0.40 0.60 0.80 1.00 1.20 1.40 1.60 1.80 2.00 2.50 3.00 Coef. (English) 2.62 2.64 2.64 2.68 2.75 2.86 2.92 3.07 3.07 3.03 3.28 3.32
#3 Secondary 371.00' Custom Weir/Orifice, Cv= 2.62 (C= 3.28) Head (feet) 0.00 1.00 Width (feet) 2.00 2.00
Primary OutFlow Max=0.44 cfs @ 14.06 hrs HW=369.34' (Free Discharge)1=Exfiltration (Exfiltration Controls 0.44 cfs)
Secondary OutFlow Max=0.00 cfs @ 0.00 hrs HW=363.00' (Free Discharge)3=Custom Weir/Orifice ( Controls 0.00 cfs)
2=Broad-Crested Rectangular Weir ( Controls 0.00 cfs)

Type III 24-hr 1 Year Rainfall=2.80"Post-Development3 Printed 11/1/2010Prepared by Petruccelli Engineering
Page 27HydroCAD® 9.10 s/n 05751 © 2009 HydroCAD Software Solutions LLC
Pond 4P: Detention Pond
InflowOutflowPrimarySecondary
Hydrograph
Time (hours)2502402302202102001901801701601501401301201101009080706050403020100
Flow
(cf
s)
3
2
1
0
Inflow Area=5.751 acPeak Elev=369.34'
Storage=6,164 cf
3.05 cfs
0.44 cfs0.44 cfs
0.00 cfs
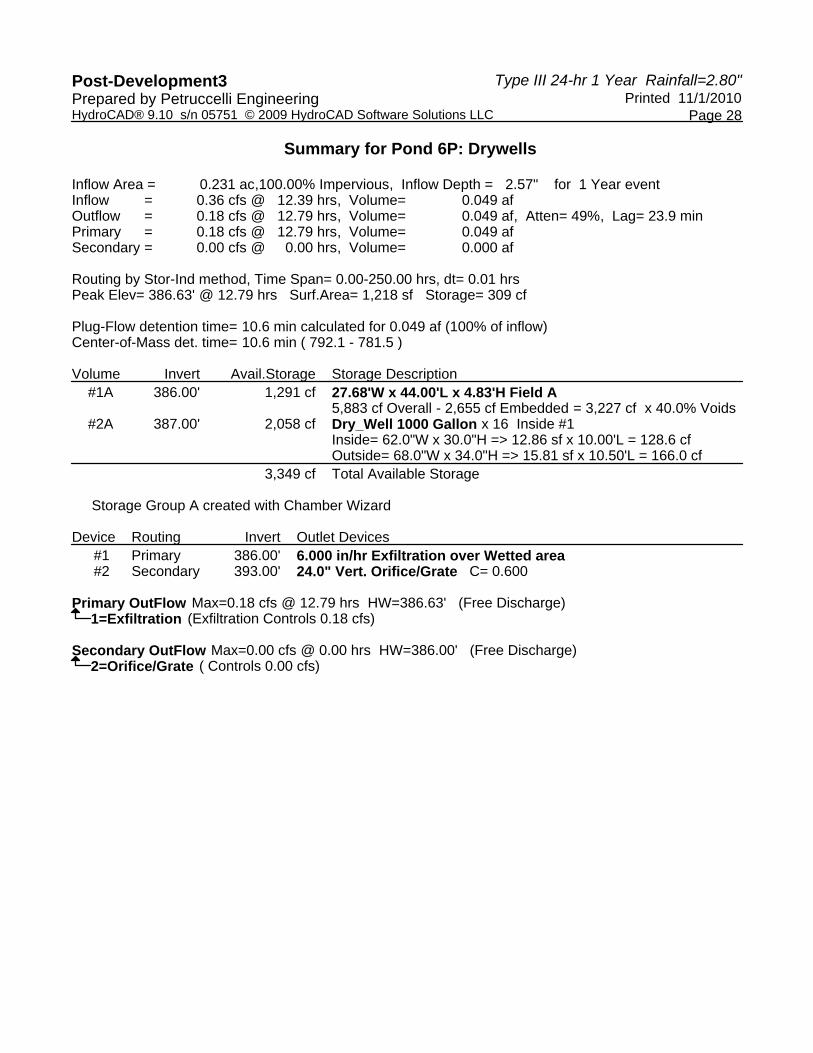
Type III 24-hr 1 Year Rainfall=2.80"Post-Development3 Printed 11/1/2010Prepared by Petruccelli Engineering
Page 28HydroCAD® 9.10 s/n 05751 © 2009 HydroCAD Software Solutions LLC
Summary for Pond 6P: Drywells
Inflow Area = 0.231 ac,100.00% Impervious, Inflow Depth = 2.57" for 1 Year eventInflow = 0.36 cfs @ 12.39 hrs, Volume= 0.049 afOutflow = 0.18 cfs @ 12.79 hrs, Volume= 0.049 af, Atten= 49%, Lag= 23.9 minPrimary = 0.18 cfs @ 12.79 hrs, Volume= 0.049 afSecondary = 0.00 cfs @ 0.00 hrs, Volume= 0.000 af
Routing by Stor-Ind method, Time Span= 0.00-250.00 hrs, dt= 0.01 hrsPeak Elev= 386.63' @ 12.79 hrs Surf.Area= 1,218 sf Storage= 309 cf
Plug-Flow detention time= 10.6 min calculated for 0.049 af (100% of inflow)Center-of-Mass det. time= 10.6 min ( 792.1 - 781.5 )
Volume Invert Avail.Storage Storage Description#1A 386.00' 1,291 cf 27.68'W x 44.00'L x 4.83'H Field A
5,883 cf Overall - 2,655 cf Embedded = 3,227 cf x 40.0% Voids#2A 387.00' 2,058 cf Dry_Well 1000 Gallon x 16 Inside #1
Inside= 62.0"W x 30.0"H => 12.86 sf x 10.00'L = 128.6 cfOutside= 68.0"W x 34.0"H => 15.81 sf x 10.50'L = 166.0 cf
3,349 cf Total Available Storage
Storage Group A created with Chamber Wizard
Device Routing Invert Outlet Devices#1 Primary 386.00' 6.000 in/hr Exfiltration over Wetted area #2 Secondary 393.00' 24.0" Vert. Orifice/Grate C= 0.600
Primary OutFlow Max=0.18 cfs @ 12.79 hrs HW=386.63' (Free Discharge)1=Exfiltration (Exfiltration Controls 0.18 cfs)
Secondary OutFlow Max=0.00 cfs @ 0.00 hrs HW=386.00' (Free Discharge)2=Orifice/Grate ( Controls 0.00 cfs)

Type III 24-hr 1 Year Rainfall=2.80"Post-Development3 Printed 11/1/2010Prepared by Petruccelli Engineering
Page 29HydroCAD® 9.10 s/n 05751 © 2009 HydroCAD Software Solutions LLC
Pond 6P: Drywells - Chamber Wizard Field A
Chamber Model = Dry_Well 1000 GallonInside= 62.0"W x 30.0"H => 12.86 sf x 10.00'L = 128.6 cfOutside= 68.0"W x 34.0"H => 15.81 sf x 10.50'L = 166.0 cf
68.0" Wide + 12.0" Spacing = 80.0" C-C
4 Chambers/Row x 10.50' Long = 42.00' + 12.0" End Stone x 2 = 44.00' Base Length4 Rows x 68.0" Wide + 12.0" Spacing x 3 + 12.0" Side Stone x 2 = 27.68' Base Width12.0" Base + 34.0" Chamber Height + 12.0" Cover = 4.83' Field Height
16 Chambers x 128.6 cf = 2,058.4 cf Chamber Storage16 Chambers x 166.0 cf = 2,655.4 cf Displacement
5,882.6 cf Field - 2,655.4 cf Chambers = 3,227.2 cf Stone x 40.0% Voids = 1,290.9 cf Stone Storage
Stone + Chamber Storage = 3,349.3 cf = 0.077 af
16 Chambers217.9 cy Field119.5 cy Stone
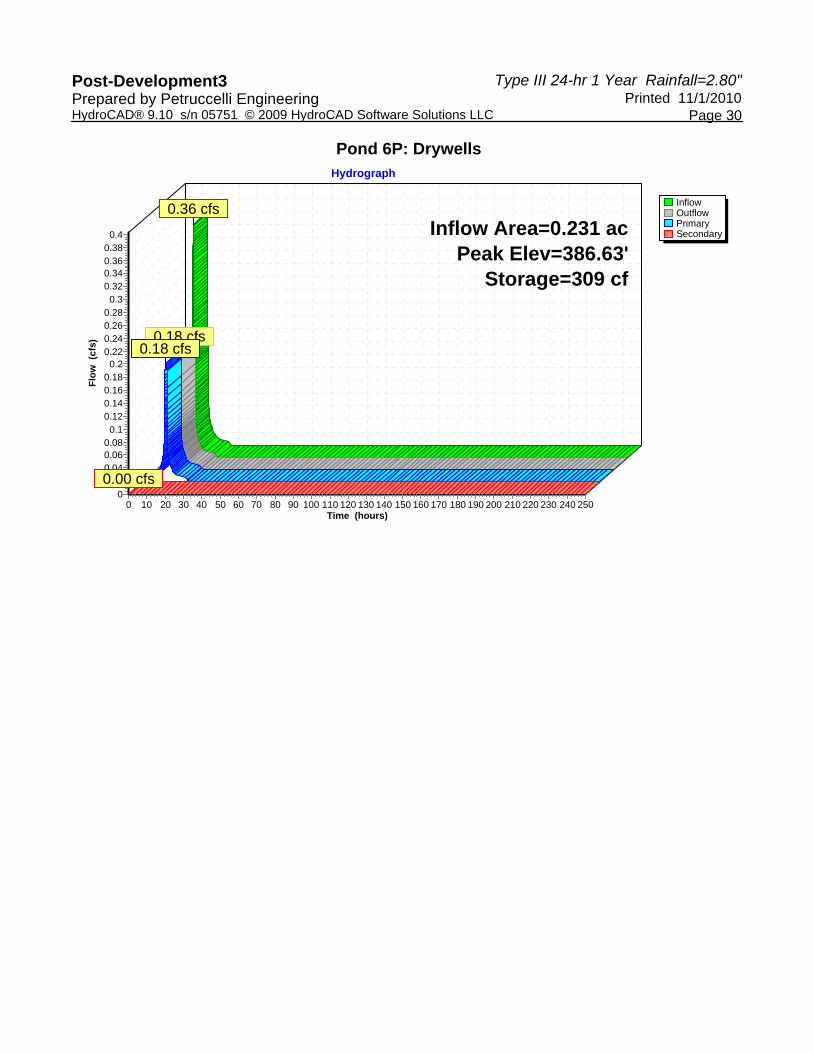
Type III 24-hr 1 Year Rainfall=2.80"Post-Development3 Printed 11/1/2010Prepared by Petruccelli Engineering
Page 30HydroCAD® 9.10 s/n 05751 © 2009 HydroCAD Software Solutions LLC
Pond 6P: Drywells
InflowOutflowPrimarySecondary
Hydrograph
Time (hours)2502402302202102001901801701601501401301201101009080706050403020100
Flow
(cf
s)
0.40.380.360.340.32
0.30.280.260.240.22
0.20.180.160.140.12
0.10.080.060.040.02
0
Inflow Area=0.231 acPeak Elev=386.63'
Storage=309 cf
0.36 cfs
0.18 cfs0.18 cfs
0.00 cfs
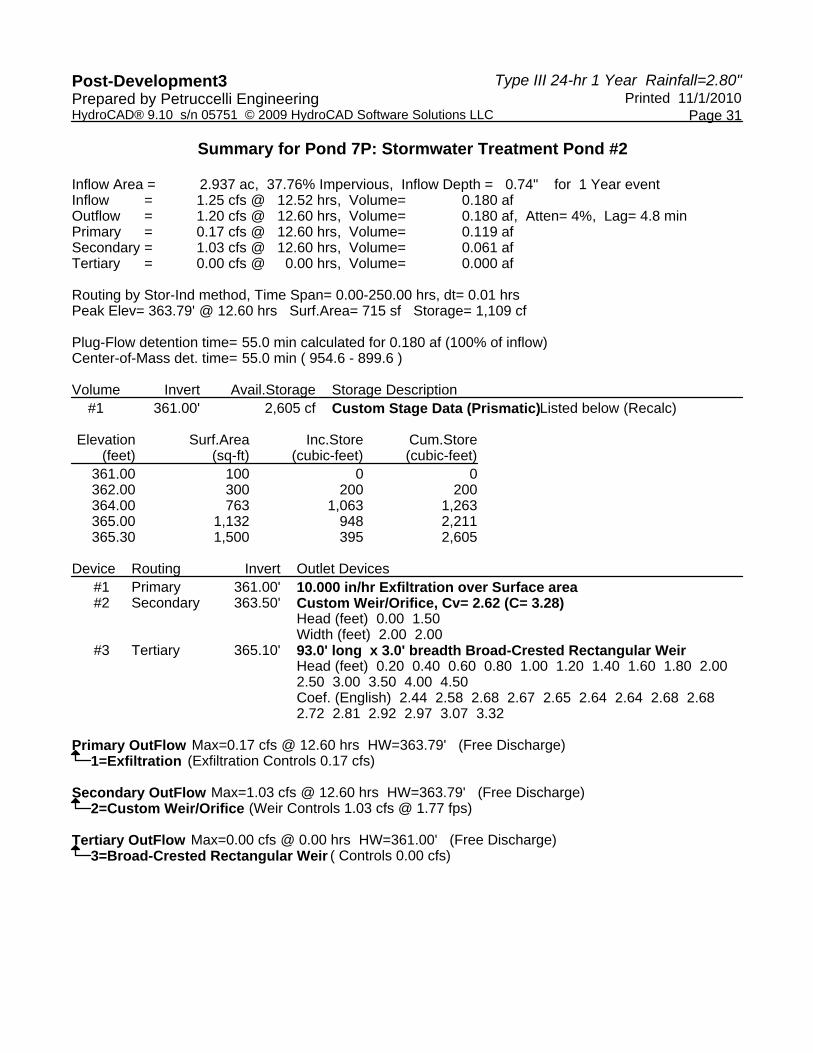
Type III 24-hr 1 Year Rainfall=2.80"Post-Development3 Printed 11/1/2010Prepared by Petruccelli Engineering
Page 31HydroCAD® 9.10 s/n 05751 © 2009 HydroCAD Software Solutions LLC
Summary for Pond 7P: Stormwater Treatment Pond #2
Inflow Area = 2.937 ac, 37.76% Impervious, Inflow Depth = 0.74" for 1 Year eventInflow = 1.25 cfs @ 12.52 hrs, Volume= 0.180 afOutflow = 1.20 cfs @ 12.60 hrs, Volume= 0.180 af, Atten= 4%, Lag= 4.8 minPrimary = 0.17 cfs @ 12.60 hrs, Volume= 0.119 afSecondary = 1.03 cfs @ 12.60 hrs, Volume= 0.061 afTertiary = 0.00 cfs @ 0.00 hrs, Volume= 0.000 af
Routing by Stor-Ind method, Time Span= 0.00-250.00 hrs, dt= 0.01 hrsPeak Elev= 363.79' @ 12.60 hrs Surf.Area= 715 sf Storage= 1,109 cf
Plug-Flow detention time= 55.0 min calculated for 0.180 af (100% of inflow)Center-of-Mass det. time= 55.0 min ( 954.6 - 899.6 )
Volume Invert Avail.Storage Storage Description#1 361.00' 2,605 cf Custom Stage Data (Prismatic) Listed below (Recalc)
Elevation Surf.Area Inc.Store Cum.Store(feet) (sq-ft) (cubic-feet) (cubic-feet)
361.00 100 0 0362.00 300 200 200364.00 763 1,063 1,263365.00 1,132 948 2,211365.30 1,500 395 2,605
Device Routing Invert Outlet Devices#1 Primary 361.00' 10.000 in/hr Exfiltration over Surface area #2 Secondary 363.50' Custom Weir/Orifice, Cv= 2.62 (C= 3.28)
Head (feet) 0.00 1.50 Width (feet) 2.00 2.00
#3 Tertiary 365.10' 93.0' long x 3.0' breadth Broad-Crested Rectangular Weir Head (feet) 0.20 0.40 0.60 0.80 1.00 1.20 1.40 1.60 1.80 2.00 2.50 3.00 3.50 4.00 4.50 Coef. (English) 2.44 2.58 2.68 2.67 2.65 2.64 2.64 2.68 2.68 2.72 2.81 2.92 2.97 3.07 3.32
Primary OutFlow Max=0.17 cfs @ 12.60 hrs HW=363.79' (Free Discharge)1=Exfiltration (Exfiltration Controls 0.17 cfs)
Secondary OutFlow Max=1.03 cfs @ 12.60 hrs HW=363.79' (Free Discharge)2=Custom Weir/Orifice (Weir Controls 1.03 cfs @ 1.77 fps)
Tertiary OutFlow Max=0.00 cfs @ 0.00 hrs HW=361.00' (Free Discharge)3=Broad-Crested Rectangular Weir ( Controls 0.00 cfs)

Type III 24-hr 1 Year Rainfall=2.80"Post-Development3 Printed 11/1/2010Prepared by Petruccelli Engineering
Page 32HydroCAD® 9.10 s/n 05751 © 2009 HydroCAD Software Solutions LLC
Pond 7P: Stormwater Treatment Pond #2
InflowOutflowPrimarySecondaryTertiary
Hydrograph
Time (hours)2502402302202102001901801701601501401301201101009080706050403020100
Flow
(cf
s)
1
0
Inflow Area=2.937 acPeak Elev=363.79'Storage=1,109 cf
1.25 cfs1.20 cfs
0.17 cfs
1.03 cfs
0.00 cfs
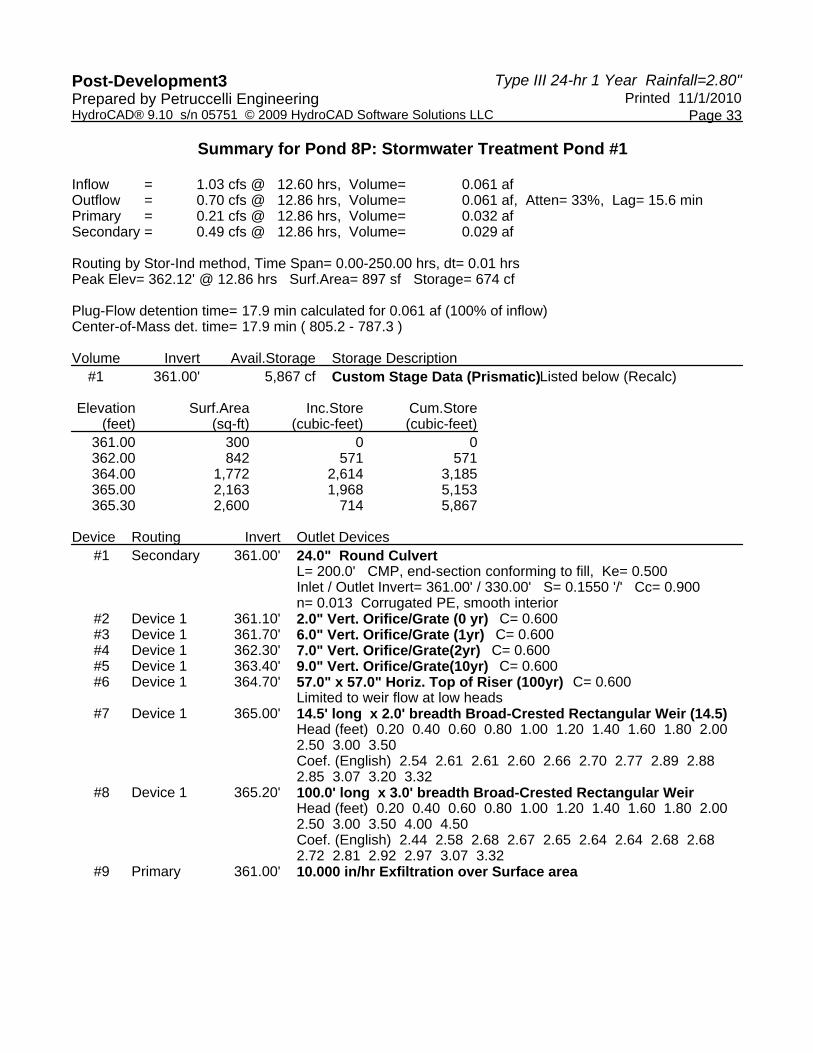
Type III 24-hr 1 Year Rainfall=2.80"Post-Development3 Printed 11/1/2010Prepared by Petruccelli Engineering
Page 33HydroCAD® 9.10 s/n 05751 © 2009 HydroCAD Software Solutions LLC
Summary for Pond 8P: Stormwater Treatment Pond #1
Inflow = 1.03 cfs @ 12.60 hrs, Volume= 0.061 afOutflow = 0.70 cfs @ 12.86 hrs, Volume= 0.061 af, Atten= 33%, Lag= 15.6 minPrimary = 0.21 cfs @ 12.86 hrs, Volume= 0.032 afSecondary = 0.49 cfs @ 12.86 hrs, Volume= 0.029 af
Routing by Stor-Ind method, Time Span= 0.00-250.00 hrs, dt= 0.01 hrsPeak Elev= 362.12' @ 12.86 hrs Surf.Area= 897 sf Storage= 674 cf
Plug-Flow detention time= 17.9 min calculated for 0.061 af (100% of inflow)Center-of-Mass det. time= 17.9 min ( 805.2 - 787.3 )
Volume Invert Avail.Storage Storage Description#1 361.00' 5,867 cf Custom Stage Data (Prismatic) Listed below (Recalc)
Elevation Surf.Area Inc.Store Cum.Store(feet) (sq-ft) (cubic-feet) (cubic-feet)
361.00 300 0 0362.00 842 571 571364.00 1,772 2,614 3,185365.00 2,163 1,968 5,153365.30 2,600 714 5,867
Device Routing Invert Outlet Devices#1 Secondary 361.00' 24.0" Round Culvert
L= 200.0' CMP, end-section conforming to fill, Ke= 0.500 Inlet / Outlet Invert= 361.00' / 330.00' S= 0.1550 '/' Cc= 0.900 n= 0.013 Corrugated PE, smooth interior
#2 Device 1 361.10' 2.0" Vert. Orifice/Grate (0 yr) C= 0.600 #3 Device 1 361.70' 6.0" Vert. Orifice/Grate (1yr) C= 0.600 #4 Device 1 362.30' 7.0" Vert. Orifice/Grate(2yr) C= 0.600 #5 Device 1 363.40' 9.0" Vert. Orifice/Grate(10yr) C= 0.600 #6 Device 1 364.70' 57.0" x 57.0" Horiz. Top of Riser (100yr) C= 0.600
Limited to weir flow at low heads #7 Device 1 365.00' 14.5' long x 2.0' breadth Broad-Crested Rectangular Weir (14.5)
Head (feet) 0.20 0.40 0.60 0.80 1.00 1.20 1.40 1.60 1.80 2.00 2.50 3.00 3.50 Coef. (English) 2.54 2.61 2.61 2.60 2.66 2.70 2.77 2.89 2.88 2.85 3.07 3.20 3.32
#8 Device 1 365.20' 100.0' long x 3.0' breadth Broad-Crested Rectangular Weir Head (feet) 0.20 0.40 0.60 0.80 1.00 1.20 1.40 1.60 1.80 2.00 2.50 3.00 3.50 4.00 4.50 Coef. (English) 2.44 2.58 2.68 2.67 2.65 2.64 2.64 2.68 2.68 2.72 2.81 2.92 2.97 3.07 3.32
#9 Primary 361.00' 10.000 in/hr Exfiltration over Surface area
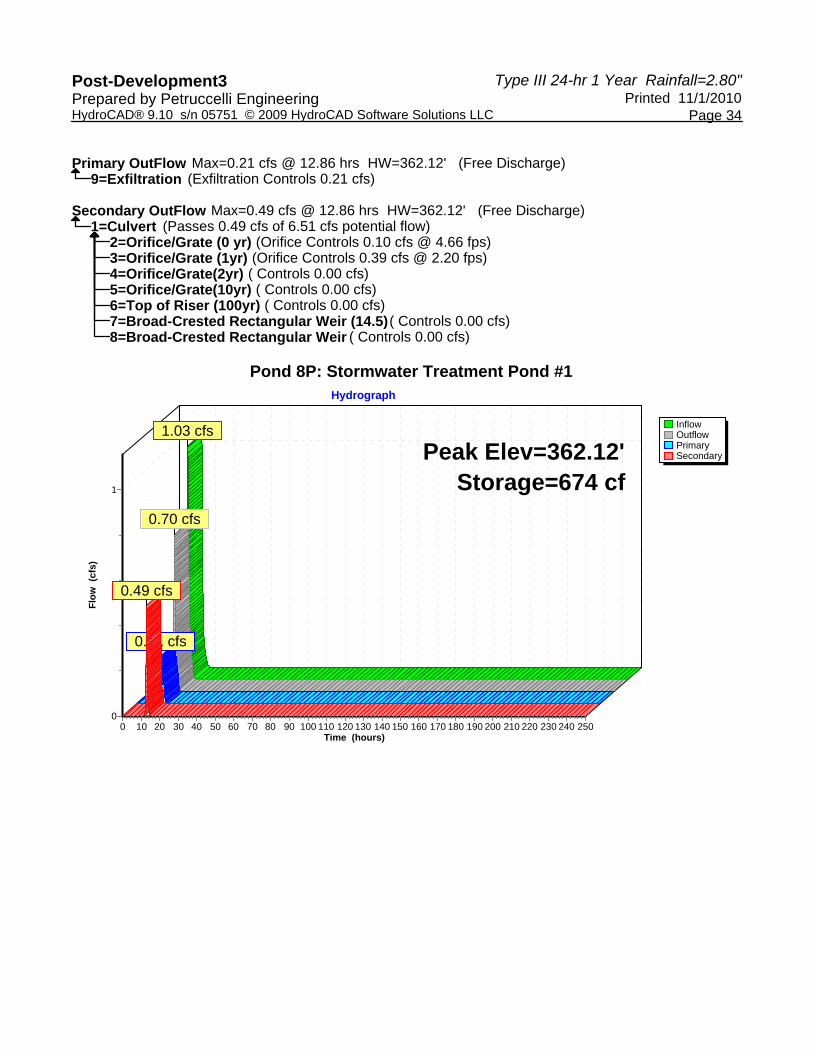
Type III 24-hr 1 Year Rainfall=2.80"Post-Development3 Printed 11/1/2010Prepared by Petruccelli Engineering
Page 34HydroCAD® 9.10 s/n 05751 © 2009 HydroCAD Software Solutions LLC
Primary OutFlow Max=0.21 cfs @ 12.86 hrs HW=362.12' (Free Discharge)9=Exfiltration (Exfiltration Controls 0.21 cfs)
Secondary OutFlow Max=0.49 cfs @ 12.86 hrs HW=362.12' (Free Discharge)1=Culvert (Passes 0.49 cfs of 6.51 cfs potential flow)
2=Orifice/Grate (0 yr) (Orifice Controls 0.10 cfs @ 4.66 fps)3=Orifice/Grate (1yr) (Orifice Controls 0.39 cfs @ 2.20 fps)4=Orifice/Grate(2yr) ( Controls 0.00 cfs)5=Orifice/Grate(10yr) ( Controls 0.00 cfs)6=Top of Riser (100yr) ( Controls 0.00 cfs)7=Broad-Crested Rectangular Weir (14.5) ( Controls 0.00 cfs)8=Broad-Crested Rectangular Weir ( Controls 0.00 cfs)
Pond 8P: Stormwater Treatment Pond #1
InflowOutflowPrimarySecondary
Hydrograph
Time (hours)2502402302202102001901801701601501401301201101009080706050403020100
Flow
(cf
s)
1
0
Peak Elev=362.12'Storage=674 cf
1.03 cfs
0.70 cfs
0.21 cfs
0.49 cfs

Type III 24-hr 1 Year Rainfall=2.80"Post-Development3 Printed 11/1/2010Prepared by Petruccelli Engineering
Page 35HydroCAD® 9.10 s/n 05751 © 2009 HydroCAD Software Solutions LLC
Summary for Pond 9P: Drywells
Inflow Area = 0.459 ac,100.00% Impervious, Inflow Depth = 2.57" for 1 Year eventInflow = 0.86 cfs @ 12.25 hrs, Volume= 0.098 afOutflow = 0.25 cfs @ 11.93 hrs, Volume= 0.098 af, Atten= 71%, Lag= 0.0 minPrimary = 0.25 cfs @ 11.93 hrs, Volume= 0.098 afSecondary = 0.00 cfs @ 0.00 hrs, Volume= 0.000 af
Routing by Stor-Ind method, Time Span= 0.00-250.00 hrs, dt= 0.01 hrsPeak Elev= 387.14' @ 12.73 hrs Surf.Area= 1,834 sf Storage= 950 cf
Plug-Flow detention time= 20.9 min calculated for 0.098 af (100% of inflow)Center-of-Mass det. time= 20.9 min ( 792.4 - 771.4 )
Volume Invert Avail.Storage Storage Description#1A 386.00' 1,685 cf 41.69'W x 44.00'L x 4.83'H Field A
8,860 cf Overall - 4,647 cf Embedded = 4,213 cf x 40.0% Voids#2A 387.00' 3,602 cf Dry_Well 1000 Gallon x 28 Inside #1
Inside= 62.0"W x 30.0"H => 12.86 sf x 10.00'L = 128.6 cfOutside= 68.0"W x 34.0"H => 15.81 sf x 10.50'L = 166.0 cf
5,287 cf Total Available Storage
Storage Group A created with Chamber Wizard
Device Routing Invert Outlet Devices#1 Primary 386.00' 6.000 in/hr Exfiltration over Surface area #2 Secondary 392.00' 24.0" Vert. Orifice/Grate C= 0.600
Primary OutFlow Max=0.25 cfs @ 11.93 hrs HW=386.08' (Free Discharge)1=Exfiltration (Exfiltration Controls 0.25 cfs)
Secondary OutFlow Max=0.00 cfs @ 0.00 hrs HW=386.00' (Free Discharge)2=Orifice/Grate ( Controls 0.00 cfs)

Type III 24-hr 1 Year Rainfall=2.80"Post-Development3 Printed 11/1/2010Prepared by Petruccelli Engineering
Page 36HydroCAD® 9.10 s/n 05751 © 2009 HydroCAD Software Solutions LLC
Pond 9P: Drywells - Chamber Wizard Field A
Chamber Model = Dry_Well 1000 GallonInside= 62.0"W x 30.0"H => 12.86 sf x 10.00'L = 128.6 cfOutside= 68.0"W x 34.0"H => 15.81 sf x 10.50'L = 166.0 cf
68.0" Wide + 0.0" Spacing = 68.0" C-C
4 Chambers/Row x 10.50' Long = 42.00' + 12.0" End Stone x 2 = 44.00' Base Length7 Rows x 68.0" Wide + 12.0" Side Stone x 2 = 41.69' Base Width12.0" Base + 34.0" Chamber Height + 12.0" Cover = 4.83' Field Height
28 Chambers x 128.6 cf = 3,602.2 cf Chamber Storage28 Chambers x 166.0 cf = 4,646.9 cf Displacement
8,860.0 cf Field - 4,646.9 cf Chambers = 4,213.1 cf Stone x 40.0% Voids = 1,685.2 cf Stone Storage
Stone + Chamber Storage = 5,287.4 cf = 0.121 af
28 Chambers328.1 cy Field156.0 cy Stone
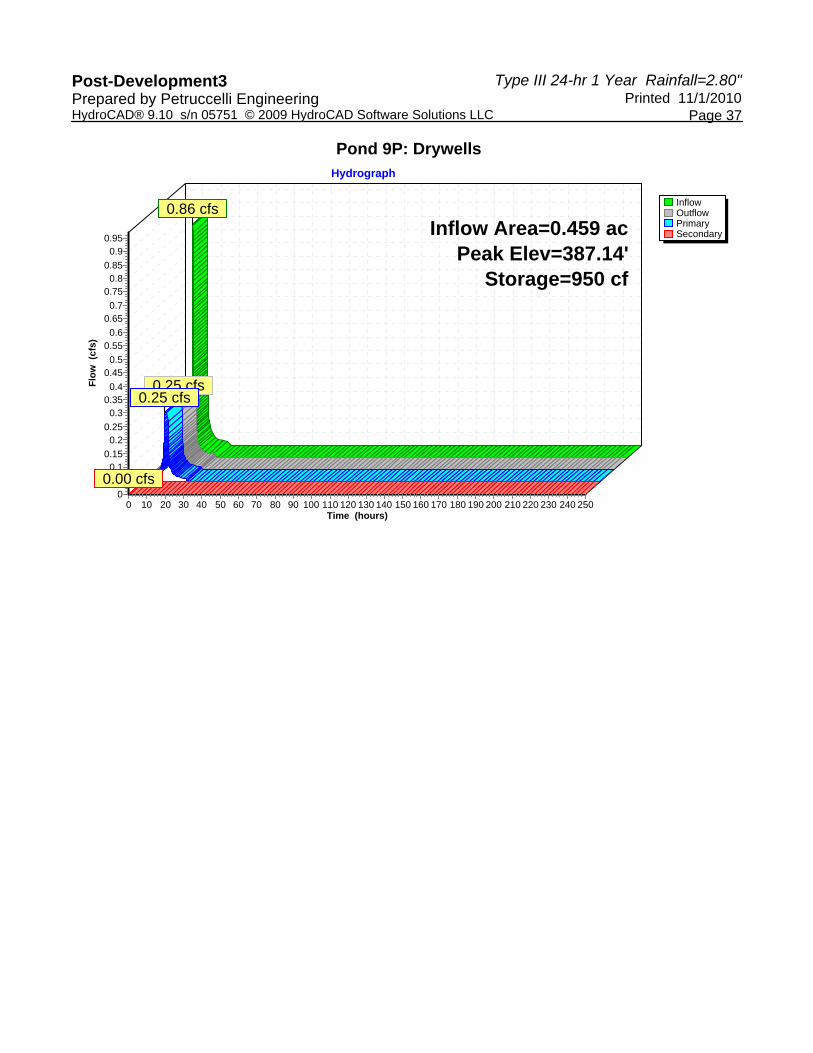
Type III 24-hr 1 Year Rainfall=2.80"Post-Development3 Printed 11/1/2010Prepared by Petruccelli Engineering
Page 37HydroCAD® 9.10 s/n 05751 © 2009 HydroCAD Software Solutions LLC
Pond 9P: Drywells
InflowOutflowPrimarySecondary
Hydrograph
Time (hours)2502402302202102001901801701601501401301201101009080706050403020100
Flow
(cf
s)
0.950.9
0.850.8
0.750.7
0.650.6
0.550.5
0.450.4
0.350.3
0.250.2
0.150.1
0.050
Inflow Area=0.459 acPeak Elev=387.14'
Storage=950 cf
0.86 cfs
0.25 cfs0.25 cfs
0.00 cfs

Type III 24-hr 1 Year Rainfall=2.80"Post-Development3 Printed 11/1/2010Prepared by Petruccelli Engineering
Page 38HydroCAD® 9.10 s/n 05751 © 2009 HydroCAD Software Solutions LLC
Summary for Link DP-1: Design Point 1
Inflow Area = 13.292 ac, 3.27% Impervious, Inflow Depth = 0.26" for 1 Year eventInflow = 1.20 cfs @ 12.68 hrs, Volume= 0.293 afPrimary = 1.20 cfs @ 12.68 hrs, Volume= 0.293 af, Atten= 0%, Lag= 0.0 min
Primary outflow = Inflow, Time Span= 0.00-250.00 hrs, dt= 0.01 hrs
Link DP-1: Design Point 1
InflowPrimary
Hydrograph
Time (hours)2502402302202102001901801701601501401301201101009080706050403020100
Flow
(cf
s)
1
0
Inflow Area=13.292 ac1.20 cfs
1.20 cfs

Type III 24-hr 1 Year Rainfall=2.80"Post-Development3 Printed 11/1/2010Prepared by Petruccelli Engineering
Page 39HydroCAD® 9.10 s/n 05751 © 2009 HydroCAD Software Solutions LLC
Summary for Link DP-2: Design Point 2
Inflow Area = 1.273 ac, 7.29% Impervious, Inflow Depth = 0.35" for 1 Year eventInflow = 0.21 cfs @ 12.47 hrs, Volume= 0.037 afPrimary = 0.21 cfs @ 12.47 hrs, Volume= 0.037 af, Atten= 0%, Lag= 0.0 min
Primary outflow = Inflow, Time Span= 0.00-250.00 hrs, dt= 0.01 hrs
Link DP-2: Design Point 2
InflowPrimary
Hydrograph
Time (hours)2502402302202102001901801701601501401301201101009080706050403020100
Flow
(cf
s)
0.230.220.21
0.20.190.180.170.160.150.140.130.120.11
0.10.090.080.070.060.050.040.030.020.01
0
Inflow Area=1.273 ac0.21 cfs
0.21 cfs

Type III 24-hr 1 Year Rainfall=2.80"Post-Development3 Printed 11/1/2010Prepared by Petruccelli Engineering
Page 40HydroCAD® 9.10 s/n 05751 © 2009 HydroCAD Software Solutions LLC
Summary for Link DP-3: Design Point 3
Inflow Area = 2.653 ac, 7.97% Impervious, Inflow Depth = 0.35" for 1 Year eventInflow = 0.41 cfs @ 12.55 hrs, Volume= 0.078 afPrimary = 0.41 cfs @ 12.55 hrs, Volume= 0.078 af, Atten= 0%, Lag= 0.0 min
Primary outflow = Inflow, Time Span= 0.00-250.00 hrs, dt= 0.01 hrs
Link DP-3: Design Point 3
InflowPrimary
Hydrograph
Time (hours)2502402302202102001901801701601501401301201101009080706050403020100
Flow
(cf
s)
0.440.42
0.40.380.360.340.32
0.30.280.260.240.22
0.20.180.160.140.12
0.10.080.060.040.02
0
Inflow Area=2.653 ac0.41 cfs
0.41 cfs
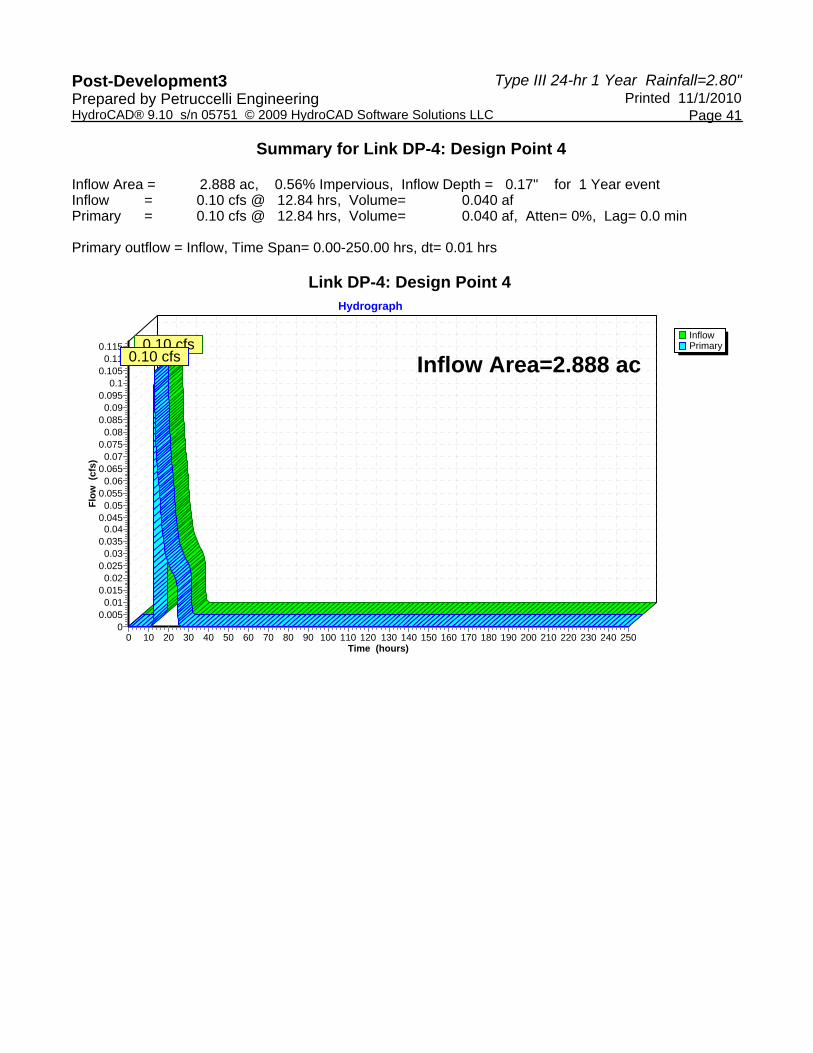
Type III 24-hr 1 Year Rainfall=2.80"Post-Development3 Printed 11/1/2010Prepared by Petruccelli Engineering
Page 41HydroCAD® 9.10 s/n 05751 © 2009 HydroCAD Software Solutions LLC
Summary for Link DP-4: Design Point 4
Inflow Area = 2.888 ac, 0.56% Impervious, Inflow Depth = 0.17" for 1 Year eventInflow = 0.10 cfs @ 12.84 hrs, Volume= 0.040 afPrimary = 0.10 cfs @ 12.84 hrs, Volume= 0.040 af, Atten= 0%, Lag= 0.0 min
Primary outflow = Inflow, Time Span= 0.00-250.00 hrs, dt= 0.01 hrs
Link DP-4: Design Point 4
InflowPrimary
Hydrograph
Time (hours)2502402302202102001901801701601501401301201101009080706050403020100
Flow
(cf
s)
0.1150.11
0.1050.1
0.0950.09
0.0850.08
0.0750.07
0.0650.06
0.0550.05
0.0450.04
0.0350.03
0.0250.02
0.0150.01
0.0050
Inflow Area=2.888 ac0.10 cfs
0.10 cfs

Type III 24-hr 1 Year Rainfall=2.80"Post-Development3 Printed 11/1/2010Prepared by Petruccelli Engineering
Page 42HydroCAD® 9.10 s/n 05751 © 2009 HydroCAD Software Solutions LLC
Summary for Link DP-5: Design Point 5
Inflow Area = 2.294 ac, 15.79% Impervious, Inflow Depth = 0.45" for 1 Year eventInflow = 0.68 cfs @ 12.23 hrs, Volume= 0.086 afPrimary = 0.68 cfs @ 12.23 hrs, Volume= 0.086 af, Atten= 0%, Lag= 0.0 min
Primary outflow = Inflow, Time Span= 0.00-250.00 hrs, dt= 0.01 hrs
Link DP-5: Design Point 5
InflowPrimary
Hydrograph
Time (hours)2502402302202102001901801701601501401301201101009080706050403020100
Flow
(cf
s)
0.75
0.7
0.65
0.6
0.55
0.5
0.45
0.4
0.35
0.3
0.25
0.2
0.15
0.1
0.05
0
Inflow Area=2.294 ac0.68 cfs
0.68 cfs
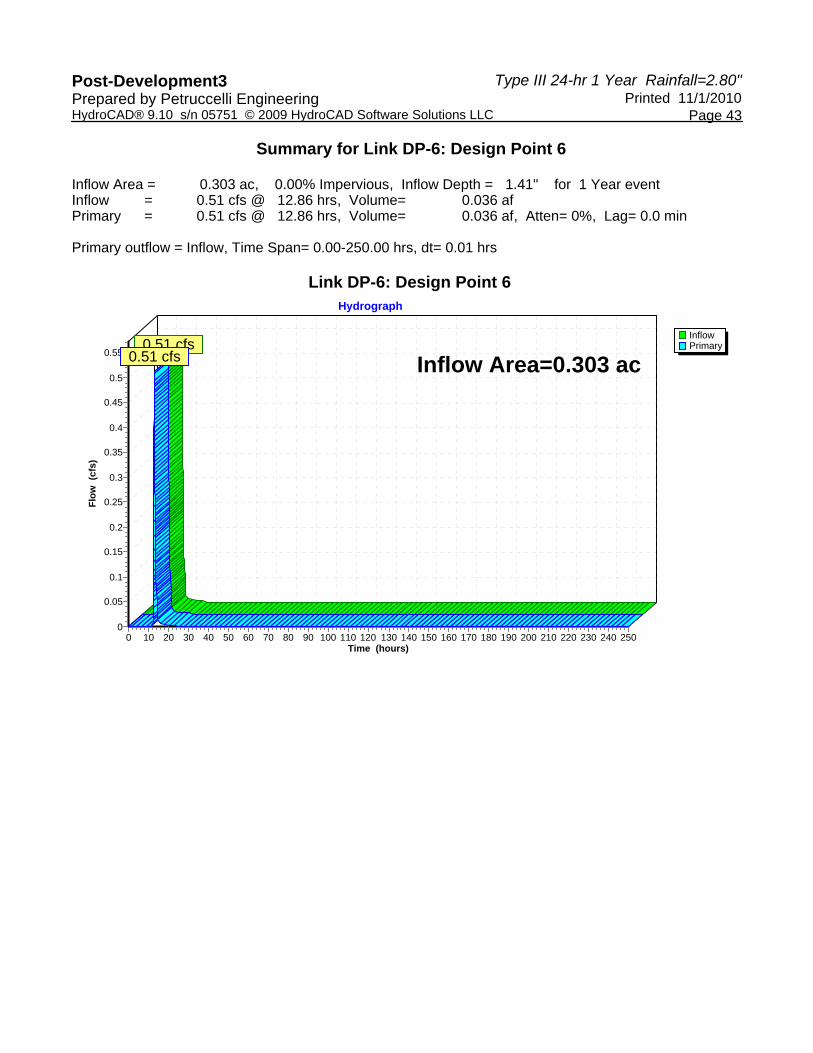
Type III 24-hr 1 Year Rainfall=2.80"Post-Development3 Printed 11/1/2010Prepared by Petruccelli Engineering
Page 43HydroCAD® 9.10 s/n 05751 © 2009 HydroCAD Software Solutions LLC
Summary for Link DP-6: Design Point 6
Inflow Area = 0.303 ac, 0.00% Impervious, Inflow Depth = 1.41" for 1 Year eventInflow = 0.51 cfs @ 12.86 hrs, Volume= 0.036 afPrimary = 0.51 cfs @ 12.86 hrs, Volume= 0.036 af, Atten= 0%, Lag= 0.0 min
Primary outflow = Inflow, Time Span= 0.00-250.00 hrs, dt= 0.01 hrs
Link DP-6: Design Point 6
InflowPrimary
Hydrograph
Time (hours)2502402302202102001901801701601501401301201101009080706050403020100
Flow
(cf
s)
0.55
0.5
0.45
0.4
0.35
0.3
0.25
0.2
0.15
0.1
0.05
0
Inflow Area=0.303 ac0.51 cfs
0.51 cfs

Type III 24-hr 1 Year Rainfall=2.80"Post-Development3 Printed 11/1/2010Prepared by Petruccelli Engineering
Page 44HydroCAD® 9.10 s/n 05751 © 2009 HydroCAD Software Solutions LLC
Summary for Link DP-7: Design Point 7
Inflow Area = 3.006 ac, 9.68% Impervious, Inflow Depth = 0.38" for 1 Year eventInflow = 0.66 cfs @ 12.26 hrs, Volume= 0.096 afPrimary = 0.66 cfs @ 12.26 hrs, Volume= 0.096 af, Atten= 0%, Lag= 0.0 min
Primary outflow = Inflow, Time Span= 0.00-250.00 hrs, dt= 0.01 hrs
Link DP-7: Design Point 7
InflowPrimary
Hydrograph
Time (hours)2502402302202102001901801701601501401301201101009080706050403020100
Flow
(cf
s)
0.7
0.65
0.6
0.55
0.5
0.45
0.4
0.35
0.3
0.25
0.2
0.15
0.1
0.05
0
Inflow Area=3.006 ac0.66 cfs
0.66 cfs
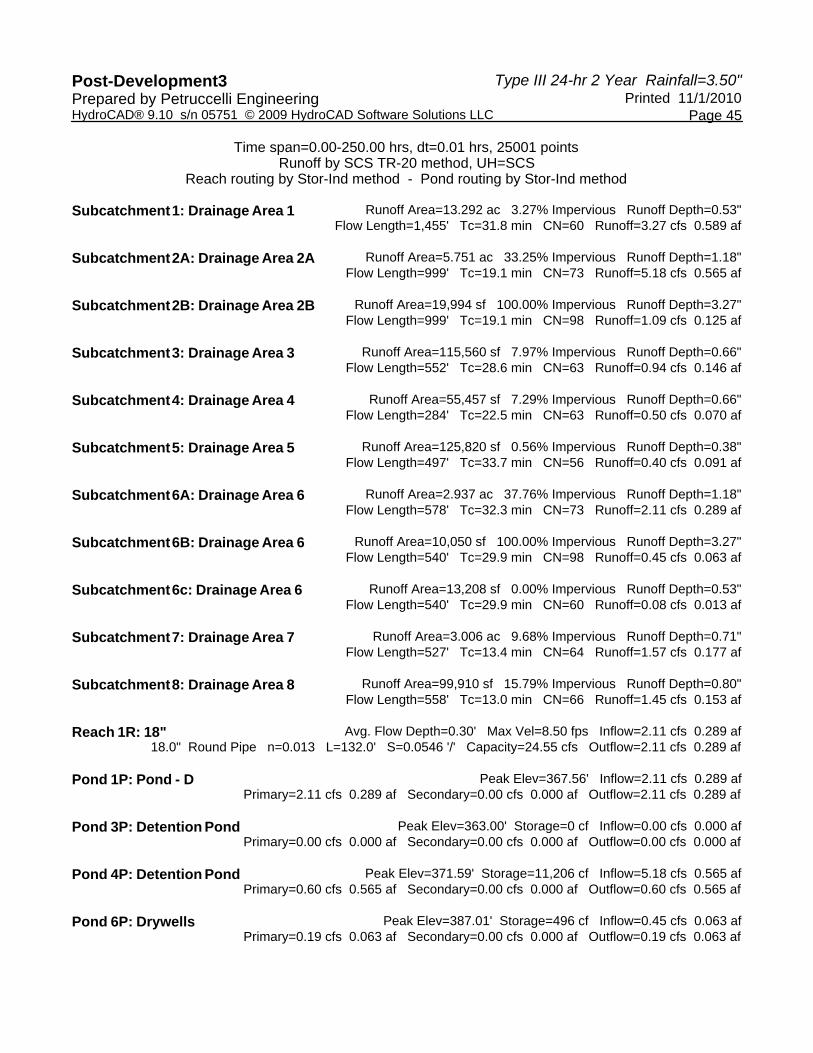
Type III 24-hr 2 Year Rainfall=3.50"Post-Development3 Printed 11/1/2010Prepared by Petruccelli Engineering
Page 45HydroCAD® 9.10 s/n 05751 © 2009 HydroCAD Software Solutions LLC
Time span=0.00-250.00 hrs, dt=0.01 hrs, 25001 pointsRunoff by SCS TR-20 method, UH=SCS
Reach routing by Stor-Ind method - Pond routing by Stor-Ind method
Runoff Area=13.292 ac 3.27% Impervious Runoff Depth=0.53"Subcatchment 1: Drainage Area 1 Flow Length=1,455' Tc=31.8 min CN=60 Runoff=3.27 cfs 0.589 af
Runoff Area=5.751 ac 33.25% Impervious Runoff Depth=1.18"Subcatchment 2A: Drainage Area 2A Flow Length=999' Tc=19.1 min CN=73 Runoff=5.18 cfs 0.565 af
Runoff Area=19,994 sf 100.00% Impervious Runoff Depth=3.27"Subcatchment 2B: Drainage Area 2B Flow Length=999' Tc=19.1 min CN=98 Runoff=1.09 cfs 0.125 af
Runoff Area=115,560 sf 7.97% Impervious Runoff Depth=0.66"Subcatchment 3: Drainage Area 3 Flow Length=552' Tc=28.6 min CN=63 Runoff=0.94 cfs 0.146 af
Runoff Area=55,457 sf 7.29% Impervious Runoff Depth=0.66"Subcatchment 4: Drainage Area 4 Flow Length=284' Tc=22.5 min CN=63 Runoff=0.50 cfs 0.070 af
Runoff Area=125,820 sf 0.56% Impervious Runoff Depth=0.38"Subcatchment 5: Drainage Area 5 Flow Length=497' Tc=33.7 min CN=56 Runoff=0.40 cfs 0.091 af
Runoff Area=2.937 ac 37.76% Impervious Runoff Depth=1.18"Subcatchment 6A: Drainage Area 6 Flow Length=578' Tc=32.3 min CN=73 Runoff=2.11 cfs 0.289 af
Runoff Area=10,050 sf 100.00% Impervious Runoff Depth=3.27"Subcatchment 6B: Drainage Area 6 Flow Length=540' Tc=29.9 min CN=98 Runoff=0.45 cfs 0.063 af
Runoff Area=13,208 sf 0.00% Impervious Runoff Depth=0.53"Subcatchment 6c: Drainage Area 6 Flow Length=540' Tc=29.9 min CN=60 Runoff=0.08 cfs 0.013 af
Runoff Area=3.006 ac 9.68% Impervious Runoff Depth=0.71"Subcatchment 7: Drainage Area 7 Flow Length=527' Tc=13.4 min CN=64 Runoff=1.57 cfs 0.177 af
Runoff Area=99,910 sf 15.79% Impervious Runoff Depth=0.80"Subcatchment 8: Drainage Area 8 Flow Length=558' Tc=13.0 min CN=66 Runoff=1.45 cfs 0.153 af
Avg. Flow Depth=0.30' Max Vel=8.50 fps Inflow=2.11 cfs 0.289 afReach 1R: 18"18.0" Round Pipe n=0.013 L=132.0' S=0.0546 '/' Capacity=24.55 cfs Outflow=2.11 cfs 0.289 af
Peak Elev=367.56' Inflow=2.11 cfs 0.289 afPond 1P: Pond - D Primary=2.11 cfs 0.289 af Secondary=0.00 cfs 0.000 af Outflow=2.11 cfs 0.289 af
Peak Elev=363.00' Storage=0 cf Inflow=0.00 cfs 0.000 afPond 3P: Detention Pond Primary=0.00 cfs 0.000 af Secondary=0.00 cfs 0.000 af Outflow=0.00 cfs 0.000 af
Peak Elev=371.59' Storage=11,206 cf Inflow=5.18 cfs 0.565 afPond 4P: Detention Pond Primary=0.60 cfs 0.565 af Secondary=0.00 cfs 0.000 af Outflow=0.60 cfs 0.565 af
Peak Elev=387.01' Storage=496 cf Inflow=0.45 cfs 0.063 afPond 6P: Drywells Primary=0.19 cfs 0.063 af Secondary=0.00 cfs 0.000 af Outflow=0.19 cfs 0.063 af
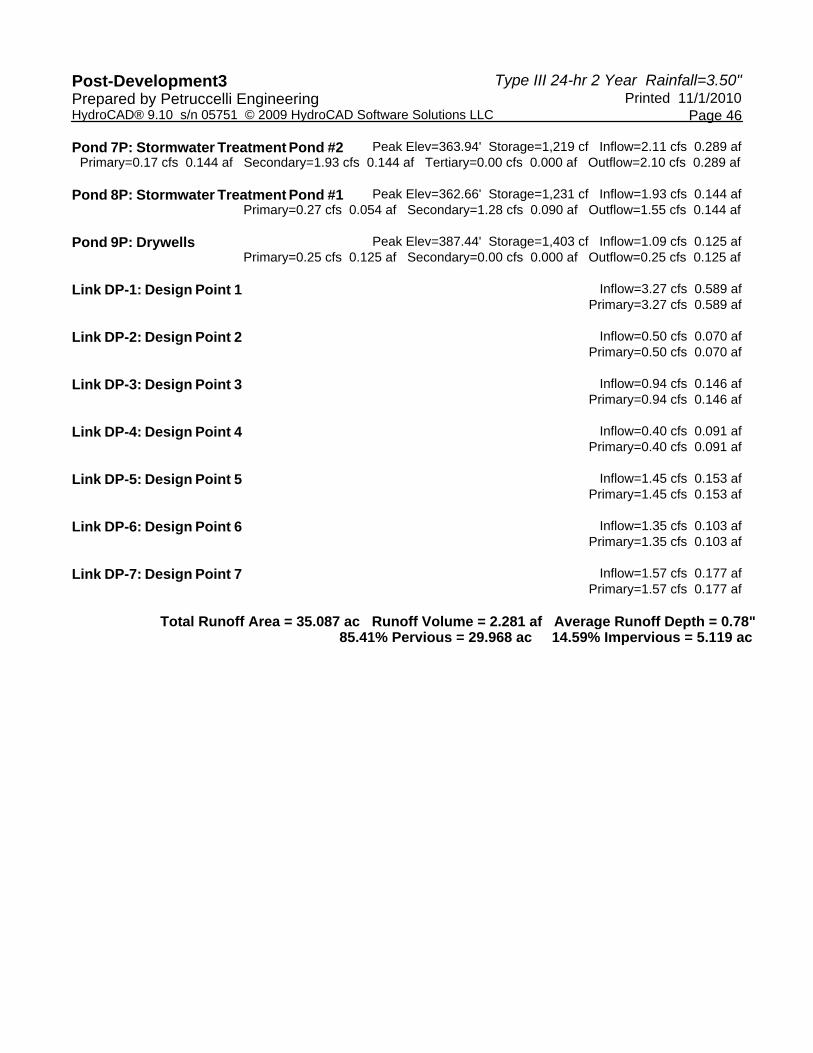
Type III 24-hr 2 Year Rainfall=3.50"Post-Development3 Printed 11/1/2010Prepared by Petruccelli Engineering
Page 46HydroCAD® 9.10 s/n 05751 © 2009 HydroCAD Software Solutions LLC
Peak Elev=363.94' Storage=1,219 cf Inflow=2.11 cfs 0.289 afPond 7P: Stormwater Treatment Pond #2 Primary=0.17 cfs 0.144 af Secondary=1.93 cfs 0.144 af Tertiary=0.00 cfs 0.000 af Outflow=2.10 cfs 0.289 af
Peak Elev=362.66' Storage=1,231 cf Inflow=1.93 cfs 0.144 afPond 8P: Stormwater Treatment Pond #1 Primary=0.27 cfs 0.054 af Secondary=1.28 cfs 0.090 af Outflow=1.55 cfs 0.144 af
Peak Elev=387.44' Storage=1,403 cf Inflow=1.09 cfs 0.125 afPond 9P: Drywells Primary=0.25 cfs 0.125 af Secondary=0.00 cfs 0.000 af Outflow=0.25 cfs 0.125 af
Inflow=3.27 cfs 0.589 afLink DP-1: Design Point 1 Primary=3.27 cfs 0.589 af
Inflow=0.50 cfs 0.070 afLink DP-2: Design Point 2 Primary=0.50 cfs 0.070 af
Inflow=0.94 cfs 0.146 afLink DP-3: Design Point 3 Primary=0.94 cfs 0.146 af
Inflow=0.40 cfs 0.091 afLink DP-4: Design Point 4 Primary=0.40 cfs 0.091 af
Inflow=1.45 cfs 0.153 afLink DP-5: Design Point 5 Primary=1.45 cfs 0.153 af
Inflow=1.35 cfs 0.103 afLink DP-6: Design Point 6 Primary=1.35 cfs 0.103 af
Inflow=1.57 cfs 0.177 afLink DP-7: Design Point 7 Primary=1.57 cfs 0.177 af
Total Runoff Area = 35.087 ac Runoff Volume = 2.281 af Average Runoff Depth = 0.78"85.41% Pervious = 29.968 ac 14.59% Impervious = 5.119 ac
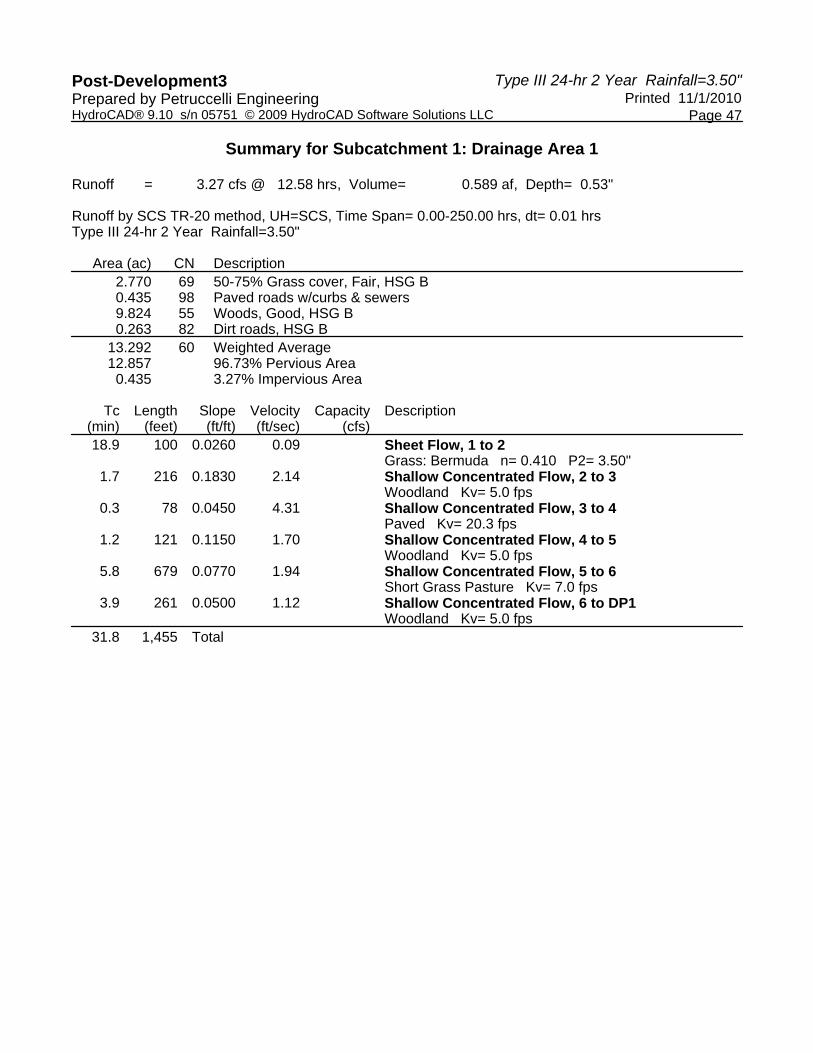
Type III 24-hr 2 Year Rainfall=3.50"Post-Development3 Printed 11/1/2010Prepared by Petruccelli Engineering
Page 47HydroCAD® 9.10 s/n 05751 © 2009 HydroCAD Software Solutions LLC
Summary for Subcatchment 1: Drainage Area 1
Runoff = 3.27 cfs @ 12.58 hrs, Volume= 0.589 af, Depth= 0.53"
Runoff by SCS TR-20 method, UH=SCS, Time Span= 0.00-250.00 hrs, dt= 0.01 hrsType III 24-hr 2 Year Rainfall=3.50"
Area (ac) CN Description2.770 69 50-75% Grass cover, Fair, HSG B0.435 98 Paved roads w/curbs & sewers9.824 55 Woods, Good, HSG B0.263 82 Dirt roads, HSG B
13.292 60 Weighted Average12.857 96.73% Pervious Area
0.435 3.27% Impervious Area
Tc Length Slope Velocity Capacity Description(min) (feet) (ft/ft) (ft/sec) (cfs)18.9 100 0.0260 0.09 Sheet Flow, 1 to 2
Grass: Bermuda n= 0.410 P2= 3.50"1.7 216 0.1830 2.14 Shallow Concentrated Flow, 2 to 3
Woodland Kv= 5.0 fps0.3 78 0.0450 4.31 Shallow Concentrated Flow, 3 to 4
Paved Kv= 20.3 fps1.2 121 0.1150 1.70 Shallow Concentrated Flow, 4 to 5
Woodland Kv= 5.0 fps5.8 679 0.0770 1.94 Shallow Concentrated Flow, 5 to 6
Short Grass Pasture Kv= 7.0 fps3.9 261 0.0500 1.12 Shallow Concentrated Flow, 6 to DP1
Woodland Kv= 5.0 fps31.8 1,455 Total

Type III 24-hr 2 Year Rainfall=3.50"Post-Development3 Printed 11/1/2010Prepared by Petruccelli Engineering
Page 48HydroCAD® 9.10 s/n 05751 © 2009 HydroCAD Software Solutions LLC
Subcatchment 1: Drainage Area 1
Runoff
Hydrograph
Time (hours)2502402302202102001901801701601501401301201101009080706050403020100
Flow
(cf
s)
3
2
1
0
Type III 24-hr 2 YearRainfall=3.50"
Runoff Area=13.292 acRunoff Volume=0.589 af
Runoff Depth=0.53"Flow Length=1,455'
Tc=31.8 minCN=60
3.27 cfs
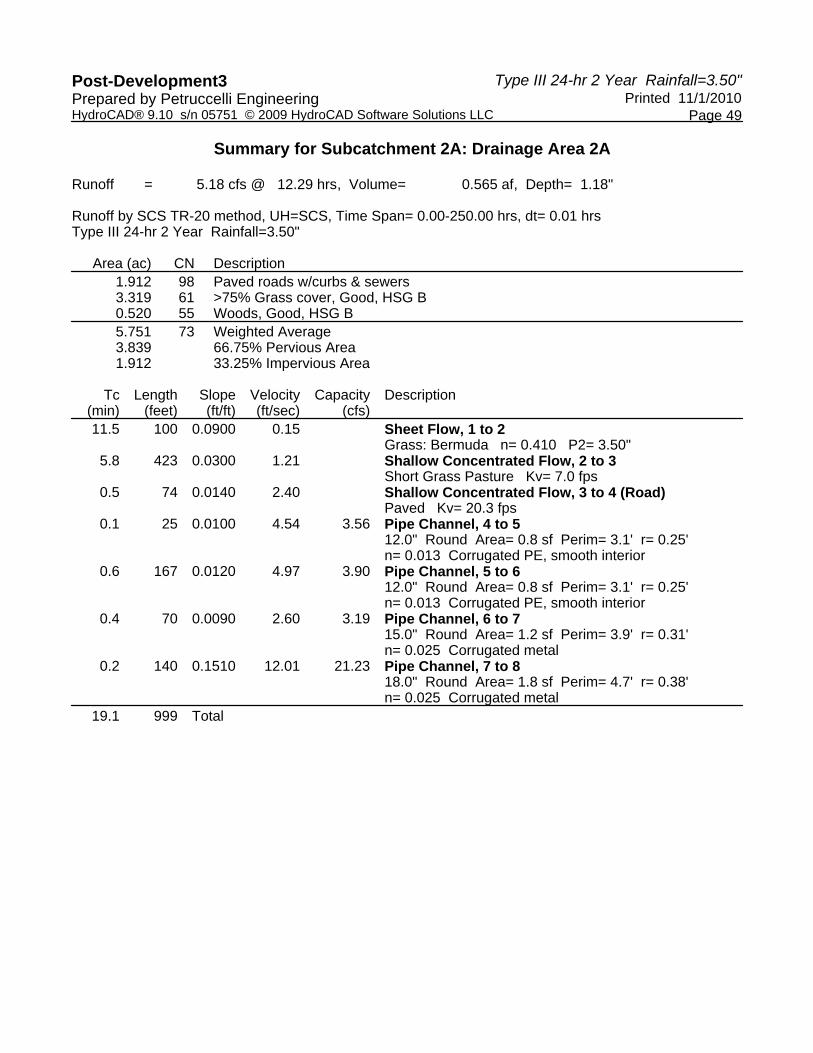
Type III 24-hr 2 Year Rainfall=3.50"Post-Development3 Printed 11/1/2010Prepared by Petruccelli Engineering
Page 49HydroCAD® 9.10 s/n 05751 © 2009 HydroCAD Software Solutions LLC
Summary for Subcatchment 2A: Drainage Area 2A
Runoff = 5.18 cfs @ 12.29 hrs, Volume= 0.565 af, Depth= 1.18"
Runoff by SCS TR-20 method, UH=SCS, Time Span= 0.00-250.00 hrs, dt= 0.01 hrsType III 24-hr 2 Year Rainfall=3.50"
Area (ac) CN Description1.912 98 Paved roads w/curbs & sewers3.319 61 >75% Grass cover, Good, HSG B0.520 55 Woods, Good, HSG B5.751 73 Weighted Average3.839 66.75% Pervious Area1.912 33.25% Impervious Area
Tc Length Slope Velocity Capacity Description(min) (feet) (ft/ft) (ft/sec) (cfs)11.5 100 0.0900 0.15 Sheet Flow, 1 to 2
Grass: Bermuda n= 0.410 P2= 3.50"5.8 423 0.0300 1.21 Shallow Concentrated Flow, 2 to 3
Short Grass Pasture Kv= 7.0 fps0.5 74 0.0140 2.40 Shallow Concentrated Flow, 3 to 4 (Road)
Paved Kv= 20.3 fps0.1 25 0.0100 4.54 3.56 Pipe Channel, 4 to 5
12.0" Round Area= 0.8 sf Perim= 3.1' r= 0.25'n= 0.013 Corrugated PE, smooth interior
0.6 167 0.0120 4.97 3.90 Pipe Channel, 5 to 612.0" Round Area= 0.8 sf Perim= 3.1' r= 0.25'n= 0.013 Corrugated PE, smooth interior
0.4 70 0.0090 2.60 3.19 Pipe Channel, 6 to 715.0" Round Area= 1.2 sf Perim= 3.9' r= 0.31'n= 0.025 Corrugated metal
0.2 140 0.1510 12.01 21.23 Pipe Channel, 7 to 818.0" Round Area= 1.8 sf Perim= 4.7' r= 0.38'n= 0.025 Corrugated metal
19.1 999 Total

Type III 24-hr 2 Year Rainfall=3.50"Post-Development3 Printed 11/1/2010Prepared by Petruccelli Engineering
Page 50HydroCAD® 9.10 s/n 05751 © 2009 HydroCAD Software Solutions LLC
Subcatchment 2A: Drainage Area 2A
Runoff
Hydrograph
Time (hours)2502402302202102001901801701601501401301201101009080706050403020100
Flow
(cf
s)
5
4
3
2
1
0
Type III 24-hr 2 YearRainfall=3.50"
Runoff Area=5.751 acRunoff Volume=0.565 af
Runoff Depth=1.18"Flow Length=999'
Tc=19.1 minCN=73
5.18 cfs

Type III 24-hr 2 Year Rainfall=3.50"Post-Development3 Printed 11/1/2010Prepared by Petruccelli Engineering
Page 51HydroCAD® 9.10 s/n 05751 © 2009 HydroCAD Software Solutions LLC
Summary for Subcatchment 2B: Drainage Area 2B
Runoff = 1.09 cfs @ 12.25 hrs, Volume= 0.125 af, Depth= 3.27"
Runoff by SCS TR-20 method, UH=SCS, Time Span= 0.00-250.00 hrs, dt= 0.01 hrsType III 24-hr 2 Year Rainfall=3.50"
Area (sf) CN Description19,994 98 Paved roads w/curbs & sewers19,994 100.00% Impervious Area
Tc Length Slope Velocity Capacity Description(min) (feet) (ft/ft) (ft/sec) (cfs)11.5 100 0.0900 0.15 Sheet Flow, 1 to 2
Grass: Bermuda n= 0.410 P2= 3.50"5.8 423 0.0300 1.21 Shallow Concentrated Flow, 2 to 3
Short Grass Pasture Kv= 7.0 fps0.5 74 0.0140 2.40 Shallow Concentrated Flow, 3 to 4 (Road)
Paved Kv= 20.3 fps0.1 25 0.0100 4.54 3.56 Pipe Channel, 4 to 5
12.0" Round Area= 0.8 sf Perim= 3.1' r= 0.25'n= 0.013 Corrugated PE, smooth interior
0.6 167 0.0120 4.97 3.90 Pipe Channel, 5 to 612.0" Round Area= 0.8 sf Perim= 3.1' r= 0.25'n= 0.013 Corrugated PE, smooth interior
0.4 70 0.0090 2.60 3.19 Pipe Channel, 6 to 715.0" Round Area= 1.2 sf Perim= 3.9' r= 0.31'n= 0.025 Corrugated metal
0.2 140 0.1510 12.01 21.23 Pipe Channel, 7 to 818.0" Round Area= 1.8 sf Perim= 4.7' r= 0.38'n= 0.025 Corrugated metal
19.1 999 Total

Type III 24-hr 2 Year Rainfall=3.50"Post-Development3 Printed 11/1/2010Prepared by Petruccelli Engineering
Page 52HydroCAD® 9.10 s/n 05751 © 2009 HydroCAD Software Solutions LLC
Subcatchment 2B: Drainage Area 2B
Runoff
Hydrograph
Time (hours)2502402302202102001901801701601501401301201101009080706050403020100
Flow
(cf
s)
1
0
Type III 24-hr 2 YearRainfall=3.50"
Runoff Area=19,994 sfRunoff Volume=0.125 af
Runoff Depth=3.27"Flow Length=999'
Tc=19.1 minCN=98
1.09 cfs

Type III 24-hr 2 Year Rainfall=3.50"Post-Development3 Printed 11/1/2010Prepared by Petruccelli Engineering
Page 53HydroCAD® 9.10 s/n 05751 © 2009 HydroCAD Software Solutions LLC
Summary for Subcatchment 3: Drainage Area 3
Runoff = 0.94 cfs @ 12.49 hrs, Volume= 0.146 af, Depth= 0.66"
Runoff by SCS TR-20 method, UH=SCS, Time Span= 0.00-250.00 hrs, dt= 0.01 hrsType III 24-hr 2 Year Rainfall=3.50"
Area (sf) CN Description49,852 61 >75% Grass cover, Good, HSG B56,494 60 Woods, Fair, HSG B
9,214 98 Paved roads w/curbs & sewers115,560 63 Weighted Average106,346 92.03% Pervious Area
9,214 7.97% Impervious Area
Tc Length Slope Velocity Capacity Description(min) (feet) (ft/ft) (ft/sec) (cfs)19.4 118 0.0320 0.10 Sheet Flow, 1 to 2
Woods: Light underbrush n= 0.400 P2= 3.50"2.5 87 0.0140 0.59 Shallow Concentrated Flow, 2 to 3
Woodland Kv= 5.0 fps1.2 159 0.1940 2.20 Shallow Concentrated Flow, 3 to 4
Woodland Kv= 5.0 fps5.5 188 0.0130 0.57 Shallow Concentrated Flow, 4 to DP 3
Woodland Kv= 5.0 fps28.6 552 Total
Subcatchment 3: Drainage Area 3
Runoff
Hydrograph
Time (hours)2502402302202102001901801701601501401301201101009080706050403020100
Flow
(cf
s)
1
0
Type III 24-hr 2 YearRainfall=3.50"
Runoff Area=115,560 sfRunoff Volume=0.146 af
Runoff Depth=0.66"Flow Length=552'
Tc=28.6 minCN=63
0.94 cfs

Type III 24-hr 2 Year Rainfall=3.50"Post-Development3 Printed 11/1/2010Prepared by Petruccelli Engineering
Page 54HydroCAD® 9.10 s/n 05751 © 2009 HydroCAD Software Solutions LLC
Summary for Subcatchment 4: Drainage Area 4
Runoff = 0.50 cfs @ 12.38 hrs, Volume= 0.070 af, Depth= 0.66"
Runoff by SCS TR-20 method, UH=SCS, Time Span= 0.00-250.00 hrs, dt= 0.01 hrsType III 24-hr 2 Year Rainfall=3.50"
Area (sf) CN Description31,781 60 Woods, Fair, HSG B
4,042 98 Paved roads w/curbs & sewers19,634 61 >75% Grass cover, Good, HSG B55,457 63 Weighted Average51,415 92.71% Pervious Area
4,042 7.29% Impervious Area
Tc Length Slope Velocity Capacity Description(min) (feet) (ft/ft) (ft/sec) (cfs)20.9 207 0.0860 0.16 Sheet Flow, 1 to 2
Grass: Bermuda n= 0.410 P2= 3.50"1.6 77 0.0130 0.80 Shallow Concentrated Flow, 2 to DP 4
Short Grass Pasture Kv= 7.0 fps22.5 284 Total
Subcatchment 4: Drainage Area 4
Runoff
Hydrograph
Time (hours)2502402302202102001901801701601501401301201101009080706050403020100
Flow
(cf
s)
0.55
0.5
0.45
0.4
0.35
0.3
0.25
0.2
0.15
0.1
0.05
0
Type III 24-hr 2 YearRainfall=3.50"
Runoff Area=55,457 sfRunoff Volume=0.070 af
Runoff Depth=0.66"Flow Length=284'
Tc=22.5 minCN=63
0.50 cfs

Type III 24-hr 2 Year Rainfall=3.50"Post-Development3 Printed 11/1/2010Prepared by Petruccelli Engineering
Page 55HydroCAD® 9.10 s/n 05751 © 2009 HydroCAD Software Solutions LLC
Summary for Subcatchment 5: Drainage Area 5
Runoff = 0.40 cfs @ 12.66 hrs, Volume= 0.091 af, Depth= 0.38"
Runoff by SCS TR-20 method, UH=SCS, Time Span= 0.00-250.00 hrs, dt= 0.01 hrsType III 24-hr 2 Year Rainfall=3.50"
Area (sf) CN Description23,735 61 >75% Grass cover, Good, HSG B
101,385 55 Woods, Good, HSG B700 98 Paved parking, HSG B
125,820 56 Weighted Average125,120 99.44% Pervious Area
700 0.56% Impervious Area
Tc Length Slope Velocity Capacity Description(min) (feet) (ft/ft) (ft/sec) (cfs)29.9 135 0.0150 0.08 Sheet Flow, 1 to 2
Grass: Bermuda n= 0.410 P2= 3.50"3.8 362 0.1020 1.60 Shallow Concentrated Flow, 2 to DP 4
Woodland Kv= 5.0 fps33.7 497 Total
Subcatchment 5: Drainage Area 5
Runoff
Hydrograph
Time (hours)2502402302202102001901801701601501401301201101009080706050403020100
Flow
(cf
s)
0.440.42
0.40.380.360.340.32
0.30.280.260.240.22
0.20.180.160.140.12
0.10.080.060.040.02
0
Type III 24-hr 2 YearRainfall=3.50"
Runoff Area=125,820 sfRunoff Volume=0.091 af
Runoff Depth=0.38"Flow Length=497'
Tc=33.7 minCN=56
0.40 cfs

Type III 24-hr 2 Year Rainfall=3.50"Post-Development3 Printed 11/1/2010Prepared by Petruccelli Engineering
Page 56HydroCAD® 9.10 s/n 05751 © 2009 HydroCAD Software Solutions LLC
Summary for Subcatchment 6A: Drainage Area 6
Runoff = 2.11 cfs @ 12.49 hrs, Volume= 0.289 af, Depth= 1.18"
Runoff by SCS TR-20 method, UH=SCS, Time Span= 0.00-250.00 hrs, dt= 0.01 hrsType III 24-hr 2 Year Rainfall=3.50"
Area (ac) CN Description0.893 55 Woods, Good, HSG B1.109 98 Paved roads w/curbs & sewers0.935 61 >75% Grass cover, Good, HSG B2.937 73 Weighted Average1.828 62.24% Pervious Area1.109 37.76% Impervious Area
Tc Length Slope Velocity Capacity Description(min) (feet) (ft/ft) (ft/sec) (cfs)21.6 185 0.0600 0.14 Sheet Flow, 1 to 2
Woods: Light underbrush n= 0.400 P2= 3.50"0.5 214 0.1180 6.97 Shallow Concentrated Flow, 2 to 3
Paved Kv= 20.3 fps0.0 17 0.0120 6.25 7.67 Pipe Channel, 3 to 4 (Catchbasins)
15.0" Round Area= 1.2 sf Perim= 3.9' r= 0.31'n= 0.012 HDPE
0.4 132 0.0077 5.22 9.22 Pipe Channel, 4 to 5 (18" Culvert)18.0" Round Area= 1.8 sf Perim= 4.7' r= 0.38'n= 0.013 HDPE
9.8 30 0.0120 0.05 Sheet Flow, 5 to DP 6Grass: Bermuda n= 0.410 P2= 3.50"
32.3 578 Total

Type III 24-hr 2 Year Rainfall=3.50"Post-Development3 Printed 11/1/2010Prepared by Petruccelli Engineering
Page 57HydroCAD® 9.10 s/n 05751 © 2009 HydroCAD Software Solutions LLC
Subcatchment 6A: Drainage Area 6
Runoff
Hydrograph
Time (hours)2502402302202102001901801701601501401301201101009080706050403020100
Flow
(cf
s)
2
1
0
Type III 24-hr 2 YearRainfall=3.50"
Runoff Area=2.937 acRunoff Volume=0.289 af
Runoff Depth=1.18"Flow Length=578'
Tc=32.3 minCN=73
2.11 cfs

Type III 24-hr 2 Year Rainfall=3.50"Post-Development3 Printed 11/1/2010Prepared by Petruccelli Engineering
Page 58HydroCAD® 9.10 s/n 05751 © 2009 HydroCAD Software Solutions LLC
Summary for Subcatchment 6B: Drainage Area 6
Runoff = 0.45 cfs @ 12.39 hrs, Volume= 0.063 af, Depth= 3.27"
Runoff by SCS TR-20 method, UH=SCS, Time Span= 0.00-250.00 hrs, dt= 0.01 hrsType III 24-hr 2 Year Rainfall=3.50"
Area (sf) CN Description10,050 98 Paved roads w/curbs & sewers10,050 100.00% Impervious Area
Tc Length Slope Velocity Capacity Description(min) (feet) (ft/ft) (ft/sec) (cfs)21.6 185 0.0600 0.14 Sheet Flow, 1 to 2
Woods: Light underbrush n= 0.400 P2= 3.50"0.5 214 0.1180 6.97 Shallow Concentrated Flow, 2 to 3
Paved Kv= 20.3 fps0.0 17 0.0120 6.25 7.67 Pipe Channel, 3 to 4 (Catchbasins)
15.0" Round Area= 1.2 sf Perim= 3.9' r= 0.31'n= 0.012 HDPE
0.1 101 0.1730 24.72 43.69 Pipe Channel, 4 to 5 (18" Culvert)18.0" Round Area= 1.8 sf Perim= 4.7' r= 0.38'n= 0.013 HDPE
7.7 23 0.0130 0.05 Sheet Flow, 5 to DP 6Grass: Bermuda n= 0.410 P2= 3.50"
29.9 540 Total
Subcatchment 6B: Drainage Area 6
Runoff
Hydrograph
Time (hours)2502402302202102001901801701601501401301201101009080706050403020100
Flow
(cf
s)
0.50.480.460.440.42
0.40.380.360.340.32
0.30.280.260.240.22
0.20.180.160.140.12
0.10.080.060.040.02
0
Type III 24-hr 2 YearRainfall=3.50"
Runoff Area=10,050 sfRunoff Volume=0.063 af
Runoff Depth=3.27"Flow Length=540'
Tc=29.9 minCN=98
0.45 cfs
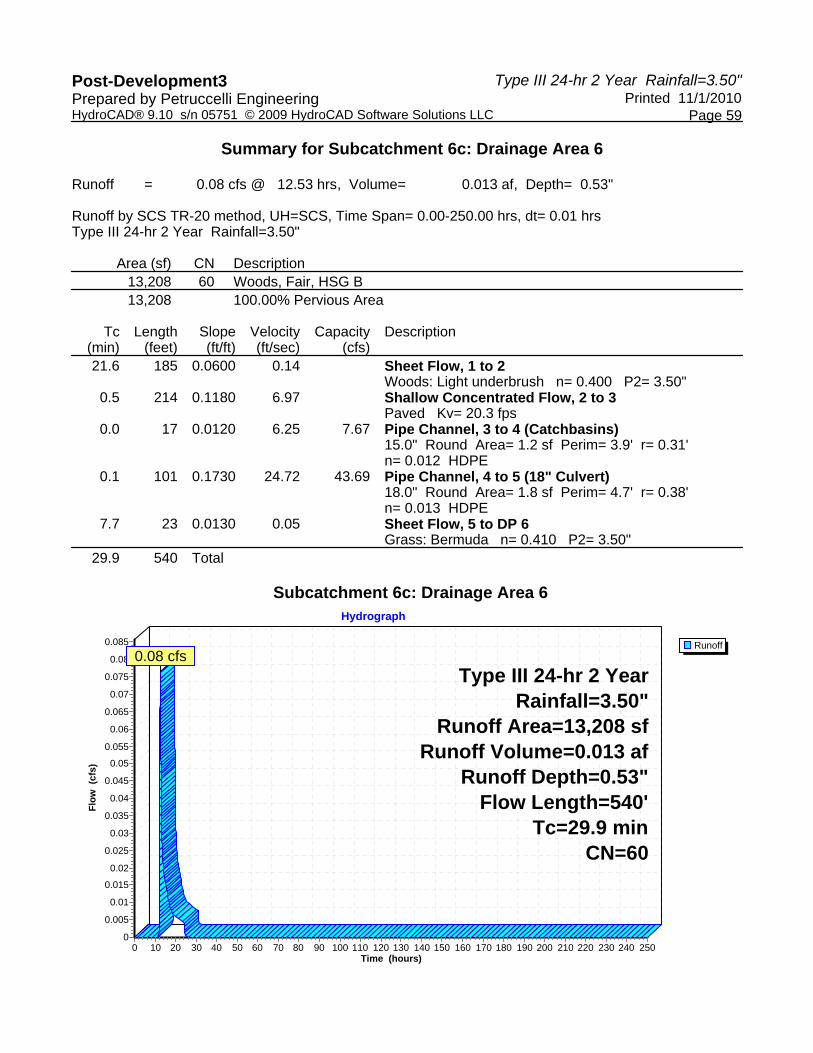
Type III 24-hr 2 Year Rainfall=3.50"Post-Development3 Printed 11/1/2010Prepared by Petruccelli Engineering
Page 59HydroCAD® 9.10 s/n 05751 © 2009 HydroCAD Software Solutions LLC
Summary for Subcatchment 6c: Drainage Area 6
Runoff = 0.08 cfs @ 12.53 hrs, Volume= 0.013 af, Depth= 0.53"
Runoff by SCS TR-20 method, UH=SCS, Time Span= 0.00-250.00 hrs, dt= 0.01 hrsType III 24-hr 2 Year Rainfall=3.50"
Area (sf) CN Description13,208 60 Woods, Fair, HSG B13,208 100.00% Pervious Area
Tc Length Slope Velocity Capacity Description(min) (feet) (ft/ft) (ft/sec) (cfs)21.6 185 0.0600 0.14 Sheet Flow, 1 to 2
Woods: Light underbrush n= 0.400 P2= 3.50"0.5 214 0.1180 6.97 Shallow Concentrated Flow, 2 to 3
Paved Kv= 20.3 fps0.0 17 0.0120 6.25 7.67 Pipe Channel, 3 to 4 (Catchbasins)
15.0" Round Area= 1.2 sf Perim= 3.9' r= 0.31'n= 0.012 HDPE
0.1 101 0.1730 24.72 43.69 Pipe Channel, 4 to 5 (18" Culvert)18.0" Round Area= 1.8 sf Perim= 4.7' r= 0.38'n= 0.013 HDPE
7.7 23 0.0130 0.05 Sheet Flow, 5 to DP 6Grass: Bermuda n= 0.410 P2= 3.50"
29.9 540 Total
Subcatchment 6c: Drainage Area 6
Runoff
Hydrograph
Time (hours)2502402302202102001901801701601501401301201101009080706050403020100
Flow
(cf
s)
0.085
0.08
0.075
0.07
0.065
0.06
0.055
0.05
0.045
0.04
0.035
0.03
0.025
0.02
0.015
0.01
0.005
0
Type III 24-hr 2 YearRainfall=3.50"
Runoff Area=13,208 sfRunoff Volume=0.013 af
Runoff Depth=0.53"Flow Length=540'
Tc=29.9 minCN=60
0.08 cfs
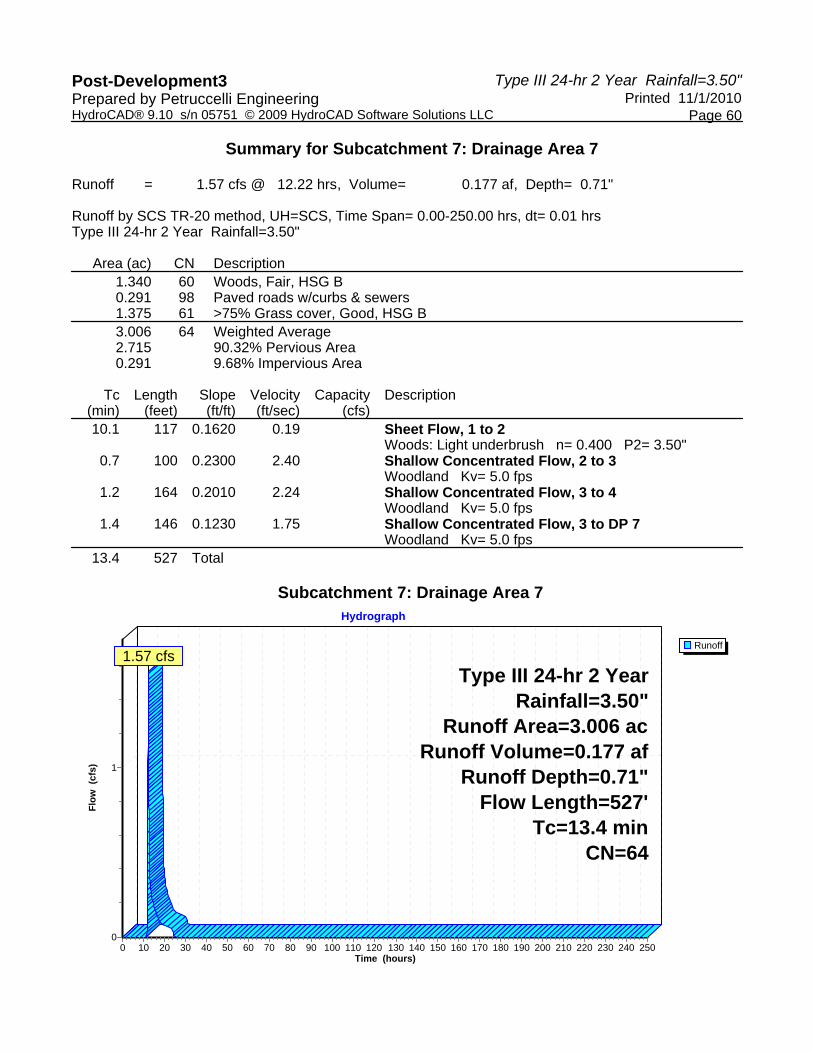
Type III 24-hr 2 Year Rainfall=3.50"Post-Development3 Printed 11/1/2010Prepared by Petruccelli Engineering
Page 60HydroCAD® 9.10 s/n 05751 © 2009 HydroCAD Software Solutions LLC
Summary for Subcatchment 7: Drainage Area 7
Runoff = 1.57 cfs @ 12.22 hrs, Volume= 0.177 af, Depth= 0.71"
Runoff by SCS TR-20 method, UH=SCS, Time Span= 0.00-250.00 hrs, dt= 0.01 hrsType III 24-hr 2 Year Rainfall=3.50"
Area (ac) CN Description1.340 60 Woods, Fair, HSG B0.291 98 Paved roads w/curbs & sewers1.375 61 >75% Grass cover, Good, HSG B3.006 64 Weighted Average2.715 90.32% Pervious Area0.291 9.68% Impervious Area
Tc Length Slope Velocity Capacity Description(min) (feet) (ft/ft) (ft/sec) (cfs)10.1 117 0.1620 0.19 Sheet Flow, 1 to 2
Woods: Light underbrush n= 0.400 P2= 3.50"0.7 100 0.2300 2.40 Shallow Concentrated Flow, 2 to 3
Woodland Kv= 5.0 fps1.2 164 0.2010 2.24 Shallow Concentrated Flow, 3 to 4
Woodland Kv= 5.0 fps1.4 146 0.1230 1.75 Shallow Concentrated Flow, 3 to DP 7
Woodland Kv= 5.0 fps13.4 527 Total
Subcatchment 7: Drainage Area 7
Runoff
Hydrograph
Time (hours)2502402302202102001901801701601501401301201101009080706050403020100
Flow
(cf
s) 1
0
Type III 24-hr 2 YearRainfall=3.50"
Runoff Area=3.006 acRunoff Volume=0.177 af
Runoff Depth=0.71"Flow Length=527'
Tc=13.4 minCN=64
1.57 cfs

Type III 24-hr 2 Year Rainfall=3.50"Post-Development3 Printed 11/1/2010Prepared by Petruccelli Engineering
Page 61HydroCAD® 9.10 s/n 05751 © 2009 HydroCAD Software Solutions LLC
Summary for Subcatchment 8: Drainage Area 8
Runoff = 1.45 cfs @ 12.21 hrs, Volume= 0.153 af, Depth= 0.80"
Runoff by SCS TR-20 method, UH=SCS, Time Span= 0.00-250.00 hrs, dt= 0.01 hrsType III 24-hr 2 Year Rainfall=3.50"
Area (sf) CN Description41,570 60 Woods, Fair, HSG B15,772 98 Paved roads w/curbs & sewers42,568 61 >75% Grass cover, Good, HSG B99,910 66 Weighted Average84,138 84.21% Pervious Area15,772 15.79% Impervious Area
Tc Length Slope Velocity Capacity Description(min) (feet) (ft/ft) (ft/sec) (cfs)
9.7 100 0.1300 0.17 Sheet Flow, 1 to 2Woods: Light underbrush n= 0.400 P2= 3.50"
3.1 362 0.1550 1.97 Shallow Concentrated Flow, 2 to 3Woodland Kv= 5.0 fps
0.2 96 0.1150 6.88 Shallow Concentrated Flow, 3 to DP 8Paved Kv= 20.3 fps
13.0 558 Total
Subcatchment 8: Drainage Area 8
Runoff
Hydrograph
Time (hours)2502402302202102001901801701601501401301201101009080706050403020100
Flow
(cf
s)
1
0
Type III 24-hr 2 YearRainfall=3.50"
Runoff Area=99,910 sfRunoff Volume=0.153 af
Runoff Depth=0.80"Flow Length=558'
Tc=13.0 minCN=66
1.45 cfs
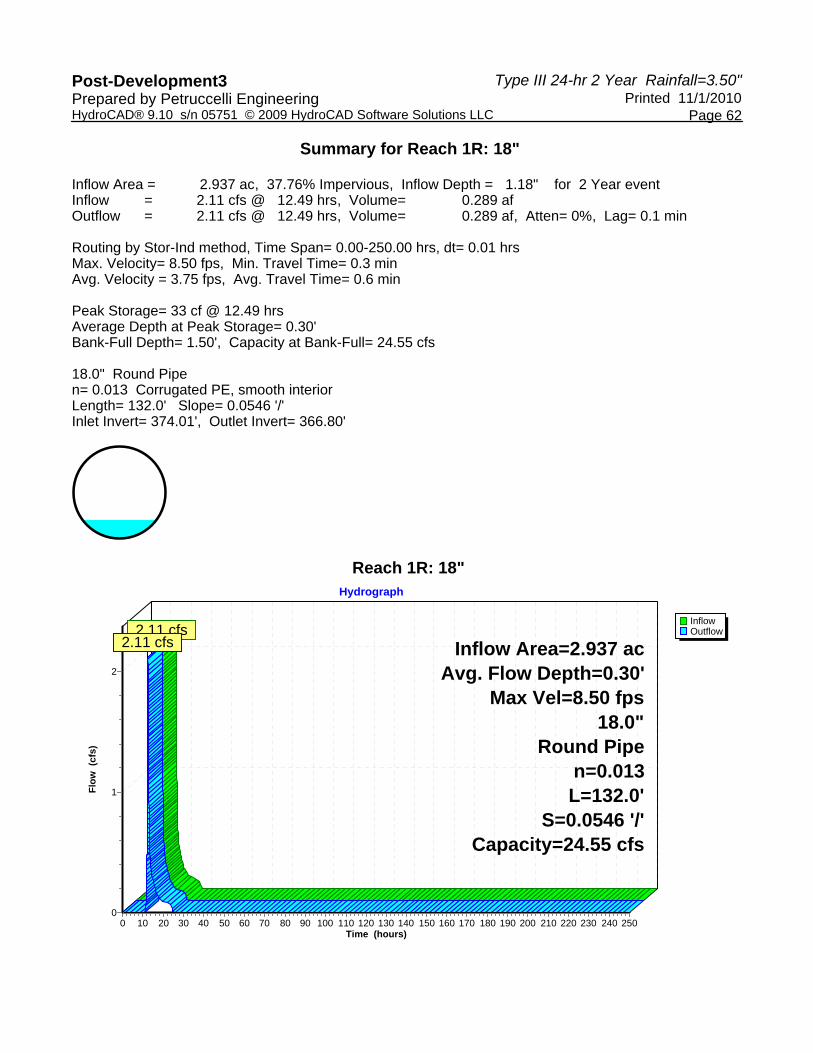
Type III 24-hr 2 Year Rainfall=3.50"Post-Development3 Printed 11/1/2010Prepared by Petruccelli Engineering
Page 62HydroCAD® 9.10 s/n 05751 © 2009 HydroCAD Software Solutions LLC
Summary for Reach 1R: 18"
Inflow Area = 2.937 ac, 37.76% Impervious, Inflow Depth = 1.18" for 2 Year eventInflow = 2.11 cfs @ 12.49 hrs, Volume= 0.289 afOutflow = 2.11 cfs @ 12.49 hrs, Volume= 0.289 af, Atten= 0%, Lag= 0.1 min
Routing by Stor-Ind method, Time Span= 0.00-250.00 hrs, dt= 0.01 hrsMax. Velocity= 8.50 fps, Min. Travel Time= 0.3 minAvg. Velocity = 3.75 fps, Avg. Travel Time= 0.6 min
Peak Storage= 33 cf @ 12.49 hrsAverage Depth at Peak Storage= 0.30'Bank-Full Depth= 1.50', Capacity at Bank-Full= 24.55 cfs
18.0" Round Pipen= 0.013 Corrugated PE, smooth interiorLength= 132.0' Slope= 0.0546 '/'Inlet Invert= 374.01', Outlet Invert= 366.80'
Reach 1R: 18"
InflowOutflow
Hydrograph
Time (hours)2502402302202102001901801701601501401301201101009080706050403020100
Flow
(cf
s)
2
1
0
Inflow Area=2.937 acAvg. Flow Depth=0.30'
Max Vel=8.50 fps18.0"
Round Pipen=0.013L=132.0'
S=0.0546 '/'Capacity=24.55 cfs
2.11 cfs2.11 cfs
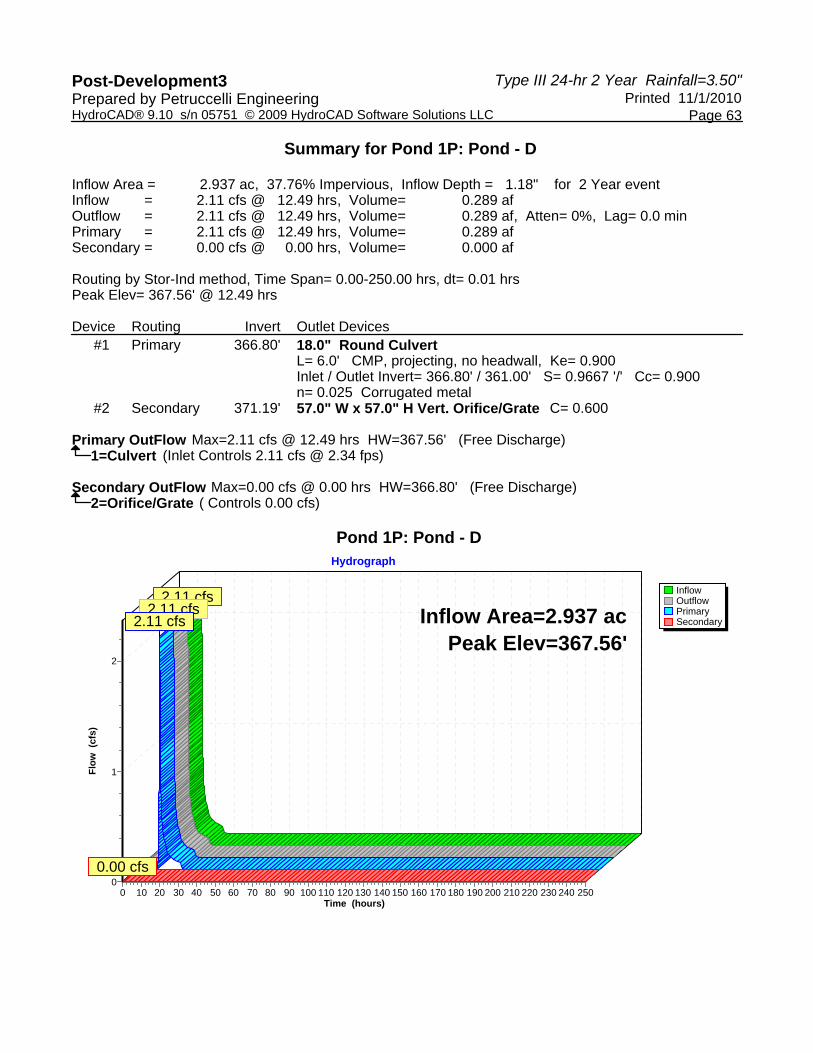
Type III 24-hr 2 Year Rainfall=3.50"Post-Development3 Printed 11/1/2010Prepared by Petruccelli Engineering
Page 63HydroCAD® 9.10 s/n 05751 © 2009 HydroCAD Software Solutions LLC
Summary for Pond 1P: Pond - D
Inflow Area = 2.937 ac, 37.76% Impervious, Inflow Depth = 1.18" for 2 Year eventInflow = 2.11 cfs @ 12.49 hrs, Volume= 0.289 afOutflow = 2.11 cfs @ 12.49 hrs, Volume= 0.289 af, Atten= 0%, Lag= 0.0 minPrimary = 2.11 cfs @ 12.49 hrs, Volume= 0.289 afSecondary = 0.00 cfs @ 0.00 hrs, Volume= 0.000 af
Routing by Stor-Ind method, Time Span= 0.00-250.00 hrs, dt= 0.01 hrsPeak Elev= 367.56' @ 12.49 hrs
Device Routing Invert Outlet Devices#1 Primary 366.80' 18.0" Round Culvert
L= 6.0' CMP, projecting, no headwall, Ke= 0.900 Inlet / Outlet Invert= 366.80' / 361.00' S= 0.9667 '/' Cc= 0.900 n= 0.025 Corrugated metal
#2 Secondary 371.19' 57.0" W x 57.0" H Vert. Orifice/Grate C= 0.600
Primary OutFlow Max=2.11 cfs @ 12.49 hrs HW=367.56' (Free Discharge)1=Culvert (Inlet Controls 2.11 cfs @ 2.34 fps)
Secondary OutFlow Max=0.00 cfs @ 0.00 hrs HW=366.80' (Free Discharge)2=Orifice/Grate ( Controls 0.00 cfs)
Pond 1P: Pond - D
InflowOutflowPrimarySecondary
Hydrograph
Time (hours)2502402302202102001901801701601501401301201101009080706050403020100
Flow
(cf
s)
2
1
0
Inflow Area=2.937 acPeak Elev=367.56'
2.11 cfs2.11 cfs
2.11 cfs
0.00 cfs
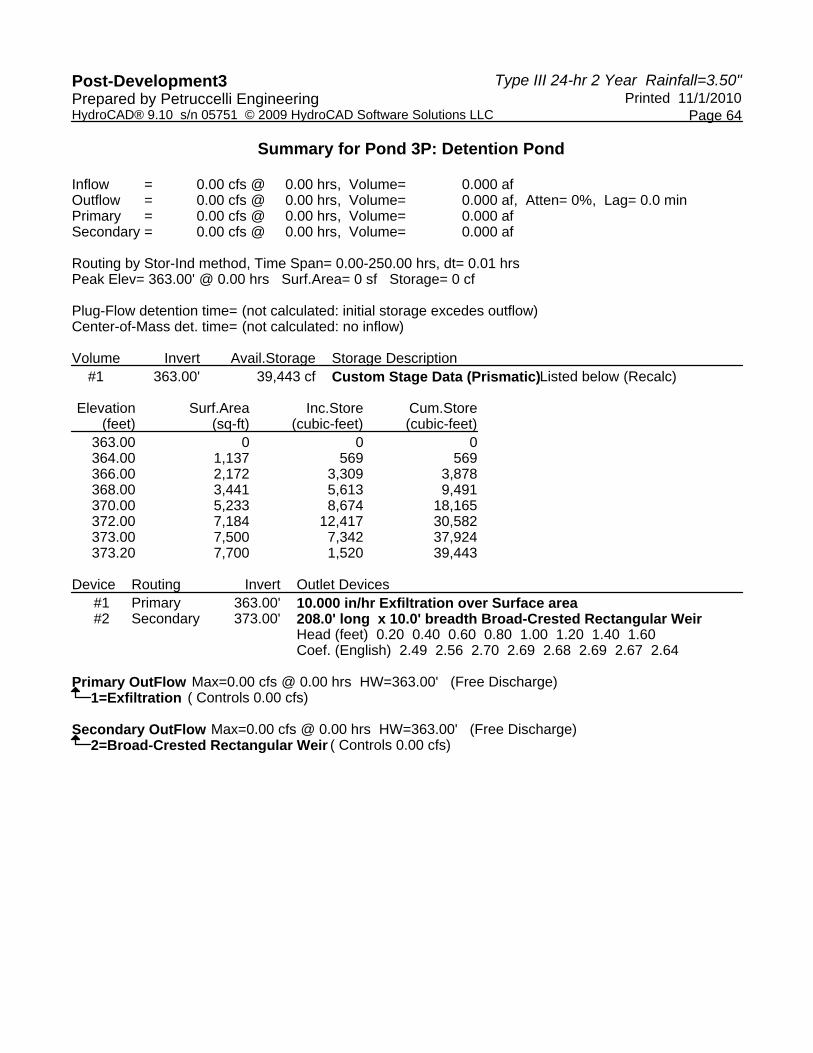
Type III 24-hr 2 Year Rainfall=3.50"Post-Development3 Printed 11/1/2010Prepared by Petruccelli Engineering
Page 64HydroCAD® 9.10 s/n 05751 © 2009 HydroCAD Software Solutions LLC
Summary for Pond 3P: Detention Pond
Inflow = 0.00 cfs @ 0.00 hrs, Volume= 0.000 afOutflow = 0.00 cfs @ 0.00 hrs, Volume= 0.000 af, Atten= 0%, Lag= 0.0 minPrimary = 0.00 cfs @ 0.00 hrs, Volume= 0.000 afSecondary = 0.00 cfs @ 0.00 hrs, Volume= 0.000 af
Routing by Stor-Ind method, Time Span= 0.00-250.00 hrs, dt= 0.01 hrsPeak Elev= 363.00' @ 0.00 hrs Surf.Area= 0 sf Storage= 0 cf
Plug-Flow detention time= (not calculated: initial storage excedes outflow)Center-of-Mass det. time= (not calculated: no inflow)
Volume Invert Avail.Storage Storage Description#1 363.00' 39,443 cf Custom Stage Data (Prismatic) Listed below (Recalc)
Elevation Surf.Area Inc.Store Cum.Store(feet) (sq-ft) (cubic-feet) (cubic-feet)
363.00 0 0 0364.00 1,137 569 569366.00 2,172 3,309 3,878368.00 3,441 5,613 9,491370.00 5,233 8,674 18,165372.00 7,184 12,417 30,582373.00 7,500 7,342 37,924373.20 7,700 1,520 39,443
Device Routing Invert Outlet Devices#1 Primary 363.00' 10.000 in/hr Exfiltration over Surface area #2 Secondary 373.00' 208.0' long x 10.0' breadth Broad-Crested Rectangular Weir
Head (feet) 0.20 0.40 0.60 0.80 1.00 1.20 1.40 1.60 Coef. (English) 2.49 2.56 2.70 2.69 2.68 2.69 2.67 2.64
Primary OutFlow Max=0.00 cfs @ 0.00 hrs HW=363.00' (Free Discharge)1=Exfiltration ( Controls 0.00 cfs)
Secondary OutFlow Max=0.00 cfs @ 0.00 hrs HW=363.00' (Free Discharge)2=Broad-Crested Rectangular Weir ( Controls 0.00 cfs)

Type III 24-hr 2 Year Rainfall=3.50"Post-Development3 Printed 11/1/2010Prepared by Petruccelli Engineering
Page 65HydroCAD® 9.10 s/n 05751 © 2009 HydroCAD Software Solutions LLC
Pond 3P: Detention Pond
InflowOutflowPrimarySecondary
Hydrograph
Time (hours)2502402302202102001901801701601501401301201101009080706050403020100
Flow
(cf
s)
1
0
Peak Elev=363.00'Storage=0 cf
0.00 cfs0.00 cfs
0.00 cfs0.00 cfs
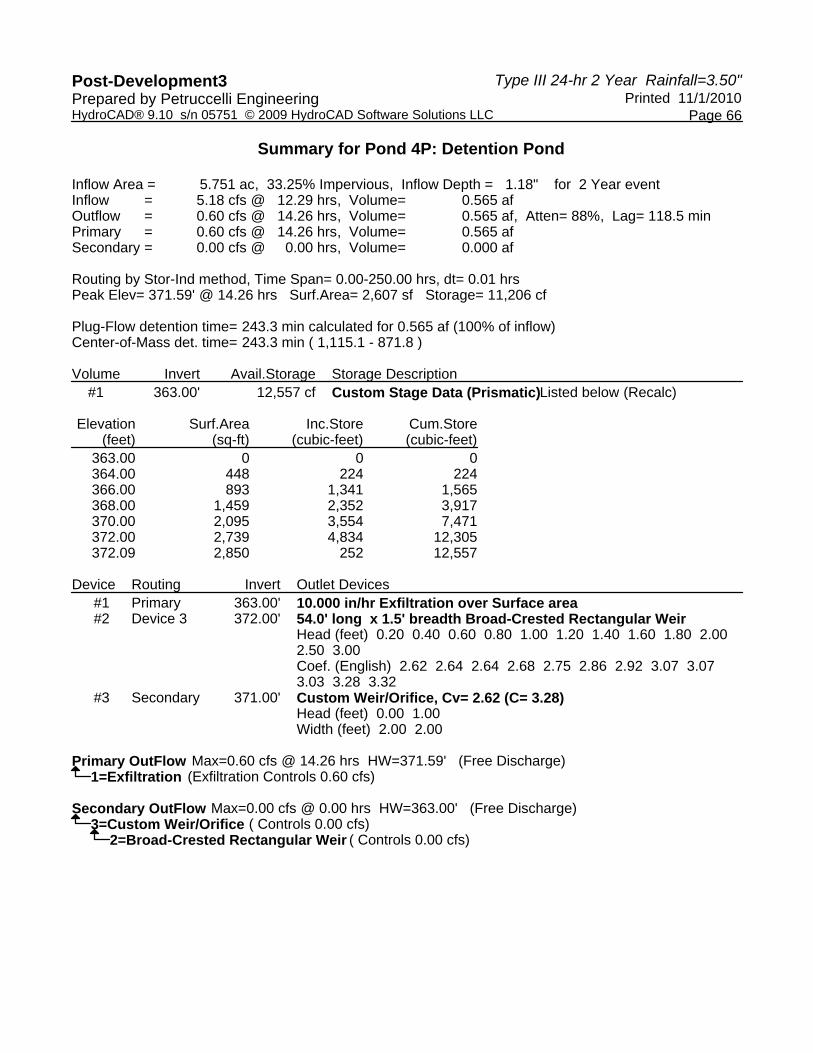
Type III 24-hr 2 Year Rainfall=3.50"Post-Development3 Printed 11/1/2010Prepared by Petruccelli Engineering
Page 66HydroCAD® 9.10 s/n 05751 © 2009 HydroCAD Software Solutions LLC
Summary for Pond 4P: Detention Pond
Inflow Area = 5.751 ac, 33.25% Impervious, Inflow Depth = 1.18" for 2 Year eventInflow = 5.18 cfs @ 12.29 hrs, Volume= 0.565 afOutflow = 0.60 cfs @ 14.26 hrs, Volume= 0.565 af, Atten= 88%, Lag= 118.5 minPrimary = 0.60 cfs @ 14.26 hrs, Volume= 0.565 afSecondary = 0.00 cfs @ 0.00 hrs, Volume= 0.000 af
Routing by Stor-Ind method, Time Span= 0.00-250.00 hrs, dt= 0.01 hrsPeak Elev= 371.59' @ 14.26 hrs Surf.Area= 2,607 sf Storage= 11,206 cf
Plug-Flow detention time= 243.3 min calculated for 0.565 af (100% of inflow)Center-of-Mass det. time= 243.3 min ( 1,115.1 - 871.8 )
Volume Invert Avail.Storage Storage Description#1 363.00' 12,557 cf Custom Stage Data (Prismatic) Listed below (Recalc)
Elevation Surf.Area Inc.Store Cum.Store(feet) (sq-ft) (cubic-feet) (cubic-feet)
363.00 0 0 0364.00 448 224 224366.00 893 1,341 1,565368.00 1,459 2,352 3,917370.00 2,095 3,554 7,471372.00 2,739 4,834 12,305372.09 2,850 252 12,557
Device Routing Invert Outlet Devices#1 Primary 363.00' 10.000 in/hr Exfiltration over Surface area #2 Device 3 372.00' 54.0' long x 1.5' breadth Broad-Crested Rectangular Weir
Head (feet) 0.20 0.40 0.60 0.80 1.00 1.20 1.40 1.60 1.80 2.00 2.50 3.00 Coef. (English) 2.62 2.64 2.64 2.68 2.75 2.86 2.92 3.07 3.07 3.03 3.28 3.32
#3 Secondary 371.00' Custom Weir/Orifice, Cv= 2.62 (C= 3.28) Head (feet) 0.00 1.00 Width (feet) 2.00 2.00
Primary OutFlow Max=0.60 cfs @ 14.26 hrs HW=371.59' (Free Discharge)1=Exfiltration (Exfiltration Controls 0.60 cfs)
Secondary OutFlow Max=0.00 cfs @ 0.00 hrs HW=363.00' (Free Discharge)3=Custom Weir/Orifice ( Controls 0.00 cfs)
2=Broad-Crested Rectangular Weir ( Controls 0.00 cfs)

Type III 24-hr 2 Year Rainfall=3.50"Post-Development3 Printed 11/1/2010Prepared by Petruccelli Engineering
Page 67HydroCAD® 9.10 s/n 05751 © 2009 HydroCAD Software Solutions LLC
Pond 4P: Detention Pond
InflowOutflowPrimarySecondary
Hydrograph
Time (hours)2502402302202102001901801701601501401301201101009080706050403020100
Flow
(cf
s)
5
4
3
2
1
0
Inflow Area=5.751 acPeak Elev=371.59'Storage=11,206 cf
5.18 cfs
0.60 cfs0.60 cfs
0.00 cfs

Type III 24-hr 2 Year Rainfall=3.50"Post-Development3 Printed 11/1/2010Prepared by Petruccelli Engineering
Page 68HydroCAD® 9.10 s/n 05751 © 2009 HydroCAD Software Solutions LLC
Summary for Pond 6P: Drywells
Inflow Area = 0.231 ac,100.00% Impervious, Inflow Depth = 3.27" for 2 Year eventInflow = 0.45 cfs @ 12.39 hrs, Volume= 0.063 afOutflow = 0.19 cfs @ 12.86 hrs, Volume= 0.063 af, Atten= 58%, Lag= 28.4 minPrimary = 0.19 cfs @ 12.86 hrs, Volume= 0.063 afSecondary = 0.00 cfs @ 0.00 hrs, Volume= 0.000 af
Routing by Stor-Ind method, Time Span= 0.00-250.00 hrs, dt= 0.01 hrsPeak Elev= 387.01' @ 12.86 hrs Surf.Area= 1,218 sf Storage= 496 cf
Plug-Flow detention time= 15.7 min calculated for 0.063 af (100% of inflow)Center-of-Mass det. time= 15.7 min ( 792.4 - 776.7 )
Volume Invert Avail.Storage Storage Description#1A 386.00' 1,291 cf 27.68'W x 44.00'L x 4.83'H Field A
5,883 cf Overall - 2,655 cf Embedded = 3,227 cf x 40.0% Voids#2A 387.00' 2,058 cf Dry_Well 1000 Gallon x 16 Inside #1
Inside= 62.0"W x 30.0"H => 12.86 sf x 10.00'L = 128.6 cfOutside= 68.0"W x 34.0"H => 15.81 sf x 10.50'L = 166.0 cf
3,349 cf Total Available Storage
Storage Group A created with Chamber Wizard
Device Routing Invert Outlet Devices#1 Primary 386.00' 6.000 in/hr Exfiltration over Wetted area #2 Secondary 393.00' 24.0" Vert. Orifice/Grate C= 0.600
Primary OutFlow Max=0.19 cfs @ 12.86 hrs HW=387.01' (Free Discharge)1=Exfiltration (Exfiltration Controls 0.19 cfs)
Secondary OutFlow Max=0.00 cfs @ 0.00 hrs HW=386.00' (Free Discharge)2=Orifice/Grate ( Controls 0.00 cfs)

Type III 24-hr 2 Year Rainfall=3.50"Post-Development3 Printed 11/1/2010Prepared by Petruccelli Engineering
Page 69HydroCAD® 9.10 s/n 05751 © 2009 HydroCAD Software Solutions LLC
Pond 6P: Drywells - Chamber Wizard Field A
Chamber Model = Dry_Well 1000 GallonInside= 62.0"W x 30.0"H => 12.86 sf x 10.00'L = 128.6 cfOutside= 68.0"W x 34.0"H => 15.81 sf x 10.50'L = 166.0 cf
68.0" Wide + 12.0" Spacing = 80.0" C-C
4 Chambers/Row x 10.50' Long = 42.00' + 12.0" End Stone x 2 = 44.00' Base Length4 Rows x 68.0" Wide + 12.0" Spacing x 3 + 12.0" Side Stone x 2 = 27.68' Base Width12.0" Base + 34.0" Chamber Height + 12.0" Cover = 4.83' Field Height
16 Chambers x 128.6 cf = 2,058.4 cf Chamber Storage16 Chambers x 166.0 cf = 2,655.4 cf Displacement
5,882.6 cf Field - 2,655.4 cf Chambers = 3,227.2 cf Stone x 40.0% Voids = 1,290.9 cf Stone Storage
Stone + Chamber Storage = 3,349.3 cf = 0.077 af
16 Chambers217.9 cy Field119.5 cy Stone

Type III 24-hr 2 Year Rainfall=3.50"Post-Development3 Printed 11/1/2010Prepared by Petruccelli Engineering
Page 70HydroCAD® 9.10 s/n 05751 © 2009 HydroCAD Software Solutions LLC
Pond 6P: Drywells
InflowOutflowPrimarySecondary
Hydrograph
Time (hours)2502402302202102001901801701601501401301201101009080706050403020100
Flow
(cf
s)
0.5
0.45
0.4
0.35
0.3
0.25
0.2
0.15
0.1
0.05
0
Inflow Area=0.231 acPeak Elev=387.01'
Storage=496 cf
0.45 cfs
0.19 cfs0.19 cfs
0.00 cfs

Type III 24-hr 2 Year Rainfall=3.50"Post-Development3 Printed 11/1/2010Prepared by Petruccelli Engineering
Page 71HydroCAD® 9.10 s/n 05751 © 2009 HydroCAD Software Solutions LLC
Summary for Pond 7P: Stormwater Treatment Pond #2
Inflow Area = 2.937 ac, 37.76% Impervious, Inflow Depth = 1.18" for 2 Year eventInflow = 2.11 cfs @ 12.49 hrs, Volume= 0.289 afOutflow = 2.10 cfs @ 12.53 hrs, Volume= 0.289 af, Atten= 1%, Lag= 2.1 minPrimary = 0.17 cfs @ 12.53 hrs, Volume= 0.144 afSecondary = 1.93 cfs @ 12.53 hrs, Volume= 0.144 afTertiary = 0.00 cfs @ 0.00 hrs, Volume= 0.000 af
Routing by Stor-Ind method, Time Span= 0.00-250.00 hrs, dt= 0.01 hrsPeak Elev= 363.94' @ 12.53 hrs Surf.Area= 750 sf Storage= 1,219 cf
Plug-Flow detention time= 44.4 min calculated for 0.289 af (100% of inflow)Center-of-Mass det. time= 44.4 min ( 929.0 - 884.5 )
Volume Invert Avail.Storage Storage Description#1 361.00' 2,605 cf Custom Stage Data (Prismatic) Listed below (Recalc)
Elevation Surf.Area Inc.Store Cum.Store(feet) (sq-ft) (cubic-feet) (cubic-feet)
361.00 100 0 0362.00 300 200 200364.00 763 1,063 1,263365.00 1,132 948 2,211365.30 1,500 395 2,605
Device Routing Invert Outlet Devices#1 Primary 361.00' 10.000 in/hr Exfiltration over Surface area #2 Secondary 363.50' Custom Weir/Orifice, Cv= 2.62 (C= 3.28)
Head (feet) 0.00 1.50 Width (feet) 2.00 2.00
#3 Tertiary 365.10' 93.0' long x 3.0' breadth Broad-Crested Rectangular Weir Head (feet) 0.20 0.40 0.60 0.80 1.00 1.20 1.40 1.60 1.80 2.00 2.50 3.00 3.50 4.00 4.50 Coef. (English) 2.44 2.58 2.68 2.67 2.65 2.64 2.64 2.68 2.68 2.72 2.81 2.92 2.97 3.07 3.32
Primary OutFlow Max=0.17 cfs @ 12.53 hrs HW=363.94' (Free Discharge)1=Exfiltration (Exfiltration Controls 0.17 cfs)
Secondary OutFlow Max=1.92 cfs @ 12.53 hrs HW=363.94' (Free Discharge)2=Custom Weir/Orifice (Weir Controls 1.92 cfs @ 2.18 fps)
Tertiary OutFlow Max=0.00 cfs @ 0.00 hrs HW=361.00' (Free Discharge)3=Broad-Crested Rectangular Weir ( Controls 0.00 cfs)
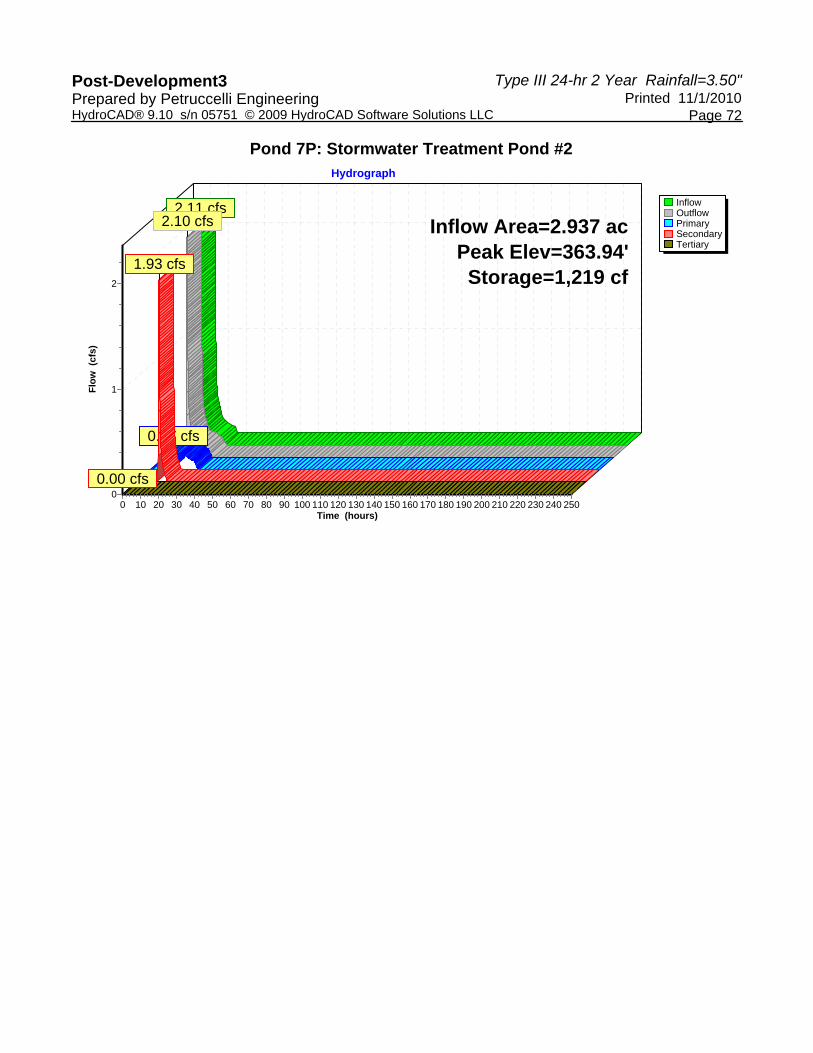
Type III 24-hr 2 Year Rainfall=3.50"Post-Development3 Printed 11/1/2010Prepared by Petruccelli Engineering
Page 72HydroCAD® 9.10 s/n 05751 © 2009 HydroCAD Software Solutions LLC
Pond 7P: Stormwater Treatment Pond #2
InflowOutflowPrimarySecondaryTertiary
Hydrograph
Time (hours)2502402302202102001901801701601501401301201101009080706050403020100
Flow
(cf
s)
2
1
0
Inflow Area=2.937 acPeak Elev=363.94'Storage=1,219 cf
2.11 cfs2.10 cfs
0.17 cfs
1.93 cfs
0.00 cfs

Type III 24-hr 2 Year Rainfall=3.50"Post-Development3 Printed 11/1/2010Prepared by Petruccelli Engineering
Page 73HydroCAD® 9.10 s/n 05751 © 2009 HydroCAD Software Solutions LLC
Summary for Pond 8P: Stormwater Treatment Pond #1
Inflow = 1.93 cfs @ 12.53 hrs, Volume= 0.144 afOutflow = 1.55 cfs @ 12.73 hrs, Volume= 0.144 af, Atten= 20%, Lag= 12.2 minPrimary = 0.27 cfs @ 12.73 hrs, Volume= 0.054 afSecondary = 1.28 cfs @ 12.73 hrs, Volume= 0.090 af
Routing by Stor-Ind method, Time Span= 0.00-250.00 hrs, dt= 0.01 hrsPeak Elev= 362.66' @ 12.73 hrs Surf.Area= 1,150 sf Storage= 1,231 cf
Plug-Flow detention time= 16.2 min calculated for 0.144 af (100% of inflow)Center-of-Mass det. time= 16.2 min ( 807.9 - 791.7 )
Volume Invert Avail.Storage Storage Description#1 361.00' 5,867 cf Custom Stage Data (Prismatic) Listed below (Recalc)
Elevation Surf.Area Inc.Store Cum.Store(feet) (sq-ft) (cubic-feet) (cubic-feet)
361.00 300 0 0362.00 842 571 571364.00 1,772 2,614 3,185365.00 2,163 1,968 5,153365.30 2,600 714 5,867
Device Routing Invert Outlet Devices#1 Secondary 361.00' 24.0" Round Culvert
L= 200.0' CMP, end-section conforming to fill, Ke= 0.500 Inlet / Outlet Invert= 361.00' / 330.00' S= 0.1550 '/' Cc= 0.900 n= 0.013 Corrugated PE, smooth interior
#2 Device 1 361.10' 2.0" Vert. Orifice/Grate (0 yr) C= 0.600 #3 Device 1 361.70' 6.0" Vert. Orifice/Grate (1yr) C= 0.600 #4 Device 1 362.30' 7.0" Vert. Orifice/Grate(2yr) C= 0.600 #5 Device 1 363.40' 9.0" Vert. Orifice/Grate(10yr) C= 0.600 #6 Device 1 364.70' 57.0" x 57.0" Horiz. Top of Riser (100yr) C= 0.600
Limited to weir flow at low heads #7 Device 1 365.00' 14.5' long x 2.0' breadth Broad-Crested Rectangular Weir (14.5)
Head (feet) 0.20 0.40 0.60 0.80 1.00 1.20 1.40 1.60 1.80 2.00 2.50 3.00 3.50 Coef. (English) 2.54 2.61 2.61 2.60 2.66 2.70 2.77 2.89 2.88 2.85 3.07 3.20 3.32
#8 Device 1 365.20' 100.0' long x 3.0' breadth Broad-Crested Rectangular Weir Head (feet) 0.20 0.40 0.60 0.80 1.00 1.20 1.40 1.60 1.80 2.00 2.50 3.00 3.50 4.00 4.50 Coef. (English) 2.44 2.58 2.68 2.67 2.65 2.64 2.64 2.68 2.68 2.72 2.81 2.92 2.97 3.07 3.32
#9 Primary 361.00' 10.000 in/hr Exfiltration over Surface area

Type III 24-hr 2 Year Rainfall=3.50"Post-Development3 Printed 11/1/2010Prepared by Petruccelli Engineering
Page 74HydroCAD® 9.10 s/n 05751 © 2009 HydroCAD Software Solutions LLC
Primary OutFlow Max=0.27 cfs @ 12.73 hrs HW=362.66' (Free Discharge)9=Exfiltration (Exfiltration Controls 0.27 cfs)
Secondary OutFlow Max=1.28 cfs @ 12.73 hrs HW=362.66' (Free Discharge)1=Culvert (Passes 1.28 cfs of 12.25 cfs potential flow)
2=Orifice/Grate (0 yr) (Orifice Controls 0.13 cfs @ 5.86 fps)3=Orifice/Grate (1yr) (Orifice Controls 0.80 cfs @ 4.06 fps)4=Orifice/Grate(2yr) (Orifice Controls 0.36 cfs @ 2.05 fps)5=Orifice/Grate(10yr) ( Controls 0.00 cfs)6=Top of Riser (100yr) ( Controls 0.00 cfs)7=Broad-Crested Rectangular Weir (14.5) ( Controls 0.00 cfs)8=Broad-Crested Rectangular Weir ( Controls 0.00 cfs)
Pond 8P: Stormwater Treatment Pond #1
InflowOutflowPrimarySecondary
Hydrograph
Time (hours)2502402302202102001901801701601501401301201101009080706050403020100
Flow
(cf
s)
2
1
0
Peak Elev=362.66'Storage=1,231 cf
1.93 cfs
1.55 cfs
0.27 cfs
1.28 cfs

Type III 24-hr 2 Year Rainfall=3.50"Post-Development3 Printed 11/1/2010Prepared by Petruccelli Engineering
Page 75HydroCAD® 9.10 s/n 05751 © 2009 HydroCAD Software Solutions LLC
Summary for Pond 9P: Drywells
Inflow Area = 0.459 ac,100.00% Impervious, Inflow Depth = 3.27" for 2 Year eventInflow = 1.09 cfs @ 12.25 hrs, Volume= 0.125 afOutflow = 0.25 cfs @ 11.86 hrs, Volume= 0.125 af, Atten= 77%, Lag= 0.0 minPrimary = 0.25 cfs @ 11.86 hrs, Volume= 0.125 afSecondary = 0.00 cfs @ 0.00 hrs, Volume= 0.000 af
Routing by Stor-Ind method, Time Span= 0.00-250.00 hrs, dt= 0.01 hrsPeak Elev= 387.44' @ 12.81 hrs Surf.Area= 1,834 sf Storage= 1,403 cf
Plug-Flow detention time= 32.1 min calculated for 0.125 af (100% of inflow)Center-of-Mass det. time= 32.1 min ( 798.8 - 766.7 )
Volume Invert Avail.Storage Storage Description#1A 386.00' 1,685 cf 41.69'W x 44.00'L x 4.83'H Field A
8,860 cf Overall - 4,647 cf Embedded = 4,213 cf x 40.0% Voids#2A 387.00' 3,602 cf Dry_Well 1000 Gallon x 28 Inside #1
Inside= 62.0"W x 30.0"H => 12.86 sf x 10.00'L = 128.6 cfOutside= 68.0"W x 34.0"H => 15.81 sf x 10.50'L = 166.0 cf
5,287 cf Total Available Storage
Storage Group A created with Chamber Wizard
Device Routing Invert Outlet Devices#1 Primary 386.00' 6.000 in/hr Exfiltration over Surface area #2 Secondary 392.00' 24.0" Vert. Orifice/Grate C= 0.600
Primary OutFlow Max=0.25 cfs @ 11.86 hrs HW=386.08' (Free Discharge)1=Exfiltration (Exfiltration Controls 0.25 cfs)
Secondary OutFlow Max=0.00 cfs @ 0.00 hrs HW=386.00' (Free Discharge)2=Orifice/Grate ( Controls 0.00 cfs)

Type III 24-hr 2 Year Rainfall=3.50"Post-Development3 Printed 11/1/2010Prepared by Petruccelli Engineering
Page 76HydroCAD® 9.10 s/n 05751 © 2009 HydroCAD Software Solutions LLC
Pond 9P: Drywells - Chamber Wizard Field A
Chamber Model = Dry_Well 1000 GallonInside= 62.0"W x 30.0"H => 12.86 sf x 10.00'L = 128.6 cfOutside= 68.0"W x 34.0"H => 15.81 sf x 10.50'L = 166.0 cf
68.0" Wide + 0.0" Spacing = 68.0" C-C
4 Chambers/Row x 10.50' Long = 42.00' + 12.0" End Stone x 2 = 44.00' Base Length7 Rows x 68.0" Wide + 12.0" Side Stone x 2 = 41.69' Base Width12.0" Base + 34.0" Chamber Height + 12.0" Cover = 4.83' Field Height
28 Chambers x 128.6 cf = 3,602.2 cf Chamber Storage28 Chambers x 166.0 cf = 4,646.9 cf Displacement
8,860.0 cf Field - 4,646.9 cf Chambers = 4,213.1 cf Stone x 40.0% Voids = 1,685.2 cf Stone Storage
Stone + Chamber Storage = 5,287.4 cf = 0.121 af
28 Chambers328.1 cy Field156.0 cy Stone

Type III 24-hr 2 Year Rainfall=3.50"Post-Development3 Printed 11/1/2010Prepared by Petruccelli Engineering
Page 77HydroCAD® 9.10 s/n 05751 © 2009 HydroCAD Software Solutions LLC
Pond 9P: Drywells
InflowOutflowPrimarySecondary
Hydrograph
Time (hours)2502402302202102001901801701601501401301201101009080706050403020100
Flow
(cf
s)
1
0
Inflow Area=0.459 acPeak Elev=387.44'
Storage=1,403 cf
1.09 cfs
0.25 cfs0.25 cfs
0.00 cfs

Type III 24-hr 2 Year Rainfall=3.50"Post-Development3 Printed 11/1/2010Prepared by Petruccelli Engineering
Page 78HydroCAD® 9.10 s/n 05751 © 2009 HydroCAD Software Solutions LLC
Summary for Link DP-1: Design Point 1
Inflow Area = 13.292 ac, 3.27% Impervious, Inflow Depth = 0.53" for 2 Year eventInflow = 3.27 cfs @ 12.58 hrs, Volume= 0.589 afPrimary = 3.27 cfs @ 12.58 hrs, Volume= 0.589 af, Atten= 0%, Lag= 0.0 min
Primary outflow = Inflow, Time Span= 0.00-250.00 hrs, dt= 0.01 hrs
Link DP-1: Design Point 1
InflowPrimary
Hydrograph
Time (hours)2502402302202102001901801701601501401301201101009080706050403020100
Flow
(cf
s)
3
2
1
0
Inflow Area=13.292 ac3.27 cfs
3.27 cfs

Type III 24-hr 2 Year Rainfall=3.50"Post-Development3 Printed 11/1/2010Prepared by Petruccelli Engineering
Page 79HydroCAD® 9.10 s/n 05751 © 2009 HydroCAD Software Solutions LLC
Summary for Link DP-2: Design Point 2
Inflow Area = 1.273 ac, 7.29% Impervious, Inflow Depth = 0.66" for 2 Year eventInflow = 0.50 cfs @ 12.38 hrs, Volume= 0.070 afPrimary = 0.50 cfs @ 12.38 hrs, Volume= 0.070 af, Atten= 0%, Lag= 0.0 min
Primary outflow = Inflow, Time Span= 0.00-250.00 hrs, dt= 0.01 hrs
Link DP-2: Design Point 2
InflowPrimary
Hydrograph
Time (hours)2502402302202102001901801701601501401301201101009080706050403020100
Flow
(cf
s)
0.55
0.5
0.45
0.4
0.35
0.3
0.25
0.2
0.15
0.1
0.05
0
Inflow Area=1.273 ac0.50 cfs
0.50 cfs

Type III 24-hr 2 Year Rainfall=3.50"Post-Development3 Printed 11/1/2010Prepared by Petruccelli Engineering
Page 80HydroCAD® 9.10 s/n 05751 © 2009 HydroCAD Software Solutions LLC
Summary for Link DP-3: Design Point 3
Inflow Area = 2.653 ac, 7.97% Impervious, Inflow Depth = 0.66" for 2 Year eventInflow = 0.94 cfs @ 12.49 hrs, Volume= 0.146 afPrimary = 0.94 cfs @ 12.49 hrs, Volume= 0.146 af, Atten= 0%, Lag= 0.0 min
Primary outflow = Inflow, Time Span= 0.00-250.00 hrs, dt= 0.01 hrs
Link DP-3: Design Point 3
InflowPrimary
Hydrograph
Time (hours)2502402302202102001901801701601501401301201101009080706050403020100
Flow
(cf
s)
1
0
Inflow Area=2.653 ac0.94 cfs
0.94 cfs

Type III 24-hr 2 Year Rainfall=3.50"Post-Development3 Printed 11/1/2010Prepared by Petruccelli Engineering
Page 81HydroCAD® 9.10 s/n 05751 © 2009 HydroCAD Software Solutions LLC
Summary for Link DP-4: Design Point 4
Inflow Area = 2.888 ac, 0.56% Impervious, Inflow Depth = 0.38" for 2 Year eventInflow = 0.40 cfs @ 12.66 hrs, Volume= 0.091 afPrimary = 0.40 cfs @ 12.66 hrs, Volume= 0.091 af, Atten= 0%, Lag= 0.0 min
Primary outflow = Inflow, Time Span= 0.00-250.00 hrs, dt= 0.01 hrs
Link DP-4: Design Point 4
InflowPrimary
Hydrograph
Time (hours)2502402302202102001901801701601501401301201101009080706050403020100
Flow
(cf
s)
0.440.42
0.40.380.360.340.32
0.30.280.260.240.22
0.20.180.160.140.12
0.10.080.060.040.02
0
Inflow Area=2.888 ac0.40 cfs
0.40 cfs

Type III 24-hr 2 Year Rainfall=3.50"Post-Development3 Printed 11/1/2010Prepared by Petruccelli Engineering
Page 82HydroCAD® 9.10 s/n 05751 © 2009 HydroCAD Software Solutions LLC
Summary for Link DP-5: Design Point 5
Inflow Area = 2.294 ac, 15.79% Impervious, Inflow Depth = 0.80" for 2 Year eventInflow = 1.45 cfs @ 12.21 hrs, Volume= 0.153 afPrimary = 1.45 cfs @ 12.21 hrs, Volume= 0.153 af, Atten= 0%, Lag= 0.0 min
Primary outflow = Inflow, Time Span= 0.00-250.00 hrs, dt= 0.01 hrs
Link DP-5: Design Point 5
InflowPrimary
Hydrograph
Time (hours)2502402302202102001901801701601501401301201101009080706050403020100
Flow
(cf
s)
1
0
Inflow Area=2.294 ac1.45 cfs
1.45 cfs

Type III 24-hr 2 Year Rainfall=3.50"Post-Development3 Printed 11/1/2010Prepared by Petruccelli Engineering
Page 83HydroCAD® 9.10 s/n 05751 © 2009 HydroCAD Software Solutions LLC
Summary for Link DP-6: Design Point 6
Inflow Area = 0.303 ac, 0.00% Impervious, Inflow Depth = 4.09" for 2 Year eventInflow = 1.35 cfs @ 12.72 hrs, Volume= 0.103 afPrimary = 1.35 cfs @ 12.72 hrs, Volume= 0.103 af, Atten= 0%, Lag= 0.0 min
Primary outflow = Inflow, Time Span= 0.00-250.00 hrs, dt= 0.01 hrs
Link DP-6: Design Point 6
InflowPrimary
Hydrograph
Time (hours)2502402302202102001901801701601501401301201101009080706050403020100
Flow
(cf
s)
1
0
Inflow Area=0.303 ac1.35 cfs
1.35 cfs

Type III 24-hr 2 Year Rainfall=3.50"Post-Development3 Printed 11/1/2010Prepared by Petruccelli Engineering
Page 84HydroCAD® 9.10 s/n 05751 © 2009 HydroCAD Software Solutions LLC
Summary for Link DP-7: Design Point 7
Inflow Area = 3.006 ac, 9.68% Impervious, Inflow Depth = 0.71" for 2 Year eventInflow = 1.57 cfs @ 12.22 hrs, Volume= 0.177 afPrimary = 1.57 cfs @ 12.22 hrs, Volume= 0.177 af, Atten= 0%, Lag= 0.0 min
Primary outflow = Inflow, Time Span= 0.00-250.00 hrs, dt= 0.01 hrs
Link DP-7: Design Point 7
InflowPrimary
Hydrograph
Time (hours)2502402302202102001901801701601501401301201101009080706050403020100
Flow
(cf
s) 1
0
Inflow Area=3.006 ac1.57 cfs
1.57 cfs
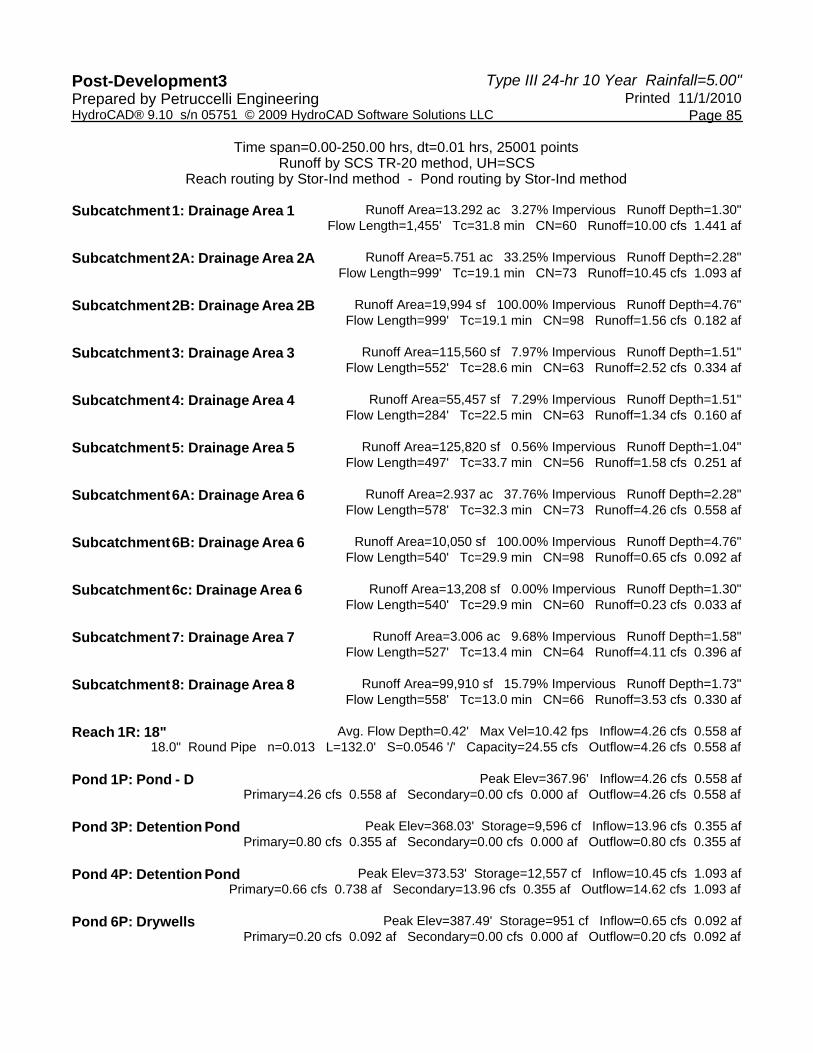
Type III 24-hr 10 Year Rainfall=5.00"Post-Development3 Printed 11/1/2010Prepared by Petruccelli Engineering
Page 85HydroCAD® 9.10 s/n 05751 © 2009 HydroCAD Software Solutions LLC
Time span=0.00-250.00 hrs, dt=0.01 hrs, 25001 pointsRunoff by SCS TR-20 method, UH=SCS
Reach routing by Stor-Ind method - Pond routing by Stor-Ind method
Runoff Area=13.292 ac 3.27% Impervious Runoff Depth=1.30"Subcatchment 1: Drainage Area 1 Flow Length=1,455' Tc=31.8 min CN=60 Runoff=10.00 cfs 1.441 af
Runoff Area=5.751 ac 33.25% Impervious Runoff Depth=2.28"Subcatchment 2A: Drainage Area 2A Flow Length=999' Tc=19.1 min CN=73 Runoff=10.45 cfs 1.093 af
Runoff Area=19,994 sf 100.00% Impervious Runoff Depth=4.76"Subcatchment 2B: Drainage Area 2B Flow Length=999' Tc=19.1 min CN=98 Runoff=1.56 cfs 0.182 af
Runoff Area=115,560 sf 7.97% Impervious Runoff Depth=1.51"Subcatchment 3: Drainage Area 3 Flow Length=552' Tc=28.6 min CN=63 Runoff=2.52 cfs 0.334 af
Runoff Area=55,457 sf 7.29% Impervious Runoff Depth=1.51"Subcatchment 4: Drainage Area 4 Flow Length=284' Tc=22.5 min CN=63 Runoff=1.34 cfs 0.160 af
Runoff Area=125,820 sf 0.56% Impervious Runoff Depth=1.04"Subcatchment 5: Drainage Area 5 Flow Length=497' Tc=33.7 min CN=56 Runoff=1.58 cfs 0.251 af
Runoff Area=2.937 ac 37.76% Impervious Runoff Depth=2.28"Subcatchment 6A: Drainage Area 6 Flow Length=578' Tc=32.3 min CN=73 Runoff=4.26 cfs 0.558 af
Runoff Area=10,050 sf 100.00% Impervious Runoff Depth=4.76"Subcatchment 6B: Drainage Area 6 Flow Length=540' Tc=29.9 min CN=98 Runoff=0.65 cfs 0.092 af
Runoff Area=13,208 sf 0.00% Impervious Runoff Depth=1.30"Subcatchment 6c: Drainage Area 6 Flow Length=540' Tc=29.9 min CN=60 Runoff=0.23 cfs 0.033 af
Runoff Area=3.006 ac 9.68% Impervious Runoff Depth=1.58"Subcatchment 7: Drainage Area 7 Flow Length=527' Tc=13.4 min CN=64 Runoff=4.11 cfs 0.396 af
Runoff Area=99,910 sf 15.79% Impervious Runoff Depth=1.73"Subcatchment 8: Drainage Area 8 Flow Length=558' Tc=13.0 min CN=66 Runoff=3.53 cfs 0.330 af
Avg. Flow Depth=0.42' Max Vel=10.42 fps Inflow=4.26 cfs 0.558 afReach 1R: 18"18.0" Round Pipe n=0.013 L=132.0' S=0.0546 '/' Capacity=24.55 cfs Outflow=4.26 cfs 0.558 af
Peak Elev=367.96' Inflow=4.26 cfs 0.558 afPond 1P: Pond - D Primary=4.26 cfs 0.558 af Secondary=0.00 cfs 0.000 af Outflow=4.26 cfs 0.558 af
Peak Elev=368.03' Storage=9,596 cf Inflow=13.96 cfs 0.355 afPond 3P: Detention Pond Primary=0.80 cfs 0.355 af Secondary=0.00 cfs 0.000 af Outflow=0.80 cfs 0.355 af
Peak Elev=373.53' Storage=12,557 cf Inflow=10.45 cfs 1.093 afPond 4P: Detention Pond Primary=0.66 cfs 0.738 af Secondary=13.96 cfs 0.355 af Outflow=14.62 cfs 1.093 af
Peak Elev=387.49' Storage=951 cf Inflow=0.65 cfs 0.092 afPond 6P: Drywells Primary=0.20 cfs 0.092 af Secondary=0.00 cfs 0.000 af Outflow=0.20 cfs 0.092 af

Type III 24-hr 10 Year Rainfall=5.00"Post-Development3 Printed 11/1/2010Prepared by Petruccelli Engineering
Page 86HydroCAD® 9.10 s/n 05751 © 2009 HydroCAD Software Solutions LLC
Peak Elev=364.22' Storage=1,443 cf Inflow=4.26 cfs 0.558 afPond 7P: Stormwater Treatment Pond #2 Primary=0.20 cfs 0.185 af Secondary=4.03 cfs 0.373 af Tertiary=0.00 cfs 0.000 af Outflow=4.23 cfs 0.558 af
Peak Elev=363.67' Storage=2,623 cf Inflow=4.03 cfs 0.373 afPond 8P: Stormwater Treatment Pond #1 Primary=0.37 cfs 0.100 af Secondary=2.99 cfs 0.273 af Outflow=3.37 cfs 0.373 af
Peak Elev=388.13' Storage=2,457 cf Inflow=1.56 cfs 0.182 afPond 9P: Drywells Primary=0.25 cfs 0.182 af Secondary=0.00 cfs 0.000 af Outflow=0.25 cfs 0.182 af
Inflow=10.00 cfs 1.441 afLink DP-1: Design Point 1 Primary=10.00 cfs 1.441 af
Inflow=1.34 cfs 0.160 afLink DP-2: Design Point 2 Primary=1.34 cfs 0.160 af
Inflow=2.52 cfs 0.334 afLink DP-3: Design Point 3 Primary=2.52 cfs 0.334 af
Inflow=1.58 cfs 0.251 afLink DP-4: Design Point 4 Primary=1.58 cfs 0.251 af
Inflow=3.53 cfs 0.330 afLink DP-5: Design Point 5 Primary=3.53 cfs 0.330 af
Inflow=3.18 cfs 0.306 afLink DP-6: Design Point 6 Primary=3.18 cfs 0.306 af
Inflow=4.11 cfs 0.396 afLink DP-7: Design Point 7 Primary=4.11 cfs 0.396 af
Total Runoff Area = 35.087 ac Runoff Volume = 4.869 af Average Runoff Depth = 1.67"85.41% Pervious = 29.968 ac 14.59% Impervious = 5.119 ac

Type III 24-hr 10 Year Rainfall=5.00"Post-Development3 Printed 11/1/2010Prepared by Petruccelli Engineering
Page 87HydroCAD® 9.10 s/n 05751 © 2009 HydroCAD Software Solutions LLC
Summary for Subcatchment 1: Drainage Area 1
Runoff = 10.00 cfs @ 12.50 hrs, Volume= 1.441 af, Depth= 1.30"
Runoff by SCS TR-20 method, UH=SCS, Time Span= 0.00-250.00 hrs, dt= 0.01 hrsType III 24-hr 10 Year Rainfall=5.00"
Area (ac) CN Description2.770 69 50-75% Grass cover, Fair, HSG B0.435 98 Paved roads w/curbs & sewers9.824 55 Woods, Good, HSG B0.263 82 Dirt roads, HSG B
13.292 60 Weighted Average12.857 96.73% Pervious Area
0.435 3.27% Impervious Area
Tc Length Slope Velocity Capacity Description(min) (feet) (ft/ft) (ft/sec) (cfs)18.9 100 0.0260 0.09 Sheet Flow, 1 to 2
Grass: Bermuda n= 0.410 P2= 3.50"1.7 216 0.1830 2.14 Shallow Concentrated Flow, 2 to 3
Woodland Kv= 5.0 fps0.3 78 0.0450 4.31 Shallow Concentrated Flow, 3 to 4
Paved Kv= 20.3 fps1.2 121 0.1150 1.70 Shallow Concentrated Flow, 4 to 5
Woodland Kv= 5.0 fps5.8 679 0.0770 1.94 Shallow Concentrated Flow, 5 to 6
Short Grass Pasture Kv= 7.0 fps3.9 261 0.0500 1.12 Shallow Concentrated Flow, 6 to DP1
Woodland Kv= 5.0 fps31.8 1,455 Total

Type III 24-hr 10 Year Rainfall=5.00"Post-Development3 Printed 11/1/2010Prepared by Petruccelli Engineering
Page 88HydroCAD® 9.10 s/n 05751 © 2009 HydroCAD Software Solutions LLC
Subcatchment 1: Drainage Area 1
Runoff
Hydrograph
Time (hours)2502402302202102001901801701601501401301201101009080706050403020100
Flow
(cf
s)
11
10
9
8
7
6
5
4
3
2
1
0
Type III 24-hr 10 YearRainfall=5.00"
Runoff Area=13.292 acRunoff Volume=1.441 af
Runoff Depth=1.30"Flow Length=1,455'
Tc=31.8 minCN=60
10.00 cfs

Type III 24-hr 10 Year Rainfall=5.00"Post-Development3 Printed 11/1/2010Prepared by Petruccelli Engineering
Page 89HydroCAD® 9.10 s/n 05751 © 2009 HydroCAD Software Solutions LLC
Summary for Subcatchment 2A: Drainage Area 2A
Runoff = 10.45 cfs @ 12.27 hrs, Volume= 1.093 af, Depth= 2.28"
Runoff by SCS TR-20 method, UH=SCS, Time Span= 0.00-250.00 hrs, dt= 0.01 hrsType III 24-hr 10 Year Rainfall=5.00"
Area (ac) CN Description1.912 98 Paved roads w/curbs & sewers3.319 61 >75% Grass cover, Good, HSG B0.520 55 Woods, Good, HSG B5.751 73 Weighted Average3.839 66.75% Pervious Area1.912 33.25% Impervious Area
Tc Length Slope Velocity Capacity Description(min) (feet) (ft/ft) (ft/sec) (cfs)11.5 100 0.0900 0.15 Sheet Flow, 1 to 2
Grass: Bermuda n= 0.410 P2= 3.50"5.8 423 0.0300 1.21 Shallow Concentrated Flow, 2 to 3
Short Grass Pasture Kv= 7.0 fps0.5 74 0.0140 2.40 Shallow Concentrated Flow, 3 to 4 (Road)
Paved Kv= 20.3 fps0.1 25 0.0100 4.54 3.56 Pipe Channel, 4 to 5
12.0" Round Area= 0.8 sf Perim= 3.1' r= 0.25'n= 0.013 Corrugated PE, smooth interior
0.6 167 0.0120 4.97 3.90 Pipe Channel, 5 to 612.0" Round Area= 0.8 sf Perim= 3.1' r= 0.25'n= 0.013 Corrugated PE, smooth interior
0.4 70 0.0090 2.60 3.19 Pipe Channel, 6 to 715.0" Round Area= 1.2 sf Perim= 3.9' r= 0.31'n= 0.025 Corrugated metal
0.2 140 0.1510 12.01 21.23 Pipe Channel, 7 to 818.0" Round Area= 1.8 sf Perim= 4.7' r= 0.38'n= 0.025 Corrugated metal
19.1 999 Total
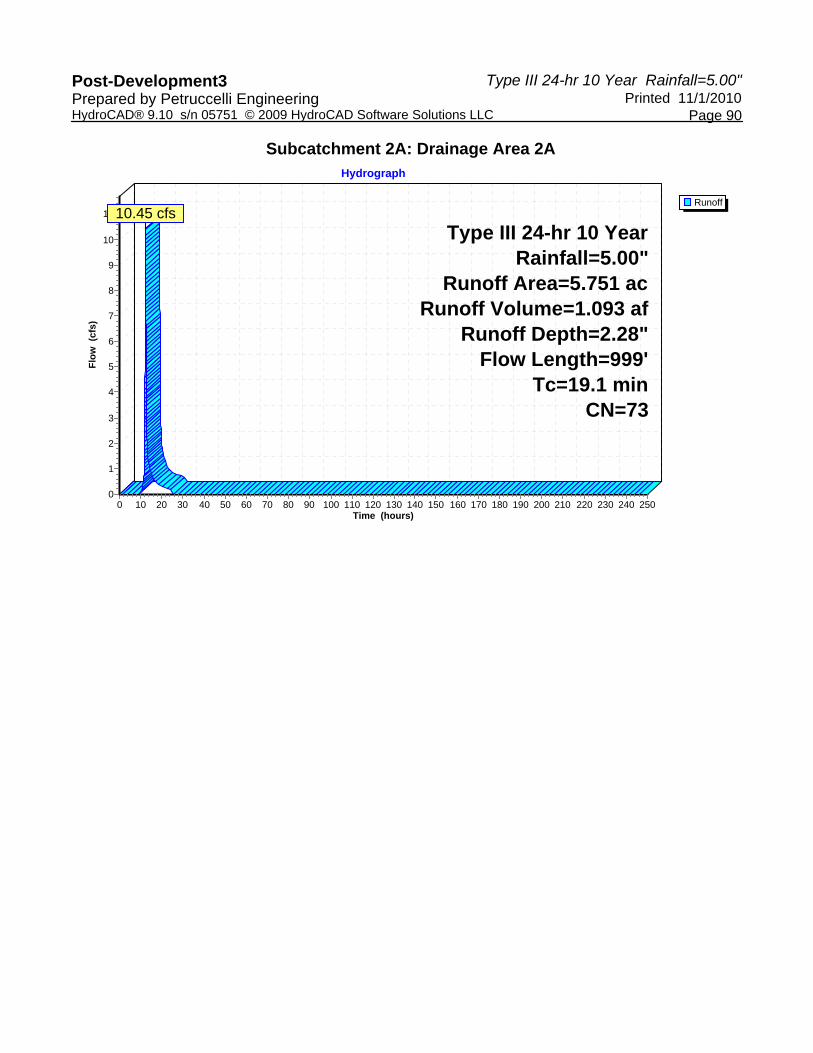
Type III 24-hr 10 Year Rainfall=5.00"Post-Development3 Printed 11/1/2010Prepared by Petruccelli Engineering
Page 90HydroCAD® 9.10 s/n 05751 © 2009 HydroCAD Software Solutions LLC
Subcatchment 2A: Drainage Area 2A
Runoff
Hydrograph
Time (hours)2502402302202102001901801701601501401301201101009080706050403020100
Flow
(cf
s)
11
10
9
8
7
6
5
4
3
2
1
0
Type III 24-hr 10 YearRainfall=5.00"
Runoff Area=5.751 acRunoff Volume=1.093 af
Runoff Depth=2.28"Flow Length=999'
Tc=19.1 minCN=73
10.45 cfs
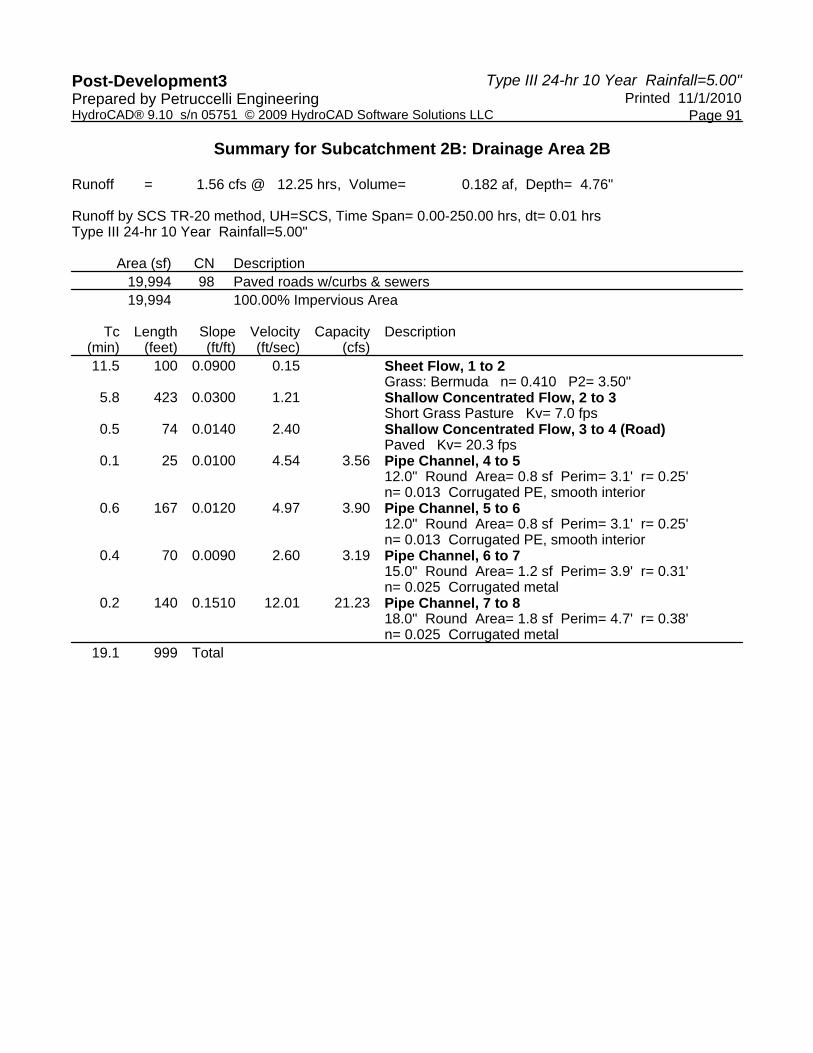
Type III 24-hr 10 Year Rainfall=5.00"Post-Development3 Printed 11/1/2010Prepared by Petruccelli Engineering
Page 91HydroCAD® 9.10 s/n 05751 © 2009 HydroCAD Software Solutions LLC
Summary for Subcatchment 2B: Drainage Area 2B
Runoff = 1.56 cfs @ 12.25 hrs, Volume= 0.182 af, Depth= 4.76"
Runoff by SCS TR-20 method, UH=SCS, Time Span= 0.00-250.00 hrs, dt= 0.01 hrsType III 24-hr 10 Year Rainfall=5.00"
Area (sf) CN Description19,994 98 Paved roads w/curbs & sewers19,994 100.00% Impervious Area
Tc Length Slope Velocity Capacity Description(min) (feet) (ft/ft) (ft/sec) (cfs)11.5 100 0.0900 0.15 Sheet Flow, 1 to 2
Grass: Bermuda n= 0.410 P2= 3.50"5.8 423 0.0300 1.21 Shallow Concentrated Flow, 2 to 3
Short Grass Pasture Kv= 7.0 fps0.5 74 0.0140 2.40 Shallow Concentrated Flow, 3 to 4 (Road)
Paved Kv= 20.3 fps0.1 25 0.0100 4.54 3.56 Pipe Channel, 4 to 5
12.0" Round Area= 0.8 sf Perim= 3.1' r= 0.25'n= 0.013 Corrugated PE, smooth interior
0.6 167 0.0120 4.97 3.90 Pipe Channel, 5 to 612.0" Round Area= 0.8 sf Perim= 3.1' r= 0.25'n= 0.013 Corrugated PE, smooth interior
0.4 70 0.0090 2.60 3.19 Pipe Channel, 6 to 715.0" Round Area= 1.2 sf Perim= 3.9' r= 0.31'n= 0.025 Corrugated metal
0.2 140 0.1510 12.01 21.23 Pipe Channel, 7 to 818.0" Round Area= 1.8 sf Perim= 4.7' r= 0.38'n= 0.025 Corrugated metal
19.1 999 Total

Type III 24-hr 10 Year Rainfall=5.00"Post-Development3 Printed 11/1/2010Prepared by Petruccelli Engineering
Page 92HydroCAD® 9.10 s/n 05751 © 2009 HydroCAD Software Solutions LLC
Subcatchment 2B: Drainage Area 2B
Runoff
Hydrograph
Time (hours)2502402302202102001901801701601501401301201101009080706050403020100
Flow
(cf
s) 1
0
Type III 24-hr 10 YearRainfall=5.00"
Runoff Area=19,994 sfRunoff Volume=0.182 af
Runoff Depth=4.76"Flow Length=999'
Tc=19.1 minCN=98
1.56 cfs
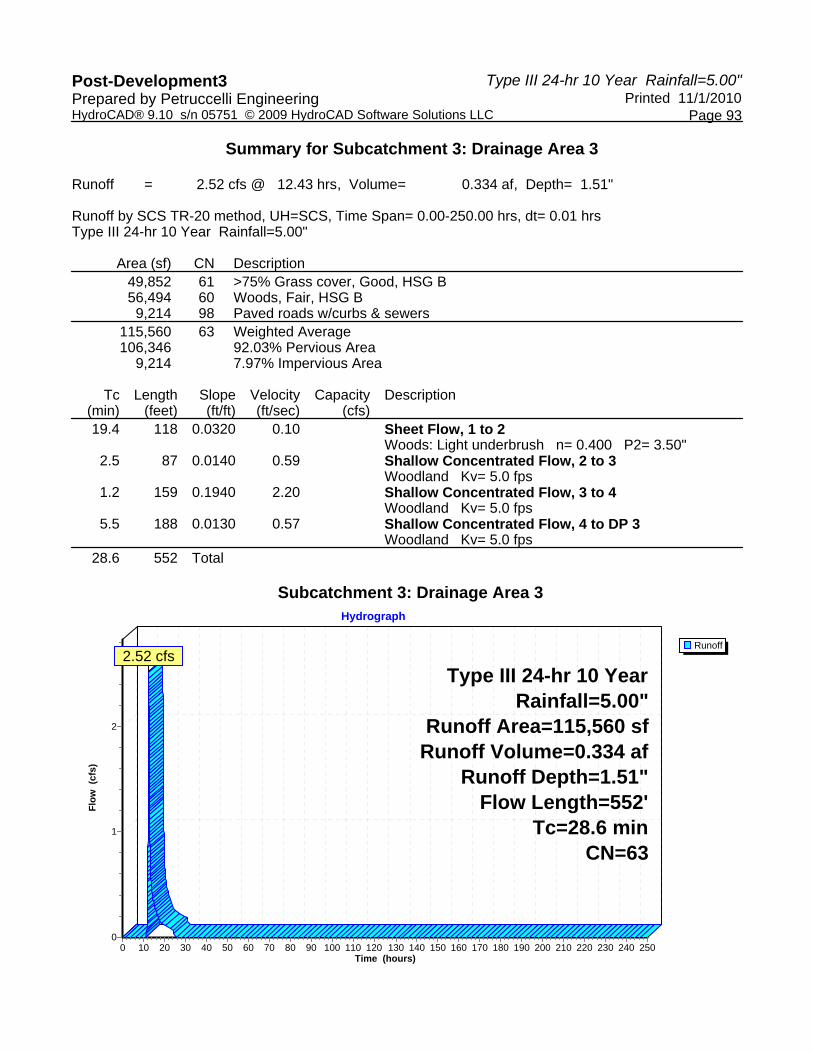
Type III 24-hr 10 Year Rainfall=5.00"Post-Development3 Printed 11/1/2010Prepared by Petruccelli Engineering
Page 93HydroCAD® 9.10 s/n 05751 © 2009 HydroCAD Software Solutions LLC
Summary for Subcatchment 3: Drainage Area 3
Runoff = 2.52 cfs @ 12.43 hrs, Volume= 0.334 af, Depth= 1.51"
Runoff by SCS TR-20 method, UH=SCS, Time Span= 0.00-250.00 hrs, dt= 0.01 hrsType III 24-hr 10 Year Rainfall=5.00"
Area (sf) CN Description49,852 61 >75% Grass cover, Good, HSG B56,494 60 Woods, Fair, HSG B
9,214 98 Paved roads w/curbs & sewers115,560 63 Weighted Average106,346 92.03% Pervious Area
9,214 7.97% Impervious Area
Tc Length Slope Velocity Capacity Description(min) (feet) (ft/ft) (ft/sec) (cfs)19.4 118 0.0320 0.10 Sheet Flow, 1 to 2
Woods: Light underbrush n= 0.400 P2= 3.50"2.5 87 0.0140 0.59 Shallow Concentrated Flow, 2 to 3
Woodland Kv= 5.0 fps1.2 159 0.1940 2.20 Shallow Concentrated Flow, 3 to 4
Woodland Kv= 5.0 fps5.5 188 0.0130 0.57 Shallow Concentrated Flow, 4 to DP 3
Woodland Kv= 5.0 fps28.6 552 Total
Subcatchment 3: Drainage Area 3
Runoff
Hydrograph
Time (hours)2502402302202102001901801701601501401301201101009080706050403020100
Flow
(cf
s)
2
1
0
Type III 24-hr 10 YearRainfall=5.00"
Runoff Area=115,560 sfRunoff Volume=0.334 af
Runoff Depth=1.51"Flow Length=552'
Tc=28.6 minCN=63
2.52 cfs

Type III 24-hr 10 Year Rainfall=5.00"Post-Development3 Printed 11/1/2010Prepared by Petruccelli Engineering
Page 94HydroCAD® 9.10 s/n 05751 © 2009 HydroCAD Software Solutions LLC
Summary for Subcatchment 4: Drainage Area 4
Runoff = 1.34 cfs @ 12.34 hrs, Volume= 0.160 af, Depth= 1.51"
Runoff by SCS TR-20 method, UH=SCS, Time Span= 0.00-250.00 hrs, dt= 0.01 hrsType III 24-hr 10 Year Rainfall=5.00"
Area (sf) CN Description31,781 60 Woods, Fair, HSG B
4,042 98 Paved roads w/curbs & sewers19,634 61 >75% Grass cover, Good, HSG B55,457 63 Weighted Average51,415 92.71% Pervious Area
4,042 7.29% Impervious Area
Tc Length Slope Velocity Capacity Description(min) (feet) (ft/ft) (ft/sec) (cfs)20.9 207 0.0860 0.16 Sheet Flow, 1 to 2
Grass: Bermuda n= 0.410 P2= 3.50"1.6 77 0.0130 0.80 Shallow Concentrated Flow, 2 to DP 4
Short Grass Pasture Kv= 7.0 fps22.5 284 Total
Subcatchment 4: Drainage Area 4
Runoff
Hydrograph
Time (hours)2502402302202102001901801701601501401301201101009080706050403020100
Flow
(cf
s)
1
0
Type III 24-hr 10 YearRainfall=5.00"
Runoff Area=55,457 sfRunoff Volume=0.160 af
Runoff Depth=1.51"Flow Length=284'
Tc=22.5 minCN=63
1.34 cfs

Type III 24-hr 10 Year Rainfall=5.00"Post-Development3 Printed 11/1/2010Prepared by Petruccelli Engineering
Page 95HydroCAD® 9.10 s/n 05751 © 2009 HydroCAD Software Solutions LLC
Summary for Subcatchment 5: Drainage Area 5
Runoff = 1.58 cfs @ 12.55 hrs, Volume= 0.251 af, Depth= 1.04"
Runoff by SCS TR-20 method, UH=SCS, Time Span= 0.00-250.00 hrs, dt= 0.01 hrsType III 24-hr 10 Year Rainfall=5.00"
Area (sf) CN Description23,735 61 >75% Grass cover, Good, HSG B
101,385 55 Woods, Good, HSG B700 98 Paved parking, HSG B
125,820 56 Weighted Average125,120 99.44% Pervious Area
700 0.56% Impervious Area
Tc Length Slope Velocity Capacity Description(min) (feet) (ft/ft) (ft/sec) (cfs)29.9 135 0.0150 0.08 Sheet Flow, 1 to 2
Grass: Bermuda n= 0.410 P2= 3.50"3.8 362 0.1020 1.60 Shallow Concentrated Flow, 2 to DP 4
Woodland Kv= 5.0 fps33.7 497 Total
Subcatchment 5: Drainage Area 5
Runoff
Hydrograph
Time (hours)2502402302202102001901801701601501401301201101009080706050403020100
Flow
(cf
s) 1
0
Type III 24-hr 10 YearRainfall=5.00"
Runoff Area=125,820 sfRunoff Volume=0.251 af
Runoff Depth=1.04"Flow Length=497'
Tc=33.7 minCN=56
1.58 cfs

Type III 24-hr 10 Year Rainfall=5.00"Post-Development3 Printed 11/1/2010Prepared by Petruccelli Engineering
Page 96HydroCAD® 9.10 s/n 05751 © 2009 HydroCAD Software Solutions LLC
Summary for Subcatchment 6A: Drainage Area 6
Runoff = 4.26 cfs @ 12.46 hrs, Volume= 0.558 af, Depth= 2.28"
Runoff by SCS TR-20 method, UH=SCS, Time Span= 0.00-250.00 hrs, dt= 0.01 hrsType III 24-hr 10 Year Rainfall=5.00"
Area (ac) CN Description0.893 55 Woods, Good, HSG B1.109 98 Paved roads w/curbs & sewers0.935 61 >75% Grass cover, Good, HSG B2.937 73 Weighted Average1.828 62.24% Pervious Area1.109 37.76% Impervious Area
Tc Length Slope Velocity Capacity Description(min) (feet) (ft/ft) (ft/sec) (cfs)21.6 185 0.0600 0.14 Sheet Flow, 1 to 2
Woods: Light underbrush n= 0.400 P2= 3.50"0.5 214 0.1180 6.97 Shallow Concentrated Flow, 2 to 3
Paved Kv= 20.3 fps0.0 17 0.0120 6.25 7.67 Pipe Channel, 3 to 4 (Catchbasins)
15.0" Round Area= 1.2 sf Perim= 3.9' r= 0.31'n= 0.012 HDPE
0.4 132 0.0077 5.22 9.22 Pipe Channel, 4 to 5 (18" Culvert)18.0" Round Area= 1.8 sf Perim= 4.7' r= 0.38'n= 0.013 HDPE
9.8 30 0.0120 0.05 Sheet Flow, 5 to DP 6Grass: Bermuda n= 0.410 P2= 3.50"
32.3 578 Total

Type III 24-hr 10 Year Rainfall=5.00"Post-Development3 Printed 11/1/2010Prepared by Petruccelli Engineering
Page 97HydroCAD® 9.10 s/n 05751 © 2009 HydroCAD Software Solutions LLC
Subcatchment 6A: Drainage Area 6
Runoff
Hydrograph
Time (hours)2502402302202102001901801701601501401301201101009080706050403020100
Flow
(cf
s)
4
3
2
1
0
Type III 24-hr 10 YearRainfall=5.00"
Runoff Area=2.937 acRunoff Volume=0.558 af
Runoff Depth=2.28"Flow Length=578'
Tc=32.3 minCN=73
4.26 cfs

Type III 24-hr 10 Year Rainfall=5.00"Post-Development3 Printed 11/1/2010Prepared by Petruccelli Engineering
Page 98HydroCAD® 9.10 s/n 05751 © 2009 HydroCAD Software Solutions LLC
Summary for Subcatchment 6B: Drainage Area 6
Runoff = 0.65 cfs @ 12.39 hrs, Volume= 0.092 af, Depth= 4.76"
Runoff by SCS TR-20 method, UH=SCS, Time Span= 0.00-250.00 hrs, dt= 0.01 hrsType III 24-hr 10 Year Rainfall=5.00"
Area (sf) CN Description10,050 98 Paved roads w/curbs & sewers10,050 100.00% Impervious Area
Tc Length Slope Velocity Capacity Description(min) (feet) (ft/ft) (ft/sec) (cfs)21.6 185 0.0600 0.14 Sheet Flow, 1 to 2
Woods: Light underbrush n= 0.400 P2= 3.50"0.5 214 0.1180 6.97 Shallow Concentrated Flow, 2 to 3
Paved Kv= 20.3 fps0.0 17 0.0120 6.25 7.67 Pipe Channel, 3 to 4 (Catchbasins)
15.0" Round Area= 1.2 sf Perim= 3.9' r= 0.31'n= 0.012 HDPE
0.1 101 0.1730 24.72 43.69 Pipe Channel, 4 to 5 (18" Culvert)18.0" Round Area= 1.8 sf Perim= 4.7' r= 0.38'n= 0.013 HDPE
7.7 23 0.0130 0.05 Sheet Flow, 5 to DP 6Grass: Bermuda n= 0.410 P2= 3.50"
29.9 540 Total
Subcatchment 6B: Drainage Area 6
Runoff
Hydrograph
Time (hours)2502402302202102001901801701601501401301201101009080706050403020100
Flow
(cf
s)
0.7
0.65
0.6
0.55
0.5
0.45
0.4
0.35
0.3
0.25
0.2
0.15
0.1
0.05
0
Type III 24-hr 10 YearRainfall=5.00"
Runoff Area=10,050 sfRunoff Volume=0.092 af
Runoff Depth=4.76"Flow Length=540'
Tc=29.9 minCN=98
0.65 cfs

Type III 24-hr 10 Year Rainfall=5.00"Post-Development3 Printed 11/1/2010Prepared by Petruccelli Engineering
Page 99HydroCAD® 9.10 s/n 05751 © 2009 HydroCAD Software Solutions LLC
Summary for Subcatchment 6c: Drainage Area 6
Runoff = 0.23 cfs @ 12.46 hrs, Volume= 0.033 af, Depth= 1.30"
Runoff by SCS TR-20 method, UH=SCS, Time Span= 0.00-250.00 hrs, dt= 0.01 hrsType III 24-hr 10 Year Rainfall=5.00"
Area (sf) CN Description13,208 60 Woods, Fair, HSG B13,208 100.00% Pervious Area
Tc Length Slope Velocity Capacity Description(min) (feet) (ft/ft) (ft/sec) (cfs)21.6 185 0.0600 0.14 Sheet Flow, 1 to 2
Woods: Light underbrush n= 0.400 P2= 3.50"0.5 214 0.1180 6.97 Shallow Concentrated Flow, 2 to 3
Paved Kv= 20.3 fps0.0 17 0.0120 6.25 7.67 Pipe Channel, 3 to 4 (Catchbasins)
15.0" Round Area= 1.2 sf Perim= 3.9' r= 0.31'n= 0.012 HDPE
0.1 101 0.1730 24.72 43.69 Pipe Channel, 4 to 5 (18" Culvert)18.0" Round Area= 1.8 sf Perim= 4.7' r= 0.38'n= 0.013 HDPE
7.7 23 0.0130 0.05 Sheet Flow, 5 to DP 6Grass: Bermuda n= 0.410 P2= 3.50"
29.9 540 Total
Subcatchment 6c: Drainage Area 6
Runoff
Hydrograph
Time (hours)2502402302202102001901801701601501401301201101009080706050403020100
Flow
(cf
s)
0.260.250.240.230.220.21
0.20.190.180.170.160.150.140.130.120.11
0.10.090.080.070.060.050.040.030.020.01
0
Type III 24-hr 10 YearRainfall=5.00"
Runoff Area=13,208 sfRunoff Volume=0.033 af
Runoff Depth=1.30"Flow Length=540'
Tc=29.9 minCN=60
0.23 cfs

Type III 24-hr 10 Year Rainfall=5.00"Post-Development3 Printed 11/1/2010Prepared by Petruccelli Engineering
Page 100HydroCAD® 9.10 s/n 05751 © 2009 HydroCAD Software Solutions LLC
Summary for Subcatchment 7: Drainage Area 7
Runoff = 4.11 cfs @ 12.20 hrs, Volume= 0.396 af, Depth= 1.58"
Runoff by SCS TR-20 method, UH=SCS, Time Span= 0.00-250.00 hrs, dt= 0.01 hrsType III 24-hr 10 Year Rainfall=5.00"
Area (ac) CN Description1.340 60 Woods, Fair, HSG B0.291 98 Paved roads w/curbs & sewers1.375 61 >75% Grass cover, Good, HSG B3.006 64 Weighted Average2.715 90.32% Pervious Area0.291 9.68% Impervious Area
Tc Length Slope Velocity Capacity Description(min) (feet) (ft/ft) (ft/sec) (cfs)10.1 117 0.1620 0.19 Sheet Flow, 1 to 2
Woods: Light underbrush n= 0.400 P2= 3.50"0.7 100 0.2300 2.40 Shallow Concentrated Flow, 2 to 3
Woodland Kv= 5.0 fps1.2 164 0.2010 2.24 Shallow Concentrated Flow, 3 to 4
Woodland Kv= 5.0 fps1.4 146 0.1230 1.75 Shallow Concentrated Flow, 3 to DP 7
Woodland Kv= 5.0 fps13.4 527 Total
Subcatchment 7: Drainage Area 7
Runoff
Hydrograph
Time (hours)2502402302202102001901801701601501401301201101009080706050403020100
Flow
(cf
s)
4
3
2
1
0
Type III 24-hr 10 YearRainfall=5.00"
Runoff Area=3.006 acRunoff Volume=0.396 af
Runoff Depth=1.58"Flow Length=527'
Tc=13.4 minCN=64
4.11 cfs

Type III 24-hr 10 Year Rainfall=5.00"Post-Development3 Printed 11/1/2010Prepared by Petruccelli Engineering
Page 101HydroCAD® 9.10 s/n 05751 © 2009 HydroCAD Software Solutions LLC
Summary for Subcatchment 8: Drainage Area 8
Runoff = 3.53 cfs @ 12.19 hrs, Volume= 0.330 af, Depth= 1.73"
Runoff by SCS TR-20 method, UH=SCS, Time Span= 0.00-250.00 hrs, dt= 0.01 hrsType III 24-hr 10 Year Rainfall=5.00"
Area (sf) CN Description41,570 60 Woods, Fair, HSG B15,772 98 Paved roads w/curbs & sewers42,568 61 >75% Grass cover, Good, HSG B99,910 66 Weighted Average84,138 84.21% Pervious Area15,772 15.79% Impervious Area
Tc Length Slope Velocity Capacity Description(min) (feet) (ft/ft) (ft/sec) (cfs)
9.7 100 0.1300 0.17 Sheet Flow, 1 to 2Woods: Light underbrush n= 0.400 P2= 3.50"
3.1 362 0.1550 1.97 Shallow Concentrated Flow, 2 to 3Woodland Kv= 5.0 fps
0.2 96 0.1150 6.88 Shallow Concentrated Flow, 3 to DP 8Paved Kv= 20.3 fps
13.0 558 Total
Subcatchment 8: Drainage Area 8
Runoff
Hydrograph
Time (hours)2502402302202102001901801701601501401301201101009080706050403020100
Flow
(cf
s)
3
2
1
0
Type III 24-hr 10 YearRainfall=5.00"
Runoff Area=99,910 sfRunoff Volume=0.330 af
Runoff Depth=1.73"Flow Length=558'
Tc=13.0 minCN=66
3.53 cfs

Type III 24-hr 10 Year Rainfall=5.00"Post-Development3 Printed 11/1/2010Prepared by Petruccelli Engineering
Page 102HydroCAD® 9.10 s/n 05751 © 2009 HydroCAD Software Solutions LLC
Summary for Reach 1R: 18"
Inflow Area = 2.937 ac, 37.76% Impervious, Inflow Depth = 2.28" for 10 Year eventInflow = 4.26 cfs @ 12.46 hrs, Volume= 0.558 afOutflow = 4.26 cfs @ 12.46 hrs, Volume= 0.558 af, Atten= 0%, Lag= 0.2 min
Routing by Stor-Ind method, Time Span= 0.00-250.00 hrs, dt= 0.01 hrsMax. Velocity= 10.42 fps, Min. Travel Time= 0.2 minAvg. Velocity = 4.36 fps, Avg. Travel Time= 0.5 min
Peak Storage= 54 cf @ 12.46 hrsAverage Depth at Peak Storage= 0.42'Bank-Full Depth= 1.50', Capacity at Bank-Full= 24.55 cfs
18.0" Round Pipen= 0.013 Corrugated PE, smooth interiorLength= 132.0' Slope= 0.0546 '/'Inlet Invert= 374.01', Outlet Invert= 366.80'
Reach 1R: 18"
InflowOutflow
Hydrograph
Time (hours)2502402302202102001901801701601501401301201101009080706050403020100
Flow
(cf
s)
4
3
2
1
0
Inflow Area=2.937 acAvg. Flow Depth=0.42'
Max Vel=10.42 fps18.0"
Round Pipen=0.013L=132.0'
S=0.0546 '/'Capacity=24.55 cfs
4.26 cfs4.26 cfs

Type III 24-hr 10 Year Rainfall=5.00"Post-Development3 Printed 11/1/2010Prepared by Petruccelli Engineering
Page 103HydroCAD® 9.10 s/n 05751 © 2009 HydroCAD Software Solutions LLC
Summary for Pond 1P: Pond - D
Inflow Area = 2.937 ac, 37.76% Impervious, Inflow Depth = 2.28" for 10 Year eventInflow = 4.26 cfs @ 12.46 hrs, Volume= 0.558 afOutflow = 4.26 cfs @ 12.46 hrs, Volume= 0.558 af, Atten= 0%, Lag= 0.0 minPrimary = 4.26 cfs @ 12.46 hrs, Volume= 0.558 afSecondary = 0.00 cfs @ 0.00 hrs, Volume= 0.000 af
Routing by Stor-Ind method, Time Span= 0.00-250.00 hrs, dt= 0.01 hrsPeak Elev= 367.96' @ 12.46 hrs
Device Routing Invert Outlet Devices#1 Primary 366.80' 18.0" Round Culvert
L= 6.0' CMP, projecting, no headwall, Ke= 0.900 Inlet / Outlet Invert= 366.80' / 361.00' S= 0.9667 '/' Cc= 0.900 n= 0.025 Corrugated metal
#2 Secondary 371.19' 57.0" W x 57.0" H Vert. Orifice/Grate C= 0.600
Primary OutFlow Max=4.26 cfs @ 12.46 hrs HW=367.96' (Free Discharge)1=Culvert (Inlet Controls 4.26 cfs @ 2.90 fps)
Secondary OutFlow Max=0.00 cfs @ 0.00 hrs HW=366.80' (Free Discharge)2=Orifice/Grate ( Controls 0.00 cfs)
Pond 1P: Pond - D
InflowOutflowPrimarySecondary
Hydrograph
Time (hours)2502402302202102001901801701601501401301201101009080706050403020100
Flow
(cf
s)
4
3
2
1
0
Inflow Area=2.937 acPeak Elev=367.96'
4.26 cfs4.26 cfs
4.26 cfs
0.00 cfs

Type III 24-hr 10 Year Rainfall=5.00"Post-Development3 Printed 11/1/2010Prepared by Petruccelli Engineering
Page 104HydroCAD® 9.10 s/n 05751 © 2009 HydroCAD Software Solutions LLC
Summary for Pond 3P: Detention Pond
Inflow = 13.96 cfs @ 12.35 hrs, Volume= 0.355 afOutflow = 0.80 cfs @ 13.45 hrs, Volume= 0.355 af, Atten= 94%, Lag= 65.9 minPrimary = 0.80 cfs @ 13.45 hrs, Volume= 0.355 afSecondary = 0.00 cfs @ 0.00 hrs, Volume= 0.000 af
Routing by Stor-Ind method, Time Span= 0.00-250.00 hrs, dt= 0.01 hrsPeak Elev= 368.03' @ 13.45 hrs Surf.Area= 3,468 sf Storage= 9,596 cf
Plug-Flow detention time= 152.3 min calculated for 0.355 af (100% of inflow)Center-of-Mass det. time= 152.3 min ( 931.0 - 778.6 )
Volume Invert Avail.Storage Storage Description#1 363.00' 39,443 cf Custom Stage Data (Prismatic) Listed below (Recalc)
Elevation Surf.Area Inc.Store Cum.Store(feet) (sq-ft) (cubic-feet) (cubic-feet)
363.00 0 0 0364.00 1,137 569 569366.00 2,172 3,309 3,878368.00 3,441 5,613 9,491370.00 5,233 8,674 18,165372.00 7,184 12,417 30,582373.00 7,500 7,342 37,924373.20 7,700 1,520 39,443
Device Routing Invert Outlet Devices#1 Primary 363.00' 10.000 in/hr Exfiltration over Surface area #2 Secondary 373.00' 208.0' long x 10.0' breadth Broad-Crested Rectangular Weir
Head (feet) 0.20 0.40 0.60 0.80 1.00 1.20 1.40 1.60 Coef. (English) 2.49 2.56 2.70 2.69 2.68 2.69 2.67 2.64
Primary OutFlow Max=0.80 cfs @ 13.45 hrs HW=368.03' (Free Discharge)1=Exfiltration (Exfiltration Controls 0.80 cfs)
Secondary OutFlow Max=0.00 cfs @ 0.00 hrs HW=363.00' (Free Discharge)2=Broad-Crested Rectangular Weir ( Controls 0.00 cfs)

Type III 24-hr 10 Year Rainfall=5.00"Post-Development3 Printed 11/1/2010Prepared by Petruccelli Engineering
Page 105HydroCAD® 9.10 s/n 05751 © 2009 HydroCAD Software Solutions LLC
Pond 3P: Detention Pond
InflowOutflowPrimarySecondary
Hydrograph
Time (hours)2502402302202102001901801701601501401301201101009080706050403020100
Flow
(cf
s)
15
14
13
12
11
10
9
8
7
6
5
4
3
2
1
0
Peak Elev=368.03'Storage=9,596 cf
13.96 cfs
0.80 cfs0.80 cfs
0.00 cfs

Type III 24-hr 10 Year Rainfall=5.00"Post-Development3 Printed 11/1/2010Prepared by Petruccelli Engineering
Page 106HydroCAD® 9.10 s/n 05751 © 2009 HydroCAD Software Solutions LLC
Summary for Pond 4P: Detention Pond
Inflow Area = 5.751 ac, 33.25% Impervious, Inflow Depth = 2.28" for 10 Year eventInflow = 10.45 cfs @ 12.27 hrs, Volume= 1.093 afOutflow = 14.62 cfs @ 12.35 hrs, Volume= 1.093 af, Atten= 0%, Lag= 4.7 minPrimary = 0.66 cfs @ 12.35 hrs, Volume= 0.738 afSecondary = 13.96 cfs @ 12.35 hrs, Volume= 0.355 af
Routing by Stor-Ind method, Time Span= 0.00-250.00 hrs, dt= 0.01 hrsPeak Elev= 373.53' @ 12.35 hrs Surf.Area= 2,850 sf Storage= 12,557 cf
Plug-Flow detention time= 179.2 min calculated for 1.093 af (100% of inflow)Center-of-Mass det. time= 179.2 min ( 1,031.3 - 852.1 )
Volume Invert Avail.Storage Storage Description#1 363.00' 12,557 cf Custom Stage Data (Prismatic) Listed below (Recalc)
Elevation Surf.Area Inc.Store Cum.Store(feet) (sq-ft) (cubic-feet) (cubic-feet)
363.00 0 0 0364.00 448 224 224366.00 893 1,341 1,565368.00 1,459 2,352 3,917370.00 2,095 3,554 7,471372.00 2,739 4,834 12,305372.09 2,850 252 12,557
Device Routing Invert Outlet Devices#1 Primary 363.00' 10.000 in/hr Exfiltration over Surface area #2 Device 3 372.00' 54.0' long x 1.5' breadth Broad-Crested Rectangular Weir
Head (feet) 0.20 0.40 0.60 0.80 1.00 1.20 1.40 1.60 1.80 2.00 2.50 3.00 Coef. (English) 2.62 2.64 2.64 2.68 2.75 2.86 2.92 3.07 3.07 3.03 3.28 3.32
#3 Secondary 371.00' Custom Weir/Orifice, Cv= 2.62 (C= 3.28) Head (feet) 0.00 1.00 Width (feet) 2.00 2.00
Primary OutFlow Max=0.66 cfs @ 12.35 hrs HW=373.53' (Free Discharge)1=Exfiltration (Exfiltration Controls 0.66 cfs)
Secondary OutFlow Max=13.96 cfs @ 12.35 hrs HW=373.53' (Free Discharge)3=Custom Weir/Orifice (Orifice Controls 13.96 cfs @ 6.98 fps)
2=Broad-Crested Rectangular Weir (Passes 13.96 cfs of 308.61 cfs potential flow)

Type III 24-hr 10 Year Rainfall=5.00"Post-Development3 Printed 11/1/2010Prepared by Petruccelli Engineering
Page 107HydroCAD® 9.10 s/n 05751 © 2009 HydroCAD Software Solutions LLC
Pond 4P: Detention Pond
InflowOutflowPrimarySecondary
Hydrograph
Time (hours)2502402302202102001901801701601501401301201101009080706050403020100
Flow
(cf
s)
161514
13121110
9876
5432
10
Inflow Area=5.751 acPeak Elev=373.53'Storage=12,557 cf10.45 cfs
14.62 cfs
0.66 cfs
13.96 cfs

Type III 24-hr 10 Year Rainfall=5.00"Post-Development3 Printed 11/1/2010Prepared by Petruccelli Engineering
Page 108HydroCAD® 9.10 s/n 05751 © 2009 HydroCAD Software Solutions LLC
Summary for Pond 6P: Drywells
Inflow Area = 0.231 ac,100.00% Impervious, Inflow Depth = 4.76" for 10 Year eventInflow = 0.65 cfs @ 12.39 hrs, Volume= 0.092 afOutflow = 0.20 cfs @ 13.00 hrs, Volume= 0.092 af, Atten= 69%, Lag= 36.4 minPrimary = 0.20 cfs @ 13.00 hrs, Volume= 0.092 afSecondary = 0.00 cfs @ 0.00 hrs, Volume= 0.000 af
Routing by Stor-Ind method, Time Span= 0.00-250.00 hrs, dt= 0.01 hrsPeak Elev= 387.49' @ 13.00 hrs Surf.Area= 1,218 sf Storage= 951 cf
Plug-Flow detention time= 29.2 min calculated for 0.092 af (100% of inflow)Center-of-Mass det. time= 29.2 min ( 799.4 - 770.2 )
Volume Invert Avail.Storage Storage Description#1A 386.00' 1,291 cf 27.68'W x 44.00'L x 4.83'H Field A
5,883 cf Overall - 2,655 cf Embedded = 3,227 cf x 40.0% Voids#2A 387.00' 2,058 cf Dry_Well 1000 Gallon x 16 Inside #1
Inside= 62.0"W x 30.0"H => 12.86 sf x 10.00'L = 128.6 cfOutside= 68.0"W x 34.0"H => 15.81 sf x 10.50'L = 166.0 cf
3,349 cf Total Available Storage
Storage Group A created with Chamber Wizard
Device Routing Invert Outlet Devices#1 Primary 386.00' 6.000 in/hr Exfiltration over Wetted area #2 Secondary 393.00' 24.0" Vert. Orifice/Grate C= 0.600
Primary OutFlow Max=0.20 cfs @ 13.00 hrs HW=387.49' (Free Discharge)1=Exfiltration (Exfiltration Controls 0.20 cfs)
Secondary OutFlow Max=0.00 cfs @ 0.00 hrs HW=386.00' (Free Discharge)2=Orifice/Grate ( Controls 0.00 cfs)
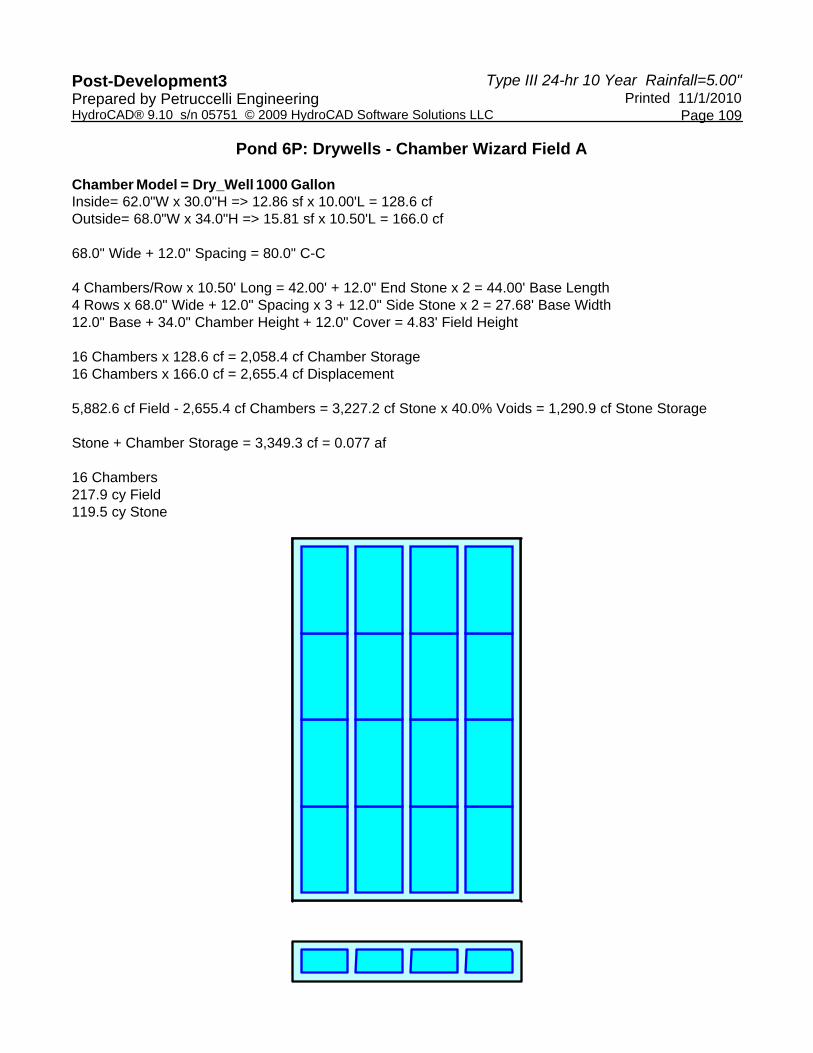
Type III 24-hr 10 Year Rainfall=5.00"Post-Development3 Printed 11/1/2010Prepared by Petruccelli Engineering
Page 109HydroCAD® 9.10 s/n 05751 © 2009 HydroCAD Software Solutions LLC
Pond 6P: Drywells - Chamber Wizard Field A
Chamber Model = Dry_Well 1000 GallonInside= 62.0"W x 30.0"H => 12.86 sf x 10.00'L = 128.6 cfOutside= 68.0"W x 34.0"H => 15.81 sf x 10.50'L = 166.0 cf
68.0" Wide + 12.0" Spacing = 80.0" C-C
4 Chambers/Row x 10.50' Long = 42.00' + 12.0" End Stone x 2 = 44.00' Base Length4 Rows x 68.0" Wide + 12.0" Spacing x 3 + 12.0" Side Stone x 2 = 27.68' Base Width12.0" Base + 34.0" Chamber Height + 12.0" Cover = 4.83' Field Height
16 Chambers x 128.6 cf = 2,058.4 cf Chamber Storage16 Chambers x 166.0 cf = 2,655.4 cf Displacement
5,882.6 cf Field - 2,655.4 cf Chambers = 3,227.2 cf Stone x 40.0% Voids = 1,290.9 cf Stone Storage
Stone + Chamber Storage = 3,349.3 cf = 0.077 af
16 Chambers217.9 cy Field119.5 cy Stone

Type III 24-hr 10 Year Rainfall=5.00"Post-Development3 Printed 11/1/2010Prepared by Petruccelli Engineering
Page 110HydroCAD® 9.10 s/n 05751 © 2009 HydroCAD Software Solutions LLC
Pond 6P: Drywells
InflowOutflowPrimarySecondary
Hydrograph
Time (hours)2502402302202102001901801701601501401301201101009080706050403020100
Flow
(cf
s)
0.7
0.65
0.6
0.55
0.5
0.45
0.4
0.35
0.3
0.25
0.2
0.15
0.1
0.05
0
Inflow Area=0.231 acPeak Elev=387.49'
Storage=951 cf
0.65 cfs
0.20 cfs0.20 cfs
0.00 cfs
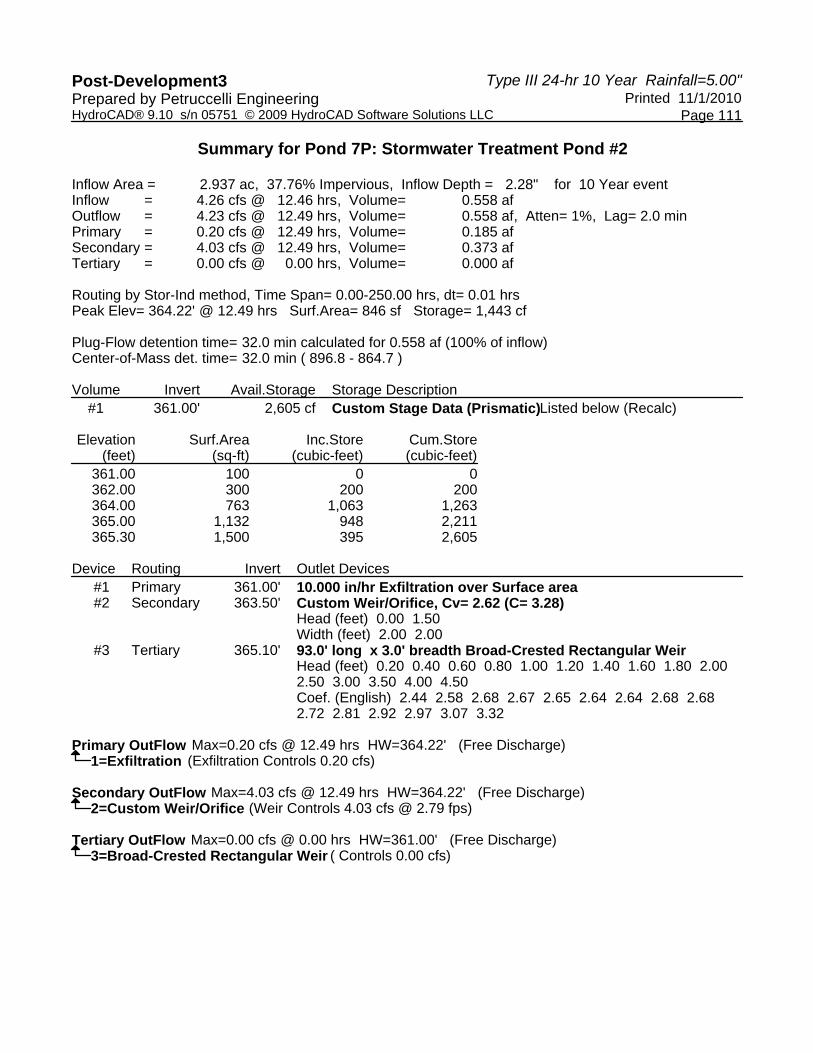
Type III 24-hr 10 Year Rainfall=5.00"Post-Development3 Printed 11/1/2010Prepared by Petruccelli Engineering
Page 111HydroCAD® 9.10 s/n 05751 © 2009 HydroCAD Software Solutions LLC
Summary for Pond 7P: Stormwater Treatment Pond #2
Inflow Area = 2.937 ac, 37.76% Impervious, Inflow Depth = 2.28" for 10 Year eventInflow = 4.26 cfs @ 12.46 hrs, Volume= 0.558 afOutflow = 4.23 cfs @ 12.49 hrs, Volume= 0.558 af, Atten= 1%, Lag= 2.0 minPrimary = 0.20 cfs @ 12.49 hrs, Volume= 0.185 afSecondary = 4.03 cfs @ 12.49 hrs, Volume= 0.373 afTertiary = 0.00 cfs @ 0.00 hrs, Volume= 0.000 af
Routing by Stor-Ind method, Time Span= 0.00-250.00 hrs, dt= 0.01 hrsPeak Elev= 364.22' @ 12.49 hrs Surf.Area= 846 sf Storage= 1,443 cf
Plug-Flow detention time= 32.0 min calculated for 0.558 af (100% of inflow)Center-of-Mass det. time= 32.0 min ( 896.8 - 864.7 )
Volume Invert Avail.Storage Storage Description#1 361.00' 2,605 cf Custom Stage Data (Prismatic) Listed below (Recalc)
Elevation Surf.Area Inc.Store Cum.Store(feet) (sq-ft) (cubic-feet) (cubic-feet)
361.00 100 0 0362.00 300 200 200364.00 763 1,063 1,263365.00 1,132 948 2,211365.30 1,500 395 2,605
Device Routing Invert Outlet Devices#1 Primary 361.00' 10.000 in/hr Exfiltration over Surface area #2 Secondary 363.50' Custom Weir/Orifice, Cv= 2.62 (C= 3.28)
Head (feet) 0.00 1.50 Width (feet) 2.00 2.00
#3 Tertiary 365.10' 93.0' long x 3.0' breadth Broad-Crested Rectangular Weir Head (feet) 0.20 0.40 0.60 0.80 1.00 1.20 1.40 1.60 1.80 2.00 2.50 3.00 3.50 4.00 4.50 Coef. (English) 2.44 2.58 2.68 2.67 2.65 2.64 2.64 2.68 2.68 2.72 2.81 2.92 2.97 3.07 3.32
Primary OutFlow Max=0.20 cfs @ 12.49 hrs HW=364.22' (Free Discharge)1=Exfiltration (Exfiltration Controls 0.20 cfs)
Secondary OutFlow Max=4.03 cfs @ 12.49 hrs HW=364.22' (Free Discharge)2=Custom Weir/Orifice (Weir Controls 4.03 cfs @ 2.79 fps)
Tertiary OutFlow Max=0.00 cfs @ 0.00 hrs HW=361.00' (Free Discharge)3=Broad-Crested Rectangular Weir ( Controls 0.00 cfs)
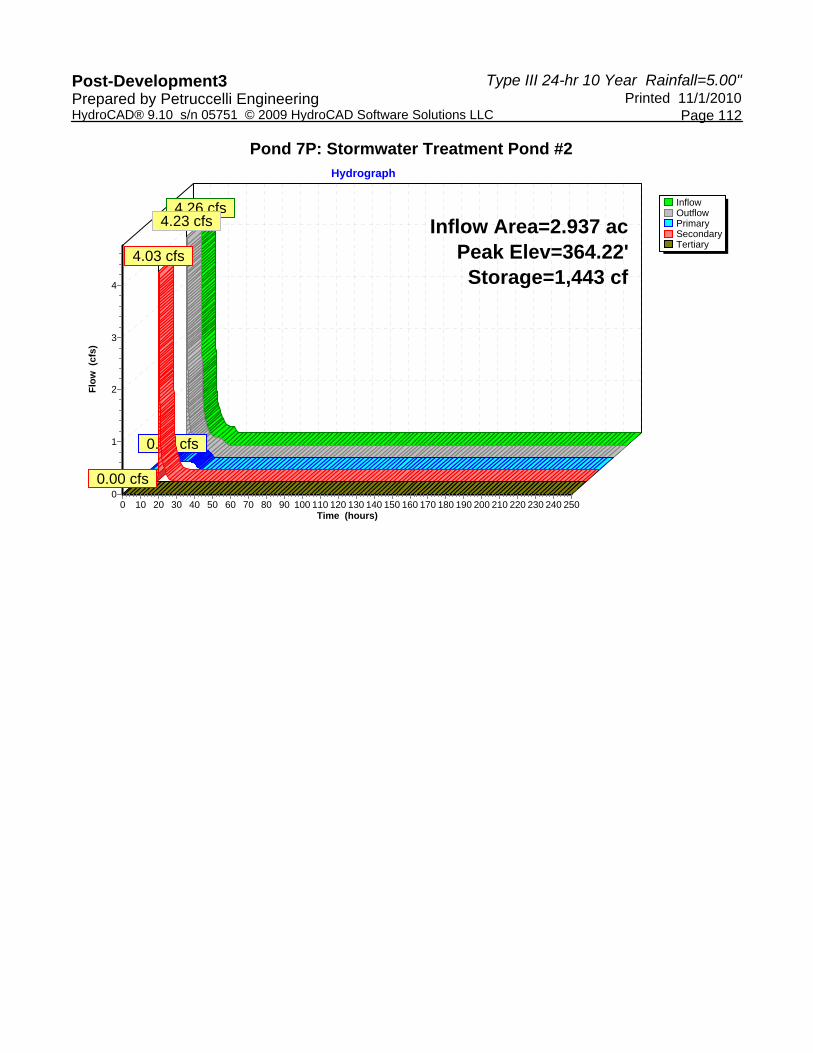
Type III 24-hr 10 Year Rainfall=5.00"Post-Development3 Printed 11/1/2010Prepared by Petruccelli Engineering
Page 112HydroCAD® 9.10 s/n 05751 © 2009 HydroCAD Software Solutions LLC
Pond 7P: Stormwater Treatment Pond #2
InflowOutflowPrimarySecondaryTertiary
Hydrograph
Time (hours)2502402302202102001901801701601501401301201101009080706050403020100
Flow
(cf
s)
4
3
2
1
0
Inflow Area=2.937 acPeak Elev=364.22'Storage=1,443 cf
4.26 cfs4.23 cfs
0.20 cfs
4.03 cfs
0.00 cfs

Type III 24-hr 10 Year Rainfall=5.00"Post-Development3 Printed 11/1/2010Prepared by Petruccelli Engineering
Page 113HydroCAD® 9.10 s/n 05751 © 2009 HydroCAD Software Solutions LLC
Summary for Pond 8P: Stormwater Treatment Pond #1
Inflow = 4.03 cfs @ 12.49 hrs, Volume= 0.373 afOutflow = 3.37 cfs @ 12.68 hrs, Volume= 0.373 af, Atten= 17%, Lag= 11.3 minPrimary = 0.37 cfs @ 12.68 hrs, Volume= 0.100 afSecondary = 2.99 cfs @ 12.68 hrs, Volume= 0.273 af
Routing by Stor-Ind method, Time Span= 0.00-250.00 hrs, dt= 0.01 hrsPeak Elev= 363.67' @ 12.68 hrs Surf.Area= 1,618 sf Storage= 2,623 cf
Plug-Flow detention time= 15.0 min calculated for 0.373 af (100% of inflow)Center-of-Mass det. time= 15.0 min ( 815.7 - 800.8 )
Volume Invert Avail.Storage Storage Description#1 361.00' 5,867 cf Custom Stage Data (Prismatic) Listed below (Recalc)
Elevation Surf.Area Inc.Store Cum.Store(feet) (sq-ft) (cubic-feet) (cubic-feet)
361.00 300 0 0362.00 842 571 571364.00 1,772 2,614 3,185365.00 2,163 1,968 5,153365.30 2,600 714 5,867
Device Routing Invert Outlet Devices#1 Secondary 361.00' 24.0" Round Culvert
L= 200.0' CMP, end-section conforming to fill, Ke= 0.500 Inlet / Outlet Invert= 361.00' / 330.00' S= 0.1550 '/' Cc= 0.900 n= 0.013 Corrugated PE, smooth interior
#2 Device 1 361.10' 2.0" Vert. Orifice/Grate (0 yr) C= 0.600 #3 Device 1 361.70' 6.0" Vert. Orifice/Grate (1yr) C= 0.600 #4 Device 1 362.30' 7.0" Vert. Orifice/Grate(2yr) C= 0.600 #5 Device 1 363.40' 9.0" Vert. Orifice/Grate(10yr) C= 0.600 #6 Device 1 364.70' 57.0" x 57.0" Horiz. Top of Riser (100yr) C= 0.600
Limited to weir flow at low heads #7 Device 1 365.00' 14.5' long x 2.0' breadth Broad-Crested Rectangular Weir (14.5)
Head (feet) 0.20 0.40 0.60 0.80 1.00 1.20 1.40 1.60 1.80 2.00 2.50 3.00 3.50 Coef. (English) 2.54 2.61 2.61 2.60 2.66 2.70 2.77 2.89 2.88 2.85 3.07 3.20 3.32
#8 Device 1 365.20' 100.0' long x 3.0' breadth Broad-Crested Rectangular Weir Head (feet) 0.20 0.40 0.60 0.80 1.00 1.20 1.40 1.60 1.80 2.00 2.50 3.00 3.50 4.00 4.50 Coef. (English) 2.44 2.58 2.68 2.67 2.65 2.64 2.64 2.68 2.68 2.72 2.81 2.92 2.97 3.07 3.32
#9 Primary 361.00' 10.000 in/hr Exfiltration over Surface area
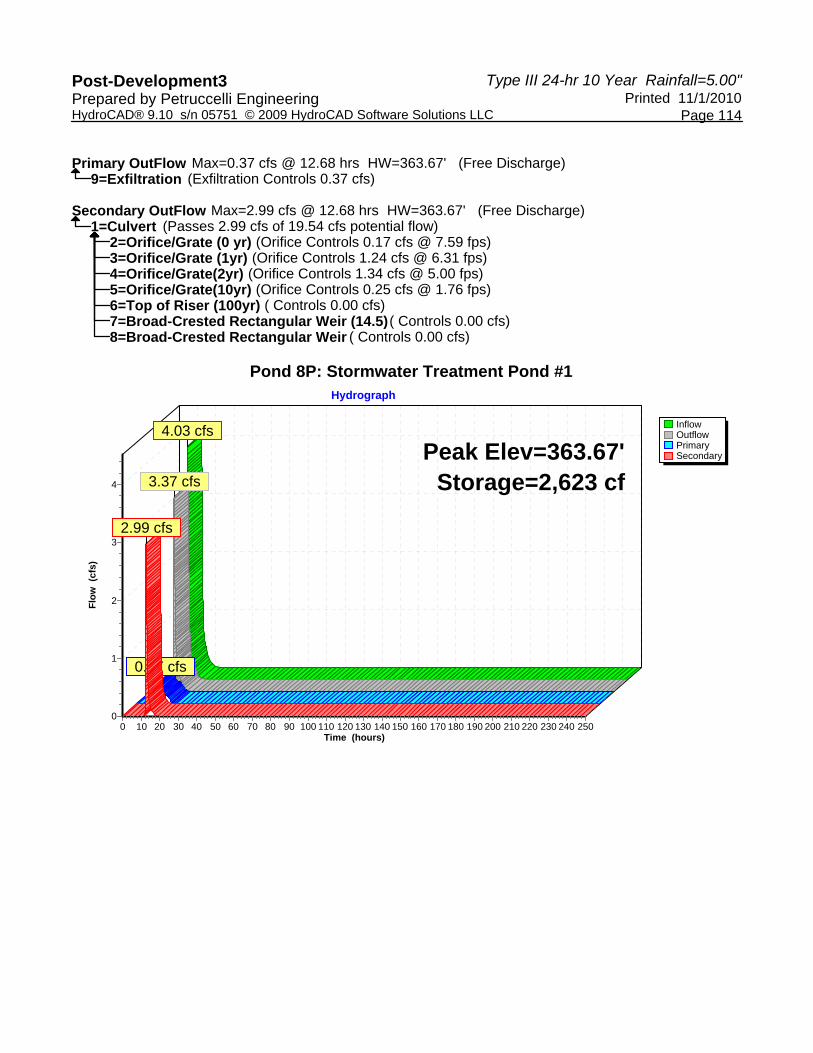
Type III 24-hr 10 Year Rainfall=5.00"Post-Development3 Printed 11/1/2010Prepared by Petruccelli Engineering
Page 114HydroCAD® 9.10 s/n 05751 © 2009 HydroCAD Software Solutions LLC
Primary OutFlow Max=0.37 cfs @ 12.68 hrs HW=363.67' (Free Discharge)9=Exfiltration (Exfiltration Controls 0.37 cfs)
Secondary OutFlow Max=2.99 cfs @ 12.68 hrs HW=363.67' (Free Discharge)1=Culvert (Passes 2.99 cfs of 19.54 cfs potential flow)
2=Orifice/Grate (0 yr) (Orifice Controls 0.17 cfs @ 7.59 fps)3=Orifice/Grate (1yr) (Orifice Controls 1.24 cfs @ 6.31 fps)4=Orifice/Grate(2yr) (Orifice Controls 1.34 cfs @ 5.00 fps)5=Orifice/Grate(10yr) (Orifice Controls 0.25 cfs @ 1.76 fps)6=Top of Riser (100yr) ( Controls 0.00 cfs)7=Broad-Crested Rectangular Weir (14.5) ( Controls 0.00 cfs)8=Broad-Crested Rectangular Weir ( Controls 0.00 cfs)
Pond 8P: Stormwater Treatment Pond #1
InflowOutflowPrimarySecondary
Hydrograph
Time (hours)2502402302202102001901801701601501401301201101009080706050403020100
Flow
(cf
s)
4
3
2
1
0
Peak Elev=363.67'Storage=2,623 cf
4.03 cfs
3.37 cfs
0.37 cfs
2.99 cfs

Type III 24-hr 10 Year Rainfall=5.00"Post-Development3 Printed 11/1/2010Prepared by Petruccelli Engineering
Page 115HydroCAD® 9.10 s/n 05751 © 2009 HydroCAD Software Solutions LLC
Summary for Pond 9P: Drywells
Inflow Area = 0.459 ac,100.00% Impervious, Inflow Depth = 4.76" for 10 Year eventInflow = 1.56 cfs @ 12.25 hrs, Volume= 0.182 afOutflow = 0.25 cfs @ 11.72 hrs, Volume= 0.182 af, Atten= 84%, Lag= 0.0 minPrimary = 0.25 cfs @ 11.72 hrs, Volume= 0.182 afSecondary = 0.00 cfs @ 0.00 hrs, Volume= 0.000 af
Routing by Stor-Ind method, Time Span= 0.00-250.00 hrs, dt= 0.01 hrsPeak Elev= 388.13' @ 12.99 hrs Surf.Area= 1,834 sf Storage= 2,457 cf
Plug-Flow detention time= 61.9 min calculated for 0.182 af (100% of inflow)Center-of-Mass det. time= 61.9 min ( 822.1 - 760.2 )
Volume Invert Avail.Storage Storage Description#1A 386.00' 1,685 cf 41.69'W x 44.00'L x 4.83'H Field A
8,860 cf Overall - 4,647 cf Embedded = 4,213 cf x 40.0% Voids#2A 387.00' 3,602 cf Dry_Well 1000 Gallon x 28 Inside #1
Inside= 62.0"W x 30.0"H => 12.86 sf x 10.00'L = 128.6 cfOutside= 68.0"W x 34.0"H => 15.81 sf x 10.50'L = 166.0 cf
5,287 cf Total Available Storage
Storage Group A created with Chamber Wizard
Device Routing Invert Outlet Devices#1 Primary 386.00' 6.000 in/hr Exfiltration over Surface area #2 Secondary 392.00' 24.0" Vert. Orifice/Grate C= 0.600
Primary OutFlow Max=0.25 cfs @ 11.72 hrs HW=386.08' (Free Discharge)1=Exfiltration (Exfiltration Controls 0.25 cfs)
Secondary OutFlow Max=0.00 cfs @ 0.00 hrs HW=386.00' (Free Discharge)2=Orifice/Grate ( Controls 0.00 cfs)
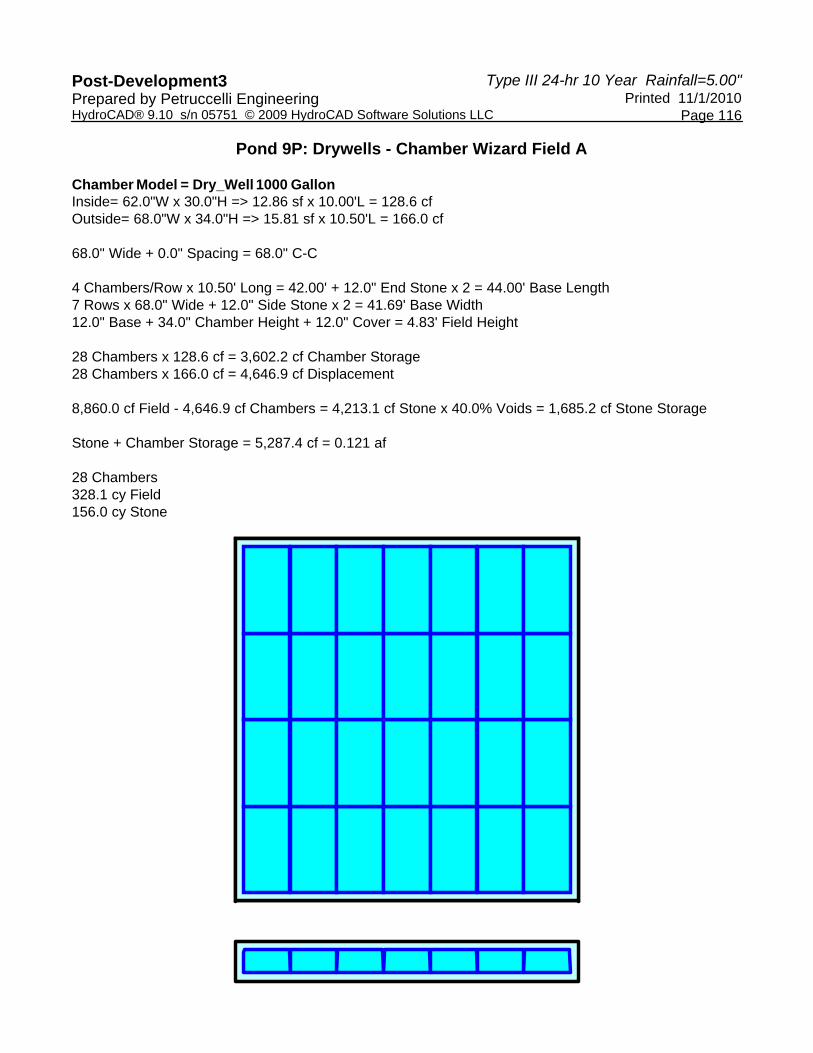
Type III 24-hr 10 Year Rainfall=5.00"Post-Development3 Printed 11/1/2010Prepared by Petruccelli Engineering
Page 116HydroCAD® 9.10 s/n 05751 © 2009 HydroCAD Software Solutions LLC
Pond 9P: Drywells - Chamber Wizard Field A
Chamber Model = Dry_Well 1000 GallonInside= 62.0"W x 30.0"H => 12.86 sf x 10.00'L = 128.6 cfOutside= 68.0"W x 34.0"H => 15.81 sf x 10.50'L = 166.0 cf
68.0" Wide + 0.0" Spacing = 68.0" C-C
4 Chambers/Row x 10.50' Long = 42.00' + 12.0" End Stone x 2 = 44.00' Base Length7 Rows x 68.0" Wide + 12.0" Side Stone x 2 = 41.69' Base Width12.0" Base + 34.0" Chamber Height + 12.0" Cover = 4.83' Field Height
28 Chambers x 128.6 cf = 3,602.2 cf Chamber Storage28 Chambers x 166.0 cf = 4,646.9 cf Displacement
8,860.0 cf Field - 4,646.9 cf Chambers = 4,213.1 cf Stone x 40.0% Voids = 1,685.2 cf Stone Storage
Stone + Chamber Storage = 5,287.4 cf = 0.121 af
28 Chambers328.1 cy Field156.0 cy Stone

Type III 24-hr 10 Year Rainfall=5.00"Post-Development3 Printed 11/1/2010Prepared by Petruccelli Engineering
Page 117HydroCAD® 9.10 s/n 05751 © 2009 HydroCAD Software Solutions LLC
Pond 9P: Drywells
InflowOutflowPrimarySecondary
Hydrograph
Time (hours)2502402302202102001901801701601501401301201101009080706050403020100
Flow
(cf
s) 1
0
Inflow Area=0.459 acPeak Elev=388.13'
Storage=2,457 cf
1.56 cfs
0.25 cfs0.25 cfs
0.00 cfs

Type III 24-hr 10 Year Rainfall=5.00"Post-Development3 Printed 11/1/2010Prepared by Petruccelli Engineering
Page 118HydroCAD® 9.10 s/n 05751 © 2009 HydroCAD Software Solutions LLC
Summary for Link DP-1: Design Point 1
Inflow Area = 13.292 ac, 3.27% Impervious, Inflow Depth = 1.30" for 10 Year eventInflow = 10.00 cfs @ 12.50 hrs, Volume= 1.441 afPrimary = 10.00 cfs @ 12.50 hrs, Volume= 1.441 af, Atten= 0%, Lag= 0.0 min
Primary outflow = Inflow, Time Span= 0.00-250.00 hrs, dt= 0.01 hrs
Link DP-1: Design Point 1
InflowPrimary
Hydrograph
Time (hours)2502402302202102001901801701601501401301201101009080706050403020100
Flow
(cf
s)
11
10
9
8
7
6
5
4
3
2
1
0
Inflow Area=13.292 ac10.00 cfs
10.00 cfs

Type III 24-hr 10 Year Rainfall=5.00"Post-Development3 Printed 11/1/2010Prepared by Petruccelli Engineering
Page 119HydroCAD® 9.10 s/n 05751 © 2009 HydroCAD Software Solutions LLC
Summary for Link DP-2: Design Point 2
Inflow Area = 1.273 ac, 7.29% Impervious, Inflow Depth = 1.51" for 10 Year eventInflow = 1.34 cfs @ 12.34 hrs, Volume= 0.160 afPrimary = 1.34 cfs @ 12.34 hrs, Volume= 0.160 af, Atten= 0%, Lag= 0.0 min
Primary outflow = Inflow, Time Span= 0.00-250.00 hrs, dt= 0.01 hrs
Link DP-2: Design Point 2
InflowPrimary
Hydrograph
Time (hours)2502402302202102001901801701601501401301201101009080706050403020100
Flow
(cf
s)
1
0
Inflow Area=1.273 ac1.34 cfs
1.34 cfs

Type III 24-hr 10 Year Rainfall=5.00"Post-Development3 Printed 11/1/2010Prepared by Petruccelli Engineering
Page 120HydroCAD® 9.10 s/n 05751 © 2009 HydroCAD Software Solutions LLC
Summary for Link DP-3: Design Point 3
Inflow Area = 2.653 ac, 7.97% Impervious, Inflow Depth = 1.51" for 10 Year eventInflow = 2.52 cfs @ 12.43 hrs, Volume= 0.334 afPrimary = 2.52 cfs @ 12.43 hrs, Volume= 0.334 af, Atten= 0%, Lag= 0.0 min
Primary outflow = Inflow, Time Span= 0.00-250.00 hrs, dt= 0.01 hrs
Link DP-3: Design Point 3
InflowPrimary
Hydrograph
Time (hours)2502402302202102001901801701601501401301201101009080706050403020100
Flow
(cf
s)
2
1
0
Inflow Area=2.653 ac2.52 cfs
2.52 cfs

Type III 24-hr 10 Year Rainfall=5.00"Post-Development3 Printed 11/1/2010Prepared by Petruccelli Engineering
Page 121HydroCAD® 9.10 s/n 05751 © 2009 HydroCAD Software Solutions LLC
Summary for Link DP-4: Design Point 4
Inflow Area = 2.888 ac, 0.56% Impervious, Inflow Depth = 1.04" for 10 Year eventInflow = 1.58 cfs @ 12.55 hrs, Volume= 0.251 afPrimary = 1.58 cfs @ 12.55 hrs, Volume= 0.251 af, Atten= 0%, Lag= 0.0 min
Primary outflow = Inflow, Time Span= 0.00-250.00 hrs, dt= 0.01 hrs
Link DP-4: Design Point 4
InflowPrimary
Hydrograph
Time (hours)2502402302202102001901801701601501401301201101009080706050403020100
Flow
(cf
s) 1
0
Inflow Area=2.888 ac1.58 cfs
1.58 cfs

Type III 24-hr 10 Year Rainfall=5.00"Post-Development3 Printed 11/1/2010Prepared by Petruccelli Engineering
Page 122HydroCAD® 9.10 s/n 05751 © 2009 HydroCAD Software Solutions LLC
Summary for Link DP-5: Design Point 5
Inflow Area = 2.294 ac, 15.79% Impervious, Inflow Depth = 1.73" for 10 Year eventInflow = 3.53 cfs @ 12.19 hrs, Volume= 0.330 afPrimary = 3.53 cfs @ 12.19 hrs, Volume= 0.330 af, Atten= 0%, Lag= 0.0 min
Primary outflow = Inflow, Time Span= 0.00-250.00 hrs, dt= 0.01 hrs
Link DP-5: Design Point 5
InflowPrimary
Hydrograph
Time (hours)2502402302202102001901801701601501401301201101009080706050403020100
Flow
(cf
s)
3
2
1
0
Inflow Area=2.294 ac3.53 cfs
3.53 cfs

Type III 24-hr 10 Year Rainfall=5.00"Post-Development3 Printed 11/1/2010Prepared by Petruccelli Engineering
Page 123HydroCAD® 9.10 s/n 05751 © 2009 HydroCAD Software Solutions LLC
Summary for Link DP-6: Design Point 6
Inflow Area = 0.303 ac, 0.00% Impervious, Inflow Depth = 12.11" for 10 Year eventInflow = 3.18 cfs @ 12.67 hrs, Volume= 0.306 afPrimary = 3.18 cfs @ 12.67 hrs, Volume= 0.306 af, Atten= 0%, Lag= 0.0 min
Primary outflow = Inflow, Time Span= 0.00-250.00 hrs, dt= 0.01 hrs
Link DP-6: Design Point 6
InflowPrimary
Hydrograph
Time (hours)2502402302202102001901801701601501401301201101009080706050403020100
Flow
(cf
s)
3
2
1
0
Inflow Area=0.303 ac3.18 cfs
3.18 cfs

Type III 24-hr 10 Year Rainfall=5.00"Post-Development3 Printed 11/1/2010Prepared by Petruccelli Engineering
Page 124HydroCAD® 9.10 s/n 05751 © 2009 HydroCAD Software Solutions LLC
Summary for Link DP-7: Design Point 7
Inflow Area = 3.006 ac, 9.68% Impervious, Inflow Depth = 1.58" for 10 Year eventInflow = 4.11 cfs @ 12.20 hrs, Volume= 0.396 afPrimary = 4.11 cfs @ 12.20 hrs, Volume= 0.396 af, Atten= 0%, Lag= 0.0 min
Primary outflow = Inflow, Time Span= 0.00-250.00 hrs, dt= 0.01 hrs
Link DP-7: Design Point 7
InflowPrimary
Hydrograph
Time (hours)2502402302202102001901801701601501401301201101009080706050403020100
Flow
(cf
s)
4
3
2
1
0
Inflow Area=3.006 ac4.11 cfs
4.11 cfs
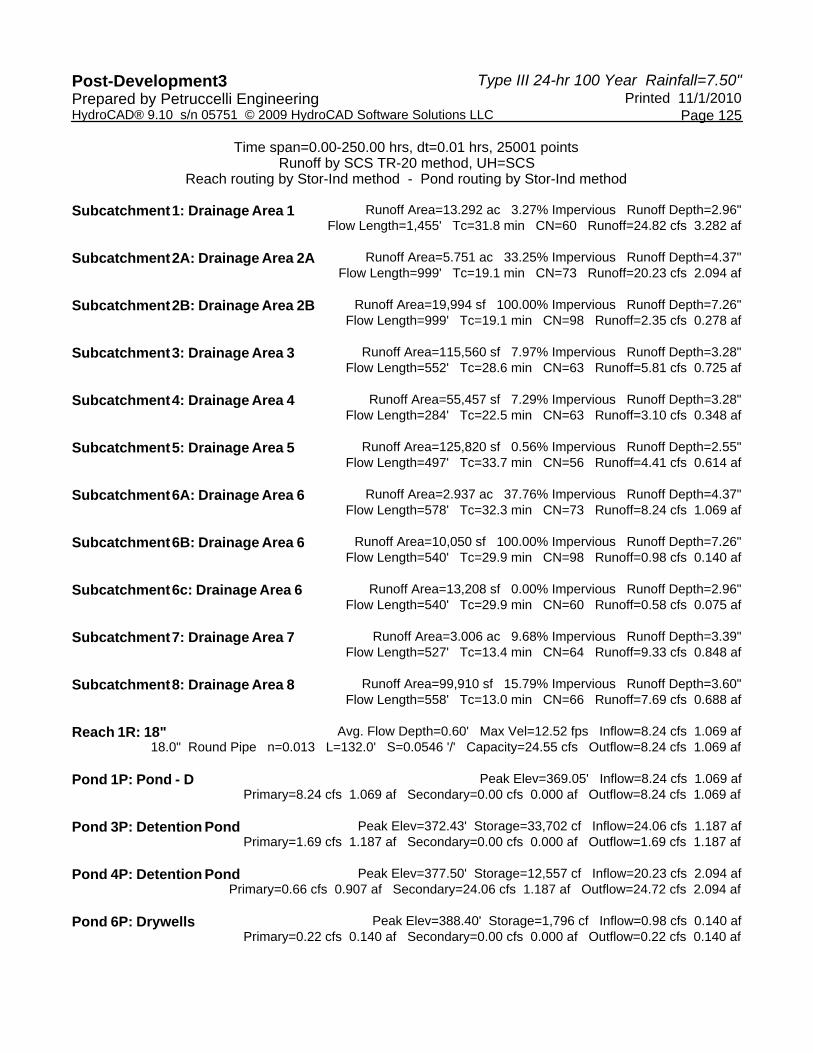
Type III 24-hr 100 Year Rainfall=7.50"Post-Development3 Printed 11/1/2010Prepared by Petruccelli Engineering
Page 125HydroCAD® 9.10 s/n 05751 © 2009 HydroCAD Software Solutions LLC
Time span=0.00-250.00 hrs, dt=0.01 hrs, 25001 pointsRunoff by SCS TR-20 method, UH=SCS
Reach routing by Stor-Ind method - Pond routing by Stor-Ind method
Runoff Area=13.292 ac 3.27% Impervious Runoff Depth=2.96"Subcatchment 1: Drainage Area 1 Flow Length=1,455' Tc=31.8 min CN=60 Runoff=24.82 cfs 3.282 af
Runoff Area=5.751 ac 33.25% Impervious Runoff Depth=4.37"Subcatchment 2A: Drainage Area 2A Flow Length=999' Tc=19.1 min CN=73 Runoff=20.23 cfs 2.094 af
Runoff Area=19,994 sf 100.00% Impervious Runoff Depth=7.26"Subcatchment 2B: Drainage Area 2B Flow Length=999' Tc=19.1 min CN=98 Runoff=2.35 cfs 0.278 af
Runoff Area=115,560 sf 7.97% Impervious Runoff Depth=3.28"Subcatchment 3: Drainage Area 3 Flow Length=552' Tc=28.6 min CN=63 Runoff=5.81 cfs 0.725 af
Runoff Area=55,457 sf 7.29% Impervious Runoff Depth=3.28"Subcatchment 4: Drainage Area 4 Flow Length=284' Tc=22.5 min CN=63 Runoff=3.10 cfs 0.348 af
Runoff Area=125,820 sf 0.56% Impervious Runoff Depth=2.55"Subcatchment 5: Drainage Area 5 Flow Length=497' Tc=33.7 min CN=56 Runoff=4.41 cfs 0.614 af
Runoff Area=2.937 ac 37.76% Impervious Runoff Depth=4.37"Subcatchment 6A: Drainage Area 6 Flow Length=578' Tc=32.3 min CN=73 Runoff=8.24 cfs 1.069 af
Runoff Area=10,050 sf 100.00% Impervious Runoff Depth=7.26"Subcatchment 6B: Drainage Area 6 Flow Length=540' Tc=29.9 min CN=98 Runoff=0.98 cfs 0.140 af
Runoff Area=13,208 sf 0.00% Impervious Runoff Depth=2.96"Subcatchment 6c: Drainage Area 6 Flow Length=540' Tc=29.9 min CN=60 Runoff=0.58 cfs 0.075 af
Runoff Area=3.006 ac 9.68% Impervious Runoff Depth=3.39"Subcatchment 7: Drainage Area 7 Flow Length=527' Tc=13.4 min CN=64 Runoff=9.33 cfs 0.848 af
Runoff Area=99,910 sf 15.79% Impervious Runoff Depth=3.60"Subcatchment 8: Drainage Area 8 Flow Length=558' Tc=13.0 min CN=66 Runoff=7.69 cfs 0.688 af
Avg. Flow Depth=0.60' Max Vel=12.52 fps Inflow=8.24 cfs 1.069 afReach 1R: 18"18.0" Round Pipe n=0.013 L=132.0' S=0.0546 '/' Capacity=24.55 cfs Outflow=8.24 cfs 1.069 af
Peak Elev=369.05' Inflow=8.24 cfs 1.069 afPond 1P: Pond - D Primary=8.24 cfs 1.069 af Secondary=0.00 cfs 0.000 af Outflow=8.24 cfs 1.069 af
Peak Elev=372.43' Storage=33,702 cf Inflow=24.06 cfs 1.187 afPond 3P: Detention Pond Primary=1.69 cfs 1.187 af Secondary=0.00 cfs 0.000 af Outflow=1.69 cfs 1.187 af
Peak Elev=377.50' Storage=12,557 cf Inflow=20.23 cfs 2.094 afPond 4P: Detention Pond Primary=0.66 cfs 0.907 af Secondary=24.06 cfs 1.187 af Outflow=24.72 cfs 2.094 af
Peak Elev=388.40' Storage=1,796 cf Inflow=0.98 cfs 0.140 afPond 6P: Drywells Primary=0.22 cfs 0.140 af Secondary=0.00 cfs 0.000 af Outflow=0.22 cfs 0.140 af
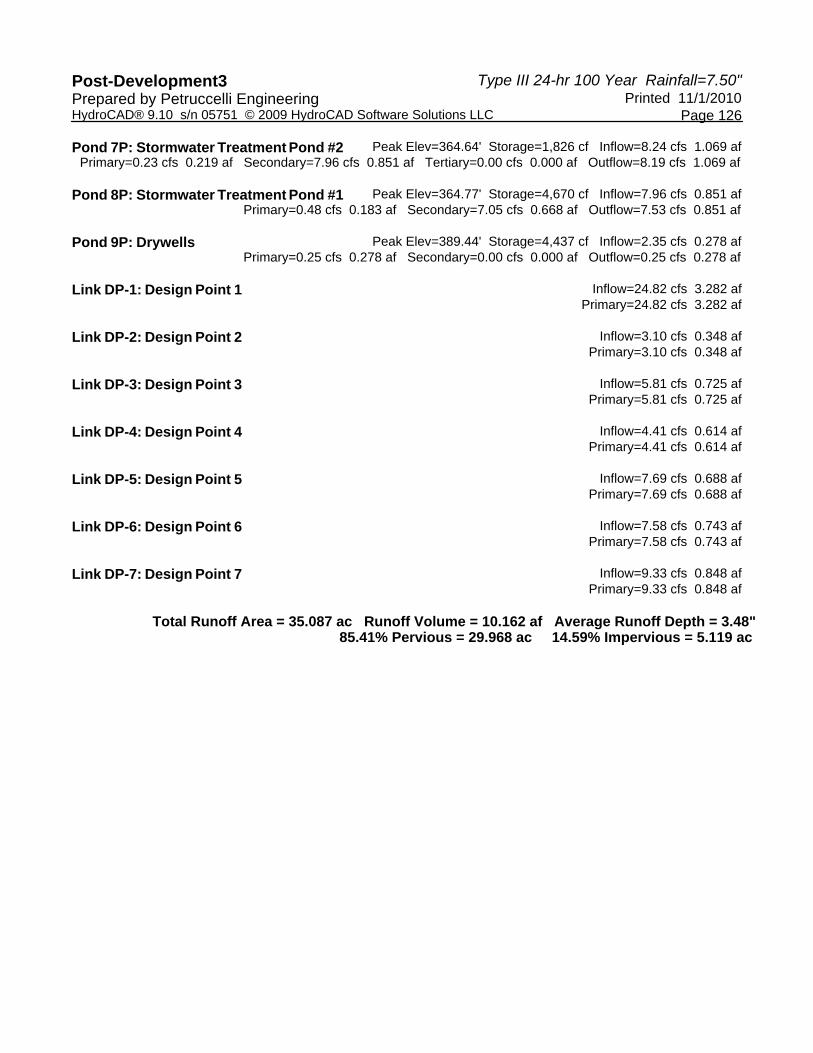
Type III 24-hr 100 Year Rainfall=7.50"Post-Development3 Printed 11/1/2010Prepared by Petruccelli Engineering
Page 126HydroCAD® 9.10 s/n 05751 © 2009 HydroCAD Software Solutions LLC
Peak Elev=364.64' Storage=1,826 cf Inflow=8.24 cfs 1.069 afPond 7P: Stormwater Treatment Pond #2 Primary=0.23 cfs 0.219 af Secondary=7.96 cfs 0.851 af Tertiary=0.00 cfs 0.000 af Outflow=8.19 cfs 1.069 af
Peak Elev=364.77' Storage=4,670 cf Inflow=7.96 cfs 0.851 afPond 8P: Stormwater Treatment Pond #1 Primary=0.48 cfs 0.183 af Secondary=7.05 cfs 0.668 af Outflow=7.53 cfs 0.851 af
Peak Elev=389.44' Storage=4,437 cf Inflow=2.35 cfs 0.278 afPond 9P: Drywells Primary=0.25 cfs 0.278 af Secondary=0.00 cfs 0.000 af Outflow=0.25 cfs 0.278 af
Inflow=24.82 cfs 3.282 afLink DP-1: Design Point 1 Primary=24.82 cfs 3.282 af
Inflow=3.10 cfs 0.348 afLink DP-2: Design Point 2 Primary=3.10 cfs 0.348 af
Inflow=5.81 cfs 0.725 afLink DP-3: Design Point 3 Primary=5.81 cfs 0.725 af
Inflow=4.41 cfs 0.614 afLink DP-4: Design Point 4 Primary=4.41 cfs 0.614 af
Inflow=7.69 cfs 0.688 afLink DP-5: Design Point 5 Primary=7.69 cfs 0.688 af
Inflow=7.58 cfs 0.743 afLink DP-6: Design Point 6 Primary=7.58 cfs 0.743 af
Inflow=9.33 cfs 0.848 afLink DP-7: Design Point 7 Primary=9.33 cfs 0.848 af
Total Runoff Area = 35.087 ac Runoff Volume = 10.162 af Average Runoff Depth = 3.48"85.41% Pervious = 29.968 ac 14.59% Impervious = 5.119 ac

Type III 24-hr 100 Year Rainfall=7.50"Post-Development3 Printed 11/1/2010Prepared by Petruccelli Engineering
Page 127HydroCAD® 9.10 s/n 05751 © 2009 HydroCAD Software Solutions LLC
Summary for Subcatchment 1: Drainage Area 1
Runoff = 24.82 cfs @ 12.47 hrs, Volume= 3.282 af, Depth= 2.96"
Runoff by SCS TR-20 method, UH=SCS, Time Span= 0.00-250.00 hrs, dt= 0.01 hrsType III 24-hr 100 Year Rainfall=7.50"
Area (ac) CN Description2.770 69 50-75% Grass cover, Fair, HSG B0.435 98 Paved roads w/curbs & sewers9.824 55 Woods, Good, HSG B0.263 82 Dirt roads, HSG B
13.292 60 Weighted Average12.857 96.73% Pervious Area
0.435 3.27% Impervious Area
Tc Length Slope Velocity Capacity Description(min) (feet) (ft/ft) (ft/sec) (cfs)18.9 100 0.0260 0.09 Sheet Flow, 1 to 2
Grass: Bermuda n= 0.410 P2= 3.50"1.7 216 0.1830 2.14 Shallow Concentrated Flow, 2 to 3
Woodland Kv= 5.0 fps0.3 78 0.0450 4.31 Shallow Concentrated Flow, 3 to 4
Paved Kv= 20.3 fps1.2 121 0.1150 1.70 Shallow Concentrated Flow, 4 to 5
Woodland Kv= 5.0 fps5.8 679 0.0770 1.94 Shallow Concentrated Flow, 5 to 6
Short Grass Pasture Kv= 7.0 fps3.9 261 0.0500 1.12 Shallow Concentrated Flow, 6 to DP1
Woodland Kv= 5.0 fps31.8 1,455 Total
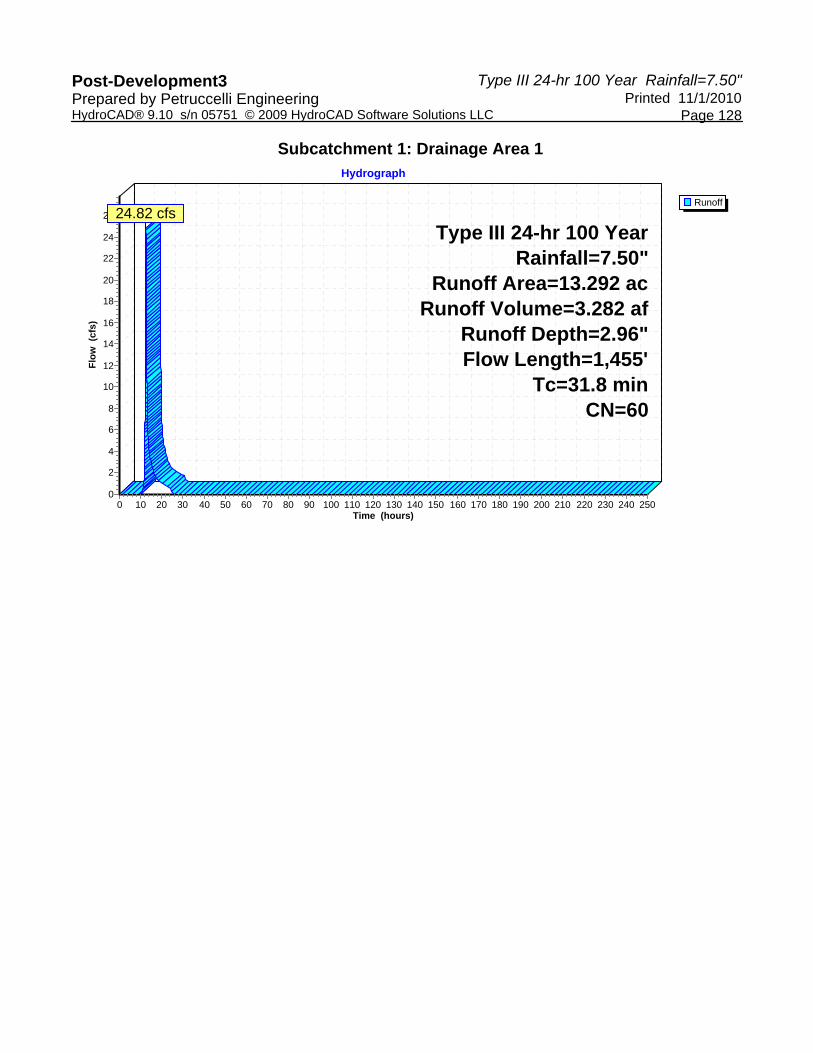
Type III 24-hr 100 Year Rainfall=7.50"Post-Development3 Printed 11/1/2010Prepared by Petruccelli Engineering
Page 128HydroCAD® 9.10 s/n 05751 © 2009 HydroCAD Software Solutions LLC
Subcatchment 1: Drainage Area 1
Runoff
Hydrograph
Time (hours)2502402302202102001901801701601501401301201101009080706050403020100
Flow
(cf
s)
26
24
22
20
18
16
14
12
10
8
6
4
2
0
Type III 24-hr 100 YearRainfall=7.50"
Runoff Area=13.292 acRunoff Volume=3.282 af
Runoff Depth=2.96"Flow Length=1,455'
Tc=31.8 minCN=60
24.82 cfs

Type III 24-hr 100 Year Rainfall=7.50"Post-Development3 Printed 11/1/2010Prepared by Petruccelli Engineering
Page 129HydroCAD® 9.10 s/n 05751 © 2009 HydroCAD Software Solutions LLC
Summary for Subcatchment 2A: Drainage Area 2A
Runoff = 20.23 cfs @ 12.26 hrs, Volume= 2.094 af, Depth= 4.37"
Runoff by SCS TR-20 method, UH=SCS, Time Span= 0.00-250.00 hrs, dt= 0.01 hrsType III 24-hr 100 Year Rainfall=7.50"
Area (ac) CN Description1.912 98 Paved roads w/curbs & sewers3.319 61 >75% Grass cover, Good, HSG B0.520 55 Woods, Good, HSG B5.751 73 Weighted Average3.839 66.75% Pervious Area1.912 33.25% Impervious Area
Tc Length Slope Velocity Capacity Description(min) (feet) (ft/ft) (ft/sec) (cfs)11.5 100 0.0900 0.15 Sheet Flow, 1 to 2
Grass: Bermuda n= 0.410 P2= 3.50"5.8 423 0.0300 1.21 Shallow Concentrated Flow, 2 to 3
Short Grass Pasture Kv= 7.0 fps0.5 74 0.0140 2.40 Shallow Concentrated Flow, 3 to 4 (Road)
Paved Kv= 20.3 fps0.1 25 0.0100 4.54 3.56 Pipe Channel, 4 to 5
12.0" Round Area= 0.8 sf Perim= 3.1' r= 0.25'n= 0.013 Corrugated PE, smooth interior
0.6 167 0.0120 4.97 3.90 Pipe Channel, 5 to 612.0" Round Area= 0.8 sf Perim= 3.1' r= 0.25'n= 0.013 Corrugated PE, smooth interior
0.4 70 0.0090 2.60 3.19 Pipe Channel, 6 to 715.0" Round Area= 1.2 sf Perim= 3.9' r= 0.31'n= 0.025 Corrugated metal
0.2 140 0.1510 12.01 21.23 Pipe Channel, 7 to 818.0" Round Area= 1.8 sf Perim= 4.7' r= 0.38'n= 0.025 Corrugated metal
19.1 999 Total

Type III 24-hr 100 Year Rainfall=7.50"Post-Development3 Printed 11/1/2010Prepared by Petruccelli Engineering
Page 130HydroCAD® 9.10 s/n 05751 © 2009 HydroCAD Software Solutions LLC
Subcatchment 2A: Drainage Area 2A
Runoff
Hydrograph
Time (hours)2502402302202102001901801701601501401301201101009080706050403020100
Flow
(cf
s)
22212019181716151413121110
9876543210
Type III 24-hr 100 YearRainfall=7.50"
Runoff Area=5.751 acRunoff Volume=2.094 af
Runoff Depth=4.37"Flow Length=999'
Tc=19.1 minCN=73
20.23 cfs

Type III 24-hr 100 Year Rainfall=7.50"Post-Development3 Printed 11/1/2010Prepared by Petruccelli Engineering
Page 131HydroCAD® 9.10 s/n 05751 © 2009 HydroCAD Software Solutions LLC
Summary for Subcatchment 2B: Drainage Area 2B
Runoff = 2.35 cfs @ 12.25 hrs, Volume= 0.278 af, Depth= 7.26"
Runoff by SCS TR-20 method, UH=SCS, Time Span= 0.00-250.00 hrs, dt= 0.01 hrsType III 24-hr 100 Year Rainfall=7.50"
Area (sf) CN Description19,994 98 Paved roads w/curbs & sewers19,994 100.00% Impervious Area
Tc Length Slope Velocity Capacity Description(min) (feet) (ft/ft) (ft/sec) (cfs)11.5 100 0.0900 0.15 Sheet Flow, 1 to 2
Grass: Bermuda n= 0.410 P2= 3.50"5.8 423 0.0300 1.21 Shallow Concentrated Flow, 2 to 3
Short Grass Pasture Kv= 7.0 fps0.5 74 0.0140 2.40 Shallow Concentrated Flow, 3 to 4 (Road)
Paved Kv= 20.3 fps0.1 25 0.0100 4.54 3.56 Pipe Channel, 4 to 5
12.0" Round Area= 0.8 sf Perim= 3.1' r= 0.25'n= 0.013 Corrugated PE, smooth interior
0.6 167 0.0120 4.97 3.90 Pipe Channel, 5 to 612.0" Round Area= 0.8 sf Perim= 3.1' r= 0.25'n= 0.013 Corrugated PE, smooth interior
0.4 70 0.0090 2.60 3.19 Pipe Channel, 6 to 715.0" Round Area= 1.2 sf Perim= 3.9' r= 0.31'n= 0.025 Corrugated metal
0.2 140 0.1510 12.01 21.23 Pipe Channel, 7 to 818.0" Round Area= 1.8 sf Perim= 4.7' r= 0.38'n= 0.025 Corrugated metal
19.1 999 Total
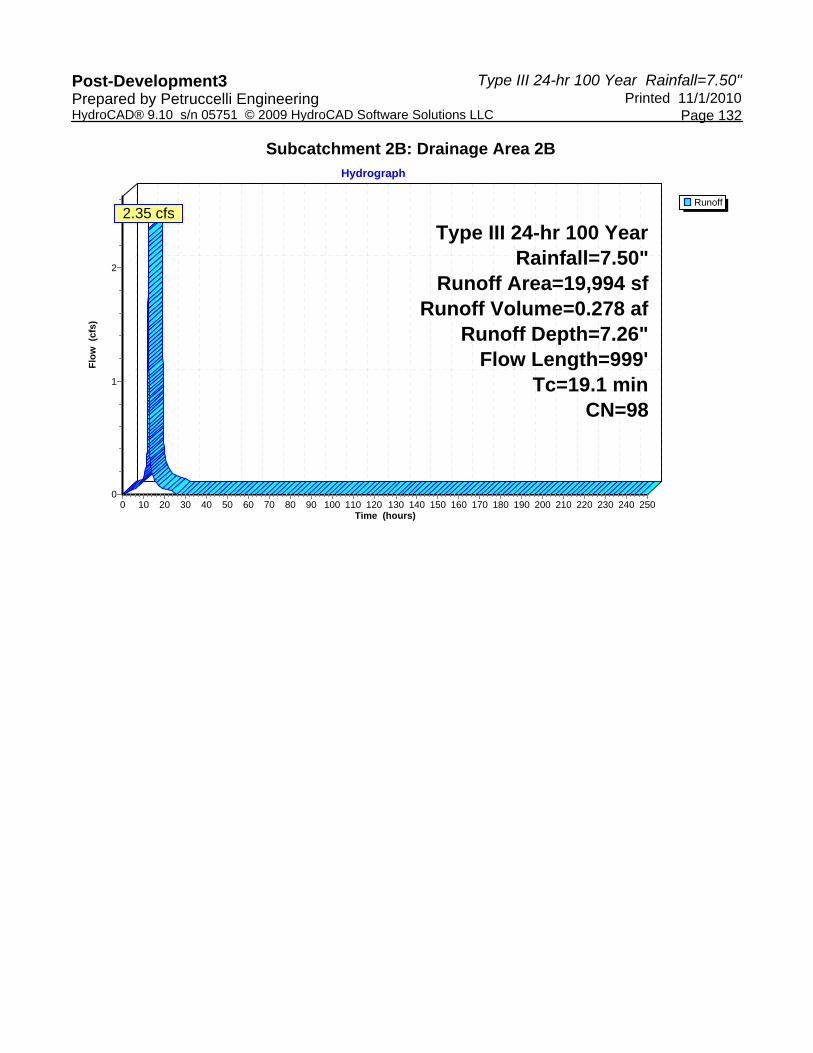
Type III 24-hr 100 Year Rainfall=7.50"Post-Development3 Printed 11/1/2010Prepared by Petruccelli Engineering
Page 132HydroCAD® 9.10 s/n 05751 © 2009 HydroCAD Software Solutions LLC
Subcatchment 2B: Drainage Area 2B
Runoff
Hydrograph
Time (hours)2502402302202102001901801701601501401301201101009080706050403020100
Flow
(cf
s)
2
1
0
Type III 24-hr 100 YearRainfall=7.50"
Runoff Area=19,994 sfRunoff Volume=0.278 af
Runoff Depth=7.26"Flow Length=999'
Tc=19.1 minCN=98
2.35 cfs
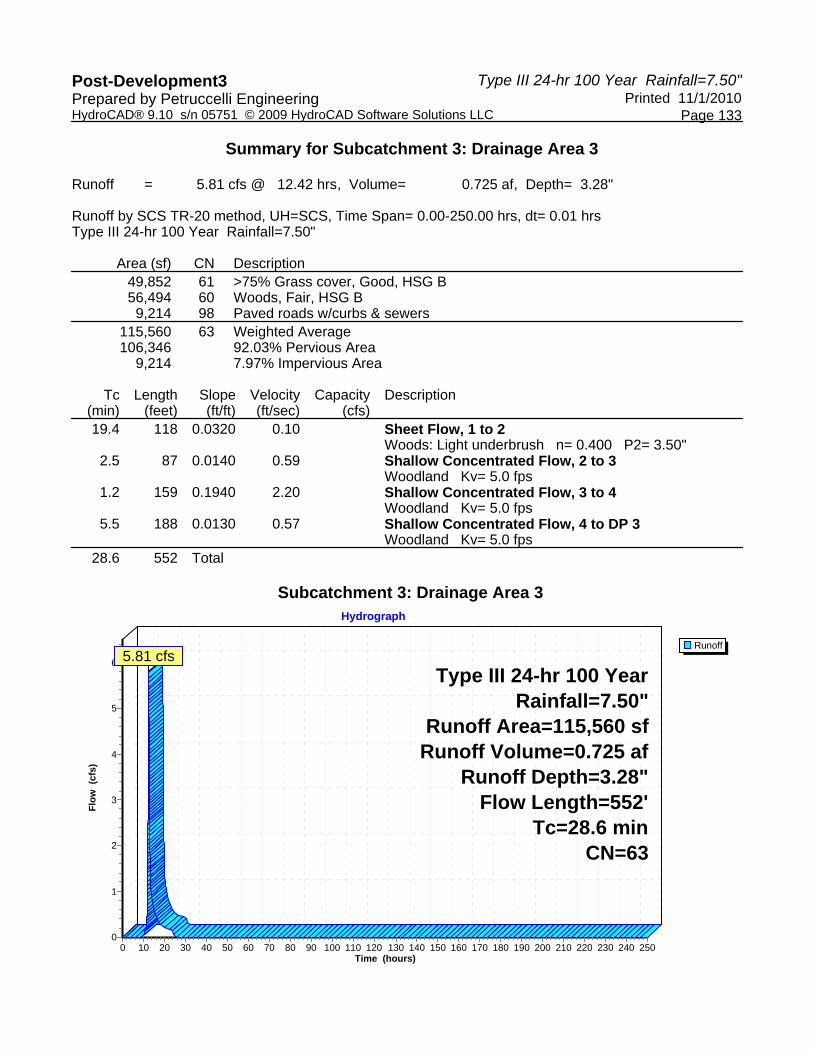
Type III 24-hr 100 Year Rainfall=7.50"Post-Development3 Printed 11/1/2010Prepared by Petruccelli Engineering
Page 133HydroCAD® 9.10 s/n 05751 © 2009 HydroCAD Software Solutions LLC
Summary for Subcatchment 3: Drainage Area 3
Runoff = 5.81 cfs @ 12.42 hrs, Volume= 0.725 af, Depth= 3.28"
Runoff by SCS TR-20 method, UH=SCS, Time Span= 0.00-250.00 hrs, dt= 0.01 hrsType III 24-hr 100 Year Rainfall=7.50"
Area (sf) CN Description49,852 61 >75% Grass cover, Good, HSG B56,494 60 Woods, Fair, HSG B
9,214 98 Paved roads w/curbs & sewers115,560 63 Weighted Average106,346 92.03% Pervious Area
9,214 7.97% Impervious Area
Tc Length Slope Velocity Capacity Description(min) (feet) (ft/ft) (ft/sec) (cfs)19.4 118 0.0320 0.10 Sheet Flow, 1 to 2
Woods: Light underbrush n= 0.400 P2= 3.50"2.5 87 0.0140 0.59 Shallow Concentrated Flow, 2 to 3
Woodland Kv= 5.0 fps1.2 159 0.1940 2.20 Shallow Concentrated Flow, 3 to 4
Woodland Kv= 5.0 fps5.5 188 0.0130 0.57 Shallow Concentrated Flow, 4 to DP 3
Woodland Kv= 5.0 fps28.6 552 Total
Subcatchment 3: Drainage Area 3
Runoff
Hydrograph
Time (hours)2502402302202102001901801701601501401301201101009080706050403020100
Flow
(cf
s)
6
5
4
3
2
1
0
Type III 24-hr 100 YearRainfall=7.50"
Runoff Area=115,560 sfRunoff Volume=0.725 af
Runoff Depth=3.28"Flow Length=552'
Tc=28.6 minCN=63
5.81 cfs
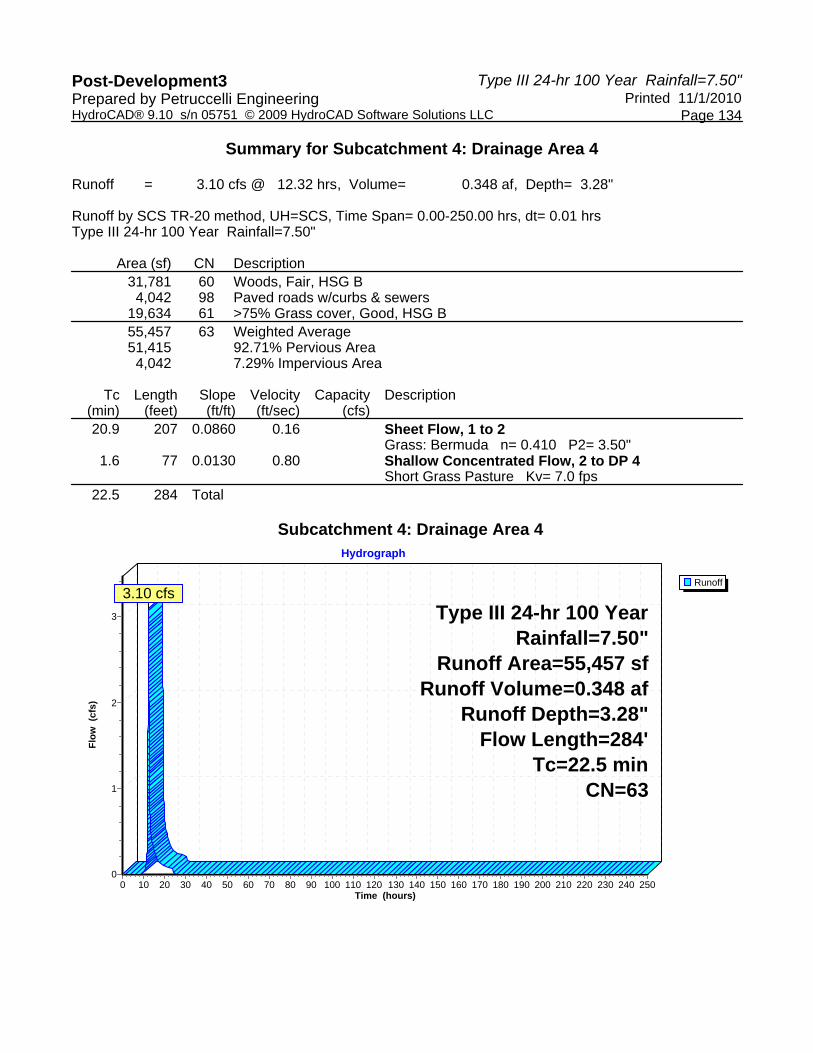
Type III 24-hr 100 Year Rainfall=7.50"Post-Development3 Printed 11/1/2010Prepared by Petruccelli Engineering
Page 134HydroCAD® 9.10 s/n 05751 © 2009 HydroCAD Software Solutions LLC
Summary for Subcatchment 4: Drainage Area 4
Runoff = 3.10 cfs @ 12.32 hrs, Volume= 0.348 af, Depth= 3.28"
Runoff by SCS TR-20 method, UH=SCS, Time Span= 0.00-250.00 hrs, dt= 0.01 hrsType III 24-hr 100 Year Rainfall=7.50"
Area (sf) CN Description31,781 60 Woods, Fair, HSG B
4,042 98 Paved roads w/curbs & sewers19,634 61 >75% Grass cover, Good, HSG B55,457 63 Weighted Average51,415 92.71% Pervious Area
4,042 7.29% Impervious Area
Tc Length Slope Velocity Capacity Description(min) (feet) (ft/ft) (ft/sec) (cfs)20.9 207 0.0860 0.16 Sheet Flow, 1 to 2
Grass: Bermuda n= 0.410 P2= 3.50"1.6 77 0.0130 0.80 Shallow Concentrated Flow, 2 to DP 4
Short Grass Pasture Kv= 7.0 fps22.5 284 Total
Subcatchment 4: Drainage Area 4
Runoff
Hydrograph
Time (hours)2502402302202102001901801701601501401301201101009080706050403020100
Flow
(cf
s)
3
2
1
0
Type III 24-hr 100 YearRainfall=7.50"
Runoff Area=55,457 sfRunoff Volume=0.348 af
Runoff Depth=3.28"Flow Length=284'
Tc=22.5 minCN=63
3.10 cfs
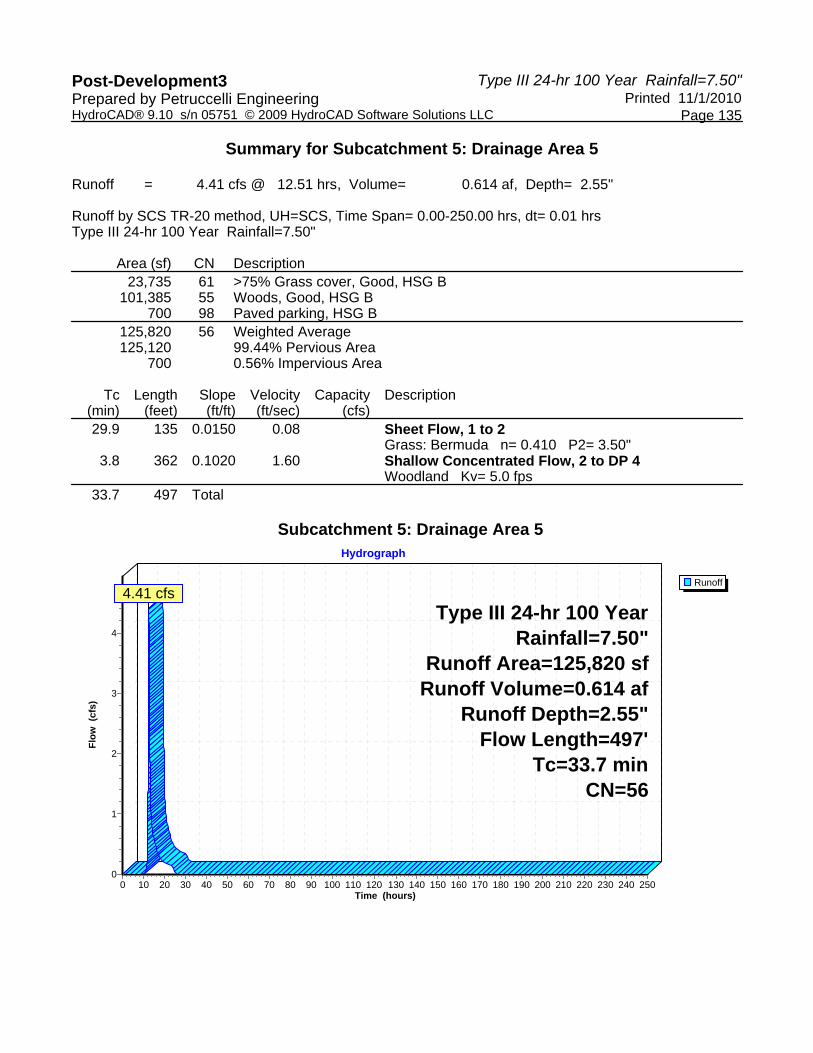
Type III 24-hr 100 Year Rainfall=7.50"Post-Development3 Printed 11/1/2010Prepared by Petruccelli Engineering
Page 135HydroCAD® 9.10 s/n 05751 © 2009 HydroCAD Software Solutions LLC
Summary for Subcatchment 5: Drainage Area 5
Runoff = 4.41 cfs @ 12.51 hrs, Volume= 0.614 af, Depth= 2.55"
Runoff by SCS TR-20 method, UH=SCS, Time Span= 0.00-250.00 hrs, dt= 0.01 hrsType III 24-hr 100 Year Rainfall=7.50"
Area (sf) CN Description23,735 61 >75% Grass cover, Good, HSG B
101,385 55 Woods, Good, HSG B700 98 Paved parking, HSG B
125,820 56 Weighted Average125,120 99.44% Pervious Area
700 0.56% Impervious Area
Tc Length Slope Velocity Capacity Description(min) (feet) (ft/ft) (ft/sec) (cfs)29.9 135 0.0150 0.08 Sheet Flow, 1 to 2
Grass: Bermuda n= 0.410 P2= 3.50"3.8 362 0.1020 1.60 Shallow Concentrated Flow, 2 to DP 4
Woodland Kv= 5.0 fps33.7 497 Total
Subcatchment 5: Drainage Area 5
Runoff
Hydrograph
Time (hours)2502402302202102001901801701601501401301201101009080706050403020100
Flow
(cf
s)
4
3
2
1
0
Type III 24-hr 100 YearRainfall=7.50"
Runoff Area=125,820 sfRunoff Volume=0.614 af
Runoff Depth=2.55"Flow Length=497'
Tc=33.7 minCN=56
4.41 cfs
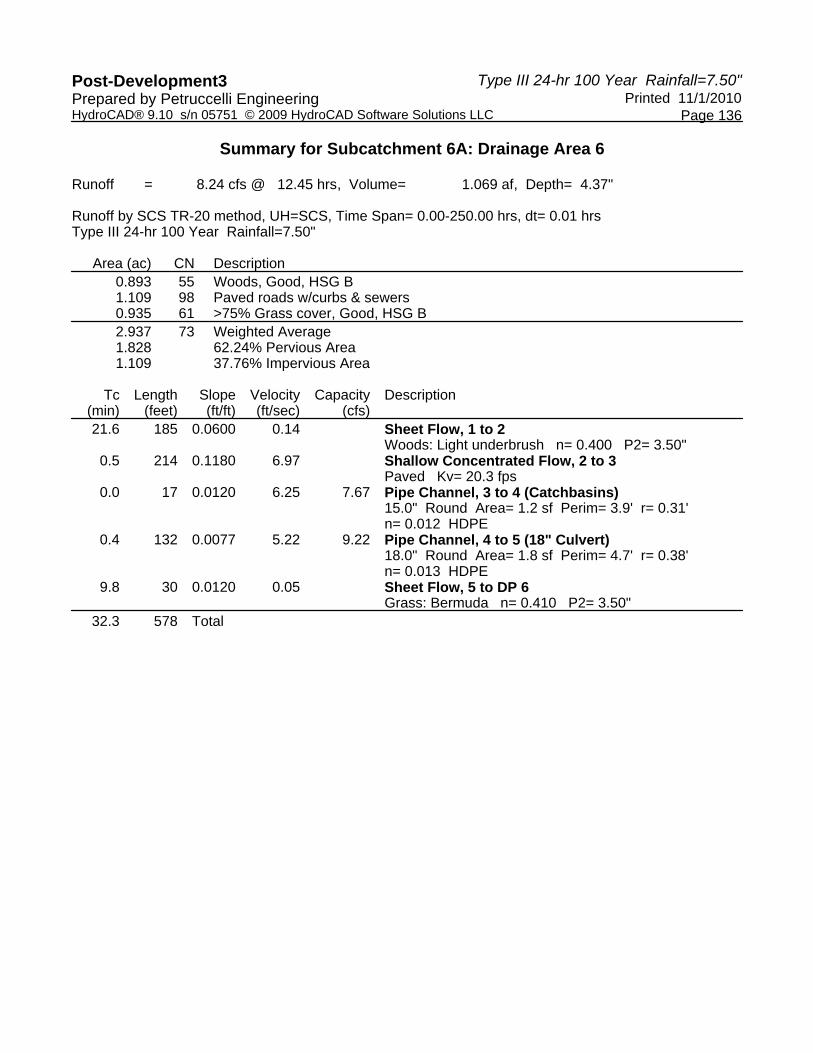
Type III 24-hr 100 Year Rainfall=7.50"Post-Development3 Printed 11/1/2010Prepared by Petruccelli Engineering
Page 136HydroCAD® 9.10 s/n 05751 © 2009 HydroCAD Software Solutions LLC
Summary for Subcatchment 6A: Drainage Area 6
Runoff = 8.24 cfs @ 12.45 hrs, Volume= 1.069 af, Depth= 4.37"
Runoff by SCS TR-20 method, UH=SCS, Time Span= 0.00-250.00 hrs, dt= 0.01 hrsType III 24-hr 100 Year Rainfall=7.50"
Area (ac) CN Description0.893 55 Woods, Good, HSG B1.109 98 Paved roads w/curbs & sewers0.935 61 >75% Grass cover, Good, HSG B2.937 73 Weighted Average1.828 62.24% Pervious Area1.109 37.76% Impervious Area
Tc Length Slope Velocity Capacity Description(min) (feet) (ft/ft) (ft/sec) (cfs)21.6 185 0.0600 0.14 Sheet Flow, 1 to 2
Woods: Light underbrush n= 0.400 P2= 3.50"0.5 214 0.1180 6.97 Shallow Concentrated Flow, 2 to 3
Paved Kv= 20.3 fps0.0 17 0.0120 6.25 7.67 Pipe Channel, 3 to 4 (Catchbasins)
15.0" Round Area= 1.2 sf Perim= 3.9' r= 0.31'n= 0.012 HDPE
0.4 132 0.0077 5.22 9.22 Pipe Channel, 4 to 5 (18" Culvert)18.0" Round Area= 1.8 sf Perim= 4.7' r= 0.38'n= 0.013 HDPE
9.8 30 0.0120 0.05 Sheet Flow, 5 to DP 6Grass: Bermuda n= 0.410 P2= 3.50"
32.3 578 Total

Type III 24-hr 100 Year Rainfall=7.50"Post-Development3 Printed 11/1/2010Prepared by Petruccelli Engineering
Page 137HydroCAD® 9.10 s/n 05751 © 2009 HydroCAD Software Solutions LLC
Subcatchment 6A: Drainage Area 6
Runoff
Hydrograph
Time (hours)2502402302202102001901801701601501401301201101009080706050403020100
Flow
(cf
s)
9
8
7
6
5
4
3
2
1
0
Type III 24-hr 100 YearRainfall=7.50"
Runoff Area=2.937 acRunoff Volume=1.069 af
Runoff Depth=4.37"Flow Length=578'
Tc=32.3 minCN=73
8.24 cfs

Type III 24-hr 100 Year Rainfall=7.50"Post-Development3 Printed 11/1/2010Prepared by Petruccelli Engineering
Page 138HydroCAD® 9.10 s/n 05751 © 2009 HydroCAD Software Solutions LLC
Summary for Subcatchment 6B: Drainage Area 6
Runoff = 0.98 cfs @ 12.39 hrs, Volume= 0.140 af, Depth= 7.26"
Runoff by SCS TR-20 method, UH=SCS, Time Span= 0.00-250.00 hrs, dt= 0.01 hrsType III 24-hr 100 Year Rainfall=7.50"
Area (sf) CN Description10,050 98 Paved roads w/curbs & sewers10,050 100.00% Impervious Area
Tc Length Slope Velocity Capacity Description(min) (feet) (ft/ft) (ft/sec) (cfs)21.6 185 0.0600 0.14 Sheet Flow, 1 to 2
Woods: Light underbrush n= 0.400 P2= 3.50"0.5 214 0.1180 6.97 Shallow Concentrated Flow, 2 to 3
Paved Kv= 20.3 fps0.0 17 0.0120 6.25 7.67 Pipe Channel, 3 to 4 (Catchbasins)
15.0" Round Area= 1.2 sf Perim= 3.9' r= 0.31'n= 0.012 HDPE
0.1 101 0.1730 24.72 43.69 Pipe Channel, 4 to 5 (18" Culvert)18.0" Round Area= 1.8 sf Perim= 4.7' r= 0.38'n= 0.013 HDPE
7.7 23 0.0130 0.05 Sheet Flow, 5 to DP 6Grass: Bermuda n= 0.410 P2= 3.50"
29.9 540 Total
Subcatchment 6B: Drainage Area 6
Runoff
Hydrograph
Time (hours)2502402302202102001901801701601501401301201101009080706050403020100
Flow
(cf
s)
1
0
Type III 24-hr 100 YearRainfall=7.50"
Runoff Area=10,050 sfRunoff Volume=0.140 af
Runoff Depth=7.26"Flow Length=540'
Tc=29.9 minCN=98
0.98 cfs

Type III 24-hr 100 Year Rainfall=7.50"Post-Development3 Printed 11/1/2010Prepared by Petruccelli Engineering
Page 139HydroCAD® 9.10 s/n 05751 © 2009 HydroCAD Software Solutions LLC
Summary for Subcatchment 6c: Drainage Area 6
Runoff = 0.58 cfs @ 12.45 hrs, Volume= 0.075 af, Depth= 2.96"
Runoff by SCS TR-20 method, UH=SCS, Time Span= 0.00-250.00 hrs, dt= 0.01 hrsType III 24-hr 100 Year Rainfall=7.50"
Area (sf) CN Description13,208 60 Woods, Fair, HSG B13,208 100.00% Pervious Area
Tc Length Slope Velocity Capacity Description(min) (feet) (ft/ft) (ft/sec) (cfs)21.6 185 0.0600 0.14 Sheet Flow, 1 to 2
Woods: Light underbrush n= 0.400 P2= 3.50"0.5 214 0.1180 6.97 Shallow Concentrated Flow, 2 to 3
Paved Kv= 20.3 fps0.0 17 0.0120 6.25 7.67 Pipe Channel, 3 to 4 (Catchbasins)
15.0" Round Area= 1.2 sf Perim= 3.9' r= 0.31'n= 0.012 HDPE
0.1 101 0.1730 24.72 43.69 Pipe Channel, 4 to 5 (18" Culvert)18.0" Round Area= 1.8 sf Perim= 4.7' r= 0.38'n= 0.013 HDPE
7.7 23 0.0130 0.05 Sheet Flow, 5 to DP 6Grass: Bermuda n= 0.410 P2= 3.50"
29.9 540 Total
Subcatchment 6c: Drainage Area 6
Runoff
Hydrograph
Time (hours)2502402302202102001901801701601501401301201101009080706050403020100
Flow
(cf
s)
0.65
0.6
0.55
0.5
0.45
0.4
0.35
0.3
0.25
0.2
0.15
0.1
0.05
0
Type III 24-hr 100 YearRainfall=7.50"
Runoff Area=13,208 sfRunoff Volume=0.075 af
Runoff Depth=2.96"Flow Length=540'
Tc=29.9 minCN=60
0.58 cfs

Type III 24-hr 100 Year Rainfall=7.50"Post-Development3 Printed 11/1/2010Prepared by Petruccelli Engineering
Page 140HydroCAD® 9.10 s/n 05751 © 2009 HydroCAD Software Solutions LLC
Summary for Subcatchment 7: Drainage Area 7
Runoff = 9.33 cfs @ 12.19 hrs, Volume= 0.848 af, Depth= 3.39"
Runoff by SCS TR-20 method, UH=SCS, Time Span= 0.00-250.00 hrs, dt= 0.01 hrsType III 24-hr 100 Year Rainfall=7.50"
Area (ac) CN Description1.340 60 Woods, Fair, HSG B0.291 98 Paved roads w/curbs & sewers1.375 61 >75% Grass cover, Good, HSG B3.006 64 Weighted Average2.715 90.32% Pervious Area0.291 9.68% Impervious Area
Tc Length Slope Velocity Capacity Description(min) (feet) (ft/ft) (ft/sec) (cfs)10.1 117 0.1620 0.19 Sheet Flow, 1 to 2
Woods: Light underbrush n= 0.400 P2= 3.50"0.7 100 0.2300 2.40 Shallow Concentrated Flow, 2 to 3
Woodland Kv= 5.0 fps1.2 164 0.2010 2.24 Shallow Concentrated Flow, 3 to 4
Woodland Kv= 5.0 fps1.4 146 0.1230 1.75 Shallow Concentrated Flow, 3 to DP 7
Woodland Kv= 5.0 fps13.4 527 Total
Subcatchment 7: Drainage Area 7
Runoff
Hydrograph
Time (hours)2502402302202102001901801701601501401301201101009080706050403020100
Flow
(cf
s)
10
9
8
7
6
5
4
3
2
1
0
Type III 24-hr 100 YearRainfall=7.50"
Runoff Area=3.006 acRunoff Volume=0.848 af
Runoff Depth=3.39"Flow Length=527'
Tc=13.4 minCN=64
9.33 cfs

Type III 24-hr 100 Year Rainfall=7.50"Post-Development3 Printed 11/1/2010Prepared by Petruccelli Engineering
Page 141HydroCAD® 9.10 s/n 05751 © 2009 HydroCAD Software Solutions LLC
Summary for Subcatchment 8: Drainage Area 8
Runoff = 7.69 cfs @ 12.18 hrs, Volume= 0.688 af, Depth= 3.60"
Runoff by SCS TR-20 method, UH=SCS, Time Span= 0.00-250.00 hrs, dt= 0.01 hrsType III 24-hr 100 Year Rainfall=7.50"
Area (sf) CN Description41,570 60 Woods, Fair, HSG B15,772 98 Paved roads w/curbs & sewers42,568 61 >75% Grass cover, Good, HSG B99,910 66 Weighted Average84,138 84.21% Pervious Area15,772 15.79% Impervious Area
Tc Length Slope Velocity Capacity Description(min) (feet) (ft/ft) (ft/sec) (cfs)
9.7 100 0.1300 0.17 Sheet Flow, 1 to 2Woods: Light underbrush n= 0.400 P2= 3.50"
3.1 362 0.1550 1.97 Shallow Concentrated Flow, 2 to 3Woodland Kv= 5.0 fps
0.2 96 0.1150 6.88 Shallow Concentrated Flow, 3 to DP 8Paved Kv= 20.3 fps
13.0 558 Total
Subcatchment 8: Drainage Area 8
Runoff
Hydrograph
Time (hours)2502402302202102001901801701601501401301201101009080706050403020100
Flow
(cf
s)
8
7
6
5
4
3
2
1
0
Type III 24-hr 100 YearRainfall=7.50"
Runoff Area=99,910 sfRunoff Volume=0.688 af
Runoff Depth=3.60"Flow Length=558'
Tc=13.0 minCN=66
7.69 cfs

Type III 24-hr 100 Year Rainfall=7.50"Post-Development3 Printed 11/1/2010Prepared by Petruccelli Engineering
Page 142HydroCAD® 9.10 s/n 05751 © 2009 HydroCAD Software Solutions LLC
Summary for Reach 1R: 18"
Inflow Area = 2.937 ac, 37.76% Impervious, Inflow Depth = 4.37" for 100 Year eventInflow = 8.24 cfs @ 12.45 hrs, Volume= 1.069 afOutflow = 8.24 cfs @ 12.45 hrs, Volume= 1.069 af, Atten= 0%, Lag= 0.2 min
Routing by Stor-Ind method, Time Span= 0.00-250.00 hrs, dt= 0.01 hrsMax. Velocity= 12.52 fps, Min. Travel Time= 0.2 minAvg. Velocity = 5.05 fps, Avg. Travel Time= 0.4 min
Peak Storage= 87 cf @ 12.45 hrsAverage Depth at Peak Storage= 0.60'Bank-Full Depth= 1.50', Capacity at Bank-Full= 24.55 cfs
18.0" Round Pipen= 0.013 Corrugated PE, smooth interiorLength= 132.0' Slope= 0.0546 '/'Inlet Invert= 374.01', Outlet Invert= 366.80'
Reach 1R: 18"
InflowOutflow
Hydrograph
Time (hours)2502402302202102001901801701601501401301201101009080706050403020100
Flow
(cf
s)
9
8
7
6
5
4
3
2
1
0
Inflow Area=2.937 acAvg. Flow Depth=0.60'
Max Vel=12.52 fps18.0"
Round Pipen=0.013L=132.0'
S=0.0546 '/'Capacity=24.55 cfs
8.24 cfs8.24 cfs

Type III 24-hr 100 Year Rainfall=7.50"Post-Development3 Printed 11/1/2010Prepared by Petruccelli Engineering
Page 143HydroCAD® 9.10 s/n 05751 © 2009 HydroCAD Software Solutions LLC
Summary for Pond 1P: Pond - D
Inflow Area = 2.937 ac, 37.76% Impervious, Inflow Depth = 4.37" for 100 Year eventInflow = 8.24 cfs @ 12.45 hrs, Volume= 1.069 afOutflow = 8.24 cfs @ 12.45 hrs, Volume= 1.069 af, Atten= 0%, Lag= 0.0 minPrimary = 8.24 cfs @ 12.45 hrs, Volume= 1.069 afSecondary = 0.00 cfs @ 0.00 hrs, Volume= 0.000 af
Routing by Stor-Ind method, Time Span= 0.00-250.00 hrs, dt= 0.01 hrsPeak Elev= 369.05' @ 12.45 hrs
Device Routing Invert Outlet Devices#1 Primary 366.80' 18.0" Round Culvert
L= 6.0' CMP, projecting, no headwall, Ke= 0.900 Inlet / Outlet Invert= 366.80' / 361.00' S= 0.9667 '/' Cc= 0.900 n= 0.025 Corrugated metal
#2 Secondary 371.19' 57.0" W x 57.0" H Vert. Orifice/Grate C= 0.600
Primary OutFlow Max=8.23 cfs @ 12.45 hrs HW=369.05' (Free Discharge)1=Culvert (Inlet Controls 8.23 cfs @ 4.66 fps)
Secondary OutFlow Max=0.00 cfs @ 0.00 hrs HW=366.80' (Free Discharge)2=Orifice/Grate ( Controls 0.00 cfs)
Pond 1P: Pond - D
InflowOutflowPrimarySecondary
Hydrograph
Time (hours)2502402302202102001901801701601501401301201101009080706050403020100
Flow
(cf
s)
9
8
7
6
5
4
3
2
1
0
Inflow Area=2.937 acPeak Elev=369.05'
8.24 cfs8.24 cfs
8.24 cfs
0.00 cfs

Type III 24-hr 100 Year Rainfall=7.50"Post-Development3 Printed 11/1/2010Prepared by Petruccelli Engineering
Page 144HydroCAD® 9.10 s/n 05751 © 2009 HydroCAD Software Solutions LLC
Summary for Pond 3P: Detention Pond
Inflow = 24.06 cfs @ 12.26 hrs, Volume= 1.187 afOutflow = 1.69 cfs @ 13.64 hrs, Volume= 1.187 af, Atten= 93%, Lag= 82.5 minPrimary = 1.69 cfs @ 13.64 hrs, Volume= 1.187 afSecondary = 0.00 cfs @ 0.00 hrs, Volume= 0.000 af
Routing by Stor-Ind method, Time Span= 0.00-250.00 hrs, dt= 0.01 hrsPeak Elev= 372.43' @ 13.64 hrs Surf.Area= 7,320 sf Storage= 33,702 cf
Plug-Flow detention time= 255.3 min calculated for 1.187 af (100% of inflow)Center-of-Mass det. time= 255.3 min ( 1,033.8 - 778.5 )
Volume Invert Avail.Storage Storage Description#1 363.00' 39,443 cf Custom Stage Data (Prismatic) Listed below (Recalc)
Elevation Surf.Area Inc.Store Cum.Store(feet) (sq-ft) (cubic-feet) (cubic-feet)
363.00 0 0 0364.00 1,137 569 569366.00 2,172 3,309 3,878368.00 3,441 5,613 9,491370.00 5,233 8,674 18,165372.00 7,184 12,417 30,582373.00 7,500 7,342 37,924373.20 7,700 1,520 39,443
Device Routing Invert Outlet Devices#1 Primary 363.00' 10.000 in/hr Exfiltration over Surface area #2 Secondary 373.00' 208.0' long x 10.0' breadth Broad-Crested Rectangular Weir
Head (feet) 0.20 0.40 0.60 0.80 1.00 1.20 1.40 1.60 Coef. (English) 2.49 2.56 2.70 2.69 2.68 2.69 2.67 2.64
Primary OutFlow Max=1.69 cfs @ 13.64 hrs HW=372.43' (Free Discharge)1=Exfiltration (Exfiltration Controls 1.69 cfs)
Secondary OutFlow Max=0.00 cfs @ 0.00 hrs HW=363.00' (Free Discharge)2=Broad-Crested Rectangular Weir ( Controls 0.00 cfs)
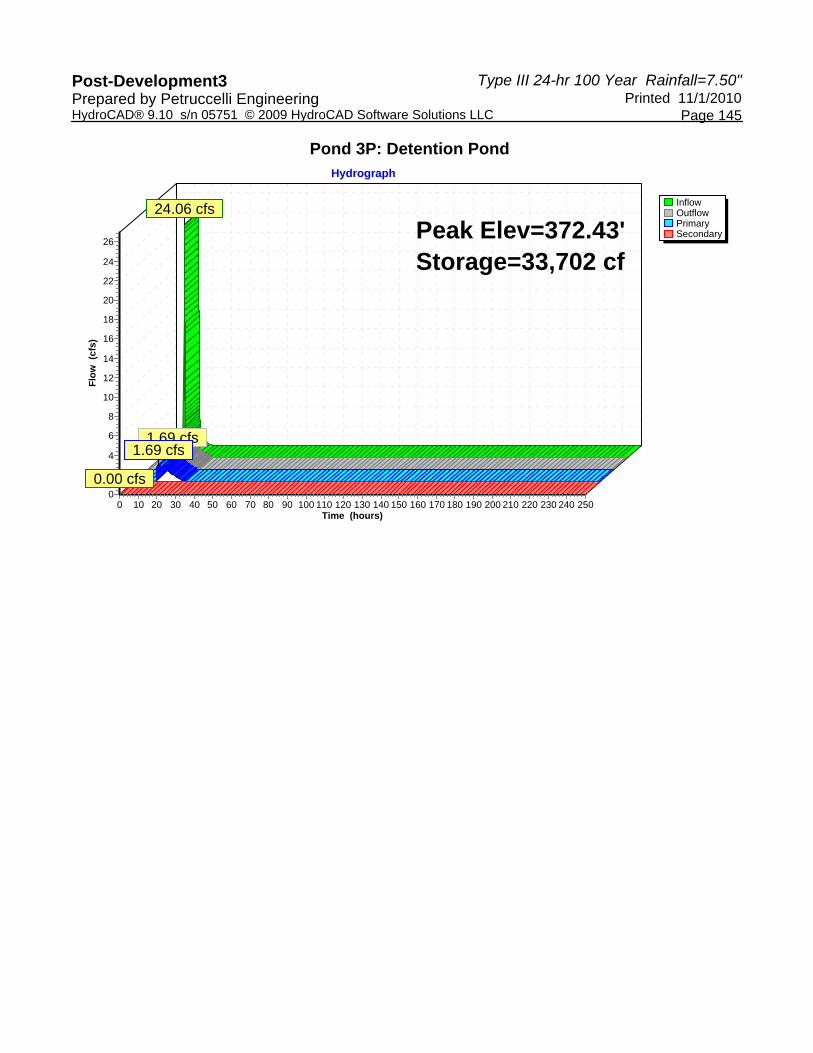
Type III 24-hr 100 Year Rainfall=7.50"Post-Development3 Printed 11/1/2010Prepared by Petruccelli Engineering
Page 145HydroCAD® 9.10 s/n 05751 © 2009 HydroCAD Software Solutions LLC
Pond 3P: Detention Pond
InflowOutflowPrimarySecondary
Hydrograph
Time (hours)2502402302202102001901801701601501401301201101009080706050403020100
Flow
(cf
s)
26
24
22
20
18
16
14
12
10
8
6
4
2
0
Peak Elev=372.43'Storage=33,702 cf
24.06 cfs
1.69 cfs1.69 cfs
0.00 cfs
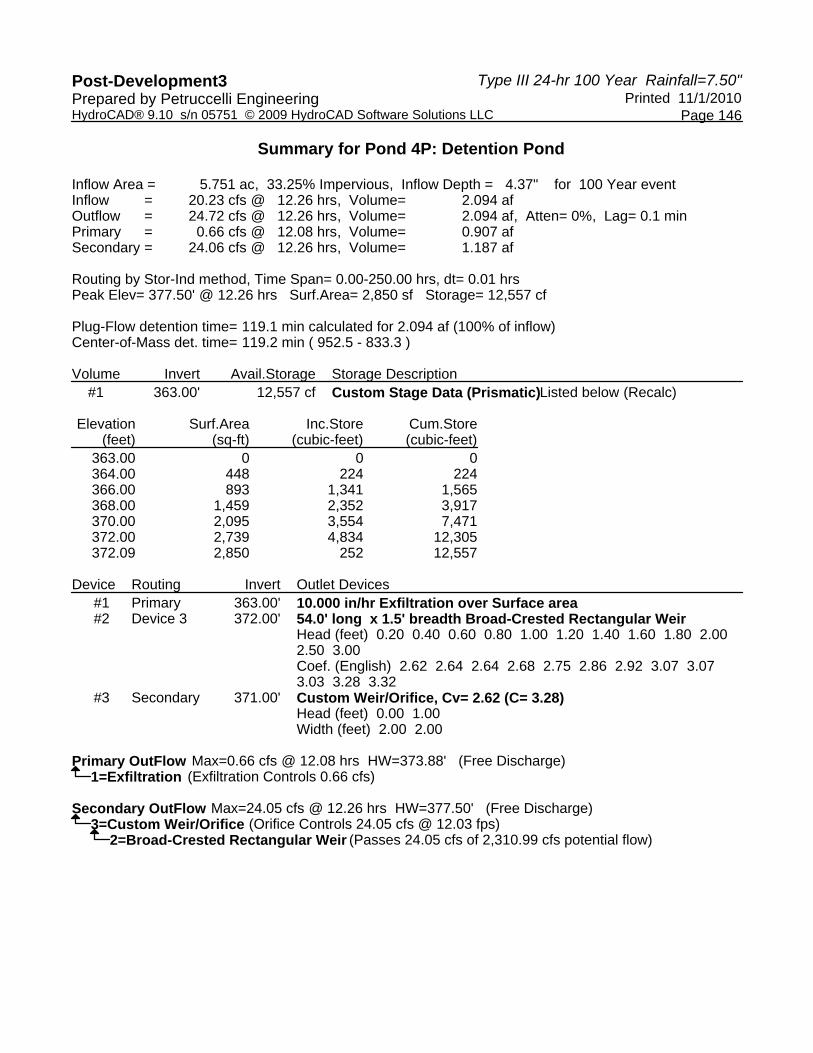
Type III 24-hr 100 Year Rainfall=7.50"Post-Development3 Printed 11/1/2010Prepared by Petruccelli Engineering
Page 146HydroCAD® 9.10 s/n 05751 © 2009 HydroCAD Software Solutions LLC
Summary for Pond 4P: Detention Pond
Inflow Area = 5.751 ac, 33.25% Impervious, Inflow Depth = 4.37" for 100 Year eventInflow = 20.23 cfs @ 12.26 hrs, Volume= 2.094 afOutflow = 24.72 cfs @ 12.26 hrs, Volume= 2.094 af, Atten= 0%, Lag= 0.1 minPrimary = 0.66 cfs @ 12.08 hrs, Volume= 0.907 afSecondary = 24.06 cfs @ 12.26 hrs, Volume= 1.187 af
Routing by Stor-Ind method, Time Span= 0.00-250.00 hrs, dt= 0.01 hrsPeak Elev= 377.50' @ 12.26 hrs Surf.Area= 2,850 sf Storage= 12,557 cf
Plug-Flow detention time= 119.1 min calculated for 2.094 af (100% of inflow)Center-of-Mass det. time= 119.2 min ( 952.5 - 833.3 )
Volume Invert Avail.Storage Storage Description#1 363.00' 12,557 cf Custom Stage Data (Prismatic) Listed below (Recalc)
Elevation Surf.Area Inc.Store Cum.Store(feet) (sq-ft) (cubic-feet) (cubic-feet)
363.00 0 0 0364.00 448 224 224366.00 893 1,341 1,565368.00 1,459 2,352 3,917370.00 2,095 3,554 7,471372.00 2,739 4,834 12,305372.09 2,850 252 12,557
Device Routing Invert Outlet Devices#1 Primary 363.00' 10.000 in/hr Exfiltration over Surface area #2 Device 3 372.00' 54.0' long x 1.5' breadth Broad-Crested Rectangular Weir
Head (feet) 0.20 0.40 0.60 0.80 1.00 1.20 1.40 1.60 1.80 2.00 2.50 3.00 Coef. (English) 2.62 2.64 2.64 2.68 2.75 2.86 2.92 3.07 3.07 3.03 3.28 3.32
#3 Secondary 371.00' Custom Weir/Orifice, Cv= 2.62 (C= 3.28) Head (feet) 0.00 1.00 Width (feet) 2.00 2.00
Primary OutFlow Max=0.66 cfs @ 12.08 hrs HW=373.88' (Free Discharge)1=Exfiltration (Exfiltration Controls 0.66 cfs)
Secondary OutFlow Max=24.05 cfs @ 12.26 hrs HW=377.50' (Free Discharge)3=Custom Weir/Orifice (Orifice Controls 24.05 cfs @ 12.03 fps)
2=Broad-Crested Rectangular Weir (Passes 24.05 cfs of 2,310.99 cfs potential flow)

Type III 24-hr 100 Year Rainfall=7.50"Post-Development3 Printed 11/1/2010Prepared by Petruccelli Engineering
Page 147HydroCAD® 9.10 s/n 05751 © 2009 HydroCAD Software Solutions LLC
Pond 4P: Detention Pond
InflowOutflowPrimarySecondary
Hydrograph
Time (hours)2502402302202102001901801701601501401301201101009080706050403020100
Flow
(cf
s)
26
24
22
20
18
16
14
12
10
8
6
4
2
0
Inflow Area=5.751 acPeak Elev=377.50'Storage=12,557 cf
20.23 cfs
24.72 cfs
0.66 cfs
24.06 cfs

Type III 24-hr 100 Year Rainfall=7.50"Post-Development3 Printed 11/1/2010Prepared by Petruccelli Engineering
Page 148HydroCAD® 9.10 s/n 05751 © 2009 HydroCAD Software Solutions LLC
Summary for Pond 6P: Drywells
Inflow Area = 0.231 ac,100.00% Impervious, Inflow Depth = 7.26" for 100 Year eventInflow = 0.98 cfs @ 12.39 hrs, Volume= 0.140 afOutflow = 0.22 cfs @ 13.17 hrs, Volume= 0.140 af, Atten= 78%, Lag= 46.6 minPrimary = 0.22 cfs @ 13.17 hrs, Volume= 0.140 afSecondary = 0.00 cfs @ 0.00 hrs, Volume= 0.000 af
Routing by Stor-Ind method, Time Span= 0.00-250.00 hrs, dt= 0.01 hrsPeak Elev= 388.40' @ 13.17 hrs Surf.Area= 1,218 sf Storage= 1,796 cf
Plug-Flow detention time= 55.7 min calculated for 0.140 af (100% of inflow)Center-of-Mass det. time= 55.7 min ( 819.9 - 764.2 )
Volume Invert Avail.Storage Storage Description#1A 386.00' 1,291 cf 27.68'W x 44.00'L x 4.83'H Field A
5,883 cf Overall - 2,655 cf Embedded = 3,227 cf x 40.0% Voids#2A 387.00' 2,058 cf Dry_Well 1000 Gallon x 16 Inside #1
Inside= 62.0"W x 30.0"H => 12.86 sf x 10.00'L = 128.6 cfOutside= 68.0"W x 34.0"H => 15.81 sf x 10.50'L = 166.0 cf
3,349 cf Total Available Storage
Storage Group A created with Chamber Wizard
Device Routing Invert Outlet Devices#1 Primary 386.00' 6.000 in/hr Exfiltration over Wetted area #2 Secondary 393.00' 24.0" Vert. Orifice/Grate C= 0.600
Primary OutFlow Max=0.22 cfs @ 13.17 hrs HW=388.40' (Free Discharge)1=Exfiltration (Exfiltration Controls 0.22 cfs)
Secondary OutFlow Max=0.00 cfs @ 0.00 hrs HW=386.00' (Free Discharge)2=Orifice/Grate ( Controls 0.00 cfs)

Type III 24-hr 100 Year Rainfall=7.50"Post-Development3 Printed 11/1/2010Prepared by Petruccelli Engineering
Page 149HydroCAD® 9.10 s/n 05751 © 2009 HydroCAD Software Solutions LLC
Pond 6P: Drywells - Chamber Wizard Field A
Chamber Model = Dry_Well 1000 GallonInside= 62.0"W x 30.0"H => 12.86 sf x 10.00'L = 128.6 cfOutside= 68.0"W x 34.0"H => 15.81 sf x 10.50'L = 166.0 cf
68.0" Wide + 12.0" Spacing = 80.0" C-C
4 Chambers/Row x 10.50' Long = 42.00' + 12.0" End Stone x 2 = 44.00' Base Length4 Rows x 68.0" Wide + 12.0" Spacing x 3 + 12.0" Side Stone x 2 = 27.68' Base Width12.0" Base + 34.0" Chamber Height + 12.0" Cover = 4.83' Field Height
16 Chambers x 128.6 cf = 2,058.4 cf Chamber Storage16 Chambers x 166.0 cf = 2,655.4 cf Displacement
5,882.6 cf Field - 2,655.4 cf Chambers = 3,227.2 cf Stone x 40.0% Voids = 1,290.9 cf Stone Storage
Stone + Chamber Storage = 3,349.3 cf = 0.077 af
16 Chambers217.9 cy Field119.5 cy Stone

Type III 24-hr 100 Year Rainfall=7.50"Post-Development3 Printed 11/1/2010Prepared by Petruccelli Engineering
Page 150HydroCAD® 9.10 s/n 05751 © 2009 HydroCAD Software Solutions LLC
Pond 6P: Drywells
InflowOutflowPrimarySecondary
Hydrograph
Time (hours)2502402302202102001901801701601501401301201101009080706050403020100
Flow
(cf
s)
1
0
Inflow Area=0.231 acPeak Elev=388.40'
Storage=1,796 cf
0.98 cfs
0.22 cfs0.22 cfs
0.00 cfs

Type III 24-hr 100 Year Rainfall=7.50"Post-Development3 Printed 11/1/2010Prepared by Petruccelli Engineering
Page 151HydroCAD® 9.10 s/n 05751 © 2009 HydroCAD Software Solutions LLC
Summary for Pond 7P: Stormwater Treatment Pond #2
Inflow Area = 2.937 ac, 37.76% Impervious, Inflow Depth = 4.37" for 100 Year eventInflow = 8.24 cfs @ 12.45 hrs, Volume= 1.069 afOutflow = 8.19 cfs @ 12.48 hrs, Volume= 1.069 af, Atten= 1%, Lag= 1.3 minPrimary = 0.23 cfs @ 12.48 hrs, Volume= 0.219 afSecondary = 7.96 cfs @ 12.48 hrs, Volume= 0.851 afTertiary = 0.00 cfs @ 0.00 hrs, Volume= 0.000 af
Routing by Stor-Ind method, Time Span= 0.00-250.00 hrs, dt= 0.01 hrsPeak Elev= 364.64' @ 12.48 hrs Surf.Area= 999 sf Storage= 1,826 cf
Plug-Flow detention time= 20.6 min calculated for 1.069 af (100% of inflow)Center-of-Mass det. time= 20.6 min ( 866.4 - 845.9 )
Volume Invert Avail.Storage Storage Description#1 361.00' 2,605 cf Custom Stage Data (Prismatic) Listed below (Recalc)
Elevation Surf.Area Inc.Store Cum.Store(feet) (sq-ft) (cubic-feet) (cubic-feet)
361.00 100 0 0362.00 300 200 200364.00 763 1,063 1,263365.00 1,132 948 2,211365.30 1,500 395 2,605
Device Routing Invert Outlet Devices#1 Primary 361.00' 10.000 in/hr Exfiltration over Surface area #2 Secondary 363.50' Custom Weir/Orifice, Cv= 2.62 (C= 3.28)
Head (feet) 0.00 1.50 Width (feet) 2.00 2.00
#3 Tertiary 365.10' 93.0' long x 3.0' breadth Broad-Crested Rectangular Weir Head (feet) 0.20 0.40 0.60 0.80 1.00 1.20 1.40 1.60 1.80 2.00 2.50 3.00 3.50 4.00 4.50 Coef. (English) 2.44 2.58 2.68 2.67 2.65 2.64 2.64 2.68 2.68 2.72 2.81 2.92 2.97 3.07 3.32
Primary OutFlow Max=0.23 cfs @ 12.48 hrs HW=364.64' (Free Discharge)1=Exfiltration (Exfiltration Controls 0.23 cfs)
Secondary OutFlow Max=7.96 cfs @ 12.48 hrs HW=364.64' (Free Discharge)2=Custom Weir/Orifice (Weir Controls 7.96 cfs @ 3.49 fps)
Tertiary OutFlow Max=0.00 cfs @ 0.00 hrs HW=361.00' (Free Discharge)3=Broad-Crested Rectangular Weir ( Controls 0.00 cfs)

Type III 24-hr 100 Year Rainfall=7.50"Post-Development3 Printed 11/1/2010Prepared by Petruccelli Engineering
Page 152HydroCAD® 9.10 s/n 05751 © 2009 HydroCAD Software Solutions LLC
Pond 7P: Stormwater Treatment Pond #2
InflowOutflowPrimarySecondaryTertiary
Hydrograph
Time (hours)2502402302202102001901801701601501401301201101009080706050403020100
Flow
(cf
s)
9
8
7
6
5
4
3
2
1
0
Inflow Area=2.937 acPeak Elev=364.64'Storage=1,826 cf
8.24 cfs8.19 cfs
0.23 cfs
7.96 cfs
0.00 cfs

Type III 24-hr 100 Year Rainfall=7.50"Post-Development3 Printed 11/1/2010Prepared by Petruccelli Engineering
Page 153HydroCAD® 9.10 s/n 05751 © 2009 HydroCAD Software Solutions LLC
Summary for Pond 8P: Stormwater Treatment Pond #1
Inflow = 7.96 cfs @ 12.48 hrs, Volume= 0.851 afOutflow = 7.53 cfs @ 12.58 hrs, Volume= 0.851 af, Atten= 5%, Lag= 6.0 minPrimary = 0.48 cfs @ 12.58 hrs, Volume= 0.183 afSecondary = 7.05 cfs @ 12.58 hrs, Volume= 0.668 af
Routing by Stor-Ind method, Time Span= 0.00-250.00 hrs, dt= 0.01 hrsPeak Elev= 364.77' @ 12.58 hrs Surf.Area= 2,074 sf Storage= 4,670 cf
Plug-Flow detention time= 13.7 min calculated for 0.851 af (100% of inflow)Center-of-Mass det. time= 13.7 min ( 829.6 - 815.9 )
Volume Invert Avail.Storage Storage Description#1 361.00' 5,867 cf Custom Stage Data (Prismatic) Listed below (Recalc)
Elevation Surf.Area Inc.Store Cum.Store(feet) (sq-ft) (cubic-feet) (cubic-feet)
361.00 300 0 0362.00 842 571 571364.00 1,772 2,614 3,185365.00 2,163 1,968 5,153365.30 2,600 714 5,867
Device Routing Invert Outlet Devices#1 Secondary 361.00' 24.0" Round Culvert
L= 200.0' CMP, end-section conforming to fill, Ke= 0.500 Inlet / Outlet Invert= 361.00' / 330.00' S= 0.1550 '/' Cc= 0.900 n= 0.013 Corrugated PE, smooth interior
#2 Device 1 361.10' 2.0" Vert. Orifice/Grate (0 yr) C= 0.600 #3 Device 1 361.70' 6.0" Vert. Orifice/Grate (1yr) C= 0.600 #4 Device 1 362.30' 7.0" Vert. Orifice/Grate(2yr) C= 0.600 #5 Device 1 363.40' 9.0" Vert. Orifice/Grate(10yr) C= 0.600 #6 Device 1 364.70' 57.0" x 57.0" Horiz. Top of Riser (100yr) C= 0.600
Limited to weir flow at low heads #7 Device 1 365.00' 14.5' long x 2.0' breadth Broad-Crested Rectangular Weir (14.5)
Head (feet) 0.20 0.40 0.60 0.80 1.00 1.20 1.40 1.60 1.80 2.00 2.50 3.00 3.50 Coef. (English) 2.54 2.61 2.61 2.60 2.66 2.70 2.77 2.89 2.88 2.85 3.07 3.20 3.32
#8 Device 1 365.20' 100.0' long x 3.0' breadth Broad-Crested Rectangular Weir Head (feet) 0.20 0.40 0.60 0.80 1.00 1.20 1.40 1.60 1.80 2.00 2.50 3.00 3.50 4.00 4.50 Coef. (English) 2.44 2.58 2.68 2.67 2.65 2.64 2.64 2.68 2.68 2.72 2.81 2.92 2.97 3.07 3.32
#9 Primary 361.00' 10.000 in/hr Exfiltration over Surface area

Type III 24-hr 100 Year Rainfall=7.50"Post-Development3 Printed 11/1/2010Prepared by Petruccelli Engineering
Page 154HydroCAD® 9.10 s/n 05751 © 2009 HydroCAD Software Solutions LLC
Primary OutFlow Max=0.48 cfs @ 12.58 hrs HW=364.77' (Free Discharge)9=Exfiltration (Exfiltration Controls 0.48 cfs)
Secondary OutFlow Max=7.01 cfs @ 12.58 hrs HW=364.77' (Free Discharge)1=Culvert (Passes 7.01 cfs of 25.19 cfs potential flow)
2=Orifice/Grate (0 yr) (Orifice Controls 0.20 cfs @ 9.12 fps)3=Orifice/Grate (1yr) (Orifice Controls 1.59 cfs @ 8.09 fps)4=Orifice/Grate(2yr) (Orifice Controls 1.90 cfs @ 7.11 fps)5=Orifice/Grate(10yr) (Orifice Controls 2.12 cfs @ 4.81 fps)6=Top of Riser (100yr) (Weir Controls 1.20 cfs @ 0.88 fps)7=Broad-Crested Rectangular Weir (14.5) ( Controls 0.00 cfs)8=Broad-Crested Rectangular Weir ( Controls 0.00 cfs)
Pond 8P: Stormwater Treatment Pond #1
InflowOutflowPrimarySecondary
Hydrograph
Time (hours)2502402302202102001901801701601501401301201101009080706050403020100
Flow
(cf
s)
8
7
6
5
4
3
2
1
0
Peak Elev=364.77'Storage=4,670 cf
7.96 cfs7.53 cfs
0.48 cfs
7.05 cfs

Type III 24-hr 100 Year Rainfall=7.50"Post-Development3 Printed 11/1/2010Prepared by Petruccelli Engineering
Page 155HydroCAD® 9.10 s/n 05751 © 2009 HydroCAD Software Solutions LLC
Summary for Pond 9P: Drywells
Inflow Area = 0.459 ac,100.00% Impervious, Inflow Depth = 7.26" for 100 Year eventInflow = 2.35 cfs @ 12.25 hrs, Volume= 0.278 afOutflow = 0.25 cfs @ 11.31 hrs, Volume= 0.278 af, Atten= 89%, Lag= 0.0 minPrimary = 0.25 cfs @ 11.31 hrs, Volume= 0.278 afSecondary = 0.00 cfs @ 0.00 hrs, Volume= 0.000 af
Routing by Stor-Ind method, Time Span= 0.00-250.00 hrs, dt= 0.01 hrsPeak Elev= 389.44' @ 13.37 hrs Surf.Area= 1,834 sf Storage= 4,437 cf
Plug-Flow detention time= 125.5 min calculated for 0.278 af (100% of inflow)Center-of-Mass det. time= 125.5 min ( 879.7 - 754.2 )
Volume Invert Avail.Storage Storage Description#1A 386.00' 1,685 cf 41.69'W x 44.00'L x 4.83'H Field A
8,860 cf Overall - 4,647 cf Embedded = 4,213 cf x 40.0% Voids#2A 387.00' 3,602 cf Dry_Well 1000 Gallon x 28 Inside #1
Inside= 62.0"W x 30.0"H => 12.86 sf x 10.00'L = 128.6 cfOutside= 68.0"W x 34.0"H => 15.81 sf x 10.50'L = 166.0 cf
5,287 cf Total Available Storage
Storage Group A created with Chamber Wizard
Device Routing Invert Outlet Devices#1 Primary 386.00' 6.000 in/hr Exfiltration over Surface area #2 Secondary 392.00' 24.0" Vert. Orifice/Grate C= 0.600
Primary OutFlow Max=0.25 cfs @ 11.31 hrs HW=386.08' (Free Discharge)1=Exfiltration (Exfiltration Controls 0.25 cfs)
Secondary OutFlow Max=0.00 cfs @ 0.00 hrs HW=386.00' (Free Discharge)2=Orifice/Grate ( Controls 0.00 cfs)

Type III 24-hr 100 Year Rainfall=7.50"Post-Development3 Printed 11/1/2010Prepared by Petruccelli Engineering
Page 156HydroCAD® 9.10 s/n 05751 © 2009 HydroCAD Software Solutions LLC
Pond 9P: Drywells - Chamber Wizard Field A
Chamber Model = Dry_Well 1000 GallonInside= 62.0"W x 30.0"H => 12.86 sf x 10.00'L = 128.6 cfOutside= 68.0"W x 34.0"H => 15.81 sf x 10.50'L = 166.0 cf
68.0" Wide + 0.0" Spacing = 68.0" C-C
4 Chambers/Row x 10.50' Long = 42.00' + 12.0" End Stone x 2 = 44.00' Base Length7 Rows x 68.0" Wide + 12.0" Side Stone x 2 = 41.69' Base Width12.0" Base + 34.0" Chamber Height + 12.0" Cover = 4.83' Field Height
28 Chambers x 128.6 cf = 3,602.2 cf Chamber Storage28 Chambers x 166.0 cf = 4,646.9 cf Displacement
8,860.0 cf Field - 4,646.9 cf Chambers = 4,213.1 cf Stone x 40.0% Voids = 1,685.2 cf Stone Storage
Stone + Chamber Storage = 5,287.4 cf = 0.121 af
28 Chambers328.1 cy Field156.0 cy Stone
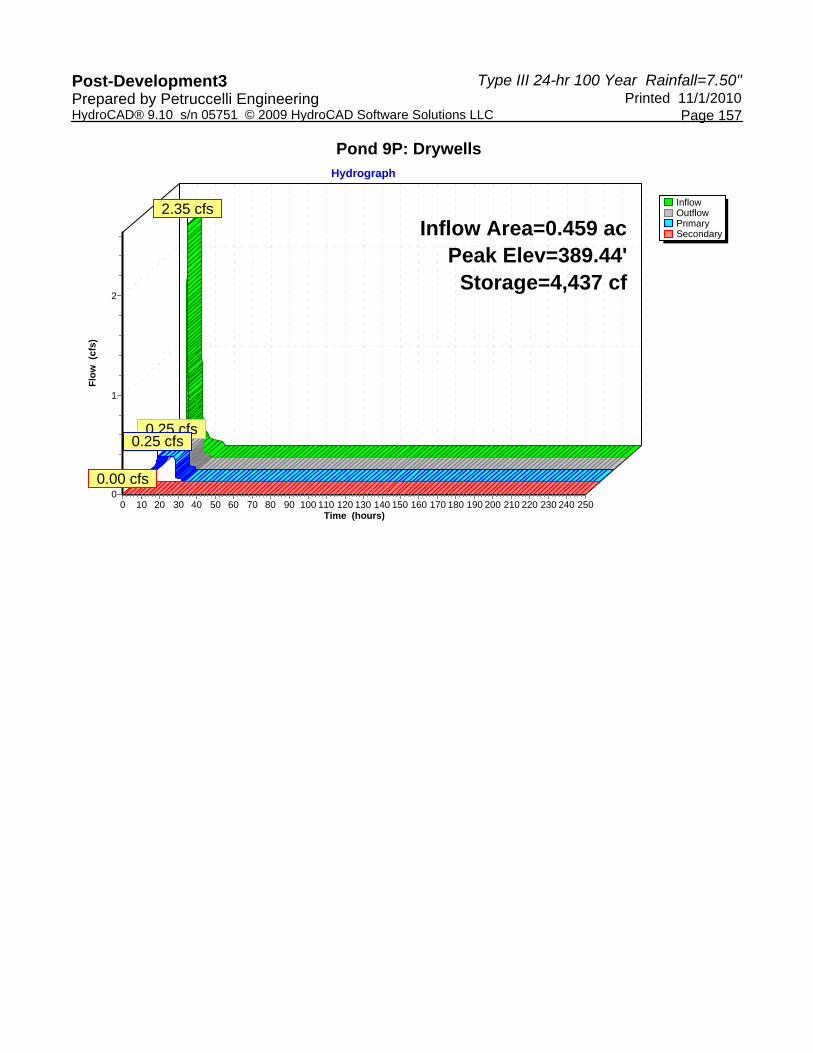
Type III 24-hr 100 Year Rainfall=7.50"Post-Development3 Printed 11/1/2010Prepared by Petruccelli Engineering
Page 157HydroCAD® 9.10 s/n 05751 © 2009 HydroCAD Software Solutions LLC
Pond 9P: Drywells
InflowOutflowPrimarySecondary
Hydrograph
Time (hours)2502402302202102001901801701601501401301201101009080706050403020100
Flow
(cf
s)
2
1
0
Inflow Area=0.459 acPeak Elev=389.44'
Storage=4,437 cf
2.35 cfs
0.25 cfs0.25 cfs
0.00 cfs

Type III 24-hr 100 Year Rainfall=7.50"Post-Development3 Printed 11/1/2010Prepared by Petruccelli Engineering
Page 158HydroCAD® 9.10 s/n 05751 © 2009 HydroCAD Software Solutions LLC
Summary for Link DP-1: Design Point 1
Inflow Area = 13.292 ac, 3.27% Impervious, Inflow Depth = 2.96" for 100 Year eventInflow = 24.82 cfs @ 12.47 hrs, Volume= 3.282 afPrimary = 24.82 cfs @ 12.47 hrs, Volume= 3.282 af, Atten= 0%, Lag= 0.0 min
Primary outflow = Inflow, Time Span= 0.00-250.00 hrs, dt= 0.01 hrs
Link DP-1: Design Point 1
InflowPrimary
Hydrograph
Time (hours)2502402302202102001901801701601501401301201101009080706050403020100
Flow
(cf
s)
26
24
22
20
18
16
14
12
10
8
6
4
2
0
Inflow Area=13.292 ac24.82 cfs
24.82 cfs

Type III 24-hr 100 Year Rainfall=7.50"Post-Development3 Printed 11/1/2010Prepared by Petruccelli Engineering
Page 159HydroCAD® 9.10 s/n 05751 © 2009 HydroCAD Software Solutions LLC
Summary for Link DP-2: Design Point 2
Inflow Area = 1.273 ac, 7.29% Impervious, Inflow Depth = 3.28" for 100 Year eventInflow = 3.10 cfs @ 12.32 hrs, Volume= 0.348 afPrimary = 3.10 cfs @ 12.32 hrs, Volume= 0.348 af, Atten= 0%, Lag= 0.0 min
Primary outflow = Inflow, Time Span= 0.00-250.00 hrs, dt= 0.01 hrs
Link DP-2: Design Point 2
InflowPrimary
Hydrograph
Time (hours)2502402302202102001901801701601501401301201101009080706050403020100
Flow
(cf
s)
3
2
1
0
Inflow Area=1.273 ac3.10 cfs
3.10 cfs

Type III 24-hr 100 Year Rainfall=7.50"Post-Development3 Printed 11/1/2010Prepared by Petruccelli Engineering
Page 160HydroCAD® 9.10 s/n 05751 © 2009 HydroCAD Software Solutions LLC
Summary for Link DP-3: Design Point 3
Inflow Area = 2.653 ac, 7.97% Impervious, Inflow Depth = 3.28" for 100 Year eventInflow = 5.81 cfs @ 12.42 hrs, Volume= 0.725 afPrimary = 5.81 cfs @ 12.42 hrs, Volume= 0.725 af, Atten= 0%, Lag= 0.0 min
Primary outflow = Inflow, Time Span= 0.00-250.00 hrs, dt= 0.01 hrs
Link DP-3: Design Point 3
InflowPrimary
Hydrograph
Time (hours)2502402302202102001901801701601501401301201101009080706050403020100
Flow
(cf
s)
6
5
4
3
2
1
0
Inflow Area=2.653 ac5.81 cfs
5.81 cfs

Type III 24-hr 100 Year Rainfall=7.50"Post-Development3 Printed 11/1/2010Prepared by Petruccelli Engineering
Page 161HydroCAD® 9.10 s/n 05751 © 2009 HydroCAD Software Solutions LLC
Summary for Link DP-4: Design Point 4
Inflow Area = 2.888 ac, 0.56% Impervious, Inflow Depth = 2.55" for 100 Year eventInflow = 4.41 cfs @ 12.51 hrs, Volume= 0.614 afPrimary = 4.41 cfs @ 12.51 hrs, Volume= 0.614 af, Atten= 0%, Lag= 0.0 min
Primary outflow = Inflow, Time Span= 0.00-250.00 hrs, dt= 0.01 hrs
Link DP-4: Design Point 4
InflowPrimary
Hydrograph
Time (hours)2502402302202102001901801701601501401301201101009080706050403020100
Flow
(cf
s)
4
3
2
1
0
Inflow Area=2.888 ac4.41 cfs
4.41 cfs

Type III 24-hr 100 Year Rainfall=7.50"Post-Development3 Printed 11/1/2010Prepared by Petruccelli Engineering
Page 162HydroCAD® 9.10 s/n 05751 © 2009 HydroCAD Software Solutions LLC
Summary for Link DP-5: Design Point 5
Inflow Area = 2.294 ac, 15.79% Impervious, Inflow Depth = 3.60" for 100 Year eventInflow = 7.69 cfs @ 12.18 hrs, Volume= 0.688 afPrimary = 7.69 cfs @ 12.18 hrs, Volume= 0.688 af, Atten= 0%, Lag= 0.0 min
Primary outflow = Inflow, Time Span= 0.00-250.00 hrs, dt= 0.01 hrs
Link DP-5: Design Point 5
InflowPrimary
Hydrograph
Time (hours)2502402302202102001901801701601501401301201101009080706050403020100
Flow
(cf
s)
8
7
6
5
4
3
2
1
0
Inflow Area=2.294 ac7.69 cfs
7.69 cfs
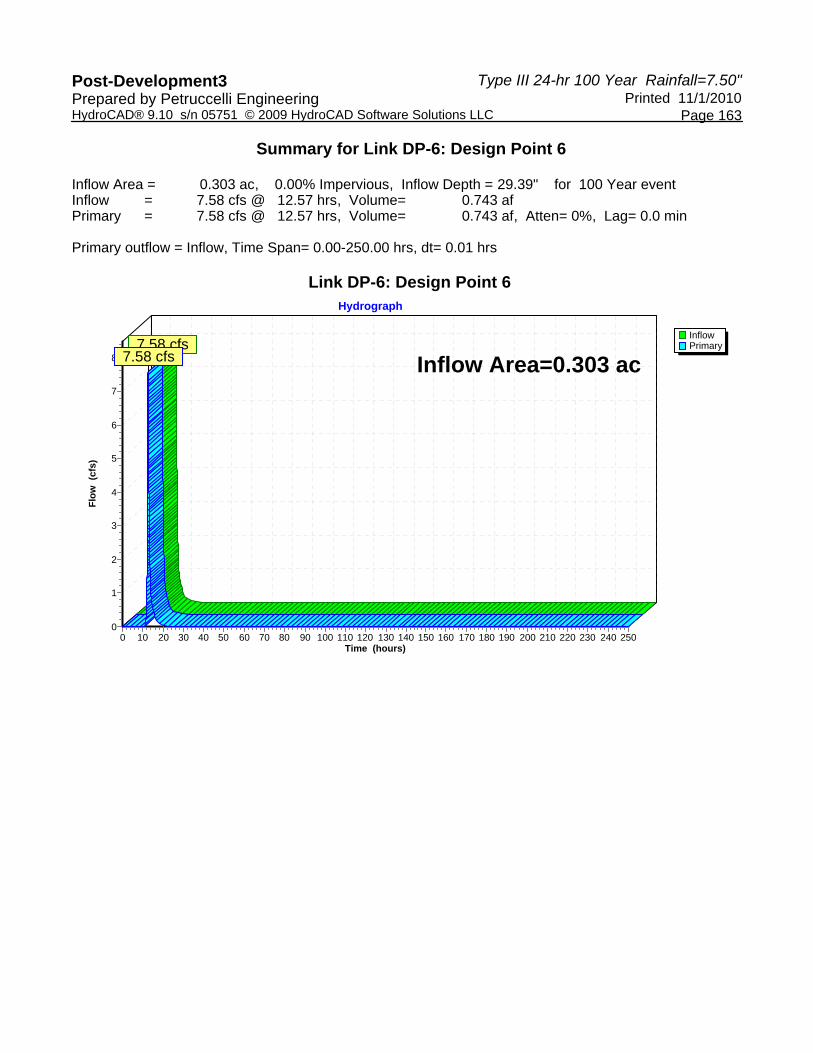
Type III 24-hr 100 Year Rainfall=7.50"Post-Development3 Printed 11/1/2010Prepared by Petruccelli Engineering
Page 163HydroCAD® 9.10 s/n 05751 © 2009 HydroCAD Software Solutions LLC
Summary for Link DP-6: Design Point 6
Inflow Area = 0.303 ac, 0.00% Impervious, Inflow Depth = 29.39" for 100 Year eventInflow = 7.58 cfs @ 12.57 hrs, Volume= 0.743 afPrimary = 7.58 cfs @ 12.57 hrs, Volume= 0.743 af, Atten= 0%, Lag= 0.0 min
Primary outflow = Inflow, Time Span= 0.00-250.00 hrs, dt= 0.01 hrs
Link DP-6: Design Point 6
InflowPrimary
Hydrograph
Time (hours)2502402302202102001901801701601501401301201101009080706050403020100
Flow
(cf
s)
8
7
6
5
4
3
2
1
0
Inflow Area=0.303 ac7.58 cfs
7.58 cfs
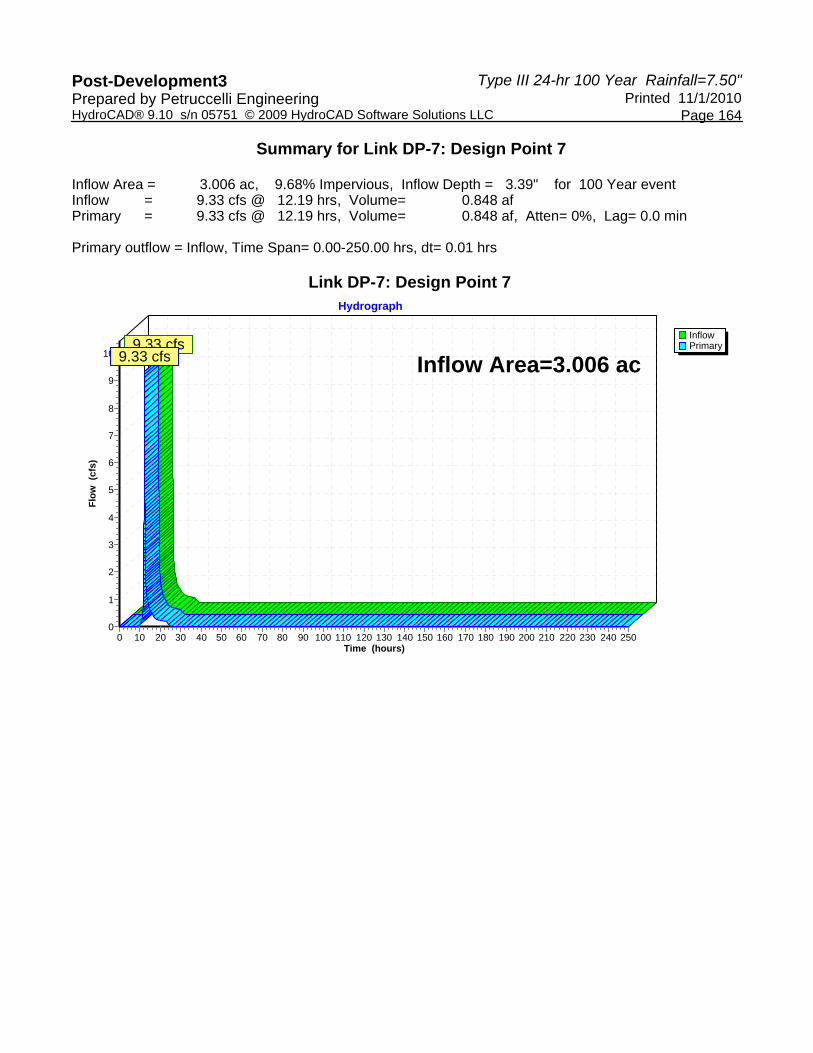
Type III 24-hr 100 Year Rainfall=7.50"Post-Development3 Printed 11/1/2010Prepared by Petruccelli Engineering
Page 164HydroCAD® 9.10 s/n 05751 © 2009 HydroCAD Software Solutions LLC
Summary for Link DP-7: Design Point 7
Inflow Area = 3.006 ac, 9.68% Impervious, Inflow Depth = 3.39" for 100 Year eventInflow = 9.33 cfs @ 12.19 hrs, Volume= 0.848 afPrimary = 9.33 cfs @ 12.19 hrs, Volume= 0.848 af, Atten= 0%, Lag= 0.0 min
Primary outflow = Inflow, Time Span= 0.00-250.00 hrs, dt= 0.01 hrs
Link DP-7: Design Point 7
InflowPrimary
Hydrograph
Time (hours)2502402302202102001901801701601501401301201101009080706050403020100
Flow
(cf
s)
10
9
8
7
6
5
4
3
2
1
0
Inflow Area=3.006 ac9.33 cfs
9.33 cfs

THIS PAGE IS LEFT INTENTIONALLY BLANK
APPENDIX D
- OPERATOR AND CONTRACTOR CERTIFICATIONS

THIS PAGE IS LEFT INTENTIONALLY BLANK

TRIPI CONSERVATION SUBDIVISION
HARRIS ROAD
TOWN OF BEDFORD
WESTCHESTER COUNTY, NEW YORK
OPERATOR CERTIFICATION STATEMENT
I certify under penalty of law that this document and all attachments were prepared under my direction or supervision in accordance with a system designed to assure that qualified personnel properly gathered and evaluated the information submitted. Based on my inquiry of the person or persons who manage the system, or those persons directly responsible for gathering the information, the information submitted is, to the best of my knowledge and belief, true, accurate, and complete. I am aware that false statements made herein are punishable as a class A misdemeanor pursuant to sections 210.45 of the Penal Law.
___________________________
Operator
___________________________
Signature
___________________________
Print Name
___________________________
Title
___________________________
Date
___________________________
Address
___________________________
Telephone Number

THIS PAGE IS LEFT INTENTIONALLY BLANK
APPENDIX E
- MAINTENANCE AND INSPECTION REPORTS AND CONSTRUCTION CHECKLIST

THIS PAGE IS LEFT INTENTIONALLY BLANK

F-1
Stormwater/Wetland Pond Construction Inspection Checklist
Project: Location: Site Status: Date: Time: Inspector: CONSTRUCTION SEQUENCE
SATISFACTORY/ UNSATISFACTORY
COMMENTS
Pre-Construction/Materials and Equipment Pre-construction meeting
Pipe and appurtenances on-site prior to constructionand dimensions checked
1. Material (including protective coating, if specified)
2. Diameter
3. Dimensions of metal riser or pre-cast concrete outlet structure
4. Required dimensions between water control structures (orifices, weirs, etc.) are in accordance with approved plans
5. Barrel stub for prefabricated pipe structures at proper angle for design barrel slope
6. Number and dimensions of prefabricated anti-seep collars
7. Watertight connectors and gaskets
8. Outlet drain valve
Project benchmark near pond site
Equipment for temporary de-watering
Appendix F: Construction Inspection ChecklistsTools
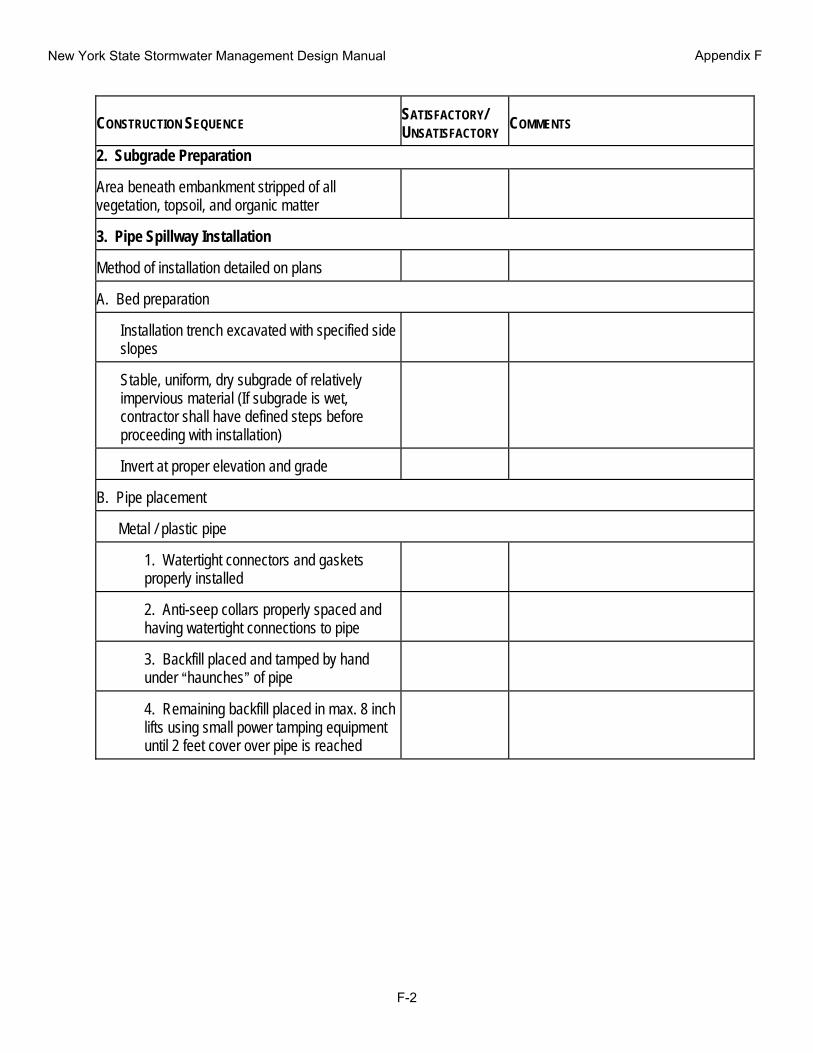
New York State Stormwater Management Design Manual
F-2
Appendix F
CONSTRUCTION SEQUENCE
SATISFACTORY/ UNSATISFACTORY
COMMENTS
2. Subgrade Preparation Area beneath embankment stripped of all vegetation, topsoil, and organic matter
3. Pipe Spillway Installation Method of installation detailed on plans
A. Bed preparation
Installation trench excavated with specified side slopes
Stable, uniform, dry subgrade of relatively impervious material (If subgrade is wet, contractor shall have defined steps before proceeding with installation)
Invert at proper elevation and grade
B. Pipe placement Metal / plastic pipe
1. Watertight connectors and gaskets properly installed
2. Anti-seep collars properly spaced and having watertight connections to pipe
3. Backfill placed and tamped by hand under Ahaunches@ of pipe
4. Remaining backfill placed in max. 8 inch lifts using small power tamping equipment until 2 feet cover over pipe is reached

New York State Stormwater Management Design Manual
F-3
Appendix F
CONSTRUCTION SEQUENCE
SATISFACTORY/ UNSATISFACTORY
COMMENTS
3. Pipe Spillway Installation Concrete pipe
1. Pipe set on blocks or concrete slab for pouring of low cradle
2. Pipe installed with rubber gasket joints with no spalling in gasket interface area
3. Excavation for lower half of anti-seep collar(s) with reinforcing steel set
4. Entire area where anti-seep collar(s) will come in contact with pipe coated with mastic or other approved waterproof sealant
5. Low cradle and bottom half of anti-seep collar installed as monolithic pour and of an approved mix
6. Upper half of anti-seep collar(s) formed with reinforcing steel set
7. Concrete for collar of an approved mix and vibrated into place (protected from freezing while curing, if necessary)
8. Forms stripped and collar inspected for honeycomb prior to backfilling. Parge if necessary.
C. Backfilling
Fill placed in maximum 8 inch lifts
Backfill taken minimum 2 feet above top of anti-seep collar elevation before traversing with heavy equipment
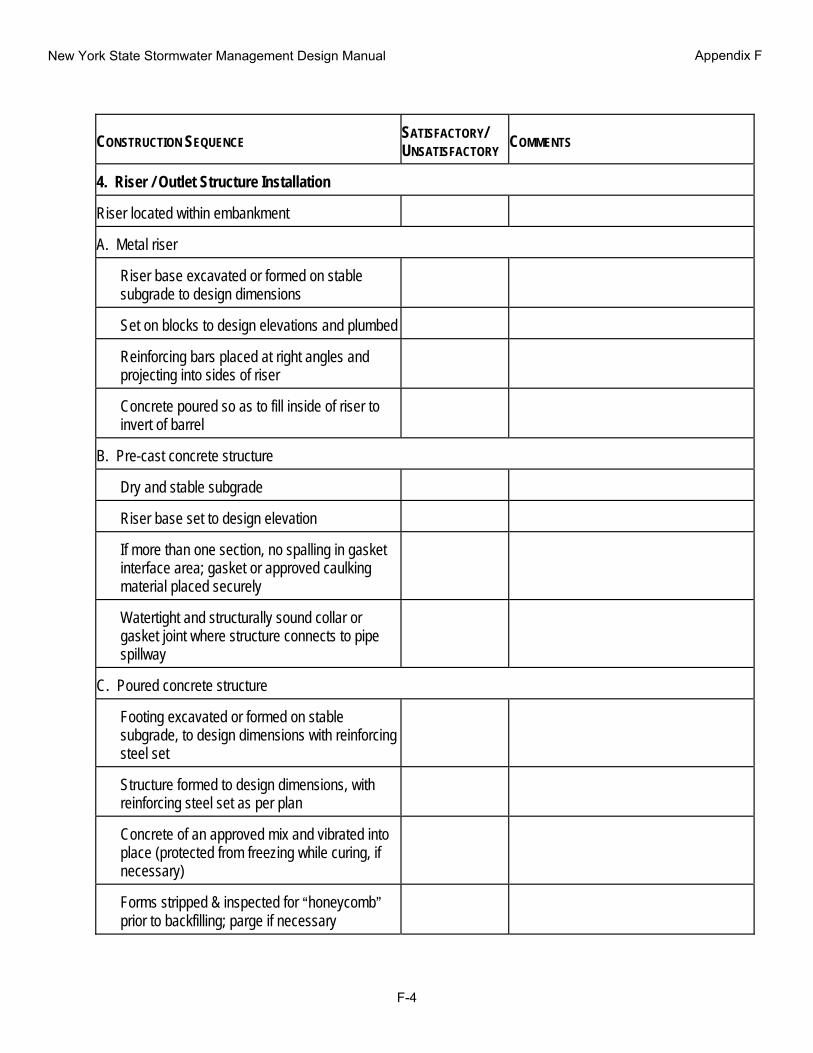
New York State Stormwater Management Design Manual
F-4
Appendix F
CONSTRUCTION SEQUENCE
SATISFACTORY/ UNSATISFACTORY
COMMENTS
4. Riser / Outlet Structure Installation Riser located within embankment
A. Metal riser
Riser base excavated or formed on stable subgrade to design dimensions
Set on blocks to design elevations and plumbed
Reinforcing bars placed at right angles and projecting into sides of riser
Concrete poured so as to fill inside of riser to invert of barrel
B. Pre-cast concrete structure
Dry and stable subgrade
Riser base set to design elevation
If more than one section, no spalling in gasket interface area; gasket or approved caulking material placed securely
Watertight and structurally sound collar or gasket joint where structure connects to pipe spillway
C. Poured concrete structure
Footing excavated or formed on stable subgrade, to design dimensions with reinforcing steel set
Structure formed to design dimensions, with reinforcing steel set as per plan
Concrete of an approved mix and vibrated into place (protected from freezing while curing, if necessary)
Forms stripped & inspected for Ahoneycomb@ prior to backfilling; parge if necessary
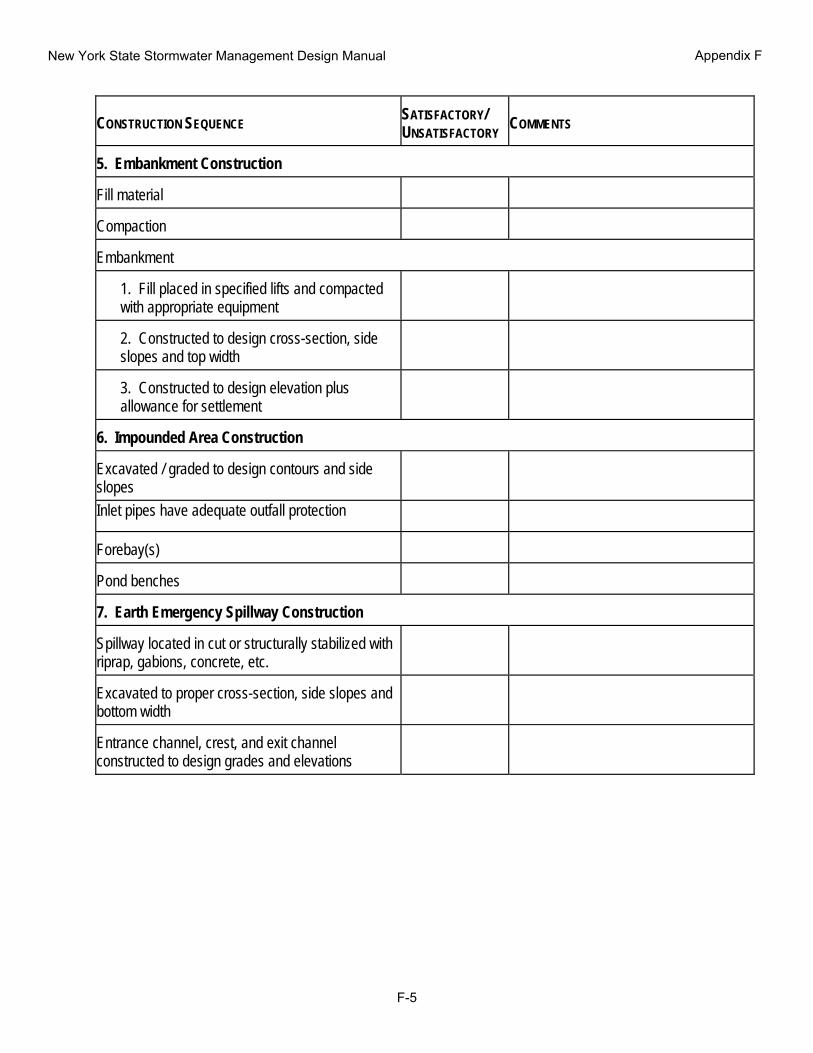
New York State Stormwater Management Design Manual
F-5
Appendix F
CONSTRUCTION SEQUENCE
SATISFACTORY/ UNSATISFACTORY
COMMENTS
5. Embankment Construction Fill material
Compaction
Embankment
1. Fill placed in specified lifts and compacted with appropriate equipment
2. Constructed to design cross-section, side slopes and top width
3. Constructed to design elevation plus allowance for settlement
6. Impounded Area Construction Excavated / graded to design contours and side slopes
Inlet pipes have adequate outfall protection
Forebay(s)
Pond benches
7. Earth Emergency Spillway Construction Spillway located in cut or structurally stabilized with riprap, gabions, concrete, etc.
Excavated to proper cross-section, side slopes and bottom width
Entrance channel, crest, and exit channel constructed to design grades and elevations
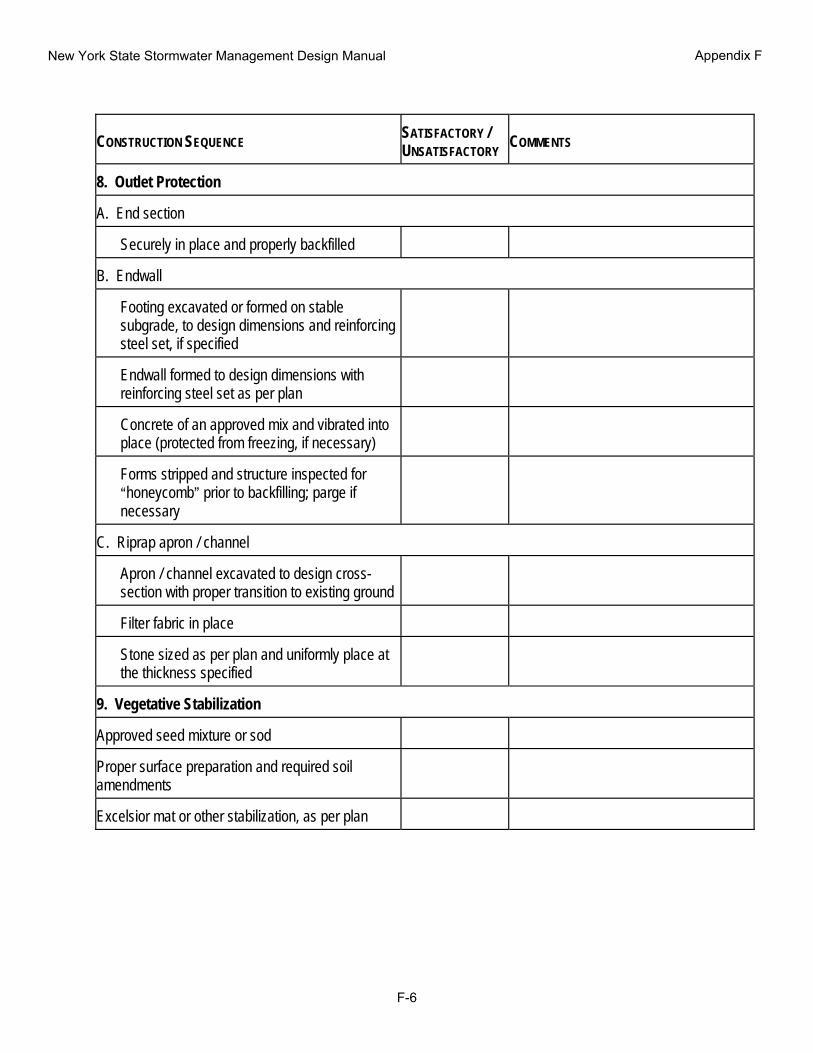
New York State Stormwater Management Design Manual
F-6
Appendix F
CONSTRUCTION SEQUENCE
SATISFACTORY / UNSATISFACTORY
COMMENTS
8. Outlet Protection A. End section
Securely in place and properly backfilled
B. Endwall
Footing excavated or formed on stable subgrade, to design dimensions and reinforcing steel set, if specified
Endwall formed to design dimensions with reinforcing steel set as per plan
Concrete of an approved mix and vibrated into place (protected from freezing, if necessary)
Forms stripped and structure inspected for Ahoneycomb@ prior to backfilling; parge if necessary
C. Riprap apron / channel
Apron / channel excavated to design cross-section with proper transition to existing ground
Filter fabric in place
Stone sized as per plan and uniformly place at the thickness specified
9. Vegetative Stabilization Approved seed mixture or sod
Proper surface preparation and required soil amendments
Excelsior mat or other stabilization, as per plan
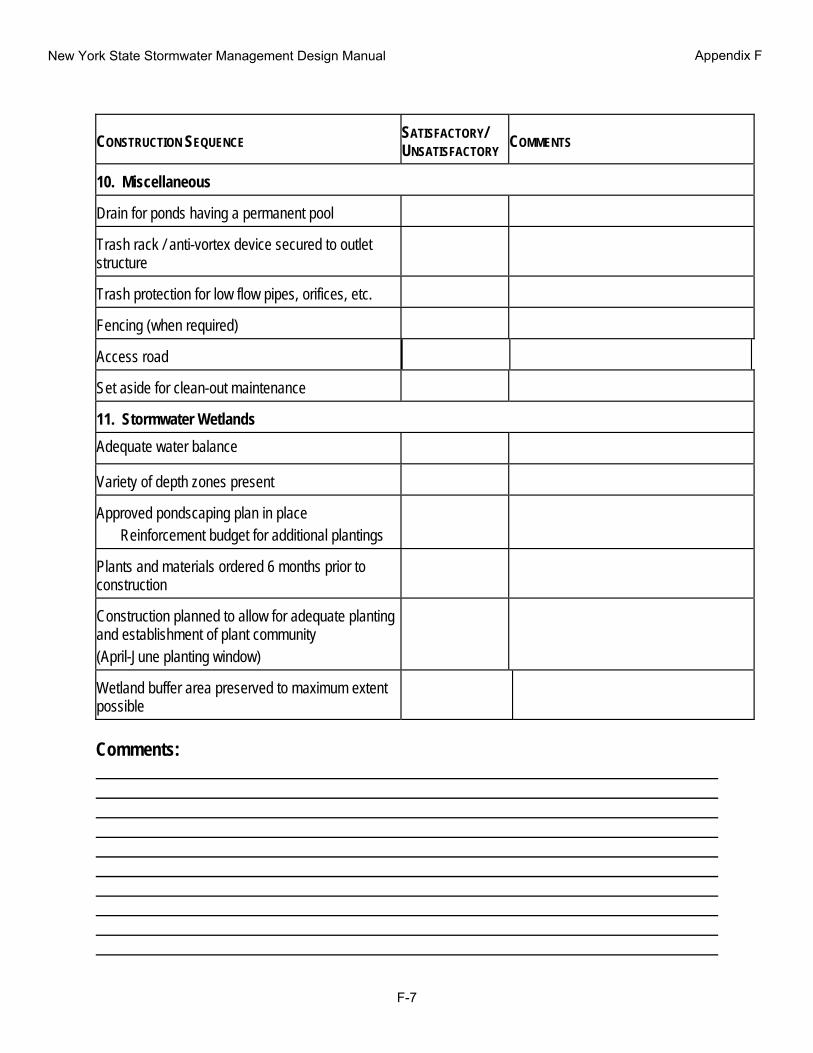
New York State Stormwater Management Design Manual
F-7
Appendix F
CONSTRUCTION SEQUENCE
SATISFACTORY/ UNSATISFACTORY
COMMENTS
10. Miscellaneous Drain for ponds having a permanent pool
Trash rack / anti-vortex device secured to outlet structure
Trash protection for low flow pipes, orifices, etc.
Fencing (when required)
Access road
Set aside for clean-out maintenance
11. Stormwater Wetlands Adequate water balance
Variety of depth zones present
Approved pondscaping plan in place Reinforcement budget for additional plantings
Plants and materials ordered 6 months prior to construction
Construction planned to allow for adequate planting and establishment of plant community (April-June planting window)
Wetland buffer area preserved to maximum extent possible
Comments:
New York State Stormwater Management Design Manual
F-8
Appendix F
Actions to be Taken:
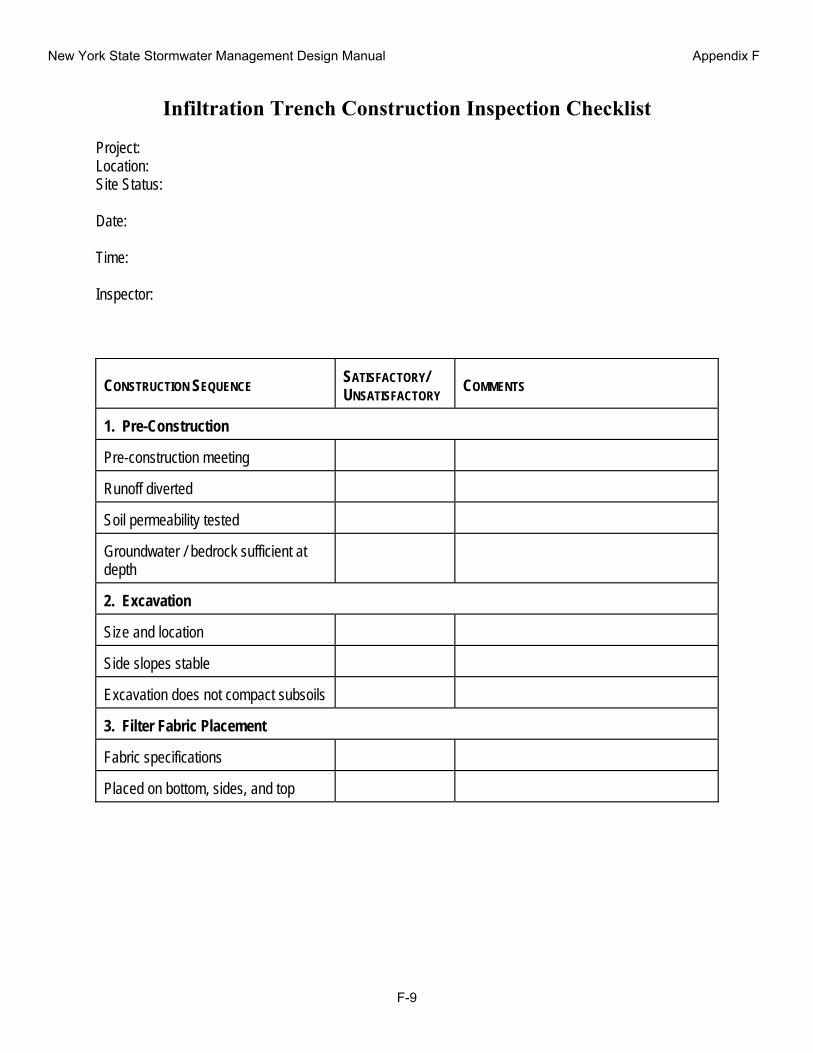
New York State Stormwater Management Design Manual Appendix F
F-9
Infiltration Trench Construction Inspection Checklist Project: Location: Site Status: Date: Time: Inspector:
CONSTRUCTION SEQUENCE
SATISFACTORY/ UNSATISFACTORY
COMMENTS
1. Pre-Construction Pre-construction meeting
Runoff diverted
Soil permeability tested
Groundwater / bedrock sufficient at depth
2. Excavation Size and location
Side slopes stable
Excavation does not compact subsoils
3. Filter Fabric Placement Fabric specifications
Placed on bottom, sides, and top

New York State Stormwater Management Design Manual Appendix F
F-10
CONSTRUCTION SEQUENCE
SATISFACTORY / UNSATISFACTORY
COMMENTS
4. Aggregate Material Size as specified
Clean / washed material
Placed properly
5. Observation Well Pipe size
Removable cap / footplate
Initial depth = feet
6. Final Inspection Pretreatment facility in place
Contributing watershed stabilized prior to flow diversion
Outlet
Comments:

New York State Stormwater Management Design Manual Appendix F
F-11
Actions to be Taken:
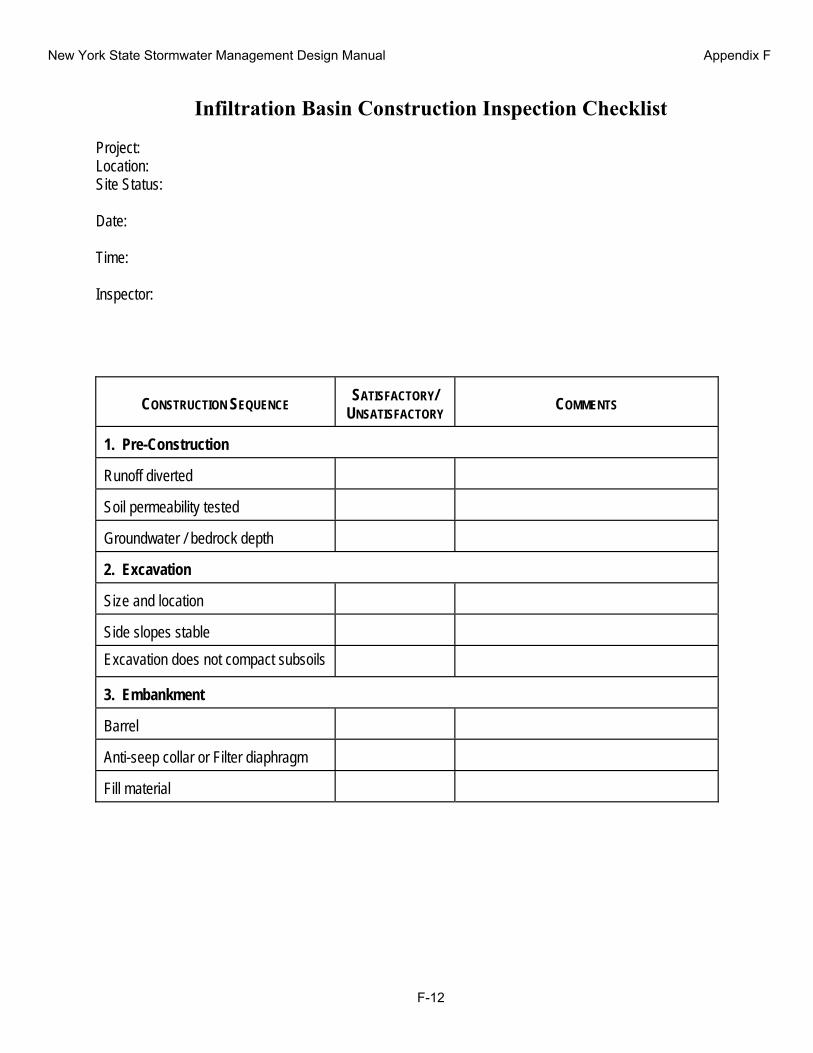
New York State Stormwater Management Design Manual Appendix F
F-12
Infiltration Basin Construction Inspection Checklist Project: Location: Site Status: Date: Time: Inspector:
CONSTRUCTION SEQUENCE
SATISFACTORY/
UNSATISFACTORY
COMMENTS 1. Pre-Construction Runoff diverted
Soil permeability tested
Groundwater / bedrock depth
2. Excavation Size and location
Side slopes stable
Excavation does not compact subsoils
3. Embankment Barrel
Anti-seep collar or Filter diaphragm
Fill material

New York State Stormwater Management Design Manual Appendix F
F-13
CONSTRUCTION SEQUENCE
SATISFACTORY/ UNSATISFACTORY
COMMENTS
4. Final Excavation Drainage area stabilized
Sediment removed from facility
Basin floor tilled
Facility stabilized
5. Final Inspection Pretreatment facility in place
Inlets / outlets
Contributing watershed stabilized before flow is routed to the factility
Comments: Actions to be Taken: