APPENDIX B: OVERVIEW CHARTS OF CHAPTER 3 … · Job Role Quality Questionnaire (JRQ) Measure...
21
APPENDIX B: OVERVIEW CHARTS OF CHAPTER 3 MEASURES, BY TOPIC B-1
Transcript of APPENDIX B: OVERVIEW CHARTS OF CHAPTER 3 … · Job Role Quality Questionnaire (JRQ) Measure...

APPENDIX B: OVERVIEW CHARTS OF CHAPTER 3 MEASURES, BY TOPIC
B-1
B-2
Instruments Which Use Data
Organizations May Already Collect

B-3
Injuries and Illnesses Instrument
Bureau of Labor Statistics (BLS) Instrument for Injuries and Illnesses Measure Number of nonfatal injuries and illnesses X 200,000
Number of all employee hours worked (not including non-work time, such as vacation, sick leave, holidays, etc.)
Administration Data collected from employers via survey and payroll records.
Scoring Can be scored by hand.
Availability Free.
Reliability N/A
Validity N/A

B-4
Retention Instruments
Leon, et al. Retention Instrument Remsburg, Armacost, and Bennett Retention Instrument
Measure # of nurse aides employed for less than one yeartotal # employees at time of survey # of nurse aides employed for 3 years or more total # employees at time of survey # of nurse aides employed for ten years or more total # employees at time of survey
# of nurse aides employed for more than one year # of nurse aides on payroll on the last day of the fiscal year length of service for terminated employees and staff who remained
Administration Data collected from nursing home administrator via survey.
Data collected from human resource records.
Scoring Can be scored by hand.
Can be scored by hand.
Availability Free.
Free.
Reliability N/A
N/A
Validity N/A
N/A
B-5
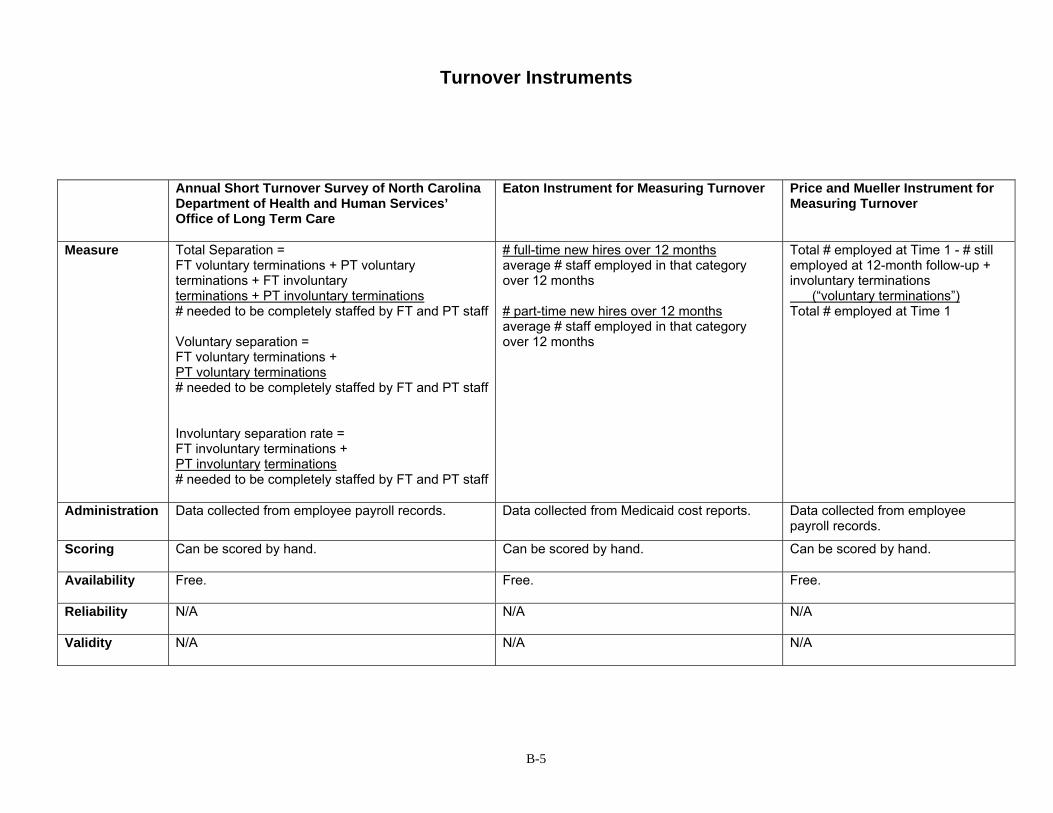
Turnover Instruments
Annual Short Turnover Survey of North Carolina Department of Health and Human Services’ Office of Long Term Care
Eaton Instrument for Measuring Turnover
Price and Mueller Instrument for Measuring Turnover
Measure Total Separation = FT voluntary terminations + PT voluntary terminations + FT involuntary terminations + PT involuntary terminations # needed to be completely staffed by FT and PT staff Voluntary separation = FT voluntary terminations + PT voluntary terminations # needed to be completely staffed by FT and PT staff Involuntary separation rate = FT involuntary terminations + PT involuntary terminations # needed to be completely staffed by FT and PT staff
# full-time new hires over 12 months average # staff employed in that category over 12 months # part-time new hires over 12 months average # staff employed in that category over 12 months
Total # employed at Time 1 - # still employed at 12-month follow-up + involuntary terminations (“voluntary terminations”)Total # employed at Time 1
Administration Data collected from employee payroll records. Data collected from Medicaid cost reports. Data collected from employee payroll records.
Scoring Can be scored by hand.
Can be scored by hand.
Can be scored by hand.
Availability Free.
Free.
Free.
Reliability N/A
N/A
N/A
Validity N/A
N/A
N/A

B-6
Vacancies Instruments
Job Openings and Labor Turnover Survey (JOLTS)
Job Vacancy Survey (JVS)
Leon, et al. Job Vacancies Instrument
Measure # job openings on last day of month total # employed for pay period that includes the 12th of the month (for full-time or part-time)
# job openings total # employed OR total # positions
# job openings total number of FTE positions on the day of the interview
Administration Data collected from human resources records via survey.
Data collected from human resources records via survey. No time frame specified for when to make calculation.
Data collected from human resources records via survey.
Scoring Can be scored by hand.
Can be scored by hand or by using purchased software.
Can be scored by hand.
Availability Free.
Free.
Free.
Reliability N/A
N/A
N/A
Validity N/A
N/A
N/A

B-7
Instruments Which Require New Data Collection --
Measures of DCW Job Characteristics
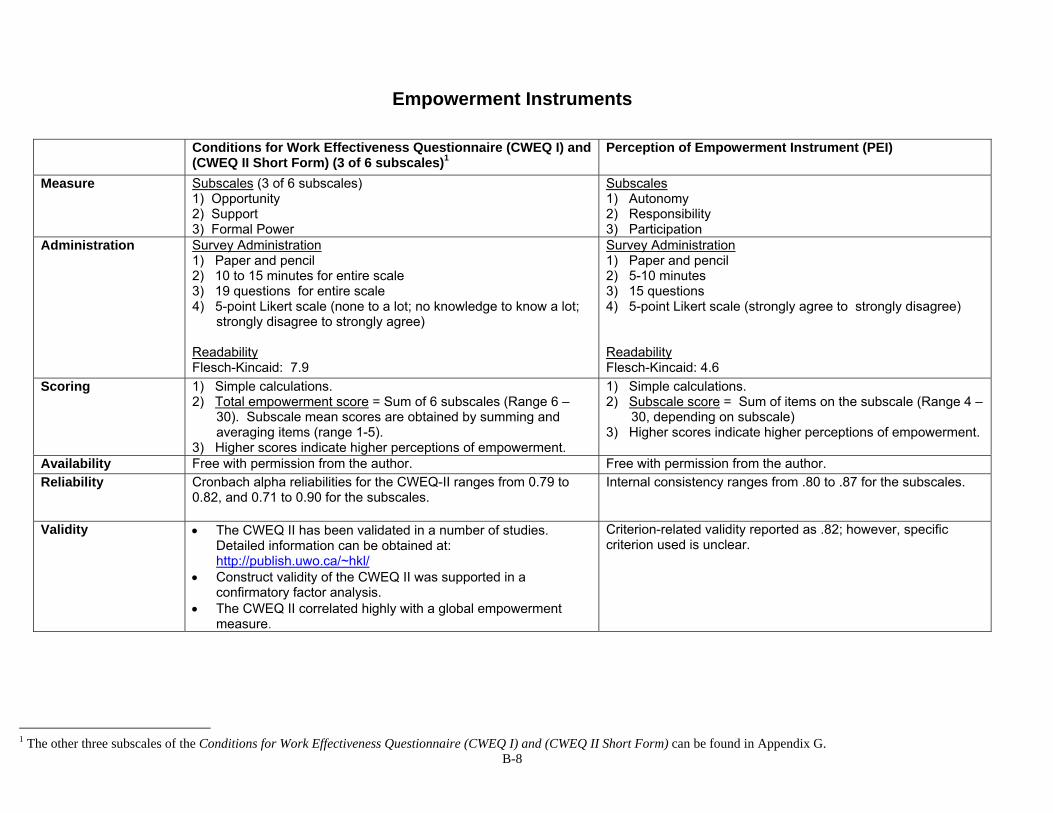
Empowerment Instruments
Conditions for Work Effectiveness Questionnaire (CWEQ I) and
(CWEQ II Short Form) (3 of 6 subscales)1Perception of Empowerment Instrument (PEI)
Measure Subscales (3 of 6 subscales) 1) Opportunity 2) Support 3) Formal Power
Subscales 1) Autonomy 2) Responsibility 3) Participation
Administration Survey Administration 1) Paper and pencil 2) 10 to 15 minutes for entire scale 3) 19 questions for entire scale 4) 5-point Likert scale (none to a lot; no knowledge to know a lot;
strongly disagree to strongly agree) Readability Flesch-Kincaid: 7.9
Survey Administration 1) Paper and pencil 2) 5-10 minutes 3) 15 questions 4) 5-point Likert scale (strongly agree to strongly disagree) Readability Flesch-Kincaid: 4.6
Scoring 1) Simple calculations. 2) Total empowerment score = Sum of 6 subscales (Range 6 –
30). Subscale mean scores are obtained by summing and averaging items (range 1-5).
3) Higher scores indicate higher perceptions of empowerment.
1) Simple calculations. 2) Subscale score = Sum of items on the subscale (Range 4 –
30, depending on subscale) 3) Higher scores indicate higher perceptions of empowerment.
Availability Free with permission from the author. Free with permission from the author. Reliability Cronbach alpha reliabilities for the CWEQ-II ranges from 0.79 to
0.82, and 0.71 to 0.90 for the subscales. Internal consistency ranges from .80 to .87 for the subscales.
Validity • The CWEQ II has been validated in a number of studies. Detailed information can be obtained at: http://publish.uwo.ca/~hkl/
• Construct validity of the CWEQ II was supported in a confirmatory factor analysis.
• The CWEQ II correlated highly with a global empowerment measure.
Criterion-related validity reported as .82; however, specific criterion used is unclear.
B-8 1 The other three subscales of the Conditions for Work Effectiveness Questionnaire (CWEQ I) and (CWEQ II Short Form) can be found in Appendix G.

B-9
Empowerment Instruments (continued)
Psychological Empowerment Instrument Yeatts and Cready Dimensions of Empowerment Measure
Measure Subscales 1) Meaning 2) Competence 3) Self-Determination 4) Impact
Subscale1) Ability to make workplace decisions 2) Ability to modify the work 3) Management listens seriously to CNAs 4) Management consults CNAs 5) Global empowerment
Administration Survey Administration 1) Paper and pencil 2) 5-10 minutes 3) 12 questions 4) 7-point Likert scale (very strongly agree to very strongly
disagree) Readability Flesch-Kincaid: 8.1
Survey Administration 1) Paper and pencil 2) 20 to 30 minutes 3) 26 questions 4) 5-point Likert scale (disagree strongly to agree strongly) Readability Flesch-Kincaid: Data not available at this time.
Scoring 1) Simple calculations. 2) Subscale score = Sum of items on the subscale (Range 3
- 21) Total scale score = Average of subscale scores (Range 3
- 21). 3) Higher scores indicate higher perceptions of
empowerment.
1) Simple calculations. 2) Total scale score = Sum of subscale scores, after reverse coding
the one negatively worded item (Range 26 – 130) 3) Higher scores indicate higher perceptions of empowerment.
Availability Free if used for research or non-commercial use with permission from the author.
Free with permission from the author.
Reliability Internal consistency ranges from .62 to .74 for the total scale and from .79 to .85 for the subscales.
Internal consistency ranges from .63 to .80 for the subscales. (It should be noted that the survey data are still in the process of being collected from 3 nursing homes, and additional reliability testing will be conducted in future phases of the research project.)
Validity Criterion-related validity: • Subscale scores were significantly but moderately related
to career intentions and organizational commitment.
No published information is available.

B-10
Job Design Instruments Job Characteristics Scales (JCS) of the Job Diagnostic
Survey (JDS) Revised (4 of 5 subscales)2Job Role Quality Questionnaire (JRQ)
Measure Subscales (4 of 5)
1) Skill variety 2) Task significance 3) Autonomy 4) Job feedback
Subscales Concern Factors: 1) Overload 2) Dead-end job 3) Hazard exposure 4) Supervision 5) Discrimination Reward factors: 1) Helping others 2) Decision authority 3) Challenge 4) Supervisor support 5) Recognition 6) Satisfaction with salary
Administration Survey Administration 1) Paper and pencil 2) 5-8 minutes 3) 12 questions 4) 7-item Likert scale (very little to very much) Readability Flesch-Kincaid: 6.8
Survey Administration 1) Designed for face-to-face interview, but may be possible to adapt to paper
and pencil, self-administered 2) Data on time not available 3) 36 questions 4) 4-item Likert scale (not at all (concerned/rewarding) to extremely
(concerned/rewarding)) Readability Flesch-Kincaid: 5.9
Scoring 1) Simple calculations. 2) Subscale score = Average of items on the subscale (Range 1 -
7) 3) Higher scores indicate better job design features.
1) Simple calculations. 2) Subscale score = Average of items on the subscale (Range 1 - 4) 3) Lower scores on Job Concern subscales indicate better job design
features; Higher scores on Job Reward subscales indicate better job design features.
Availability Free. Free.Reliability Internal consistency ranges from .75 to .79 for the subscales. Internal consistency ranges from .48 to .87 for the subscales. Validity Criterion-related validity:
• Job design correlates with intent to leave and is predictive of absenteeism and job satisfaction
Construct validity: • Subscales were confirmed using confirmatory factor analysis. • Logical variations in scores among social workers and LPNs. Criterion-related validity: • Hospital LPNs and nursing home LPNs report quite different job demands.
Hospital LPNs reported more overload and less decision authority than those in nursing homes.
2 The other subscale of the Job Characteristics Scales (JCS) of the Job Diagnostic Survey (JDS) Revised can be found in Appendix G.
B-11
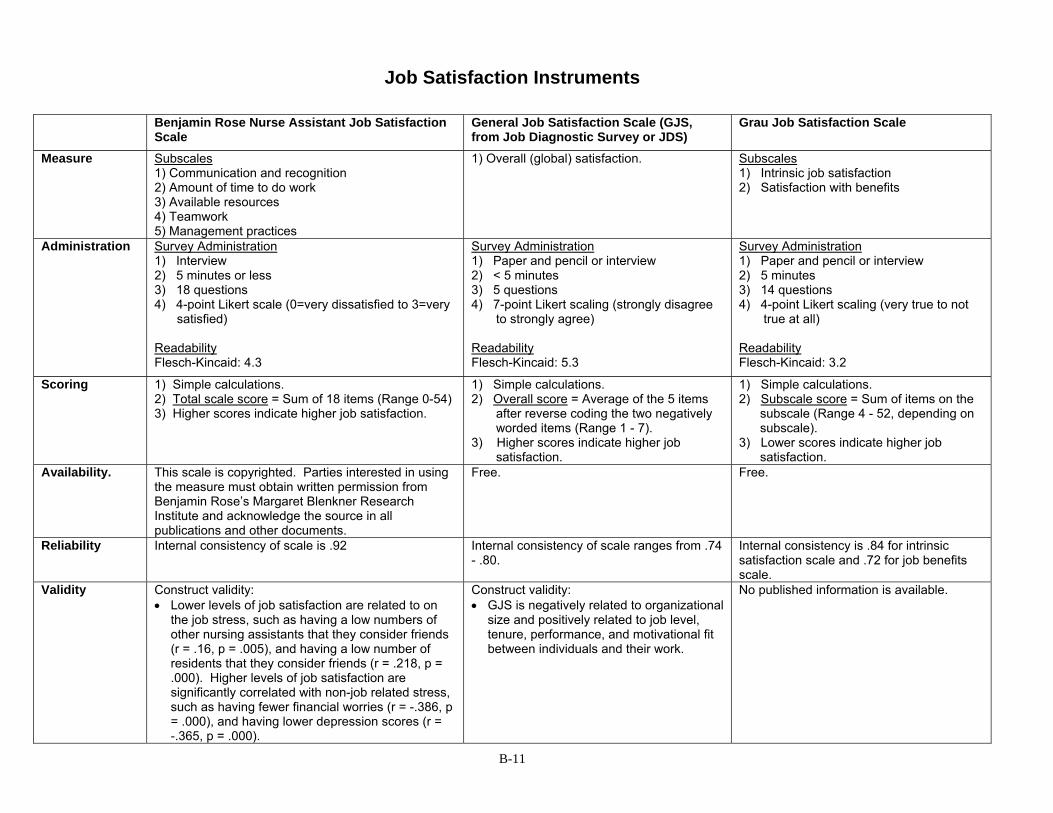
Job Satisfaction Instruments
Benjamin Rose Nurse Assistant Job Satisfaction Scale
General Job Satisfaction Scale (GJS, from Job Diagnostic Survey or JDS)
Grau Job Satisfaction Scale
Measure Subscales 1) Communication and recognition 2) Amount of time to do work 3) Available resources 4) Teamwork 5) Management practices
1) Overall (global) satisfaction. Subscales 1) Intrinsic job satisfaction 2) Satisfaction with benefits
Administration Survey Administration 1) Interview 2) 5 minutes or less 3) 18 questions 4) 4-point Likert scale (0=very dissatisfied to 3=very
satisfied) ReadabilityFlesch-Kincaid: 4.3
Survey Administration 1) Paper and pencil or interview 2) < 5 minutes 3) 5 questions 4) 7-point Likert scaling (strongly disagree
to strongly agree) Readability Flesch-Kincaid: 5.3
Survey Administration 1) Paper and pencil or interview 2) 5 minutes 3) 14 questions 4) 4-point Likert scaling (very true to not true at all) Readability Flesch-Kincaid: 3.2
Scoring 1) Simple calculations. 2) Total scale score = Sum of 18 items (Range 0-54) 3) Higher scores indicate higher job satisfaction.
1) Simple calculations. 2) Overall score = Average of the 5 items
after reverse coding the two negatively worded items (Range 1 - 7).
3) Higher scores indicate higher job satisfaction.
1) Simple calculations. 2) Subscale score = Sum of items on the subscale (Range 4 - 52, depending on subscale). 3) Lower scores indicate higher job satisfaction.
Availability. This scale is copyrighted. Parties interested in using the measure must obtain written permission from Benjamin Rose’s Margaret Blenkner Research Institute and acknowledge the source in all publications and other documents.
Free. Free.
Reliability Internal consistency of scale is .92 Internal consistency of scale ranges from .74 - .80.
Internal consistency is .84 for intrinsic satisfaction scale and .72 for job benefits scale.
Validity Construct validity: • Lower levels of job satisfaction are related to on
the job stress, such as having a low numbers of other nursing assistants that they consider friends (r = .16, p = .005), and having a low number of residents that they consider friends (r = .218, p = .000). Higher levels of job satisfaction are significantly correlated with non-job related stress, such as having fewer financial worries (r = -.386, p = .000), and having lower depression scores (r = -.365, p = .000).
Construct validity: • GJS is negatively related to organizational
size and positively related to job level, tenure, performance, and motivational fit between individuals and their work.
No published information is available.
B-12
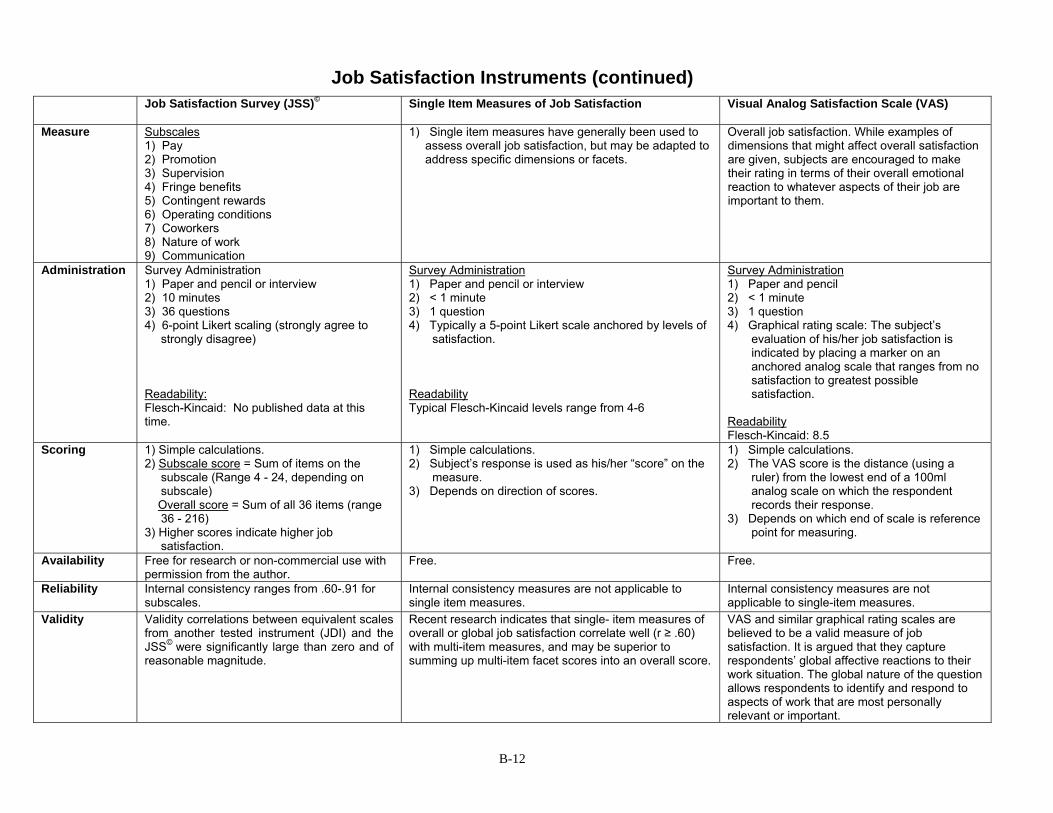
Job Satisfaction Instruments (continued) Job Satisfaction Survey (JSS)© Single Item Measures of Job Satisfaction Visual Analog Satisfaction Scale (VAS)
Measure Subscales
1) Pay 2) Promotion 3) Supervision 4) Fringe benefits 5) Contingent rewards 6) Operating conditions 7) Coworkers 8) Nature of work 9) Communication
1) Single item measures have generally been used to assess overall job satisfaction, but may be adapted to address specific dimensions or facets.
Overall job satisfaction. While examples of dimensions that might affect overall satisfaction are given, subjects are encouraged to make their rating in terms of their overall emotional reaction to whatever aspects of their job are important to them.
Administration Survey Administration 1) Paper and pencil or interview 2) 10 minutes 3) 36 questions 4) 6-point Likert scaling (strongly agree to
strongly disagree) Readability: Flesch-Kincaid: No published data at this time.
Survey Administration 1) Paper and pencil or interview 2) < 1 minute 3) 1 question 4) Typically a 5-point Likert scale anchored by levels of
satisfaction. Readability Typical Flesch-Kincaid levels range from 4-6
Survey Administration 1) Paper and pencil 2) < 1 minute 3) 1 question 4) Graphical rating scale: The subject’s
evaluation of his/her job satisfaction is indicated by placing a marker on an anchored analog scale that ranges from no satisfaction to greatest possible satisfaction.
Readability Flesch-Kincaid: 8.5
Scoring
1) Simple calculations. 2) Subscale score = Sum of items on the
subscale (Range 4 - 24, depending on subscale)
Overall score = Sum of all 36 items (range 36 - 216)
3) Higher scores indicate higher job satisfaction.
1) Simple calculations. 2) Subject’s response is used as his/her “score” on the
measure. 3) Depends on direction of scores.
1) Simple calculations. 2) The VAS score is the distance (using a
ruler) from the lowest end of a 100ml analog scale on which the respondent records their response.
3) Depends on which end of scale is reference point for measuring.
Availability Free for research or non-commercial use with permission from the author.
Free. Free.
Reliability Internal consistency ranges from .60-.91 for subscales.
Internal consistency measures are not applicable to single item measures.
Internal consistency measures are not applicable to single-item measures.
Validity Validity correlations between equivalent scales from another tested instrument (JDI) and the JSS© were significantly large than zero and of reasonable magnitude.
Recent research indicates that single- item measures of overall or global job satisfaction correlate well (r ≥ .60) with multi-item measures, and may be superior to summing up multi-item facet scores into an overall score.
VAS and similar graphical rating scales are believed to be a valid measure of job satisfaction. It is argued that they capture respondents’ global affective reactions to their work situation. The global nature of the question allows respondents to identify and respond to aspects of work that are most personally relevant or important.
B-13
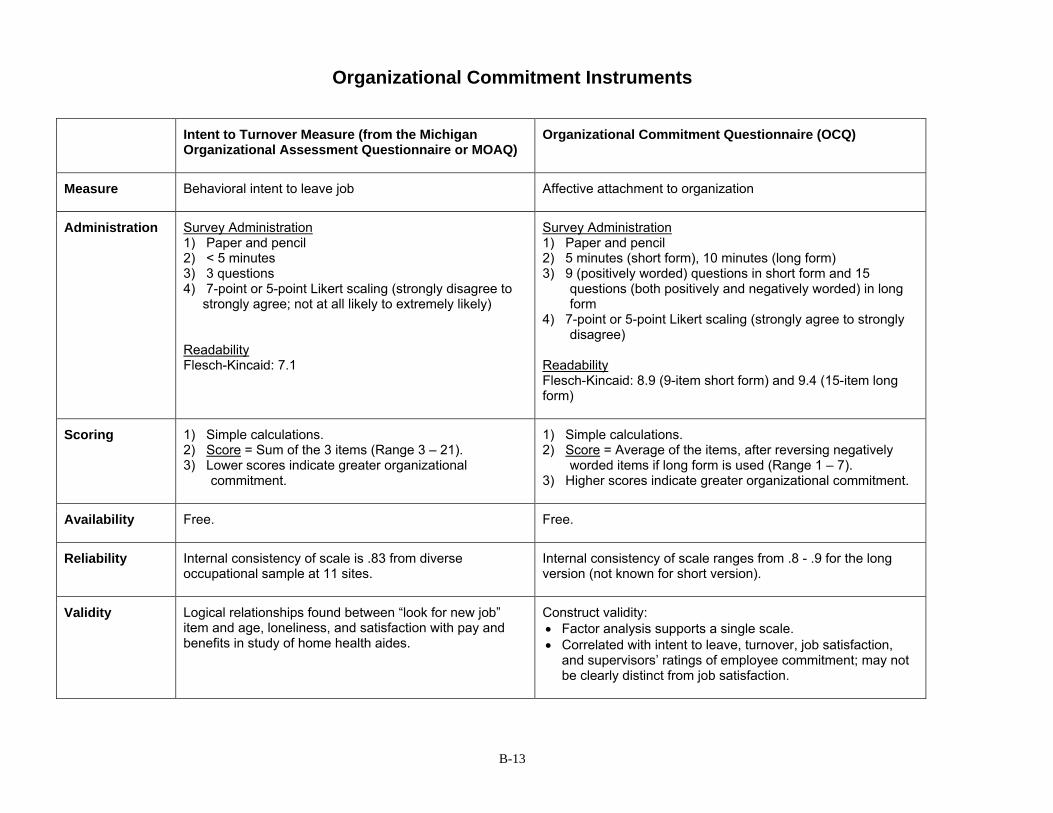
Organizational Commitment Instruments
Intent to Turnover Measure (from the Michigan Organizational Assessment Questionnaire or MOAQ)
Organizational Commitment Questionnaire (OCQ)
Measure Behavioral intent to leave job
Affective attachment to organization
Administration Survey Administration1) Paper and pencil 2) < 5 minutes 3) 3 questions 4) 7-point or 5-point Likert scaling (strongly disagree to
strongly agree; not at all likely to extremely likely) ReadabilityFlesch-Kincaid: 7.1
Survey Administration1) Paper and pencil 2) 5 minutes (short form), 10 minutes (long form) 3) 9 (positively worded) questions in short form and 15
questions (both positively and negatively worded) in long form
4) 7-point or 5-point Likert scaling (strongly agree to strongly disagree)
ReadabilityFlesch-Kincaid: 8.9 (9-item short form) and 9.4 (15-item long form)
Scoring 1) Simple calculations. 2) Score = Sum of the 3 items (Range 3 – 21). 3) Lower scores indicate greater organizational
commitment.
1) Simple calculations. 2) Score = Average of the items, after reversing negatively
worded items if long form is used (Range 1 – 7). 3) Higher scores indicate greater organizational commitment.
Availability Free.
Free.
Reliability Internal consistency of scale is .83 from diverse occupational sample at 11 sites.
Internal consistency of scale ranges from .8 - .9 for the long version (not known for short version).
Validity Logical relationships found between “look for new job” item and age, loneliness, and satisfaction with pay and benefits in study of home health aides.
Construct validity: • Factor analysis supports a single scale. • Correlated with intent to leave, turnover, job satisfaction,
and supervisors’ ratings of employee commitment; may not be clearly distinct from job satisfaction.

Worker-Client/Resident Relationships Instrument
Stress/Burden Scale from the California Homecare Workers Outcomes Survey (2 of 6 subscales)3
Measure Stress/Burden (2 of 6 subscales)
1) Relationship with client 2) Client role in provider’s work
Administration Survey Administration 1) Telephone interview 2) 1-2 minutes 3) 6 questions 4) 5-point Likert scales (very close to hostile; strongly agree to strongly disagree, or extremely well to not well a Readability: Published data not available at this time.
Scoring 1) Simple calculations. 2) Score = Average of the 6 items (Range 1-5). 3) Higher scores indicate the most stress.
Availability Free. If using this measure, please cite the following: Benjamin, A.E., and Matthias, R.E. (2004). Work Life Differences and Outcomes for Agency and Consumer-Directed Home Care Workers. The Gerontologist, 44(4): 479-488.
Reliability Internal consistency ranges from .63 - .75 for subscales.
Validity Published data on validity not available at this time.
B-14 3 The other four subscales of the Stress/Burden Scale from the California Homecare Workers Outcomes Survey can be found in the Workload topic section of Chapter 3.

B-15
Worker-Supervisor Relationships Instruments
Benjamin Rose Relationship with Supervisor Scale
Charge Nurse Support Scale
LEAP Leadership Behaviors and Organizational Climate Survey (1 of 2 subscales, Leadership)4
Measure Relationship with supervisor
Charge nurse support
Subscales 1) Leadership
Administration Survey Administration 1) Interview 2) Less than 5 minutes 3) 11 questions 4) 3-point Likert scale (2=most of the time to 0=hardly ever/never) ReadabilityFlesch-Kincaid: 6.2
Survey Administration 1) Paper and pencil 2) 10 minutes 3) 15 questions 4) 5-point Likert scale (never to always) Readability Flesch-Kincaid: Published data not available at this time.
Survey Administration 1) Paper and pencil 2) 5-6 minutes 3) 10 questions 4) 5-point Likert scale (very little to
always) Readability Flesch-Kincaid: 8.1
Scoring 1) Simple calculations. 2) Total scale score = Sum of items in the scale
(Range 0 - 22) 3) Higher scores indicate more positive
perceptions of supervisors.
1) Simple calculations. 2) Scale score = Sum of items in the scale (Range 15 - 75) 3) Higher scores indicate higher levels of
supportive charge nurses/supervisors.
1) Simple calculations 2) Sum of items 1-10 (Range of 10 -
50) 3) Higher scores indicate better
perceptions of leadership behaviors.
Availability This scale is copyrighted. Parties interested in using the measure must obtain written permission from Benjamin Rose’s Margaret Blenkner Research Institute and acknowledge the source in all publications and other documents.
Free with permission from author. Free with permission from author.
Reliability Internal consistency of scale is .90 Internal consistency for scale is .92 Internal consistency ranges from .75 to .82 for leadership items; .94 for the leadership subscale.
Validity Construct validity: • Better relationships with supervisors is
correlated with nursing assistants reporting higher levels of positive interaction with other staff members (r = .206, p = .000). Better relationships with supervisor is also significantly correlated with higher job satisfaction (r = .604, p = .000).
Construct validity. • The precursor supportive supervisory
scale has been show to be related to how well an aide related to a client during care (r = .42, p = .05).
Discriminant validity showed high intercorrelations among leadership items.
4 The other subscale (Organizational Climate) of the LEAP Leadership Behaviors and Organizational Climate Survey can be found in the Organizational Culture topic section of Chapter 3.

B-16
Worker-Supervisor Relationships Instruments (continued)
Supervision Subscales of the Job Role Quality Questionnaire (JRQ) (2 of 11 subscales)5
Measure Subscales (2 of 11) Concern Factors: 1) Supervision Reward factors: 1) Supervisor Support
Administration Survey Administration 1) Designed for face-to-face interview, but may be possible to adapt to paper and pencil, self-
administered 2) Data on time not available 3) 8 questions (4 for poor supervision subscale and 4 for supervisor support subscale) 4) 4-item Likert scale (not at all (concerned/rewarding) to extremely (concerned/rewarding)) Readability Flesch-Kincaid: 5.9
Scoring 1) Simple calculations. 2) Subscale score = Average of items on the subscale (Range 1 – 4) 3) Lower scores on Job Concern subscales indicate better job design features; Higher scores on Job Reward subscales indicate better job design features.
Availability Free.
Reliability Internal consistency ranges from .48 to .87 for the subscales.
Validity Construct validity: • Subscales were confirmed using confirmatory factor analysis • Logical variations in scores among social workers and LPNs. Criterion-related validity: • Hospital LPNs and nursing home LPNs report quite different job demands. Hospital LPNs reported
more overload and less decision authority than those in nursing homes.
5 All subscales of the Job Role Quality Questionnaire can be found in the Job Design topic section of Chapter 3.

Workload Instruments
Quantitative Workload Scale from the Quality of Employment Survey
Role Overload Scale (from the Michigan Organizational Assessment Questionnaire or MOAQ)
Stress/Burden Scale from the California Homecare Workers Outcomes Survey (4 of 6 subscales)6
Measure Workload
Role Overload
Stress/Burden (4 of 6 subscales) 1) Client safety concerns for provider 2) Family issues 3) Client behavioral problems 4) Emotional state of provider
Administration Survey Administration 1) Paper and pencil 2) 2 minutes 3) 4 questions 4) 5-point Likert scale (very often to rarely) Readability Flesch-Kincaid: 3.8
Survey Administration 1) Paper and pencil 2) 2 minutes 3) 3 questions 4) 7-point Likert scale (strongly disagree to strongly
agree) Readability Flesch-Kincaid: 4.7
Survey Administration 1) Telephone interview 2) 4–5 minutes 3) 15 questions 4) 5-point Likert scale (very often to never or
strongly agree to strongly disagree, or all to most of the time)
Readability: Published data not available at this time.
Scoring 1) Simple calculations. 2) Score = Average of the 4 items (Range 1 – 5). 3) Higher scores indicate higher workload.
1) Simple calculations. 2) Score = Average of the 3 items after reverse scoring
item #2 (Range 1–7). 3) Higher scores indicate higher workload.
1) Simple calculations. 2) Score = Average of the 15 items (Range 1 - 5). 3) Higher scores indicate the most stress.
Availability Free. Free.
Free. If using this measure, please cite the following: Benjamin, A.E., and Matthias, R.E. (2004). Work Life Differences and Outcomes for Agency and Consumer-Directed Home Care Workers. The Gerontologist, 44(4): 479-488.
Reliability Internal consistency of scale is not reported. However, since items are highly correlated (.5 - .6), it may be suitable to use only one item.
Internal consistency of scale is .65 in original sample of 400 respondents with varied jobs.
Internal consistency ranges from .63 - .75 for subscales.
Validity Criterion validity: • Scale is negatively related to job satisfaction (higher
workload, lower satisfaction) • Scale is distinct from role conflict and role clarity in
factor analysis.
Criterion validity: The scale is negatively related to overall job satisfaction (higher workload, lower satisfaction).
Published data on validity not available at this time.
B-17 6 The other two subscales of the Stress/Burden Scale from the California Homecare Workers Outcomes Survey can be located in the Worker-Client/Resident Relationships topic section of Chapter 3.
B-18
Instruments Which Require New Data Collection -- Measures of the Organization

Organizational Culture Instruments
LEAP Leadership Behaviors and Organizational Climate Survey (1 of 2 subscales, Organizational Climate)7
LEAP Organizational Learning Readiness Survey
Measure Subscales (1 of 2) 1) Organizational climate
Management Style subscales 1) Autocratic 2) Custodial 3) Supportive 4) Collegial subscale Organization Readiness for Learning Subscales 1) Mobility 2) Visioning 3) Empowering 4) Evaluating
Administration Survey Administration 1) Paper and pencil 2) 2-3 minutes 3) 4 questions 4) 5-point Likert scale (very little to always) Readability Flesch-Kincaid: 6.4
Survey Administration 1) Paper and pencil 2) Data on time unavailable 3) 20 questions 4) 5-point Likert scale (almost never almost always (except for two reversed scales) Readability Flesch-Kincaid: 11.0 (The survey is designed primarily for administration and managers.)
Scoring 1) Simple calculations 2) Subscale score = Sum of items 1-4 (Range of 4-20) 3) Higher scores indicate better perceptions of organizational climate.
1) Simple calculations. 2) Subscale scores = Sum of items on the subscale (Range 20–100). 3) Highest scored subscales determine the management style. Higher scores on
Organization Readiness for Learning scale indicate greater readiness for learning in each dimension.
Availability Free with permission from author. Free with permission from author. Reliability Internal consistency ranges from .54 to .62 for organizational climate items; .65 for
the total organizational climate score.
Internal consistency for management styles: autocratic subscales - .798; custodial subscales - .623; supportive subscales - .709; collegial subscales - .820. Internal consistency for learning readiness dimensions: mobility subscales - .642; visioning subscales- .841; empowering subscales - .644; evaluating subscales - .726.
Validity Construct validity and discriminant validity of organizational climate items reported – four distinct “clusters” that relate to four concepts identified in the theoretical model of organizational climate.
Construct validity of the management scale and learning readiness scale supported. For the management scale, three components were identified: autocratic style, custodial style, and supportive/collegial style. The supportive/collegial styles of management best support organizational learning cultures. For learning readiness, all factors loaded on a single dimension which was to be expected given all four dmensions are key to establish an organization’s readiness to learn.
7 The other subscale (Leadership) of the LEAP Leadership Behaviors and Organizational Climate Survey can be found in the Worker-Supervisor Relationships topic section in Chapter 3.
B-19

Organizational Culture Instruments (continued) Nursing Home Adaptation of the Competing Values Framework (CVF) Organizational Culture Assessment
Measure Subscales (e.g., Culture Types) 1) Group 2) Developmental 3) Hierarchy 4) Market
Administration Survey Administration 1) Paper and pencil 2) 10 minutes 3) 24 questions (4 in each of 6 sets) 4) Distribution of 100 points for each of 6 sets of 4 categories. Respondents must know basic math. Readability Flesch-Kincaid: 10.6 (Although the tools actually tests at a 10.6 grade level the tool has been used successfully with all levels of nursing home staff in over 140 nursing homes.)
Scoring 1) Subscale (culture type) score = Validate that each section adds up to 10 and then multiply each section total by 10 to maintain relative value on a 100 point scale. • Add across sections so that the first question in each section is added, the second question in each section is added, etc. There will be a
total of four different sets of six questions. • Divide the sum of each set of six questions by six to get the relative value of each cultural type, the first question set provides the relative
value score for group, the second question provides the relative value score for adhocracy or risk taking, the third question set provides the relative value score for hierarchy and the fourth question set provides the relative value score for market.
• Subscale and total scores were averaged across raters to obtain facility scores. 2) For each type, higher scores indicate the organization is perceived to reflect more characteristics of this type (than other types). 3) Note the difference between the overall scores, if the score is 10 greater than the other values there is a strong culture. 4) Also note if the same patterns of strength exist across the six dimensions (sets of questions), this suggests there is congruence within the
different aspects of the organizational culture (Scott-Cawiezell, in press). Availability Free with permission from the author. Reliability Measures of internal consistency can not be computed because the CVF is a scale with relative rather than absolute values (Scott-Cawiezell, et
al, in press). Validity Construct validity:
• The relationship between CVF scores and selected subscales (organizational harmony, connectedness, and clinical leadership subscales) from another tested tool (Shortell Organization and Management Survey) were examined. There was a strong positive correlation between the group orientation of the CVF and the modified Shortell subscales of organizational harmony and connectedness and a strong inverse relationship between the hierarchy dominance and organizational harmony and connectedness.
B-20

MEASURING LONG-TERM CARE WORK:
A Guide to Selected Instruments to Examine Direct
Care Worker Experiences and Outcome
PDF Files Available for This Report
Cover, Table of Contents, Acknowledgments and Executive Summaryhttp://aspe.hhs.gov/daltcp/reports/dcwguide.pdf
CHAPTER 1: Introduction and Purpose of Guidehttp://aspe.hhs.gov/daltcp/reports/dcwguide1.pdf
CHAPTER 2: How This Guide Can Help Organizations Use Information to Address theChallenges of Job Retention and Performance Among DCWshttp://aspe.hhs.gov/daltcp/reports/dcwguide2.pdf
CHAPTER 3: Ready to Use Instruments http://aspe.hhs.gov/daltcp/reports/dcwguide3.pdf
References http://aspe.hhs.gov/daltcp/reports/dcwguide4.pdf
APPENDIX A: From Start to Finish -- Sample Scenarios of Using and/or Constructing SurveyInstruments http://aspe.hhs.gov/daltcp/reports/dcwguideA.pdf
APPENDIX B: Overview Charts of Chapter 3 Measures, By Topichttp://aspe.hhs.gov/daltcp/reports/dcwguideB.pdf
APPENDIX C: Data Collection Planning and Implementation Issueshttp://aspe.hhs.gov/daltcp/reports/dcwguideC.pdf
APPENDIX D: Resources for Providers Considering Use of Employee Surveyshttp://aspe.hhs.gov/daltcp/reports/dcwguideD.pdf
APPENDIX E: Individual Measures from Chapter 3 that Use Survey Instruments to CollectData, By Topic http://aspe.hhs.gov/daltcp/reports/dcwguideE.pdf
APPENDIX F: Ready Made Multi-Topic Survey Instrumentshttp://aspe.hhs.gov/daltcp/reports/dcwguideF.pdf
APPENDIX G: Instruments Needing Work http://aspe.hhs.gov/daltcp/reports/dcwguideG.pdf
APPENDIX H: Guide Reviewers http://aspe.hhs.gov/daltcp/reports/dcwguideH.pdf