Appendix B – Detention and Infiltration Pond Design ... · These mitigation techniques include...
56
Appendix B – Detention and Infiltration Pond Design Analyses–Technical Documentation (Parametrix Technical Memorandum)
Transcript of Appendix B – Detention and Infiltration Pond Design ... · These mitigation techniques include...

Appendix B – Detention and Infiltration Pond Design Analyses–Technical Documentation (Parametrix Technical
Memorandum)


M E M O R A N D U M
Date: July 18, 2007 – Revised July 31, 2007
To: Mark Ewbank; Herrera Dave Felstul; Herrera
From: Jenna Friebel
Subject: Detention and Infiltration Pond Design Analyses Technical Documentation
cc: Tom Atkins; Parametrix Paul Fendt; Parametrix Joan Lee; Parametrix
Project Number: 558-2535-005 AZ.AZ4
Project Name: Airport Runoff Manual
OVERVIEW Many of the traditional methods for managing stormwater identified in the Washington State Department of Ecology (Ecology) 2005 Stormwater Management Manual for Western Washington (Ecology Manual), such as open ponds, attract wildlife that can pose a hazard for aircraft (Washington State Department of Transportation [WSDOT] Aviation 2006). However, airports in Washington are still required to manage stormwater runoff for new development and facility upgrades. This Technical Memorandum provides documentation on how the Western Washington Hydrology Model (WWHM) and the Ecology Manual were used to evaluate traditional detention and infiltration pond designs and develop recommendations for modifications to these designs resulting in the facilities being less of a wildlife attractant and more appropriate for use at airports.
DESIGN GUIDANCE A number of operational and regulatory requirements determine how airports in the State of Washington must manage stormwater on their property. Ecology is the lead agency responsible for stormwater regulations in the state and has developed two stormwater management manuals (one for eastern Washington and one for western Washington), which include standards and criteria related to controlling the quality and quantity of stormwater runoff (Ecology 2004, 2005). In addition, the Federal Aviation Administration (FAA) has developed the following recommendations for mitigation techniques to reduce wildlife hazards associated with existing stormwater facilities (FAA 2004). These mitigation techniques include the following:
• Modify stormwater detention ponds to allow a maximum 48-hour detention (ponding) period for the design storm.
• Use steep-sided, narrow, linear-shaped detention basins.
(Rev. 06/04)
Herrera July 18, 2007 – revised July 31, 2007 Page 2
• Increase the depth of the facility and make it more linear to achieve capacity without increasing surface area.
• Use a two-chambered design if necessary, and design the pond with at least a ½ to 1 percent gradient from the upper to lower pond, making sure that the outlet/control structure is at the absolute lowest point.
To meet the mitigation techniques, the required modifications to the traditional methods for managing stormwater generally fell into two categories:
• Category 1 Modifications: Modifications in the first category are intended to minimize the duration and frequency of inundation of water to less than 48 hours. Hydrologic modeling was used to generate recommendations for modifications to detention and infiltration best management practices (BMPs) to help achieve this goal. The methods used for the hydrologic modeling and the associated results are documented in the following sections.
• Category 2 Modifications: The second category includes simple modifications to the physical
geometry of the BMP to make it less likely to attract wildlife. These modifications did not require hydrologic or hydraulic analysis and are the same for both detention and infiltration BMPs. These modifications are included in the proposed BMP fact sheets and are not discussed further in this Technical Memorandum.
DETENTION POND HYDROLOGIC ANALYSIS As discussed in the previous section, traditional detention ponds are considered a wildlife attractant. For verification, a hydrologic analysis was performed for a traditional detention pond (Step 1). Once it was verified that a traditional pond design is a wildlife attractant, a more detailed analysis was performed to modify the pond geometry to reduce the attractant potential (Step 2).
Step 1: Hydrologic Model to Evaluate Traditional Detention Pond Design The WWHM and Ecology Manual (Ecology 2005) were used to design a traditional detention pond (Table 1; Attachment 1).
Table 1. Land Use for Traditional Pond Design
Land Use (Acres on Till Soils)
Pre-Development Post-Development
Forest Landscape Impervious Forest Landscape Impervious Pond 1 5.0 0.0 0.0 0.0 2.0 3.0
Once the pond was sized, the hourly volume information in the WWHM output files for the entire data set (50 years) was exported to excel. The duration of time in consecutive hours, that the pond had a volume greater than zero was calculated for each year. Based on output from WWHM, it was determined that Pond 1 had a volume of water greater than 0.0 for an average of 80 consecutive days per year (Attachment 1). It was assumed that the analysis performed on Pond 1 is representative of detention ponds designed for a variety of land-use conditions in western Washington. Therefore, it was assumed that all detention ponds sized to meet Ecology requirements would exceed the 48-hour maximum inundation criteria and would be considered a wildlife attractant.

Herrera July 18, 2007 – revised July 31, 2007 Page 3 Based on these results, Parametrix recommended that the traditional detention pond design be modified for use in the vicinity of an airport to reduce the risk of attracting hazardous wildlife.
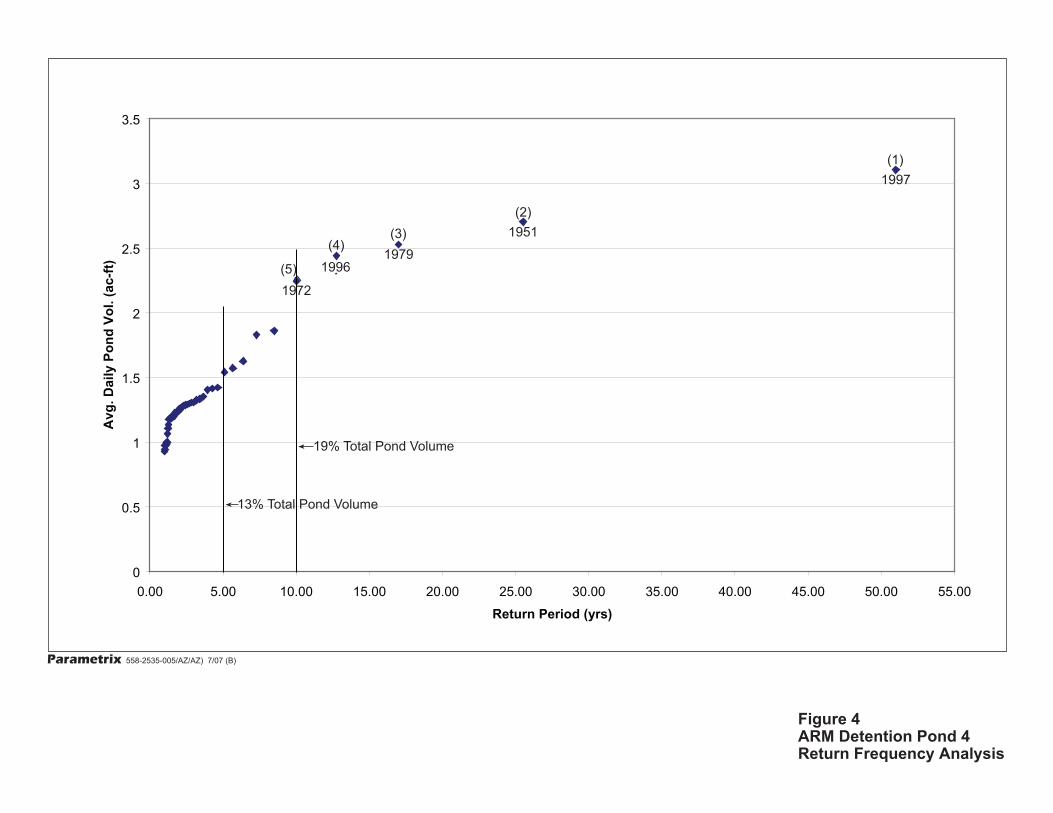
Step 2: Recommended Detention Pond Modifications The recommended detention pond modifications include designing the pond with two cells instead of the traditional one cell. The first cell (adjacent to the discharge structure) would be inundated frequently and for more than 48 hours; the second cell would be inundated less frequently and for less than 48 hours. Therefore, only the first cell would require additional wildlife deterrent such as wire grid or bird balls. This design approach minimizes installation and maintenance costs and still meets Ecology’s stormwater management requirements and FAA’s wildlife deterrent goals. In order to recommend a size for the first cell of the pond, a return frequency analysis using WWHM was performed on the pond volume for four different land use scenarios (Table 2).
Table 2. Land Use for the Return Frequency Analysis
Land Use (Acres on Till Soils)
Pre-Development Post-Development
Forest Landscape Impervious Forest Landscape Pasture Impervious Pond 1 5 0 0 0 2 0 3 Pond 2 4 0 0 0 3 0 1 Pond 3 10 0 0 0 2 2 6 Pond 4 40 10 0 5 15 0 30
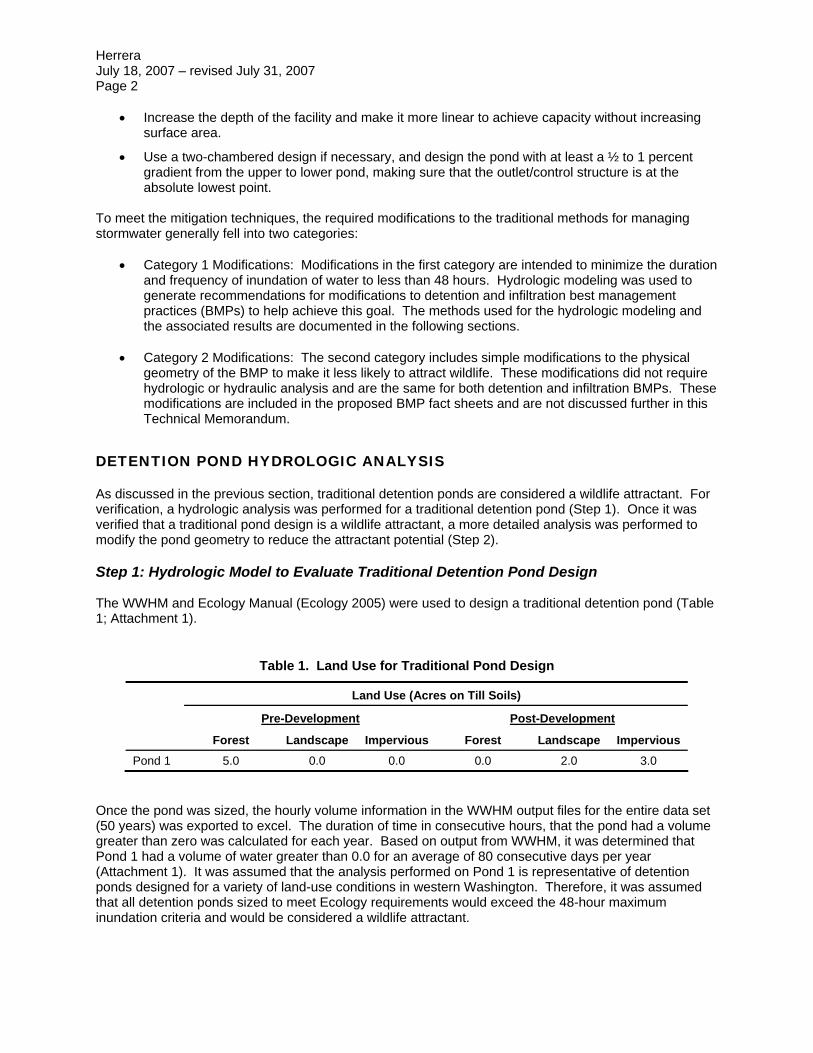
The average daily pond volume was selected for this analysis because it is more representative of project goals, which are to reduce the area ponded for more than 48-hours and to minimize the area that required additional wildlife deterrent BMPs. The average daily pond volume for each year of record was calculated for each pond. This value was then ranked, the return frequency was determined using Weibull’s equations, and the values were plotted (Figures 1 through 4) (Linsley et al. 1982). Although the ponds represent a wide range of land uses, the results for each pond were consistent. Based on this analysis, the large, less frequent storm events accounted for most of the pond volume. Storms with a frequency of less than 5 years only accounted for between 13 and 21 percent of the total pond volume and storms with a 10-year return frequency accounted for between 16 and 29 percent of the total pond volume (see Figures 1 through 4). Therefore, it was recommended that the first cell of the pond be designed to have a volume that is 20 to 30 percent of the total pond volume1. To optimize this recommendation and calculate the actual time the second cell is inundated additional modeling would be required.
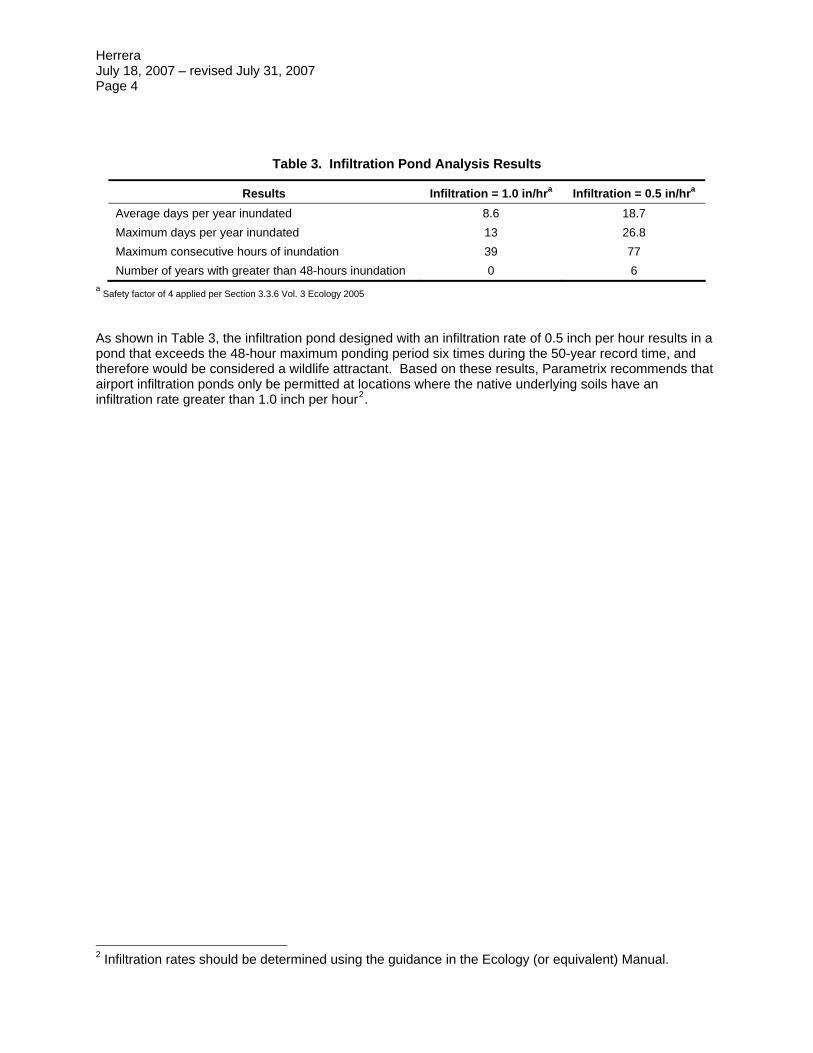
INFILTRATION POND ANALYSIS As discussed in the previous section, traditional infiltration ponds may also be considered a wildlife attractant. To evaluate this, a hydrologic analysis was performed for a traditional infiltration pond using a variety of infiltration rates to determine if the pond meets the 48-hour drawdown time requirement. The Pond 1 land use (see Table 2) was used to size the infiltration facility. As shown in Table 3, the period of inundation varies depending on the infiltration rate selected.
1 The Ecology Manual (or equivalent) should be used to determine the total pond volume and allowable discharge rates.
Herrera July 18, 2007 – revised July 31, 2007 Page 4
Table 3. Infiltration Pond Analysis Results
Results Infiltration = 1.0 in/hra Infiltration = 0.5 in/hra Average days per year inundated 8.6 18.7 Maximum days per year inundated 13 26.8 Maximum consecutive hours of inundation 39 77 Number of years with greater than 48-hours inundation 0 6
a Safety factor of 4 applied per Section 3.3.6 Vol. 3 Ecology 2005 As shown in Table 3, the infiltration pond designed with an infiltration rate of 0.5 inch per hour results in a pond that exceeds the 48-hour maximum ponding period six times during the 50-year record time, and therefore would be considered a wildlife attractant. Based on these results, Parametrix recommends that airport infiltration ponds only be permitted at locations where the native underlying soils have an infiltration rate greater than 1.0 inch per hour2.
2 Infiltration rates should be determined using the guidance in the Ecology (or equivalent) Manual.

Herrera July 18, 2007 – revised July 31, 2007 Page 5
REFERENCES
Ecology (Washington State Department of Ecology). 2004. Stormwater Management Manual for Eastern Washington. Ecology Publication 04-10-076. Washington State Department of Ecology. September 2004.
Ecology (Washington State Department of Ecology). 2005. Stormwater Management Manual for Western Washington. 5 vols. Ecology Publications 05-10-029 through 05-10-0339. Washington State Department of Ecology, Water Quality Program. February 2005.
FAA (Federal Aviation Administration). 2004. Hazardous Wildlife Attractants on or Near Airport. Advisory Circular 150/5200-33A. Federal Aviation Administration.
Linsley, R.K., M.A. Kohler, J.L.H. Paulhus. 1982. Hydrology for Engineers, Third Edition, McGraw-Hill, New York, New York.
WSDOT (Washington State Department of Transportation) Aviation. 2006. A Guidance Document for the Development of a Washington State Stormwater Management Manual Mitigating Hazardous Wildlife Attractants at Airports. Prepared by Herrera Environmental Consultants Inc. for WSDOT Aviation. Arlington, Washington.


FIGURES


Parametrix 558-2535-005/AZ/AZ) 7/07 (B)
Figure 1ARM Detention Pond 1Return Frequency Analysis
0
0.05
0.1
0.15
0.2
0.25
0.3
0.35
0.4
0.00 5.00 10.00 15.00 20.00 25.00 30.00 35.00 40.00 45.00 50.00 55.00
Return Period (yrs)
Avg
. Dai
ly P
ond
Volu
me
(ac-
ft)
(5)
1996
(4)
1972
(3)
1979
16% Total Pond Volume
13% Total Pond Volume
(2)
1951
(1)
1997

Parametrix 558-2535-005/AZ/AZ) 7/07 (B)
Figure 2ARM Detention Pond 2Return Frequency Analysis
0
0.05
0.1
0.15
0.2
0.25
0.3
0.35
0 5 10 15 20 25 30 35 40 45 50 55
Return Period (yrs)
Avg
. Dai
ly P
ond
Volu
me
(ac-
ft)
(5)1972
(4)1996
(3)1979
25% Total Pond Volume
18% Total Pond Volume
(2)1951
(1)
1997

Parametrix 558-2535-005/AZ/AZ) 7/07 (B)
Figure 3ARM Detention Pond 3Return Frequency Analysis
0
0.2
0.4
0.6
0.8
1
1.2
0.00 5.00 10.00 15.00 20.00 25.00 30.00 35.00 40.00 45.00 50.00 55.00
Return Period (yrs)
Avg
. Dai
ly P
ond
Vol.
(ac-
ft)
(5)
1979
(4)1991
(3)1997
29% Total Pond Volume
21% Total Pond Volume
(2)
1951
(1)1996
Parametrix 558-2535-005/AZ/AZ) 7/07 (B)
Figure 4ARM Detention Pond 4Return Frequency Analysis
0
0.5
1
1.5
2
2.5
3
3.5
0.00 5.00 10.00 15.00 20.00 25.00 30.00 35.00 40.00 45.00 50.00 55.00
Return Period (yrs)
Avg
. Dai
ly P
ond
Vol.
(ac-
ft) (5)1972
(4)1996
(3)1979
19% Total Pond Volume
13% Total Pond Volume
(2)1951
(1)1997

ATTACHMENTS


POND TRIAL #1 POND TRIAL #2ARMDET1.prj Detention Pond Design WWHM ARMDET2.prj Detention Pond Design - WWHMLand Use predev = 5ac forest till Land Use predev = 4ac forest tillLand Use dev = 3ac Imp; 2ac landscape till Land Use dev = 1ac Imp; 3ac landscape tillInfiltration rate = 0.0 Infiltration rate = 0.0L:W = 3:1; 160.8ft x 53.6ft x 6ft + 1 ft freeboard L:W = 3:1; 113.4 ft x 37.8 ft x 6 ft + 1 ft freeboardss=2:1 ss=2:1Total Pond Volume @ Riser = 1.57 ac-ft Total Pond Volume @ Riser = 0.87 ac-ft
Avg. Daily Pond Vol. Max 0.33 ac-ft Avg. Daily Pond Vol. Max 0.31 ac-ft% of pnd volume 21% % of pnd volume 36%
5-yr 10-yr max 5-yr 10-yr maxAvg. Daily Pond Volume (ac-ft) 0.20 0.25 0.34 Pond Volume (ac-ft) 0.16 0.21 0.31% of Total Pond Volume 13% 16% 21% % of Total Pond Volume 18% 25% 35%
Return Frequncy Volume Return Frequncy Volume
Airport Runoff Manual - Technical DocumentationParametrix 558-2535-005July 17, 2007 Attachment 1

POND TRIAL #3 POND TRIAL #4ARMDET3.prj Detention Pond Design - WWHM ARMDET4.prj Detention Pond Design - WWHMLand Use predev = 10ac forest till Land Use predev = 40ac forest till; 10ac till grassLand Use dev = 6ac Imp; 2ac landscape till; 2ac pasture till Land Use dev = 30ac Imp; 15ac grass till; 5ac forestInfiltration rate = 0.0 Infiltration rate = 0.0L:W = 3:1; 230.5 ft x 76.9 ft x 6 ft + 1 ft freeboard L:W = 3:1; 485.7 ft x 161.9 ft x 6 ft + 1 ft freeboardss=2:1 ss=2:1Total Pond Volume @ Riser = 2.98 ac-ft Total Pond Volume @ Riser = 11.93 ac-ft
Avg. Daily Pond Vol. Max 1.09 ac-ft Avg. Daily Pond Vol. Max 3.10 ac-ft% of pnd volume 37% % of pnd volume 26%
5-yr 10-yr max 5-yr 10-yr maxPond Volume (ac-ft) 0.64 0.85 1.09 Pond Volume (ac-ft) 1.54 2.24 3.10% of Total Pond Volume 21% 29% 37% % of Total Pond Volume 13% 19% 26%
Return Frequncy Volume Return Frequncy Volume
Airport Runoff Manual - Technical DocumentationParametrix 558-2535-005July 17, 2007 Attachment 1

WESTERN WASHINGTON HYDROLOGY MODEL V2PROJECT REPORT
_____________________________________________________
Project Name: ARMDET1Site Address:City :Report Date : 1/24/2007Gage : SeatacData Start : 1948Data End : 1998Precip Scale: 1.17_____________________________________________________
_____________________________________________________
PREDEVELOLAND USE
Basin : Basin 1Flows To : Point of ComplianceGroundWater No
Land Use AcresTILL FOREST: 5
_____________________________________________________
_____________________________________________________
DEVELOPEDLAND USEBasin : Basin 1Flows To : Pond 1GroundWater No
Land Use AcresTILL GRASS: 2IMPERVIOUS 3
_____________________________________________________
_____________________________________________________
RCHRES (POND) INFORMATIONPond Name: Pond 1Pond Type: Trapezoidal PondPond Flows to : Point of CompliancePond Rain / Evap is not activated.DimensionsDepth: 7ft.Bottom Length: 160.81ft.Bottom Width : 53.64ft.Side slope 1:00 2 To 1Airport Runoff Manual - Technical DocumentationParametrix 558-2535-005July 17, 2007 Attachment 1

Side slope 2:00 2 To 1Side slope 3:00 2 To 1Side slope 4:00 2 To 1Volume at Riser Head: 1.569 acre-ft.Discharge StructureRiser Height: 6 ft.Riser Diameter: 18 in.NotchType : RectangularNotch Width : 0.034 ft.Notch Height: 2.338 ft.Orifice 1 Diameter: 1.307 in. Elevati 0 ft.
Pond Hydraulic TableStage(ft) Area(acr) Volume(acr-ft) Dschrg(cfs) Infilt(cfs)
0.00 0.20 0.00 0.00 00.08 0.20 0.02 0.01 00.16 0.20 0.03 0.02 00.23 0.20 0.05 0.02 00.31 0.20 0.06 0.03 00.39 0.21 0.08 0.03 00.47 0.21 0.10 0.03 00.54 0.21 0.11 0.03 00.62 0.21 0.13 0.04 00.70 0.21 0.14 0.04 00.78 0.21 0.16 0.04 00.86 0.22 0.18 0.04 00.93 0.22 0.19 0.04 01.01 0.22 0.21 0.05 01.09 0.22 0.23 0.05 01.17 0.22 0.25 0.05 01.24 0.22 0.26 0.05 01.32 0.23 0.28 0.05 01.40 0.23 0.297 0.05 01.48 0.23 0.315 0.06 01.56 0.23 0.33 0.06 01.63 0.23 0.35 0.06 01.71 0.23 0.37 0.06 01.79 0.23 0.39 0.06 01.87 0.24 0.41 0.06 01.94 0.24 0.42 0.06 02.02 0.24 0.44 0.06 02.10 0.24 0.46 0.07 02.18 0.24 0.48 0.07 02.26 0.24 0.50 0.07 02.33 0.25 0.52 0.07 02.41 0.25 0.54 0.07 02.49 0.25 0.56 0.07 02.57 0.25 0.58 0.07 02.64 0.25 0.60 0.07 02.72 0.25 0.61 0.07 02.80 0.26 0.63 0.075 02.88 0.26 0.65 0.076 0
Airport Runoff Manual - Technical DocumentationParametrix 558-2535-005July 17, 2007 Attachment 1

2.96 0.26 0.67 0.077 03.03 0.26 0.70 0.078 03.11 0.26 0.72 0.079 03.19 0.27 0.74 0.080 03.27 0.27 0.76 0.081 03.34 0.27 0.78 0.082 03.42 0.27 0.80 0.083 03.50 0.27 0.82 0.084 0 50% of Predev Q2yr3.58 0.27 0.84 0.09 03.66 0.28 0.86 0.09 03.73 0.28 0.88 0.09 03.81 0.28 0.90 0.09 03.89 0.28 0.93 0.10 03.97 0.28 0.95 0.11 04.04 0.28 0.97 0.12 04.12 0.29 0.99 0.12 04.20 0.29 1.01 0.13 04.28 0.29 1.04 0.14 04.36 0.29 1.06 0.15 04.43 0.29 1.08 0.16 04.51 0.29 1.11 0.17 0 Predev Q2yr4.59 0.30 1.13 0.18 04.67 0.30 1.15 0.19 04.74 0.30 1.17 0.20 04.82 0.30 1.20 0.21 04.90 0.30 1.22 0.23 04.98 0.31 1.25 0.24 05.06 0.31 1.27 0.25 05.13 0.31 1.29 0.27 05.21 0.31 1.32 0.28 05.29 0.31 1.34 0.29 05.37 0.31 1.37 0.31 05.44 0.32 1.39 0.32 0 Predev Q10yr5.52 0.32 1.41 0.34 05.60 0.32 1.44 0.35 05.68 0.32 1.46 0.37 05.76 0.32 1.49 0.38 05.83 0.33 1.51 0.40 05.91 0.33 1.54 0.42 05.99 0.33 1.57 0.43 06.07 0.33 1.59 0.69 06.14 0.33 1.62 1.24 06.22 0.34 1.64 1.97 06.30 0.34 1.67 2.84 06.38 0.34 1.70 3.83 06.46 0.34 1.72 4.93 06.53 0.34 1.75 6.13 06.61 0.34 1.78 7.42 06.69 0.35 1.80 8.80 06.77 0.35 1.83 10.25 06.84 0.35 1.86 11.78 06.92 0.35 1.88 13.38 0
Airport Runoff Manual - Technical DocumentationParametrix 558-2535-005July 17, 2007 Attachment 1

7.00 0.35 1.91 15.05 0
_____________________________________________________
ANALYSIS RESULTS
Flow Frequency Return PredevelopedReturn Period Flow(cfs)
2 year 0.17 0.08598355 year 0.27
10 year 0.3325 year 0.4250 year 0.48
100 year 0.54
Flow Frequency Return Developed MitigatedReturn Period Flow(cfs)
2 year 0.085 year 0.10
10 year 0.1225 year 0.1450 year 0.16
100 year 0.17_____________________________________________________
Yearly Peaks forYear Predeveloped Developed
1949 0.20 0.071950 0.42 0.081951 0.40 0.161952 0.13 0.061953 0.11 0.081954 0.15 0.071955 0.25 0.071956 0.23 0.111957 0.20 0.071958 0.18 0.081959 0.15 0.071960 0.29 0.121961 0.15 0.081962 0.10 0.061963 0.14 0.081964 0.15 0.081965 0.13 0.091966 0.13 0.081967 0.26 0.081968 0.15 0.071969 0.16 0.071970 0.14 0.081971 0.14 0.081972 0.33 0.13
Airport Runoff Manual - Technical DocumentationParametrix 558-2535-005July 17, 2007 Attachment 1

1973 0.14 0.091974 0.15 0.081975 0.26 0.071976 0.15 0.071977 0.03 0.061978 0.14 0.081979 0.08 0.061980 0.22 0.151981 0.12 0.081982 0.30 0.091983 0.19 0.081984 0.12 0.061985 0.07 0.061986 0.32 0.081987 0.29 0.101988 0.12 0.071989 0.07 0.061990 0.46 0.111991 0.38 0.111992 0.14 0.081993 0.15 0.061994 0.05 0.061995 0.20 0.081996 0.38 0.141997 0.36 0.191998 0.10 0.06
_____________________________________________________
Ranked Yearly Peaks for Predevelope and Developed-MitigatedRank Predeveloped Developed
1 0.4244 0.15642 0.3978 0.14963 0.3807 0.13734 0.3778 0.13135 0.362 0.1156 0.3298 0.11347 0.3176 0.10928 0.2956 0.10559 0.2942 0.1005
10 0.293 0.093111 0.2597 0.092712 0.2548 0.087713 0.2479 0.083714 0.2258 0.083615 0.2164 0.081916 0.1977 0.081417 0.1957 0.081218 0.1953 0.080919 0.1916 0.080320 0.1806 0.080321 0.159 0.079822 0.1543 0.0786
Airport Runoff Manual - Technical DocumentationParametrix 558-2535-005July 17, 2007 Attachment 1
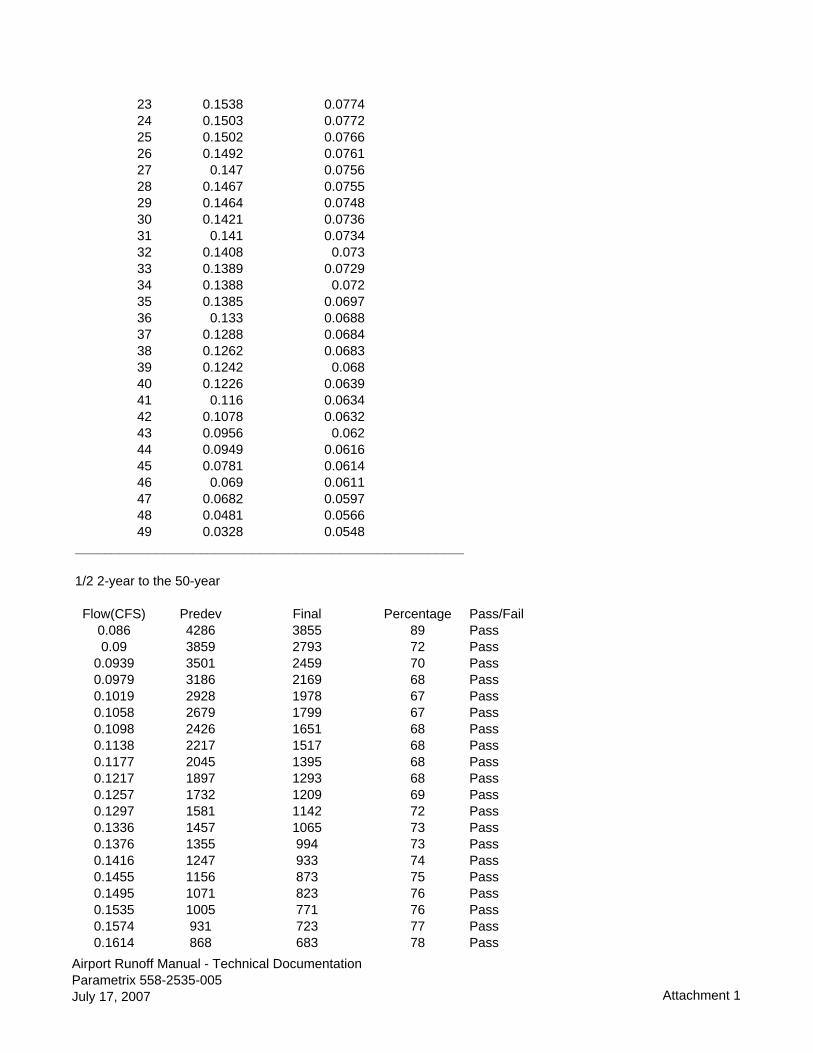
23 0.1538 0.077424 0.1503 0.077225 0.1502 0.076626 0.1492 0.076127 0.147 0.075628 0.1467 0.075529 0.1464 0.074830 0.1421 0.073631 0.141 0.073432 0.1408 0.07333 0.1389 0.072934 0.1388 0.07235 0.1385 0.069736 0.133 0.068837 0.1288 0.068438 0.1262 0.068339 0.1242 0.06840 0.1226 0.063941 0.116 0.063442 0.1078 0.063243 0.0956 0.06244 0.0949 0.061645 0.0781 0.061446 0.069 0.061147 0.0682 0.059748 0.0481 0.056649 0.0328 0.0548
_____________________________________________________
1/2 2-year to the 50-year
Flow(CFS) Predev Final Percentage Pass/Fail0.086 4286 3855 89 Pass0.09 3859 2793 72 Pass
0.0939 3501 2459 70 Pass0.0979 3186 2169 68 Pass0.1019 2928 1978 67 Pass0.1058 2679 1799 67 Pass0.1098 2426 1651 68 Pass0.1138 2217 1517 68 Pass0.1177 2045 1395 68 Pass0.1217 1897 1293 68 Pass0.1257 1732 1209 69 Pass0.1297 1581 1142 72 Pass0.1336 1457 1065 73 Pass0.1376 1355 994 73 Pass0.1416 1247 933 74 Pass0.1455 1156 873 75 Pass0.1495 1071 823 76 Pass0.1535 1005 771 76 Pass0.1574 931 723 77 Pass0.1614 868 683 78 Pass
Airport Runoff Manual - Technical DocumentationParametrix 558-2535-005July 17, 2007 Attachment 1
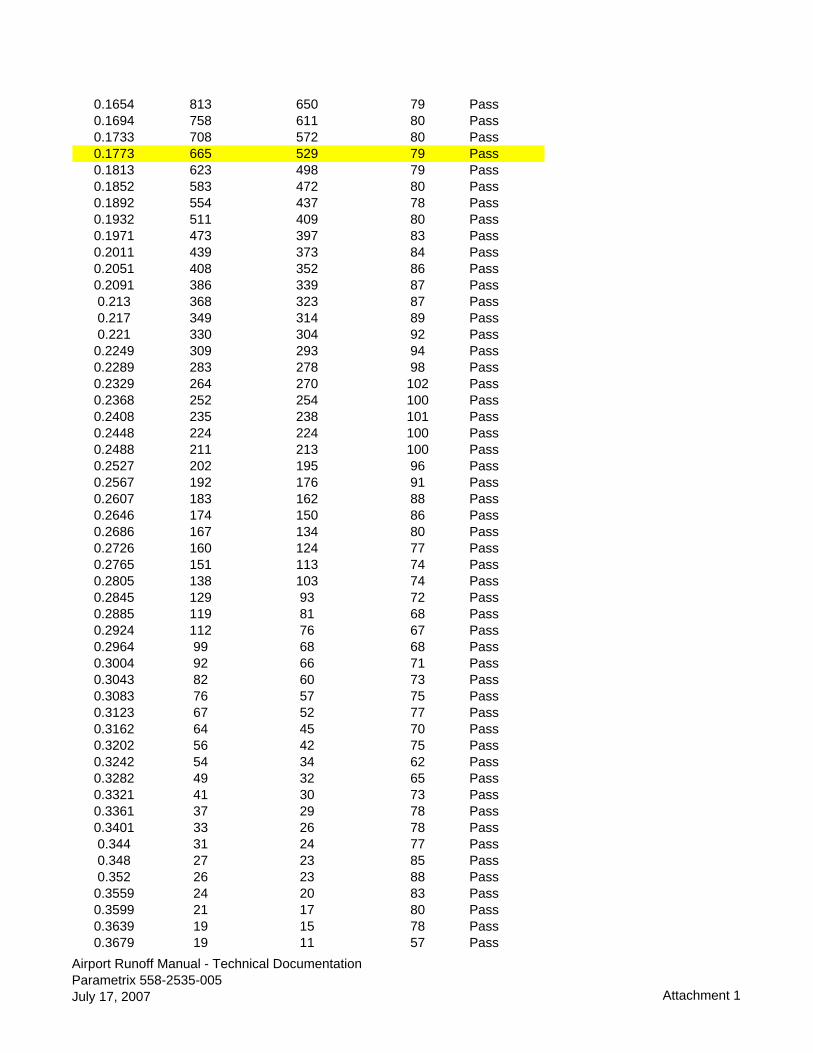
0.1654 813 650 79 Pass0.1694 758 611 80 Pass0.1733 708 572 80 Pass0.1773 665 529 79 Pass0.1813 623 498 79 Pass0.1852 583 472 80 Pass0.1892 554 437 78 Pass0.1932 511 409 80 Pass0.1971 473 397 83 Pass0.2011 439 373 84 Pass0.2051 408 352 86 Pass0.2091 386 339 87 Pass0.213 368 323 87 Pass0.217 349 314 89 Pass0.221 330 304 92 Pass0.2249 309 293 94 Pass0.2289 283 278 98 Pass0.2329 264 270 102 Pass0.2368 252 254 100 Pass0.2408 235 238 101 Pass0.2448 224 224 100 Pass0.2488 211 213 100 Pass0.2527 202 195 96 Pass0.2567 192 176 91 Pass0.2607 183 162 88 Pass0.2646 174 150 86 Pass0.2686 167 134 80 Pass0.2726 160 124 77 Pass0.2765 151 113 74 Pass0.2805 138 103 74 Pass0.2845 129 93 72 Pass0.2885 119 81 68 Pass0.2924 112 76 67 Pass0.2964 99 68 68 Pass0.3004 92 66 71 Pass0.3043 82 60 73 Pass0.3083 76 57 75 Pass0.3123 67 52 77 Pass0.3162 64 45 70 Pass0.3202 56 42 75 Pass0.3242 54 34 62 Pass0.3282 49 32 65 Pass0.3321 41 30 73 Pass0.3361 37 29 78 Pass0.3401 33 26 78 Pass0.344 31 24 77 Pass0.348 27 23 85 Pass0.352 26 23 88 Pass0.3559 24 20 83 Pass0.3599 21 17 80 Pass0.3639 19 15 78 Pass0.3679 19 11 57 Pass
Airport Runoff Manual - Technical DocumentationParametrix 558-2535-005July 17, 2007 Attachment 1

0.3718 18 10 55 Pass0.3758 14 8 57 Pass0.3798 10 8 80 Pass0.3837 8 6 75 Pass0.3877 8 4 50 Pass0.3917 6 3 50 Pass0.3956 6 2 33 Pass0.3996 5 0 0 Pass0.4036 5 0 0 Pass0.4076 5 0 0 Pass0.4115 5 0 0 Pass0.4155 5 0 0 Pass0.4195 4 0 0 Pass0.4234 4 0 0 Pass0.4274 3 0 0 Pass0.4314 3 0 0 Pass0.4353 2 0 0 Pass0.4393 2 0 0 Pass0.4433 2 0 0 Pass0.4473 2 0 0 Pass0.4512 2 0 0 Pass0.4552 1 0 0 Pass0.4592 0 0 0 Pass0.4631 0 0 0 Pass0.4671 0 0 0 Pass0.4711 0 0 0 Pass0.475 0 0 0 Pass0.479 0 0 0 Pass
_____________________________________________________
Airport Runoff Manual - Technical DocumentationParametrix 558-2535-005July 17, 2007 Attachment 1

WESTERN WASHINGTON HYDROLOGY MODEL V2 PROJECT REPORT _____________________________________________________
Project Name: ARMDET2 Site Address: City : Report Date : 1/24/2007 Gage : Seatac Data Start : 1948 Data End : 1998 Precip Scale: 1.17 _____________________________________________________
_____________________________________________________
PREDEVELOPED LAND USE
Basin : Basin 1 Flows To : Point of Compliance GroundWater: No
Land Use Acres TILL FOREST: 4
_____________________________________________________
_____________________________________________________
DEVELOPED LAND USE Basin : Basin 1 Flows To : Pond 1 GroundWater: No
Land Use Acres TILL GRASS: 3 IMPERVIOUS: 1
_____________________________________________________
_____________________________________________________
RCHRES (POND) INFORMATION Pond Name: Pond 1 Pond Type: Trapezoidal Pond Pond Flows to : Point of Compliance Pond Rain / Evap is not activated. Dimensions Depth: 7ft. Bottom Length: 113.36ft. Bottom Width : 37.8ft. Side slope 1: 2 To 1 Airport Runoff Manual - Technical DocumentationParametrix 558-2535-005July 17, 2007 Attachment 1

Side slope 2: 2 To 1 Side slope 3: 2 To 1 Side slope 4: 2 To 1 Volume at Riser Head: 0.867 acre-ft. Discharge Structure Riser Height: 6 ft. Riser Diameter: 18 in. NotchType : Rectangular Notch Width : 0.012 ft. Notch Height: 2.301 ft. Orifice 1 Diameter: 1.166 in. Elevation: 0 ft.
Pond Hydraulic Table Stage(ft) Area(acr) Volume(acr-ft) Dschrg(cfs) Infilt(cfs)
0.00 0.10 0.00 0.00 0.000.08 0.10 0.01 0.01 0.000.16 0.10 0.02 0.01 0.000.23 0.10 0.02 0.02 0.000.31 0.10 0.03 0.02 0.000.39 0.10 0.04 0.02 0.000.47 0.11 0.05 0.02 0.000.54 0.11 0.06 0.03 0.000.62 0.11 0.06 0.03 0.000.70 0.11 0.07 0.03 0.000.78 0.11 0.08 0.03 0.000.86 0.11 0.09 0.03 0.000.93 0.11 0.10 0.03 0.001.01 0.11 0.11 0.04 0.001.09 0.11 0.12 0.04 0.001.17 0.12 0.12 0.04 0.001.24 0.12 0.13 0.04 0.001.32 0.12 0.14 0.04 0.001.40 0.12 0.15 0.04 0.001.48 0.12 0.16 0.04 0.001.56 0.12 0.17 0.05 0.001.63 0.12 0.18 0.05 0.001.71 0.12 0.19 0.05 0.001.79 0.12 0.20 0.05 0.001.87 0.13 0.21 0.05 0.001.94 0.13 0.22 0.05 0.002.02 0.13 0.23 0.05 0.002.10 0.13 0.24 0.05 0.002.18 0.13 0.25 0.05 0.002.26 0.13 0.26 0.05 0.002.33 0.13 0.27 0.06 0.002.41 0.13 0.28 0.06 0.002.49 0.14 0.29 0.06 0.002.57 0.14 0.30 0.06 0.002.64 0.14 0.31 0.06 0.002.72 0.14 0.32 0.06 0.002.80 0.14 0.33 0.06 0.002.88 0.14 0.34 0.06 0.00
Airport Runoff Manual - Technical DocumentationParametrix 558-2535-005July 17, 2007 Attachment 1
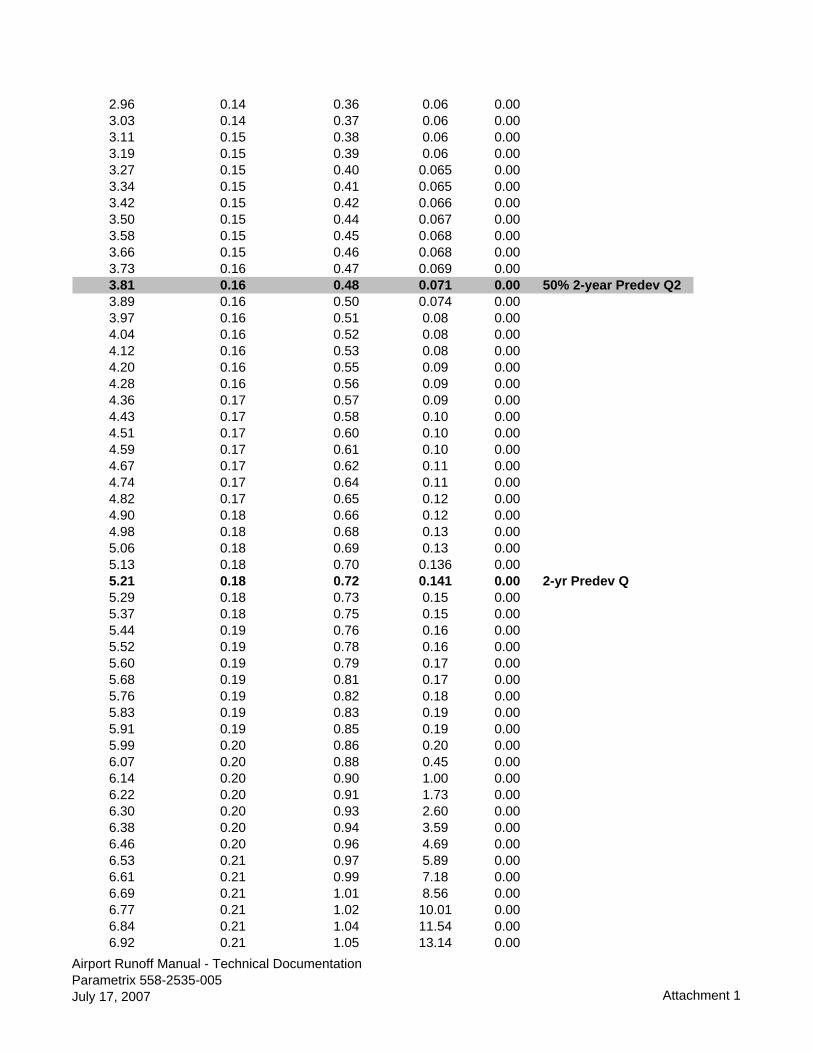
2.96 0.14 0.36 0.06 0.003.03 0.14 0.37 0.06 0.003.11 0.15 0.38 0.06 0.003.19 0.15 0.39 0.06 0.003.27 0.15 0.40 0.065 0.003.34 0.15 0.41 0.065 0.003.42 0.15 0.42 0.066 0.003.50 0.15 0.44 0.067 0.003.58 0.15 0.45 0.068 0.003.66 0.15 0.46 0.068 0.003.73 0.16 0.47 0.069 0.003.81 0.16 0.48 0.071 0.00 50% 2-year Predev Q23.89 0.16 0.50 0.074 0.003.97 0.16 0.51 0.08 0.004.04 0.16 0.52 0.08 0.004.12 0.16 0.53 0.08 0.004.20 0.16 0.55 0.09 0.004.28 0.16 0.56 0.09 0.004.36 0.17 0.57 0.09 0.004.43 0.17 0.58 0.10 0.004.51 0.17 0.60 0.10 0.004.59 0.17 0.61 0.10 0.004.67 0.17 0.62 0.11 0.004.74 0.17 0.64 0.11 0.004.82 0.17 0.65 0.12 0.004.90 0.18 0.66 0.12 0.004.98 0.18 0.68 0.13 0.005.06 0.18 0.69 0.13 0.005.13 0.18 0.70 0.136 0.005.21 0.18 0.72 0.141 0.00 2-yr Predev Q5.29 0.18 0.73 0.15 0.005.37 0.18 0.75 0.15 0.005.44 0.19 0.76 0.16 0.005.52 0.19 0.78 0.16 0.005.60 0.19 0.79 0.17 0.005.68 0.19 0.81 0.17 0.005.76 0.19 0.82 0.18 0.005.83 0.19 0.83 0.19 0.005.91 0.19 0.85 0.19 0.005.99 0.20 0.86 0.20 0.006.07 0.20 0.88 0.45 0.006.14 0.20 0.90 1.00 0.006.22 0.20 0.91 1.73 0.006.30 0.20 0.93 2.60 0.006.38 0.20 0.94 3.59 0.006.46 0.20 0.96 4.69 0.006.53 0.21 0.97 5.89 0.006.61 0.21 0.99 7.18 0.006.69 0.21 1.01 8.56 0.006.77 0.21 1.02 10.01 0.006.84 0.21 1.04 11.54 0.006.92 0.21 1.05 13.14 0.00
Airport Runoff Manual - Technical DocumentationParametrix 558-2535-005July 17, 2007 Attachment 1

7.00 0.21 1.07 14.81 0.00
ANALYSIS RESULTS
Flow Frequency Return Periods for Predeveloped Return Period Flow(cfs)
2 year 0.145 year 0.22
10 year 0.2725 year 0.3350 year 0.38
100 year 0.43
Flow Frequency Return Periods for Developed Mitigated Return Period Flow(cfs)
2 year 0.065 year 0.08
10 year 0.1025 year 0.1250 year 0.14
100 year 0.16_____________________________________________________
Yearly Peaks for Predeveloped and Developed-Mitigated Year Predeveloped Developed
1949 0.16 0.051950 0.34 0.071951 0.32 0.141952 0.11 0.051953 0.09 0.061954 0.12 0.061955 0.20 0.061956 0.18 0.081957 0.16 0.061958 0.15 0.061959 0.12 0.051960 0.23 0.111961 0.12 0.071962 0.08 0.051963 0.11 0.061964 0.12 0.061965 0.10 0.071966 0.10 0.061967 0.21 0.061968 0.12 0.061969 0.13 0.061970 0.11 0.061971 0.11 0.061972 0.26 0.111973 0.11 0.071974 0.12 0.061975 0.20 0.06
Airport Runoff Manual - Technical DocumentationParametrix 558-2535-005July 17, 2007 Attachment 1
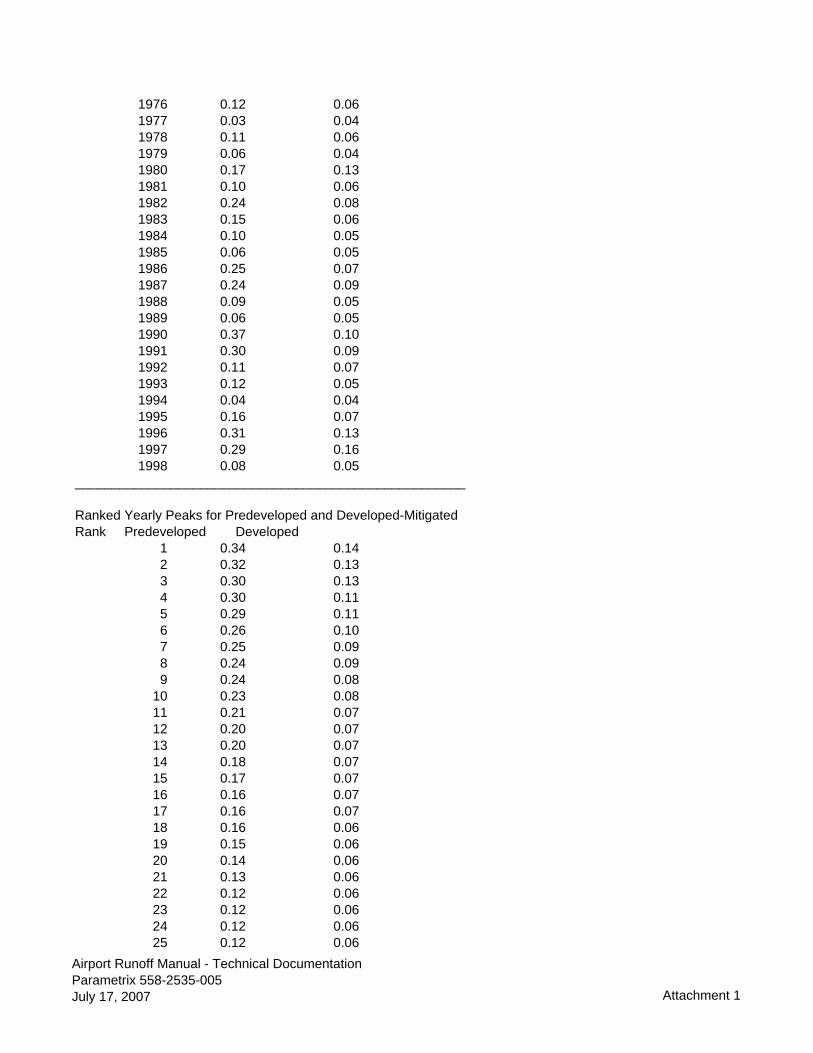
1976 0.12 0.061977 0.03 0.041978 0.11 0.061979 0.06 0.041980 0.17 0.131981 0.10 0.061982 0.24 0.081983 0.15 0.061984 0.10 0.051985 0.06 0.051986 0.25 0.071987 0.24 0.091988 0.09 0.051989 0.06 0.051990 0.37 0.101991 0.30 0.091992 0.11 0.071993 0.12 0.051994 0.04 0.041995 0.16 0.071996 0.31 0.131997 0.29 0.161998 0.08 0.05
_____________________________________________________
Ranked Yearly Peaks for Predeveloped and Developed-Mitigated Rank Predeveloped Developed
1 0.34 0.142 0.32 0.133 0.30 0.134 0.30 0.115 0.29 0.116 0.26 0.107 0.25 0.098 0.24 0.099 0.24 0.08
10 0.23 0.0811 0.21 0.0712 0.20 0.0713 0.20 0.0714 0.18 0.0715 0.17 0.0716 0.16 0.0717 0.16 0.0718 0.16 0.0619 0.15 0.0620 0.14 0.0621 0.13 0.0622 0.12 0.0623 0.12 0.0624 0.12 0.0625 0.12 0.06
Airport Runoff Manual - Technical DocumentationParametrix 558-2535-005July 17, 2007 Attachment 1

26 0.12 0.0627 0.12 0.0628 0.12 0.0629 0.12 0.0630 0.11 0.0631 0.11 0.0632 0.11 0.0633 0.11 0.0634 0.11 0.0635 0.11 0.0636 0.11 0.0637 0.10 0.0538 0.10 0.0539 0.10 0.0540 0.10 0.0541 0.09 0.0542 0.09 0.0543 0.08 0.0544 0.08 0.0545 0.06 0.0546 0.06 0.0547 0.05 0.0448 0.04 0.0449 0.03 0.04
_____________________________________________________
1/2 2 year to 50 yearFlow(CFS) Predev Final Percentage Pass/Fail 0.0688 4286 4093 95.0 Pass 0.0720 3883 3331 85.0 Pass 0.0751 3432 2760 80.0 Pass 0.0783 3155 2430 77.0 Pass 0.0815 2911 2131 73.0 Pass 0.0847 2679 1861 69.0 Pass 0.0878 2441 1681 68.0 Pass 0.0910 2182 1451 66.0 Pass 0.0942 2025 1319 65.0 Pass 0.0974 1885 1213 64.0 Pass 0.1005 1732 1116 64.0 Pass 0.1037 1590 1039 65.0 Pass 0.1069 1473 956 64.0 Pass 0.1101 1335 853 63.0 Pass 0.1133 1237 781 63.0 Pass 0.1164 1156 740 64.0 Pass 0.1196 1075 705 65.0 Pass 0.1228 1010 659 65.0 Pass 0.1260 946 620 65.0 Pass 0.1291 864 565 65.0 Pass 0.1323 813 524 64.0 Pass 0.1355 760 468 61.0 Pass 0.1387 717 438 61.0 Pass 0.1418 668 409 61.0 Pass Airport Runoff Manual - Technical DocumentationParametrix 558-2535-005July 17, 2007 Attachment 1

0.1450 622 359 57.0 Pass 0.1482 583 344 59.0 Pass 0.1514 556 325 58.0 Pass 0.1545 517 311 60.0 Pass 0.1577 480 292 60.0 Pass 0.1609 447 276 61.0 Pass 0.1641 408 250 61.0 Pass 0.1672 389 228 58.0 Pass 0.1704 372 201 54.0 Pass 0.1736 348 176 50.0 Pass 0.1768 330 151 45.0 Pass 0.1799 310 131 42.0 Pass 0.1831 278 115 41.0 Pass 0.1863 263 101 38.0 Pass 0.1895 251 87 34.0 Pass 0.1927 235 67 28.0 Pass 0.1958 224 49 21.0 Pass 0.1990 209 31 14.0 Pass 0.2022 201 29 14.0 Pass 0.2054 192 28 14.0 Pass 0.2085 183 27 14.0 Pass 0.2117 175 25 14.0 Pass 0.2149 169 24 14.0 Pass 0.2181 159 21 13.0 Pass 0.2212 149 21 14.0 Pass 0.2244 138 21 15.0 Pass 0.2276 129 20 15.0 Pass 0.2308 120 19 15.0 Pass 0.2339 113 19 16.0 Pass 0.2371 98 19 19.0 Pass 0.2403 92 18 19.0 Pass 0.2435 82 17 20.0 Pass 0.2466 76 17 22.0 Pass 0.2498 68 16 23.0 Pass 0.2530 66 15 22.0 Pass 0.2562 56 14 25.0 Pass 0.2593 54 12 22.0 Pass 0.2625 49 11 22.0 Pass 0.2657 41 11 26.0 Pass 0.2689 39 11 28.0 Pass 0.2721 33 10 30.0 Pass 0.2752 31 10 32.0 Pass 0.2784 29 10 34.0 Pass 0.2816 26 9 34.0 Pass 0.2848 24 9 37.0 Pass 0.2879 21 9 42.0 Pass 0.2911 19 7 36.0 Pass 0.2943 19 7 36.0 Pass 0.2975 17 6 35.0 Pass 0.3006 14 6 42.0 Pass 0.3038 10 6 60.0 Pass 0.3070 8 6 75.0 Pass Airport Runoff Manual - Technical DocumentationParametrix 558-2535-005July 17, 2007 Attachment 1

0.3102 8 5 62.0 Pass 0.3133 6 5 83.0 Pass 0.3165 6 5 83.0 Pass 0.3197 5 5 100.0 Pass 0.3229 5 5 100.0 Pass 0.3260 5 5 100.0 Pass 0.3292 5 4 80.0 Pass 0.3324 5 4 80.0 Pass 0.3356 4 4 100.0 Pass 0.3387 4 4 100.0 Pass 0.3419 3 3 100.0 Pass 0.3451 3 2 66.0 Pass 0.3483 2 2 100.0 Pass 0.3515 2 2 100.0 Pass 0.3546 2 2 100.0 Pass 0.3578 2 2 100.0 Pass 0.3610 2 2 100.0 Pass 0.3642 1 0 .0 Pass 0.3673 0 0 .0 Pass 0.3705 0 0 .0 Pass 0.3737 0 0 .0 Pass 0.3769 0 0 .0 Pass 0.3800 0 0 .0 Pass 0.3832 0 0 .0 Pass _____________________________________________________
Airport Runoff Manual - Technical DocumentationParametrix 558-2535-005July 17, 2007 Attachment 1
WESTERN WASHINGTON HYDROLOGY MODEL V2 PROJECT REPORT _____________________________________________________
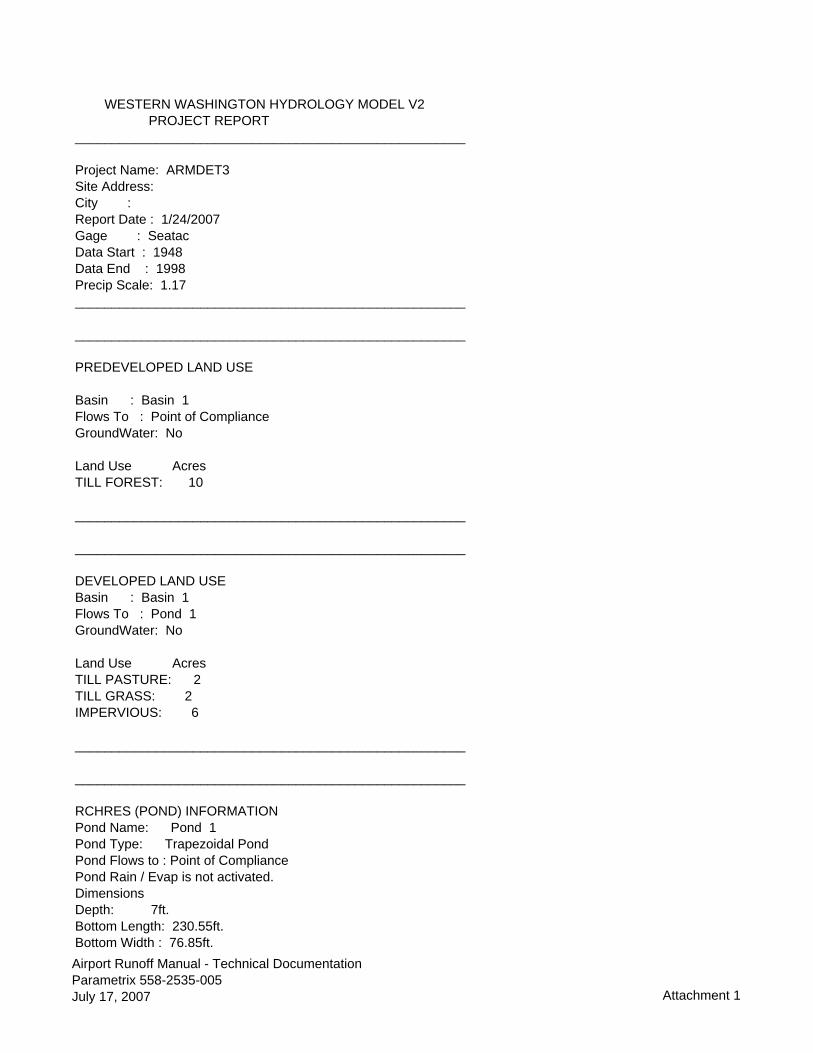
Project Name: ARMDET3 Site Address: City : Report Date : 1/24/2007 Gage : Seatac Data Start : 1948 Data End : 1998 Precip Scale: 1.17 _____________________________________________________
_____________________________________________________
PREDEVELOPED LAND USE
Basin : Basin 1 Flows To : Point of Compliance GroundWater: No
Land Use Acres TILL FOREST: 10
_____________________________________________________
_____________________________________________________
DEVELOPED LAND USE Basin : Basin 1 Flows To : Pond 1 GroundWater: No
Land Use Acres TILL PASTURE: 2 TILL GRASS: 2 IMPERVIOUS: 6
_____________________________________________________
_____________________________________________________
RCHRES (POND) INFORMATION Pond Name: Pond 1 Pond Type: Trapezoidal Pond Pond Flows to : Point of Compliance Pond Rain / Evap is not activated. Dimensions Depth: 7ft. Bottom Length: 230.55ft. Bottom Width : 76.85ft. Airport Runoff Manual - Technical DocumentationParametrix 558-2535-005July 17, 2007 Attachment 1
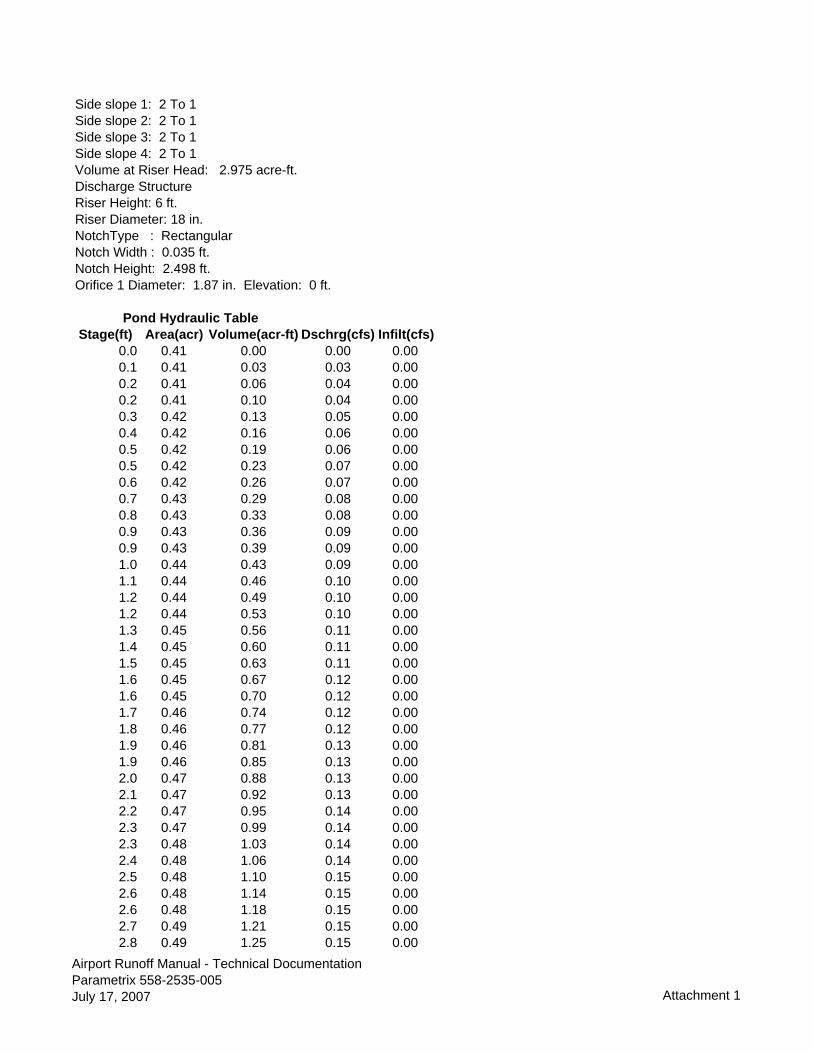
Side slope 1: 2 To 1 Side slope 2: 2 To 1 Side slope 3: 2 To 1 Side slope 4: 2 To 1 Volume at Riser Head: 2.975 acre-ft. Discharge Structure Riser Height: 6 ft. Riser Diameter: 18 in. NotchType : Rectangular Notch Width : 0.035 ft. Notch Height: 2.498 ft. Orifice 1 Diameter: 1.87 in. Elevation: 0 ft. Pond Hydraulic Table Stage(ft) Area(acr) Volume(acr-ft) Dschrg(cfs) Infilt(cfs)
0.0 0.41 0.00 0.00 0.000.1 0.41 0.03 0.03 0.000.2 0.41 0.06 0.04 0.000.2 0.41 0.10 0.04 0.000.3 0.42 0.13 0.05 0.000.4 0.42 0.16 0.06 0.000.5 0.42 0.19 0.06 0.000.5 0.42 0.23 0.07 0.000.6 0.42 0.26 0.07 0.000.7 0.43 0.29 0.08 0.000.8 0.43 0.33 0.08 0.000.9 0.43 0.36 0.09 0.000.9 0.43 0.39 0.09 0.001.0 0.44 0.43 0.09 0.001.1 0.44 0.46 0.10 0.001.2 0.44 0.49 0.10 0.001.2 0.44 0.53 0.10 0.001.3 0.45 0.56 0.11 0.001.4 0.45 0.60 0.11 0.001.5 0.45 0.63 0.11 0.001.6 0.45 0.67 0.12 0.001.6 0.45 0.70 0.12 0.001.7 0.46 0.74 0.12 0.001.8 0.46 0.77 0.12 0.001.9 0.46 0.81 0.13 0.001.9 0.46 0.85 0.13 0.002.0 0.47 0.88 0.13 0.002.1 0.47 0.92 0.13 0.002.2 0.47 0.95 0.14 0.002.3 0.47 0.99 0.14 0.002.3 0.48 1.03 0.14 0.002.4 0.48 1.06 0.14 0.002.5 0.48 1.10 0.15 0.002.6 0.48 1.14 0.15 0.002.6 0.48 1.18 0.15 0.002.7 0.49 1.21 0.15 0.002.8 0.49 1.25 0.15 0.00
Airport Runoff Manual - Technical DocumentationParametrix 558-2535-005July 17, 2007 Attachment 1

2.9 0.49 1.29 0.16 0.003.0 0.49 1.33 0.16 0.003.0 0.50 1.37 0.16 0.003.1 0.50 1.41 0.16 0.003.2 0.50 1.45 0.16 0.003.3 0.50 1.48 0.166 0.003.3 0.51 1.52 0.168 0.003.4 0.51 1.56 0.170 0.00 50% 2-yr Predev Q3.5 0.51 1.60 0.172 0.003.6 0.51 1.64 0.18 0.003.7 0.52 1.68 0.18 0.003.7 0.52 1.72 0.19 0.003.8 0.52 1.76 0.20 0.003.9 0.52 1.80 0.21 0.004.0 0.52 1.84 0.22 0.004.0 0.53 1.88 0.23 0.004.1 0.53 1.93 0.24 0.004.2 0.53 1.97 0.25 0.004.3 0.53 2.01 0.26 0.004.4 0.54 2.05 0.27 0.004.4 0.54 2.09 0.28 0.004.5 0.54 2.13 0.29 0.004.6 0.54 2.18 0.30 0.004.7 0.55 2.22 0.32 0.004.7 0.55 2.26 0.33 0.004.8 0.55 2.30 0.34 0.00 2-yr Predev Q4.9 0.55 2.35 0.36 0.005.0 0.56 2.39 0.37 0.005.1 0.56 2.43 0.39 0.005.1 0.56 2.48 0.40 0.005.2 0.56 2.52 0.42 0.005.3 0.57 2.56 0.43 0.005.4 0.57 2.61 0.45 0.005.4 0.57 2.65 0.47 0.005.5 0.57 2.70 0.48 0.005.6 0.58 2.74 0.50 0.005.7 0.58 2.79 0.52 0.005.8 0.58 2.83 0.54 0.005.8 0.58 2.88 0.55 0.005.9 0.59 2.92 0.57 0.006.0 0.59 2.97 0.59 0.00 10-yr Predev Q6.1 0.59 3.01 0.85 0.006.1 0.59 3.06 1.40 0.006.2 0.60 3.11 2.13 0.006.3 0.60 3.15 3.00 0.006.4 0.60 3.20 3.99 0.006.5 0.60 3.25 5.09 0.006.5 0.61 3.29 6.29 0.006.6 0.61 3.34 7.58 0.006.7 0.61 3.39 8.96 0.006.8 0.62 3.44 10.41 0.006.8 0.62 3.48 11.94 0.00
Airport Runoff Manual - Technical DocumentationParametrix 558-2535-005July 17, 2007 Attachment 1

6.9 0.62 3.53 13.55 0.007.0 0.62 3.58 15.22 0.00
_____________________________________________________
_____________________________________________________
ANALYSIS RESULTS
Flow Frequency Return Periods for Predeveloped Return Period Flow(cfs)
2 year 0.345 year 0.54
10 year 0.6725 year 0.8450 year 0.96
100 year 1.08
Flow Frequency Return Periods for Developed Mitigated Return Period Flow(cfs)
2 year 0.165 year 0.21
10 year 0.2525 year 0.3050 year 0.34
100 year 0.38_____________________________________________________
Yearly Peaks for Predeveloped and Developed-Mitigated Year Predeveloped Developed
1949 0.40 0.141950 0.85 0.161951 0.80 0.341952 0.27 0.121953 0.22 0.161954 0.30 0.151955 0.50 0.141956 0.45 0.211957 0.39 0.151958 0.36 0.161959 0.29 0.141960 0.59 0.241961 0.29 0.171962 0.19 0.121963 0.28 0.151964 0.30 0.161965 0.26 0.181966 0.25 0.151967 0.52 0.161968 0.31 0.151969 0.32 0.151970 0.28 0.161971 0.28 0.15
Airport Runoff Manual - Technical DocumentationParametrix 558-2535-005July 17, 2007 Attachment 1

1972 0.66 0.291973 0.28 0.191974 0.30 0.151975 0.51 0.141976 0.31 0.151977 0.07 0.121978 0.28 0.161979 0.16 0.111980 0.43 0.321981 0.25 0.151982 0.59 0.191983 0.38 0.151984 0.25 0.121985 0.14 0.131986 0.64 0.161987 0.59 0.211988 0.23 0.131989 0.14 0.121990 0.92 0.251991 0.76 0.221992 0.28 0.161993 0.29 0.121994 0.10 0.111995 0.39 0.171996 0.76 0.311997 0.72 0.411998 0.19 0.13
_____________________________________________________
Ranked Yearly Peaks for Predeveloped and Developed-Mitigated Rank Predeveloped Developed 1 0.8488 0.3433 2 0.7955 0.3218 3 0.7614 0.3052 4 0.7556 0.2862 5 0.7240 0.2454 6 0.6595 0.2431 7 0.6352 0.2237 8 0.5912 0.2128 9 0.5885 0.2070 10 0.5859 0.1870 11 0.5195 0.1854 12 0.5096 0.1775 13 0.4959 0.1678 14 0.4516 0.1670 15 0.4327 0.1636 16 0.3953 0.1635 17 0.3914 0.1628 18 0.3907 0.1619 19 0.3831 0.1614 20 0.3612 0.1607 21 0.3180 0.1569 Airport Runoff Manual - Technical DocumentationParametrix 558-2535-005July 17, 2007 Attachment 1

22 0.3086 0.1568 23 0.3076 0.1563 24 0.3006 0.1544 25 0.3004 0.1535 26 0.2984 0.1535 27 0.2941 0.1517 28 0.2934 0.1514 29 0.2927 0.1484 30 0.2842 0.1475 31 0.2820 0.1471 32 0.2816 0.1471 33 0.2779 0.1470 34 0.2777 0.1455 35 0.2771 0.1418 36 0.2660 0.1372 37 0.2577 0.1371 38 0.2524 0.1366 39 0.2484 0.1330 40 0.2452 0.1255 41 0.2321 0.1248 42 0.2157 0.1244 43 0.1913 0.1242 44 0.1899 0.1233 45 0.1561 0.1225 46 0.1380 0.1210 47 0.1365 0.1203 48 0.0961 0.1134 49 0.0656 0.1094 _____________________________________________________
1/2 2 year to 50 yearFlow(CFS) Predev Final Percentage Pass/Fail 0.1720 4231 3839 90.0 Pass 0.1799 3812 3000 78.0 Pass 0.1878 3457 2563 74.0 Pass 0.1958 3155 2228 70.0 Pass 0.2037 2899 1969 67.0 Pass 0.2117 2641 1760 66.0 Pass 0.2196 2396 1570 65.0 Pass 0.2275 2194 1433 65.0 Pass 0.2355 2025 1314 64.0 Pass 0.2434 1876 1202 64.0 Pass 0.2514 1714 1095 63.0 Pass 0.2593 1565 1000 63.0 Pass 0.2672 1440 917 63.0 Pass 0.2752 1335 839 62.0 Pass 0.2831 1229 772 62.0 Pass 0.2911 1144 718 62.0 Pass 0.2990 1065 650 61.0 Pass 0.3069 1005 613 60.0 Pass 0.3149 931 579 62.0 Pass 0.3228 868 548 63.0 Pass Airport Runoff Manual - Technical DocumentationParametrix 558-2535-005July 17, 2007 Attachment 1
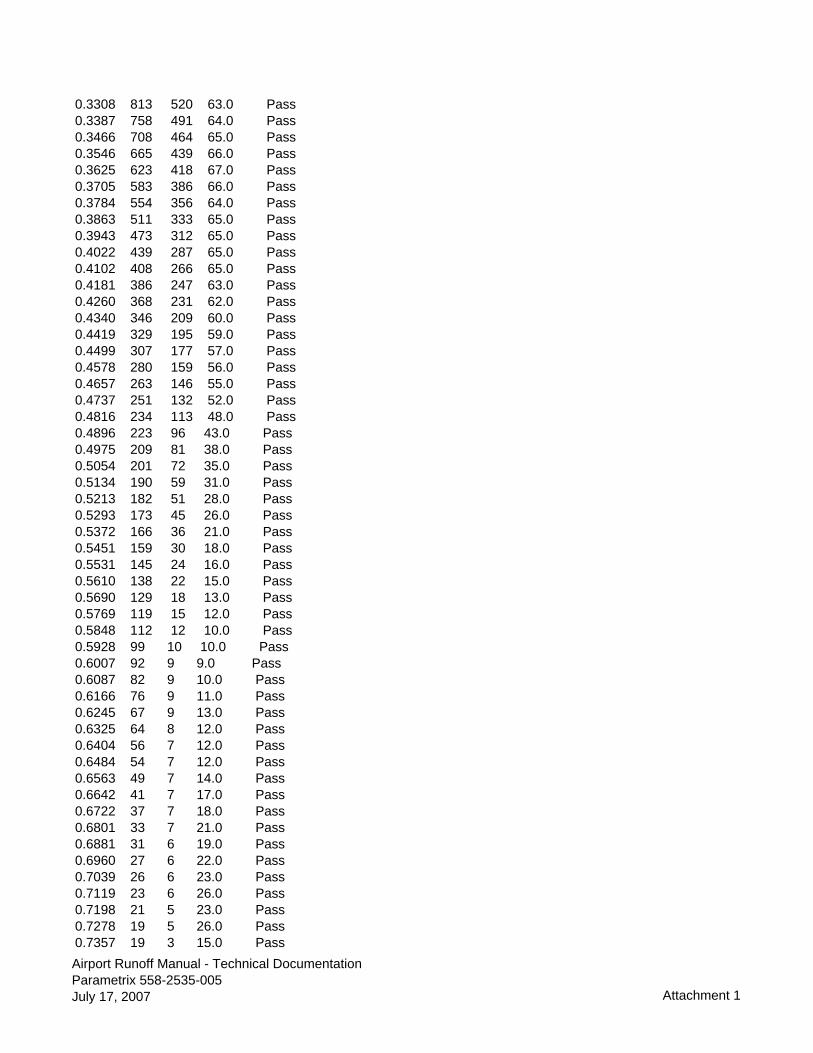
0.3308 813 520 63.0 Pass 0.3387 758 491 64.0 Pass 0.3466 708 464 65.0 Pass 0.3546 665 439 66.0 Pass 0.3625 623 418 67.0 Pass 0.3705 583 386 66.0 Pass 0.3784 554 356 64.0 Pass 0.3863 511 333 65.0 Pass 0.3943 473 312 65.0 Pass 0.4022 439 287 65.0 Pass 0.4102 408 266 65.0 Pass 0.4181 386 247 63.0 Pass 0.4260 368 231 62.0 Pass 0.4340 346 209 60.0 Pass 0.4419 329 195 59.0 Pass 0.4499 307 177 57.0 Pass 0.4578 280 159 56.0 Pass 0.4657 263 146 55.0 Pass 0.4737 251 132 52.0 Pass 0.4816 234 113 48.0 Pass 0.4896 223 96 43.0 Pass 0.4975 209 81 38.0 Pass 0.5054 201 72 35.0 Pass 0.5134 190 59 31.0 Pass 0.5213 182 51 28.0 Pass 0.5293 173 45 26.0 Pass 0.5372 166 36 21.0 Pass 0.5451 159 30 18.0 Pass 0.5531 145 24 16.0 Pass 0.5610 138 22 15.0 Pass 0.5690 129 18 13.0 Pass 0.5769 119 15 12.0 Pass 0.5848 112 12 10.0 Pass 0.5928 99 10 10.0 Pass 0.6007 92 9 9.0 Pass 0.6087 82 9 10.0 Pass 0.6166 76 9 11.0 Pass 0.6245 67 9 13.0 Pass 0.6325 64 8 12.0 Pass 0.6404 56 7 12.0 Pass 0.6484 54 7 12.0 Pass 0.6563 49 7 14.0 Pass 0.6642 41 7 17.0 Pass 0.6722 37 7 18.0 Pass 0.6801 33 7 21.0 Pass 0.6881 31 6 19.0 Pass 0.6960 27 6 22.0 Pass 0.7039 26 6 23.0 Pass 0.7119 23 6 26.0 Pass 0.7198 21 5 23.0 Pass 0.7278 19 5 26.0 Pass 0.7357 19 3 15.0 Pass Airport Runoff Manual - Technical DocumentationParametrix 558-2535-005July 17, 2007 Attachment 1
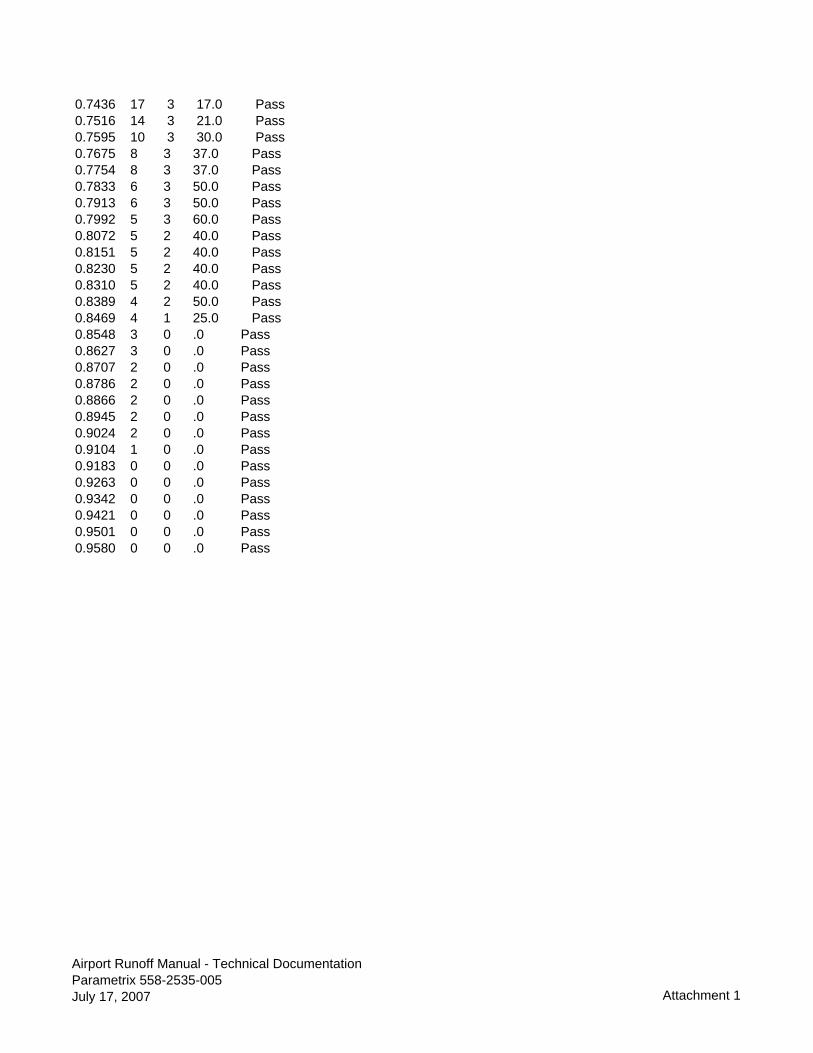
0.7436 17 3 17.0 Pass 0.7516 14 3 21.0 Pass 0.7595 10 3 30.0 Pass 0.7675 8 3 37.0 Pass 0.7754 8 3 37.0 Pass 0.7833 6 3 50.0 Pass 0.7913 6 3 50.0 Pass 0.7992 5 3 60.0 Pass 0.8072 5 2 40.0 Pass 0.8151 5 2 40.0 Pass 0.8230 5 2 40.0 Pass 0.8310 5 2 40.0 Pass 0.8389 4 2 50.0 Pass 0.8469 4 1 25.0 Pass 0.8548 3 0 .0 Pass 0.8627 3 0 .0 Pass 0.8707 2 0 .0 Pass 0.8786 2 0 .0 Pass 0.8866 2 0 .0 Pass 0.8945 2 0 .0 Pass 0.9024 2 0 .0 Pass 0.9104 1 0 .0 Pass 0.9183 0 0 .0 Pass 0.9263 0 0 .0 Pass 0.9342 0 0 .0 Pass 0.9421 0 0 .0 Pass 0.9501 0 0 .0 Pass 0.9580 0 0 .0 Pass
Airport Runoff Manual - Technical DocumentationParametrix 558-2535-005July 17, 2007 Attachment 1
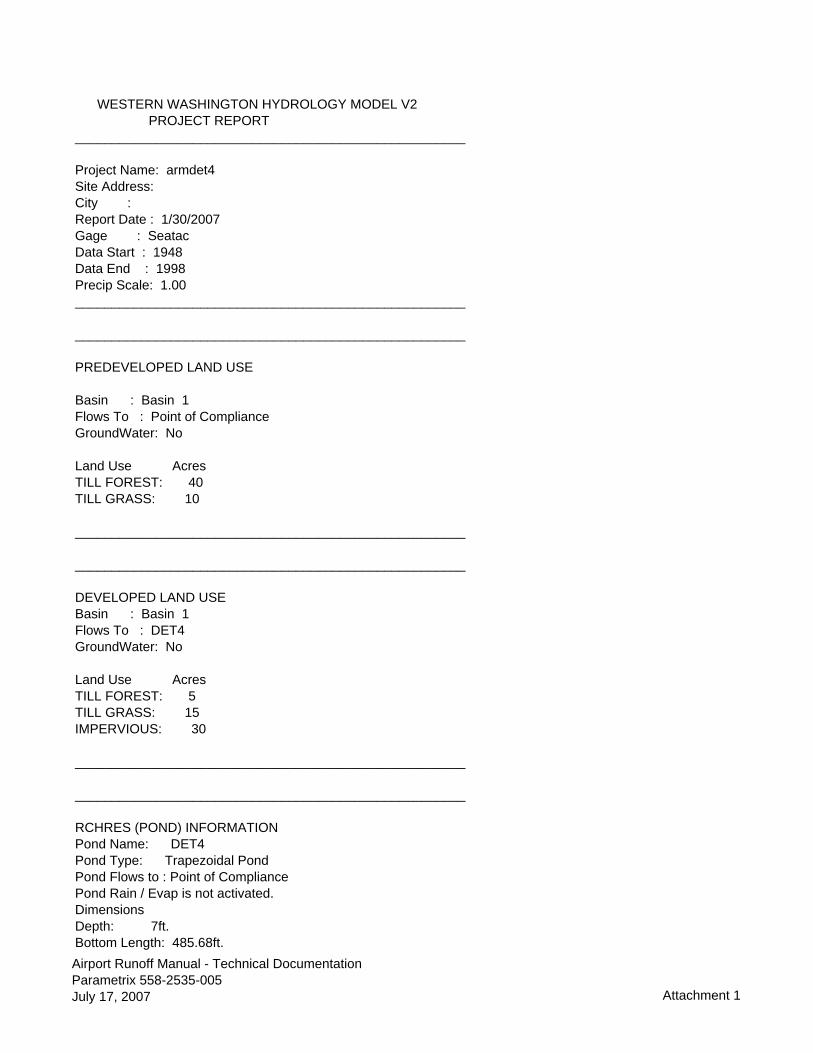
WESTERN WASHINGTON HYDROLOGY MODEL V2 PROJECT REPORT _____________________________________________________
Project Name: armdet4 Site Address: City : Report Date : 1/30/2007 Gage : Seatac Data Start : 1948 Data End : 1998 Precip Scale: 1.00 _____________________________________________________
_____________________________________________________
PREDEVELOPED LAND USE
Basin : Basin 1 Flows To : Point of Compliance GroundWater: No
Land Use Acres TILL FOREST: 40 TILL GRASS: 10
_____________________________________________________
_____________________________________________________
DEVELOPED LAND USE Basin : Basin 1 Flows To : DET4 GroundWater: No
Land Use Acres TILL FOREST: 5 TILL GRASS: 15 IMPERVIOUS: 30
_____________________________________________________
_____________________________________________________
RCHRES (POND) INFORMATION Pond Name: DET4 Pond Type: Trapezoidal Pond Pond Flows to : Point of Compliance Pond Rain / Evap is not activated. Dimensions Depth: 7ft. Bottom Length: 485.68ft. Airport Runoff Manual - Technical DocumentationParametrix 558-2535-005July 17, 2007 Attachment 1

Bottom Width : 161.92ft. Side slope 1: 2 To 1 Side slope 2: 2 To 1 Side slope 3: 2 To 1 Side slope 4: 2 To 1 Volume at Riser Head: 11.929 acre-ft. Discharge Structure Riser Height: 6 ft. Riser Diameter: 18 in. NotchType : Rectangular Notch Width : 0.226 ft. Notch Height: 2.462 ft. Orifice 1 Diameter: 3.824 in. Elevation: 0 ft. Pond Hydraulic Table Stage(ft) Area(acr) Volume(acr-ft) Dschrg(cfs) Infilt(cfs) 0.000 1.805 0.000 0.000 0.000 0.078 1.810 0.141 0.107 0.000 0.156 1.815 0.282 0.151 0.000 0.233 1.819 0.423 0.186 0.000 0.311 1.824 0.565 0.214 0.000 0.389 1.829 0.707 0.240 0.000 0.467 1.833 0.849 0.262 0.000 0.544 1.838 0.992 0.283 0.000 0.622 1.843 1.135 0.303 0.000 0.700 1.847 1.278 0.321 0.000 0.778 1.852 1.422 0.339 0.000 0.856 1.857 1.566 0.355 0.000 0.933 1.861 1.711 0.371 0.000 1.011 1.866 1.856 0.386 0.000 1.089 1.871 2.001 0.401 0.000 1.167 1.875 2.147 0.415 0.000 1.244 1.880 2.293 0.428 0.000 1.322 1.885 2.439 0.442 0.000 1.400 1.889 2.586 0.454 0.000 1.478 1.894 2.733 0.467 0.000 1.556 1.899 2.881 0.479 0.000 1.633 1.903 3.029 0.491 0.000 1.711 1.908 3.177 0.502 0.000 1.789 1.913 3.325 0.514 0.000 1.867 1.918 3.474 0.525 0.000 1.944 1.922 3.624 0.536 0.000 2.022 1.927 3.773 0.546 0.000 2.100 1.932 3.924 0.557 0.000 2.178 1.937 4.074 0.567 0.000 2.256 1.941 4.225 0.577 0.000 2.333 1.946 4.376 0.587 0.000 2.411 1.951 4.527 0.596 0.000 2.489 1.956 4.679 0.606 0.000 2.567 1.960 4.832 0.615 0.000 2.644 1.965 4.984 0.625 0.000 2.722 1.970 5.137 0.634 0.000 Airport Runoff Manual - Technical DocumentationParametrix 558-2535-005July 17, 2007 Attachment 1
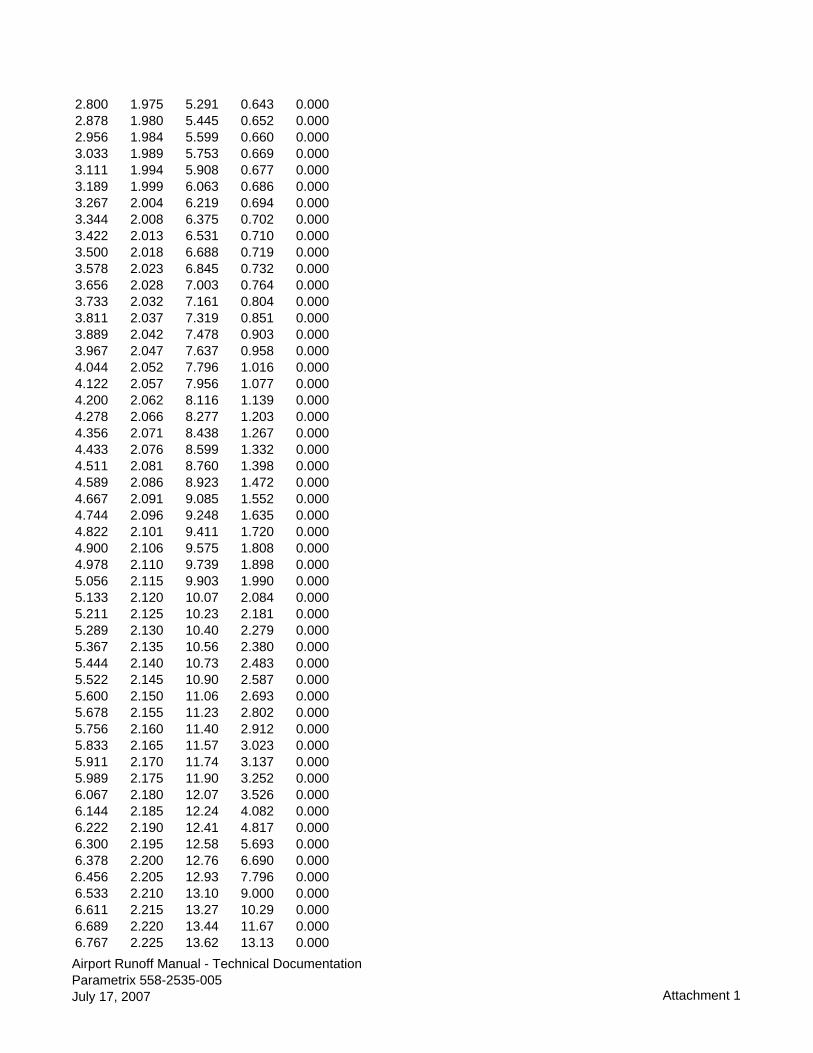
2.800 1.975 5.291 0.643 0.000 2.878 1.980 5.445 0.652 0.000 2.956 1.984 5.599 0.660 0.000 3.033 1.989 5.753 0.669 0.000 3.111 1.994 5.908 0.677 0.000 3.189 1.999 6.063 0.686 0.000 3.267 2.004 6.219 0.694 0.000 3.344 2.008 6.375 0.702 0.000 3.422 2.013 6.531 0.710 0.000 3.500 2.018 6.688 0.719 0.000 3.578 2.023 6.845 0.732 0.000 3.656 2.028 7.003 0.764 0.000 3.733 2.032 7.161 0.804 0.000 3.811 2.037 7.319 0.851 0.000 3.889 2.042 7.478 0.903 0.000 3.967 2.047 7.637 0.958 0.000 4.044 2.052 7.796 1.016 0.000 4.122 2.057 7.956 1.077 0.000 4.200 2.062 8.116 1.139 0.000 4.278 2.066 8.277 1.203 0.000 4.356 2.071 8.438 1.267 0.000 4.433 2.076 8.599 1.332 0.000 4.511 2.081 8.760 1.398 0.000 4.589 2.086 8.923 1.472 0.000 4.667 2.091 9.085 1.552 0.000 4.744 2.096 9.248 1.635 0.000 4.822 2.101 9.411 1.720 0.000 4.900 2.106 9.575 1.808 0.000 4.978 2.110 9.739 1.898 0.000 5.056 2.115 9.903 1.990 0.000 5.133 2.120 10.07 2.084 0.000 5.211 2.125 10.23 2.181 0.000 5.289 2.130 10.40 2.279 0.000 5.367 2.135 10.56 2.380 0.000 5.444 2.140 10.73 2.483 0.000 5.522 2.145 10.90 2.587 0.000 5.600 2.150 11.06 2.693 0.000 5.678 2.155 11.23 2.802 0.000 5.756 2.160 11.40 2.912 0.000 5.833 2.165 11.57 3.023 0.000 5.911 2.170 11.74 3.137 0.000 5.989 2.175 11.90 3.252 0.000 6.067 2.180 12.07 3.526 0.000 6.144 2.185 12.24 4.082 0.000 6.222 2.190 12.41 4.817 0.000 6.300 2.195 12.58 5.693 0.000 6.378 2.200 12.76 6.690 0.000 6.456 2.205 12.93 7.796 0.000 6.533 2.210 13.10 9.000 0.000 6.611 2.215 13.27 10.29 0.000 6.689 2.220 13.44 11.67 0.000 6.767 2.225 13.62 13.13 0.000 Airport Runoff Manual - Technical DocumentationParametrix 558-2535-005July 17, 2007 Attachment 1

6.844 2.230 13.79 14.67 0.000 6.922 2.235 13.96 16.28 0.000 7.000 2.240 14.14 17.95 0.000 _____________________________________________________
_____________________________________________________
ANALYSIS RESULTS
Flow Frequency Return Periods for Predeveloped Return Period Flow(cfs) 2 year 1.445288 5 year 2.324012 10 year 2.931093 25 year 3.709506 50 year 4.291359 100 year 4.871527
Flow Frequency Return Periods for Developed Mitigated Return Period Flow(cfs) 2 year 0.650784 5 year 0.855746 10 year 1.008362 25 year 1.221237 50 year 1.394998 100 year 1.582343 _____________________________________________________
Yearly Peaks for Predeveloped and Developed-Mitigated Year Predeveloped Developed 1949 1.763 0.562 1950 4.139 0.673 1951 3.342 1.453 1952 1.154 0.507 1953 0.868 0.648 1954 1.215 0.601 1955 2.083 0.577 1956 2.023 0.877 1957 1.708 0.592 1958 1.468 0.639 1959 1.212 0.563 1960 2.341 0.965 1961 1.219 0.681 1962 0.747 0.493 1963 1.139 0.629 1964 1.296 0.664 1965 0.987 0.712 1966 1.116 0.609 1967 2.354 0.665 1968 1.334 0.602 1969 1.334 0.604 1970 1.178 0.644 Airport Runoff Manual - Technical DocumentationParametrix 558-2535-005July 17, 2007 Attachment 1
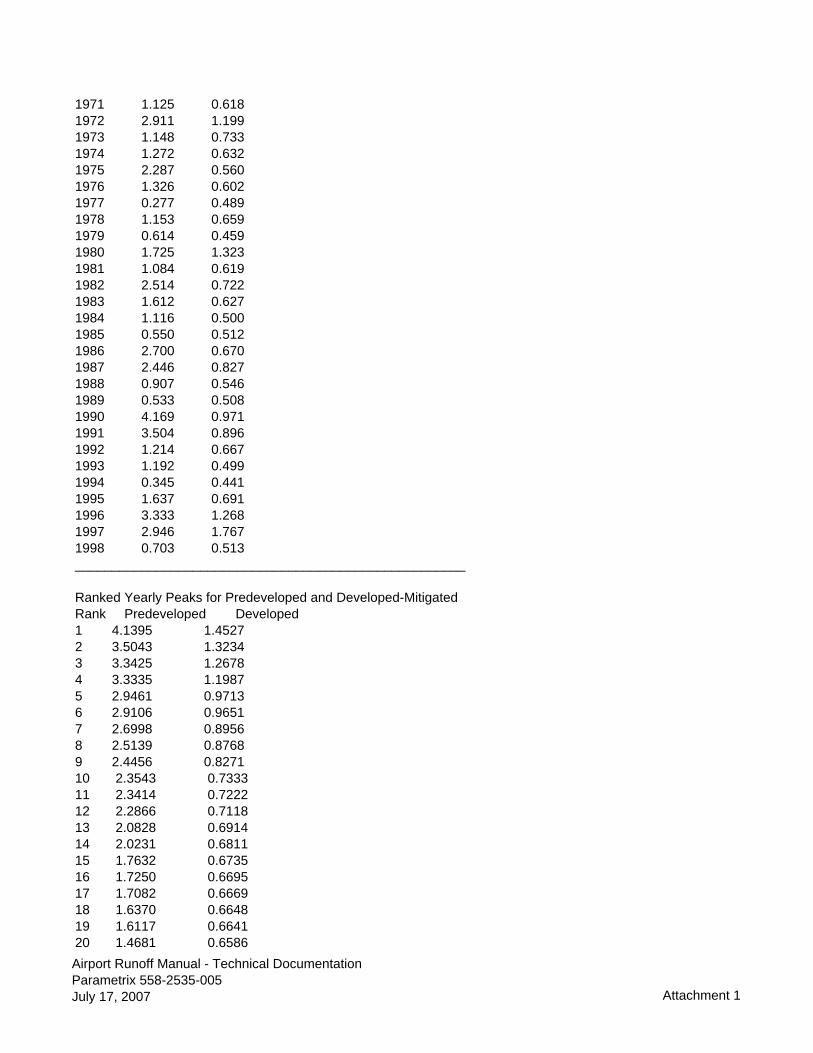
1971 1.125 0.618 1972 2.911 1.199 1973 1.148 0.733 1974 1.272 0.632 1975 2.287 0.560 1976 1.326 0.602 1977 0.277 0.489 1978 1.153 0.659 1979 0.614 0.459 1980 1.725 1.323 1981 1.084 0.619 1982 2.514 0.722 1983 1.612 0.627 1984 1.116 0.500 1985 0.550 0.512 1986 2.700 0.670 1987 2.446 0.827 1988 0.907 0.546 1989 0.533 0.508 1990 4.169 0.971 1991 3.504 0.896 1992 1.214 0.667 1993 1.192 0.499 1994 0.345 0.441 1995 1.637 0.691 1996 3.333 1.268 1997 2.946 1.767 1998 0.703 0.513 _____________________________________________________
Ranked Yearly Peaks for Predeveloped and Developed-Mitigated Rank Predeveloped Developed 1 4.1395 1.4527 2 3.5043 1.3234 3 3.3425 1.2678 4 3.3335 1.1987 5 2.9461 0.9713 6 2.9106 0.9651 7 2.6998 0.8956 8 2.5139 0.8768 9 2.4456 0.8271 10 2.3543 0.7333 11 2.3414 0.7222 12 2.2866 0.7118 13 2.0828 0.6914 14 2.0231 0.6811 15 1.7632 0.6735 16 1.7250 0.6695 17 1.7082 0.6669 18 1.6370 0.6648 19 1.6117 0.6641 20 1.4681 0.6586 Airport Runoff Manual - Technical DocumentationParametrix 558-2535-005July 17, 2007 Attachment 1

21 1.3344 0.6477 22 1.3341 0.6444 23 1.3263 0.6394 24 1.2965 0.6320 25 1.2722 0.6287 26 1.2191 0.6273 27 1.2147 0.6188 28 1.2141 0.6179 29 1.2118 0.6094 30 1.1923 0.6041 31 1.1784 0.6025 32 1.1540 0.6024 33 1.1535 0.6013 34 1.1475 0.5919 35 1.1388 0.5772 36 1.1249 0.5627 37 1.1158 0.5616 38 1.1157 0.5595 39 1.0842 0.5458 40 0.9874 0.5125 41 0.9066 0.5117 42 0.8679 0.5079 43 0.7470 0.5074 44 0.7034 0.5002 45 0.6144 0.4988 46 0.5496 0.4929 47 0.5334 0.4885 48 0.3451 0.4594 49 0.2774 0.4408 _____________________________________________________
1/2 2 year to 50 yearFlow(CFS) Predev Final Percentage Pass/Fail 0.7226 3659 3265 89.0 Pass 0.7587 3312 2632 79.0 Pass 0.7947 3005 2273 75.0 Pass 0.8308 2741 1999 72.0 Pass 0.8668 2477 1795 72.0 Pass 0.9029 2238 1625 72.0 Pass 0.9389 2051 1481 72.0 Pass 0.9750 1888 1354 71.0 Pass 1.0110 1738 1235 71.0 Pass 1.0471 1577 1145 72.0 Pass 1.0831 1453 1070 73.0 Pass 1.1192 1328 992 74.0 Pass 1.1552 1220 921 75.0 Pass 1.1913 1128 843 74.0 Pass 1.2273 1041 779 74.0 Pass 1.2634 969 738 76.0 Pass 1.2994 896 705 78.0 Pass 1.3355 838 667 79.0 Pass 1.3715 787 624 79.0 Pass Airport Runoff Manual - Technical DocumentationParametrix 558-2535-005July 17, 2007 Attachment 1

1.4075 728 588 80.0 Pass 1.4436 670 553 82.0 Pass 1.4796 627 513 81.0 Pass 1.5157 590 473 80.0 Pass 1.5517 553 445 80.0 Pass 1.5878 511 419 81.0 Pass 1.6238 473 399 84.0 Pass 1.6599 441 380 86.0 Pass 1.6959 410 353 86.0 Pass 1.7320 378 333 88.0 Pass 1.7680 348 319 91.0 Pass 1.8041 326 307 94.0 Pass 1.8401 304 295 97.0 Pass 1.8762 279 287 102.0 Pass 1.9122 263 272 103.0 Pass 1.9483 247 260 105.0 Pass 1.9843 231 250 108.0 Pass 2.0204 220 236 107.0 Pass 2.0564 206 223 108.0 Pass 2.0925 191 197 103.0 Pass 2.1285 183 179 97.0 Pass 2.1645 172 167 97.0 Pass 2.2006 165 152 92.0 Pass 2.2366 158 138 87.0 Pass 2.2727 148 125 84.0 Pass 2.3087 139 113 81.0 Pass 2.3448 128 98 76.0 Pass 2.3808 118 90 76.0 Pass 2.4169 104 83 79.0 Pass 2.4529 97 81 83.0 Pass 2.4890 86 72 83.0 Pass 2.5250 75 67 89.0 Pass 2.5611 68 60 88.0 Pass 2.5971 65 52 80.0 Pass 2.6332 60 50 83.0 Pass 2.6692 53 40 75.0 Pass 2.7053 48 37 77.0 Pass 2.7413 43 33 76.0 Pass 2.7774 37 32 86.0 Pass 2.8134 34 30 88.0 Pass 2.8495 31 28 90.0 Pass 2.8855 30 26 86.0 Pass 2.9215 26 22 84.0 Pass 2.9576 23 20 86.0 Pass 2.9936 22 16 72.0 Pass 3.0297 21 15 71.0 Pass 3.0657 20 13 65.0 Pass 3.1018 18 13 72.0 Pass 3.1378 16 11 68.0 Pass 3.1739 15 9 60.0 Pass 3.2099 12 8 66.0 Pass 3.2460 9 8 88.0 Pass Airport Runoff Manual - Technical DocumentationParametrix 558-2535-005July 17, 2007 Attachment 1

3.2820 9 7 77.0 Pass 3.3181 8 6 75.0 Pass 3.3541 6 5 83.0 Pass 3.3902 6 5 83.0 Pass 3.4262 6 2 33.0 Pass 3.4623 6 2 33.0 Pass 3.4983 6 2 33.0 Pass 3.5344 5 2 40.0 Pass 3.5704 5 2 40.0 Pass 3.6065 5 2 40.0 Pass 3.6425 5 1 20.0 Pass 3.6785 5 0 .0 Pass 3.7146 5 0 .0 Pass 3.7506 5 0 .0 Pass 3.7867 5 0 .0 Pass 3.8227 5 0 .0 Pass 3.8588 5 0 .0 Pass 3.8948 5 0 .0 Pass 3.9309 5 0 .0 Pass 3.9669 4 0 .0 Pass 4.0030 4 0 .0 Pass 4.0390 3 0 .0 Pass 4.0751 2 0 .0 Pass 4.1111 2 0 .0 Pass 4.1472 1 0 .0 Pass 4.1832 0 0 .0 Pass 4.2193 0 0 .0 Pass 4.2553 0 0 .0 Pass 4.2914 0 0 .0 Pass _____________________________________________________
Airport Runoff Manual - Technical DocumentationParametrix 558-2535-005July 17, 2007 Attachment 1

Detention Pond Design - WWHMLand Use predev = 5ac forest tillLand Use dev = 3ac Imp; 2ac landscape tillInfiltration rate = 0.0
YearHours
InundatedDays
InundatedConsecutive
Hours InundatedConsecutive Days
Inundated1948 4,446 185.3 1480 61.71949 5,902 245.9 3577 149.01950 5,405 225.2 3138 130.81951 5,390 224.6 1288 53.71952 5,186 216.1 2073 86.41953 6,371 265.5 2403 100.11954 6,277 261.5 2439 101.61955 5,878 244.9 2439 101.61956 6,071 253.0 1136 47.31957 5,671 236.3 1413 58.91958 6,671 278.0 3291 137.11959 6,126 255.3 1303 54.31960 5,998 249.9 1695 70.61961 5,856 244.0 948 39.51962 5,856 244.0 1261 52.51963 7,027 292.8 3058 127.41964 5,622 234.3 1349 56.21965 6,335 264.0 2341 97.51966 5,739 239.1 2748 114.51967 6,948 289.5 1279 53.31968 6,123 255.1 1889 78.71969 5,924 246.8 766 31.91970 6,714 279.8 2348 97.81971 6,943 289.3 4077 169.91972 5,504 229.3 1833 76.41973 6,316 263.2 2316 96.51974 5,996 249.8 2169 90.41975 6,602 275.1 3001 125.01976 5,385 224.4 631 26.31977 6,989 291.2 2121 88.41978 5,484 228.5 798 33.31979 6,450 268.8 1092 45.51980 6,728 280.3 1763 73.51981 5,981 249.2 1420 59.21982 7,169 298.7 1128 47.01983 6,119 255.0 1632 68.01984 5,848 243.7 1802 75.11985 5,932 247.2 1136 47.31986 5,463 227.6 1372 57.21987 5,857 244.0 793 33.01988 5,802 241.8 2412 100.51989 6,353 264.7 1514 63.11990 6,270 261.3 2234 93.11991 5,718 238.3 2029 84.51992 5,858 244.1 1498 62.4
Airport Runoff Manual - Technical DocumentationParametrix 558-2535-005July 17, 2007 Attachment 1

Detention Pond Design - WWHMLand Use predev = 5ac forest tillLand Use dev = 3ac Imp; 2ac landscape tillInfiltration rate = 0.0
YearHours
InundatedDays
InundatedConsecutive
Hours InundatedConsecutive Days
Inundated1993 5,584 232.7 1074 44.81994 6,155 256.5 2193 91.41995 6,450 268.8 1918 79.91996 7,232 301.3 5312 221.31997 5,370 223.8 1264 52.7AVG 252.6 80.2
Airport Runoff Manual - Technical DocumentationParametrix 558-2535-005July 17, 2007 Attachment 1

POND TRIAL #1 POND TRIAL #2Infiltration Pond Design - WWHM Infiltration Pond Design - WWHMLand Use predev = 5ac forest till Land Use predev = 5ac forest tillLand Use dev = 3ac Imp; 2ac landscape till Land Use dev = 3ac Imp; 2ac landscape tillInfiltration rate = 1.0 in/hr w/ 4 SF Infiltration rate = 0.5 in/hr w/ 4 SFL:W = 4:1 L:W = 4:1ss=3:1 ss=3:1
YearHours
InundatedDays
Inundated
Consecutive Hours
Inundated YearHours
Inundated Days Inundated
Consecutive Hours
Inundated1948 150 6.3 1948 357 14.9 181949 295 12.3 7 1949 595 24.8 311950 288 12.0 12 1950 568 23.7 721951 144 6.0 7 1951 346 14.4 191952 211 8.8 12 1952 438 18.3 221953 253 10.5 14 1953 536 22.3 431954 170 7.1 15 1954 377 15.7 321955 295 12.3 18 1955 642 26.8 251956 194 8.1 13 1956 423 17.6 231957 172 7.2 13 1957 402 16.8 231958 265 11.0 13 1958 583 24.3 271959 214 8.9 33 1959 484 20.2 481960 269 11.2 16 1960 560 23.3 331961 122 5.1 7 1961 309 12.9 221962 195 8.1 15 1962 440 18.3 411963 255 10.6 14 1963 542 22.6 281964 212 8.8 22 1964 442 18.4 231965 188 7.8 11 1965 438 18.3 221966 222 9.3 14 1966 485 20.2 371967 282 11.8 17 1967 547 22.8 361968 231 9.6 15 1968 523 21.8 241969 195 8.1 14 1969 374 15.6 311970 231 9.6 14 1970 521 21.7 521971 281 11.7 23 1971 631 26.3 601972 153 6.4 17 1972 336 14.0 201973 263 11.0 11 1973 580 24.2 181974 196 8.2 20 1974 426 17.8 251975 240 10.0 21 1975 512 21.3 291976 88 3.7 8 1976 210 8.8 231977 182 7.6 13 1977 423 17.6 221978 123 5.1 11 1978 238 9.9 211979 212 8.8 21 1979 465 19.4 431980 175 7.3 9 1980 425 17.7 181981 201 8.4 17 1981 492 20.5 401982 225 9.4 25 1982 517 21.5 311983 192 8.0 12 1983 417 17.4 231984 149 6.2 14 1984 316 13.2 291985 162 6.8 20 1985 371 15.5 351986 202 8.4 29 1986 415 17.3 451987 157 6.5 14 1987 327 13.6 281988 149 6.2 6 1988 402 16.8 191989 211 8.8 17 1989 407 17.0 361990 250 10.4 39 1990 534 22.3 541991 163 6.8 14 1991 360 15.0 191992 158 6.6 20 1992 362 15.1 281993 94 3.9 6 1993 225 9.4 121994 215 9.0 16 1994 455 19.0 331995 311 13.0 21 1995 622 25.9 601996 305 12.7 30 1996 574 23.9 771997 172 7.2 11 1997 419 17.5 25
Average 206 8.6 15.9 Average 448 18.7 32.1Maximum 311 13.0 39 Maximum 642 26.8 77Minimum 88 3.7 6 Minimum 210 8.8 12Number of years with > 48 hrs 0 Number of years with > 48 hrs 6
Airport Runoff Manual - Technical DocumentationParametrix 558-2535-005July 17, 2007 Attachment 2


Aviation Stormwater Design Manual Comment Form Your comments are important, as they will help in future revision of the manual. Please take a few moments to share your thoughts and ideas. Do you have any particular interest areas relating to aviation stormwater issues? Please provide the reason for your interest in the manual. (Airport operator, city manager, wildlife specialist, airport neighbor, etc.) General Comments:

Questions? Contact: John Shambaugh, Senior Planner, WSDOT Aviation Email: [email protected] Phone: 360-651-6306 Fax: 360-651-6319 More information is available at www.wsdot.wa.gov/aviation Would you like to receive WSDOT Aviation email alerts? Yes / No (circle one) Name Address City Zip Email ------------------------------------------------------------------------------------------------------------ ---------------------------------------------------------------------------------------------------------------------------------
John Shambaugh WSDOT Aviation PO Box 3367 Arlington, WA 98223