
APPENDIX B - ATTACHMENT 3 New Jersey Source … · 1 APPENDIX B - ATTACHMENT 3 New Jersey Source...
39
1 APPENDIX B - ATTACHMENT 3 New Jersey Source Water Assessment Program Potential Contaminant Source Inventory (PCSI) Methodology Introduction The 1996 Amendments to the Federal Safe Drinking Water Act required states to complete Source Water Assessments for all public drinking water sources. New Jersey’s Source Water Assessment Program (SWAP) Plan developed in conjunction with the Source Water Assessment Advisory Committee, and approved by USEPA Region 2 on November 1, 1999. Four steps were necessary to complete a source water assessment: 1. Delineate the source water assessment area of each public drinking water source. 2. Inventory the potential contaminant sources within the source water assessment area. 3. Determine the source’s susceptibility to contaminants. 4. Produce a Source Water Assessment Report for each public drinking water system, and release the report to the public. The Source Water Assessment process determined a drinking water source’s susceptibility to potential contamination from natural and anthropogenic sources. Susceptibility = Sensitivity + Intensity of contaminant use/occurrence. Susceptibility to contamination was a function of several factors, including the characteristics of the water source and contaminant use near the water source. A drinking water source’s susceptibility was determined by adding “sensitivity” and “intensity” factors. “Sensitivity” factors included items related to well construction (such as well depth) and naturally occurring items (such as geology). “Intensity” factors included contamination related to anthropogenic activities (such as Contaminated Sites). The Potential Contaminant Source Inventory (PCSI) was developed to catalog these factors. These factors were then used in susceptibility modeling to determine each drinking water source’s susceptibility rating of Low, Medium, or High. This rating represents the potential for contamination and not the actual existence of contamination. Background Source Water Assessment Program Geographic Information System (GIS) GIS technology was the main tool utilized to accumulate, analyze, transfer, report, and deliver source water assessments in New Jersey. The GIS software utilized was Environmental Systems Research Institute, Inc.'s (ESRI) ArcView and ArcInfo with migration to ArcGIS vr. 8.x. GIS tools identified source water assessment delineation areas (both groundwater and surface water) based upon certain GIS data layers. Surface water delineations were based on the overland drainage basin upstream of the intake,
Transcript of APPENDIX B - ATTACHMENT 3 New Jersey Source … · 1 APPENDIX B - ATTACHMENT 3 New Jersey Source...

1
APPENDIX B - ATTACHMENT 3
New Jersey Source Water Assessment ProgramPotential Contaminant Source Inventory (PCSI) Methodology
IntroductionThe 1996 Amendments to the Federal Safe Drinking Water Act required states tocomplete Source Water Assessments for all public drinking water sources. New Jersey’sSource Water Assessment Program (SWAP) Plan developed in conjunction with theSource Water Assessment Advisory Committee, and approved by USEPA Region 2 onNovember 1, 1999. Four steps were necessary to complete a source water assessment:
1. Delineate the source water assessment area of each public drinking watersource.
2. Inventory the potential contaminant sources within the source waterassessment area.
3. Determine the source’s susceptibility to contaminants.4. Produce a Source Water Assessment Report for each public drinking water
system, and release the report to the public.
The Source Water Assessment process determined a drinking water source’ssusceptibility to potential contamination from natural and anthropogenic sources.
Susceptibility = Sensitivity + Intensity of contaminant use/occurrence.
Susceptibility to contamination was a function of several factors, including thecharacteristics of the water source and contaminant use near the water source. A drinkingwater source’s susceptibility was determined by adding “sensitivity” and “intensity”factors. “Sensitivity” factors included items related to well construction (such as welldepth) and naturally occurring items (such as geology). “Intensity” factors includedcontamination related to anthropogenic activities (such as Contaminated Sites). ThePotential Contaminant Source Inventory (PCSI) was developed to catalog these factors.These factors were then used in susceptibility modeling to determine each drinking watersource’s susceptibility rating of Low, Medium, or High. This rating represents thepotential for contamination and not the actual existence of contamination.
Background
Source Water Assessment Program Geographic Information System (GIS)GIS technology was the main tool utilized to accumulate, analyze, transfer, report, anddeliver source water assessments in New Jersey. The GIS software utilized wasEnvironmental Systems Research Institute, Inc.'s (ESRI) ArcView and ArcInfo withmigration to ArcGIS vr. 8.x. GIS tools identified source water assessment delineationareas (both groundwater and surface water) based upon certain GIS data layers. Surfacewater delineations were based on the overland drainage basin upstream of the intake,

2
including all tributaries to the headwaters. The delineation areas then served as theinstrument for GIS clipping of the remaining data layers for use in the PCSI.
GIS Data SetsThe New Jersey SWAP Plan identified two distinct sets of necessary GIS data layers; 1)those required to create the delineation areas, and 2) those required to develop thePotential Contaminant Source Inventory (PCSI) for susceptibility model developmentand implementation. The New Jersey SWAP Plan, Table 3 pp. 36-37, lists sites/activitiesof concern, and guided DEP when identifying data layers necessary for the PCSI. GISdata-sets were gathered from many sources both within the DEP and from other sources(other New Jersey State Agencies, Federal Agencies, and State Agencies outside of NewJersey). All accumulated data for SWAP development were assessed and accepted orrejected based on the accuracy constraints of the data layers. Accuracy constraintsincluded but were not limited to data completeness, positional accuracy, and temporalconcerns. Critical data layers which either did not exist or did not meet necessaryaccuracy levels were developed by DEP staff as needed. The DEP/GIS Mapping andDigital Data Standards were followed for any data developed internally by the SWAP.
When assessing GIS data layer’s applicability, the SWAP consulted the availablemetadata. In cases when metadata were unavailable, the data steward(s) were contactedand “pre-metadata” acquired. The SWAP saved all applicable metadata and pre-metadata. GIS data continues to evolve, therefore the SWAP made every effort to keepcurrent with newly released data and any updates to current data. As new data wereassessed and accepted, these were incorporated into the SWAP.
3
Potential Contaminant Source Inventory (PCSI)
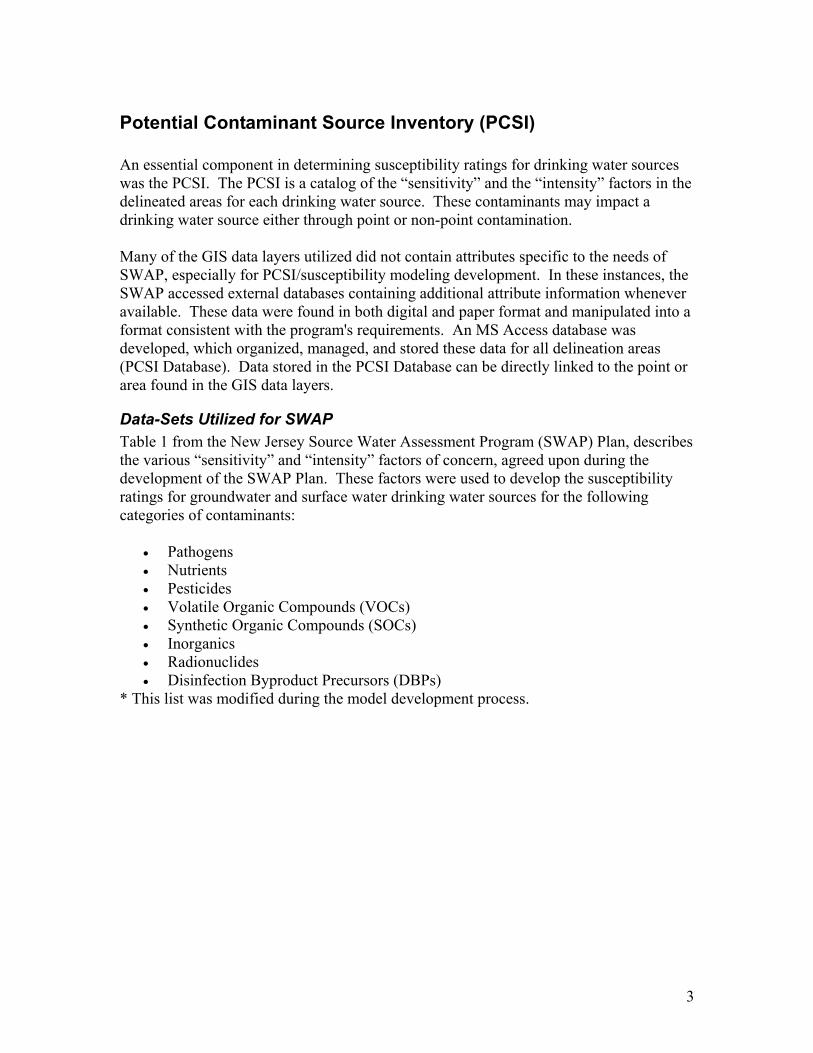
An essential component in determining susceptibility ratings for drinking water sourceswas the PCSI. The PCSI is a catalog of the “sensitivity” and the “intensity” factors in thedelineated areas for each drinking water source. These contaminants may impact adrinking water source either through point or non-point contamination.
Many of the GIS data layers utilized did not contain attributes specific to the needs ofSWAP, especially for PCSI/susceptibility modeling development. In these instances, theSWAP accessed external databases containing additional attribute information wheneveravailable. These data were found in both digital and paper format and manipulated into aformat consistent with the program's requirements. An MS Access database wasdeveloped, which organized, managed, and stored these data for all delineation areas(PCSI Database). Data stored in the PCSI Database can be directly linked to the point orarea found in the GIS data layers.
Data-Sets Utilized for SWAPTable 1 from the New Jersey Source Water Assessment Program (SWAP) Plan, describesthe various “sensitivity” and “intensity” factors of concern, agreed upon during thedevelopment of the SWAP Plan. These factors were used to develop the susceptibilityratings for groundwater and surface water drinking water sources for the followingcategories of contaminants:
• Pathogens• Nutrients• Pesticides• Volatile Organic Compounds (VOCs)• Synthetic Organic Compounds (SOCs)• Inorganics• Radionuclides• Disinfection Byproduct Precursors (DBPs)
* This list was modified during the model development process.

4
Table 1: Sites/Activities Identified in the SWAP Plan (1999) Included in the New JerseySource Water Assessments Potential Contamination Source Inventories
Site/Activity InformationSource Potential Associated Contaminant Groups
Agriculture Land use GIS Pathogens, nutrients, pesticides, inorganics
Animal feedlots/livestock yards/animalboarding facilities
Land use GIS Pathogens, nutrients, disinfection byproductformation potential
Bulk chemical storage Electronic text, GIS VOCs, SOCs, inorganicsCombined sewer overflow GIS Pathogens, nutrientsCompost facilities Electronic Text,
GISDisinfection byproduct formation potential
Contaminated soils GIS VOCs, SOCs, pesticides, inorganics, radionuclidesDischarges to surface and ground water[NJPDES/DGW (including Class V UIC) &NJPDES/DSW]
Electronic text, GIS All contaminant groups
Erosion Case by case Disinfection byproduct formation potentialGround water discharges to surface water GIS All contaminant groupsHighway runoff Case by case VOCs, pesticides, inorganicsIndustrial commercial point sources GIS All contaminant groupsInfiltration lagoons, spray irrigation sites,overland flow
Electronic text, GIS Pathogens, nutrients, VOCs, pesticides, SOCs,inorganics
Interstate pollution sources PA/NY databases All contaminant groupsJunkyards GIS VOCs, SOCs, inorganics
Known contaminated sites (e.g. Superfundsites, RCRA sites, etc.)
GIS All contaminant groups
Landfills GIS All contaminant groupsLeaking sewer lines Case by Case pathogens, nutrients, VOCsMilitary base GIS all contaminant groupsMining operations Electronic Files VOCs, inorganicsNaturally occurring contaminants (e.g.arsenic, asbestos, radium, radon etc.)
Future GIS inorganics, radionuclides
Nonagricultural pesticide application Land use GIS nutrients, pesticidesRadioactive sites GIS RadionuclidesRecreational activities (e.g. golf courses) GIS nutrients, pesticides, inorganicsRunoff Land use and GIS pathogens, nutrients, VOCs, pesticides, SOCs,
inorganicsSalt water intrusion Future GIS InorganicSeptic systems (Class V UIC-exempt andauthorized by permit-by-rule)
Future GISCensus data
pathogens, nutrients, VOCs
Surface impoundments GIS pathogens, nutrients, VOCs, pesticides, SOCs,inorganics
Leaking underground storage tanks GIS VOCsWastewater treatment plants GIS pathogens, nutrients, VOCs, SOCs, inorganics,
disinfection byproduct formation potential

5
With the list of potential factors of concern for each contaminant group, SWAP staffreached out to many Local, County, State, and Federal organizations to identifyadditional potential data-sets. Those data-sets found had varying levels of positional,temporal, and attribute accuracy. SWAP staff weighed the benefits and drawbacks ofeach data-set and established a final list of data-sets utilized for the susceptibilitymodeling. The data-sets used can be found in Table 2: GIS Data-sets Utilized for NewJersey SWAP. Descriptions of each data-set follow in the PCSI Data-set Descriptionssection.
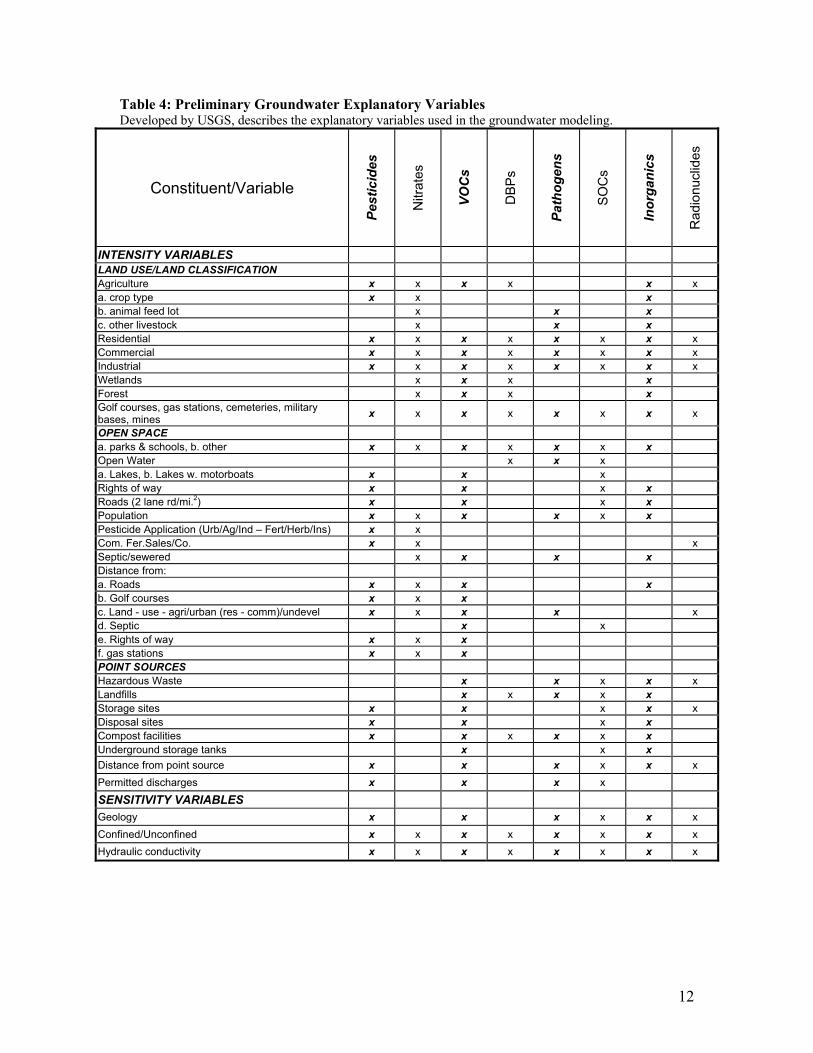
Preliminary variables were identified for each contaminant category (pesticides,pathogens, etc. ) in groundwater and surface water for use in the susceptibility models asshown in Table 3: Preliminary Surface Water Explanatory Variables and Table 4:Preliminary Groundwater Explanatory Variables.
With the preliminary variables established, the PCSI GIS data-sets were clipped by anautomated macro language program, written by USGS, to the delineation of eachdrinking water source. Each of the resulting clipped attribute tables were migrated to aMS Access database. A total of 482 surface water and groundwater preliminary variableswere created. These variables were then used in the susceptibility modeling, anexploratory data analysis using univariate and multivariate statistical techniques, andgraphical procedures. This analysis determined the susceptibility explanatory variables.
Point Source ReconciliationThe geographic data-sets used in source water assessments created overlap difficulties forboth geographic location and attribute data for each potential contaminant site. Manysites have several different permit types that reside in several geographic data-sets. Eachdata-set potentially had different locational information or used a different mappingmethod. SWAP staff felt when a site had multiple permits the site should be counted foreach permit type. In other words, a site with four permit types was weighted higher thana site with a single permit. In this way sites were ranked by how many permit types werepresent.
In addition to evaluating the contaminant variables separately, USGS and DEPinvestigated grouping several point source variables together as a single explanatoryvariable to determine if a certain subset of point sources produced meaningful results.USGS determined that although several types of point sources are not statisticallysignificant individually, grouping them as a unit could produce statistical significance.DEP and USGS grouped point sources that are similar to each other, and thesecombinations are known as “Point Source Groupings.”
Point Source Grouping 1: consists of sites on the Known Contaminated Site List and onthe Solid Waste Landfill Site list. These point sources are existing contaminationproblems.
Point Source Grouping 2: consists of New Jersey Pollutant Discharge Elimination Systemfor permitted discharges to surface water, New Jersey Pollutant Discharge Elimination

6
System storm water discharges, and Compost Facilities. These point sources arepotential surface water contamination problems.
Point Source Grouping 3: consists of New Jersey Pollutant Discharge Elimination Systemdischarges for ground water, Solid Waste Resource Recovery Facilities (RRF), SolidWaste Transfer Facilities (SWTF), and Class B Recycling Facilities. These point sourcesare potential ground water contamination problems. The last three activities (RRF,SWTF, and Class B) are designed not to discharge contamination and degrade groundwater. They do handle pollutants, and there is a potential to cause contamination. Thus,they are in the inventory. Facilities that discharge in via a NJPDES/DGW permit aregiven strict permit limits. The discharge standards are typically at or below the groundwater quality standards. For that reason, USGS and DEP felt the NJPDES/DGWactivities are closer to things that are not designed to discharge.
Point Source Grouping 4: consists of sites regulated by the DEP Discharge Preventionand Countermeasures Plan regulations and Discharge Cleanup and Removal Planregulations. These point sources are sources in which contamination currently does notexist, but if a disaster occurs a contamination problem may develop.
Point Source Grouping 5: consists of regulated Underground Storage Tanks. USGS andDEP decided to keep underground storage tanks as a separate point source grouping dueto the number of underground storage tanks in New Jersey. There are approximately19,454 underground storage tank registrations in New Jersey, consisting of active andinactive tanks. Since there are numerous registrations, USGS and DEP did not wantthese sources to overpower the other point sources and be the deciding factor indetermining susceptibility.
Point Source Grouping 6: consists of the entire Potential Contaminant Source Inventoryof point sources.
Several point source groupings were combined to determine whether or not these pointsource groupings had an effect on a source’s susceptibility. If a point source groupingcombination was found to be significant it was used as an explanatory variable in thesusceptibility models.

7
Table 2: GIS Data-sets Utilized for New Jersey SWAP
Data-Set Title Data-SetName Originator Publication
DateModified
By1970s Land Use/LandClassification giras70s USGS 1986
1986 Land Use/LandClassification nj_itu_spf
NJ Department of Environmental Protection (NJDEP), Office ofInformation Resources Management (OIRM), Bureau ofGeographic Information and Analysis (BGIA)
1995/97 Land Use/LandClassification nj_itu_spf
NJ Department of Environmental Protection (NJDEP), Office ofInformation Resources Management (OIRM), Bureau ofGeographic Information and Analysis (BGIA)
20001201
20’ Elevation Contours stconNew Jersey Department of Environmental Protection (NJDEP),Office of Information Resources Management (OIRM), Bureauof Geographic Information and Analysis (BGIA)
1987
Agricultual land in NJ bytownship in 1986 twpag86sp USGS – Eric Vowinkel 2002 Eric Vowinkel
Agricultual land in NJ bytownship in 1995 twpag95sp USGS – Eric Vowinkel 2002 Eric Vowinkel
Agricultual land in NJ bytownship in early 1970s twpag70sp USGS – Eric Vowinkel 2002 Eric Vowinkel
All Basins allbasins USGS
All Recreation Areas allrec New Jersey Department of Environmental Protection (NJDEP),Division of Science, Research and Technology (DSRT)
Bedrock Geology of NewJersey geology New Jersey Department of Environmental Protection (NJDEP),
New Jersey Geologic Survey (NJGS) 1999
Cemeteries CemeteriesNew Jersey Department of Environmental Protection (NJDEP),Office of Information Resources Management (OIRM), Bureauof Geographic Information and Analysis (BGIA)
1987
Census Blocks nynj_cenblk Environmental Systems Research Institute, Inc. (ESRI)Chrome chromeClass B RecyclingFacilities class_b New Jersey Department of Environmental Protection (NJDEP),
Solid Waste and Hazardous Waste Facilities 199206
Classification ExceptionAreas (CEA) ceapoly New Jersey Department of Environmental Protection (NJDEP),
Site Remediation Program (SRP) 2001
Combined SewerOverflows cso New Jersey Department of Environmental Protection (NJDEP),
Bureau of Safe Drinking Water (BSDW) 2001

8
Data-Set Title Data-SetName Originator Publication
DateModified
ByCompost Facilities compost New Jersey Department of Environmental Protection (NJDEP),
Solid Waste and Hazardous Waste FacilitiesCurrently Known Extents(CKE) ckepoly New Jersey Department of Environmental Protection (NJDEP),
Site Remediation Program (SRP) 2001
Dams dams New Jersey Department of Environmental Protection (NJDEP),Dam Safety 20000516
Delaware and RaritanCanal newcanal USGS 1995
Delaware and RaritanCanal Drainage Basin d_rbasin USGS and NJWSA 1995
Delaware River BasinLand Use delr_lusp83 USGS - National Land Cover Data (NLCD)
Delaware River BasinPhysiographic Provinces delrphsp83 USGS - Delaware River NAWQA
Delaware River DrainageBasin HUC11 drbhuc11 Delaware River Drainage Commission (DRBC)
Delaware River NJAmerican intake RiverReach File
RRF04404 USGS and EPA 19990930
Delaware River Trentonintake River Reach File RRF02902 USGS and EPA 19990930
Discharge Prevention andCountermeasures Plansand Discharge Cleanupand Removal Plans(DPCC) Facilities
dpcc New Jersey Department of Environmental Protection (NJDEP),Bureau of Safe Drinking Water (BSDW) 2001
Hydrologic Unit Code 14 huc14 USGS 1994Known ContaminatedSites 2001 kcsl2001 New Jersey Department of Environmental Protection (NJDEP),
Site Remediation Program (SRP) 20020507
New Jersey Streams strm_24k USGS and NJ Department of Environmental Protection(NJDEP), BGSA
New Jersey/New YorkLand Use njny_lusp83 USGS - National Land Cover Data (NLCD)

9
Data-Set Title Data-SetName Originator Publication
DateModified
ByNew York StreamsDelaware River Basin nyhyd Delaware River Drainage Commission (DRBC)
NJ Golf Courses njgolf Division of Science, Research and Technology (DSRT) 20011109
NJ Lakes njlakecov
New Jersey Department of Environmental Protection (NJDEP),Division of Landuse Management, Water Monitoring &Standards, Bureau of Freshwater Biological Monitoring(BFBM)
2003
NJ Reservoirs wsmaNew Jersey Department of Environmental Protection (NJDEP),Office of Information Resources Management (OIRM), Bureauof Geographic Information and Analysis (BGIA)
1990
NJ Streams njstreamsNew Jersey Department of Environmental Protection (NJDEP),Office of Information Resources Management (OIRM), Bureauof Geographic Information and Analysis (BGIA)
19981101
NJDOT Major Roads dotmajrd
New Jersey Department of Transportation (NJDOT), NewJersey Department of Environmental Protection (NJDEP),Office of Information Resources Management (OIRM), Bureauof Geographic Information and Analysis (BGIA)
1995/1996
NJDOT Roads dotrds
New Jersey Department of Transportation (NJDOT), NewJersey Department of Environmental Protection (NJDEP),Office of Information Resources Management (OIRM), Bureauof Geographic Information and Analysis (BGIA)
1998
NJPDES-Discharge toGroundwater Permits njpdes_dgw New Jersey Department of Environmental Protection (NJDEP),
New Jersey Pollutant Discharge Elimination System 20020912
NJPDES-Discharge toSurface Water Permits njpdes_dsw New Jersey Department of Environmental Protection (NJDEP),
New Jersey Pollutant Discharge Elimination System 20020912
NJPDES-Storm WaterPermits njpdes_storm New Jersey Department of Environmental Protection (NJDEP),
New Jersey Pollutant Discharge Elimination System 2002
Pennsylvania StreamsDelaware River Basin pahyd Delaware River Drainage Commission (DRBC)
Physiographic Provincesin New Jersey physnj_sp83 USGS 1964
Population Density cenps_sp83 U.S. Bureau of Census 1990 1990

10
Data-Set Title Data-SetName Originator Publication
DateModified
ByPotable Water SurfaceWater Intakes swint_02e New Jersey Department of Environmental Protection (NJDEP),
Bureau of Safe Drinking Water (BSDW) 2002
Railroads railr TIGER 1990 NJDEPSeptic Tank Density cenps_sp83 U.S. Bureau of Census 1990 1990Sewerage TreatmentPlants stploc New Jersey Department of Environmental Protection (NJDEP),
Bureau of Safe Drinking Water (BSDW) 2001
Soils in New Jersey andNew York bestsoil U.S. Department of Agriculture, Natural Resources
Conservation Service 1995 LeonKauffman
Solid Waste Landfills swl New Jersey Department of Environmental Protection (NJDEP),Solid Waste and Hazardous Waste Facilities
Solid Waste ResourceRecovery Facilities swrrf New Jersey Department of Environmental Protection (NJDEP),
Solid Waste and Hazardous Waste FacilitiesSolid Waste TransferFacilities swtf200011 NJDEP/Solid Waste and Hazardous Waste Facilities
State Pollutant DischargeElimination Systems -Ramapo, New York
nyrams83 NY State Department of Environmental Conservation(NYSDEC)/ Division of Water - Region 3
Surficial Geology of NewJersey surfgeo_nj New Jersey Department of Environmental Protection (NJDEP),
New Jersey Geologic Survey (NJGS)UndergroundStorageTank (UST)Permits
ust New Jersey Department of Environmental Protection (NJDEP),Bureau of Safe Drinking Water (BSDW) 2001
Waste-water TreatmentSites – Rockland County,New York
rkldwws83 USGS - NJ District
Watersheds wtrshdr_sp83 USGS New Jersey District UnknownWatersheds wtrshd_a USGS New Jersey District Unknown

11
Table 3: Preliminary Surface Water Explanatory VariablesDeveloped by USGS, describes the explanatory variables used in the surface water modeling.
Constituent/Variable
Pest
icid
es
Nitr
ate
Vola
tiles
DB
Ps
Path
ogen
s
SOC
s
Inor
gani
cs
Alg
ae/P
O4
Rad
ionu
clid
es
INTENSITY VARIABLESLAND USE/LAND CLASSIFIACTIONAgriculture x x x x xa. crop type x x xb. animal feed lot x x xc. other livestock x x xResidential x x x x x x xCommercial x x x x x x xIndustrial x x x x xWetlands x xForest x xGolf (#) x x x xOPEN SPACEa. parks x xb. other xOpen water xa. Lakes xb. Lakes/motorboatsRights of way xmi. of 2 lane Rds/mi2 xATTRIBUTESSoil loss potential x x xSoil leach potential x x x xSoil organic content xSoil Ph xWater PH xWater temp xDissolved Oxygen xPopulation x x x x x xAg. Fertilizer Appl. x xCom. Fer.Sales/County x xSeptic/sewered x x xPesticide Appl xGeology xPOINT SOURCESMunicipal STPs x x x x x xIndustrial TP x x xHazardous Waste x x x xLandfills x x xStorage sites x x xDisposal sites x x xComposting x x x xSENSITIVITY VARIABLESReservoir StorageStream IntakeSize of watershedAverage slopePurveyor-owned land
12
Table 4: Preliminary Groundwater Explanatory VariablesDeveloped by USGS, describes the explanatory variables used in the groundwater modeling.
Constituent/Variable
Pest
icid
es
Nitr
ates
VOC
s
DB
Ps
Path
ogen
s
SOC
s
Inor
gani
cs
Rad
ionu
clid
es
INTENSITY VARIABLESLAND USE/LAND CLASSIFICATIONAgriculture x x x x x xa. crop type x x xb. animal feed lot x x xc. other livestock x x xResidential x x x x x x x xCommercial x x x x x x x xIndustrial x x x x x x x xWetlands x x x xForest x x x xGolf courses, gas stations, cemeteries, militarybases, mines x x x x x x x x
OPEN SPACEa. parks & schools, b. other x x x x x x xOpen Water x x xa. Lakes, b. Lakes w. motorboats x x xRights of way x x x xRoads (2 lane rd/mi.2) x x x xPopulation x x x x x xPesticide Application (Urb/Ag/Ind – Fert/Herb/Ins) x xCom. Fer.Sales/Co. x x xSeptic/sewered x x x xDistance from:a. Roads x x x xb. Golf courses x x xc. Land - use - agri/urban (res - comm)/undevel x x x x xd. Septic x xe. Rights of way x x xf. gas stations x x xPOINT SOURCESHazardous Waste x x x x xLandfills x x x x xStorage sites x x x x xDisposal sites x x x xCompost facilities x x x x x xUnderground storage tanks x x xDistance from point source x x x x x xPermitted discharges x x x x
SENSITIVITY VARIABLESGeology x x x x x xConfined/Unconfined x x x x x x x xHydraulic conductivity x x x x x x x x

13
Constituent/Variable
Pest
icid
es
Nitr
ates
VOC
s
DB
Ps
Path
ogen
s
SOC
s
Inor
gani
cs
Rad
ionu
clid
es
Surficial Geology x x x x x x x xSoil leach/loss potential x x x x x x xSoil organic content x x x x x x xSoil pH x x x x x xAverage slope (elev.) x xDistance from: x x x x x x x xa. Surface water x x x x x x x xb. Outcrop x x x x x x x xc. Areal divides x xPurveyor owned landWell Constructiona. Well Depth x x x x x xb. Depth to Open Int. x x x x x x xc. Depth of screen below WT x x x x x x
WATER QUALITY CONSTITUENTSWater pH x x xWater Temp x xDiss. Oxygen x xOther wq constit (incl. Mn, Fe, N, NH3, F, alk.) x x x

14
PCSI Data-set Descriptions
1970 GIRASDescriptionGIRAS Land use/land cover data. This land-use/land-cover data was developed from air photos taken in thelate 60's, early 70's. The mapping was done at a scale of 1:250,000. U.S. Geological Survey, 1986, Landuse and Land cover digital data from 1:250,000- and 1:100,000-scale maps. National Mapping ProgramTechnical Instructions, Data Users Guide 4. 36 p.
1986 Land Use/Land ClassificationDescriptionLand use/land cover from NJDEP 1986 ITU. Statewide coverage was created by appending countycoverages. The data layers were created by combining two separate data sets, the land use/land cover layersfrom the Integrated Terrain Unit Maps (ITUM) and the freshwater wetlands (FWW) layers generated underthe New Jersey Freshwater Wetlands Mapping Program. While the mapping specifications and intents ofthese two mapping programs were different, the data generated by these efforts are often used together tomore fully characterize the land use/land cover of New Jersey. For those not familiar with the two data sets,the use of them together can result in some confusion. To eliminate this confusion and make theseextremely important data sets as useful as possible, the NJDEP Bureau of Geographic Information andAnalysis has digitally combined the two separate data layers for each county into single integrated countyland use/land cover (LULC) coverages. Land use/land cover interpreted from 1986 JSS CIR (1:58000)photos. Geology recompiled from 1906 (1:63360) Atlas Sheet. Soils recompiled from 1966 SCS SoilSurvey. Floodprone areas recompiled from paper USGS flood maps. Land use/land cover mapped usingmodified Anderson et al. (1976) classification system. Other sources rescaled to 1:24000 and recompiled to1986 photoquads based on coincident features. There are no soil inclusions.
1995/97 Land Use/Land ClassificationDescriptionLand use from NJDEP for 1995-97. State coverage created by merging shapefiles in ARCVIEW, turning tocoverage, and projecting. The shapefile was created by comparing the 1986 land use/land cover (LU/LC)layer from NJ DEP’s geographical information systems (GIS) database to 1995/97 color infrared (CIR)imagery and delineating areas of change. LU/LC changes were captured by adding new line work andattribute data for the 1995/97 land use directly to the base data layer. The classification system used was amodified Anderson et al., classification system. An impervious surface (IS) code was also assigned to eachLU/LC polygon based on the percentage of impervious surface within each polygon as of 1995/97. The1986 baseline data layer was composed of two originally separate layers – the LU/LC from the IntegratedTerrain Unit Mapping (ITUM) project and the Freshwater Wetlands (FWW) data from the New JerseyFreshwater Wetlands Mapping Project. NJDEP integrated the two themes into one coverage in 1996.Included in the baseline LU/LC data set, as part of the original land use layer from the ITUM mapping,were the statewide hydrology boundaries for areas below the Upper Wetlands Boundary (UWB) line.Digital images were created from 1:40000 scale NAPP CIR images by USGS, referenced in UTM, NAD83.These images were then projected to New Jersey State Plane Feet Coodinates (NJSPF), NAD83, andcompressed to JPEG images files. These NJSPF compressed files were used in the development of this dataset.
20’ Elevation ContoursDescriptionThis dataset is a graphical representation of New Jersey's statewide elevation contours with twenty footintervals. It was created from the USGS DEM 100 meter lattice.

15
Agricultural Land in NJ by Township in 1986DescriptionThis coverage was created by reselecting agricultural land use from the 1986 NJDEP ITU coverage. Thiscoverage was then intersected with the twp_24k coverage in the USGS GIS library.
Agricultural Land in NJ by Township in 1995DescriptionThis coverage was created by reselecting agricultural land use from the 1995 NJDEP ITU coverage. Thiscoverage was then intersected with the twp_24k coverage in the USGS GIS library.
Agricultural Land in NJ by Township in early 1970sDescriptionThis coverage was created by reselecting agricultural land use from the USGS GIRAS coverage. Thiscoverage was then intersected with the twp_24k coverage in the USGS GIS library.
AllbasinsDescriptionGIS data-set containing the HUC14s and mapped sub-watersheds.
All Recreation AreasDescriptionThis spatially accurate data was created from the 1995/1997 LULC coverage created by the NJDEP.Recreational lands were selected from the original data-set and exported to create the new data-set.
CemeteriesDescriptionPoint data-set of point coverage of place names and features found on USGS 7.5' topoquad series,cemeteries in New Jersey.
ChromeDescriptionChromium contamination sites in New Jersey.
Class B Recycling FacilitiesDescriptionN.J.A.C. 7:26A-1.3 (Appendix L) "Class B recyclable material" means a source separated recyclablematerial which is subject to Department approval prior to receipt, storage, processing or transfer at arecycling center in accordance with N.J.S.A. 13:1E-99.34b, and which includes, but is not limited to, thefollowing: 1. Source separated, non-putrescible, waste concrete, asphalt, brick, block, asphalt-based roofingscrap and wood waste; 2. Source separated, non-putrescible, waste materials other than metal, glass, paper,plastic containers, corrugated and other cardboard resulting from construction, remodeling, repair anddemolition operations on houses, commercial buildings, pavements and other structures; 3. Sourceseparated whole trees, tree trunks, tree parts, tree stumps, brush and leaves provided that they are notcomposted; 4. Source separated scrap tires; and 5. Source separated petroleum contaminated soil.

16
Classification Exception Areas (CEA)DescriptionThis data layer identifies those Known Contaminated Sites or sites on the Site Remediation Program (SRP)Comprehensive Site List where groundwater contamination has been identified and, where appropriate, theNJDEP has established a Classification Exception Area (CEA). CEAs are institutional controls ingeographically defined areas within which the New Jersey Ground Water Quality Standards (NJGWQS) forspecific contaminants have been exceeded. When a CEA is designated for an area, the constituent standardsand designated aquifer uses are suspended for the term of the CEA.
Combined Sewer Overflows (CSO)DescriptionCombined Sewer Overflows (CSOs) are designed to carry both sanitary sewage and stormwater at alltimes. When it rains these systems sometimes lack the necessary capacity to carry all of the sewage andstormwater, causing an overflow into a water body. The overflow may contain pathogens, floatable debris,toxic metals, settleable solids, toxic organic chemicals, nutrients, and organic contaminants. There areapproximately 280 individual CSO discharge points affecting 10 different watersheds (Hudson River,Passaic River, Second River, Hackensack River, Elizabeth River, Rahway River, Delaware River, ArthurKill, Raritan River, and the Elizabeth Channel). SWAP acquired a listing of CSOs from RamPyrarilal/Environmental Regulation (4/2000) which included latitude and longitude coordinates for theoutfalls. The coordinates were converted into State Plane, NAD83. A database was built from theinformation in order to display this data in a GIS format.
Compost FacilitiesDescriptionN.J.A.C. 7:26A-1.3 (Appendix L) "Class C recyclable material" means a source separated compostablematerial which is subject to Department approval prior to the receipt, storage, processing or transfer at arecycling center in accordance with N.J.S.A. 13:1E-99.34b, and which includes, but is not limited to,organic materials such as: 1. Source separated food waste; 2. Source separated vegetative food waste; and3. Source separated yard trimmings.
Currently Known Extents (CKE)DescriptionThis data layer contains information about areas in the state which are specified as the Currently KnownExtent (CKE) of ground water pollution. CKE areas are geographically defined areas within which thelocal ground water resources are known to be compromised because the water quality exceeds drinkingwater and ground water quality standards for specific contaminants. Historically, a number of the CKEshave also been identified as Well Restriction Areas (WRAs). The regulatory authority for developingCKEs is in N.J.A.C. 7:1J, entitled Processing of Damage Claims Pursuant to the Spill Compensation andControl Act. CKEs are used by NJDEP staff, water purveyors, and local officials to make decisionsconcerning appropriate treatment and/or replacement of contaminated drinking water supplies.
DamsDescriptionDams in New Jersey.
Delaware and Raritan CanalDescriptionThis is a coverage of the center-line of the Delaware and Raritan Canal in New Jersey. Historically, thecanal was used for transportation, and now is a water supply conduit. The canal starts on the DelawareRiver north of Bulls Island and heads south towards Trenton and then northeast to its end in New

17
Brunswick. The coverage was digitized on screen using infrared and black&white digital orthophotoquarter quads (doqqs) in the background.
Delaware and Raritan Canal Drainage BasinDescriptionThis is a coverage created by Don Rice, of drainage basins that are influent to the Delaware and RaritanCanal. It was edited from the 1:24,000 basins coverage from USGS district GIS library.
Delaware River Basin Land UseDescriptionThis Delaware River Basin land use coverage was clipped from the USGS National Land Cover Data Setby the USGS Delaware River NAWQA.
Delaware River Basin Physiographic ProvinceDescriptionThis physiographic province coverage of the Delaware River Basin came from the USGS Delaware RiverNAWQA.
Delaware River Drainage Basin HUC11DescriptionDelaware River Basin hydrologic unit code 11 (HUC11) polygon dataset obtained by NJ SWAP from theDelaware River Basin Commission (2001).
Delaware River NJ American Intake River Reach FileDescriptionThe spatial data coverage ERF1DW was modified from the ERF1 digital coverage of river reaches in theconterminous United States (Alexander and others, 1999). The ERF1DW coverage is designed to supportthe CD-ROM publication of selected characteristics of the source-water areas of 525 surface-water intakesoperated by the largest 437 public water suppliers in the conterminous United States (i.e., suppliers thatserve populations greater than 10,000 with intakes in watersheds larger than 1,000 square kilometers).Separate digital coverages (i.e., subsets of ERF1DW) that define the source-water area for each of the 525drinking water intakes are contained on the CD-ROM. The ERF1DW coverage includes the ERF1enhancements to the U.S. Environmental Protection Agency's River Reach File 1 designed to ensure thehydrologic integrity of the digital reach traces and to quantify the time of travel of river reaches andreservoirs see U.S.EPA (1996) for a description of the original RF1].
Delaware River Trenton Intake River Reach FileDescriptionThe spatial data coverage ERF1DW was modified from the ERF1 digital coverage of river reaches in theconterminous United States (Alexander and others, 1999). The ERF1DW coverage is designed to supportthe CD-ROM publication of selected characteristics of the source-water areas of 525 surface-water intakesoperated by the largest 437 public water suppliers in the conterminous United States (i.e., suppliers thatserve populations greater than 10,000 with intakes in watersheds larger than 1,000 square kilometers).Separate digital coverages (i.e., subsets of ERF1DW) that define the source-water area for each of the 525drinking water intakes are contained on the CD-ROM. The ERF1DW coverage includes the ERF1enhancements to the U.S. Environmental Protection Agency's River Reach File 1 designed to ensure thehydrologic integrity of the digital reach traces and to quantify the time of travel of river reaches andreservoirs see U.S.EPA (1996) for a description of the original RF1].

18
Discharge Prevention and Countermeasures Plans and Discharge Cleanupand Removal Plans Facilities (DPCC)DescriptionThis data was originally developed by New Jersey Department of Environmental Protection - Bureau ofGeographic Information and Analysis (20000128) and represents point sites regulated by NJDEP under oneor more regulatory permitting programs. The NJDEP Department Integrated Facility File (DIFF) served asthe database that supplied the list of sites that were captured using differential (mostly post processed) GPS.Permitting programs included in DIFF were: Contaminated Site Listing, Discharge Prevension (DPCC), NJPollution Discharge Elimination System (NJPDES), Emissions Monitoring (Air), Emergency Response,Landfill Billing, Hazardous Waste Manifest, Land Use, Right To Know, Solid Waste, Toxic CatastrophePrevention, Underground Storage Tanks, and Solid Waste Haulers. For the purposes of SWAP the data-setwas modified by SWAP personnel. All DPCC sites were reselected, exported, and a statewide coverage ofDPCC sites created.
Hydrologic Unit Code 14 (HUC14)DescriptionSub-Watersheds (HUC14): The watersheds shown in this layer are the smallest watersheds mapped by theNJDEP and the USGS, with each covering only approximately 3,000 acres. The USGS calls the watershedsHydrologic Units. Each basic unit is a unique feature, and is given a unique Hydrologic Unit Code (HUC),which is 14 digits long. The HUC is hierarchical. Larger and larger watersheds can be defined usingdifferent portions of the 14 digit code to define the watershed boundaries. These HUC14 watersheds formthe basis for the other watershed layers.
Known Contaminated Sites 2001 (KCSL)DescriptionThe Known Contaminated Sites List for New Jersey 2001 are those sites and properties within the statewhere contamination of soil or ground water has been identified or where there has been, or there issuspected to have been, a discharge of contamination. This list of Known Contaminated Sites may includesites where remediation is either currently under way, required but not yet initiated or has been completed.The data included here dates from 2001. It is important to note that some of the cases listed may have beenfully remediated and should no longer be listed as known contaminated sites. Additionally newcontaminated sites have been identified since the creation of this list and are not included here. For furtherinformation contact NJDEP's Site Remediation Programs (SRP) lead program, which are identified witheach site listed in this data base. Contact information for SRPs lead program can acquired atwww.state.nj.us/dep/srp.
• DEP’s Site Remediation Program is responsible for governing the following laws:• Federal Superfund Program• Federal Resource Conservation and Recovery Act (RCRA) Corrective Action Program• New Jersey’s Industrial Site Recovery Act (ISRA)• New Jersey’s Hazardous Discharge Site Remediation Act• New Jersey’s Underground Storage of Hazardous Substances Act (UST)• New Jersey’s Spill Compensation and Control Act• New Jersey’s Solid Waste Management Act• New Jersey’s Water Pollution Control Act
• As of December 31, 1998 the CSL database contained more than 30,000 sites in NJ.• 9,235 sites “assigned to a program”• 2,202 sites “awaiting assignment”• 18,636 sites that are considered “No Further Action” (NFA). NFAs are not in the KCSL
GIS coverage.As of December 1998 there were 31,804 active underground storage tanks (UST), of these only known orsuspected leaking tanks will be on the CSL.

19
New Jersey/New York Land UseDescriptionThis New Jersey/New York land use coverage was clipped from the USGS National Land Cover Data Setby the USGS Delaware River NAWQA.
New York Streams Delaware River BasinDescriptionStreams in the Delaware River Drainage Basin in the state of New York line data-set obtained by NJSWAP from the Delaware River Basin Commision (2001).
NJ Golf CoursesDescriptionThe shapefile represents the fairway, green and tee areas of all the golf courses in New Jersey. It wascreated by selecting all recreation polygons from the 1995/97 NJDEP land use/land cover (LU/LC) file.All recreation polygons were then compared to the 1995 digital aerial photographs to confirm the presenceor absence of a golf course. Golf course parcels were retained for the golf file. Following this the GolfDigest Places to Play Travel Planner (DeLorme, 2000) software digest was compared to the golf coursesparcels identified and names were added to each course. Over 5 individual sources were examined tocompile a complete listing of courses in New Jersey (public, private, regulation, executive size, etc.) . Thedraft file was sent to Curtis Brown (Pesticide Regulation, NJDEP) for comparison against the pesticidepermit files. Several additions or corrections were made based on these NJDEP records, confirmed withtelephone calls to the course in question. Finally, all parcels were dissolved based on the course name.There are 256 courses identified and 553 polygons (Many courses show as discontinuous polygons becausefairways/green/tee zones are separated by tracts of wetland, forest or other land covers. The purpose of thefile is to determine course acreage to assist estimating the amount of pesticide, fertilizer, and herbicide usedon an annual basis. Therefore substantial (1 acre or more) tracts of forest or wetlands are not included in acourse's polygons, although these areas may be owned by the Golf Course.
NJ LakesDescriptionThis spatially accurate data was created from the 1995/1997 LULC coverage created by the NJDEP.Natural and artificial lakes were selected from the coverage and then dissolved. Name attributes from thespatially inaccurate USGS coverage (lake) were attached via a centroid coverage. Other sources of lakenames include non-digital lake monitoring data, atlases, digital datasets, and a NJ dams coverage.
NJ ReservoirsDescriptionThis data is a graphical representation of water supply management areas which include- existing andproposed reservoirs, adjacent purveyor owned property, and well fields +50 acres large.
NJ StreamsDescriptionHydrography line (network) coverages for NJ counties.
NJDOT Major RoadsDescriptionThis data is a graphical representation showing NJDOT statewide-based major roads. The major roadnetwork for NJ was originally digitized from USGS 7.5 minute paper quadrangles and corrected to digitalorthophotography (1991). Automation date: 1985-1989; corrected to 1991/92 digital orthophotography(refer to 1991 digital orthophotography metadata text), circa 1995/96.

20
NJDOT RoadsDescriptionThis data is a graphical representation of the various roads in New Jersey. The final data was producedfrom USGS 7.5 Minute Quadrangles. Data was automated from 1985-1989; corrected to 1991/92 digitalorthophotography (refer to 1991 digital orthophotography metadata text), circa 1995/96. The road datawere delivered to DEP by NJDOT in September 1998 as dgn's. The road layers were selected out of the.dgn files and converted to shapefiles for use by the NJDEP. Please note that there are no street nameattributes associated with line features in this data.
New Jersey Pollutant Discharge Elimination System-Discharge toGroundwater Permits (NJPDES-DGW)DescriptionNew Jersey Pollutant Discharge Elimination System (NJPDES) ground water discharge pipe GIS pointcoverage compiled from GPSed locations, NJPDES databases, and permit applications. This coveragecontains the ground water discharge points for the active as well as terminated pipes.Types of activities include: surface impoundments, infiltration/percolation lagoons, overland flow systems,and spray irrigation systems. NJPDES/DGW also includes underground injection control (UIC) permits.Some permitted activities would include:
• Sanitary septic systems which do not conform to the “Standards for Construction ofIndividual Subsurface Sewage Disposal Systems.” These types of UICs typically areconsidered not to “conform” because they serve more than one dwelling.
• Any septic system receiving industrial wastewater.• True wastewater injection wells.• Subsurface trench systems.• Dry wells.• Seepage pits.
New Jersey Pollutant Discharge Elimination System-Discharge to SurfaceWater Permits (NJPDES-DSW)DescriptionNew Jersey Pollutant Discharge Elimination System (NJPDES) surface water discharge pipe GIS pointcoverage compiled from GPSed locations, NJPDES databases, and permit applications. This coveragecontains the surface water discharge points and the receiving waters coordinates for the active as well asterminated pipes. There data-set includes several permit types:
• Industrial Minor/Major – Based on type of activities at each site not necessarily contaminantsor flow.
• Municipal Minor/Major – Cutoff is at 1 MGD.
New Jersey Pollutant Discharge Elimination System -Storm Water Permits(NJPDES-Storm)DescriptionNew Jersey Pollutant Discharge Elimination System (NJPDES) Storm Water Permits. Examples ofpermitted facilities are:
• Junk yards• Animal feed Lots• Composting Facilities• Salt piles

21
Pennsylvania Streams Delaware River BasinDescriptionStreams in the Delaware River Drainage Basin in the state of Pennsylvania line data-set obtained by NJSWAP from the Delaware River Basin Commision (2001).
Population DensityDescriptionThis coverage came from the 1990 U.S. Bureau of Census coverage that was in the NJ District GISLibarary. The coverage that was selected to compute the demographic data was the Census Block Group.The septic tank density was calculated by dividing the number of people by the area of the census blockgroup. The septic tank density was calculated by dividing the number of private sewers by the area of thecensus block group.
Potable Water Surface Water IntakesDescriptionThis data set contains the Potable Surface Water Intakes for Community and Non-Community DrinkingWater Systems in the State of New Jersey. The data set includes intakes on rivers, reservoirs, and fininshedwater reservoirs.
RailroadsDescriptionRailroads in New Jersey mapped from TIGER data.
Septic Tank DensityDescriptionThis coverage came from the 1990 U.S. Bureau of Census coverage that was in the NJ District GISLibarary. The coverage that was selected to compute the demographic data was the Census Block Group.The septic tank density was calculated by dividing the number of people by the area of the census blockgroup. The septic tank density was calculated by dividing the number of private sewers by the area of thecensus block group.
Sewerage Treatment Plants (STP)DescriptionSWAP staff compiled a list of currently operating STPs, (EPA Envirofacts, NJDEP/EnvironmentalRegulation, Julio Collazo) as of 5/30/2001. This list, related to the GIS coverage for NJPDES/DSWpermits, provides coordinates to map the STPs, which includes the outfalls.
Solid Waste Landfills (SWL)DescriptionThis data represents solid waste landfills in New Jersey. The points delineated in this data were taken fromoriginal paper topoquads marked by field scientists. These delineations were completed by employees ofthe Division of Solid Waste. At a later date seven more sites were added by recompiling data to mylartopoquads and digitizing polygons into the GIS.
Solid Waste Resource Recovery Facilities (SWRRF)DescriptionN.J.A.C. 7:26 1-4 (Appendix K) Resource recovery facility means any place, equipment, device or plandesigned and/or operated to separate or process solid or liquid waste into usable secondary materials,including fuel and energy.

22
Solid Waste Transfer Facilities (SWTF)DescriptionN.J.A.C. 7:26 1-4 (Appendix K) "Transfer station" means a solid waste facility at which solid waste istransferred from one solid waste vehicle to another solid waste vehicle, including a rail car, fortransportation to an off-site solid waste facility, except that a "transfer station" shall not include any solidwaste facility at which solid waste is received for onsite transfer and processing or disposal utilizingfacility-owned or operated equipment and vehicles operated therefore a transfer station may not performany material recovery operations.
State Pollutant Discharge Elimination Systems-Ramapo, New YorkDescriptionThis is a coverage of State Pollutant Discharge Elimination Systems (SPDES) for the Ramapo area of NY.Several points are outside of the Ramapo area.
Underground Storage Tank Permits (UST)DescriptionThis data was originally developed by New Jersey Department of Environmental Protection - Bureau ofGeographic Information and Analysis (20000128) and represents point sites regulated by NJDEP under oneor more regulatory permitting programs. The NJDEP Department Integrated Facility File (DIFF) served asthe database that supplied the list of sites that were captured using differential (mostly post processed) GPS.Permitting programs included in DIFF were: Contaminated Site Listing, Discharge Prevension (DPCC), NJPollution Discharge Elimination System (NJPDES), Emissions Monitoring (Air), Emergency Response,Landfill Billing, Hazardous Waste Manifest, Land Use, Right To Know, Solid Waste, Toxic CatastrophePrevention, Underground Storage Tanks, and Solid Waste Haulers. For the purposes of SWAP the data-setwas modified by SWAP personnel. All UST sites were reselected, exported, and a statewide coverage ofUST sites created.
Wastewater Treatment Sites-Rockland County, New YorkDescriptionThis is a coverage of waste-water treatment sites in Rockland County, NY. This coverage was only used toview locations and was created using latitude/longitude of a site with the Arc command 'createpoint'

23
Table 5: List of Preliminary Variables
Medium VariableType Variable Name Variable Description
GW Intensity _1PLU70 Predominant Land-use Level 1 within delineation, 1970 Land-useGW Intensity _1PLU70_1 Predominant Land-use Level 1 within delineation, 1970 Land-use, Tier 1GW Intensity _1PLU86 Predominant Land-use Level 1 within delineation, 1986 Land-useGW Intensity _1PLU86_1 Predominant Land-use Level 1 within delineation, 1986 Land-use, Tier 1GW Intensity _1PLU95_1 Predominant Land-use Level 1 within delineation, 1995-1997 Land-use, Tier 1GW Intensity _1PLU70_2 Predominant Land-use Level 1 within delineation, 1970 Land-use, Tier 2GW Intensity _1PLU86_2 Predominant Land-use Level 1 within delineation, 1986 Land-use, Tier 2GW Intensity _1PLU95_2 Predominant Land-use Level 1 within delineation, 1995-1997 Land-use, Tier 2GW Intensity _1PLU70_3 Predominant Land-use Level 1 within delineation, 1970 Land-use, Tier 3GW Intensity _1PLU86_3 Predominant Land-use Level 1 within delineation, 1986 Land-use, Tier 3GW Intensity _1PLU95_3 Predominant Land-use Level 1 within delineation, 1995-1997 Land-use, Tier 3GW Intensity AG_SqMi Agricultural Land within delineation, in Square Miles, 1995-1997 Land-useGW Intensity ALACHLOR_1 Amount of Alachlor applied within delineation, Tier 1, in poundsGW Intensity ALACHLOR_2 Amount of Alachlor applied within delineation, Tier 2, in poundsGW Intensity ALACHLOR_3 Amount of Alachlor applied within delineation, Tier 3, in poundsGW Intensity ATRAZINE_1 Amount of Atrazine applied within delineation, Tier 1, in poundsGW Intensity ATRAZINE_2 Amount of Atrazine applied within delineation, Tier 2, in poundsGW Intensity ATRAZINE_3 Amount of Atrazine applied within delineation, Tier 3, in poundsGW Intensity BARREN_SqMi Barren Land within delineation, in Square Miles, 1995-1997 Land-useGW Intensity CARBOFURAN_1 Amount of Carbofuran applied within delineation, Tier 1, in poundsGW Intensity CARBOFURAN_2 Amount of Carbofuran applied within delineation, Tier 2, in poundsGW Intensity CARBOFURAN_3 Amount of Carbofuran applied within delineation, Tier 3, in poundsGW Intensity CSI_SqMi_1 Number of Contaminant Source Inventory sites per Square Mile within delineation, Tier 1GW Intensity CSI_SqMi_2 Number of Contaminant Source Inventory sites per Square Mile within delineation, Tier 2GW Intensity CSI_SqMi_3 Number of Contaminant Source Inventory sites per Square Mile within delineation, Tier 3GW Intensity DevUndev_1 Predominant Land-use within delineation:Developed Land (Urban & Agricultural) or
Undeveloped Land (Barren, Forest, Water, & Wetlands), Tier 1GW Intensity DevUndev_2 Predominant Land-use within delineation:Developed Land (Urban & Agricultural) or
Undeveloped Land (Barren, Forest, Water, & Wetlands), Tier 2GW Intensity DevUndev_3 Predominant Land-use within delineation:Developed Land (Urban & Agricultural) or
Undeveloped Land (Barren, Forest, Water, & Wetlands), Tier 3

24
Medium VariableType Variable Name Variable Description
GW Intensity FOREST_SqMi Forested Land within delineation, in Square Miles, 1995-1997 Land-useGW Intensity LINDANE_1 Amount of Lindane applied within delineation, Tier 1, in poundsGW Intensity LINDANE_2 Amount of Lindane applied within delineation, Tier 2, in poundsGW Intensity LINDANE_3 Amount of Lindane applied within delineation, Tier 3, in poundsGW Intensity n_CEA_1 Number of Classified Exemption Areas within delineation, Tier 1GW Intensity n_CEA_2 Number of Classified Exemption Areas within delineation, Tier 2GW Intensity n_CEA_3 Number of Classified Exemption Areas within delineation, Tier 3GW Intensity n_CEMETERIES_1 Number of Cemeteries within delineation, Tier 1GW Intensity n_CEMETERIES_2 Number of Cemeteries within delineation, Tier 2GW Intensity n_CEMETERIES_3 Number of Cemeteries within delineation, Tier 3GW Intensity n_CKE_1 Number of Currently Known Extent within delineation, Tier 1GW Intensity n_CKE_2 Number of Currently Known Extent within delineation, Tier 2GW Intensity n_CKE_3 Number of Currently Known Extent within delineation, Tier 3GW Intensity n_compost_1 Number of Class C Compost Facilities within delineation, Tier 1GW Intensity n_compost_2 Number of Class C Compost Facilities within delineation, Tier 2GW Intensity n_compost_3 Number of Class C Compost Facilities within delineation, Tier 3GW Intensity n_cso_1 Number of Combined Sewer Overflow within delineation, Tier 1GW Intensity n_cso_2 Number of Combined Sewer Overflow within delineation, Tier 2GW Intensity n_cso_3 Number of Combined Sewer Overflow within delineation, Tier 3GW Intensity n_dams_1 Number of Dams within delineation, Tier 1GW Intensity n_dams_2 Number of Dams within delineation, Tier 2GW Intensity n_dams_3 Number of Dams within delineation, Tier 3GW Intensity n_dpcc_1 Number of Discharge Prevention and Countermeasure Plan and Cleanup & Removal Plan
Sites within delineation, Tier 1GW Intensity n_dpcc_2 Number of Discharge Prevention and Countermeasure Plan and Cleanup & Removal Plan
Sites within delineation, Tier 2GW Intensity n_dpcc_3 Number of Discharge Prevention and Countermeasure Plan and Cleanup & Removal Plan
Sites within delineation, Tier 3GW Intensity n_kcsl2001_1 Number of Known Contaminant Sites within delineation, 2001, Tier 1GW Intensity n_kcsl2001_2 Number of Known Contaminant Sites within delineation, 2001, Tier 2GW Intensity n_kcsl2001_3 Number of Known Contaminant Sites within delineation, 2001, Tier 3GW Intensity n_njpdes_dgw_1 Number of NJPDES Discharge to Ground Water sites within delineation, Tier 1

25
Medium VariableType Variable Name Variable Description
GW Intensity n_njpdes_dgw_2 Number of NJPDES Discharge to Ground Water sites within delineation, Tier 2GW Intensity n_njpdes_dgw_3 Number of NJPDES Discharge to Ground Water sites within delineation, Tier 3GW Intensity n_njpdes_dsw_1 Number of NJPDES Discharge to Surface Water sites within delineation, Tier 1GW Intensity n_njpdes_dsw_2 Number of NJPDES Discharge to Surface Water sites within delineation, Tier 2GW Intensity n_njpdes_dsw_3 Number of NJPDES Discharge to Surface Water sites within delineation, Tier 3GW Intensity n_njpdes_storm_1 Number of NJPDES Storm Water Discharge sites within delineation, Tier 1GW Intensity n_njpdes_storm_2 Number of NJPDES Storm Water Discharge sites within delineation, Tier 2GW Intensity n_njpdes_storm_3 Number of NJPDES Storm Water Discharge sites within delineation, Tier 3GW Intensity n_STPloc_1 Number of Sewerage Treatment Plant locations within delineation, Tier 1GW Intensity n_STPloc_2 Number of Sewerage Treatment Plant locations within delineation, Tier 2GW Intensity n_STPloc_3 Number of Sewerage Treatment Plant locations within delineation, Tier 3GW Intensity n_swl_1 Number of Solid Waste Landfills within delineation, Tier 1GW Intensity n_swl_2 Number of Solid Waste Landfills within delineation, Tier 2GW Intensity n_swl_3 Number of Solid Waste Landfills within delineation, Tier 3GW Intensity n_swtf200011_1 Number of Solid Waste Transfer Facilities within delineation, 11/2000, Tier 1GW Intensity n_swtf200011_2 Number of Solid Waste Transfer Facilities within delineation, 11/2000, Tier 2GW Intensity n_swtf200011_3 Number of Solid Waste Transfer Facilities within delineation, 11/2000, Tier 3GW Intensity n_TotalCSI_1 Number of Contaminant Source Inventory Sites within delineation, Tier 1GW Intensity n_TotalCSI_2 Number of Contaminant Source Inventory Sites within delineation, Tier 2GW Intensity n_TotalCSI_3 Number of Contaminant Source Inventory Sites within delineation, Tier 3GW Intensity n_ust_1 Number of Underground Storage Tanks within delineation, Tier 1GW Intensity n_ust_2 Number of Underground Storage Tanks within delineation, Tier 2GW Intensity n_ust_3 Number of Underground Storage Tanks within delineation, Tier 3GW Intensity p_1PLU70 % Predominant Land-use Level 1 within delineation, 1970 Land-useGW Intensity p_1PLU70_1 % Predominant Land-use Level 1 within delineation, 1970 Land-use, Tier 1GW Intensity p_1PLU86 % Predominant Land-use Level 1 within delineation, 1986 Land-useGW Intensity p_1PLU86_1 % Predominant Land-use Level 1 within delineation, 1986 Land-use, Tier 1GW Intensity p_1PLU95_1 % Predominant Land-use Level 1 within delineation, 1995-1997 Land-use, Tier 1GW Intensity p_1PLU70_2 % Predominant Land-use Level 1 within delineation, 1970 Land-use, Tier 2GW Intensity p_1PLU86_2 % Predominant Land-use Level 1 within delineation, 1986 Land-use, Tier 2GW Intensity p_1PLU95_2 % Predominant Land-use Level 1 within delineation, 1995-1997 Land-use, Tier 2GW Intensity p_1PLU70_3 % Predominant Land-use Level 1 within delineation, 1970 Land-use, Tier 3

26
Medium VariableType Variable Name Variable Description
GW Intensity p_1PLU86_3 % Predominant Land-use Level 1 within delineation, 1986 Land-use, Tier 3GW Intensity p_1PLU95_3 % Predominant Land-use Level 1 within delineation, 1995-1997 Land-use, Tier 3GW Intensity p_AG_70 % Agricultural Land in delineation within delineation, 1970 Land-UseGW Intensity p_AG_70_1 % Agricultural Land in delineation within delineation, Tier 1, 1970 Land-UseGW Intensity p_AG_70_2 % Agricultural Land in delineation within delineation, Tier 2, 1970 Land-UseGW Intensity p_AG_70_3 % Agricultural Land in delineation within delineation, Tier 3, 1970 Land-UseGW Intensity p_AG_86 % Agricultural Land in delineation within delineation, 1986 Land-UseGW Intensity p_AG_86_1 % Agricultural Land in delineation within delineation, Tier 1, 1986 Land-UseGW Intensity p_AG_86_2 % Agricultural Land in delineation within delineation, Tier 2, 1986 Land-UseGW Intensity p_AG_86_3 % Agricultural Land in delineation within delineation, Tier 3, 1986 Land-UseGW Intensity p_AG_95_1 % Agricultural Land in delineation within delineation, Tier 1, 1995-1997 Land-UseGW Intensity p_AG_95_2 % Agricultural Land in delineation within delineation, Tier 2, 1995-1997 Land-UseGW Intensity p_AG_95_3 % Agricultural Land in delineation within delineation, Tier 3, 1995-1997 Land-UseGW Intensity p_BARREN_70 % Barren Land in delineation within delineation, 1970 Land-UseGW Intensity p_BARREN_70_1 % Barren Land in delineation within delineation, Tier 1, 1970 Land-UseGW Intensity p_BARREN_70_2 % Barren Land in delineation within delineation, Tier 2, 1970 Land-UseGW Intensity p_BARREN_70_3 % Barren Land in delineation within delineation, Tier 3, 1970 Land-UseGW Intensity p_BARREN_86 % Barren Land in delineation within delineation, 1986 Land-UseGW Intensity p_BARREN_86_1 % Barren Land in delineation within delineation, Tier 1, 1986 Land-UseGW Intensity p_BARREN_86_2 % Barren Land in delineation within delineation, Tier 2, 1986 Land-UseGW Intensity p_BARREN_86_3 % Barren Land in delineation within delineation, Tier 3, 1986 Land-UseGW Intensity p_BARREN_95_1 % Barren Land in delineation within delineation, Tier1, 1995-1997 Land-UseGW Intensity p_BARREN_95_2 % Barren Land in delineation within delineation, Tier1, 1995-1997 Land-UseGW Intensity p_BARREN_95_3 % Barren Land in delineation within delineation, Tier1, 1995-1997 Land-UseGW Intensity p_COMM_IND_type2_1 % Commercial/Industrial Land within delineation, Tier1, 1995-1997 Land-UseGW Intensity p_COMM_IND_type2_2 % Commercial/Industrial Land within delineation, Tier1, 1995-1997 Land-UseGW Intensity p_COMM_IND_type2_3 % Commercial/Industrial Land within delineation, Tier1, 1995-1997 Land-UseGW Intensity p_Dev_1 % Developed (Urban & Agricultural) Land within delineation, Tier 1, 1995-1997 Land-UseGW Intensity p_Dev_2 % Developed (Urban & Agricultural) Land within delineation, Tier 2, 1995-1997 Land-UseGW Intensity p_Dev_3 % Developed (Urban & Agricultural) Land within delineation, Tier 3, 1995-1997 Land-UseGW Intensity p_FOREST_70 % Forest Land within delineation, 1970 Land-UseGW Intensity p_FOREST_70_1 % Forest Land within delineation, Tier1, 1970 Land-Use

27
Medium VariableType Variable Name Variable Description
GW Intensity p_FOREST_70_2 % Forest Land within delineation, Tier1, 1970 Land-UseGW Intensity p_FOREST_70_3 % Forest Land within delineation, Tier1, 1970 Land-UseGW Intensity p_FOREST_86 % Forest Land within delineation, 1986 Land-UseGW Intensity p_FOREST_86_1 % Forest Land within delineation, Tier1, 1986 Land-UseGW Intensity p_FOREST_86_2 % Forest Land within delineation, Tier1, 1986 Land-UseGW Intensity p_FOREST_86_3 % Forest Land within delineation, Tier1, 1986 Land-UseGW Intensity p_FOREST_95_1 % Forest Land within delineation, Tier1, 1995-1997 Land-UseGW Intensity p_FOREST_95_2 % Forest Land within delineation, Tier1, 1995-1997 Land-UseGW Intensity p_FOREST_95_3 % Forest Land within delineation, Tier1, 1995-1997 Land-UseGW Intensity p_GolfAreaName_1 % Golf Area within delineation, Tier 1GW Intensity p_GolfAreaName_2 % Golf Area within delineation, Tier 2GW Intensity p_GolfAreaName_3 % Golf Area within delineation, Tier 3GW Intensity p_ImpSurf_1 % Impervious Surface within delineation, Tier 1GW Intensity p_ImpSurf_2 % Impervious Surface within delineation, Tier 2GW Intensity p_ImpSurf_3 % Impervious Surface within delineation, Tier 3GW Intensity p_IND_Level2_1 % Industrial Land within delineation, Tier1, 1995-1997 Land-UseGW Intensity p_IND_Level2_2 % Industrial Land within delineation, Tier1, 1995-1997 Land-UseGW Intensity p_IND_Level2_3 % Industrial Land within delineation, Tier1, 1995-1997 Land-UseGW Intensity p_Resid_type2_1 % Residential Land within delineation, Tier1, 1995-1997 Land-UseGW Intensity p_Resid_type2_2 % Residential Land within delineation, Tier1, 1995-1997 Land-UseGW Intensity p_Resid_type2_3 % Residential Land within delineation, Tier1, 1995-1997 Land-UseGW Intensity p_UnDev_1 % Undeveloped (Barren, Forest, Water, & Wetlands) Land within delineation, Tier 1, 1995-
1997 Land-UseGW Intensity p_UnDev_2 % Undeveloped (Barren, Forest, Water, & Wetlands) Land within delineation, Tier 2, 1995-
1997 Land-UseGW Intensity p_UnDev_3 % Undeveloped (Barren, Forest, Water, & Wetlands) Land within delineation, Tier 3, 1995-
1997 Land-UseGW Intensity p_Urb_Rec_type2_1 % Urban/Recreational Land within delineation, Tier1, 1995-1997 Land-UseGW Intensity p_Urb_Rec_type2_2 % Urban/Recreational Land within delineation, Tier1, 1995-1997 Land-UseGW Intensity p_Urb_Rec_type2_3 % Urban/Recreational Land within delineation, Tier1, 1995-1997 Land-UseGW Intensity p_URBAN_70 % Urban Land within delineation, 1970 Land-UseGW Intensity p_URBAN_70_1 % Urban Land within delineation, Tier1, 1970 Land-Use

28
Medium VariableType Variable Name Variable Description
GW Intensity p_URBAN_70_2 % Urban Land within delineation, Tier1, 1970 Land-UseGW Intensity p_URBAN_70_3 % Urban Land within delineation, Tier1, 1970 Land-UseGW Intensity p_URBAN_86 % Urban Land within delineation, 1986 Land-UseGW Intensity p_URBAN_86_1 % Urban Land within delineation, Tier1, 1986 Land-UseGW Intensity p_URBAN_86_2 % Urban Land within delineation, Tier1, 1986 Land-UseGW Intensity p_URBAN_86_3 % Urban Land within delineation, Tier1, 1986 Land-UseGW Intensity p_URBAN_95_1 % Urban Land within delineation, Tier1, 1995-1997 Land-UseGW Intensity p_URBAN_95_2 % Urban Land within delineation, Tier1, 1995-1997 Land-UseGW Intensity p_URBAN_95_3 % Urban Land within delineation, Tier1, 1995-1997 Land-UseGW Intensity p_WATER_70 % Water within delineation, 1970 Land-UseGW Intensity p_WATER_70_1 % Water within delineation, Tier 1, 1970 Land-UseGW Intensity p_WATER_70_2 % Water within delineation, Tier 2, 1970 Land-UseGW Intensity p_WATER_70_3 % Water within delineation, Tier 3, 1970 Land-UseGW Intensity p_WATER_86 % Water within delineation, 1986 Land-UseGW Intensity p_WATER_86_1 % Water within delineation, Tier 1, 1986 Land-UseGW Intensity p_WATER_86_2 % Water within delineation, Tier 2, 1986 Land-UseGW Intensity p_WATER_86_3 % Water within delineation, Tier 3, 1986 Land-UseGW Intensity p_WATER_95_1 % Water within delineation, Tier 1, 1995-1997 Land-UseGW Intensity p_WATER_95_2 % Water within delineation, Tier 1, 1995-1997 Land-UseGW Intensity p_WATER_95_3 % Water within delineation, Tier 1, 1995-1997 Land-UseGW Intensity p_WETLANDS_70 % Wetlands within delineation, 1970 Land-UseGW Intensity p_WETLANDS_70_1 % Wetlands within delineation, Tier 1, 1970 Land-UseGW Intensity p_WETLANDS_70_2 % Wetlands within delineation, Tier 2, 1970 Land-UseGW Intensity p_WETLANDS_70_3 % Wetlands within delineation, Tier 3, 1970 Land-UseGW Intensity p_WETLANDS_86 % Wetlands within delineation, 1986 Land-UseGW Intensity p_WETLANDS_86_1 % Wetlands within delineation, Tier 1, 1986 Land-UseGW Intensity p_WETLANDS_86_2 % Wetlands within delineation, Tier 2, 1986 Land-UseGW Intensity p_WETLANDS_86_3 % Wetlands within delineation, Tier 3, 1986 Land-UseGW Intensity p_WETLANDS_95_1 % Wetlands within delineation, Tier 1, 1995-1997 Land-UseGW Intensity p_WETLANDS_95_2 % Wetlands within delineation, Tier 2, 1995-1997 Land-UseGW Intensity p_WETLANDS_95_3 % Wetlands within delineation, Tier 3, 1995-1997 Land-UseGW Intensity SIMAZINE_1 Amount of Simazine applied within delineation, Tier 1, in pounds

29
Medium VariableType Variable Name Variable Description
GW Intensity SIMAZINE_2 Amount of Simazine applied within delineation, Tier 2, in poundsGW Intensity SIMAZINE_3 Amount of Simazine applied within delineation, Tier 3, in poundsGW Intensity URBAN_SqMi Urban Land within delineation, in Square Miles, 1995-1997 Land-useGW Intensity WATER_SqMi Water within delineation, in Square Miles, 1995-1997 Land-useGW Intensity WETLANDS_SqMi Wetlands within delineation, in Square Miles, 1995-1997 Land-useGW Intensity SepDen_2_SqMi Septic Density per Square Mile within delineation, Tier 2GW Intensity SepDen_3_SqMi Septic Density per Square Mile within delineation, Tier 3GW Intensity PopDen_2_SqMi Population per Square Mile within delineation, Tier 2GW Intensity PopDen_3_SqMi Population per Square Mile within delineation, Tier 3GW Intensity L_dotmajrd_1 Length of DOT Major Roads within delineation, Tier 1, in feetGW Intensity L_dotmajrd_3 Length of DOT Major Roads within delineation, Tier 3, in feetGW Intensity L_dotmajrd_2 Length of DOT Major Roads within delineation, Tier 2, in feetGW Intensity L_dotrds_1 Length of DOT Roads within delineation, Tier 1, in feetGW Intensity L_dotrds_2 Length of DOT Roads within delineation, Tier 2, in feetGW Intensity L_dotrds_3 Length of DOT Roads within delineation, Tier 3, in feetGW Intensity L_railr_1 Length of Rail Roads within delineation, Tier 1, in feetGW Intensity L_railr_2 Length of Rail Roads within delineation, Tier 2, in feetGW Intensity L_railr_3 Length of Rail Roads within delineation, Tier 3, in feetGW Intensity L_strm_1 Length of streams within delineation, Tier 1, in feet, 1:24000 GIS coverageGW Intensity L_strm_2 Length of streams within delineation, Tier 2, in feet, 1:24000 GIS coverageGW Intensity L_strm_3 Length of streams within delineation, Tier 3, in feet, 1:24000 GIS coverageGW Intensity p_GolfArea_1 % Golf Area within delineation, Tier 1GW Intensity p_GolfArea_2 % Golf Area within delineation, Tier 2GW Intensity p_GolfArea_3 % Golf Area within delineation, Tier 3GW Intensity n_class_b_1 Number of Class B Recycling Facilities within delineation, Tier 1GW Intensity n_class_b_2 Number of Class B Recycling Facilities within delineation, Tier 2GW Intensity n_class_b_3 Number of Class B Recycling Facilities within delineation, Tier 3GW Intensity n_swrrf_1 Number of Resource Recovery Facilities within delineation, Tier1GW Intensity n_swrrf_3 Number of Resource Recovery Facilities within delineation, Tier3GW Intensity STP_2_SqMi Number of Sewerage Treatment Plants per Square Mile within delineation, Tier 2GW Intensity STP_3_SqMi Number of Sewerage Treatment Plants per Square Mile within delineation, Tier 3GW Intensity Golf_1 Yes/No is a golf course present within delineation, Tier 1

30
Medium VariableType Variable Name Variable Description
GW Intensity Golf_2 Yes/No is a golf course present within delineation, Tier 2GW Intensity Golf_3 Yes/No is a golf course present within delineation, Tier 3GW Intensity n_swrrf_2 Number of Resource Recovery Facilities within delineation, Tier2GW Sensitivity Area_1_SqMi Area of delineation, Tier 1, in Square MilesGW Sensitivity AWC_r_1 Average available water capacity of soil within delineation, Tier 1, in centimeters of water per
centimeter of soilGW Sensitivity AWC_r_2 Average available water capacity of soil within delineation, Tier 2, in centimeters of water per
centimeter of soilGW Sensitivity AWC_r_3 Average available water capacity of soil within delineation, Tier 3, in centimeters of water per
centimeter of soilGW Sensitivity COASTAL_PL_1 Percent of delineation in Coastal Plain Physiographic Province, Tier 1GW Sensitivity COASTAL_PL_2 Percent of delineation in Coastal Plain Physiographic Province, Tier 2GW Sensitivity COASTAL_PL_3 Percent of delineation in Coastal Plain Physiographic Province, Tier 3GW Sensitivity DU_awc_1 Average available water capacity of soil within delineation, for disturbed and undisturbed areas,
Tier 1, in centimeters of water per centimeter of soilGW Sensitivity DU_awc_2 Average available water capacity of soil within delineation, for disturbed and undisturbed areas,
Tier 2, in centimeters of water per centimeter of soilGW Sensitivity DU_awc_3 Average available water capacity of soil within delineation, for disturbed and undisturbed areas,
Tier 3, in centimeters of water per centimeter of soilGW Sensitivity DU_clay_r_1 Average clay content of soil within delineation, Tier 1, in percentGW Sensitivity DU_clay_r_2 Average clay content of soil within delineation, Tier 2, in percentGW Sensitivity DU_clay_r_3 Average clay content of soil within delineation, Tier 3, in percentGW Sensitivity DU_kffact_1 Average soil erodibility factor within delineation, Tier 1, less than 2 millimeter fraction of soil
only, no unitsGW Sensitivity DU_kffact_2 Average soil erodibility factor within delineation, Tier 2, less than 2 millimeter fraction of soil
only, no unitsGW Sensitivity DU_kffact_3 Average soil erodibility factor within delineation, Tier 3, less than 2 millimeter fraction of soil
only, no unitsGW Sensitivity DU_ksat_ave_1 Average saturated hydraulic conductivity of soil within delineation, for disturbed and
undisturbed areas, Tier 1, in micrometers per secondGW Sensitivity DU_ksat_ave_2 Average saturated hydraulic conductivity of soil within delineation, for disturbed and
undisturbed areas, Tier 2, in micrometers per secondGW Sensitivity DU_ksat_ave_3 Average saturated hydraulic conductivity of soil within delineation, for disturbed and
undisturbed areas, Tier 3, in micrometers per second

31
Medium VariableType Variable Name Variable Description
GW Sensitivity DU_ksat_min_1 Minimum vertical saturated hydraulic conductivity of soil within delineation, for disturbed andundisturbed areas, Tier 1, in micrometers per second
GW Sensitivity DU_ksat_min_2 Minimum vertical saturated hydraulic conductivity of soil within delineation, for disturbed andundisturbed areas, Tier 2, in micrometers per second
GW Sensitivity DU_ksat_min_3 Minimum vertical saturated hydraulic conductivity of soil within delineation, for disturbed andundisturbed areas, Tier 3, in micrometers per second
GW Sensitivity DU_kwfact_1 Average soil erodibility factor within delineation, Tier 1, whole soil, no unitsGW Sensitivity DU_kwfact_2 Average soil erodibility factor within delineation, Tier 2, whole soil, no unitsGW Sensitivity DU_kwfact_3 Average soil erodibility factor within delineation, Tier 3, whole soil, no unitsGW Sensitivity DU_OM_1 Average organic matter of soil within delineation, for disturbed and undisturbed areas, in
percent, Tier 1GW Sensitivity DU_OM_2 Average organic matter of soil within delineation, for disturbed and undisturbed areas, in
percent, Tier 2GW Sensitivity DU_OM_3 Average organic matter of soil within delineation, for disturbed and undisturbed areas, in
percent, Tier 3GW Sensitivity DU_pH_1 Average pH of soil within delineation, for disturbed and undisturbed areas, in standard units,
Tier 1GW Sensitivity DU_pH_2 Average pH of soil within delineation, for disturbed and undisturbed areas, in standard units,
Tier 2GW Sensitivity DU_pH_3 Average pH of soil within delineation, for disturbed and undisturbed areas, in standard units,
Tier 3GW Sensitivity DU_slope_1 Average slope of soil within delineation, for disturbed and undisturbed areas, Tier 1, in degreesGW Sensitivity DU_slope_2 Average slope of soil within delineation, for disturbed and undisturbed areas, Tier 2, in degreesGW Sensitivity DU_slope_3 Average slope of soil within delineation, for disturbed and undisturbed areas, Tier 3, in degreesGW Sensitivity GeoBed_1 Predominant geologic unit within delineation, Tier 1GW Sensitivity GeoBed_2 Predominant geologic unit within delineation, Tier 2GW Sensitivity GeoBed_3 Predominant geologic unit within delineation, Tier 3GW Sensitivity hydgrp_1 Predominant soil hydrologic group within delineation, Tier 1, no unitsGW Sensitivity hydgrp_2 Predominant soil hydrologic group within delineation, Tier 2, no unitsGW Sensitivity hydgrp_3 Predominant soil hydrologic group within delineation, Tier 3, no unitsGW Sensitivity Ksat_r_ave_1 Average saturated hydraulic conductivity of soil within delineation, Tier 1, in micrometers per
secondGW Sensitivity Ksat_r_ave_2 Average saturated hydraulic conductivity of soil within delineation, Tier 2, in micrometers per
second

32
Medium VariableType Variable Name Variable Description
GW Sensitivity Ksat_r_ave_3 Average saturated hydraulic conductivity of soil within delineation, Tier 3, in micrometers persecond
GW Sensitivity muwathelcl_1 Predominant map unit water highly erodibility land designation, Tier 1, no unitsGW Sensitivity muwathelcl_2 Predominant map unit water highly erodibility land designation, Tier 2, no unitsGW Sensitivity muwathelcl_3 Predominant map unit water highly erodibility land designation, Tier 3, no unitsGW Sensitivity NEW_ENG_1 Percent of delineation in New England Physiographic Province, Tier 1GW Sensitivity NEW_ENG_2 Percent of delineation in New England Physiographic Province, Tier 2GW Sensitivity NEW_ENG_3 Percent of delineation in New England Physiographic Province, Tier 3GW Sensitivity OM_r_1 Average organic matter of soil within delineation, in percent, Tier 1GW Sensitivity OM_r_2 Average organic matter of soil within delineation, in percent, Tier 2GW Sensitivity OM_r_3 Average organic matter of soil within delineation, in percent, Tier 3GW Sensitivity p_GeoBed_1 Percent of predominant geologic unit within delineation, Tier 1GW Sensitivity p_GeoBed_2 Percent of predominant geologic unit within delineation, Tier 2GW Sensitivity p_GeoBed_3 Percent of predominant geologic unit within delineation, Tier 3GW Sensitivity p_Predom_Phys_1 Percent of predominant Physiographic Province within delineation, Tier 1GW Sensitivity p_Predom_Phys_2 Percent of predominant Physiographic Province within delineation, Tier 2GW Sensitivity p_Predom_Phys_3 Percent of predominant Physiographic Province within delineation, Tier 3GW Sensitivity pH_r_1 Average pH of soil within delineation, in standard units, Tier 1GW Sensitivity pH_r_2 Average pH of soil within delineation, in standard units, Tier 2GW Sensitivity pH_r_3 Average pH of soil within delineation, in standard units, Tier 3GW Sensitivity Phys_Prov_1 Predominant Physiographic Province within delineation, Tier 1GW Sensitivity Phys_Prov_2 Predominant Physiographic Province within delineation, Tier 2GW Sensitivity Phys_Prov_3 Predominant Physiographic Province within delineation, Tier 3GW Sensitivity PIED_1 Percent of delineation in Piedmont Physiographic Province, Tier 1GW Sensitivity PIED_2 Percent of delineation in Piedmont Physiographic Province, Tier 2GW Sensitivity PIED_3 Percent of delineation in Piedmont Physiographic Province, Tier 3GW Sensitivity SARP_1 Soil adsorbed runoff potential, Tier 1, no unitsGW Sensitivity SARP_2 Soil adsorbed runoff potential, Tier 2, no unitsGW Sensitivity SARP_3 Soil adsorbed runoff potential, Tier 3, no unitsGW Sensitivity SLP_1 Soil leaching potential, Tier 1, no unitsGW Sensitivity SLP_2 Soil leaching potential, Tier 2, no unitsGW Sensitivity SLP_3 Soil leaching potential, Tier 3, no units

33
Medium VariableType Variable Name Variable Description
GW Sensitivity SSRP_1 Soil solution runoff potential, Tier 1, no unitsGW Sensitivity SSRP_2 Soil solution runoff potential, Tier 2, no unitsGW Sensitivity SSRP_3 Soil solution runoff potential, Tier 3, no unitsGW Sensitivity VALLEY_RI_1 Percent of delineation in Valley and Ridge Physiographic Province, Tier 1GW Sensitivity VALLEY_RI_2 Percent of delineation in Valley and Ridge Physiographic Province, Tier 2GW Sensitivity VALLEY_RI_3 Percent of delineation in Valley and Ridge Physiographic Province, Tier 3GW Sensitivity NJGS_TOI Depth to Top of Open Interval, in feet, NJGSGW Sensitivity NJGS_BOI Depth to Bottom of Open Interval, in feet, NJGSGW Sensitivity NJGS_LENGTH_OPEN Length of Open Interval, in feet, NJGSGW Sensitivity Area_2_SqMi Area of delineation, Tier 2, in Square MilesGW Sensitivity Area_3_SqMi Area of delineation, Tier 3, in Square MilesGW Sensitivity Hydronum Hydronum from NJGSGW Sensitivity Hydroabb Hydroabb from NJGSGW Sensitivity Hydroname Hydroname from NJGSGW Sensitivity Geonum Geonum from NJGSGW Sensitivity Geoabb Geoabb from NJGSGW Sensitivity Geoname Geoname from NJGS
GW/SW Intensity _1PLU95 Predominant Land-use Level 1 within delineation, 1995-1997 Land-useGW/SW Intensity ALACHLOR_123 Amount of Alachlor applied within delineation, in poundsGW/SW Intensity ATRAZINE_123 Amount of Atrazine applied within delineation, in poundsGW/SW Intensity CARBOFURAN_123 Amount of Carbofuran applied within delineation, in poundsGW/SW Intensity CSI_SqMi Number of Contaminant Source Inventory sites per Square Mile within delineationGW/SW Intensity d_AGRICULTURE Distance to nearest Agricultural Land within delineation, in feet, 1995-1997 Land-useGW/SW Intensity d_BARREN Distance to nearest Barren Land within delineation, in feet, 1995-1997 Land-useGW/SW Intensity d_ceapoly Distance to nearest Classified Exemption Area polygon within delineation, in feetGW/SW Intensity d_CEMETERIES Distance to nearest Cemetery within delineation, in feetGW/SW Intensity d_ckepoly Distance to nearest Currently Known Extent polygon within delineation, in feetGW/SW Intensity d_class_b Distance to nearest Class B Recycling Facilities within delineation, in feetGW/SW Intensity d_compost Distance to nearest Class C Compost Facilities within delineation, in feetGW/SW Intensity d_cso Distance to nearest Combined Sewer Overflow within delineation, in feetGW/SW Intensity d_dams Distance to nearest Dam within delineation, in feetGW/SW Intensity d_dotmajrd Distance to nearest DOT Major Road within delineation, in feet

34
Medium VariableType Variable Name Variable Description
GW/SW Intensity d_dotrds Distance to nearest DOT Road within delineation, in feetGW/SW Intensity d_dpcc Distance to nearest Discharge Prevention and Countermeasure Plan and Cleanup & Removal
Plan Site within delineation, in feetGW/SW Intensity d_FOREST Distance to nearest Forested Land within delineation, in feet, 1995-1997 Land-useGW/SW Intensity d_kcsl2001 Distance to nearest Known Contaminant Site within delineation, in feet, 2001GW/SW Intensity d_njgolf Distance to nearest Golf Course within delineation, in feetGW/SW Intensity d_njpdes_dgw Distance to nearest NJPDES Discharge to Ground Water site within delineation, in feetGW/SW Intensity d_njpdes_dsw Distance to nearest NJPDES Discharge to Surface Water site within delineation, in feetGW/SW Intensity d_njpdes_storm Distance to nearest NJPDES Storm Water Discharge site within delineation, in feetGW/SW Intensity d_railr Distance to nearest Rail Road within delineation, in feetGW/SW Intensity d_stploc Distance to nearest Sewerage Treatment Plant location within delineation, in feetGW/SW Intensity d_strm_24k Distance to nearest Stream within delineation, in feet, 1:24000 GIS coverageGW/SW Intensity d_swl Distance to nearest Solid Waste Landfill within delineation, in feetGW/SW Intensity d_swrrf Distance to nearest Resource Recovery Facility within delineation, in feetGW/SW Intensity d_swtf200011 Distance to nearest Solid Waste Transfer Facility within delineation, in feet, 11/2000GW/SW Intensity d_URBAN Distance to nearest Urban Land, 1995-1997 Land-use within delineation, in feetGW/SW Intensity d_ust Distance to nearest Underground Storage Tank within delineation, in feetGW/SW Intensity d_WATER Distance to nearest Water within delineation, in feet, 1995-1997 Land-useGW/SW Intensity d_WETLANDS Distance to nearest Wetlands within delineation, in feet, 1995-1997 Land-useGW/SW Intensity DevUndev Predominant Land-use within delineation:Developed Land (Urban & Agricultural) or
Undeveloped Land (Barren, Forest, Water, & Wetlands)GW/SW Intensity Golf Yes/No is a golf course present within delineationGW/SW Intensity L_dotmajrd Length of DOT Major Roads within delineation, in feetGW/SW Intensity L_dotrds Length of DOT Roads within delineation, in feetGW/SW Intensity L_railr Length of Rail Roads within delineation, in feetGW/SW Intensity L_strm Length of streams within delineation, in feet, 1:24000 GIS coverageGW/SW Intensity LINDANE_123 Amount of Lindane applied within delineation, in poundsGW/SW Intensity n_CEA Number of Classified Exemption Areas within delineationGW/SW Intensity n_CEMETERIES Number of Cemeteries within delineationGW/SW Intensity n_CKE Number of Currently Known Extent within delineationGW/SW Intensity n_class_b Number of Class B Recycling Facilities within delineationGW/SW Intensity n_compost Number of Class C Compost Facilities within delineation

35
Medium VariableType Variable Name Variable Description
GW/SW Intensity n_cso Number of Combined Sewer Overflow within delineationGW/SW Intensity n_dams Number of Dams within delineationGW/SW Intensity n_dpcc Number of Discharge Prevention and Countermeasure Plan and Cleanup & Removal Plan
Sites within delineationGW/SW Intensity n_kcsl2001 Number of Known Contaminant Sites within delineation, 2001GW/SW Intensity n_njpdes_dgw Number of NJPDES Discharge to Ground Water sites within delineationGW/SW Intensity n_njpdes_dsw Number of NJPDES Discharge to Surface Water sites within delineationGW/SW Intensity n_njpdes_storm Number of NJPDES Storm Water Discharge sites within delineationGW/SW Intensity n_STPloc Number of Sewerage Treatment Plant locations within delineationGW/SW Intensity n_swl Number of Solid Waste Landfills within delineationGW/SW Intensity n_swrrf Number of Resource Recovery Facilities within delineationGW/SW Intensity n_swtf200011 Number of Solid Waste Transfer Facilities within delineation, 11/2000GW/SW Intensity n_TotalCSI Number of Contaminant Source Inventory Sites within delineationGW/SW Intensity n_ust Number of Underground Storage Tanks within delineationGW/SW Intensity p_1PLU95 % Predominant Land-use Level 1 within delineation, 1995-1997 Land-useGW/SW Intensity p_AG_95 % Agricultural Land in delineation within delineation, 1995-1997 Land-UseGW/SW Intensity p_BARREN_95 % Barren Land in delineation within delineation, 1995-1997 Land-UseGW/SW Intensity p_COMM_IND_type2 % Commercial/Industrial Land within delineation, 1995-1997 Land-UseGW/SW Intensity p_Dev % Developed (Urban & Agricultural) Land within delineation, 1995-1997 Land-UseGW/SW Intensity p_FOREST_95 % Forest Land within delineation, 1995-1997 Land-UseGW/SW Intensity p_GolfArea % Golf Area within delineationGW/SW Intensity p_GolfAreaName % Golf Area within delineationGW/SW Intensity p_ImpSurf % Impervious Surface within delineationGW/SW Intensity p_IND_Level2 % Industrial Land within delineation, 1995-1997 Land-UseGW/SW Intensity p_RESID_type2 % Residential Land within delineation, 1995-1997 Land-UseGW/SW Intensity p_UnDev % Undeveloped (Barren, Forest, Water, & Wetlands) Land within delineation, 1995-1997 Land-
UseGW/SW Intensity p_URB_REC_type2 % Urban/Recreational Land within delineation, 1995-1997 Land-UseGW/SW Intensity p_URBAN_95 % Urban Land within delineation, 1995-1997 Land-UseGW/SW Intensity p_WATER_95 % Water within delineation, 1995-1997 Land-UseGW/SW Intensity p_WETLANDS_95 % Wetlands within delineation, 1995-1997 Land-UseGW/SW Intensity PopDen_1_SqMi Population per Square Mile within delineation, Tier 1

36
Medium VariableType Variable Name Variable Description
GW/SW Intensity PopDen_SqMi Population per Square Mile within delineationGW/SW Intensity SepDen_1_SqMi Septic Density per Square Mile within delineation, Tier 1GW/SW Intensity SepDen_SqMi Septic Density per Square Mile within delineationGW/SW Intensity SIMAZINE_123 Amount of Simazine applied within delineation, in poundsGW/SW Intensity STP_1_SqMi Number of Sewerage Treatment Plants per Square Mile within delineation, Tier 1GW/SW Intensity STP_SqMi Number of Sewerage Treatment Plants per Square Mile within delineationGW/SW Intensity Well No Well Identification NumberGW/SW Intensity Bin1 number of Bin 1 sites in delineationGW/SW Intensity Bin2 number of Bin 2 sites in delineationGW/SW Intensity Bin3 number of Bin 3 sites in delineationGW/SW Intensity Bin4 number of Bin 4 sites in delineationGW/SW Intensity Bin5 number of Bin 5 sites in delineationGW/SW Intensity Bins12 number of Bins 1 & 2 sites in delineationGW/SW Intensity Bins13 number of Bins 1 & 3 sites in delineationGW/SW Intensity Bins14 number of Bins 1 & 4 sites in delineationGW/SW Intensity Bins15 number of Bins 1 & 5 sites in delineationGW/SW Intensity Bins23 number of Bins 2 & 3 sites in delineationGW/SW Intensity Bins24 number of Bins 2 & 4 sites in delineationGW/SW Intensity Bins25 number of Bins 2 & 5 sites in delineationGW/SW Intensity Bins34 number of Bins 3 & 4 sites in delineationGW/SW Intensity Bins35 number of Bins 3 & 5 sites in delineationGW/SW Intensity Bins45 number of Bins 4 & 5 sites in delineationGW/SW Intensity Bins123 number of Bins 1, 2, & 3 sites in delineationGW/SW Intensity Bins124 number of Bins 1, 2, & 4 sites in delineationGW/SW Intensity Bins125 number of Bins 1, 2, & 5 sites in delineationGW/SW Intensity Bins234 number of Bins 2, 3, & 4 sites in delineationGW/SW Intensity Bins235 number of Bins 2, 3, & 5 sites in delineationGW/SW Intensity Bins245 number of Bins 2, 4, & 5 sites in delineationGW/SW Intensity Bins134 number of Bins 1, 3, & 4 sites in delineationGW/SW Intensity Bins135 number of Bins 1, 3, & 5 sites in delineationGW/SW Intensity Bins145 number of Bins 1, 4, & 5 sites in delineationGW/SW Intensity Bins345 number of Bins 3, 4, & 5 sites in delineation

37
Medium VariableType Variable Name Variable Description
GW/SW Intensity Bins1234 number of Bins 1, 2, 3, & 4 sites in delineationGW/SW Intensity Bins1345 number of Bins 1, 3, 4, & 5 sites in delineationGW/SW Intensity Bins1245 number of Bins 1, 2, 4, & 5 sites in delineationGW/SW Intensity Bins1235 number of Bins 1, 2, 3, & 5 sites in delineationGW/SW Intensity Bins2345 number of Bins 2, 3, 4, & 5 sites in delineationGW/SW Intensity Bins12345 number of Bins 1, 2, 3, 4, & 5 sites in delineationGW/SW Intensity DenBin1 Density of Bin 1: number of Bin 1 sites per square mile of delineationGW/SW Intensity DenBin2 Density of Bin 2: number of Bin 2 sites per square mile of delineationGW/SW Intensity DenBin3 Density of Bin 3: number of Bin 3 sites per square mile of delineationGW/SW Intensity DenBin4 Density of Bin 4: number of Bin 4 sites per square mile of delineationGW/SW Intensity DenBin5 Density of Bin 5: number of Bin 5 sites per square mile of delineationGW/SW Intensity DenBins12 Density of Bins 1 & 2: number of Bins 1 & 2 sites per square mile of delineationGW/SW Intensity DenBins13 Density of Bins 1 & 3: number of Bins 1 & 3 sites per square mile of delineationGW/SW Intensity DenBins14 Density of Bins 1 & 4: number of Bins 1 & 4 sites per square mile of delineationGW/SW Intensity DenBins15 Density of Bins 1 & 5: number of Bins 1 & 5 sites per square mile of delineationGW/SW Intensity DenBins23 Density of Bins 2 & 3: number of Bins 2 & 3 sites per square mile of delineationGW/SW Intensity DenBins24 Density of Bins 2 & 4: number of Bins 2 & 4 sites per square mile of delineationGW/SW Intensity DenBins25 Density of Bins 2 & 5: number of Bins 2 & 5 sites per square mile of delineationGW/SW Intensity DenBins34 Density of Bins 3 & 4: number of Bins 3 & 4 sites per square mile of delineationGW/SW Intensity DenBins35 Density of Bins 3 & 5: number of Bins 3 & 5 sites per square mile of delineationGW/SW Intensity DenBins45 Density of Bins 4 & 5: number of Bins 4 & 5 sites per square mile of delineationGW/SW Intensity DenBins123 Density of Bins 1, 2, & 3: number of Bins 1, 2, & 3 sites per square mile of delineationGW/SW Intensity DenBins124 Density of Bins 1, 2, & 4: number of Bins 1, 2, & 4 sites per square mile of delineationGW/SW Intensity DenBins125 Density of Bins 1, 2, & 5: number of Bins 1, 2, & 5 sites per square mile of delineationGW/SW Intensity DenBins234 Density of Bins 2, 3, & 4: number of Bins 2, 3, & 4 sites per square mile of delineationGW/SW Intensity DenBins235 Density of Bins 2, 3, & 5: number of Bins 2, 3, & 5 sites per square mile of delineationGW/SW Intensity DenBins245 Density of Bins 2, 4, & 5: number of Bins 2, 4, & 5 sites per square mile of delineationGW/SW Intensity DenBins134 Density of Bins 1, 3, & 4: number of Bins 1, 3, & 4 sites per square mile of delineationGW/SW Intensity DenBins135 Density of Bins 1, 3, & 5: number of Bins 1, 3, & 5 sites per square mile of delineationGW/SW Intensity DenBins145 Density of Bins 1, 4, & 5: number of Bins 1, 4, & 5 sites per square mile of delineationGW/SW Intensity DenBins345 Density of Bins 3, 4, & 5: number of Bins 3, 4, & 5 sites per square mile of delineationGW/SW Intensity DenBins1234 Density of Bins 1, 2, 3, & 4: number of Bins 1, 2, 3, & 4 sites per square mile of delineation

38
Medium VariableType Variable Name Variable Description
GW/SW Intensity DenBins1345 Density of Bins 1, 3, 4, & 5: number of Bins 1, 3, 4, & 5 sites per square mile of delineationGW/SW Intensity DenBins1245 Density of Bins 1, 2, 4, & 5: number of Bins 1, 2, 4, & 5 sites per square mile of delineationGW/SW Intensity DenBins1235 Density of Bins 1, 2, 3, & 5: number of Bins 1, 2, 3, & 5 sites per square mile of delineationGW/SW Intensity DenBins2345 Density of Bins 2, 3, 4, & 5: number of Bins 2, 3, 4, & 5 sites per square mile of delineationGW/SW Intensity DenBins12345 Density of Bins 1, 2, 3, 4, & 5: number of Bins 1, 2, 3, 4, & 5 sites per square mile of delineationGW/SW Sensitivity Area_SqMi Area of delineation, in Square MilesGW/SW Sensitivity AWC_r Average available water capacity of soil within delineation, in centimeters of water per
centimeter of soilGW/SW Sensitivity COASTAL_PL Percent of delineation in Coastal Plain Physiographic ProvinceGW/SW Sensitivity DU_AWC Average available water capacity of soil within delineation, for disturbed and undisturbed areas,
in centimeters of water per centimeter of soilGW/SW Sensitivity DU_Clay_r Average clay content of soil within delineation, in percentGW/SW Sensitivity DU_KFfact Average soil erodibility factor within delineation, less than 2 millimeter fraction of soil only, no
unitsGW/SW Sensitivity DU_Ksat_ave Average saturated hydraulic conductivity of soil within delineation, for disturbed and
undisturbed areas, in micrometers per secondGW/SW Sensitivity DU_Ksat_min Minimum vertical saturated hydraulic conductivity of soil within delineation, for disturbed and
undisturbed areas, in micrometers per secondGW/SW Sensitivity DU_KWfact Average soil erodibility factor within delineation, whole soil, no unitsGW/SW Sensitivity DU_OM Average organic matter of soil within delineation, for disturbed and undisturbed areas, in
percentGW/SW Sensitivity DU_pH Average pH of soil within delineation, for disturbed and undisturbed areas, in standard unitsGW/SW Sensitivity DU_slope Average slope of soil within delineation, for disturbed and undisturbed areas, in degreesGW/SW Sensitivity GeoBed Predominant geologic unit within delineationGW/SW Sensitivity HUC8 Predominant hydrologic unit within delineationGW/SW Sensitivity hydgrp Predominant soil hydrologic group within delineation, no unitsGW/SW Sensitivity Ksat_r_ave Average saturated hydraulic conductivity of soil within delineation, in micrometers per secondGW/SW Sensitivity muwathelcl Predominant map unit water highly erodibility land designation, no unitsGW/SW Sensitivity NEW_ENG Percent of delineation in New England Physiographic ProvinceGW/SW Sensitivity OM_r Average organic matter of soil within delineation, in percentGW/SW Sensitivity p_GeoBed Percent of predominant geologic unit within delineationGW/SW Sensitivity p_HUC Percent of predominant hydrologic unit within delineationGW/SW Sensitivity p_Predom_Phys Percent of predominant Physiographic Province within delineation

39
Medium VariableType Variable Name Variable Description
GW/SW Sensitivity p_watershed Percent of predominant watershed within delineationGW/SW Sensitivity pH_r Average pH of soil within delineation, in standard unitsGW/SW Sensitivity Phys_Prov Predominant Physiographic Province within delineationGW/SW Sensitivity PIED Percent of delineation in Piedmont Physiographic ProvinceGW/SW Sensitivity SARP Soil adsorbed runoff potential, no unitsGW/SW Sensitivity SLP Soil leaching potential, no unitsGW/SW Sensitivity SSRP Soil solution runoff potential, no unitsGW/SW Sensitivity VALLEY_RI Percent of delineation in Valley and Ridge Physiographic ProvinceGW/SW Sensitivity WtrShd Predominant watershed within delineation


