APPENDIX B – SOIL SAMPLE SUMMARY · Appendix B – Attachment B-5 CSC B-5-2 January 2010...
24
Casmalia Site Draft Final Remedial Investigation Report Appendix B – Attachment B-5 CSC B-5-1 January 2010 X:\Casmalia Draft Final RI Report\Appendix B\Apx B Text.doc Box plots are presented in Figures B5-1 through B5-21 that summarize, for each of 21 metals, the data distribution for each study area as well as background. For perspective, toxicity screening levels are identified. Each box plot depicts a summary of the associated data distribution along a log transformed scale, as follows. The open box incorporates the middle 50% of the data referred to as the inter-quartile range (IQR), and thus is stretched between the 75 th percentile and the 25 th percentiles of the data (see in-text diagram below). The median is indicated by a black bar. The dotted lines, referred to as whiskers, stretch to the highest data point before what is considered by the algorithm to be an isolated value, a potential outlier. The end limits of each upper (or lower) whisker is an observed data point that is no more than 1.5 times the IQR above the upper edge of the open box (or below the lower edge). Any separate lines above or below the whisker limits are potential outliers. Outliers are considered unusual, and outside the distribution of remaining data, however interpretation of why the outlier exists (analysis error, localized contamination, etc.) must be made on a case by case basis. Under each study area abbreviation, the total sample size and number of detected values (in parenthesis) are indicated. . . . potential outliers Censored data are plotted at their detection limits. However, using this, or any other replacement value occasionally affects the size, location, or behavior (e.g. what is considered an outlier), of the boxes to the extent that the plot itself can be misleading. For example, in the figures for Cobalt, the box plot algorithm does not show a box for the middle 75% of the data, but only a line for the median. In effect, the box does not extend beyond the median because 53 of the 97 background data points (over 50%) are “less than 5.0” and represented as all equaling 5.0 (rather than as their unique unknown concentrations varying in the range less than 5. When the central 50% of the data points are equal, the algorithm considers all remaining points (most of which, in this case, are detected concentrations) as low and high outliers. A . . . median whisker (data within expected lower tail of distribution) box (middle 50% of data) whisker (data within expected upper tail of distribution)
Transcript of APPENDIX B – SOIL SAMPLE SUMMARY · Appendix B – Attachment B-5 CSC B-5-2 January 2010...
Casmalia Site Draft Final Remedial Investigation Report Appendix B – Attachment B-5
C S C B-5-1 January 2010 X:\Casmalia Draft Final RI Report\Appendix B\Apx B Text.doc
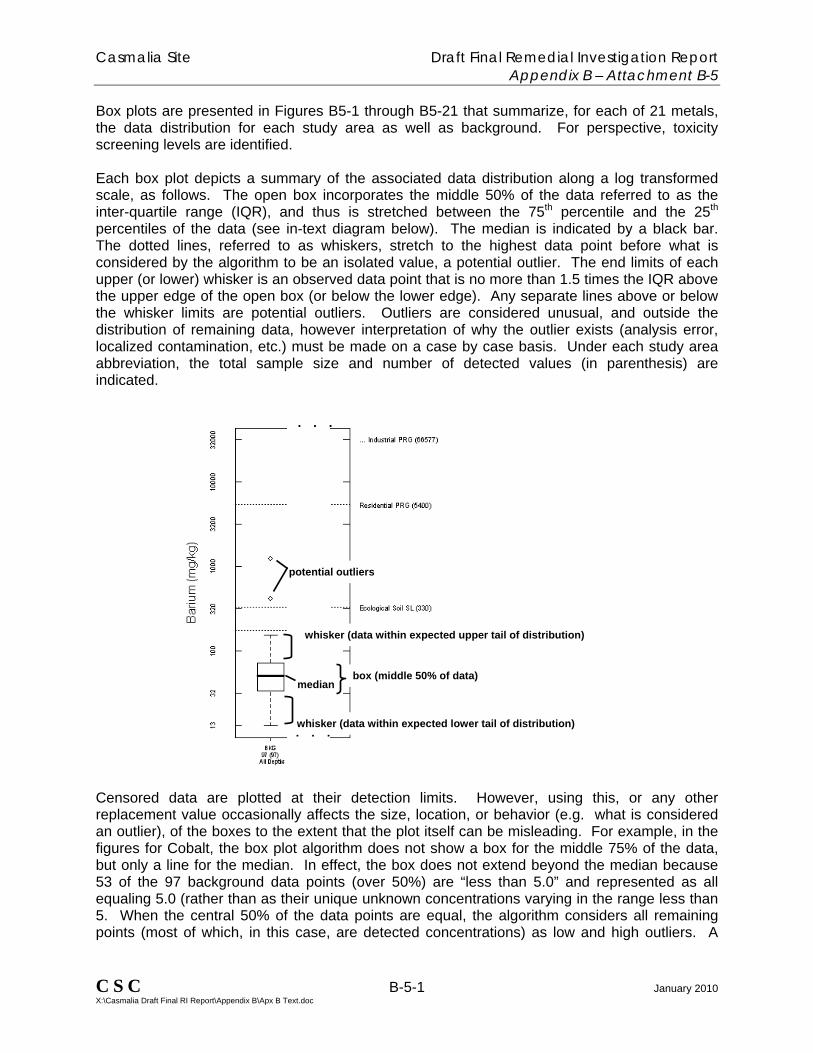
Box plots are presented in Figures B5-1 through B5-21 that summarize, for each of 21 metals, the data distribution for each study area as well as background. For perspective, toxicity screening levels are identified. Each box plot depicts a summary of the associated data distribution along a log transformed scale, as follows. The open box incorporates the middle 50% of the data referred to as the inter-quartile range (IQR), and thus is stretched between the 75th percentile and the 25th percentiles of the data (see in-text diagram below). The median is indicated by a black bar. The dotted lines, referred to as whiskers, stretch to the highest data point before what is considered by the algorithm to be an isolated value, a potential outlier. The end limits of each upper (or lower) whisker is an observed data point that is no more than 1.5 times the IQR above the upper edge of the open box (or below the lower edge). Any separate lines above or below the whisker limits are potential outliers. Outliers are considered unusual, and outside the distribution of remaining data, however interpretation of why the outlier exists (analysis error, localized contamination, etc.) must be made on a case by case basis. Under each study area abbreviation, the total sample size and number of detected values (in parenthesis) are indicated.
. . .
potential outliers
Censored data are plotted at their detection limits. However, using this, or any other replacement value occasionally affects the size, location, or behavior (e.g. what is considered an outlier), of the boxes to the extent that the plot itself can be misleading. For example, in the figures for Cobalt, the box plot algorithm does not show a box for the middle 75% of the data, but only a line for the median. In effect, the box does not extend beyond the median because 53 of the 97 background data points (over 50%) are “less than 5.0” and represented as all equaling 5.0 (rather than as their unique unknown concentrations varying in the range less than 5. When the central 50% of the data points are equal, the algorithm considers all remaining points (most of which, in this case, are detected concentrations) as low and high outliers. A
. . .
median
whisker (data within expected lower tail of distribution)
box (middle 50% of data)
whisker (data within expected upper tail of distribution)

Casmalia Site Draft Final Remedial Investigation Report Appendix B – Attachment B-5
C S C B-5-2 January 2010 X:\Casmalia Draft Final RI Report\Appendix B\Apx B Text.doc
better box plot representation of the sampled population would involve using specialized statistical methods censored data, such as regression order statistics (Helsel, 1994). Aside from detection limit uncertainty, these box plots are helpful for quickly viewing distributions as varying across the site and also for identifying outliers. Although the condensation of the full information contained in a given data into only a few statistics (IQR, median, and outliers) necessarily drops information which may sometimes be important (in particular cases), this condensation allows many box plots to be grouped onto a single page to compare across study areas. The calculation of box and whiskers on the log transformed data scale was chosen because background and study area metals were found to have skewed distributions generally characterized by a lognormal distribution type. The box plot whiskers calculated from and applied to log-transformed data identify outliers that are “outside” of expectations for a lognormal distribution.
References Helsel, D.R., Hirsch, R.M., 1994. Statistical Methods in Water Resources. John Wiley.

Casmalia Resources Superfund Site Final Remedial Investigation Report Attachment B-5
C S C B - 5 - 3 January 2011 X:\CASMALIA FINAL RI REPORT\_REPORT ON CD\APPENDIX B\ATTACHMENTS\ATT B-5\ATTACH B-5 TOC.DOC
Box Plots
List of Figures Figure B5-1 – Log Scale Box Plots of Aluminum (0 to 10 feet) Figure B5-2 – Log Scale Box Plots of Antimony (0 to 10 feet) Figure B5-3 – Log Scale Box Plots of Arsenic (0 to 10 feet) Figure B5-4 – Log Scale Box Plots of Barium (0 to 10 feet) Figure B5-5 – Log Scale Box Plots of Beryllium (0 to 10 feet) Figure B5-6 – Log Scale Box Plots of Cadmium (0 to 10 feet) Figure B5-7 – Log Scale Box Plots of Chromium (0 to 10 feet) Figure B5-8 – Log Scale Box Plots of Cobalt (0 to 10 feet) Figure B5-9 – Log Scale Box Plots of Copper (0 to 10 feet) Figure B5-10 – Log Scale Box Plots of Iron (0 to 10 feet) Figure B5-11 – Log Scale Box Plots of Lead (0 to 10 feet) Figure B5-12 – Log Scale Box Plots of Magnesium (0 to 10 feet) Figure B5-13 – Log Scale Box Plots of Manganese (0 to 10 feet) Figure B5-14 – Log Scale Box Plots of Mercury (0 to 10 feet) Figure B5-15 – Log Scale Box Plots of Molybdenum (0 to 10 feet) Figure B5-16 – Log Scale Box Plots of Nickel (0 to 10 feet) Figure B5-17 – Log Scale Box Plots of Selenium (0 to 10 feet) Figure B5-18 – Log Scale Box Plots of Thallium (0 to 10 feet) Figure B5-19 – Log Scale Box Plots of Tin (0 to 10 feet) Figure B5-20 – Log Scale Box Plots of Vanadium (0 to 10 feet) Figure B5-21 – Log Scale Box Plots of Zinc (0 to 10 feet)

● ●
●
●
●●
●
●●
●●
●
●
●
●
●
●
● ●●
●●●
●
●
BKG
25 (25) All Depths
Off
16 (16)
Adm
11 (11)
BC
26 (26)
CDA
40 (40)
FPP
218 (218)
LiqT
41 (41)
MS
39 (39)
PD−RCF 18 (18)
PD−A 12 (12)
RCRA
102 (102)
WCSA 36 (36)
Road
60 (60)
ROS
63 (63)
Alu
min
um (
mg/
kg)
Figure B5−1Log Scale Box Plots of Aluminum (0 to 10 Feet)
Casmalia Resources Superfund Site Remedial Investigation
Study Area or Pond With Number of Samples (Number of Detections)
With MDL assigned to non−detects
430
1000
3200
1000
032
000
1e+
05
Background UTL (18000)
Residential PRG (76000)
Industrial PRG (100000)

●
●
●
●●●
●●●●●●●●●●●●●●●
●
●
● ●●
●
●●
●●
● ●●●●●
●
●
●
●●
BKG
97 (12) All Depths
Off
16 (0)
Adm
11 (0)
BC
26 (0)
CDA 39 (1)
FPP
218 (0)
LiqT
41 (0)
MS
39 (1)
PD−RCF
18 (0)
PD−A 12 (0)
RCRA 102 (1)
WCSA 36 (0)
Road 60 (0)
ROS 63 (3)
Ant
imon
y (m
g/kg
)Figure B5−2
Log Scale Box Plots of Antimony (0 to 10 Feet)
Casmalia Resources Superfund Site Remedial Investigation
Study Area or Pond With Number of Samples (Number of Detections)
With MDL assigned to non−detects
0.01
30.
032
0.1
0.32
13.
210
Ecological Soil SL (0.27)
Background UTL (4.0)
... Residential PRG (31)
... Industrial PRG (410)

●●
●●●
●
●
●●
●●
●
●
●
●
●
●
●●
●●●●
●
●
●
●
●
●
●
●
●
●●
●
●●●
●
●
●
●
●
●
●
●
●
●
●
●
●
●
●
●
●
●
●
BKG
97 (80) All Depths
Off
16 (16)
Adm
11 (11)
BC
26 (26)
CDA
41 (36)
FPP
218 (209)
LiqT
41 (39)
MS
39 (38)
PD−RCF 18 (18)
PD−A 12 (10)
RCRA
102 (100)
WCSA 36 (36)
Road
60 (58)
ROS
63 (61)
Ars
enic
(m
g/kg
)Figure B5−3
Log Scale Box Plots of Arsenic (0 to 10 Feet)
Casmalia Resources Superfund Site Remedial Investigation
Study Area or Pond With Number of Samples (Number of Detections)
With MDL assigned to non−detects
0.00
440.
010.
11
1010
0
Residential PRG − CA (0.062)
Industrial PRG − CA (0.251)
Residential PRG (0.39)
Industrial PRG (1.59)
Ecological Soil SL (18)Background UTL (22)

●
●
●
●
●●●
●
●
●
●
●
●
●
●
●
●●
●
●
●
BKG
97 (97) All Depths
Off
16 (16)
Adm
11 (11)
BC
26 (26)
CDA
41 (40)
FPP
218 (218)
LiqT
41 (41)
MS
39 (39)
PD−RCF 18 (18)
PD−A 12 (12)
RCRA
102 (102)
WCSA 36 (36)
Road
60 (60)
ROS
63 (63)
Bar
ium
(m
g/kg
)Figure B5−4
Log Scale Box Plots of Barium (0 to 10 Feet)
Casmalia Resources Superfund Site Remedial Investigation
Study Area or Pond With Number of Samples (Number of Detections)
With MDL assigned to non−detects
1332
100
320
1000
3200
1000
032
000
Background UTL (174)
Ecological Soil SL (330)
Residential PRG (5400)
... Industrial PRG (66577)

●●●●●●●●●●●●●●●●●●●●●●
●●
●
●
●●
●
●●
●
●
●
●
●
●
●
●
●
●
●
●●●
●
●
●
●
●
●
●
●
●
●●
●
●
●
●
●
●
●●
●●
●
●
●●
●
●
●
BKG
97 (25) All Depths
Off
16 (16)
Adm
11 (11)
BC
26 (26)
CDA
41 (40)
FPP
218 (218)
LiqT
41 (41)
MS
39 (38)
PD−RCF 18 (18)
PD−A 12 (12)
RCRA
102 (101)
WCSA 36 (36)
Road
60 (60)
ROS
63 (63)
Ber
ylliu
m (
mg/
kg)
Figure B5−5Log Scale Box Plots of Beryllium (0 to 10 Feet)
Casmalia Resources Superfund Site Remedial Investigation
Study Area or Pond With Number of Samples (Number of Detections)
With MDL assigned to non−detects
0.12
0.16
0.25
0.4
0.63
11.
6
Background UTL (.91)
... Updated Eco Soil SL (10)
... Ecological Soil SL (20)
... Residential PRG (50)
... Industrial PRG (1941)

●
●●
●●
●
●●
●
●
●
●
●
●
●
●
●
●
●
●●
●
●
●
●●●●
●
●
●
●
●●●
●
●
●●
●
●
●
●
●
●
●●
●●
●
●
●
●
●
●
●●
●
●●●
●
●
●
●
●
●●●
●●
●
●
●
●
●●
●
●
●
●
BKG
97 (33) All Depths
Off
16 (16)
Adm
11 (11)
BC
26 (26)
CDA
41 (41)
FPP
218 (218)
LiqT
41 (41)
MS
39 (38)
PD−RCF 28 (28)
PD−A 22 (22)
RCRA
102 (102)
WCSA 36 (36)
Road
60 (60)
ROS
63 (63)
Cad
miu
m (
mg/
kg)
Figure B5−6Log Scale Box Plots of Cadmium (0 to 10 Feet)
Casmalia Resources Superfund Site Remedial Investigation
Study Area or Pond With Number of Samples (Number of Detections)
With MDL assigned to non−detects
0.11
0.32
13.
210
3210
0
Ecological Soil SL (0.36)
Background UTL (3.2)
Updated Eco Soil SL (32)Residential PRG (37)
... Industrial PRG (451)

●●
●●●●●
●
●●●
●
●
●
●
●
●
●●
●
●●
●●
●
●●
●
●
●
●
●
●
●
●
●
●
●
●●
●
●
●
●
●
●
●
●
●
●
●
●
●●
●
●●
●
●
●
●
BKG
97 (97) All Depths
Off
16 (16)
Adm
11 (11)
BC
26 (26)
CDA
41 (41)
FPP
218 (218)
LiqT
41 (41)
MS
39 (39)
PD−RCF 18 (18)
PD−A 12 (12)
RCRA
102 (102)
WCSA 36 (36)
Road
60 (60)
ROS
63 (63)
Chr
omiu
m (
mg/
kg)
Figure B5−7Log Scale Box Plots of Chromium (0 to 10 Feet)
Casmalia Resources Superfund Site Remedial Investigation
Study Area or Pond With Number of Samples (Number of Detections)
With MDL assigned to non−detects
0.4
13.
210
3210
032
010
00
Ecological Soil SL (0.4)
Background UTL (64)
Residential PRG (210)
Industrial PRG (448)

●
●●
●
●●
●
●●
●
●
●●●
●
●●
●
●
●
●
●
●
●●
●
●
●
●●
●●
●
●
●
●
●
●
●
●
●●●●
●
●
●
●
●
●
●
●●
●●
●
●
●
● ●
●
●●
●
BKG
97 (49) All Depths
Off
16 (16)
Adm
11 (11)
BC
26 (25)
CDA
40 (39)
FPP
218 (218)
LiqT
41 (41)
MS
39 (39)
PD−RCF 18 (18)
PD−A 12 (12)
RCRA
102 (101)
WCSA 36 (36)
Road
60 (60)
ROS
63 (63)
Cob
alt (
mg/
kg)
Figure B5−8Log Scale Box Plots of Cobalt (0 to 10 Feet)
Casmalia Resources Superfund Site Remedial Investigation
Study Area or Pond With Number of Samples (Number of Detections)
With MDL assigned to non−detects
0.82
3.2
1032
100
320
1000
Ecological Soil SL (13)
Background UTL (20)
Residential PRG (900)

●●●
●
●●
●
●
●●●●●●●
●
●
●
●
●
●
●
●●
●
●
●
●
●
●
●●●●●
● ●
●
●●
●
●
●
●
●
●
●
●
●
●
●
●
●●
●
●
●●
●
●
●
●
●
●
●
●●●
BKG
97 (87) All Depths
Off
16 (16)
Adm
11 (11)
BC
26 (26)
CDA
41 (40)
FPP
218 (218)
LiqT
41 (41)
MS
39 (39)
PD−RCF 28 (28)
PD−A 22 (22)
RCRA
102 (102)
WCSA 36 (36)
Road
60 (60)
ROS
63 (63)
Cop
per
(mg/
kg)
Figure B5−9Log Scale Box Plots of Copper (0 to 10 Feet)
Casmalia Resources Superfund Site Remedial Investigation
Study Area or Pond With Number of Samples (Number of Detections)
With MDL assigned to non−detects
0.00
820.
11
1010
010
0010
000
Background UTL (19)Ecological Soil SL (28)
Updated Eco Soil SL (70)
Residential PRG (3100)
... Industrial PRG (40880)

●
●
●●
●●
●●●●
●
●●
●●●●
●
●
●●
●
●●
●
●
●
●●
●
●
●
●
●●
●
●
●
●
●
●
●
●
●
●
●
●
●
●
●●
●
●
●● ●●
●●
●
●
●
●
●●●
BKG
25 (25) All Depths
Off
16 (16)
Adm
11 (11)
BC
26 (26)
CDA
41 (41)
FPP
218 (215)
LiqT
41 (41)
MS
39 (38)
PD−RCF 18 (18)
PD−A 12 (12)
RCRA
102 (101)
WCSA 36 (36)
Road
60 (60)
ROS
63 (60)
Iron
(m
g/kg
)Figure B5−10
Log Scale Box Plots of Iron (0 to 10 Feet)
Casmalia Resources Superfund Site Remedial Investigation
Study Area or Pond With Number of Samples (Number of Detections)
With MDL assigned to non−detects
4810
010
0010
000
1e+
051e
+06
1e+
071e
+08
Residential PRG (2300)
Background UTL (25000)
Industrial PRG (10000)

●
●
●
●●●●●
●●●●●
●●●
●●
●●
●
●●
●
●●
●●
●●
●
●●
●
●●
●●
●
●
●●
●●
●
●
●
●
●
●
●●
●
●
●
●
●
●
●
●●
●
●●
●●
●
●
●
●
●
●●
●●
●●●
●
●●
●
●
●
●
●
●
●
●
●●●
●
●
●
●
● ●
●
●
●●
●●
●
●
●
BKG
119 (18) All Depths
Off
16 (3)
Adm
11 (0)
BC
26 (11)
CDA 41 (6)
FPP
218 (39)
LiqT
41 (7)
MS
39 (7)
PD−RCF
28 (8)
PD−A 22 (5)
RCRA
102 (34)
WCSA 36 (9)
Road 60 (4)
ROS
63 (12)
Lead
(m
g/kg
)Figure B5−11
Log Scale Box Plots of Lead (0 to 10 Feet)
Casmalia Resources Superfund Site Remedial Investigation
Study Area or Pond With Number of Samples (Number of Detections)
With MDL assigned to non−detects
0.02
10.
11
1010
010
00
Ecological Soil SL (11)
Updated Eco Soil SL (120)Residential PRG − CA (150)
Residential PRG (400)
Industrial PRG (800)
Background UTL (12)

●
●
●
●●
●
●●●
●
●
●
●●●
●●●
●
●
●
●●●●
●●
●
●●●
●
●
●
●
●
●
●
●●
●
●●
●
●
●
●
●
BKG
25 (25) All Depths
Off
16 (16)
Adm
11 (11)
BC
26 (26)
CDA
41 (41)
FPP
218 (218)
LiqT
41 (41)
MS
39 (39)
PD−RCF 18 (18)
PD−A 12 (12)
RCRA
102 (102)
WCSA 36 (36)
Road
60 (60)
ROS
63 (63)
Mag
nesi
um (
mg/
kg)Figure B5−12
Log Scale Box Plots of Magnesium (0 to 10 Feet)
Casmalia Resources Superfund Site Remedial Investigation
Study Area or Pond With Number of Samples (Number of Detections)
With MDL assigned to non−detects
1000
3200
1000
032
000
1e+
05
Background UTL (5500)

●
●
●
●●
●
●
●
●
●
●
●
●
●
●
●
●
●
●
●
●
●
BKG
25 (25) All Depths
Off
16 (16)
Adm
11 (11)
BC
26 (26)
CDA
39 (39)
FPP
218 (218)
LiqT
41 (41)
MS
39 (39)
PD−RCF 18 (18)
PD−A 12 (12)
RCRA
102 (102)
WCSA 36 (36)
Road
60 (60)
ROS
63 (63)
Man
gane
se (
mg/
kg)Figure B5−13
Log Scale Box Plots of Manganese (0 to 10 Feet)
Casmalia Resources Superfund Site Remedial Investigation
Study Area or Pond With Number of Samples (Number of Detections)
With MDL assigned to non−detects
2032
100
320
1000
3200
1000
032
000
Updated Eco Soil SL (220)
Background UTL (330)
Ecological Soil SL (500)
Residential PRG (1800)
Industrial PRG (19460)

●●●●●●●●●●
●
●
●●●
●
●●●
●
●●
●●●●
●
●
●
●
●
●●●
●●
●●
●
●●●●●●
●
●
●
●
●
●
●●●
●
●●●●
●
●●
●
●●
● ●
●
●●●
●●●
●
●
●●
●
●●●●
●
●
●●
●
●●●
●
●
BKG
97 (13) All Depths
Off
16 (1)
Adm
11 (3)
BC
26 (9)
CDA
39 (12)
FPP
212 (49)
LiqT
41 (13)
MS
39 (9)
PD−RCF
28 (7)
PD−A 21 (3)
RCRA 90 (35)
WCSA 35 (11)
Road
59 (24)
ROS
61 (22)
Mer
cury
(m
g/kg
)Figure B5−14
Log Scale Box Plots of Mercury (0 to 10 Feet)
Casmalia Resources Superfund Site Remedial Investigation
Study Area or Pond With Number of Samples (Number of Detections)
With MDL assigned to non−detects
0.00
014
0.00
10.
010.
11
1010
0
Background UTL (0.026)
Ecological Soil SL (0.1)
Residential PRG (23)

●●●●●●●●●●●●●●●
●
●
●
●●
●
●●
●
●
●
●
●●
●
●
●
●
●
●●●
●
●
●●●
●
●●
●
●●
●
●
●
BKG
97 (42) All Depths
Off
16 (10)
Adm
11 (6)
BC
26 (20)
CDA
41 (28)
FPP
218 (134)
LiqT
41 (29)
MS
39 (15)
PD−RCF
18 (8)
PD−A 12 (8)
RCRA
102 (47)
WCSA 36 (18)
Road
60 (31)
ROS
63 (37)
Mol
ybde
num
(m
g/kg
)Figure B5−15
Log Scale Box Plots of Molybdenum (0 to 10 Feet)
Casmalia Resources Superfund Site Remedial Investigation
Study Area or Pond With Number of Samples (Number of Detections)
With MDL assigned to non−detects
0.05
0.1
0.32
13.
210
32
Ecological Soil SL (2)
Background UTL (10)
... Residential PRG (390)

●
●
●
●
●●
●
●
●
●
●
●●
●
●●●
●
●
●
●
●
●●
●
●●
●
●
●
●
●
●
●
●
●
●
●●
●
●
●●
●
●
●
●
●
BKG
97 (97) All Depths
Off
16 (16)
Adm
11 (11)
BC
26 (26)
CDA
41 (41)
FPP
218 (218)
LiqT
41 (41)
MS
39 (39)
PD−RCF 28 (28)
PD−A 22 (22)
RCRA
102 (102)
WCSA 36 (36)
Road
60 (60)
ROS
63 (63)
Nic
kel (
mg/
kg)
Figure B5−16Log Scale Box Plots of Nickel (0 to 10 Feet)
Casmalia Resources Superfund Site Remedial Investigation
Study Area or Pond With Number of Samples (Number of Detections)
With MDL assigned to non−detects
5.4
1032
100
320
1000
3200
Ecological Soil SL (30)
Updated Eco Soil SL (38)
Background UTL (49)
Residential PRG (1600)
... Industrial PRG (20439)

●
●
●●●●●
●
●
●●
●●●
●
●●
●
●●
●
●●
●
●●
●●
●●●
●
●
●
●●
●
●
●
●
●
●
●
●●
●
●
●●
●
●
●●
●
●●
●
●●
●
●
●
●
●
●
●●●
●
●
● ●●●●
●
●
●●
●
●●
●●
●●
●●
●
●
●
●
●●●●
●
●●●
●
●
●
●
●●
BKG
97 (17) All Depths
Off
16 (2)
Adm
11 (1)
BC
26 (11)
CDA 39 (7)
FPP
218 (45)
LiqT
41 (8)
MS
39 (0)
PD−RCF
18 (2)
PD−A 12 (4)
RCRA
102 (52)
WCSA 36 (14)
Road 60 (8)
ROS
63 (17)
Sel
eniu
m (
mg/
kg)
Figure B5−17Log Scale Box Plots of Selenium (0 to 10 Feet)
Casmalia Resources Superfund Site Remedial Investigation
Study Area or Pond With Number of Samples (Number of Detections)
With MDL assigned to non−detects
0.00
820.
032
0.1
0.32
13.
210
32
Ecological Soil SL (1)
Background UTL (3.3)
... Residential PRG (390)
... Industrial PRG (5100)

●
●●
●
●●
●
●●●●
●●
●
●●
●
●●
●●
●●
●●
●
●●●
●
●●
●● ●
● ●
●●●
●
● ●●
●
●
●
●
●
BKG
97 (22) All Depths
Off
16 (6)
Adm
11 (6)
BC
26 (15)
CDA
41 (32)
FPP
218 (199)
LiqT
41 (34)
MS
39 (33)
PD−RCF 18 (12)
PD−A 12 (10)
RCRA
102 (87)
WCSA 36 (31)
Road
60 (51)
ROS
63 (53)
Tha
llium
(m
g/kg
)Figure B5−18
Log Scale Box Plots of Thallium (0 to 10 Feet)
Casmalia Resources Superfund Site Remedial Investigation
Study Area or Pond With Number of Samples (Number of Detections)
With MDL assigned to non−detects
0.00
055
0.01
0.1
110
Background UTL (0.64)
Ecological Soil SL (1)
Residential PRG (5.2)
... Industrial PRG (67)

●
●
●
●●●
●● ●●●
●●●●●●●●●
●
●
●
●
●
●●●
●
●●
●●
●●●
BKG
25 (10) All Depths
Off
16 (11)
Adm
11 (10)
BC
26 (17)
CDA
41 (33)
FPP
218 (184)
LiqT
41 (35)
MS
39 (33)
PD−RCF 18 (10)
PD−A 12 (10)
RCRA
102 (86)
WCSA 36 (31)
Road
60 (42)
ROS
63 (47)
Tin
(m
g/kg
)Figure B5−19
Log Scale Box Plots of Tin (0 to 10 Feet)
Casmalia Resources Superfund Site Remedial Investigation
Study Area or Pond With Number of Samples (Number of Detections)
With MDL assigned to non−detects
1.4
3.2
1032
100
320
Ecological Soil SL (50)
Background UTL (65)
... Residential PRG (47000)
... Industrial PRG (100000)

●
●
●
●
●
●●
●
●●
●
●
●
●
●
●
●
●
●
●
●●
●●
●●
BKG
97 (97) All Depths
Off
16 (16)
Adm
11 (11)
BC
26 (26)
CDA
41 (40)
FPP
218 (218)
LiqT
41 (41)
MS
39 (38)
PD−RCF 18 (18)
PD−A 12 (12)
RCRA
102 (102)
WCSA 36 (36)
Road
60 (60)
ROS
63 (63)
Van
adiu
m (
mg/
kg)
Figure B5−20Log Scale Box Plots of Vanadium (0 to 10 Feet)
Casmalia Resources Superfund Site Remedial Investigation
Study Area or Pond With Number of Samples (Number of Detections)
With MDL assigned to non−detects
1.2
3.2
1032
100
320
1000
Ecological Soil SL (2)
Residential PRG (78) Background UTL (81)
... Industrial PRG (1022)

●
●
●
●
●
●
●
●
●
●
●●
●
●
●●
●
●
●
●
●
●
●
●
●
●
●
●
●
●
●
●
●
●
●
●
●
●
●
●●
●
●
●
●
●
●
●
●
●
●
BKG
97 (97) All Depths
Off
16 (16)
Adm
11 (11)
BC
26 (26)
CDA
41 (40)
FPP
218 (218)
LiqT
41 (41)
MS
39 (39)
PD−RCF 28 (28)
PD−A 22 (22)
RCRA
102 (102)
WCSA 36 (36)
Road
60 (60)
ROS
63 (63)
Zin
c (m
g/kg
)Figure B5−21
Log Scale Box Plots of Zinc (0 to 10 Feet)
Casmalia Resources Superfund Site Remedial Investigation
Study Area or Pond With Number of Samples (Number of Detections)
With MDL assigned to non−detects
1032
100
320
1000
Ecological Soil SL (50)
Background UTL (104)
... Residential PRG (23000)
... Industrial PRG (100000)