Appendix A: TRENDS AND FORCES - Wood County, Ohio
56
WOOD COUNTY |FUTURE LAND USE PLAN| Appendix A: TRENDS AND FORCES An assessment of existing conditions and forecasted trends
Transcript of Appendix A: TRENDS AND FORCES - Wood County, Ohio

WOOD COUNTY |FUTURE LAND USE PLAN|
Appendix A: TRENDS AND FORCES An assessment of exist ing condit ions and forecasted trends

DRAFT DATE 10/24/16

WOOD COUNTY |FUTURE LAND USE PLAN|
TABLE OF CONTENTS Key Findings ............................................................................................ 1
Population ............................................................................................... 3 Historic and Current Population ............................................................................................................... 3 Population Forecasts ................................................................................................................................. 9 Household Trends ................................................................................................................................... 12
Employment .......................................................................................... 14 Employment Forecasts ............................................................................................................................ 16
Housing ................................................................................................. 18 Existing Inventory of Housing Units ........................................................................................................ 18 Housing Density ...................................................................................................................................... 19 Occupancy and Tenure ........................................................................................................................... 22 Median Value and Housing Affordability ................................................................................................ 27
Land Use Analysis .................................................................................. 31 Existing Land Use .................................................................................................................................... 33 Vacant/Underutilized Land ..................................................................................................................... 37
Vacant Parcels ..................................................................................................................................... 37 Parks and Recreational Open Spaces .................................................................................................. 38 Prime Agricultural Soils and Farms ..................................................................................................... 40 Water and Sanitary/Sewer Service ..................................................................................................... 46
Residential/Non-Residential Land Demand ............................................ 48

DRAFT DATE 10/24/16
INDEX OF FIGURES Figure 1: Comparative Population Trends for Wood County and adjacent counties .................................... 3 Figure 2: Comparative Population Trends for Wood County and adjacent counties .................................... 4 Figure 3: Comparative Population Trends for Places in Wood County ......................................................... 5 Figure 4: Population Density (Block Level) for Wood County ........................................................................ 7 Figure 5: Population Change (Block Group Level) for Wood County ............................................................. 8 Figure 6: Comparative Population Forecast for Wood County and Adjoining Counties ............................... 9 Figure 7: Comparative Population Forecast for Wood County and Adjoining Counties ............................. 10 Figure 8: Comparative Population Forecasts for Wood County .................................................................. 11 Figure 9: Comparative Household Trends for Wood County and adjacent counties .................................. 12 Figure 10: Household Size for Wood County ............................................................................................... 12 Figure 11: Comparative Employment Trends for Wood County and adjacent counties ............................. 15 Figure 12: Inflow/Outflow Trends for Wood County and adjacent counties .............................................. 15 Figure 13: Comparative Employment Forecasts for Wood County and Adjoining Counties ....................... 16 Figure 14: Top 5 Employment Sectors for Wood County ............................................................................ 17 Figure 15: Comparative Housing Trends for Wood County and adjacent counties .................................... 18 Figure 16: Housing Unit number of Bedrooms for Wood County ............................................................... 19 Figure 17: Housing Density (Block Level) for Wood County ........................................................................ 20 Figure 18: Housing Change (Block Group Level) for Wood County ............................................................. 21 Figure 19: Housing Occupancy and Tenure Trends for Wood County ......................................................... 22 Figure 20: Vacancy Rate (Block Group Level) for Wood County ................................................................. 23 Figure 21: Change in Vacancy Rates (Block Group Level) for Wood County ............................................... 24 Figure 22: Renter-occupied Units (Block Group Level) for Wood County .................................................... 25 Figure 23: Change in Renter-occupied Units (Block Group Level) for Wood County ................................... 26 Figure 24: Housing Affordability (Monthly Housing Costs as a percentage of Household Income) for Wood County ............. 28 Figure 25: Median Home Value (Block Group Level) for Wood County ...................................................... 29 Figure 26: Median Household Income (Block Group Level) for Wood County ............................................ 30 Figure 27: Jurisdictional Land Distribution for Wood County ..................................................................... 31 Figure 28: Cities, Villages and Townships in Wood County ......................................................................... 32 Figure 29: Existing Land Use Distribution for Wood County ....................................................................... 33 Figure 30: Existing Land Use in Wood County ............................................................................................. 34 Figure 31: Existing Land Use Audit Wood County ....................................................................................... 35 Figure 32: Existing Land Use Audit Wood County ....................................................................................... 36 Figure 33: Vacant Land Use Audit Summary Wood County ........................................................................ 37 Figure 34: Parks and Recreation Open Acreage per Capita for Wood County ............................................ 38 Figure 35: Parks and Open Spaces in Wood County ................................................................................... 39 Figure 36: Agricultural Acreage per Capita for Wood County .................................................................... 40 Figure 37: Agricultural Land Use Audit Wood County ................................................................................ 41 Figure 38: Agricultural Land Use Audit Wood County ................................................................................ 41

WOOD COUNTY |FUTURE LAND USE PLAN|
Figure 39: Agricultural Land Value in Wood County ................................................................................... 42 Figure 40: Current Agricultural Use Value in Wood County ........................................................................ 43 Figure 41: Contributing Factors to Agricultural Use in Wood County ......................................................... 44 Figure 42: Agricultural Use in Wood County ............................................................................................... 45 Figure 43: Water and Sanitary Sewer Mains in Wood County .................................................................... 47 Figure 44: Existing(2014) Population Distribution and Residential/Non-Residential Land Allocation for Wood County ......... 48 Figure 45: Trend (2050) Population Distribution and Residential/Non-Residential Land Demand for Wood County .............. 49

DRAFT DATE 10/24/16

WOOD COUNTY |FUTURE LAND USE PLAN|
APPENDIX A: KEY FINDINGS | 1 |
KEY FINDINGS Wood County is a predominantly agricultural county located south of Toledo and Lucas County. Its location along the I-75 corridor puts Wood County in a unique situation that suggests a need to balance its agricultural base with growing residential and commercial pressures. The key findings from an assessment of the existing conditions and forecasted trends in Wood County and the surrounding region are highlighted below.
• Population growth trends for the Toledo MSA are generally flat, with the 2015 regional population of 606,000 just about 2,000 people less than the 1970 population of 608,000. As Lucas County loses population, Wood County gains it, shifting a greater share of regional population towards Wood County in the future. • While Lucas County is experiencing a current decline in population (a loss of 48,000 people since its peak in 1975) and a long term decline in employment, forecasts for Wood County anticipate steady population and employment growth through 2050. This presents a significant opportunity for Wood County. • Significant recent growth is visible in Perrysburg and the adjacent townships (Middleton, Perrysburg) along the I-75 corridor. As residential growth is anticipated to continue over the planning horizon (demand for as many as 11,000 new households), it will be critical to have a clear vision for the townships experiencing the greatest demand. Considerations about redevelopment and inter-jurisdictional development agreements may be needed to clearly implement the vision presented in the future land use plan. • While the urban/suburban parts of Wood County are experiencing expanding greenfield growth pressures, shifts in the rural and village populations are generally on a decline.
Factors such as land consolidation into corporate operations, average age of farmers and declining housing conditions in some of the villages have contributed to this decline. • Some villages in Wood County are reporting significant recent changes in population and households, both positive and negative. This could be indicative of a shift in rural population from farmsteads, but is also likely supported by recent investment in water and sanitary sewer infrastructure to remedy failing septic systems in the areas near the villages. It is important to recognize this trend and provide a land use framework that supports this shift. • Increasing land value for agricultural parcels, especially in transitional areas of the Wood County adjacent to Bowling Green, Perrysburg, and North Baltimore, could result in a shift of land use from agricultural to residential or commercial. Recognizing the critical agricultural zones in Wood County and encouraging continued agricultural uses will be important to maintaining the agrarian way of life in the county. • The CSX inland port in Henry Township is a potential catalyst for shipping and distribution operations in the southern portions of the county. Further examination of utility and service capacities and interchange design with I-75 in the North Baltimore/Cygnet area will be necessary to capitalize on this potential.

|FUTURE LAND USE PLAN| WOOD COUNTY
| 2 | APPENDIX A: KEY FINDINGS
• Four private gas transmission pipelines have been proposed to transect portions of Wood County. These projects are in various stages of proposal and all have different routes or easements. Wood County has taken a position to establish an energy corridor to prevent multiple pipelines from crisscrossing the county in a random network. Further examination of preferred corridors will need to be considered in land use plan. • The county’s surface water is managed by a complex system of ditches and natural waterways. Assessment of developments impact on this system is necessary. • Federally mandated sewer service areas and failing wells and septic systems as well as
increased suburban growth pressures have resulted in expansion of sanitary sewer and potable water services to various areas of the county creating capacity for growth where there were once limitations. • Agricultural runoff and other non-point source pollution contribute to the algae bloom in Lake Erie and other sediment levels in our region’s water ways. In addition to agricultural preservation of prime farmlands, and development impact assessment on the county’s drainage/stormwater systems, it will also be important to establish management practices for the riparian corridors and floodways in the county.

WOOD COUNTY |FUTURE LAND USE PLAN|
APPENDIX A: POPULATION | 3 |
POPULATION
Historic and Current Population Historically Wood County and surrounding counties, as a region, have recorded overall growth in population with intermittent periods of growth and decline. Despite the regional ups and downs, Wood County has maintained a gradual but steady population increase. The region includes Lucas County to the north which has recorded a steady decline in population since 1975. On the other hand, Hancock County to the south has recorded a small but positive population growth.
COUNTY TOTAL POPULATION
1970 1975 1980 1985 1990 1995 2000 2005 2010
Wood 125,942 130,332 133,523 136,719 139,776 142,378 144,418 146,003 147,298
Lucas 441,589 435,625 435,279 434,701 433,459 430,636 426,027 420,079 413,348
Hancock 74,675 76,278 77,834 79,379 80,832 82,009 82,852 83,428 83,833
Sandusky 60,909 60,200 60,675 61,121 61,476 61,607 61,477 61,145 60,688
Seneca 56,621 55,904 56,082 56,231 56,293 56,149 55,770 55,210 54,542
Ottawa 41,399 41,227 41,561 41,876 42,129 42,228 42,148 41,930 41,626
Putnam 34,446 34,109 34,283 34,436 34,534 34,501 34,320 34,024 33,656
Henry 28,102 28,139 28,361 28,568 28,733 28,793 28,732 28,576 28,362
Total 863,683 861,814 867,598 873,031 877,232 878,301 875,744 870,395 863,353
Figure 1: Comparat ive Populat ion Trends for Wood County and adjacent counties (Source: Census 2010 and American Community Survey 2014)
0
200,000
400,000
600,000
800,000
1,000,000
19
70
19
75
19
80
19
85
19
90
19
95
20
00
20
05
20
10
Henry
Putnam
Ottawa
Seneca
Sandusky
Hancock
Lucas
Wood

|FUTURE LAND USE PLAN| WOOD COUNTY
| 4 | APPENDIX A: POPULATION
Since the 2010 census, Wood County has grown about 3.3% in population, which is significantly higher than the State of Ohio and surrounding counties. Lucas County, including the City of Toledo, shrank 1.5% in population between 2010 and 2014. According to migration trends published by the Ohio Development Services Agency in 2014, a significant portion of the regional in-migration to Wood County is from Lucas County.
In terms of population density, Lucas County is the most densely populated in the region with 1,296 persons per square mile. Wood County is sparsely populated in comparison to Lucas County and the State of Ohio.
Ohio Wood County
Lucas County
Henry County
Putnam County
Hancock County
Seneca County
Sandusky County
Ottawa County
Population estimates, 2014
11,594,163 129,590 435,286 27,937 34,171 75,337 55,669 60,179 41,154
Population, Census, 2010
11,536,504 125,488 441,815 28,215 34,499 74,782 56,745 60,944 41,428
Population, percent change - 2010 to 2014
0.5 3.3 -1.5 -1.0 -1.0 0.7 -1.9 -1.3 -0.7
Population per square mile, 2010
282.30 203.30 1,296.20 67.80 71.50 140.70 103.00 149.20 162.50
Land area in square miles, 2010
40,860.69 617.21 340.86 416.01 482.52 531.36 551.02 408.45 254.92
Figure 2: Comparat ive Populat ion Trends for Wood County and adjacent counties (Source: Census 2010 and American Community Survey 2014)
According to the 2010 Census, the City of Bowling Green and Perrysburg host almost 40% of the county population. In 2010, the City of Bowling Green had a population of 30,028, which was 23.93% of the county population, and the City of Perrysburg had a population of 20,623, which was 16.43% of the county population in 2010.
Compared to the 2000 Census population, the City of Perrysburg grew 21.71% in population which is significantly higher than the population change in the City of Bowling Green which only grew 1.32%. Perrysburg Township reported a 8.09% decline in population for the same period. This indicates significant growth pressure in the City of Perrysburg and Perrysburg Township.
Haskins village and Middleton Township have both reported significant population increase between 2000 and 2010. On the other hand, Perry and Milton townships reported substantial declines in population between 2000 and 2010. In Milton Township, the decline in population can be attributed to Milton Center and Custar village.

WOOD COUNTY |FUTURE LAND USE PLAN|
APPENDIX A: POPULATION | 5 |
2010 2000 Change % 2010 2000 Change %
Cities Bowling Green 30,028 29,636 392 1.32%
Perrysburg 20,623 16,945 3,678 21.71%
Rossford 6,293 6,406 -113 -1.76%
Northwood 5,265 5,471 -206 -3.77%
Fostoria 1,038 842 196 23.28%
Cities Total 63,247 59,300 3,947 6.66%
Townships Villages Perrysburg 12,512 13,613 -1,101 -8.09%
Lake 10,972 10,350 622 6.01% Walbridge 3,019 2,546 473 18.58%
Millbury 1,200 1,161 39 3.36%
Middleton 4,454 2,598 1,856 71.44% Haskins 1,188 638 550 86.21%
Montgomery 4,230 4,505 -275 -6.10% Bradner 985 1,171 -186 -15.88%
Wayne 887 842 45 5.34%
Risingsun 606 620 -14 -2.26%
Henry 4,175 4,070 105 2.58% N Baltimore 3,432 3,361 71 2.11%
Troy 3,870 4,355 -485 -11.14% Luckey 1,012 998 14 1.40%
Freedom 2,727 2,695 32 1.19% Pemberville 1,371 1,365 6 0.44%
Bloom 2,609 2,535 74 2.92% Bloomdale 678 724 -46 -6.35%
Cygnet 597 564 33 5.85%
Bairdstown 130 130
Weston 2,336 2,274 62 2.73% Weston 1,590 1,659 -69 -4.16%
Washington 1,841 1,688 153 9.06% Tontogany 367 364 3 0.82%
Liberty 1,766 1,862 -96 -5.16% Portage 438 428 10 2.34%
Plain 1,663 1,706 -43 -2.52%
Portage 1,614 1,516 98 6.46% Jerry City 427 453 -26 -5.74%
Grand Rapids 1,607 1,631 -24 -1.47% Grand Rapids 965 1,002 -37 -3.69%
Perry 1,605 1,934 -329 -17.01% West Millgrove 174 78 96 123.08%
Webster 1,283 1,277 6 0.47%
Center 1,206 1,246 -40 -3.21%
Milton 979 1,159 -180 -15.53% Custar 179 208 -29 -13.94%
Milton Center 144 195 -51 -26.15%
Jackson 792 751 41 5.46% Hoytville 303 296 7 2.36%
Twnships Total 62,241 61,765 476 0.77% Villages Total 19,692 18,803 889 4.73%
County Total 125,488 121,065 4,423 3.65% Notes: Vil lage population is a lso reported as part of township population. West Mil lgrove vil lage population has an error in report ing for 2000.
Figure 3: Comparative Populat ion Trends for Places in Wood County (Source: Census 2010 and Census 2000)

|FUTURE LAND USE PLAN| WOOD COUNTY
| 6 | APPENDIX A: POPULATION
According to 2010 Census data, the highest population densities in Wood County were in the cities and villages with Perrysburg and Bowling Green reporting over 1,000 persons per square mile in the core. The townships are mostly agricultural and reported about 10 to 100 persons per square mile. In additions to the townships, the city of Northwood reported low population densities in its industrial pockets.
Between 2010 and 2014, several townships reported declining populations with the exception of block groups in townships located in proximity to the cities, especially Perrysburg and Bowling Green, and townships along the I-75 corridor.

WOOD COUNTY |FUTURE LAND USE PLAN|
APPENDIX A: POPULATION | 7 |
Figure 4: Population Density (Block Level) for Wood County (Source: Census 2010)

|FUTURE LAND USE PLAN| WOOD COUNTY
| 8 | APPENDIX A: POPULATION
Figure 5: Populat ion Change (Block Group Level) for Wood County (Source: Census 2010 and Amer ican Community Survey 2014)

WOOD COUNTY |FUTURE LAND USE PLAN|
APPENDIX A: POPULATION | 9 |
Population Forecasts Both Woods and Poole Economics Inc. and Ohio Development Services Agency have prepared population forecasts for Wood County.
The Ohio Development Services Agency forecast (to 2040) anticipates gradually declining population growth for the region, especially Lucas County, and a moderate population growth for Wood County.
2010 2015 2020 2025 2030 2035 2040
Lucas 441,815 435,300 430,450 425,620 420,080 414,630 410,570
Wood 125,488 125,220 126,540 127,530 127,600 126,400 124,910
Hancock 74,782 75,130 75,330 75,620 75,140 74,670 73,500
Sandusky 60,944 59,960 58,670 57,040 55,440 53,910 52,640
Seneca 56,745 56,030 55,050 54,030 53,040 52,190 51,560
Ottawa 41,428 40,860 40,100 39,420 38,720 37,780 36,880
Putnam 34,499 34,550 34,430 34,180 33,860 33,700 33,860
Henry 28,215 27,690 27,230 26,760 26,360 26,010 25,810
Figure 6: Comparat ive Populat ion Forecast for Wood County and Adjoining Counties (Source: ODSA 2012)
0
100,000
200,000
300,000
400,000
500,000
600,000
700,000
800,000
900,000
1,000,000
2010
2015
2020
2025
2030
2035
2040
Henry
Putnam
Ottawa
Seneca
Sandusky
Hancock
Wood
Lucas

|FUTURE LAND USE PLAN| WOOD COUNTY
| 10 | APPENDIX A: POPULATION
The Woods and Poole forecast to 2050 anticipates an initial increase in regional population followed by a gradual decline back to about 2010 population levels. While this forecast anticipates a sharper decline in population for Lucas County, it holds the population growth rate for Wood County fairly steady.
2010 2015 2020 2025 2030 2035 2040 2045 2050
Lucas 441,589 435,625 435,279 434,701 433,459 430,636 426,027 420,079 413,348
Wood 125,942 130,332 133,523 136,719 139,776 142,378 144,418 146,003 147,298
Hancock 74,675 76,278 77,834 79,379 80,832 82,009 82,852 83,428 83,833
Sandusky 60,909 60,200 60,675 61,121 61,476 61,607 61,477 61,145 60,688
Seneca 56,621 55,904 56,082 56,231 56,293 56,149 55,770 55,210 54,542
Ottawa 41,399 41,227 41,561 41,876 42,129 42,228 42,148 41,930 41,626
Putnam 34,446 34,109 34,283 34,436 34,534 34,501 34,320 34,024 33,656
Henry 28,102 28,139 28,361 28,568 28,733 28,793 28,732 28,576 28,362
Figure 7: Comparat ive Populat ion Forecast for Wood County and Adjoining Counties (Source: Woods & Poole Economics 2015)
0
100,000
200,000
300,000
400,000
500,000
600,000
700,000
800,000
900,000
1,000,000
2010
2015
2020
2025
2030
2035
2040
2045
2050
Henry
Putnam
Ottawa
Seneca
Sandusky
Hancock
Wood
Lucas

WOOD COUNTY |FUTURE LAND USE PLAN|
APPENDIX A: POPULATION | 11 |
Based on the ODSA and Woods & Poole forecast, McBride Dale Clarion prepared adjusted forecasts that established several population growth scenarios for Wood County. Given that the ODSA forecasts for 2015 do not keep pace with population trends in the last 5 years, this forecast will not be used in this assessment.
Using the Woods & Poole population forecast as the high scenario, the MDC scenarios explored a steady .25% population growth from 2015 through 2050, addition of 1,000 persons every 5 years through 2050, addition of 500 persons every 5 years through 2050, and a combination of adding 1,000 persons every 5 years through 2030 followed by losing 500 persons every five years through 2050.
Forecasts 2010 2015 2020 2025 2030 2035 2040 2045 2050 Woods and Poole
125,488 130,332 133,523 136,719 139,776 142,378 144,418 146,003 147,298
MDC (.25% growth)
125,488 130,332 131,969 133,627 135,306 137,006 138,727 140,470 142,234
MDC (1000 pop every 5 years)
125,488 130,332 131,332 132,332 133,332 133,832 134,332 134,832 135,332
MDC (500 pop every 5 years)
125,488 130,332 130,832 131,332 131,832 132,082 132,332 132,582 132,832
MDC (1000 pop /-500 pop)
125,488 130,332 131,332 132,332 133,332 132,832 132,332 131,832 131,332
ODSA 0 0 126,540 127,530 127,600 126,400 124,910 123,420 122,220
Figure 8: Comparat ive Populat ion Forecasts for Wood County (Source: Woods & Poole Economics 2015, Ohio Development Services Agency 2012, and MDC 2016)
120,000
130,000
140,000
150,000
2000
2005
2010
2015
2020
2025
2030
2035
2040
2045
2050
Woods and Poole ODSA
MDC (.25% growth) MDC (1000 pop every 5 years)
MDC (500 pop every 5 years) MDC (1000 pop /-500 pop)
|FUTURE LAND USE PLAN| WOOD COUNTY
| 12 | APPENDIX A: POPULATION
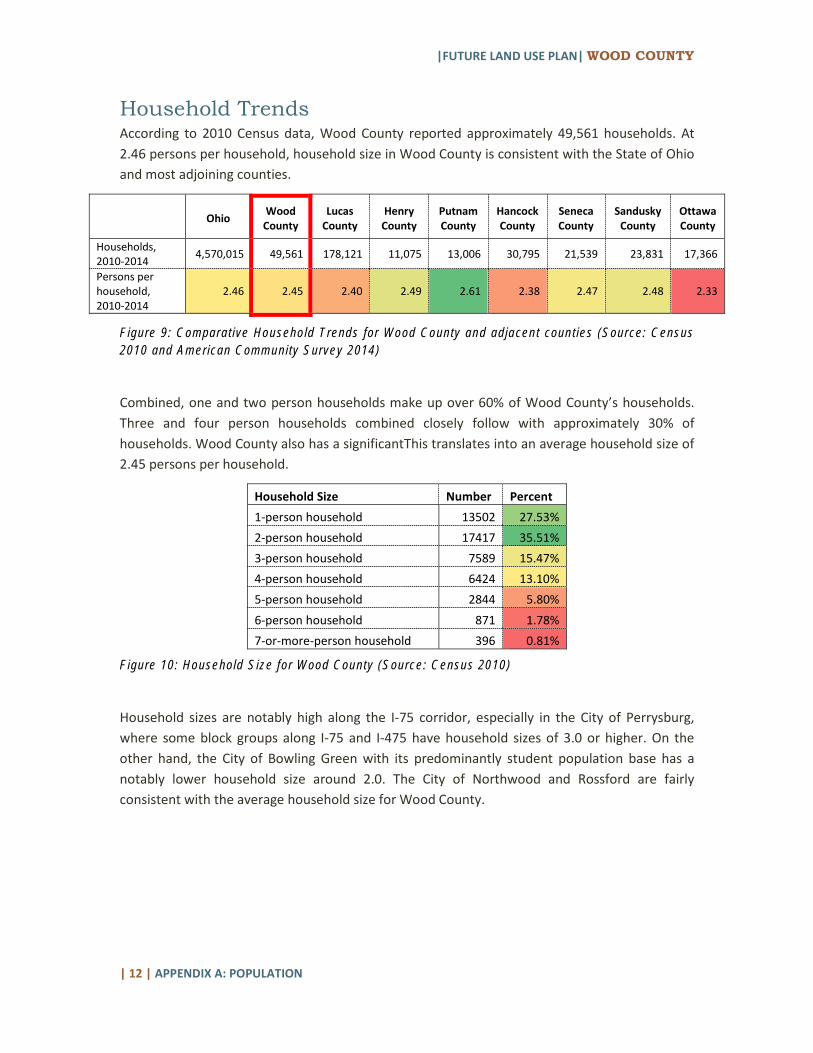
Household Trends According to 2010 Census data, Wood County reported approximately 49,561 households. At 2.46 persons per household, household size in Wood County is consistent with the State of Ohio and most adjoining counties.
Ohio Wood
County Lucas
County Henry
County Putnam County
Hancock County
Seneca County
Sandusky County
Ottawa County
Households, 2010-2014 4,570,015 49,561 178,121 11,075 13,006 30,795 21,539 23,831 17,366
Persons per household, 2010-2014
2.46 2.45 2.40 2.49 2.61 2.38 2.47 2.48 2.33
Figure 9: Comparative Household Trends for Wood County and adjacent counties (Source: Census 2010 and American Community Survey 2014)
Combined, one and two person households make up over 60% of Wood County’s households. Three and four person households combined closely follow with approximately 30% of households. Wood County also has a significantThis translates into an average household size of 2.45 persons per household.
Household Size Number Percent 1-person household 13502 27.53% 2-person household 17417 35.51% 3-person household 7589 15.47% 4-person household 6424 13.10% 5-person household 2844 5.80% 6-person household 871 1.78% 7-or-more-person household 396 0.81%
Figure 10: Household Size for Wood County (Source: Census 2010)
Household sizes are notably high along the I-75 corridor, especially in the City of Perrysburg, where some block groups along I-75 and I-475 have household sizes of 3.0 or higher. On the other hand, the City of Bowling Green with its predominantly student population base has a notably lower household size around 2.0. The City of Northwood and Rossford are fairly consistent with the average household size for Wood County.

WOOD COUNTY |FUTURE LAND USE PLAN|
APPENDIX A: POPULATION | 13 |
Map 3: Housing Densi ty (Block Group Level) for Wood County (Source: Census 2010)
|FUTURE LAND USE PLAN| WOOD COUNTY
| 14 | APPENDIX A: EMPLOYMENT
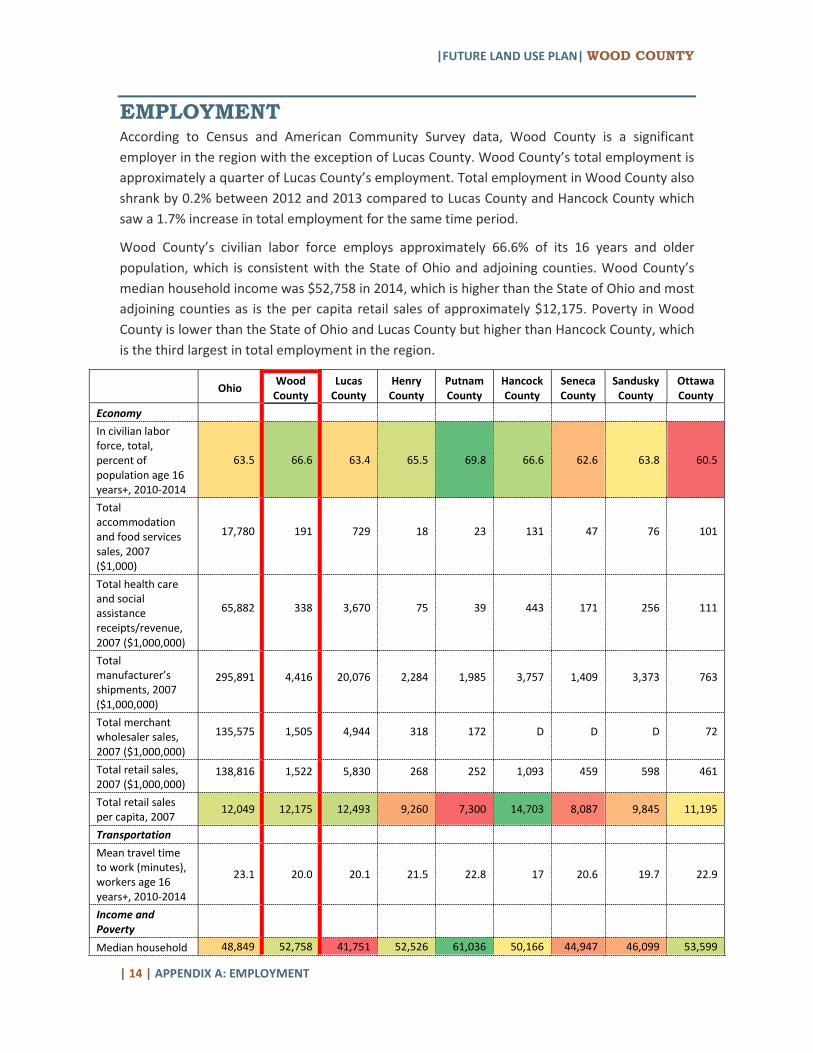
EMPLOYMENT According to Census and American Community Survey data, Wood County is a significant employer in the region with the exception of Lucas County. Wood County’s total employment is approximately a quarter of Lucas County’s employment. Total employment in Wood County also shrank by 0.2% between 2012 and 2013 compared to Lucas County and Hancock County which saw a 1.7% increase in total employment for the same time period.
Wood County’s civilian labor force employs approximately 66.6% of its 16 years and older population, which is consistent with the State of Ohio and adjoining counties. Wood County’s median household income was $52,758 in 2014, which is higher than the State of Ohio and most adjoining counties as is the per capita retail sales of approximately $12,175. Poverty in Wood County is lower than the State of Ohio and Lucas County but higher than Hancock County, which is the third largest in total employment in the region.
Ohio Wood
County Lucas
County Henry
County Putnam County
Hancock County
Seneca County
Sandusky County
Ottawa County
Economy In civilian labor force, total, percent of population age 16 years+, 2010-2014
63.5 66.6 63.4 65.5 69.8 66.6 62.6 63.8 60.5
Total accommodation and food services sales, 2007 ($1,000)
17,780 191 729 18 23 131 47 76 101
Total health care and social assistance receipts/revenue, 2007 ($1,000,000)
65,882 338 3,670 75 39 443 171 256 111
Total manufacturer’s shipments, 2007 ($1,000,000)
295,891 4,416 20,076 2,284 1,985 3,757 1,409 3,373 763
Total merchant wholesaler sales, 2007 ($1,000,000)
135,575 1,505 4,944 318 172 D D D 72
Total retail sales, 2007 ($1,000,000)
138,816 1,522 5,830 268 252 1,093 459 598 461
Total retail sales per capita, 2007
12,049 12,175 12,493 9,260 7,300 14,703 8,087 9,845 11,195
Transportation Mean travel time to work (minutes), workers age 16 years+, 2010-2014
23.1 20.0 20.1 21.5 22.8 17 20.6 19.7 22.9
Income and Poverty
Median household 48,849 52,758 41,751 52,526 61,036 50,166 44,947 46,099 53,599

WOOD COUNTY |FUTURE LAND USE PLAN|
APPENDIX A: EMPLOYMENT | 15 |
Ohio Wood
County Lucas
County Henry
County Putnam County
Hancock County
Seneca County
Sandusky County
Ottawa County
income (in 2014 dollars), 2010-2014 Per capita income in past 12 months (in 2014 dollars), 2010-2014
26,520 27,210 24,683 24,604 26,060 26,612 22,552 23,236 28,703
Persons in poverty, percent
15.8 13.5 20.7 10.2 7.8 12.7 17.5 14.5 10.1
Businesses Total employer establishments, 2013
250,117 2,722 9,599 566 728 1,706 1,140 1,305 1,019
Total employment, 2013
4,587,136 49,483 197,276 8,234 9,470 39,791 16,520 22,149 10,444
Total annual payroll, 2013 ($1,000)
195,631 2,034 7,696 319 324 1,714 521 834 416
Total employment, percent change, 2012-2013
0.9 -0.2 1.7 -0.8 0.6 1.7 -4.6 -0.9 -2.5
Figure 11: Comparat ive Employment Trends for Wood County and adjacent counties (Source: Census 2010 and American Community Survey 2014)
Based on Longitudinal Employment and Housing Dynamics (LEHD) inflow/outflow data, only 36.1% of employed Wood County residents are employment in the county. Approximately one third of employed Wood County residents have employment destinations in Lucas County. Approximately 26.5% of employed Perrysburg city residents and 29.7% of employed Perrysburg township residents work in Toledo, OH. On the other hand, 67.1% of employed Lucas County residents are employed in the county.
Ohio Wood
County Lucas
County Henry
County Putnam County
Hancock County
Seneca County
Sandusky County
Ottawa County
Employed and Living in the selection Area
96.00% 33.50% 60.80% 47.10% 57.90% 46.30% 56.40% 49.20% 51.20%
Living and Employed in the selection Area
95.90% 36.10% 67.10% 38.60% 36.10% 57.60% 39.30% 44.40% 34.40%
Figure 12: Inf low/Outf low Trends for Wood County and adjacent counties (Source: On The Map/Longi tudinal Employment and Housing Dynamics)

|FUTURE LAND USE PLAN| WOOD COUNTY
| 16 | APPENDIX A: EMPLOYMENT
Employment Forecasts Woods and Poole Economics Inc. has prepared employment forecasts for Wood County through 2050. The Woods and Poole forecast to 2050 anticipates a gradual upswing in regional employment with Lucas County, Wood County and Hancock County, as the largest employment centers in that order. All three counties are located along the I-75 corridor.
2010 2015 2020 2025 2030 2035 2040 2045 2050
Lucas 251,023 263,008 272,417 280,295 286,228 290,125 292,443 293,478 293,382
Wood 72,905 80,091 85,575 90,859 95,719 100,159 104,410 108,602 112,754
Hancock 52,003 56,029 59,624 63,106 66,346 69,378 72,337 75,277 78,221
Sandusky 31,786 32,834 34,372 35,740 36,851 37,747 38,515 39,200 39,823
Seneca 24,626 25,146 26,215 27,175 27,954 28,572 29,089 29,543 29,954
Ottawa 19,242 20,235 21,085 21,820 22,410 22,860 23,230 23,546 23,811
Putnam 15,218 16,357 17,329 18,231 18,998 19,651 20,230 20,761 21,244
Henry 14,763 15,469 15,826 16,092 16,235 16,277 16,251 16,180 16,070
Figure 13: Comparative Employment Forecasts for Wood County and Adjoin ing Counties (Source: Woods & Poole Economics 2015)
0
100,000
200,000
300,000
400,000
500,000
600,000
700,000
2010
2015
2020
2025
2030
2035
2040
2045
2050
Putnam
Ottawa
Seneca
Sandusky
Hancock
Wood
Lucas
WOOD COUNTY |FUTURE LAND USE PLAN|
APPENDIX A: EMPLOYMENT | 17 |
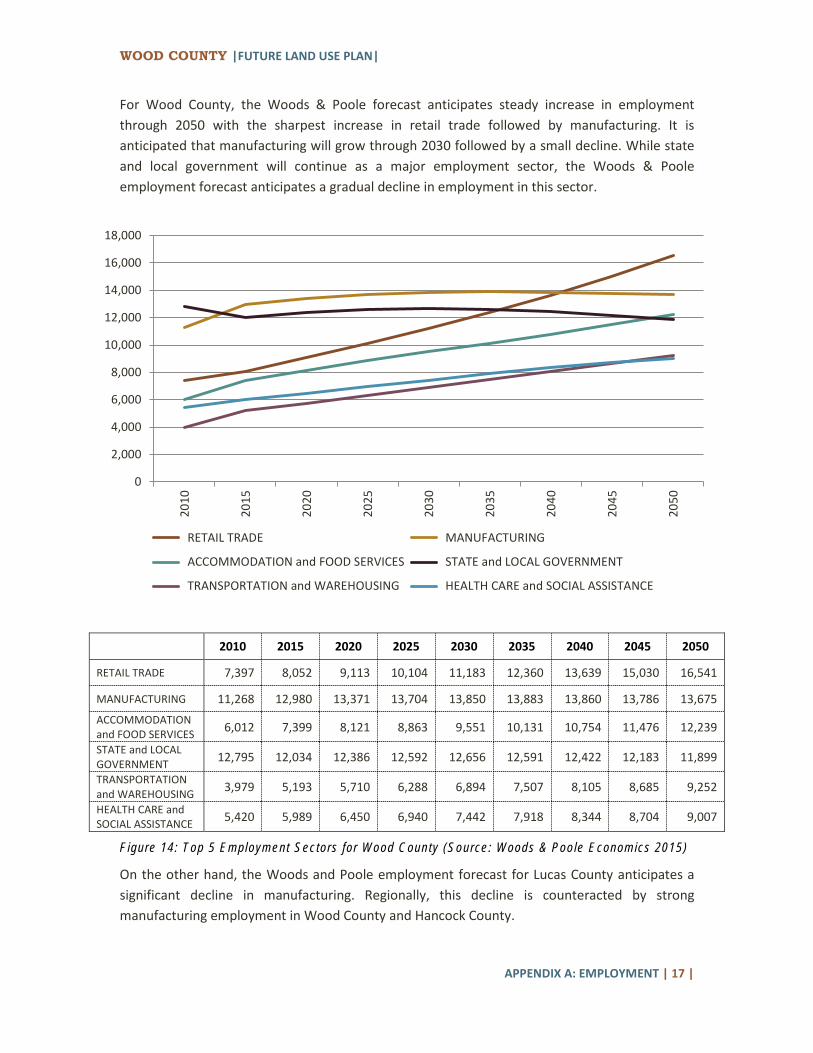
For Wood County, the Woods & Poole forecast anticipates steady increase in employment through 2050 with the sharpest increase in retail trade followed by manufacturing. It is anticipated that manufacturing will grow through 2030 followed by a small decline. While state and local government will continue as a major employment sector, the Woods & Poole employment forecast anticipates a gradual decline in employment in this sector.
2010 2015 2020 2025 2030 2035 2040 2045 2050
RETAIL TRADE 7,397 8,052 9,113 10,104 11,183 12,360 13,639 15,030 16,541
MANUFACTURING 11,268 12,980 13,371 13,704 13,850 13,883 13,860 13,786 13,675 ACCOMMODATION and FOOD SERVICES 6,012 7,399 8,121 8,863 9,551 10,131 10,754 11,476 12,239
STATE and LOCAL GOVERNMENT 12,795 12,034 12,386 12,592 12,656 12,591 12,422 12,183 11,899
TRANSPORTATION and WAREHOUSING 3,979 5,193 5,710 6,288 6,894 7,507 8,105 8,685 9,252
HEALTH CARE and SOCIAL ASSISTANCE 5,420 5,989 6,450 6,940 7,442 7,918 8,344 8,704 9,007
Figure 14: Top 5 Employment Sectors for Wood County (Source: Woods & Poole Economics 2015)
On the other hand, the Woods and Poole employment forecast for Lucas County anticipates a significant decline in manufacturing. Regionally, this decline is counteracted by strong manufacturing employment in Wood County and Hancock County.
0
2,000
4,000
6,000
8,000
10,000
12,000
14,000
16,000
18,000
2010
2015
2020
2025
2030
2035
2040
2045
2050
RETAIL TRADE MANUFACTURING
ACCOMMODATION and FOOD SERVICES STATE and LOCAL GOVERNMENT
TRANSPORTATION and WAREHOUSING HEALTH CARE and SOCIAL ASSISTANCE

|FUTURE LAND USE PLAN| WOOD COUNTY
| 18 | APPENDIX A: HOUSING
HOUSING
Existing Inventory of Housing Units According to 2014 American Community Survey data, Wood County has a housing inventory of 53,840 housing units. Overall Wood County has the highest increase in housing inventory compared to the state and adjoining counties. The 2014 American Community Survey data reported a net gain of approximately 476 housing units in Wood County while Lucas County reported a net loss of housing units between 2010 and 2014. Wood County also has the highest median home value and highest median monthly owner/rent costs but has a low occupancy rate for owner-occupied housing units compared to adjoining counties.
Ohio Wood County
Lucas County
Henry County
Putnam County
Hancock County
Seneca County
Sandusky County
Ottawa County
Housing
Housing units, 2014 5,146,933 53,840 202,107 11,917 13,782 33,273 23,932 26,222 28,014
Housing units, 2010 5,127,508 53,376 202,630 11,963 13,731 33,174 24,122 26,390 27,909
Housing, percent change - 2010 to 2014
0.38 0.87 -0.26 -0.38 0.37 0.30 -0.79 -0.64 0.38
Owner-occupied housing unit rate, 2010-2014
66.9 67.2 61.6 79.6 82.9 70.7 71.8 74.3 79.9
Median value of owner-occupied housing units, 2010-2014
129,600 145,700 106,300 110,600 134,300 124,500 97,200 109,400 135,800
Median selected monthly owner costs -with a mortgage, 2010-2014
1,274 1,356 1,206 1,140 1,115 1,196 1,002 1,109 1,228
Median selected monthly owner costs -without a mortgage, 2010-2014
442 462 435 428 414 423 375 389 417
Median gross rent, 2010-2014
729 726 664 682 692 664 635 623 703
Figure 15: Comparative Housing Trends for Wood County and adjacent count ies (Source: Census 2010 and American Community Survey 2014)

WOOD COUNTY |FUTURE LAND USE PLAN|
APPENDIX A: HOUSING | 19 |
Housing Density According to 2010 Census data, the highest housing densities in Wood County are in the City of Bowling Green and Perrysburg with some blocks of greater than 5 housing units per acre density. Other cities such as Rossford and Northwood as well as the villages have blocks with greater than 1 housing unit per acre densities. Wood County also has several blocks of industrial and agricultural uses with no housing units recorded. The city of Bowling Green has a public university which also has a housing density of 0 units per acre.
Wood County has increased their overall housing inventory by less than 1% between 2010 and 2014. This change in inventory includes approximately 2,435 housing units added to the inventory, notably in the city of Bowling Green, Northwood, and Perrysburg, and 2,223 housing units that were eliminated from the housing inventory due to aging, deterioration and delinquency. This combined with the population increase points to a change in housing trends in Wood County with increasing household sizes in owner-occupied and renter housing.
The predominant housing type in Wood County is detached 1-unit (detached single family unit) which supports 2 person and larger households. There is also a significant inventory of mobile homes in the county.
Housing Unit Types Housing Units Percent 1-unit, detached 35,162 65.6% 1-unit, attached 1,759 3.3%
2 units 1,432 2.7% 3 or 4 units 2,296 4.3% 5 to 9 units 3,891 7.3%
10 to 19 units 3,178 5.9% 20 or more units 2,507 4.7%
Mobile home 3,363 6.3% Total housing units 53,588
Table 16: Housing Uni t Types for Wood County (Source: American Community Survey 2014)
Number of Bedrooms Housing Units Percent
No bedroom 566 1.1%
1 bedroom 4926 9.2%
2 bedrooms 13946 26.0%
3 bedrooms 21878 40.8%
4 bedrooms 10508 19.6%
5 or more bedrooms 1764 3.3%
Total housing units 53,588
Figure 16: Housing Unit number of Bedrooms for Wood County (Source: Amer ican Community Survey 2014)

|FUTURE LAND USE PLAN| WOOD COUNTY
| 20 | APPENDIX A: HOUSING
Figure 17: Housing Density (Block Level) for Wood County (Source: Census 2010)

WOOD COUNTY |FUTURE LAND USE PLAN|
APPENDIX A: HOUSING | 21 |
Figure 18: Housing Change (Block Group Level) for Wood County (Source: Census 2010 and Amer ican Community Survey 2014)

|FUTURE LAND USE PLAN| WOOD COUNTY
| 22 | APPENDIX A: HOUSING
Occupancy and Tenure According to 2010 Census and 2014 American Community Survey data, housing vacancy rates in Wood County have been fairly steady between 2010 and 2014. The vacancy rate in 2014 for Wood County was 7.51%. Given the limitations of Census geography, the highest vacancy rates in Wood County are most likely newer housing tracts in the city of Bowling Green and on the periphery of the city of Perrysburg. Other block groups with high vacancy rates are located in largely agricultural areas just north of Hancock County. These townships, specifically Jackson and Henry, show the highest increase in vacancy rates from 2010 to 2014.
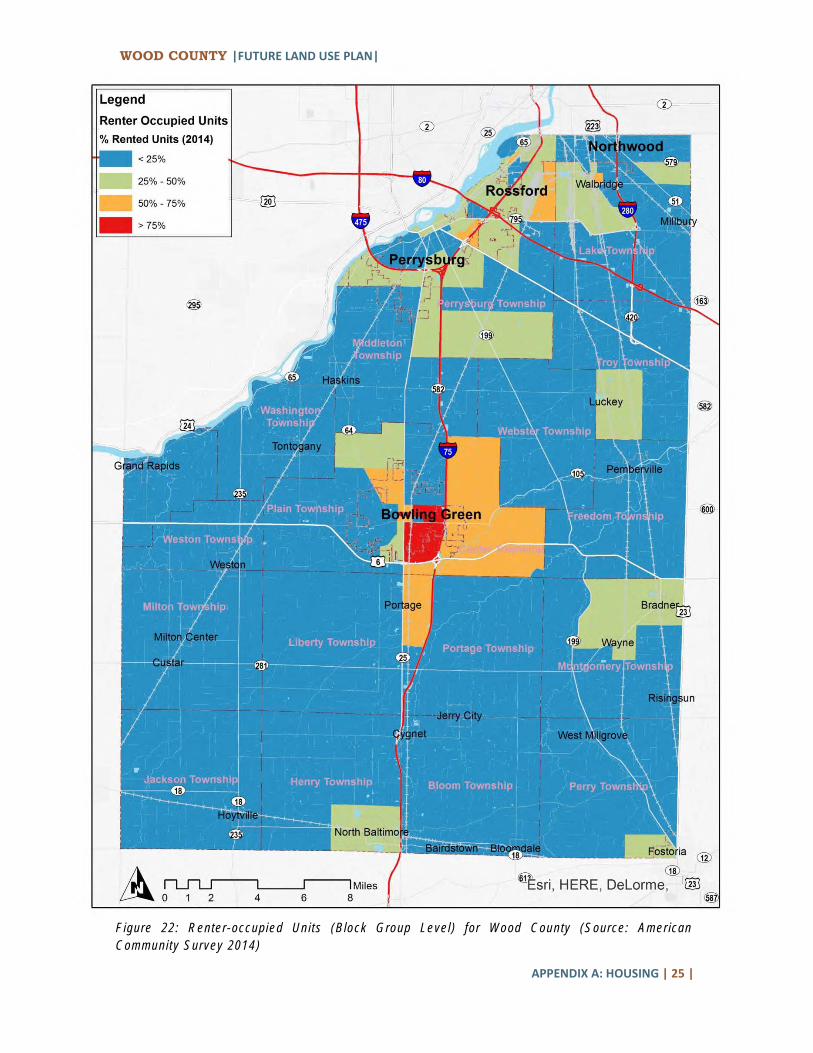
In 2014, approximately one third of the occupied housing in Wood County is renter-occupied. As with the vacancy rate, the rental tenure rate in Wood County has been fairly steady between 2010 and 2014. The city of Bowling Green has the highest rental tenure given its largely student population base. The city of Bowling Green also has areas in the heart of the city that have declining rental tenure rates indicating a shift in the renter population to university housing or to newer housing tracts east of I-75. The cities of Perrysburg, Rossford and Northwood as well as Perrysburg Township have a generally lower rental tenure rate but also have block groups with significant increases in rental tenure rates.
2014 2010 Change % Change Total Housing Units 53,588 53,376 212 0.40%
Owner-occupied 33,286 33,250 36 0.11% Renter-occupied 16,275 15,793 482 3.05%
Rental Tenure Rate 32.84% 32.20% -0.64% Vacancy Rate 7.51% 8.12% 0.60%
Figure 19: Housing Occupancy and Tenure Trends for Wood County (Source: Census 2010 and Amer ican Community Survey 2014)

WOOD COUNTY |FUTURE LAND USE PLAN|
APPENDIX A: HOUSING | 23 |
Figure 20: Vacancy Rate (Block Group Level) for Wood County (Source: Amer ican Community Survey 2014)

|FUTURE LAND USE PLAN| WOOD COUNTY
| 24 | APPENDIX A: HOUSING
Figure 21: Change in Vacancy Rates (Block Group Level) for Wood County (Source: Census 2010 and Amer ican Community Survey 2014)
WOOD COUNTY |FUTURE LAND USE PLAN|
APPENDIX A: HOUSING | 25 |
Figure 22: Renter-occupied Units (Block Group Level) for Wood County (Source: Amer ican Community Survey 2014)

|FUTURE LAND USE PLAN| WOOD COUNTY
| 26 | APPENDIX A: HOUSING
Figure 23: Change in Renter-occupied Units (Block Group Level) for Wood County (Source: Census 2010 and American Community Survey 2014)

WOOD COUNTY |FUTURE LAND USE PLAN|
APPENDIX A: HOUSING | 27 |
Median Value and Housing Affordability At $145,700, the 2014 median home value for owner-occupied units in Wood County is higher than the state of Ohio and adjoining counties. The highest median home values, greater than $150,000, in the county are in the cities of Perrysburg, Rossford and Bowling Green. The city of Bowling Green also has some of the lowest median home values, less than $50,000, in proximity to the university campus.
The median household income in 2014 for Wood County was $52,758 which was also the highest compared to the state of Ohio and adjoining counties. The median monthly cost for owner-occupied housing units with mortgages for Wood County is $1,356 which is approximately 30% of the median household income. This housing affordability metric is slightly lower than the state of Ohio (approximately 31%) and significantly lower than Lucas County (approximately 34%). This is indicative of relatively affordable housing options in Wood County.
Considering monthly housing costs as a percentage of household income, approximately 72.7% of households in Wood County contribute less than 30% of their household income towards housing costs with 48.8% of households contributing less than 20% of their household income towards housing costs. On average, the townships are more affordable than cities with 48.8% of households in townships contributing less than 20% of household income towards housing costs compared to 43.2% in cities.
Of the townships, Perry, Washington and Portage townships are most affordable with only 12% to 14% of households contributing 30% or more of household income towards housing costs. On the other hand, Plain and Center townships, both adjoining Bowling Green, are least affordable with approximately 34% of households contributing 30% or more of household income towards housing costs.
Of the cities in Wood County, Perrysburg is the most affordable with only 23.5% of households contributing 30 % or more of household income towards housing costs and Bowling Green is less affordable with 41.2% of households contributing 30% or more of household income towards housing costs.

|FUTURE LAND USE PLAN| WOOD COUNTY
| 28 | APPENDIX A: HOUSING
Figure 24: Housing Affordabil i ty (Monthly Housing Costs as a percentage of Household Income) for Wood County (Source: American Community Survey 2014)
0% 20% 40% 60% 80% 100%
WOOD COUNTY AVERAGE
Bowling Green City
Fostoria City
Northwood City
Perrysburg City
Rossford City
CITIES AVERAGE
Bloom Township
Center Township
Freedom Township
Grand Rapids Township
Henry Township
Jackson Township
Lake Township
Liberty Township
Middleton Township
Milton Township
Montgomery Township
Perry Township
Perrysburg Township
Plain Township
Portage Township
Troy Township
Washington Township
Webster Township
Weston Township
TOWNSHIPS AVERAGE
Less than 20 percent
20 to 29 percent
30 percent or more
Other

WOOD COUNTY |FUTURE LAND USE PLAN|
APPENDIX A: HOUSING | 29 |
Figure 25: Median Home Value (Block Group Level) for Wood County (Source: American Community Survey 2014)

|FUTURE LAND USE PLAN| WOOD COUNTY
| 30 | APPENDIX A: HOUSING
Figure 26: Median Household Income (Block Group Level) for Wood County (Source: American Community Survey 2014)

WOOD COUNTY |FUTURE LAND USE PLAN|
APPENDIX A: LAND USE ANALYSIS | 31 |
LAND USE ANALYSIS Wood County is approximately 620 square miles in area with approximately 617 square miles in land area and 3.3 square miles in water.
Wood County consists of 45 jurisdictional entities of 3 types: cities, villages and townships. Wood County consists of 5 cities with approximately 6.65% of total area, 21 villages with approximately 3% of the total area, and 19 townships with the remaining 90.35% of the total land area that is not incorporated by the cities and villages.
While some of the jurisdictions in the county maintain zoning, this land use analysis is based on parcel data prepared and maintained by the Wood County Auditor dated January 2016. Using this data provided up to date information and consistency across jurisdictional boundaries.
Figure 27: Jurisdict ional Land Distr ibution for Wood County (Source: Wood County Auditor Parcel Data 2016)
Cities 7%
Townships 90%
Villages 3%

|FUTURE LAND USE PLAN| WOOD COUNTY
| 32 | APPENDIX A: LAND USE ANALYSIS
Figure 28: Cit ies, Vi l lages and Townships in Wood County (Source: Wood County Auditor Parcel Data 2016)

WOOD COUNTY |FUTURE LAND USE PLAN|
APPENDIX A: LAND USE ANALYSIS | 33 |
Existing Land Use The existing land use categories for Wood County were derived from the land use classification code in the parcel data. The land use classification codes were grouped into 8 generalized existing land use categories – Residential Single Family, Residential Multifamily, Commercial, Industrial, Agricultural, Parks/Open Space, Public/Institutional and Transportation (including rail and road right-of-way).
Agriculture is the predominant existing land use in Wood County with approximately 76.6% of land in agricultural uses. A significant portion of the land is agricultural in townships (approximately 82.8% of land area in townships) but some agricultural uses are also included in cities and villages.
Overall Wood County has approximately 13.8% land in residential uses. Approximately one third of the land area in cities and villages is residential uses (single family and multifamily) whereas only 12% of the land area in the townships is residential. Residential uses in Wood County are predominantly single family with limited multifamily uses in the cities and villages.
Commercial uses, approximately 16% of land area in cities, are predominantly located along major transportation corridors in cities and some, approximately 6.4% of land area in the villages. Commercial uses in townships, approximately 1.6% of land area in townships, are generally located along major road or rail infrastructure. Overall Wood County has approximately 2.5% land area in commercial uses.
Overall Wood County has only 1.6% of land in industrial uses. Industrial uses are predominantly located in cities, specifically the city of Northwood (approximately 21% of the city’s land area). Perrysburg Township includes approximately 1,561 acres in industrial uses along major road and rail infrastructure.
Overall Wood County has only 1.8% of land in public and/or institutional uses. The most significant is in the city of which includes the county seat and Bowling Green State University. The city of Bowling Green has approximately 20.8% land in public/institutional uses. Other land uses include parks and open spaces (approximately 0.4% of county land area) and road and rail infrastructure (approximately 2.8% of county land area.
Agricultural
Residential SF
Transportation
Commercial
Public
Industrial
Residential MF
Parks
Figure 29: Exist ing Land Use Distr ibution for Wood County (Source: Wood County Auditor Parcel Data 2016)

|FUTURE LAND USE PLAN| WOOD COUNTY
| 34 | APPENDIX A: LAND USE ANALYSIS
Figure 30: Exist ing Land Use in Wood County (Source: Wood County Auditor Parcel Data 2016)

WOOD COUNTY |FUTURE LAND USE PLAN|
APPENDIX A: LAND USE ANALYSIS | 35 |
Figure 31: Exist ing Land Use Audi t Wood County (Source: Wood County Auditor Parcel Data 2016)

|FUTURE LAND USE PLAN| WOOD COUNTY
| 36 | APPENDIX A: LAND USE ANALYSIS
Figure 32: Exist ing Land Use Audi t Wood County (Source: Wood County Auditor Parcel Data 2016)

WOOD COUNTY |FUTURE LAND USE PLAN|
APPENDIX A: LAND USE ANALYSIS | 37 |
Vacant/Underutilized Land The vacant and underutilized land analysis is focused on parcels with non-agricultural existing land use. This analysis identifies parcels with no structure as vacant. Underutilized parcels are identified using improved value to land value ratio which is an indicator of the potential of the land to redevelop. A low improved to land value ratio, usually 1.0 or lesser, is indicative of high potential for redevelopment. An improved to land value ratio of 1.0 to 2.0 is indicative of moderate redevelopment potential and an improved to land value ratio higher than 2.0 is indicative of a low potential for redevelopment. While there are other factors such as structure age and local zoning regulations that contribute to redevelopment potential, this methodology provides a preview of the areas with redevelopment potential and would suffice for the development of a land use plan.
Vacant Parcels The highest proportion of vacant land in Wood County is commercial land. The inventory of vacant commercial parcels in Wood County is approximately 2,591 acres. Majority of this land is located in the cities – Rossford, Bowling Green, Perrysburg and Northwood. In addition to the cities, Perrysburg Township and Lake Township also has a significant inventory of vacant commercial land. These vacant commercial parcels are mostly located in proximity to highways and major roads. Vacant commercial parcels also include multifamily residential uses.
The inventory of vacant residential parcels is notably smaller in acres compared to commercial parcels for Wood County overall. Majority of the vacant residential parcels are in the cities – Perrysburg and Bowling Green. Perrysburg Township and Middleton Township also have substantial inventory of vacant residential parcels.
Jurisdictions Total Land
Area Vacant
Acreage % Vacant
Unincorporated County (Townships) 359,592 1,753 <0.05%
Villages 11,951 608 5%
Cities 26,466 3,273 12.36%
Total Wood County 398,008 5,634 1.41%
Figure 33: Vacant Land Use Audit Summary Wood County (Source: Wood County Auditor Parcel Data 2016)

|FUTURE LAND USE PLAN| WOOD COUNTY
| 38 | APPENDIX A: LAND USE ANALYSIS
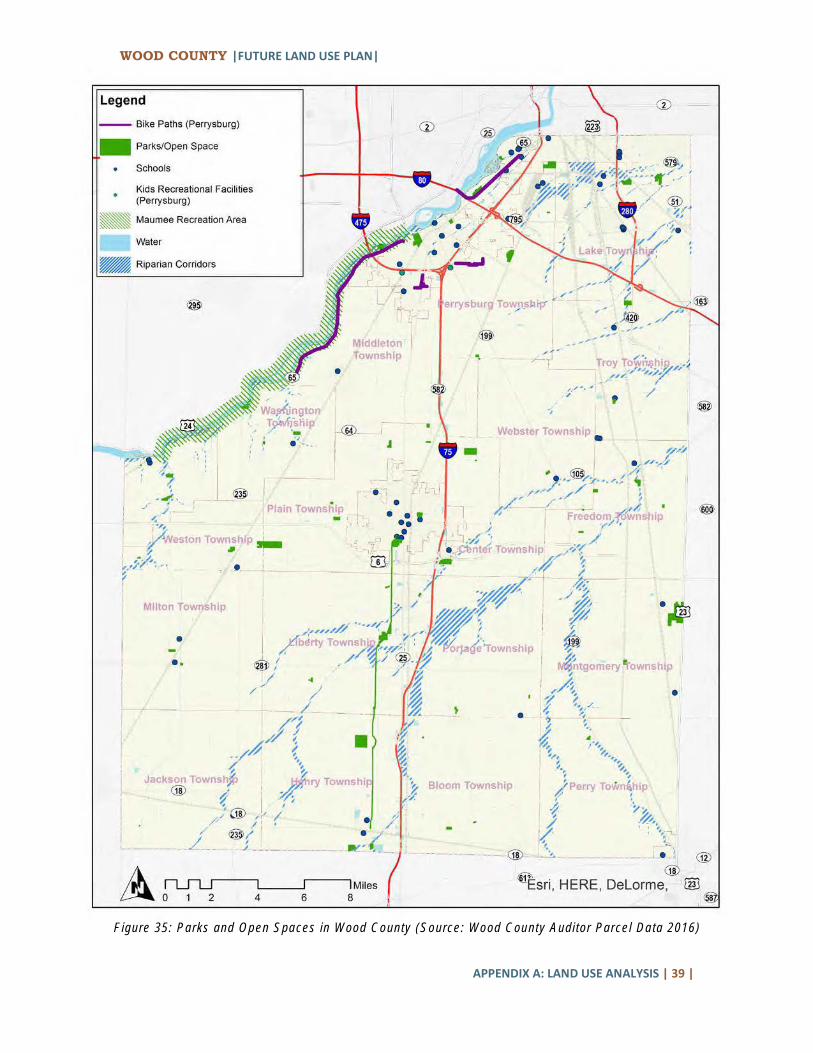
Parks and Recreational Open Spaces Overall Wood County has approximately 1,694 acres set aside as parks and open space which translates into 0.01 acres per capita when compared to County population estimates for 2014. This category includes all parks, recreational trails and cemeteries identified by the Wood County Park District. Some parks and recreational open space parcels are classified as public land but not specifically identified as such. For example, parks, playgrounds and recreational open spaces associated with schools or other institutional uses may not be identified in this category. Maumee River and the recreational areas associated with the river are identified on the following map but not all acreage is included in this analysis.
2014 ACS Population
Parks
Acres Acres per Capita
Bowling Green 31366 78 0.00
Fostoria 944 0 0.00
Northwood 5285 0 0.00
Perrysburg 21122 83 0.00
Rossford 6434 6 0.00
Total Cities 65,151 167 0.00
Bloom 2633 13 0.01
Center 1429 146 0.10
Freedom 2760 46 0.02
Grand Rapids 1533 37 0.02
Henry 4241 240 0.06
Jackson 802 0 0.00
Lake 11127 82 0.01
Liberty 1624 138 0.09
Middleton 4543 0 0.00
Milton 877 16 0.02
Montgomery 4290 252 0.06
Perry 1517 10 0.01
Perrysburg 12482 227 0.02
Plain 1950 172 0.09
Portage 1628 13 0.01
Troy 3924 40 0.01
Washington 2040 34 0.02
Webster 1211 8 0.01
Weston 2377 53 0.02
Total Townships 62,988 1,526 0.02
Total All 128,139 1,694 0.01
Figure 34: Parks and Recreation Open Acreage per Capita for Wood County (Source: Amer ican Community Survey 2014 and Wood County Audi tor Parcel Data 2016)
WOOD COUNTY |FUTURE LAND USE PLAN|
APPENDIX A: LAND USE ANALYSIS | 39 |
Figure 35: Parks and Open Spaces in Wood County (Source: Wood County Audi tor Parcel Data 2016)

|FUTURE LAND USE PLAN| WOOD COUNTY
| 40 | APPENDIX A: LAND USE ANALYSIS
Prime Agricultural Soils and Farms Wood County has predominantly agricultural land uses with approximately 76.6% land classified as agriculture. Farmland values have grown steeply in Wood County and the County has instituted a special assessment program to reflect production capabilities and not agricultural property sales. Since market land values for agricultural parcels are higher along the I-75 corridor and in the periphery of cities, the pressure to convert agricultural land to other uses is higher. The current agricultural use value minimizes the property tax increases associated with increasing land values and creates an incentive for agricultural land owners to maintain current agricultural uses.
2014 ACS Population
Agricultural
Acres Acres per Capita
Bowling Green 31366 880 0.03
Fostoria 944 94 0.10
Northwood 5285 1,355 0.26
Perrysburg 21122 829 0.04
Rossford 6434 352 0.05
Total Cities 65,151 3,510 0.05
Bloom 2633 19,391 7.36
Center 1429 13,462 9.42
Freedom 2760 16,485 5.97
Grand Rapids 1533 6,722 4.38
Henry 4241 18,806 4.43
Jackson 802 21,999 27.43
Lake 11127 12,183 1.09
Liberty 1624 21,585 13.29
Middleton 4543 15,195 3.34
Milton 877 21,600 24.63
Montgomery 4290 19,453 4.53
Perry 1517 20,424 13.46
Perrysburg 12482 13,054 1.05
Plain 1950 12,316 6.32
Portage 1628 20,407 12.53
Troy 3924 13,867 3.53
Washington 2040 10,152 4.98
Webster 1211 16,803 13.88
Weston 2377 7,542 3.17
Total Townships 62,988 301,445 4.79
Total All 128,139 304,954 2.38
Figure 36: Agr icultural Acreage per Capita for Wood County (Source: Amer ican Community Survey 2014 and Wood County Auditor Parcel Data 2016)

WOOD COUNTY |FUTURE LAND USE PLAN|
APPENDIX A: LAND USE ANALYSIS | 41 |
Several factors contribute to optimal use of agriculture land – prime farming soils, low slopes, and proper drainage. While Wood County has substantial acreage of prime farmland soils, a vast majority of the agricultural parcels have slopes less than 1% and are not located in ‘A’ flood zones.
Acres Percent
Prime Soils 284,407 93.26% Slopes <1% 46,968 17.44% Good drainage 10,652 3.96%
Total Agriculture 304,954 Figure 37: Agr icultural Land Use Audit Wood County (Source: Wood County Auditor Parcel Data
2016)
Consolidating the three factors together presents a more comprehensive view of agricultural land in Wood County. Each parcel with one of the above factors was assigned a value of 1. The values were added up to tabulate the acreage and percentage of land with 1, 2 or 3 contributing factors. While the proportion of agricultural parcels with all three contributing factors is only 6.21%, a majority of agricultural parcels in Wood County have at least two contributing factors.
Acres Percent
Ag Value = 1 233,979 76.73% Ag Value = 2 57,095 18.72% Ag Value = 3 12,713 4.17%
Total Agriculture 304,954 Figure 38: Agr icultural Land Use Audit Wood County (Source: Wood County Auditor Parcel Data
2016)

|FUTURE LAND USE PLAN| WOOD COUNTY
| 42 | APPENDIX A: LAND USE ANALYSIS
Figure 39: Agricultural Land Value in Wood County (Source: Wood County Audi tor Parcel Data 2016)

WOOD COUNTY |FUTURE LAND USE PLAN|
APPENDIX A: LAND USE ANALYSIS | 43 |
Figure 40: Current Agricul tural Use Value in Wood County (Source: Wood County Auditor Parcel Data 2016)

|FUTURE LAND USE PLAN| WOOD COUNTY
| 44 | APPENDIX A: LAND USE ANALYSIS
Figure 41: Contr ibut ing Factors to Agr icultural Use in Wood County (Source: Wood County Auditor Parcel Data 2016)

WOOD COUNTY |FUTURE LAND USE PLAN|
APPENDIX A: LAND USE ANALYSIS | 45 |
Figure 42: Agricultural Use in Wood County (Source: Wood County Auditor Parcel Data 2016)
|FUTURE LAND USE PLAN| WOOD COUNTY
| 46 | APPENDIX A: LAND USE ANALYSIS
Water and Sanitary/Sewer Service Water and sanitary/sewer service in Wood County is mostly focused in the cities and townships adjoining the major cities. The data for the following map was provided by Northwestern Water & Sewer District. The cities maintain the water and sewer data for their jurisdiction. The following map includes water and sewer data for Perrysburg, Rossford and Northwood but not Bowling Green.

WOOD COUNTY |FUTURE LAND USE PLAN|
APPENDIX A: LAND USE ANALYSIS | 47 |
Figure 43: Water and Sanitary Sewer Mains in Wood County (Source: Northwestern Water & Sewer Distr ict Data 2016)

|FUTURE LAND USE PLAN| WOOD COUNTY
| 48 | APPENDIX A: RESIDENTIAL/NON-RESIDENTIAL LAND DEMAND
RESIDENTIAL/NON-RESIDENTIAL LAND DEMAND Using Census/American Community Survey (ACS) population estimates for 2014, population forecasts for 2050, and existing land use data, MDC estimated existing residential and non-residential land supply for 2014 and future residential and non-residential land demand for 2050. The non-residential land demand estimates include the following use categories: commercial, industrial, and public. In addition to residential and non-residential uses, this analysis also looked at land allocation and demand for parks/open space.
In this analysis, existing land use acreage was distributed based on 2014 Census/ACS population estimates to calculate per capita land usage for residential and non-residential uses. The per capita land use estimates were attributed to 2050 population forecasts to calculate residential and non-residential land demand. The current distribution of population between cities and townships was held constant for 2050 population distribution. This analysis also holds other residential and non-residential development trends, such as household size and vacancy, constant through 2050. The township estimates include any villages included within the township boundaries.
Existing (2014) All Cities Townships
Total Population 128,139 65,151 62,988
Population Distribution 50.84% 49.16%
Land
Allo
catio
n
Residential Total Acres 56,927 9,713 47,213 Residential Vacant 2.72% 5.42% 2.16% Residential Acres per Capita 0.44 0.15 0.75 Non-Residential Total Acres 23,626 9,871 13,755
Commercial 10,003 7,411 5,667 Industrial 6,503 2,301 4,202
Public 7,121 3,235 3,885 Non-Residential Vacant 17.31% 27.83% 9.75%
Commercial 25.91% 41.70% 13.83% Industrial 23.02% 40.82% 13.27%
Public 0.00% 0.00% 0.00% Non-Residential Acres per Capita 0.18 0.15 0.22
Commercial 0.08 0.07 0.09 Industrial 0.05 0.04 0.07
Public 0.06 0.05 0.06 Parks/Open Space Total Acres 1,694 167 1,526 Parks/Open Space Acres per Capita 0.01 0.00 0.02
Figure 44: Exist ing(2014) Population Distr ibut ion and Residentia l/Non-Residential Land Al location for Wood County (Source: Census/ACS 2014, MDC Populat ion 2016, Wood County Auditor Parcel Data 2016)
Based on Census/ACS population estimates for 2014, 50.84% of Wood County’s population was located in cities and 49.16% in townships. It is anticipated that Wood County’s population will

WOOD COUNTY |FUTURE LAND USE PLAN|
APPENDIX A: RESIDENTIAL/NON-RESIDENTIAL LAND DEMAND | 49 |
grow to 131,332 by 2050. While there are some demographic indicators that suggest a shift in population from rural to urban, this land demand analysis holds this population distribution constant.
As anticipated, per capita land allocation for residential and non-residential uses is higher in townships compared to the cities. Although cities constitute only 7% of total land acres in Wood County, cities include a significant proportion of population and have higher density of residential and higher intensity of non-residential land uses. The primarily rural/agricultural character of the townships results in 0.75 acres per capita residential land allocation which id significantly higher than the cities at 0.15 acres per capita of residential land allocation. On the other hand, the townships include insignificant commercial, industrial or public uses which results in a non-residential land allocation of 0.06 acres per capita. The public land use category also includes an open space component. The parks/open space category only includes lands that are identified in the Wood County Auditor’s database as such.
Vacancy of residential and non-residential land is higher in cities compared to townships. Vacancy of commercial and industrial land is as high 41% which is indicative of lack of investment and locational/dimensional inefficiency in land use allocation. Vacant public land is not reported in the Wood County Auditor’s parcel database.
Trend (2050) All Cities Townships
Total Population 131,332 66,774 64,558 Population Distribution 50.84% 49.16%
Land
Dem
and
Residential New Acres 1,419 242 1,176 Non-Residential New Acres 589 246 343
Commercial 249 108 141 Industrial 162 57 105
Public 177 81 97 Parks/Open Space New Acres 42 4 38 Total Land Demand in New Acres 2,049 492 1,557
Land
Cap
acity
Available Land Total Acres 310,590 6,783 303,807 Residential Vacant 1,546 526 1,020
Non-Residential Vacant 4,089 2,747 1,342 Agricultural 304,954 3,510 301,445
Percent of Available Land needed to meet Demand 0.66% 7.26% 0.51% Residential 0.46% 3.57% 0.39%
Non-Residential 0.19% 3.63% 0.11% Parks/Open Space 0.01% 0.06% 0.01%
Figure 45: Trend (2050) Populat ion Distr ibut ion and Resident ial /Non-Resident ial Land Demand for Wood County (Source: Census/ACS 2014, MDC Populat ion 2016, Wood County Auditor Parcel Data 2016)

|FUTURE LAND USE PLAN| WOOD COUNTY
| 50 | APPENDIX A: RESIDENTIAL/NON-RESIDENTIAL LAND DEMAND
Future land demand was estimated based on the existing per capita land allocations for both residential and non-residential uses. The analysis estimates an overall demand for 1,419 new residential acres. A significant portion of this land demand (1,176 acres) is anticipated in townships since the per capita residential land allocation in townships is higher than the cities. On the other hand, the analysis estimates 589 acres of non-residential land demand overall. A little less than half the non-residential land demand is for new commercial acreage. The analysis also estimated a demand for 177 new acres of public land and 42 acres of parks/open space through 2050.
Wood County has an estimated 310,590 acres of land available to meet future land demand. This estimate of available land includes vacant residential and non-residential land as well as agricultural land. Given the large inventory of available land and the marginal future land demand, the percent of available land needed to meet demand overall is only 0.66%. The highest proportion of overall land demand is in the cities where the supply of land for future use is limited.