Appendix A Ornithology Survey Report
292
Environmental Impact Assessment Volume 2 of 4: Main Report 32102902/NIS Appendix A Ornithology Survey Report
Transcript of Appendix A Ornithology Survey Report

Environmental Impact Assessment Volume 2 of 4: Main Report
32102902/NIS
Appendix A Ornithology Survey Report

rpsgroup.com/uk
May 2018
Project Number: SEC7909
RPS Belford House, 3rd Floor, 59 Belford Road, Edinburgh, EH4 3DE
Tel: 0131 555 5011 Fax: 0131 555 4911 Email: [email protected]
Greater Dublin Drainage
Appendix A
Estuarine, Coastal and Marine Ornithology Technical Report

rpsgroup.com/uk
QUALITY MANAGEMENT
Prepared by: Name: Dr Rob Iredale Title: Principal Ornithologist
Signature:
Authorised by: Name: Dr Simon Zisman Title: Senior Director
Signature:
Status: Final
Issue Date: 23rd May 2018 Revision Number: 20180523_F1
Revision Notes: -
Project File Path: W:\7909SEC - RPS Belfast, WW EIS NIS Ornithology\Technical\Reports\EIS\2018_05_17_FinalSub\Final\2018_05_23_SEC7909 Marine Ornithology Appendix A10.1 RI_vf_clean.docx
This report has been prepared within the RPS Planning and Development Quality Management
System to British Standard EN ISO 9001 : 2008
COPYRIGHT © RPS
REPORT TEMPLATE
TYPE: Technical
ISSUE DATE: 18 May 2011
REVISION NUMBER: 1
REVISION DATE: 26 April 2012

rpsgroup.com/uk
CONTENTS
1. INTRODUCTION ........................................................................................................................ 1
1.1 Purpose of this Document ...................................................................................................... 1
2. ESTUARINE BIRD SURVEYS .................................................................................................. 2
2.1 Survey Methodology ................................................................................................................ 2 2.1.1 Introduction ................................................................................................................................. 2
2.1.2 Survey Location ......................................................................................................................... 2
2.1.3 Target Species .......................................................................................................................... 2
2.1.4 Survey Timing and Effort.......................................................................................................... 2
2.1.5 Field Recording .......................................................................................................................... 2
2.2 Results ...................................................................................................................................... 2 2.2.1 Survey Effort .............................................................................................................................. 2
2.2.2 Peak Counts ............................................................................................................................... 2
2.2.3 Figures........................................................................................................................................ 3
3. COASTAL AND MARINE VANTAGE POINT (VP) SURVEYS ................................................ 4
3.1 Survey Methodology ................................................................................................................ 4 3.1.1 Introduction ................................................................................................................................. 4
3.1.2 Survey Locations ........................................................................................................................ 4
3.1.3 Target Species ........................................................................................................................... 4
3.1.4 Survey Timings ........................................................................................................................... 5
3.1.5 Field Recording .......................................................................................................................... 5
3.2 Results ...................................................................................................................................... 5 3.2.1 Survey Effort ............................................................................................................................... 5
3.2.2 VP Peak Counts ......................................................................................................................... 5
4. REFERENCES
FIGURES
APPENDIX 1 – ESTUARINE BIRD SURVEY EFFORT
APPENDIX 2 – ESTUARINE BIRD SURVEY DATA
APPENDIX 3 – MARINE VP SURVEY EFFORT
APPENDIX 4 – MARINE VP RECORDS
APPENDIX 5 – MARINE VP GRAPHS

1 rpsgroup.com/uk
1. INTRODUCTION
1.1 Purpose of this Document
This document outlines the protocols for surveys and presents the ornithology data collected for the Greater Dublin Drainage (GDD) Project on estuarine, coastal and marine ornithology. It should be read in conjunction with the relevant Environmental Impact Assessment Report (EIAR) chapter (Chapter 10: Marine Ornithology). The following surveys are covered by this document: • Coastal and Marine VP (Velvet Strand; VP1); • Coastal and Marine VP (Ireland’s Eye; VP2); and • Estuarine bird surveys (Baldoyle Bay). . Data collected between December 2014 and March 2018 is included.

2 rpsgroup.com/uk
2. ESTUARINE BIRD SURVEYS
2.1 Survey Methodology
2.1.1 Introduction Estuarine walkover surveys were carried out based on the standard Wetland Bird Survey methods (Gilbert et al., 1998; BTO 2016a and 2016b), using a more refined methodology involving the recording of precise locations of birds as well as their behaviour. Surveys aimed to count, map and record behaviour of wildfowl and waders using the estuarine habitat, in addition to other species of bird present.
2.1.2 Survey Location The survey area is shown in Figure 10.1 of the EIAR chapter. The survey area covered the route of the pipeline to the outfall where it crosses intertidal/ estuarine habitat, and extended up to 1km from this route across the Baldoyle Bay SPA and surrounding habitats. The size of the survey area was approximately 4.95km².
2.1.3 Target Species The key species groups were wildfowl, waders and seabirds. However, during the surveys all birds were recorded. Priority was given to recording birds on the ground or on water within the survey area. Records of notable flying birds were made, for example raptors or flocks of waterfowl and waders.
2.1.4 Survey Timing and Effort In each month, two estuarine survey counts were completed. Each survey was of six hours duration. If the survey area was covered before the allotted time has elapsed (which was possible at high tide), the remaining time was used to undertake repeat counts of any wader or wildfowl hotspots. Timings of counts throughout the survey period were made so that the whole tidal cycle was equally covered. Counts were made during full daylight.
2.1.5 Field Recording Species were recorded using standard BTO codes and the behaviour codes specified on the survey map. Information on the age and sex of target species was also desirable. Notable observations that occurred outside the study area but within sight of the surveyors inside the study area were recorded.
2.2 Results
2.2.1 Survey Effort Survey effort during the estuarine walkover surveys is presented in Appendix 1 (Table A10.1).
2.2.2 Peak Counts Peak counts from estuarine walkover surveys are presented in Appendix 2 (Tables A10.2 to A10.4).

3 rpsgroup.com/uk
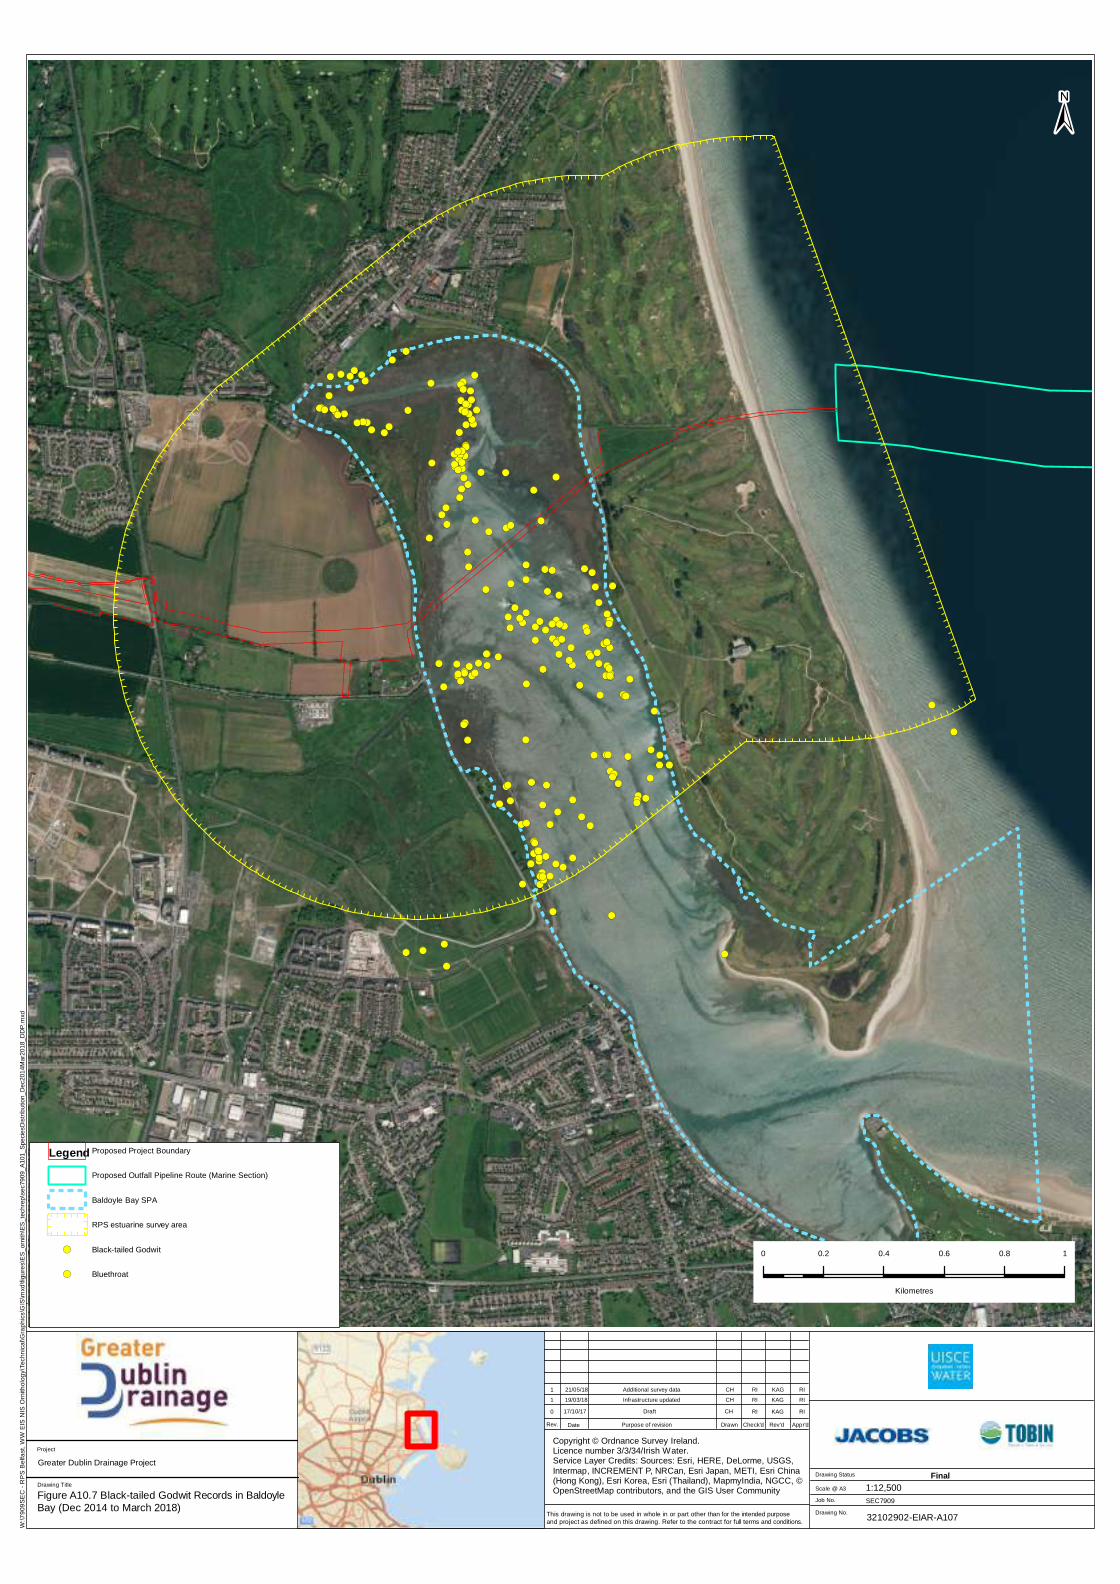
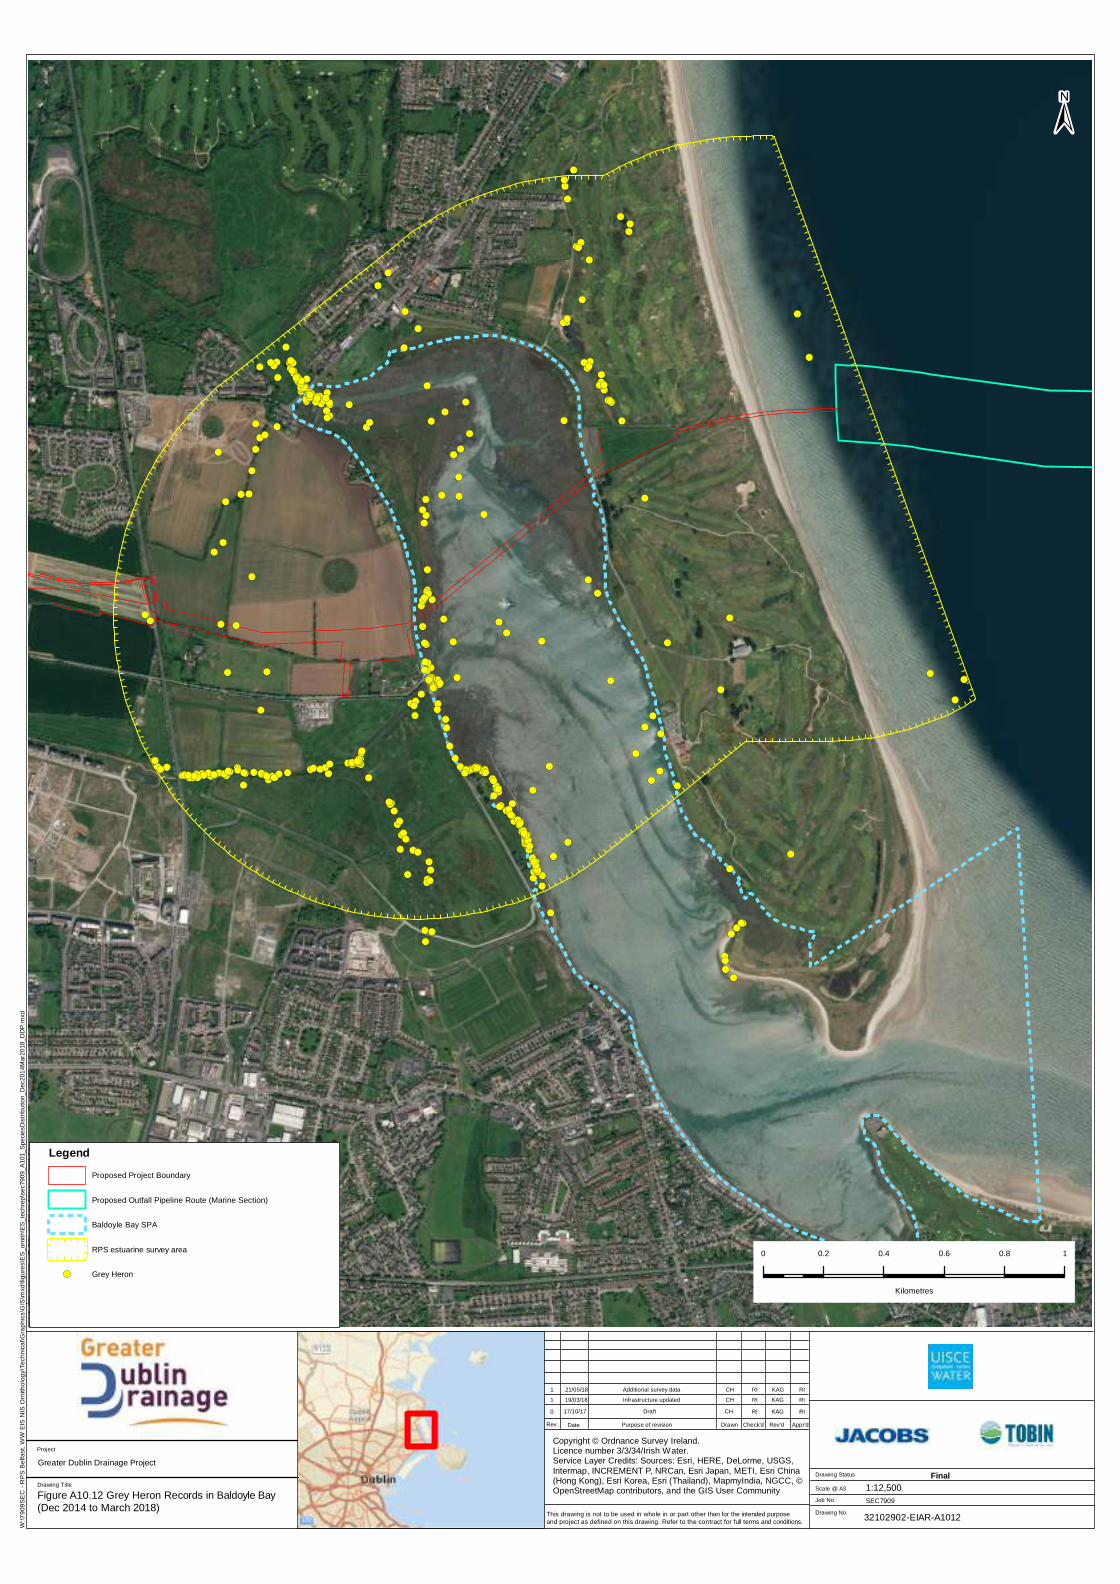
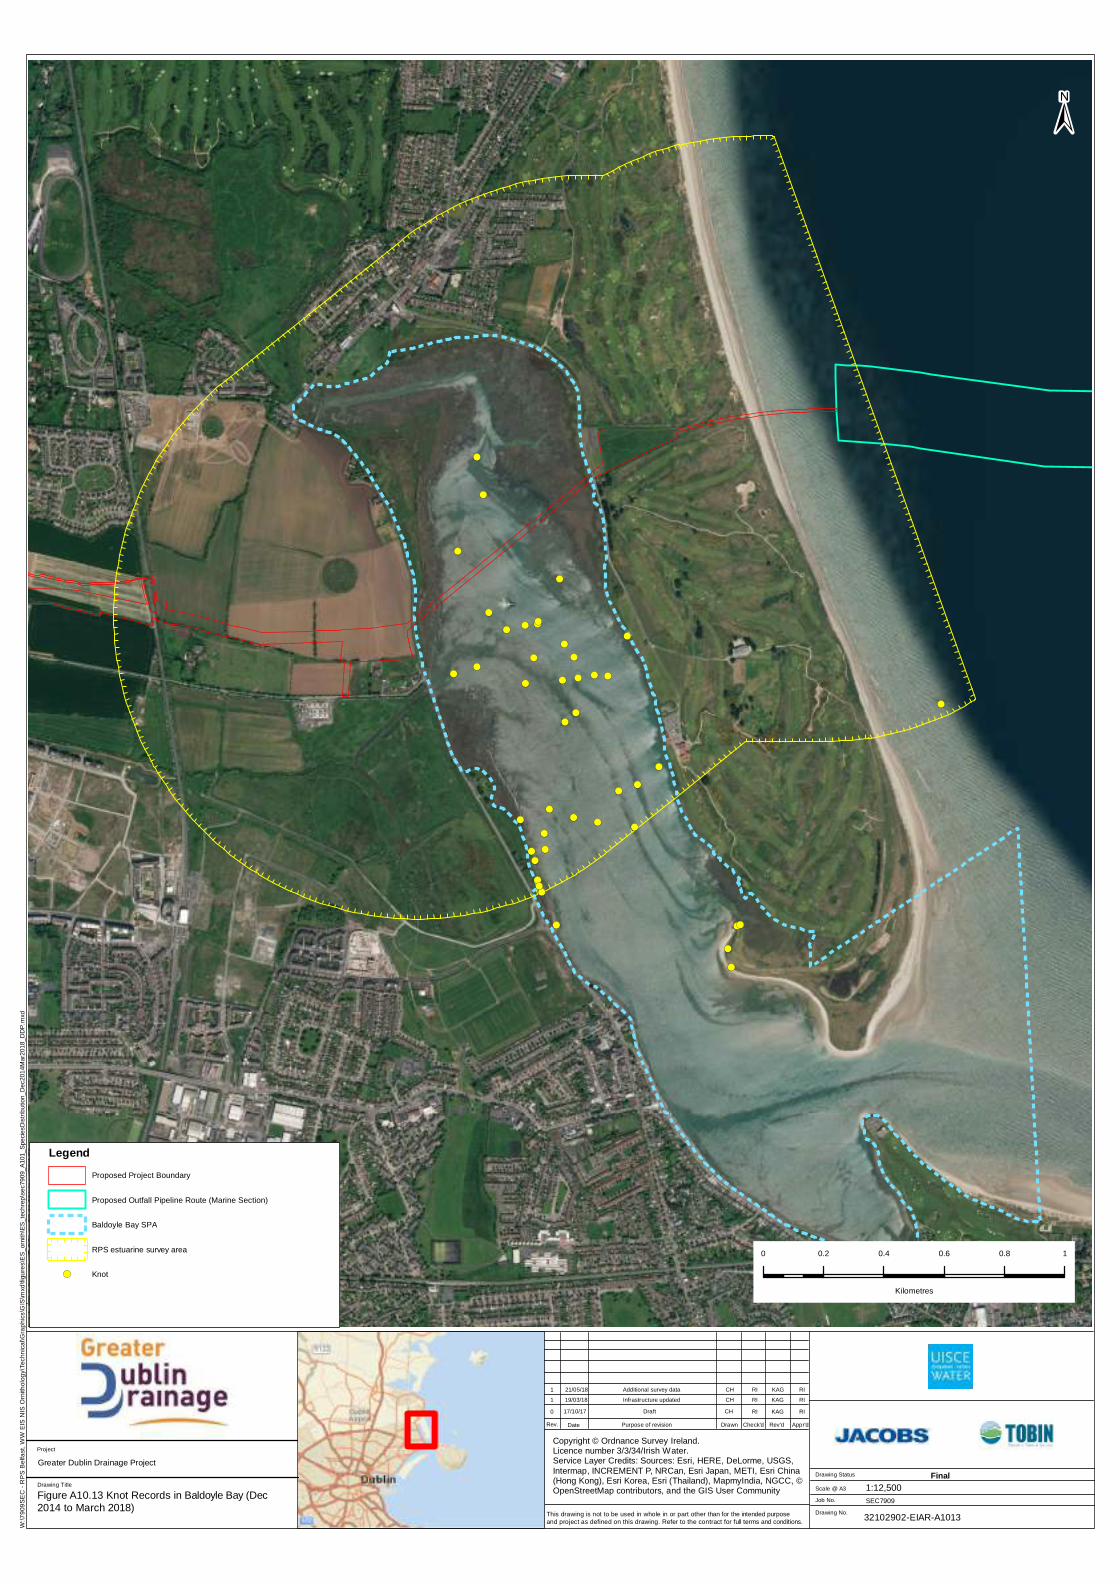
2.2.3 Figures The distribution of 53 species encountered during the estuarine walkover surveys is presented in Figures TA10.1 to TA10.53. A figure was produced for species that were named on citations of the Baldoyle Bay, Ireland’s Eye or Howth Head Coast SPA, or if more than ten records of the species were made during the surveys.

4 rpsgroup.com/uk
3. COASTAL AND MARINE VANTAGE POINT (VP)
SURVEYS
3.1 Survey Methodology
3.1.1 Introduction
VP surveys were carried out based on those undertaken for the MeyGen Tidal Energy Project in the Pentland Firth (RPS, 2013). They were carried out from December 2014, with six hours of survey carried out monthly per VP to March 2018. Survey protocol was designed to count birds on the water (primary focus) and in flight (through snapshot recording).
3.1.2 Survey Locations One location on the mainland and one location on Ireland’s Eye were used. The mainland coastal VP was positioned as in previous surveys at the proposed landfall location at Portmarnock (IO250423, Lat. 53.41631, Long. -6.11966, mean viewing angle 70°). The Ireland’s Eye VP was positioned at IO287415 (Lat. 53.40792, Long. -6.06387, mean viewing angle 0°). The mainland coastal VP covered the area of the marine outfall out to sea using a 2km viewing arc; and the Ireland’s Eye VP covered the remaining pipeline route using a 2km viewing arc. In this way, a buffer around the marine outfall pipeline footprint and working area was achieved.
3.1.3 Target Species Key species/ species groups are as listed below. These are primarily seabirds which utilise the marine environment for breeding, foraging or roosting. All species listed were covered, but species marked in bold were considered priority. • Seaducks • Divers • Grebes • Fulmar and other tubenoses (petrels, shearwaters) • Gannet • Cormorant • Shag • Skuas • Lesser black-backed gull • Herring gull • Other large gulls • Kittiwake • Other small gulls (e.g. black-headed gull, common gull) • Roseate tern • Common tern • Arctic tern • Auks

5 rpsgroup.com/uk
3.1.4 Survey Timings From each VP, six hours of survey were undertaken each month, timed to give coverage over a range of tide states, whilst ensuring a spread between neap and spring tides. Surveys commenced and ended no earlier than half an hour before sunrise and or no later than half an hour after sunset. Each VP survey was three hours long, and a minimum of 30 minutes taken as a break between surveys.
3.1.5 Field Recording The 2km 180° viewing arc was divided into 6 (30°) sections labelled A-F. Each section was subdivided into 500m distance bands (numbered sequentially 1 to 4 away from observer). Each section was identified using land features, rangefinders, and by measuring the compass bearing from the observer. A full binocular/telescope (dependent on distance band) scan of the whole area was made every 10 minutes, the surveyor working sequentially through the grid and distance bands and recording all birds observed on the water. Only birds on the sea surface, or birds in flight but using the sea (e.g. plunge diving or surface feeding, or clearly observing the sea surface in preparation to do so, or even, if not feeding, regularly dropping to the sea surface) were recorded during this scan; flying birds were ignored. The location of each record was determined using bearings, angles of declination or with reference to static easily identifiable objects in the sea. Standardised protocols for dealing with recording of behaviours and associations were used. At the end of each full scan, birds in flight were counted in each sector. To reduce/ eliminate double counting this should be as near an instantaneous count as possible. Throughout a day’s observations, environmental conditions were recorded at hourly intervals using standard recording forms. The following behaviour codes were used to describe birds on the water: • SU: Surface feeding; • PL: Plunge feeding; • DP: Dip feeding; • FE: Feeding (other); • SC: Scavenging; • SF: Scavenging at fishing vessel; • KL: Kleptoparasitising; • CN: Carrying nest material; • CF: Carrying food; • PR: Preening or bathing; • ED: Escape diving from vessel; • EF: Escape flight from vessel; • RO: Roosting on water; • LO: Loafing.
3.2 Results
3.2.1 Survey Effort Survey effort during the Coastal and Marine VP surveys is presented in Appendix 3.
3.2.2 VP Peak Counts Peak counts from Coastal and Marine VP surveys are presented in Appendix 4. Presented are tables which show the species recorded during both the breeding (April to August) and

6 rpsgroup.com/uk
passage/winter (September to March) seasons, the total number of times they were recorded during surveys (split by in flight or on sea), and the peak count of birds that were recorded during a single scan (split by in flight or on sea, and combined). Species have been split into tables based on SPA citation (i.e. Ireland’s Eye/Howth Head Coast SPA, Baldoyle Bay SPA, and non-cited species).

7 rpsgroup.com/uk
4. REFERENCES
• BTO (2016a). WeBS Core Counts Method. Available at: http://www.bto.org/volunteer-surveys/webs/taking-part/core-counts-methods.
• BTO (2016b). WeBS Low Tide Counts Method. Available at:
http://www.bto.org/volunteer-surveys/webs/taking-part/low-tide-counts.
• Gilbert G., Gibbons D.W. & Evans, J. (1998) Bird Monitoring Methods: A Manual of Techniques for Key UK Species. RSPB, Sandy.
• RPS (2013). MeyGen Tidal Energy Project Inner Sound, Pentland Firth Ornithological
Technical Report.

rpsgroup.com/uk
FIGURES
Bar-tailed Godwit Records in Baldoyle Bay (Dec 2014 to March 2018) Figure A10.1
Brent Goose (LB) Records in Baldoyle Bay (Dec 2014 to March 2018) Figure A10.2
Golden Plover Records in Baldoyle Bay (Dec 2014 to March 2018) Figure A10.3
Grey Plover Records in Baldoyle Bay (Dec 2014 to March 2018) Figure A10.4
Ringed Plover Records in Baldoyle Bay (Dec 2014 to March 2018) Figure A10.5
Shelduck Records in Baldoyle Bay (Dec 2014 to March 2018) Figure A10.6
Black-tailed Godwit Records in Baldoyle Bay (Dec 2014 to March 2018) Figure A10.7
Curlew Records in Baldoyle Bay (Dec 2014 to March 2018) Figure A10.8
Dunlin Records in Baldoyle Bay (Dec 2014 to March 2018) Figure A10.9
Great Crested Grebe Records in Baldoyle Bay (Dec 2014 to March 2018) Figure A10.10
Greenshank Records in Baldoyle Bay (Dec 2014 to March 2018) Figure A10.11
Grey Heron Records in Baldoyle Bay (Dec 2014 to March 2018) Figure A10.12
Knot Records in Baldoyle Bay (Dec 2014 to March 2018) Figure A10.13
Lapwing Records in Baldoyle Bay (Dec 2014 to March 2018) Figure A10.14
Mallard Records in Baldoyle Bay (Dec 2014 to March 2018) Figure A10.15
Oystercatcher Records in Baldoyle Bay (Dec 2014 to March 2018) Figure A10.16
Pintail Records in Baldoyle Bay (Dec 2014 to March 2018) Figure A10.17
Red-breasted Merganser Records in Baldoyle Bay (Dec 2014 to March 2018) Figure A10.18
Redshank Records in Baldoyle Bay (Dec 2014 to March 2018) Figure A10.19
Sanderling Records in Baldoyle Bay (Dec 2014 to March 2018) Figure A10.20
Teal Records in Baldoyle Bay (Dec 2014 to March 2018) Figure A10.21
Turnstone Records in Baldoyle Bay (Dec 2014 to March 2018) Figure A10.22
Black Guillemot Records in Baldoyle Bay (Dec 2014 to March 2018) Figure A10.23
Guillemot Records in Baldoyle Bay (Dec 2014 to March 2018) Figure A10.24
Razorbill Records in Baldoyle Bay (Dec 2014 to March 2018) Figure A10.25
Great Northern Diver Records in Baldoyle Bay (Dec 2014 to March 2018) Figure A10.26
Red-throated Diver Records in Baldoyle Bay (Dec 2014 to March 2018) Figure A10.27
Mute Swan Records in Baldoyle Bay (Dec 2014 to March 2018) Figure A10.28
Common Scoter Records in Baldoyle Bay (Dec 2014 to March 2018) Figure A10.29
Coot Records in Baldoyle Bay (Dec 2014 to March 2018) Figure A10.30
Little Grebe Records in Baldoyle Bay (Dec 2014 to March 2018) Figure A10.31
Moorhen Records in Baldoyle Bay (Dec 2014 to March 2018) Figure A10.32
Wigeon Records in Baldoyle Bay (Dec 2014 to March 2018) Figure A10.33
Black-headed Gull Records in Baldoyle Bay (Dec 2014 to March 2018) Figure A10.34
Common Gull Records in Baldoyle Bay (Dec 2014 to March 2018) Figure A10.35
Great Black-backed Gull Records in Baldoyle Bay (Dec 2014 to March 2018) Figure A10.36
Herring Gull Records in Baldoyle Bay (Dec 2014 to March 2018) Figure A10.37
Kittiwake Records in Baldoyle Bay (Dec 2014 to March 2018) Figure A10.38
Lesser Black-backed Gull Records in Baldoyle Bay (Dec 2014 to March 2018) Figure A10.39
Little Egret Records in Baldoyle Bay (Dec 2014 to March 2018) Figure A10.40
Buzzard Records in Baldoyle Bay (Dec 2014 to March 2018) Figure A10.41
Peregrine Records in Baldoyle Bay (Dec 2014 to March 2018) Figure A10.42

rpsgroup.com/uk
Cormorant Records in Baldoyle Bay (Dec 2014 to March 2018) Figure A10.43
Shag Records in Baldoyle Bay (Dec 2014 to March 2018) Figure A10.44
Common Tern Records in Baldoyle Bay (Dec 2014 to March 2018) Figure A10.45
Sandwich Tern Records in Baldoyle Bay (Dec 2014 to March 2018) Figure A10.46
Common Sandpiper Records in Baldoyle Bay (Dec 2014 to March 2018) Figure A10.47
Common Snipe Records in Baldoyle Bay (Dec 2014 to March 2018) Figure A10.48
Whimbrel Records in Baldoyle Bay (Dec 2014 to March 2018) Figure A10.49
Kestrel Records in Baldoyle Bay (Dec 2014 to March 2018) Figure A10.50
Mediterranean Gull Records in Baldoyle Bay (Dec 2014 to March 2018) Figure A10.51
Roseate Tern Records in Baldoyle Bay (Dec 2014 to March 2018) Figure A10.52
Ruff Records in Baldoyle Bay (Dec 2014 to March 2018) Figure A10.53 Distribution of all on sea black guillemot records from Ireland's Eye VP during breeding season (March to October)
Figure A10.54
Distribution of all on sea cormorant records from Ireland's Eye VP during breeding season (March to October)
Figure A10.55
Distribution of all on sea fulmar records from Ireland's Eye VP during breeding season (March to October)
Figure A10.56
Distribution of all on sea gannet records from Ireland's Eye VP during breeding season (March to October)
Figure A10.57
Distribution of all on sea great black-backed gull records from Ireland's Eye VP during breeding season (March to October)
Figure A10.58
Distribution of all on sea guillemot records from Ireland's Eye VP during breeding season (March to October) Figure A10.59
Distribution of all on sea guillemot or razorbill records from Ireland's Eye VP during breeding season (March to October)
Figure A10.60
Distribution of all on sea herring gull records from Ireland's Eye VP during breeding season (March to October)
Figure A10.61
Distribution of all on sea kittiwake records from Ireland's Eye VP during breeding season (March to October) Figure A10.62
Distribution of all on sea puffin records from Ireland's Eye VP during breeding season (March to October)
Figure A10.63
Distribution of all on sea razorbill records from Ireland's Eye VP during breeding season (March to October)
Figure A10.64
Distribution of all on sea shag records from Ireland's Eye VP during breeding season (March to October)
Figure A10.65

!(
!(
!(
!(
!(
!(
!(
!(!(
!(
!(
!(!(
!(!(
!(!( !(
!(
!(
!(
!(
!(!(
!(
!(
!(
!(
!(
!(
!(
!(
!(!(
!(!(
!(
!(
!(
!(
!(
!(
!(
!(
!(
!(
!(
!(
!(
!(
!(
!(
!(
!(
!(
!(!(
!(
!(
!(
!(
!(
!(
!(
!(
!(
!( !(
!(!(
!(!(
!(
!(
!(
!(
!(
!(!(
!(
!(
!(
!(
!(
!(
!(
!(
!(
!(
!(
!(
!(
!(
!(
!(!(
!(
!(
!(!(
!(
!(
!(
!(
!(
!(!(
!(
!(
!(
!(
!(
!(
!(
!(
!(
!(
!(
!(
!(
!(
!(
!(
!(
!(!(
!(
!(
!(
!(
!(
!(
!(!(
!(
!(
!(
!(
!(
!(
!(
!(
!(
!(
!(
!(
!(
!(
!(
!(
!(
!(
!(
!(
!(!(
!(!(
!(
!(
!(
!(!(
!(
!(
!(
!(
!(
!(
!(
!(
!(
!(
!(
!(
!(
!(
!(
!(
!(
!(
!(
!(
!(
!(
!(
!(
!(!(
!(
!(
!(
!(
!(
!(
!(
!(
!(
!(!(
!(
!(
!(
!(
!(
!(
!(
!(!(
!(!(
!(
!(
!(!(
!(
!(
!(
!(
!(
!(
!(
!(
!(
!(
!(
!(
!(
!(
!(
!(
!(
!(
!(
!(
!(
!(
!(
!(
!(
Drawing Title
Drawing Status
Drawing No.32102902-EIAR-A101
FinalScale @ A3
Job No.
0 0.2 0.4 0.6 0.8 1
Kilometres
This drawing is not to be used in whole in or part other than for the intended purposeand project as defined on this drawing. Refer to the contract for full terms and conditions.
1:12,500SEC7909
Drawn Check'd Appr'dPurpose of revisionRev. Date Rev'd
Legend
±
Greater Dublin Drainage Project
Project
Proposed Project Boundary
Proposed Outfall Pipeline Route (Marine Section)
Baldoyle Bay SPA
RPS estuarine survey area
!( Bar-tailed Godwit
Copyright © Ordnance Survey Ireland.Licence number 3/3/34/Irish Water.Service Layer Credits: Sources: Esri, HERE, DeLorme, USGS,Intermap, INCREMENT P, NRCan, Esri Japan, METI, Esri China(Hong Kong), Esri Korea, Esri (Thailand), MapmyIndia, NGCC, ©OpenStreetMap contributors, and the GIS User Community
W:\7
909
SE
C -
RP
S B
elfa
st, W
W E
IS N
IS O
rnith
olog
y\Te
chn
ica
l\Gra
phi
cs\G
IS\m
xd\fi
gure
s\E
S_o
rnith
\ES
_tec
hrep
\sec
7909
_A10
1_S
peci
esD
istr
ibut
ion_
Dec
2014
Mar
2018
_DD
P.m
xd
Figure A10.1 Bar-tailed Godwit Records in BaldoyleBay (Dec 2014 to March 2018)
17/10/17 Draft CH
CH RI RIInfrastructure updated1 19/03/18 KAG
0 RI RIKAG
CH RI RIAdditional survey data1 21/05/18 KAG

!(
!(
!(
!(
!(
!(
!(
!(
!(
!(
!(
!(
!(!(
!(
!(
!(
!(
!(
!(
!(
!(
!(
!( !(
!(
!(
!(
!(
!(
!(
!(
!(
!(!(
!(
!(
!(
!(
!(!(
!(
!(
!(
!(
!(!(
!(
!(
!(
!(
!(
!(
!(
!(
!(
!(
!(
!(
!(
!(
!(
!(
!(
!(
!(
!(
!(
!(
!(
!(
!(
!(
!(
!(!(
!(
!(
!(
!(
!(
!(
!(
!(
!(
!(
!(
!(!(
!(
!(
!(
!(
!(
!(
!(
!(
!(
!( !(!(
!(
!(
!(
!(
!(
!(
!( !(
!(
!(
!(
!(
!(
!(!(
!(
!(
!(
!(
!(
!(
!(
!(
!(
!(
!(
!(
!(
!(
!( !(
!(
!(
!(
!(
!(
!(
!(
!(
!(
!(
!(
!(
!(!(
!(
!(
!(
!(
!(
!(
!(
!(
!(
!(
!(
!(
!(
!(
!(
!(
!(
!(
!(!(
!(
!(
!(
!(
!(
!(
!(
!(
!(
!(
!(
!(
!(
!(
!(!(
!(
!(
!(
!(
!(
!(
!(
!(
!(
!(
!(
!(
!(
!(
!(
!(!(
!(
!(
!(
!(
!(
!(
!(
!(
!(
!(
!(
!(
!(
!(
!(
!(
!(
!(
!(
!(
!(
!(
!(
!(
!(
!(
!(
!(
!(
!(
!(
!(
!(
!(!(
!(!(
!(
!(
!(
!(
!(
!(
!(
!( !(
!(!(
!(
!(
!(
!(
!(!(
!(
!(
!(
!(
!(
!(
!(
!( !(
!(
!(
!(
!(
!(
!(
!(
!(
!(
!(
!(
!(
!(
!(
!(
!(
!(
!(
!(
!(
!(
!(
!(
!(
!(
!(
!(
!(!(
!(
!(
!(
!(
!(
!(
!(
!(
!(!(
!(
!(
!(
!(
!(
!(
!(
!(
!(
!(
!(
!(
!(
!(
!(
!( !(
!(
!(
!(
!(
!(
!(
!(
!(
!(
!(
!(
!(
!(
!(
!(
!(
!(
!(
!(
!(
!(
!(
!(
!(
!(
!(
!(
!(
!(
!(
!(
!(
!(
!(
!(
!(
!(
!(
!(
!(
!(
!(
!(
!(!(
!(!(
!(!(
!(
!(
!(!(
!(
!(
!(
!(
!(
!(
!(
!(
!(
!(
!(
!(
!(
!(
!(
!(
!(
!(
!(
!(
!(
!(
!(
!(
!(!(
!(
!(
!(
!(
!(
!(
!(
!(
!(
!(
!(
!(
!(
!(
!(
!(
!(
!(
!(
!(
!(
!(
!(
!(
!(
!(
!(!(
!(!(
!(
!(
!(
!(
!(
!(!(
!(
!(
!(
!(
Drawing Title
Drawing Status
Drawing No.32102902-EIAR-A102
FinalScale @ A3
Job No.
0 0.2 0.4 0.6 0.8 1
Kilometres
This drawing is not to be used in whole in or part other than for the intended purposeand project as defined on this drawing. Refer to the contract for full terms and conditions.
1:12,500SEC7909
Drawn Check'd Appr'dPurpose of revisionRev. Date Rev'd
Legend
±
Greater Dublin Drainage Project
Project
Proposed Project Boundary
Proposed Outfall Pipeline Route (Marine Section)
Baldoyle Bay SPA
RPS estuarine survey area
!( Brent Goose (light-bellied)
Copyright © Ordnance Survey Ireland.Licence number 3/3/34/Irish Water.Service Layer Credits: Sources: Esri, HERE, DeLorme, USGS,Intermap, INCREMENT P, NRCan, Esri Japan, METI, Esri China(Hong Kong), Esri Korea, Esri (Thailand), MapmyIndia, NGCC, ©OpenStreetMap contributors, and the GIS User Community
W:\7
909
SE
C -
RP
S B
elfa
st, W
W E
IS N
IS O
rnith
olog
y\Te
chn
ica
l\Gra
phi
cs\G
IS\m
xd\fi
gure
s\E
S_o
rnith
\ES
_tec
hrep
\sec
7909
_A10
1_S
peci
esD
istr
ibut
ion_
Dec
2014
Mar
2018
_DD
P.m
xd
Figure A10.2 Brent Goose (LB) Records in BaldoyleBay (Dec 2014 to March 2018)
17/10/17 Draft CH
CH RI RIInfrastructure updated1 19/03/18 KAG
0 RI RIKAG
CH RI RIAdditional survey data1 21/05/18 KAG

!( !(
!(
!(
!(
!(
!(
!(
!(
!(
!(
!(
!(
!(!(
!(!(
!(
!(
!(
!(
!(
!(
!(
!(
!( !(!(
!(
!(
!(
!(
!(
!(!(
!(
!(
!(
!(
Drawing Title
Drawing Status
Drawing No.32102902-EIAR-A103
FinalScale @ A3
Job No.
0 0.2 0.4 0.6 0.8 1
Kilometres
This drawing is not to be used in whole in or part other than for the intended purposeand project as defined on this drawing. Refer to the contract for full terms and conditions.
1:12,500SEC7909
Drawn Check'd Appr'dPurpose of revisionRev. Date Rev'd
Legend
±
Greater Dublin Drainage Project
Project
Proposed Project Boundary
Proposed Outfall Pipeline Route (Marine Section)
Baldoyle Bay SPA
RPS estuarine survey area
!( Golden Plover
Copyright © Ordnance Survey Ireland.Licence number 3/3/34/Irish Water.Service Layer Credits: Sources: Esri, HERE, DeLorme, USGS,Intermap, INCREMENT P, NRCan, Esri Japan, METI, Esri China(Hong Kong), Esri Korea, Esri (Thailand), MapmyIndia, NGCC, ©OpenStreetMap contributors, and the GIS User Community
W:\7
909
SE
C -
RP
S B
elfa
st, W
W E
IS N
IS O
rnith
olog
y\Te
chn
ica
l\Gra
phi
cs\G
IS\m
xd\fi
gure
s\E
S_o
rnith
\ES
_tec
hrep
\sec
7909
_A10
1_S
peci
esD
istr
ibut
ion_
Dec
2014
Mar
2018
_DD
P.m
xd
Figure A10.3 Golden Plover Records in Baldoyle Bay(Dec 2014 to March 2018)
17/10/17 Draft CH
CH RI RIInfrastructure updated1 19/03/18 KAG
0 RI RIKAG
CH RI RIAdditional survey data1 21/05/18 KAG

!(
!(
!(!(
!(
!(
!(
!(
!(
!(
!(
!(
!(
!(
!(
!(
!(
!(
!(!(
!(!(
!(
!(
!(!(
!(
!(
!(
!(
!(
!(
!(
!(
!(!(
!(
!(
!(
!(!(
!(!(!(
!(!(
!(
!(
!(
!(
!(
!(
!(
!(!(
!(
!(
!(
!(
!( !(
!(
!(
!(
!(
!(
!(
!(
!(!( !(
!(!(
!(
!(
!(
!(
!(
!(!(
!(
!(
!(
!(
!(
!(
!(
!(!(
!(
!( !(
!(
!( !(
!(!(
!(
!(!(
!(
!(
!(
!(
!(
!(
!(
!(
!(
!(!(
!(!(!(
!(
!(
!(
!(
!(
!(
!(!( !(
!(
!(!(
!(
!(
!(
!(
!(
!(
!(
!(
!(
!(
!(
!(
!(
!(
!(!(
!(
!(
!(
!(
!(
!(
!(
!(
!(!(
!(!(
!(
!(
!(
!(
!(!(!(
!(
!(
!(
!(
!(
!(
!(
!(
!(
!( !(
!(
!(
!(
!(
!(
!(
!(
!(!(
!(
!(
!(!(
!(
!(
!(
!(
!(
!(!(
!(
!(
!(!(
!(
!(
!(
!(!(!(
!(
!(
Drawing Title
Drawing Status
Drawing No.32102902-EIAR-A104
FinalScale @ A3
Job No.
0 0.2 0.4 0.6 0.8 1
Kilometres
This drawing is not to be used in whole in or part other than for the intended purposeand project as defined on this drawing. Refer to the contract for full terms and conditions.
1:12,500SEC7909
Drawn Check'd Appr'dPurpose of revisionRev. Date Rev'd
Legend
±
Greater Dublin Drainage Project
Project
Proposed Project Boundary
Proposed Outfall Pipeline Route (Marine Section)
Baldoyle Bay SPA
RPS estuarine survey area
!( Grey Plover
Copyright © Ordnance Survey Ireland.Licence number 3/3/34/Irish Water.Service Layer Credits: Sources: Esri, HERE, DeLorme, USGS,Intermap, INCREMENT P, NRCan, Esri Japan, METI, Esri China(Hong Kong), Esri Korea, Esri (Thailand), MapmyIndia, NGCC, ©OpenStreetMap contributors, and the GIS User Community
W:\7
909
SE
C -
RP
S B
elfa
st, W
W E
IS N
IS O
rnith
olog
y\Te
chn
ica
l\Gra
phi
cs\G
IS\m
xd\fi
gure
s\E
S_o
rnith
\ES
_tec
hrep
\sec
7909
_A10
1_S
peci
esD
istr
ibut
ion_
Dec
2014
Mar
2018
_DD
P.m
xd
Figure A10.4 Grey Plover Records in Baldoyle Bay(Dec 2014 to March 2018)
17/10/17 Draft CH
CH RI RIInfrastructure updated1 19/03/18 KAG
0 RI RIKAG
CH RI RIAdditional survey data1 21/05/18 KAG

!(
!(
!(
!(
!(
!(
!(
!(
!(
!(
!(
!(
!(
!(
!(
!(
!(
!(
!(
!(
!(
!(
!(
!(
!(
!(
!(
!(
!(
!(
!(
!(
!(
!(
!(
!(
!(
!(!(!(
!(
!(!(
!(
!(
!(
!(
!(
!(!(
!(
!(
!(
!( !(
!(!(
!(!(
!(
!(
!(
!(
!(
!(
!(!(
!(
!(
!(
!(!(
!(
!(
!(
!(
!(
!(
!(
!(
!(
!(
!(
!(
!(
!(
!(
!(
!(!(
!(
!(
!(
!(
!(
!(
!(
!(
!(
!(
!(
!(
!(
!(
!(
!(
!(
!(
!(
!(
!(
!(
!(!(
!(
!(
!(
!(
!(
!(
!(
!(
!(
!(
!(
!(
!(
!(
!(
!(
!(
!(
!(
!(
!( !(
!(
!(
!(
!(
!(
!(
!(
!(
!(
!(
!(
!(
!(
!(
!(
!(
!(
!(
!(
!(
!(
!(
!(
!(
!(!(
!(
!(
!(
!(
!(
!(
!(
!(
!(
!(
!(
!(
!(
!(
!(
!(
!(
!(
!(
!(
!(
!(
!(
!(
!(
!(
!(
!(
!(
!(
!(
!(
!(
!(
!(
!(
!(
!(
!(
!(!( !(
!(
!(
!(
!(
!(
!(
!(
!(
!(
!(
!(
!(
!(
!(
!(!(
!(
!(!(
!(
!(
Drawing Title
Drawing Status
Drawing No.32102902-EIAR-A105
FinalScale @ A3
Job No.
0 0.2 0.4 0.6 0.8 1
Kilometres
This drawing is not to be used in whole in or part other than for the intended purposeand project as defined on this drawing. Refer to the contract for full terms and conditions.
1:12,500SEC7909
Drawn Check'd Appr'dPurpose of revisionRev. Date Rev'd
Legend
±
Greater Dublin Drainage Project
Project
Proposed Project Boundary
Proposed Outfall Pipeline Route (Marine Section)
Baldoyle Bay SPA
RPS estuarine survey area
!( Ringed Plover
Copyright © Ordnance Survey Ireland.Licence number 3/3/34/Irish Water.Service Layer Credits: Sources: Esri, HERE, DeLorme, USGS,Intermap, INCREMENT P, NRCan, Esri Japan, METI, Esri China(Hong Kong), Esri Korea, Esri (Thailand), MapmyIndia, NGCC, ©OpenStreetMap contributors, and the GIS User Community
W:\7
909
SE
C -
RP
S B
elfa
st, W
W E
IS N
IS O
rnith
olog
y\Te
chn
ica
l\Gra
phi
cs\G
IS\m
xd\fi
gure
s\E
S_o
rnith
\ES
_tec
hrep
\sec
7909
_A10
1_S
peci
esD
istr
ibut
ion_
Dec
2014
Mar
2018
_DD
P.m
xd
Figure A10.5 Ringed Plover Records in Baldoyle Bay(Dec 2014 to March 2018)
17/10/17 Draft CH
CH RI RIInfrastructure updated1 19/03/18 KAG
0 RI RIKAG
CH RI RIAdditional survey data1 21/05/18 KAG

!(
!(
!(
!(!(
!(!(
!(
!(
!(
!(
!(
!(
!(
!(
!(
!(
!(
!(
!(
!(
!(
!(
!(
!(
!(
!(
!(!(
!(
!(
!(
!(
!(
!(
!(
!(
!(
!(!(
!( !(
!(
!(
!(
!(!(
!(
!(
!(!(
!(
!(
!(!(
!(
!( !(
!(
!(
!(
!(!(
!(!(
!(
!(!(
!(
!(
!(
!(
!(!(
!(
!(
!(
!(
!(
!(!(!(
!(
!(
!(
!(
!(
!(
!(
!(
!(
!(!(
!(
!(
!(
!(
!(
!(
!(
!(
!(
!(
!(
!(
!(
!(
!(
!(
!(
!(
!(
!(
!(
!(
!(
!(
!(!(
!(!(
!(!(
!(
!(
!(
!(
!(!( !(
!(
!(
!(
!(!(
!(!(
!(
!(
!(
!(
!(
!(
!(
!(!(
!(
!(
!(
!(!(
!(
!(
!(
!(!(
!(!(
!(
!(
!(
!(
!(
!(
!(
!(
!(
!(
!(
!(
!(
!(!(!(
!(
!(
!(
!( !(
!(
!(
!(!(
!( !(
!(
!(
!(
!(
!(
!(
!(!(
!(
!(
!(
!(
!(
!(
!(!(
!(
!(
!(
!(
!(
!(
!(
!(
!(
!(
!(!(!(
!(
!(
!(
!(
!(!(
!(
!(!(
!(
!(
!(
!(
!(!(
!(
!(
!(
!(!(!(
!(
!(!(
!(
!(!(
!(
!(
!(!(!(
!(
!(
!(
!(
!(
!(
!(
!(
!(
!(!(
!(
!( !(!(
!(
!(
!(!(
!(
!(
!(
!(
!(
!(
!(!(!(
!(
!(
!( !(
!(!(!(
!(
!(
!(
!(!(
!(
!(
!(
!(
!(
!(!(
!(!(
!(
!(
!(
!(!(
!(
!(
!(
!(!(
!(
!(!(
!(
!(
!(
!(
!(!(
!(
!(!(
!(
!(!(
!(
!(
!(
!(!(
!(
!(!(!(
!(
!(!(
!(!(
!(
!(
!(!(
!(
!(
!(
!(!(
!(
!(!(
!(
!(
!(
!(
!(
!(
!(
!(
!(
!(
!( !(
!(
!(
!(
!(
!(
!(
!(
!(
!(
!(!(
!(
!(
!(
!(!(
!(
!(
!(
!(!(
!(
!(
!(
!(!(
!(
!(
!(
!(
!(
!(!(
!(
!(
!(
!(
!(
!(!(
!(!(
!(
!(
!(
!(
!(
!(
!(
!(
!(
!(
!(
!(
!(
!( !(
!(
!(
!(
!(
!(
!(
!(
!(
!(
!(
!(
!(
!(
!(
!(
!(
!(
!( !(!(
!(
!(
!(
!(
!(!( !(!(
!(
!(
!( !(
!(!(
!(!(
!(
!(
!(
!(
!(
!(!(
!(!(
!(!(
!(
!(!(
!(
!(
!(
!(
!(
!(
!(
!(
!(
!(
!(
!(
!(
!(
!(
!(
!(
!(
!(
!(
!(
!(
!(!(
!(
!(
!(
!(
!(
!(
!(
!(
!(
!(
!(
!(
!(
!(
!(!(
!(
!(
!(
!(
!(
!(
!(
!(
!(
!(
!(
!(
!(!(
!(
!(
!(
!(!(
!(
!(
!(!(
!(
!(
!(
!(
!(
!(
!(
!(
!(
!(
!(
!(
!(
!(!(
!(
!(
!(
!(
!(
!(
!(
!(
!(
!(
!(
!(
!(
!(
!(
!(
!(
!(
!(
!(
!(!(
!(
!(
!(!(
!(
!(
!(
!(!(!(
!(
!(
!(
!(
!(
!(
!(
!(
!(
!(
!(
!(
!(
!(!(
!(
!(
!(
!(
!(
!(
!(!(
!(
!(
!(
!(
!(
!(
!(
!(
!(
!(
!(
!(
!(
!(
!(
!(
!(
!(
!(
!(
!(
!(
!(
!(
!(!(
!(
!(
!(
!(!(
!(
!(
!(
!(!(
!(
!(
!(
!(
!(
!(
!(
!(
!(
!(
!(
!(
!(
!(
!(
!(
!(
!(
!(
!(
!(
!(
!(
!(
!(
!(
!(
!(
!(!(
!(
!(
!(
!(
!(
!(
!(!(
!(
!(
!(
!(
!(
!(
!(
!(!( !(
!(
!(
!(
!(!(
!(
!(
!(
!(
!(
!(
!(
!(
!(
!(
!(
!(
!(
!(
!(
!(
!(
!(
!(
!(
!(
!(
!(
!(
!(
!(
!(
!(
!(
!(
!(
!(
!(
!(
!(
!(!(!(
!(
!(
!(
!(
!(
!(
!(
!(
!(
!(
!(
!(
!(
!(!(
!(
!(
!(
!(
!(
!(
!(
!(!(
!(!(
!(
!(
!(
!(
!(!(
!(
!(!(
!(
!(
!(
!(!(
!(
!(
!(
!(
!(
!(!(
!(
!(
!(
!(
!(
!(
!(
!(
Drawing Title
Drawing Status
Drawing No.32102902-EIAR-A106
FinalScale @ A3
Job No.
0 0.2 0.4 0.6 0.8 1
Kilometres
This drawing is not to be used in whole in or part other than for the intended purposeand project as defined on this drawing. Refer to the contract for full terms and conditions.
1:12,500SEC7909
Drawn Check'd Appr'dPurpose of revisionRev. Date Rev'd
Legend
±
Greater Dublin Drainage Project
Project
Proposed Project Boundary
Proposed Outfall Pipeline Route (Marine Section)
Baldoyle Bay SPA
RPS estuarine survey area
!( Shelduck
Copyright © Ordnance Survey Ireland.Licence number 3/3/34/Irish Water.Service Layer Credits: Sources: Esri, HERE, DeLorme, USGS,Intermap, INCREMENT P, NRCan, Esri Japan, METI, Esri China(Hong Kong), Esri Korea, Esri (Thailand), MapmyIndia, NGCC, ©OpenStreetMap contributors, and the GIS User Community
W:\7
909
SE
C -
RP
S B
elfa
st, W
W E
IS N
IS O
rnith
olog
y\Te
chn
ica
l\Gra
phi
cs\G
IS\m
xd\fi
gure
s\E
S_o
rnith
\ES
_tec
hrep
\sec
7909
_A10
1_S
peci
esD
istr
ibut
ion_
Dec
2014
Mar
2018
_DD
P.m
xd
Figure A10.6 Shelduck Records in Baldoyle Bay (Dec2014 to March 2018)
17/10/17 Draft CH
CH RI RIInfrastructure updated1 19/03/18 KAG
0 RI RIKAG
CH RI RIAdditional survey data1 21/05/18 KAG
!(!(
!(
!(
!(
!(
!(
!( !(
!(
!(
!(
!(
!(
!(
!(
!(!(
!(
!(
!(
!(
!(
!(
!(
!(
!(
!(
!(
!(
!(
!(
!(
!(
!(
!(
!(
!(
!(!(
!(
!(
!(
!(
!(
!(
!(
!(
!(!(
!(!(
!(!(
!(!(
!(!(
!(
!(
!(
!(
!(
!(
!(
!(
!(
!(
!(
!(
!(
!(!(
!(!(
!(
!(
!(
!(
!(
!(
!(
!(
!(
!( !(
!(
!(
!(
!(
!(
!(
!(!(
!(
!(
!(
!(!(
!(
!(
!(
!(
!(
!(
!(
!(
!(
!(
!(
!(
!(
!(
!(
!(
!(
!(
!(
!(
!(
!(
!(
!(
!(
!(
!(
!(
!(
!(
!(
!(
!(
!(
!(
!(
!(
!(
!(
!(
!(
!(
!(
!(
!(
!(
!(
!(
!(
!(!(
!(
!(
!(
!(
!(
!(
!(
!(
!(
!(
!(
!(
!(
!(
!(
!(
!(
!(
!(
!(
!(
!(
!(
!(
!(
!(
!(
!(
!(!(!(
!(
!(
!(
!(
!(
!(
!(
!(
!(
!(
!(
!(
!(
!(
!(
!(
!(
!(
!(
!(
!(
!(!(
!(
!(
!(
!(
!(
!(
!(
!(!(
!(
!(
!(
!(
!(
!(
!(
!(
!(!(
!(
!(
!(
!(
Drawing Title
Drawing Status
Drawing No.32102902-EIAR-A107
FinalScale @ A3
Job No.
0 0.2 0.4 0.6 0.8 1
Kilometres
This drawing is not to be used in whole in or part other than for the intended purposeand project as defined on this drawing. Refer to the contract for full terms and conditions.
1:12,500SEC7909
Drawn Check'd Appr'dPurpose of revisionRev. Date Rev'd
Legend
±
Greater Dublin Drainage Project
Project
Proposed Project Boundary
Proposed Outfall Pipeline Route (Marine Section)
Baldoyle Bay SPA
RPS estuarine survey area
!( Black-tailed Godwit
!( Bluethroat
Copyright © Ordnance Survey Ireland.Licence number 3/3/34/Irish Water.Service Layer Credits: Sources: Esri, HERE, DeLorme, USGS,Intermap, INCREMENT P, NRCan, Esri Japan, METI, Esri China(Hong Kong), Esri Korea, Esri (Thailand), MapmyIndia, NGCC, ©OpenStreetMap contributors, and the GIS User Community
W:\7
909
SE
C -
RP
S B
elfa
st, W
W E
IS N
IS O
rnith
olog
y\Te
chn
ica
l\Gra
phi
cs\G
IS\m
xd\fi
gure
s\E
S_o
rnith
\ES
_tec
hrep
\sec
7909
_A10
1_S
peci
esD
istr
ibut
ion_
Dec
2014
Mar
2018
_DD
P.m
xd
Figure A10.7 Black-tailed Godwit Records in BaldoyleBay (Dec 2014 to March 2018)
17/10/17 Draft CH
CH RI RIInfrastructure updated1 19/03/18 KAG
0 RI RIKAG
CH RI RIAdditional survey data1 21/05/18 KAG

!(
!(
!(
!(
!(
!(
!(
!(
!(
!( !(
!(
!(
!(
!(
!(
!(
!(
!(
!(
!(
!(
!(
!(
!(
!(
!(
!(
!(
!(
!(
!(
!(
!(
!(
!(
!(
!(
!(
!(
!(
!(
!(
!(
!(!(
!(
!(
!(
!(
!(
!(
!(
!(
!(
!(
!(
!(
!(
!(
!(
!(!(!(!(!(
!(
!(
!(
!(
!(
!(
!(
!(
!(
!(
!(
!(!(
!(
!(
!(
!(
!(
!(
!(
!(
!(
!(
!(
!(
!(
!(
!(
!(
!(
!(!(
!(
!(
!(!(
!(
!(!(
!(
!(
!(!(
!(
!( !(
!(
!(
!(
!(
!(!(
!(!(
!(
!(
!(
!(
!(
!(!(
!(
!(
!(!(
!(
!(
!(!(
!(
!(!(
!(
!(
!(
!(
!( !(
!(
!(
!(
!(
!(
!(
!(
!(
!(
!(
!(
!(
!(
!(
!(
!(
!(
!(
!(
!(!(!(
!(
!(!(
!(
!(
!( !(!(
!(!(
!(!(
!(
!(
!(!(!(
!(
!(
!(
!(
!(
!(
!(
!(
!(!(
!(
!(
!(
!(
!(
!(!(
!(!(
!(
!(!(
!(
!(
!(
!(
!(
!(!(
!(!(
!(
!(
!(
!(
!(
!(
!(!(
!(
!(
!(
!(
!(
!(!(
!(
!(
!(!(
!(!(
!(
!(
!(
!(
!(!(
!(!(
!(
!(
!(
!(
!(
!(
!(
!(
!(!(
!(!(
!(
!(!(!(!(
!(
!(!(
!(
!(
!(
!(
!(!(
!(
!(
!(
!(
!(
!(
!(
!(
!(
!(
!(
!(
!(
!(
!(
!(
!(
!(
!(
!(
!(!(
!( !(!(
!(
!(
!(
!(
!(
!(
!(
!(!(
!(
!(
!(
!(
!( !(!(
!(
!(!(!(
!(!(
!(
!(
!(
!(
!(
!(
!(
!(
!(
!(
!( !(
!(
!(
!(
!(
!(
!(
!(
!(
!(
!(
!(
!(
!(
!(
!(
!(
!(
!(
!(
!(!(
!(
!(
!(
!(
!(
!(
!(
!(
!(!(
!( !(!(
!(
!(
!(!(
!(
!(
!(
!(
!(
!(!(
!(
!(
!(
!(
!(
!(!(
!(!(
!(
!(
!(!(
!(
!(
!(
!(
!(!(
!(
!(
!(
!(
!(
!(
!(!(
!(
!(
!(
!(
!(
!(
!(
!(
!(
!(
!( !(
!(
!(!(
!(!(
!(
!(
!(
!(
!(!(
!(
!(
!(!(
!(
!(
!(
!(
!(!(
!(
!(
!(
!(
!(
!(
!(
!(
!(
!(
!(
!(
!(
!(
!(
!(!(
!(
!(
!(
!(
!(!(
!(
!(
!(
!(
!(
!(
!(
!(!(
!(
!(
!(
!(
!(
!(
!(
!(
!(
!(
!(
!(
!(!(
!(
!(
!(!(
!( !(
!(
!(
!(
!(
!(
!(
!(!(
!(
!(
!(
!(
!(
!(
!(!(
!(
!(
!(!(
!(!(
!(
!(
!(!(
!(
!(
!(
!(!(
!(
!(
!(!(
!(
!(
!(
!(
!(
!(
!(!(
!(
!(
!(
!(
!(
!(
!(
!(
!(!(
!(
!(
!(
!(
!(
!(
!(
!(
!(
!(
!(
!(
!(
!(
!(
!(
!(
!(
!(
!(
!(
!(
!(
!(
!(
!(
!(
!(
!(
!(
!(
!( !(
!(
!(
!(
!(
!(
!(!(
!(!(
!(
!(
!(
!(
!(
!(
!(
!(
!(
!(!(
!(
!(
!(
!(!(
!(
!(
!(!(
!(
!(
!(
!(
!(
!(
!(
!(
!(
!(
!(!(
!(
!(
!(
!(
!(
!(
!(
!(
!(
!(
!(!(
!(
!(
!(!(
!(
!(
!(
!(
!(!(
!(
!(
!(!(
!(
!(
!(
!(!(
!(
!(
!(
!(
!( !(
!(
!(
!(
!(
!(
!(
!(
!(
!(
!(
!(
!(
!(
!(!(
!(
!(
!(
!(
!(
!(
!(!(!(
!(
!(
!(
!(
!(
!(!( !(
!(
!(
!(!(
!(!(
!(
!(!(
!(
!(
!(
!(
!(
!(
!(!(
!(
!( !(
!(!(
!( !(
!(
!(
!(
!(
!(
!(
!(
!(
!(
!(!(
!(
!(!(
!(!(!(
!(
!(
!(
!(!(
!(
!(
!(
!(
!( !(
!(!(
!( !(
!(
!(
!(
!(
!(
!(
!(
!(
!(
!(!(
!(!(
!(
!(
!(
!(
!(
!(
!(!(
!(
!(
!(
!(
!(
!(
!(
!(!(
!( !(!(
!(
!(
!(!(
!(
!(
!(
!(
!(
!(
!(
!(
!(
!(
!(
!(
!(!(
!(!(
!(
!(
!(
!(
!(
!( !(
!(
!(!(
!(
!(
!(
!(
!(
!(
!(
!(!(
!(
!(
!(
!(
!(
!( !(
!(
!(!(
!(
!(
!(
!(
!(
!(
!(
!(
!(
!(
!(
!(
!(
!(
!(
!(!(!(
!(
!(
!(
!(
!(
!(
!(
!(
!(!(
!(
!(
!(
!(
!(
!(
!(
!(!(
!(
!(
!(
!(
!(
!(!(
!(
!(
!(!(
!(
!(
!(
!(
!(
!(
!(
!(
!(
!(!(
!(
!(!(
Drawing Title
Drawing Status
Drawing No.32102902-EIAR-A108
FinalScale @ A3
Job No.
0 0.2 0.4 0.6 0.8 1
Kilometres
This drawing is not to be used in whole in or part other than for the intended purposeand project as defined on this drawing. Refer to the contract for full terms and conditions.
1:12,500SEC7909
Drawn Check'd Appr'dPurpose of revisionRev. Date Rev'd
Legend
±
Greater Dublin Drainage Project
Project
Proposed Project Boundary
Proposed Outfall Pipeline Route (Marine Section)
Baldoyle Bay SPA
RPS estuarine survey area
!( Curlew
Copyright © Ordnance Survey Ireland.Licence number 3/3/34/Irish Water.Service Layer Credits: Sources: Esri, HERE, DeLorme, USGS,Intermap, INCREMENT P, NRCan, Esri Japan, METI, Esri China(Hong Kong), Esri Korea, Esri (Thailand), MapmyIndia, NGCC, ©OpenStreetMap contributors, and the GIS User Community
W:\7
909
SE
C -
RP
S B
elfa
st, W
W E
IS N
IS O
rnith
olog
y\Te
chn
ica
l\Gra
phi
cs\G
IS\m
xd\fi
gure
s\E
S_o
rnith
\ES
_tec
hrep
\sec
7909
_A10
1_S
peci
esD
istr
ibut
ion_
Dec
2014
Mar
2018
_DD
P.m
xd
Figure A10.8 Curlew Records in Baldoyle Bay (Dec2014 to March 2018)
17/10/17 Draft CH
CH RI RIInfrastructure updated1 19/03/18 KAG
0 RI RIKAG
CH RI RIAdditional survey data1 21/05/18 KAG

!(
!(
!(
!(
!(
!(
!(
!(
!(
!(
!(
!(
!(
!(
!(
!(
!(
!(
!(
!(
!(!(
!(
!(
!(
!(
!(
!(
!(
!(
!(
!(
!(
!(
!(
!(
!(
!(
!(
!(
!(
!(
!(
!(
!(
!(
!(
!(
!(
!(
!(
!(
!(
!(
!(!(
!(
!(
!(
!(
!(
!(
!(
!(
!(
!(
!(
!(
!(
!( !(
!(
!(
!(
!(
!(
!(
!(
!(
!(
!(!(
!(!(
!(
!(
!(
!(
!(
!(
!(
!(
!(
!(
!(
!(
!(
!(
!(
!(
!(
!(
!(
!(
!(
!(
!(
!( !(
!(
!(
!(
!(
!(
!(
!(
!(
!(
!(
!(
!(
!(
!(
!(
!(
!(
!(
!(
!(
!(
!(!(
!(
!(!(
!(
!(
!(
!(
!(
!(
!(
!(
!(
!(
!(
!(
!(
!(
!(
!(
!(
!(
!(
!(
!(!(
!(
!(
!(
!(
!(
!(
!(
!(
!(
!(
!(
!(
!(
!(
!(
!(!(
!(
!(
!(
!(
!(!(
!(
!(!(
!(
!(
!(
!(
!(
!(
!(
!(
!(
!(!(
!(
!(
!(
!(
!(
!(
!(
!(
!(
!(
!( !(
!(
!(
!(
!(
!(
!(
!(
!(
!(
!(
!(
!(
!(
!(
!(!(
!(
!(
!(
!(!(
!(
!(
!(!(
!(
!(
!(
!(
!(
!(
!(
!(
!(
!(
!(
Drawing Title
Drawing Status
Drawing No.32102902-EIAR-A109
FinalScale @ A3
Job No.
0 0.2 0.4 0.6 0.8 1
Kilometres
This drawing is not to be used in whole in or part other than for the intended purposeand project as defined on this drawing. Refer to the contract for full terms and conditions.
1:12,500SEC7909
Drawn Check'd Appr'dPurpose of revisionRev. Date Rev'd
Legend
±
Greater Dublin Drainage Project
Project
Proposed Project Boundary
Proposed Outfall Pipeline Route (Marine Section)
Baldoyle Bay SPA
RPS estuarine survey area
!( Dunlin
Copyright © Ordnance Survey Ireland.Licence number 3/3/34/Irish Water.Service Layer Credits: Sources: Esri, HERE, DeLorme, USGS,Intermap, INCREMENT P, NRCan, Esri Japan, METI, Esri China(Hong Kong), Esri Korea, Esri (Thailand), MapmyIndia, NGCC, ©OpenStreetMap contributors, and the GIS User Community
W:\7
909
SE
C -
RP
S B
elfa
st, W
W E
IS N
IS O
rnith
olog
y\Te
chn
ica
l\Gra
phi
cs\G
IS\m
xd\fi
gure
s\E
S_o
rnith
\ES
_tec
hrep
\sec
7909
_A10
1_S
peci
esD
istr
ibut
ion_
Dec
2014
Mar
2018
_DD
P.m
xd
Figure A10.9 Dunlin Records in Baldoyle Bay (Dec2014 to March 2018)
17/10/17 Draft CH
CH RI RIInfrastructure updated1 19/03/18 KAG
0 RI RIKAG
CH RI RIAdditional survey data1 21/05/18 KAG

!(
!(
!(
!(
!(
!(
!(
!(
!(
!(
!(
!(
!(
!(
!(
!(
!(
!(
!(
!(
!(
!(
!(
!(
!(
!(
!(
!(
!(
!(
!(
!(
!(
!(
!(
!(
!(
!(
!(
!(
!(
!(
!(
!(
!(
!(
!(
!(
!(
!(
!(
!(
!(
!(
!(
!(
!(
!(
!(
!(
!(
!(
!(
!(
!(
!(
!(
!(
!(
!(
!(
!(
!(
!(
!(
!(
!(
!(
!(
!(
!(
!(
!(
!(
!(
!(
!(
!(
!(
!(
!(
!(
!(
!(
!(
!(
!(
!(
!(
!(
!(
!(
!(
!(
!(
!(
!(
!(
!(
!(
!(
!(
!(
!(
!(
!(
!(
!(
!(
!(!(
!(
!(
!(
!(
!(
!(
!(
!(
!(
!(
!(
!(
!(
!(
!(
!(
!(
!(
!(
!(
!(
!(
!(
!(
!(
!(
!(
!(
!(
!(
!(
!(
!(
!(
!(
!(
!(
!(
!(
!(
!(
!(
!(
!(
!(
!(
!(
Drawing Title
Drawing Status
Drawing No.32102902-EIAR-A1010
FinalScale @ A3
Job No.
0 0.2 0.4 0.6 0.8 1
Kilometres
This drawing is not to be used in whole in or part other than for the intended purposeand project as defined on this drawing. Refer to the contract for full terms and conditions.
1:12,500SEC7909
Drawn Check'd Appr'dPurpose of revisionRev. Date Rev'd
Legend
±
Greater Dublin Drainage Project
Project
Proposed Project Boundary
Proposed Outfall Pipeline Route (Marine Section)
Baldoyle Bay SPA
RPS estuarine survey area
!( Great Crested Grebe
!( Green Woodpecker
Copyright © Ordnance Survey Ireland.Licence number 3/3/34/Irish Water.Service Layer Credits: Sources: Esri, HERE, DeLorme, USGS,Intermap, INCREMENT P, NRCan, Esri Japan, METI, Esri China(Hong Kong), Esri Korea, Esri (Thailand), MapmyIndia, NGCC, ©OpenStreetMap contributors, and the GIS User Community
W:\7
909
SE
C -
RP
S B
elfa
st, W
W E
IS N
IS O
rnith
olog
y\Te
chn
ica
l\Gra
phi
cs\G
IS\m
xd\fi
gure
s\E
S_o
rnith
\ES
_tec
hrep
\sec
7909
_A10
1_S
peci
esD
istr
ibut
ion_
Dec
2014
Mar
2018
_DD
P.m
xd
Figure A10.10 Great Crested Grebe Records inBaldoyle Bay (Dec 2014 to March 2018)
17/10/17 Draft CH
CH RI RIInfrastructure updated1 19/03/18 KAG
0 RI RIKAG
CH RI RIAdditional survey data1 21/05/18 KAG

!(
!(
!(
!(
!(
!(
!(
!(
!(
!(
!(
!(
!(
!(
!(
!(
!(
!(
!(
!(
!(
!(
!(!(
!(
!(!(
!(
!(
!(
!(
!(
!(
!(
!(
!(
!(
!(
!(
!(
!(
!(
!(
!(
!(
!(
!(
!(
!(
!(
!(
!(!(
!(
!(
!(
!(
!(
!(
!(
!(!(
!(
!(
!(
!(
!(
!( !(
!(
!(
!(
!(
!(
!(
!( !(
!(
!(
!(
!(
!(
!(
!(
!(
!(
!(
!(
!(
!(
!(
!(
!(
!(
!(
!(
!(
!(
!(
!(
!(
!(
!(
!(
!(
!(
!(
!(
!(
!(
!(
!(
!(
!(
!(
!(
!(
!(
!(!(
!(
!(
!(!(
!(
!(
!(
!(
!(
!(
!(
!(
!(
!(
!(
!(
Drawing Title
Drawing Status
Drawing No.32102902-EIAR-A1011
FinalScale @ A3
Job No.
0 0.2 0.4 0.6 0.8 1
Kilometres
This drawing is not to be used in whole in or part other than for the intended purposeand project as defined on this drawing. Refer to the contract for full terms and conditions.
1:12,500SEC7909
Drawn Check'd Appr'dPurpose of revisionRev. Date Rev'd
Legend
±
Greater Dublin Drainage Project
Project
Proposed Project Boundary
Proposed Outfall Pipeline Route (Marine Section)
Baldoyle Bay SPA
RPS estuarine survey area
!( Greenshank
Copyright © Ordnance Survey Ireland.Licence number 3/3/34/Irish Water.Service Layer Credits: Sources: Esri, HERE, DeLorme, USGS,Intermap, INCREMENT P, NRCan, Esri Japan, METI, Esri China(Hong Kong), Esri Korea, Esri (Thailand), MapmyIndia, NGCC, ©OpenStreetMap contributors, and the GIS User Community
W:\7
909
SE
C -
RP
S B
elfa
st, W
W E
IS N
IS O
rnith
olog
y\Te
chn
ica
l\Gra
phi
cs\G
IS\m
xd\fi
gure
s\E
S_o
rnith
\ES
_tec
hrep
\sec
7909
_A10
1_S
peci
esD
istr
ibut
ion_
Dec
2014
Mar
2018
_DD
P.m
xd
Figure A10.11 Greenshank Records in Baldoyle Bay(Dec 2014 to March 2018)
17/10/17 Draft CH
CH RI RIInfrastructure updated1 19/03/18 KAG
0 RI RIKAG
CH RI RIAdditional survey data1 21/05/18 KAG
!(
!(
!(
!(
!(!(
!(
!(
!(
!(
!(
!(
!(!(
!(
!(
!(
!(
!(
!(
!(
!(
!(
!(!(
!(
!(
!(
!(
!(
!(
!(
!(
!(!(
!(
!(
!(
!(
!(
!(
!(
!(
!(
!(!(
!(!(
!(
!(
!(
!(
!(!(
!(!(
!(
!(
!(
!(
!(!( !(
!(
!(
!(
!(
!(
!(
!(
!(
!(
!(
!(
!(!(
!(
!(
!(
!(
!(
!(
!(
!(
!(
!(!(!(
!(
!(
!(
!(
!(
!(
!(!(
!(
!(!(!( !(
!(
!(
!(
!(
!(!(
!(
!(
!(
!(
!(!(
!(
!(
!(
!(
!(!(
!(!(
!(
!(
!(
!(!(
!(
!(
!(
!(!(
!( !(!(!(!(
!(
!(
!(
!(
!(
!(!(
!(
!(
!(
!(
!(
!(
!(
!(
!(!(
!(
!(
!(!(
!(
!( !(
!(
!(
!(
!(
!(!(
!(
!( !(!(
!(
!(
!(
!(!(
!(
!(
!(
!(
!(
!(
!(
!(
!(
!(
!(
!(
!(
!(
!(
!(
!(
!(
!(
!(
!(
!(
!(
!(
!(
!(
!(
!(
!(
!(
!(
!(
!(
!(
!(
!(
!(
!(
!(
!(
!(
!(
!(
!(
!(
!(
!(
!(
!(
!(
!(
!(
!(!(
!(!(
!(!(
!(
!(
!(
!(
!(
!(
!(
!(
!(
!(
!(
!(
!(
!(
!(
!(
!(
!(
!(
!(
!(
!(
!(
!(
!(
!(
!(
!(
!(
!(
!(
!(
!(
!(
!(
!(
!(
!(
!(
!(!(
!(
!(
!(
!(
!(
!(
!(
!(
!(
!(
!(
!(
!(
!(!(
!(
!(!(
!(
!(!(
!(
!(
!(
!(
!(
!(
!(
!(!(
!(
!(
!(
!(
!(!(
!(
!(
!(
!(
!(
!(
!(
!(!(
!(
!(
!(
!(
!(
!(
!(!(
!(
!(!(
!(
!(
!(
!(
!(
!(
!(
!(
!(!(
!(
!(!(
!(
!(
!(
!(
!(
!( !(
!(
!(
!(
!(
!(
!(
!(!(
!(
!(
!(
!(
!(
!(!(
!(
!(
!(
!(
!(
!(
!(
!(
!(
!(
!(
!(
!(
!(
!(
!(
!(
!(
!(
!(
!(
!(
!(
!(
!(
!(!(
!(
!(
!(
Drawing Title
Drawing Status
Drawing No.32102902-EIAR-A1012
FinalScale @ A3
Job No.
0 0.2 0.4 0.6 0.8 1
Kilometres
This drawing is not to be used in whole in or part other than for the intended purposeand project as defined on this drawing. Refer to the contract for full terms and conditions.
1:12,500SEC7909
Drawn Check'd Appr'dPurpose of revisionRev. Date Rev'd
Legend
±
Greater Dublin Drainage Project
Project
Proposed Project Boundary
Proposed Outfall Pipeline Route (Marine Section)
Baldoyle Bay SPA
RPS estuarine survey area
!( Grey Heron
Copyright © Ordnance Survey Ireland.Licence number 3/3/34/Irish Water.Service Layer Credits: Sources: Esri, HERE, DeLorme, USGS,Intermap, INCREMENT P, NRCan, Esri Japan, METI, Esri China(Hong Kong), Esri Korea, Esri (Thailand), MapmyIndia, NGCC, ©OpenStreetMap contributors, and the GIS User Community
W:\7
909
SE
C -
RP
S B
elfa
st, W
W E
IS N
IS O
rnith
olog
y\Te
chn
ica
l\Gra
phi
cs\G
IS\m
xd\fi
gure
s\E
S_o
rnith
\ES
_tec
hrep
\sec
7909
_A10
1_S
peci
esD
istr
ibut
ion_
Dec
2014
Mar
2018
_DD
P.m
xd
Figure A10.12 Grey Heron Records in Baldoyle Bay(Dec 2014 to March 2018)
17/10/17 Draft CH
CH RI RIInfrastructure updated1 19/03/18 KAG
0 RI RIKAG
CH RI RIAdditional survey data1 21/05/18 KAG
!(!(
!(
!(
!( !(
!(
!(
!(!(
!(
!(
!(
!(
!(
!(
!(!(
!(!(
!(
!(
!(
!(
!(
!(
!(
!(
!(
!(
!(
!(
!(
!(
!(
!(
!(
!(
!(
!(
!(
!(
!(
Drawing Title
Drawing Status
Drawing No.32102902-EIAR-A1013
FinalScale @ A3
Job No.
0 0.2 0.4 0.6 0.8 1
Kilometres
This drawing is not to be used in whole in or part other than for the intended purposeand project as defined on this drawing. Refer to the contract for full terms and conditions.
1:12,500SEC7909
Drawn Check'd Appr'dPurpose of revisionRev. Date Rev'd
Legend
±
Greater Dublin Drainage Project
Project
Proposed Project Boundary
Proposed Outfall Pipeline Route (Marine Section)
Baldoyle Bay SPA
RPS estuarine survey area
!( Knot
Copyright © Ordnance Survey Ireland.Licence number 3/3/34/Irish Water.Service Layer Credits: Sources: Esri, HERE, DeLorme, USGS,Intermap, INCREMENT P, NRCan, Esri Japan, METI, Esri China(Hong Kong), Esri Korea, Esri (Thailand), MapmyIndia, NGCC, ©OpenStreetMap contributors, and the GIS User Community
W:\7
909
SE
C -
RP
S B
elfa
st, W
W E
IS N
IS O
rnith
olog
y\Te
chn
ica
l\Gra
phi
cs\G
IS\m
xd\fi
gure
s\E
S_o
rnith
\ES
_tec
hrep
\sec
7909
_A10
1_S
peci
esD
istr
ibut
ion_
Dec
2014
Mar
2018
_DD
P.m
xd
Figure A10.13 Knot Records in Baldoyle Bay (Dec2014 to March 2018)
17/10/17 Draft CH
CH RI RIInfrastructure updated1 19/03/18 KAG
0 RI RIKAG
CH RI RIAdditional survey data1 21/05/18 KAG

!(
!(
!(
!(
!(
!(
!(
!(!(
!(
!(
!(
!(
!(
!(
!(
!(
!(
!(
!(
!(
!(!(
!(
!(
!(
!(!(!(
!(
!(
!(
!(
!(
!(
!( !(!(
!(!(
!(
!(
!(
!( !(
!(
!(
!(
!(!(
!(!(
!(!(
!(!(
!(!(!(
!(
!(
!(
!(!( !(
!(
!(
!( !(!(
!(
!(
!(
!(
!(
!(
!(
!(!(
!(
!(
!(
!(!( !(!(!(
!(
!( !(
!(
!(
!(
!(
!(
!(
!(
!(
!(
!(
!(
!(
!(
!(
!(
!(
!(!(
!(
!(
!(
!(
!(
!(
!(
!(
!(
!(
!(
!(
!(
!(
!(
!(
!(
!(
!(
!(
!(
!(
!(
!(!(
!(
!(
!(
!(
!(
!(
!(
!(
!(
!(
!(
!(
!(
!(
!(
!(
!(
!(
!(
!(!(
!(
!(
!(
!(
!(
!(
!(
!(
!(
!(
!(
!(
!(
!(
!(!(
!(
!(
!(
!(
!(
!(
!(
!(
!(
!(
!(
!(!(
!(
!(
!(
!(
!(
!(
!(
!(
!(
!(
!(
!(
!(
!(
!(
!(
!(
!(
!(
!(
!( !(
!(
!(
!(
!(
!(
!( !(
!(
!(
!(
!(
!(
!(
!(
!(
!(
!(
!(
!(
!(
!(
!(
!(
!(
!(
!(
!(
!(!(
!(
!(!(
!(
!(
!(
!(
!(
!(!(
!(
!(
!(
!(
!(
!(
!(
!(
!(
!(
!(
!(
!(
!(
!(
!(!(
!(
!(
!(
!(
!(
!(
!(
!(
!(
!(
!(
!(
!(
!(
!(
!(
!(
!(
!(
!(
!(!(
!(
!(
!(
!(
!(
!(
!(
!(
!(
!(
!(
!(
!(
!(
!(
!( !(
!(
!(
!(
!(
!(!(
!(
!(
!(
!(
!(
!(
!(
!(
!(
!(
!(!(
!(!(
!(!( !(
!(
!(
!(
!(
!(
!(
!(
!(
!(
!(
!(
!(!(
!(
!(
!(
!(
!(!(
!(
!(
!(
!(
!(
!(
!(!(
!(
!(
!(
!(
!(
!(
!(
!(
!(
!(
!(
!(
!(
!(
!(
!(
!(
!(
!(
!(
!(
!(!(
!(
!(
Drawing Title
Drawing Status
Drawing No.32102902-EIAR-A1014
FinalScale @ A3
Job No.
0 0.2 0.4 0.6 0.8 1
Kilometres
This drawing is not to be used in whole in or part other than for the intended purposeand project as defined on this drawing. Refer to the contract for full terms and conditions.
1:12,500SEC7909
Drawn Check'd Appr'dPurpose of revisionRev. Date Rev'd
Legend
±
Greater Dublin Drainage Project
Project
Proposed Project Boundary
Proposed Outfall Pipeline Route (Marine Section)
Baldoyle Bay SPA
RPS estuarine survey area
!( Lapwing
Copyright © Ordnance Survey Ireland.Licence number 3/3/34/Irish Water.Service Layer Credits: Sources: Esri, HERE, DeLorme, USGS,Intermap, INCREMENT P, NRCan, Esri Japan, METI, Esri China(Hong Kong), Esri Korea, Esri (Thailand), MapmyIndia, NGCC, ©OpenStreetMap contributors, and the GIS User Community
W:\7
909
SE
C -
RP
S B
elfa
st, W
W E
IS N
IS O
rnith
olog
y\Te
chn
ica
l\Gra
phi
cs\G
IS\m
xd\fi
gure
s\E
S_o
rnith
\ES
_tec
hrep
\sec
7909
_A10
1_S
peci
esD
istr
ibut
ion_
Dec
2014
Mar
2018
_DD
P.m
xd
Figure A10.14 Lapwing Records in Baldoyle Bay (Dec2014 to March 2018)
17/10/17 Draft CH
CH RI RIInfrastructure updated1 19/03/18 KAG
0 RI RIKAG
CH RI RIAdditional survey data1 21/05/18 KAG

!(
!(
!(
!(
!(
!(
!( !(
!(
!(
!(
!(
!(!(!(
!(
!(
!(
!(
!(
!(
!(
!(
!(
!(!(
!(
!(
!(
!(
!(!(
!(
!(
!(
!( !( !(
!(
!(
!(
!(
!(
!(
!(!(
!(
!(
!(
!(
!(
!(
!(
!(
!(
!(
!(
!(
!(!(
!(
!(
!(
!(
!(
!(
!(
!( !(
!(
!(
!(
!(
!(
!(
!(
!(
!(
!(
!(
!(
!(!(
!(
!(
!(!(
!(
!(
!(
!( !(
!(
!(
!(!(
!(!(
!(
!(
!(
!(
!(
!(
!(
!(!(
!(
!(
!(
!( !(
!(
!(
!(
!(
!(
!(
!(!(
!(
!(
!(
!(
!(
!(
!(
!(
!(!(
!(
!(
!(!(
!(
!(
!(
!( !(
!(!(
!(
!(
!(
!(
!(
!(
!(
!(
!(
!(!(
!(
!(
!(!(
!( !(
!(
!(
!(
!(!(
!(
!(
!(!(
!(
!(!(
!(
!(
!(
!(
!(
!(
!(
!( !(
!(
!(
!(
!(
!(
!(
!(
!(!(
!(
!(
!(
!(
!(
!(
!(
!(
!(
!(
!(
!(
!(
!(
!(
!(
!(
!(
!( !(
!(
!(
!(
!(
!(
!(
!(
!(
!(
!(
!(
!(
!(
!(
!(!(
!(
!(
!(
!(
!(!(
!(
!(
!(
!(
!(
!(
!(
!(
!(
!(
!(
!(
!(
!(
!(
!(
!(
!(
!(
!(
!(
!(
!(
!(!(
!(
!(
!(
!(
!(
!(
!(
!(
!(
!(
!(
!(
!(
!(
!(
!(
!(
!(
!(
!(
!(
!(
!(
!(
!(
!(
!(
!(
!(
!(
!(
!(
!(!(
!(
!(
!(
!(
!(
!(
!(
!(
!(
!(
!(
!(
!(
!(
!(
!(
!(
!(
!(
!(
!(
!(
!(
!(!(
!(
!(!(
!(
!(!(
!(
!(
!(
!(
!(
!(
!(
!(
!(
!(
!(
!(
!(
!(
!(
!(
!(
!(
!(
!(
!(
!(
!(!(
!(
!(
!(
!(
!(!(
!(
!(
!(
!(
!(
!(
!(
!(
!(
!(
!(
!(
!(
!(
!(
!(
!(
!(
!(
!(
!(
!(
!(
!(
!(
!(
!(
!(
!(
!(
!(
!(
!(
!(!(
!(
!(
!(
!(
!(
!(
!(
!(
!(
!(
!(
!(
!(
!(
!(!(
!(
!(
!(
!(
!(
!(
!(
!(
!(
!(!(
!(
!(
!(
!(
!(
!(
!(
!(
!(
!(
!(
!(
!(
!(
!(
!(
!(
!(
!(
!(
!(
!(
!(
!(
!(
!(
!(
!(
!(
!(
!(
!(!(
!(!(
!(
!(
!(
!(
!(
!(
!(
!(
!(
!(
!(
!(
!(
!(
!(
!(
!(
!(
!(
!(
!(
!( !(
!(
!(
!(
!(
!(
!(
!(
!(
!(
!(
!(
!(
!(
!(
!(
!(
!(
!(
!(
!(
!(
!(
!(
!(
!(!(
!(
!(
!(
!(!(
!(
!(
!(
!(
!(
!(
!(
!(
!(
!( !(
!(!(
!(
!(
!(
!(
!(!(
!(
!(
!(
!(
!(
!(
!(
!(!(
!(
!(
!(
!(
!(
!(!(
!(
!(
!(
!(
!(!(
!(
!(
!(!(
!(
!(
!(
!(
!(
!(
!(!(
!(
!(
!(
!(
!(
!(
!(!(
!(
!(
!(
!(
!(
!(
!(
!(
!(
!(
!(
!(
!(
!(
!(
!(
!(
!(
!(
!(
!(
!(
!(
!(
!(
!(
!(
!(
!(
!(
!(
!(
!(
!(
!(
!(
!(!(
!(
!(
!(
!(
!(
!(
!(
!(
!(
!(
!(
!(
!(
!(
!(
!(
!(
!(
!(
!(
!(!(
!(
!(
!(
!(
!(
!(
!(
!(
!(
!(
!(
!(
Drawing Title
Drawing Status
Drawing No.32102902-EIAR-A1015
FinalScale @ A3
Job No.
0 0.2 0.4 0.6 0.8 1
Kilometres
This drawing is not to be used in whole in or part other than for the intended purposeand project as defined on this drawing. Refer to the contract for full terms and conditions.
1:12,500SEC7909
Drawn Check'd Appr'dPurpose of revisionRev. Date Rev'd
Legend
±
Greater Dublin Drainage Project
Project
Proposed Project Boundary
Proposed Outfall Pipeline Route (Marine Section)
Baldoyle Bay SPA
RPS estuarine survey area
!( Mallard
Copyright © Ordnance Survey Ireland.Licence number 3/3/34/Irish Water.Service Layer Credits: Sources: Esri, HERE, DeLorme, USGS,Intermap, INCREMENT P, NRCan, Esri Japan, METI, Esri China(Hong Kong), Esri Korea, Esri (Thailand), MapmyIndia, NGCC, ©OpenStreetMap contributors, and the GIS User Community
W:\7
909
SE
C -
RP
S B
elfa
st, W
W E
IS N
IS O
rnith
olog
y\Te
chn
ica
l\Gra
phi
cs\G
IS\m
xd\fi
gure
s\E
S_o
rnith
\ES
_tec
hrep
\sec
7909
_A10
1_S
peci
esD
istr
ibut
ion_
Dec
2014
Mar
2018
_DD
P.m
xd
Figure A10.15 Mallard Records in Baldoyle Bay (Dec2014 to March 2018)
17/10/17 Draft CH
CH RI RIInfrastructure updated1 19/03/18 KAG
0 RI RIKAG
CH RI RIAdditional survey data1 21/05/18 KAG

!(
!(
!(
!(
!(
!(
!(
!(
!(
!(
!(
!(
!(
!(
!(
!(
!(
!(
!(
!(
!(
!(
!(
!(
!(
!(
!(
!(
!(!(
!(
!(
!(
!(
!(
!(
!(
!(
!( !(
!(
!(!(
!(
!(
!(
!(
!(
!(
!(
!(
!(
!(
!(
!(
!(
!(
!(
!(
!(
!(
!(
!(
!(
!(
!(
!(
!(
!(
!(
!(
!( !(!(
!(
!(
!(!( !(
!(!(
!(
!(
!(
!(
!(
!(!(
!(
!(
!(
!(
!(
!(
!(
!(
!(
!( !(
!(
!(
!(
!(
!(
!(
!(
!(
!(
!(!(
!(
!(
!(
!(
!(
!(
!(
!(
!(
!(
!(
!(
!(
!(
!(
!(
!(
!(
!(
!(
!(
!(
!(
!(
!(
!(
!(
!(
!(
!(
!(
!(
!(
!(
!(
!(!(
!(
!(
!(
!(
!( !(
!(
!(!(!(
!(
!(
!(
!(
!(
!(
!(
!(
!(
!(
!(
!(
!(
!(
!(
!(
!(
!(
!(
!(
!(
!(
!(
!(
!(
!(
!(!(
!( !(
!(!(!(
!(
!(!(
!(
!(!(!(
!(!(
!(!(
!(!(
!(!(
!(!(!(!(
!(!(!(
!(
!(
!(
!(
!(
!(
!(
!(!(
!(
!(
!(
!(
!(
!(
!( !(
!(
!(
!(
!(
!(
!(!( !(
!(
!(!(
!(
!(
!(
!(
!(
!(
!(
!(
!(
!(
!(!(
!(
!(!(
!(!(!(
!(
!(
!( !(
!(!(
!(
!(
!(
!(
!(
!(
!(!(
!(
!(
!(
!(
!(
!(
!(!(
!(
!(
!(
!(
!(
!(
!(
!(
!(
!(
!(
!(
!(
!(
!(
!(!(
!(!(
!(
!(!(
!(!(
!(!(
!(
!(
!(
!(
!(
!(
!(
!(!(
!(
!(!(
!(
!(
!(
!(
!(
!(
!(
!(
!(
!(
!(
!(
!(
!(
!(!(
!(
!(
!(
!(
!(
!(
!(
!(
!(
!(
!(
!(
!(
!(
!(
!(
!(
!(
!(
!(
!(!(
!(
!(
!(
!(
!(
!(!(
!(!(
!(
!(
!(
!(
!(
!(
!(
!(
!(
!(
!(
!(
!(!(
!(!(
!(
!(
!(
!(
!(!(
!(
!(
!(
!(
!(
!(!(
!(
!(
!(
!(
!(
!(
!(
!(
!(
!(
!(
!(
!(
!(
!(
!( !(!(
!(
!(!(
!(!(
!(
!(!(!(
!(!(
!(
!(
!(
!(
!(
!(
!(
!(
!(!( !(
!(
!(!(
!(!(
!(
!(
!(
!(
!(
!(
!(
!(
!(
!(
!(
!(
!(!(
!(
!(
!(!(
!(
!(
!(
!(
!(
!(
!(
!(
!(
!(
!(
!(
!(
!(
!(
!(
!(
!(
!(
!(
!(!(
!(
!(
!(
!(
!(
!(
!(
!(!(
!(
!(
!(
!(
!(
!(
!(
!(
!(
!(
!(
!(
!(
!(!(
!(
!(
!( !(
!(
!(
!(
!(
!(
!(
!(
!(
!(
!(
!(
!(
!(
!(!(
!(!(
!(
!(!(
!(
!(
!(
!(
!(
!( !(
!(!(
!(
!(
!(
!(
!(
!(
!(
!(
!(
!(
!(
!(
!(
!(
!(
!(
!(
!(
!(
!(
!(
!(
!(
!(
!(
!(
!(
!(
!(
!(
!(
!(
!(
!(
!(!(
!(
!(
!(
!(
!(
!(
!(
!(
!(
!(
!(
!(
!(
!(
!(
!(
!(
!(
!(
!(
!(
!(
!(
!(
!(
!(
!(
!(
!(
!(
!(
!(
!(
!(
!(
!(
!(
!(
!(
!(
!(
!(
!(
!(
!(
!(
!(
!(
!(
!(
!(
!(
!(
!(
!(
!(
!(
!(
!(
!(
!(
!(
!(
!(
!(
!(
!(
!(
!(
!(
!(
!(
!(!(
!(
!(
!(
!(
!(
!(
!(!(
!(!(
!(
!(!(
!(!(
!(
!(
!(
!(
!(
!(
!(
!(!(
!(
!(
!(!(
!(
!(
!(
!(
!(!(
!(
!(
!(!(
!(
!(
!(
!(
!(
!(
!(
!(
!(
!(
!(
!(
!(
!(
!(
!(
!(
!(!(
!(
!(
!(!(
!(
!(
!(
!(
!(!(
!(
!(
!(
!(
!(
!(!(
!(
!(
!(
!(
!(!(
!(
!(
!(!(
!(
!(
!(!(
!(
!(
!(
!(
!(
!(
!(
!(
!(
!(
!(
!(
!(
!(
!(
!(
!(
!(
!(
!(!( !(
!(
!(!(
!(
!(
!(!(!( !(
!(!(
!(
!(!(
!(
!(
!(
!(
!(
!(
!(
!(
!(
!(
!(
!(!(
!(
!(
!(
!(
!(
!(
!(
!(
!(
!(
!(
!(
!(
!(
!(!(
!(
!(
!(
!(
!(!(
!(
!(
!(
!(
!(
!(
!(
!(
!(
!(
!(
!(
!(
!(
!(
!(
!(
!(
!(
!(
!(
!(
!(
!(
!(
!(!(
!(
!(!(
!(
!(
!(
!(
!(
!(
!(
!(
!(
!(
!(
!( !(
!(
!(
!(
!(
!(
!(
!(
!(
!(
!(
!(
!(
!(
!(
!(
!(
!( !(
!(
!(
!(
!(
!(
!(
!(
!(
!(
!(!(
!(!(
!(
!(
!(
!(
!(
!(
!(
!(
!(
!(
!(
!(
!(
!(
!(
!(!(
!(
!(
!(
!(
!(
!(
!(
!(
!(
!(!(
!(
!(
!(
!(
!(
!(
!(
!(
!(
!(
!(
!(
!( !(
!(
!(!(
!(
!(!(
!(
!(
!(
!(
!(!(
!(
!(!(
!(!(!(
!(
!(!(
!(!( !(
!(
!(
!(
!(
!(
!(
!(!(
!(
!(
!(
!(
!(
!(
!(
!(
!(
!( !(
!(
!(!(
!(
!(
!(
!(
!(
!(!(
!(
!(
!(
!(
!(
!(
!(
!(
!(
!(
!(!(
!(!(
!(
!(
!(
!(
!(
!(
!(
!(!(
!(!(
!(
!(!(
!(
!(!(
!(
!(
!(
!(
Drawing Title
Drawing Status
Drawing No.32102902-EIAR-A1016
FinalScale @ A3
Job No.
0 0.2 0.4 0.6 0.8 1
Kilometres
This drawing is not to be used in whole in or part other than for the intended purposeand project as defined on this drawing. Refer to the contract for full terms and conditions.
1:12,500SEC7909
Drawn Check'd Appr'dPurpose of revisionRev. Date Rev'd
Legend
±
Greater Dublin Drainage Project
Project
Proposed Project Boundary
Proposed Outfall Pipeline Route (Marine Section)
Baldoyle Bay SPA
RPS estuarine survey area
!( Oystercatcher
Copyright © Ordnance Survey Ireland.Licence number 3/3/34/Irish Water.Service Layer Credits: Sources: Esri, HERE, DeLorme, USGS,Intermap, INCREMENT P, NRCan, Esri Japan, METI, Esri China(Hong Kong), Esri Korea, Esri (Thailand), MapmyIndia, NGCC, ©OpenStreetMap contributors, and the GIS User Community
W:\7
909
SE
C -
RP
S B
elfa
st, W
W E
IS N
IS O
rnith
olog
y\Te
chn
ica
l\Gra
phi
cs\G
IS\m
xd\fi
gure
s\E
S_o
rnith
\ES
_tec
hrep
\sec
7909
_A10
1_S
peci
esD
istr
ibut
ion_
Dec
2014
Mar
2018
_DD
P.m
xd
Figure A10.16 Oystercatcher Records in Baldoyle Bay(Dec 2014 to March 2018)
17/10/17 Draft CH
CH RI RIInfrastructure updated1 19/03/18 KAG
0 RI RIKAG
CH RI RIAdditional survey data1 21/05/18 KAG

!(
!(
Drawing Title
Drawing Status
Drawing No.32102902-EIAR-A1017
FinalScale @ A3
Job No.
0 0.2 0.4 0.6 0.8 1
Kilometres
This drawing is not to be used in whole in or part other than for the intended purposeand project as defined on this drawing. Refer to the contract for full terms and conditions.
1:12,500SEC7909
Drawn Check'd Appr'dPurpose of revisionRev. Date Rev'd
Legend
±
Greater Dublin Drainage Project
Project
Proposed Project Boundary
Proposed Outfall Pipeline Route (Marine Section)
Baldoyle Bay SPA
RPS estuarine survey area
!( Pintail
Copyright © Ordnance Survey Ireland.Licence number 3/3/34/Irish Water.Service Layer Credits: Sources: Esri, HERE, DeLorme, USGS,Intermap, INCREMENT P, NRCan, Esri Japan, METI, Esri China(Hong Kong), Esri Korea, Esri (Thailand), MapmyIndia, NGCC, ©OpenStreetMap contributors, and the GIS User Community
W:\7
909
SE
C -
RP
S B
elfa
st, W
W E
IS N
IS O
rnith
olog
y\Te
chn
ica
l\Gra
phi
cs\G
IS\m
xd\fi
gure
s\E
S_o
rnith
\ES
_tec
hrep
\sec
7909
_A10
1_S
peci
esD
istr
ibut
ion_
Dec
2014
Mar
2018
_DD
P.m
xd
Figure A10.17 Pintail Records in Baldoyle Bay (Dec2014 to March 2018)
17/10/17 Draft CH
CH RI RIInfrastructure updated1 19/03/18 KAG
0 RI RIKAG
CH RI RIAdditional survey data1 21/05/18 KAG

!(
!(
!(
!(
!(
!(
!(
!(
!(
!(
!(!(
!(
!(
!(!(
!(
!(
!(
!(
!(
!(
!(
!(
!(
!(
!(
!(
!(
!(
!(
!(
!(
!(
!(
!(
!(
!(
!(!(!(
!(
!(!(
!(
!(
!(
!(
!(
!(
!(
!(
!(
!(
!(
!(
!(
!(
!(
!(
!(
!(
!(
!(
!(
!(
!(
!(
!(
!(
!(
!(
!(
!(
!(
!(
!(
!(
!(!(
!(
!(
!(
!(
!(
!(
!(
!(
!(
!(
!(
!(
!(
!(
!(
!(
!(
!(
!(
!(
!(
!(
!(
!(
!(
!(
!(
!(
!(
!(
!(
!(
!(
!(
!(
!(
!(
!(
!(
!(
!(
!(
!(
!(
!(
!(
!(
!(
!(
!(
!(
!(
!(
!(
!(
!(
!(
!(
!(
!(
!(
!(
!(
!(
!(
!(
!(
!(
!(
!(
!(
!(
!(
!(
!(!(
!(
!(
!(
!(
!(
!(
!(
!(
!(
!(
!(
!(
Drawing Title
Drawing Status
Drawing No.32102902-EIAR-A1018
FinalScale @ A3
Job No.
0 0.2 0.4 0.6 0.8 1
Kilometres
This drawing is not to be used in whole in or part other than for the intended purposeand project as defined on this drawing. Refer to the contract for full terms and conditions.
1:12,500SEC7909
Drawn Check'd Appr'dPurpose of revisionRev. Date Rev'd
Legend
±
Greater Dublin Drainage Project
Project
Proposed Project Boundary
Proposed Outfall Pipeline Route (Marine Section)
Baldoyle Bay SPA
RPS estuarine survey area
!( Red-breasted Merganser
Copyright © Ordnance Survey Ireland.Licence number 3/3/34/Irish Water.Service Layer Credits: Sources: Esri, HERE, DeLorme, USGS,Intermap, INCREMENT P, NRCan, Esri Japan, METI, Esri China(Hong Kong), Esri Korea, Esri (Thailand), MapmyIndia, NGCC, ©OpenStreetMap contributors, and the GIS User Community
W:\7
909
SE
C -
RP
S B
elfa
st, W
W E
IS N
IS O
rnith
olog
y\Te
chn
ica
l\Gra
phi
cs\G
IS\m
xd\fi
gure
s\E
S_o
rnith
\ES
_tec
hrep
\sec
7909
_A10
1_S
peci
esD
istr
ibut
ion_
Dec
2014
Mar
2018
_DD
P.m
xd
Figure A10.18 Red-breasted Merganser Records inBaldoyle Bay (Dec 2014 to March 2018)
17/10/17 Draft CH
CH RI RIInfrastructure updated1 19/03/18 KAG
0 RI RIKAG
CH RI RIAdditional survey data1 21/05/18 KAG

!( !(!(
!(!(
!(
!(
!(
!(!(
!(
!(
!(
!(
!(
!(
!(
!(
!(
!(
!(
!(
!(
!(
!(
!(
!(
!(
!(
!(
!(
!(
!(
!(
!(
!(
!(
!(
!(
!(
!(
!(
!(
!(
!(
!(
!(
!(
!(!(
!(
!(
!(
!(
!(!(
!(
!(
!(
!(!(
!(
!(
!(
!(
!(
!(
!(!( !( !( !(
!(!(!(
!(
!(
!(!(
!(
!(
!(!(
!(
!(
!(
!(
!(!(
!(
!(
!(
!(
!(
!(
!(
!(
!(
!(
!(
!(
!(
!(
!(
!(
!(
!(
!(
!(
!(!(
!(
!(
!(
!(
!(
!(
!(
!(
!(!(
!(
!(
!(!(
!(
!(
!(
!(
!(
!(
!(
!(
!(
!(
!(
!(!(!(
!(
!(!(
!(!(
!(
!(
!(
!(
!( !(!(
!(
!(
!(
!(
!(
!(
!(
!(
!(
!(
!(
!(
!(
!(!(!(
!(
!(
!(
!(
!(!(
!(!(
!(!(
!( !(!(
!(
!(
!(
!(
!(
!(
!(
!(
!(!(
!(
!(
!( !(
!(
!(!(
!(
!(
!(
!(!(
!(
!(
!( !(!(
!(
!(!(!(
!(
!( !(
!(
!(!( !(
!(!(
!(
!(
!(!(
!(
!(!(!(
!(
!(
!(
!(
!(
!(
!(
!(
!(!(!(
!(
!(
!(
!(
!(!(
!(
!(
!(
!(!(
!(
!(
!(
!(
!(
!(!(
!(
!(
!(
!(
!(
!(
!(
!(
!(
!( !(
!(
!(
!(
!(
!(
!(
!(
!(
!(!(
!(
!(
!(
!(
!(
!(
!(
!(
!(
!(
!(
!(
!(
!(
!(
!(
!(
!(
!(
!(
!(
!( !(!(
!(
!(
!(
!(
!(
!(
!(
!(!(
!(
!(
!(
!(
!(!(
!(!(
!(
!(
!(
!(
!(
!(
!(
!(!(
!(
!(
!(
!(
!(
!(
!(
!(
!(
!(!(
!(
!(!(
!(
!(
!(
!(
!(
!(
!(
!(
!(
!(
!(
!(
!(
!(
!(
!(
!(
!( !(!(
!(
!(
!(
!(
!(
!(
!(
!(
!(
!(!(
!(
!(!(!(!(
!(!(!(
!(
!(!(
!(
!(
!(
!(
!(
!(
!(
!(
!(
!(!(
!(
!(
!(
!(
!(!(
!(
!(
!(
!(
!(!( !(
!(
!(!(
!(
!(
!(
!(!(
!(
!(
!(
!(
!(
!(
!(
!(
!(
!(!(!(
!(
!(
!(
!(
!(
!(
!(
!(
!(!(
!(
!(
!(
!(
!(
!(
!(
!(
!(
!(
!( !(
!(!(
!(
!(
!(
!(
!(
!(
!(
!(
!(!(!(
!(
!(
!(
!(!(!(
!(
!(
!(
!(!(
!(
!(
!(
!(
!(
!(
!(
!(
!(!(
!(
!(
!(
!(
!(
!(!(
!(
!(
!(
!(
!(
!(
!(
!(
!(
!( !(!(
!(
!( !(!(
!( !(
!(
!(
!(
!(
!(
!(!(
!(
!(
!(
!(!(
!(!(
!(
!(!(
!(
!(
!(
!(!(
!(
!(
!(
!(
!(
!(
!( !(!(!(
!(!(
!(
!(!(
!(
!(
!(
!(!(
!(
!(
!(
!(
!(
!(
!(
!(
!(
!(
!(
!(
!(!(
!(
!(
!(
!(
!(
!(
!(
!(!(
!(
!(
!(
!(
!(
!(
!(
!(
!(
!(
!(
!(
!(
!(
!(
!(!(
!(
!(!(
!(
!(
!(
!(
!(
!(
!(
!(
!(!(
!(
!(
!(
!(!(
!(
!(
!(!(
!(
!(
!(
!(!(
!(
!(
!(
!(
!(
!(
!(
!(
!(
!(
Drawing Title
Drawing Status
Drawing No.32102902-EIAR-A1019
FinalScale @ A3
Job No.
0 0.2 0.4 0.6 0.8 1
Kilometres
This drawing is not to be used in whole in or part other than for the intended purposeand project as defined on this drawing. Refer to the contract for full terms and conditions.
1:12,500SEC7909
Drawn Check'd Appr'dPurpose of revisionRev. Date Rev'd
Legend
±
Greater Dublin Drainage Project
Project
Proposed Project Boundary
Proposed Outfall Pipeline Route (Marine Section)
Baldoyle Bay SPA
RPS estuarine survey area
!( Redshank
Copyright © Ordnance Survey Ireland.Licence number 3/3/34/Irish Water.Service Layer Credits: Sources: Esri, HERE, DeLorme, USGS,Intermap, INCREMENT P, NRCan, Esri Japan, METI, Esri China(Hong Kong), Esri Korea, Esri (Thailand), MapmyIndia, NGCC, ©OpenStreetMap contributors, and the GIS User Community
W:\7
909
SE
C -
RP
S B
elfa
st, W
W E
IS N
IS O
rnith
olog
y\Te
chn
ica
l\Gra
phi
cs\G
IS\m
xd\fi
gure
s\E
S_o
rnith
\ES
_tec
hrep
\sec
7909
_A10
1_S
peci
esD
istr
ibut
ion_
Dec
2014
Mar
2018
_DD
P.m
xd
Figure A10.19 Redshank Records in Baldoyle Bay(Dec 2014 to March 2018)
17/10/17 Draft CH
CH RI RIInfrastructure updated1 19/03/18 KAG
0 RI RIKAG
CH RI RIAdditional survey data1 21/05/18 KAG

!(
!(
!(
!(
!(
!(
!(
!(
!(
!(
!(
!(!(!(
!(
!(
!(
!(
!(
!(
!(
!(
!(
!(
!(
!(
!(
!(!(
!(
!(
!(
!(
Drawing Title
Drawing Status
Drawing No.32102902-EIAR-A1020
FinalScale @ A3
Job No.
0 0.2 0.4 0.6 0.8 1
Kilometres
This drawing is not to be used in whole in or part other than for the intended purposeand project as defined on this drawing. Refer to the contract for full terms and conditions.
1:12,500SEC7909
Drawn Check'd Appr'dPurpose of revisionRev. Date Rev'd
Legend
±
Greater Dublin Drainage Project
Project
Proposed Project Boundary
Proposed Outfall Pipeline Route (Marine Section)
Baldoyle Bay SPA
RPS estuarine survey area
!( Sanderling
Copyright © Ordnance Survey Ireland.Licence number 3/3/34/Irish Water.Service Layer Credits: Sources: Esri, HERE, DeLorme, USGS,Intermap, INCREMENT P, NRCan, Esri Japan, METI, Esri China(Hong Kong), Esri Korea, Esri (Thailand), MapmyIndia, NGCC, ©OpenStreetMap contributors, and the GIS User Community
W:\7
909
SE
C -
RP
S B
elfa
st, W
W E
IS N
IS O
rnith
olog
y\Te
chn
ica
l\Gra
phi
cs\G
IS\m
xd\fi
gure
s\E
S_o
rnith
\ES
_tec
hrep
\sec
7909
_A10
1_S
peci
esD
istr
ibut
ion_
Dec
2014
Mar
2018
_DD
P.m
xd
Figure A10.20 Sanderling Records in Baldoyle Bay(Dec 2014 to March 2018)
17/10/17 Draft CH
CH RI RIInfrastructure updated1 19/03/18 KAG
0 RI RIKAG
CH RI RIAdditional survey data1 21/05/18 KAG

!(
!( !(
!(
!(
!(!(
!(
!(
!(
!(
!(
!(
!( !(!(
!(
!(
!(
!(
!(
!(
!(
!(
!(
!(
!(
!(
!(!(
!(
!(
!(
!(
!( !(
!(!(
!(!(
!(
!(
!(
!(
!(
!(
!(
!(
!(
!( !(
!(
!(!(
!(
!(
!(
!(
!(
!(
!(
!(
!(
!(
!(
!(!(
!(
!(
!(
!(
!(
!(
!(
!(
!(
!(
!(
!(
!(
!(
!( !(!(
!(
!(
!(
!(!(!(
!(
!(
!(
!(
!(
!(
!(
!( !(
!(
!(
!(
!(
!(!(
!(
!(
!(
!(
!(
!(!(
!(
!(
!(
!(
!(
!( !(
!(!(
!(
!(
!(
!(
!(
!(!(
!(
!(
!(
!(
!(
!(
!(
!(
!(
!(
!(
!(
!(!(
!(
!(
!(
!(
!(!(
!(
!(
!(
!(
!( !(
!(
!(
!(
!(
!(
!(
!(
!(
!(
!(
!(
!(
!(
!(
!(
!(
!(
!(
!(
!(
!(
!(
!(
!(
!(!(
!(
!(
!( !(
!(!(
!(
!(!(
!(
!(
!(
!(
!(
!(
!(
!(
!(
!(
!(!(
!(!(
!(
!(
!(
!(
!(
!(
!(
!(
!(
!(
!(
!(
!(
!( !(
!(
!(
!(
!(
!(
!(
!(
!(
!(
!(
!(
!(
!(
!(
!(
!(
!(
!(
!(
!(
!(
!(
!(
!(
!(
!(
!(
!(
!(
!(
!(!(
!(
!(
!(
!(
!(
!(
!(
!(
!(
!(
!(
!(
!(
!(
!(
!(
!(!(
!(
!(
!(
!(
!(
!(
!(!(
!(
!(
!(
!(
!(
!(
!(!(
!(
!(
!(
!(!(
!(
!(
!(
!(
!(
!(
!(
!(
!(!(
!(
!(
!(
!(
!(
!(
!(
!(!(!(!(
!(
!(
!(
!(
!(
!(
!(
!(
!(
!(
!(
!(
!(
!(
!(
!(
!(
!(!(
!( !(
!(
!(
!(
!(
!(!(
!(
!(
!(
!(
!(
!(
!(
!(
!(
!(
!(!(
!(
!(
!(!(
!(
!(
!(
!(!(
!(
!(
!(
!(!(
!(
!(
!(
!(
!(
!(
!(
!(
!(
!(!( !(
!(
!(!(
!(
!(
!(!(
!(
!(
!(
!(
!(
!(
!(
!(
!(
!(
!(
!(
!(
!(
!(
!(
!(
!(
!(
!(
!(
!(
!(
!(
!(
!(
!(
!(
!(
!(
!(
!(
!(
!(
!(
!(
!(
!(
!(
!(
!(
!(
!(
!(
!(
!(
!(
!(
!(
!(
!(
!(
!(!(
!(
!(
!(
!(
!(
!(!(
!(
!(!(
!(
!(
!(
!(
!(
!(
!(!(
!(
Drawing Title
Drawing Status
Drawing No.32102902-EIAR-A1021
FinalScale @ A3
Job No.
0 0.2 0.4 0.6 0.8 1
Kilometres
This drawing is not to be used in whole in or part other than for the intended purposeand project as defined on this drawing. Refer to the contract for full terms and conditions.
1:12,500SEC7909
Drawn Check'd Appr'dPurpose of revisionRev. Date Rev'd
Legend
±
Greater Dublin Drainage Project
Project
Proposed Project Boundary
Proposed Outfall Pipeline Route (Marine Section)
Baldoyle Bay SPA
RPS estuarine survey area
!( Teal
Copyright © Ordnance Survey Ireland.Licence number 3/3/34/Irish Water.Service Layer Credits: Sources: Esri, HERE, DeLorme, USGS,Intermap, INCREMENT P, NRCan, Esri Japan, METI, Esri China(Hong Kong), Esri Korea, Esri (Thailand), MapmyIndia, NGCC, ©OpenStreetMap contributors, and the GIS User Community
W:\7
909
SE
C -
RP
S B
elfa
st, W
W E
IS N
IS O
rnith
olog
y\Te
chn
ica
l\Gra
phi
cs\G
IS\m
xd\fi
gure
s\E
S_o
rnith
\ES
_tec
hrep
\sec
7909
_A10
1_S
peci
esD
istr
ibut
ion_
Dec
2014
Mar
2018
_DD
P.m
xd
Figure A10.21 Teal Records in Baldoyle Bay (Dec2014 to March 2018)
17/10/17 Draft CH
CH RI RIInfrastructure updated1 19/03/18 KAG
0 RI RIKAG
CH RI RIAdditional survey data1 21/05/18 KAG

!(
!(
!(
!(
!(
!(
!(
!(
!(
!(
!(
!(
!(
!(
!(
!(
!(
!(
!(
!(
!(
!(
!(
!(
!(
!(
!(
!(
!(
!(
!(
!(
!(!(
!(
!(
!(
!(
!(
!(
!(
!(
!(
!(
!(!(
!(
!(!(
!(
!(
!(
!(
!(
!(!(!(
!(
!(
!(
!(
!(
!(
!(
!(
!(
!(
!(
!(!(
!(
!(
!(
!(
!(!(
!(
!(
!(
!(
!(
!(
!(
!(
!(
!(
!(
!(
!(
!(
!(!(
!(
!(
!(
!(
!(
!(
!(
!(
!(
!(
!(
!(
!(
!(
!(
!(
!(
!(
!(
!(
!(
Drawing Title
Drawing Status
Drawing No.32102902-EIAR-A1022
FinalScale @ A3
Job No.
0 0.2 0.4 0.6 0.8 1
Kilometres
This drawing is not to be used in whole in or part other than for the intended purposeand project as defined on this drawing. Refer to the contract for full terms and conditions.
1:12,500SEC7909
Drawn Check'd Appr'dPurpose of revisionRev. Date Rev'd
Legend
±
Greater Dublin Drainage Project
Project
Proposed Project Boundary
Proposed Outfall Pipeline Route (Marine Section)
Baldoyle Bay SPA
RPS estuarine survey area
!( Turnstone
Copyright © Ordnance Survey Ireland.Licence number 3/3/34/Irish Water.Service Layer Credits: Sources: Esri, HERE, DeLorme, USGS,Intermap, INCREMENT P, NRCan, Esri Japan, METI, Esri China(Hong Kong), Esri Korea, Esri (Thailand), MapmyIndia, NGCC, ©OpenStreetMap contributors, and the GIS User Community
W:\7
909
SE
C -
RP
S B
elfa
st, W
W E
IS N
IS O
rnith
olog
y\Te
chn
ica
l\Gra
phi
cs\G
IS\m
xd\fi
gure
s\E
S_o
rnith
\ES
_tec
hrep
\sec
7909
_A10
1_S
peci
esD
istr
ibut
ion_
Dec
2014
Mar
2018
_DD
P.m
xd
Figure A10.22 Turnstone Records in Baldoyle Bay(Dec 2014 to March 2018)
17/10/17 Draft CH
CH RI RIInfrastructure updated1 19/03/18 KAG
0 RI RIKAG
CH RI RIAdditional survey data1 21/05/18 KAG

!( !(
!(
!(
!(!(!(
!(
!(
!(
!(
!(
!(
!(
!(
!(
!(
!(
!(
!(
!(
!(
!(
!(
!(!(
!(!(
!(
!(
!(
!(
Drawing Title
Drawing Status
Drawing No.32102902-EIAR-A1023
FinalScale @ A3
Job No.
0 0.2 0.4 0.6 0.8 1
Kilometres
This drawing is not to be used in whole in or part other than for the intended purposeand project as defined on this drawing. Refer to the contract for full terms and conditions.
1:12,500SEC7909
Drawn Check'd Appr'dPurpose of revisionRev. Date Rev'd
Legend
±
Greater Dublin Drainage Project
Project
Proposed Project Boundary
Proposed Outfall Pipeline Route (Marine Section)
Baldoyle Bay SPA
RPS estuarine survey area
!( Black Guillemot
Copyright © Ordnance Survey Ireland.Licence number 3/3/34/Irish Water.Service Layer Credits: Sources: Esri, HERE, DeLorme, USGS,Intermap, INCREMENT P, NRCan, Esri Japan, METI, Esri China(Hong Kong), Esri Korea, Esri (Thailand), MapmyIndia, NGCC, ©OpenStreetMap contributors, and the GIS User Community
W:\7
909
SE
C -
RP
S B
elfa
st, W
W E
IS N
IS O
rnith
olog
y\Te
chn
ica
l\Gra
phi
cs\G
IS\m
xd\fi
gure
s\E
S_o
rnith
\ES
_tec
hrep
\sec
7909
_A10
1_S
peci
esD
istr
ibut
ion_
Dec
2014
Mar
2018
_DD
P.m
xd
Figure A10.23 Black Guillemot Records in BaldoyleBay (Dec 2014 to March 2018)
17/10/17 Draft CH
CH RI RIInfrastructure updated1 19/03/18 KAG
0 RI RIKAG
CH RI RIAdditional survey data1 21/05/18 KAG

!(
!(
!(
!(
!(
!(
!(
!(
!(
!(
!(
!(
!(
!(
!(
!(
!(
!(
!(
!(
!(
!(
!(
!(
!(
!(
!(
!(
!(
!(
Drawing Title
Drawing Status
Drawing No.32102902-EIAR-A1024
FinalScale @ A3
Job No.
0 0.2 0.4 0.6 0.8 1
Kilometres
This drawing is not to be used in whole in or part other than for the intended purposeand project as defined on this drawing. Refer to the contract for full terms and conditions.
1:12,500SEC7909
Drawn Check'd Appr'dPurpose of revisionRev. Date Rev'd
Legend
±
Greater Dublin Drainage Project
Project
Proposed Project Boundary
Proposed Outfall Pipeline Route (Marine Section)
Baldoyle Bay SPA
RPS estuarine survey area
!( Guillemot
Copyright © Ordnance Survey Ireland.Licence number 3/3/34/Irish Water.Service Layer Credits: Sources: Esri, HERE, DeLorme, USGS,Intermap, INCREMENT P, NRCan, Esri Japan, METI, Esri China(Hong Kong), Esri Korea, Esri (Thailand), MapmyIndia, NGCC, ©OpenStreetMap contributors, and the GIS User Community
W:\7
909
SE
C -
RP
S B
elfa
st, W
W E
IS N
IS O
rnith
olog
y\Te
chn
ica
l\Gra
phi
cs\G
IS\m
xd\fi
gure
s\E
S_o
rnith
\ES
_tec
hrep
\sec
7909
_A10
1_S
peci
esD
istr
ibut
ion_
Dec
2014
Mar
2018
_DD
P.m
xd
Figure A10.24 Guillemot Records in Baldoyle Bay(Dec 2014 to March 2018)
17/10/17 Draft CH
CH RI RIInfrastructure updated1 19/03/18 KAG
0 RI RIKAG
CH RI RIAdditional survey data1 21/05/18 KAG

!(
!(
!(
!(
!(
!(
!(
!(
!(
!(
!(
!(
!(
!(
!(
!(
!(
!(
Drawing Title
Drawing Status
Drawing No.32102902-EIAR-A1025
FinalScale @ A3
Job No.
0 0.2 0.4 0.6 0.8 1
Kilometres
This drawing is not to be used in whole in or part other than for the intended purposeand project as defined on this drawing. Refer to the contract for full terms and conditions.
1:12,500SEC7909
Drawn Check'd Appr'dPurpose of revisionRev. Date Rev'd
Legend
±
Greater Dublin Drainage Project
Project
Proposed Project Boundary
Proposed Outfall Pipeline Route (Marine Section)
Baldoyle Bay SPA
RPS estuarine survey area
!( Razorbill
Copyright © Ordnance Survey Ireland.Licence number 3/3/34/Irish Water.Service Layer Credits: Sources: Esri, HERE, DeLorme, USGS,Intermap, INCREMENT P, NRCan, Esri Japan, METI, Esri China(Hong Kong), Esri Korea, Esri (Thailand), MapmyIndia, NGCC, ©OpenStreetMap contributors, and the GIS User Community
W:\7
909
SE
C -
RP
S B
elfa
st, W
W E
IS N
IS O
rnith
olog
y\Te
chn
ica
l\Gra
phi
cs\G
IS\m
xd\fi
gure
s\E
S_o
rnith
\ES
_tec
hrep
\sec
7909
_A10
1_S
peci
esD
istr
ibut
ion_
Dec
2014
Mar
2018
_DD
P.m
xd
Figure A10.25 Razorbill Records in Baldoyle Bay (Dec2014 to March 2018)
17/10/17 Draft CH
CH RI RIInfrastructure updated1 19/03/18 KAG
0 RI RIKAG
CH RI RIAdditional survey data1 21/05/18 KAG

!(
!(
!(
!(
!(
!(
!(
!(
!(
!(
!(
!(
!(
!(
!(
!(
!(
!(
!(
!(
!(
!(
!(
!(
!(
!(
!(
!(
!(
!(
!(
!(
!(
!(
!(
Drawing Title
Drawing Status
Drawing No.32102902-EIAR-A1026
FinalScale @ A3
Job No.
0 0.2 0.4 0.6 0.8 1
Kilometres
This drawing is not to be used in whole in or part other than for the intended purposeand project as defined on this drawing. Refer to the contract for full terms and conditions.
1:12,500SEC7909
Drawn Check'd Appr'dPurpose of revisionRev. Date Rev'd
Legend
±
Greater Dublin Drainage Project
Project
Proposed Project Boundary
Proposed Outfall Pipeline Route (Marine Section)
Baldoyle Bay SPA
RPS estuarine survey area
!( Great Northern Diver
Copyright © Ordnance Survey Ireland.Licence number 3/3/34/Irish Water.Service Layer Credits: Sources: Esri, HERE, DeLorme, USGS,Intermap, INCREMENT P, NRCan, Esri Japan, METI, Esri China(Hong Kong), Esri Korea, Esri (Thailand), MapmyIndia, NGCC, ©OpenStreetMap contributors, and the GIS User Community
W:\7
909
SE
C -
RP
S B
elfa
st, W
W E
IS N
IS O
rnith
olog
y\Te
chn
ica
l\Gra
phi
cs\G
IS\m
xd\fi
gure
s\E
S_o
rnith
\ES
_tec
hrep
\sec
7909
_A10
1_S
peci
esD
istr
ibut
ion_
Dec
2014
Mar
2018
_DD
P.m
xd
Figure A10.26 Great Northern Diver Records inBaldoyle Bay (Dec 2014 to March 2018)
17/10/17 Draft CH
CH RI RIInfrastructure updated1 19/03/18 KAG
0 RI RIKAG
CH RI RIAdditional survey data1 21/05/18 KAG

!(
!(
!(
!(
!(
!(
!(
!(
!(
!(
!(
!(
!(
!(
!(
!(
!(
!(
!(!(
!(!(
!(!(
!(
!(
!(
!(
!(
!(
!(
!(
!(
!(
!(
!(
!(
!(
!(
!(
!(
!(
!(
!(!(
!(
!(
!(
!(
!(
!(
!(
!(
!(
!(
!(
!(
!(
!(
!(
!(
!(
!(
!(
!(
!(
!(
!(
!(
!(
!(
!(
!(
!(
!(
!(
!(
!(
!(
!(
!(
!(
!(
!(
!(
!(
!(
!(
!(
!(
!(
!(
!(
!(
!(
!(
!(
!(
!(
!(
!(
!(
!(
!(
!(
Drawing Title
Drawing Status
Drawing No.32102902-EIAR-A1027
FinalScale @ A3
Job No.
0 0.2 0.4 0.6 0.8 1
Kilometres
This drawing is not to be used in whole in or part other than for the intended purposeand project as defined on this drawing. Refer to the contract for full terms and conditions.
1:12,500SEC7909
Drawn Check'd Appr'dPurpose of revisionRev. Date Rev'd
Legend
±
Greater Dublin Drainage Project
Project
Proposed Project Boundary
Proposed Outfall Pipeline Route (Marine Section)
Baldoyle Bay SPA
RPS estuarine survey area
!( Red-throated Diver
Copyright © Ordnance Survey Ireland.Licence number 3/3/34/Irish Water.Service Layer Credits: Sources: Esri, HERE, DeLorme, USGS,Intermap, INCREMENT P, NRCan, Esri Japan, METI, Esri China(Hong Kong), Esri Korea, Esri (Thailand), MapmyIndia, NGCC, ©OpenStreetMap contributors, and the GIS User Community
W:\7
909
SE
C -
RP
S B
elfa
st, W
W E
IS N
IS O
rnith
olog
y\Te
chn
ica
l\Gra
phi
cs\G
IS\m
xd\fi
gure
s\E
S_o
rnith
\ES
_tec
hrep
\sec
7909
_A10
1_S
peci
esD
istr
ibut
ion_
Dec
2014
Mar
2018
_DD
P.m
xd
Figure A10.27 Red-throated Diver Records in BaldoyleBay (Dec 2014 to March 2018)
17/10/17 Draft CH
CH RI RIInfrastructure updated1 19/03/18 KAG
0 RI RIKAG
CH RI RIAdditional survey data1 21/05/18 KAG

!(
!(
!(
!(!(
!(
!(
!(
!(
!(!(
!(!(
!(
!(
!(
!(
!(
!(
!(
!(
!(
!(
!(!(
!(!(
!(
!(
!(
!(
!(
!(
!(
!(!(
!(
!(!( !(
!(
!(
!(
!(!(!(!(
!(
!(
!(!(
!(!( !(
!(
!(
!(
!(
!(!(
!(
!(!(
!(
!(!(
!(
!(!(
!(
!(
!(
!(!(
!(
!(
!(
!(!(
!(
!(
!( !(
!(
!(
!(
!(
!(
!(
!(
!(
!(
!(
!(
!(
!(
!(
!(
!(
!(
!(
!(
!(
!(
!(
!(
!(!(
!(
!(
!(
!(
!(
!(
!(
!(
!(
!(
!(
!(
!(
!(
!(
!(
!(!(
!(
!(
!(
!(
!(
!(
!(
!(
!(
!(
!(
!(!(
!(!(
!(
!(
!(
!(!(!(
!(!(
!( !(
!(
!(
!(
!(
!(
!(
!(
!(
!(
!(!(
!(
Drawing Title
Drawing Status
Drawing No.32102902-EIAR-A1028
FinalScale @ A3
Job No.
0 0.2 0.4 0.6 0.8 1
Kilometres
This drawing is not to be used in whole in or part other than for the intended purposeand project as defined on this drawing. Refer to the contract for full terms and conditions.
1:12,500SEC7909
Drawn Check'd Appr'dPurpose of revisionRev. Date Rev'd
Legend
±
Greater Dublin Drainage Project
Project
Proposed Project Boundary
Proposed Outfall Pipeline Route (Marine Section)
Baldoyle Bay SPA
RPS estuarine survey area
!( Mute Swan
Copyright © Ordnance Survey Ireland.Licence number 3/3/34/Irish Water.Service Layer Credits: Sources: Esri, HERE, DeLorme, USGS,Intermap, INCREMENT P, NRCan, Esri Japan, METI, Esri China(Hong Kong), Esri Korea, Esri (Thailand), MapmyIndia, NGCC, ©OpenStreetMap contributors, and the GIS User Community
W:\7
909
SE
C -
RP
S B
elfa
st, W
W E
IS N
IS O
rnith
olog
y\Te
chn
ica
l\Gra
phi
cs\G
IS\m
xd\fi
gure
s\E
S_o
rnith
\ES
_tec
hrep
\sec
7909
_A10
1_S
peci
esD
istr
ibut
ion_
Dec
2014
Mar
2018
_DD
P.m
xd
Figure A10.28 Mute Swan Records in Baldoyle Bay(Dec 2014 to March 2018)
17/10/17 Draft CH
CH RI RIInfrastructure updated1 19/03/18 KAG
0 RI RIKAG
CH RI RIAdditional survey data1 21/05/18 KAG

!(
!(
!(
!(
!(
!(
!(
!(
!(
!(
!(
!(!(
!(
!(
!(
!(
!(
!(
!(
!(!(
!(
!(
!(
!(
!(
!(
!(
!(
!(
!(
!(
!(
!(
!(
!(
!(
!(
!(!(
!(
!(
!(
!(
!(
!(
!( !(
!(
!(
!(
!(
!(
!(
!(
!(
!( !(
!(
!(
!(
!(
Drawing Title
Drawing Status
Drawing No.32102902-EIAR-A1029
FinalScale @ A3
Job No.
0 0.2 0.4 0.6 0.8 1
Kilometres
This drawing is not to be used in whole in or part other than for the intended purposeand project as defined on this drawing. Refer to the contract for full terms and conditions.
1:12,500SEC7909
Drawn Check'd Appr'dPurpose of revisionRev. Date Rev'd
Legend
±
Greater Dublin Drainage Project
Project
Proposed Project Boundary
Proposed Outfall Pipeline Route (Marine Section)
Baldoyle Bay SPA
RPS estuarine survey area
!( Common Scoter
Copyright © Ordnance Survey Ireland.Licence number 3/3/34/Irish Water.Service Layer Credits: Sources: Esri, HERE, DeLorme, USGS,Intermap, INCREMENT P, NRCan, Esri Japan, METI, Esri China(Hong Kong), Esri Korea, Esri (Thailand), MapmyIndia, NGCC, ©OpenStreetMap contributors, and the GIS User Community
W:\7
909
SE
C -
RP
S B
elfa
st, W
W E
IS N
IS O
rnith
olog
y\Te
chn
ica
l\Gra
phi
cs\G
IS\m
xd\fi
gure
s\E
S_o
rnith
\ES
_tec
hrep
\sec
7909
_A10
1_S
peci
esD
istr
ibut
ion_
Dec
2014
Mar
2018
_DD
P.m
xd
Figure A10.29 Common Scoter Records in BaldoyleBay (Dec 2014 to March 2018)
17/10/17 Draft CH
CH RI RIInfrastructure updated1 19/03/18 KAG
0 RI RIKAG
CH RI RIAdditional survey data1 21/05/18 KAG

!(
!( !(
!(
!(
!(
!(
!(
!(
!(
!(
!(
!(
!(
!(
!(
!(
!(
!(
!(
!(
!(
!(
!(
!(
!(
!(
!(
!(
!(!(
!(
Drawing Title
Drawing Status
Drawing No.32102902-EIAR-A1030
FinalScale @ A3
Job No.
0 0.2 0.4 0.6 0.8 1
Kilometres
This drawing is not to be used in whole in or part other than for the intended purposeand project as defined on this drawing. Refer to the contract for full terms and conditions.
1:12,500SEC7909
Drawn Check'd Appr'dPurpose of revisionRev. Date Rev'd
Legend
±
Greater Dublin Drainage Project
Project
Proposed Project Boundary
Proposed Outfall Pipeline Route (Marine Section)
Baldoyle Bay SPA
RPS estuarine survey area
!( Coot
Copyright © Ordnance Survey Ireland.Licence number 3/3/34/Irish Water.Service Layer Credits: Sources: Esri, HERE, DeLorme, USGS,Intermap, INCREMENT P, NRCan, Esri Japan, METI, Esri China(Hong Kong), Esri Korea, Esri (Thailand), MapmyIndia, NGCC, ©OpenStreetMap contributors, and the GIS User Community
W:\7
909
SE
C -
RP
S B
elfa
st, W
W E
IS N
IS O
rnith
olog
y\Te
chn
ica
l\Gra
phi
cs\G
IS\m
xd\fi
gure
s\E
S_o
rnith
\ES
_tec
hrep
\sec
7909
_A10
1_S
peci
esD
istr
ibut
ion_
Dec
2014
Mar
2018
_DD
P.m
xd
Figure A10.30 Coot Records in Baldoyle Bay (Dec2014 to March 2018)
17/10/17 Draft CH
CH RI RIInfrastructure updated1 19/03/18 KAG
0 RI RIKAG
CH RI RIAdditional survey data1 21/05/18 KAG

!(
!(
!(!(!(
!(!(
!(!(
!(
!(
!(
!( !(
!(
!( !(
!(
!(
!(
!(
!(
!(
!(
!(
!(
!(
!(
!(
!(
!(
!(
!(
!(
!(
!(
!(
!(
!(
!(
!(
!(
!(
!(
!(
!(
!(
!(
!(
!(
!(
!( !(
!(
!(
!(
!(
!(
!(
!(
!(
!(!(!(!(!(
!(
!(!( !(
!(
!(!(!(
!(
!(
!(
!(
!(
!(
!(
Drawing Title
Drawing Status
Drawing No.32102902-EIAR-A1031
FinalScale @ A3
Job No.
0 0.2 0.4 0.6 0.8 1
Kilometres
This drawing is not to be used in whole in or part other than for the intended purposeand project as defined on this drawing. Refer to the contract for full terms and conditions.
1:12,500SEC7909
Drawn Check'd Appr'dPurpose of revisionRev. Date Rev'd
Legend
±
Greater Dublin Drainage Project
Project
Proposed Project Boundary
Proposed Outfall Pipeline Route (Marine Section)
Baldoyle Bay SPA
RPS estuarine survey area
!( Little Grebe
Copyright © Ordnance Survey Ireland.Licence number 3/3/34/Irish Water.Service Layer Credits: Sources: Esri, HERE, DeLorme, USGS,Intermap, INCREMENT P, NRCan, Esri Japan, METI, Esri China(Hong Kong), Esri Korea, Esri (Thailand), MapmyIndia, NGCC, ©OpenStreetMap contributors, and the GIS User Community
W:\7
909
SE
C -
RP
S B
elfa
st, W
W E
IS N
IS O
rnith
olog
y\Te
chn
ica
l\Gra
phi
cs\G
IS\m
xd\fi
gure
s\E
S_o
rnith
\ES
_tec
hrep
\sec
7909
_A10
1_S
peci
esD
istr
ibut
ion_
Dec
2014
Mar
2018
_DD
P.m
xd
Figure A10.31 Little Grebe Records in Baldoyle Bay(Dec 2014 to March 2018)
17/10/17 Draft CH
CH RI RIInfrastructure updated1 19/03/18 KAG
0 RI RIKAG
CH RI RIAdditional survey data1 21/05/18 KAG

!(
!(
!(
!(!(!(!(
!(
!(
!(
!(
!(
!(
!(!(
!(
!(!(
!(
!(
!(
!(
!(
!(
!(
!(!(
!(!(
!(
!(
!(
!(
!(
!(
!(
!(
!(!(
!(
!(
!(
!(
!(
!(
!(
!(
!(
!(
!(!(
!(!(
!(!(!(
!(
!(
!(
!(!(
!(
!(
!(
!(
!(
!(
!(
!(
!(
!(
!(
!(
!(
!(!(
!(
!(
!(
!(
!(!(
!(!( !(
!(
!(
!(
!(
!(!(
!(
!( !(
!(
!(
!(
!(
!(
!(
!(
!(
!(
!(
!(
!(
!(
!(!(
!(
!(
!(
!(
!(
!(
!(
!(
!(
!(
!(
!(
!(
!(!(
!(
!(
!(
!(
!(
!(
!(
!(
!(
!(
!(
!(
!(
!(
!(
!(!(
!(
!(
!(
!(
!(
!(
!(
!(
!(
!(
!(
!(
!(
!(!(
!(
!(
!(
!(
!(
!(
!(
!(
!(
!(
!(
!(
!(
!(
!(
!(
!(
!(
!(
!(
!(
!(
!(
!(
!(
!(
!(
!(
!(!( !(
!(
!(
!(
!(
!(
!(
!(
!(
!(
!(
!(
!(
!(
!(
!(
!(
!(
!(!(
!(
!(
!(
!(
Drawing Title
Drawing Status
Drawing No.32102902-EIAR-A1032
FinalScale @ A3
Job No.
0 0.2 0.4 0.6 0.8 1
Kilometres
This drawing is not to be used in whole in or part other than for the intended purposeand project as defined on this drawing. Refer to the contract for full terms and conditions.
1:12,500SEC7909
Drawn Check'd Appr'dPurpose of revisionRev. Date Rev'd
Legend
±
Greater Dublin Drainage Project
Project
Proposed Project Boundary
Proposed Outfall Pipeline Route (Marine Section)
Baldoyle Bay SPA
RPS estuarine survey area
!( Moorhen
Copyright © Ordnance Survey Ireland.Licence number 3/3/34/Irish Water.Service Layer Credits: Sources: Esri, HERE, DeLorme, USGS,Intermap, INCREMENT P, NRCan, Esri Japan, METI, Esri China(Hong Kong), Esri Korea, Esri (Thailand), MapmyIndia, NGCC, ©OpenStreetMap contributors, and the GIS User Community
W:\7
909
SE
C -
RP
S B
elfa
st, W
W E
IS N
IS O
rnith
olog
y\Te
chn
ica
l\Gra
phi
cs\G
IS\m
xd\fi
gure
s\E
S_o
rnith
\ES
_tec
hrep
\sec
7909
_A10
1_S
peci
esD
istr
ibut
ion_
Dec
2014
Mar
2018
_DD
P.m
xd
Figure A10.32 Moorhen Records in Baldoyle Bay (Dec2014 to March 2018)
17/10/17 Draft CH
CH RI RIInfrastructure updated1 19/03/18 KAG
0 RI RIKAG
CH RI RIAdditional survey data1 21/05/18 KAG

!(
!(
!(
!(
!(!(
!(
!(
!(
!(
!(
!(
!(
!(
!(
!(
!(
!(
!(
!(
!(
!(!(
!(
!(
!(
!(
!(
!(
!(
!(
!(
!(
!(
!(
!(
!(
!(
!(
!(
!(
!(
!(
!( !(
!(
!(
!(
!(
!(
!(
!(
!(
!( !(
!(
!(
!(
!(
!(
!(
!(!(
!(
!(
!(
!(
!(
!(
!(
!(
!(
!(
!(
!(
!(
!(
!(
!(
!(
!(!(
!(
!(
!(
!(
!(!(
!(
!(
!(
!(
!(
!(
!(
!(!(!(
!(
!(
!(
!(
!(
!(
!(
!(
!(
!(
!(
!(
!(
!(
!(
!(
!(
!(
!(
!(
!(
!(
!(
!(
!(
!(
!(
!(
!(
!(
!(
!(
!(
!(
!(
!(
!(
!(
!(
!(
!(
!(
!(
!( !(
!(
!(
!(!(
!(
!(
!(
!(
!(
!(
!(
!(
!(
!(
!(
!(!(
!(
!(
!(
!(
!(
!(!(
!(
!(
!(
!(
!(
!(
!(
!(
!(
!(
!(!(
!(
!(
!(
!(
!(
!(
!(
!(
!(
!(
!(
!(
!(
!(
!(
!(
!(
!(
!(
!(
!(
!(
!(
!(
!(
!(
!(
!(
!(
!(
!(
!(
Drawing Title
Drawing Status
Drawing No.32102902-EIAR-A1033
FinalScale @ A3
Job No.
0 0.2 0.4 0.6 0.8 1
Kilometres
This drawing is not to be used in whole in or part other than for the intended purposeand project as defined on this drawing. Refer to the contract for full terms and conditions.
1:12,500SEC7909
Drawn Check'd Appr'dPurpose of revisionRev. Date Rev'd
Legend
±
Greater Dublin Drainage Project
Project
Proposed Project Boundary
Proposed Outfall Pipeline Route (Marine Section)
Baldoyle Bay SPA
RPS estuarine survey area
!( Wigeon
Copyright © Ordnance Survey Ireland.Licence number 3/3/34/Irish Water.Service Layer Credits: Sources: Esri, HERE, DeLorme, USGS,Intermap, INCREMENT P, NRCan, Esri Japan, METI, Esri China(Hong Kong), Esri Korea, Esri (Thailand), MapmyIndia, NGCC, ©OpenStreetMap contributors, and the GIS User Community
W:\7
909
SE
C -
RP
S B
elfa
st, W
W E
IS N
IS O
rnith
olog
y\Te
chn
ica
l\Gra
phi
cs\G
IS\m
xd\fi
gure
s\E
S_o
rnith
\ES
_tec
hrep
\sec
7909
_A10
1_S
peci
esD
istr
ibut
ion_
Dec
2014
Mar
2018
_DD
P.m
xd
Figure A10.33 Wigeon Records in Baldoyle Bay (Dec2014 to March 2018)
17/10/17 Draft CH
CH RI RIInfrastructure updated1 19/03/18 KAG
0 RI RIKAG
CH RI RIAdditional survey data1 21/05/18 KAG

!(
!(
!(!(
!(
!(
!(
!(
!(!(
!(
!(
!(
!(
!(
!(
!(
!(
!(
!(
!(
!(!(
!(
!(
!(
!(
!(
!(
!(!(!(
!(
!(
!(
!(
!(
!(
!(
!(
!(
!(
!(
!(!(
!(
!(
!(
!(
!(
!(
!(
!(
!(
!(
!(
!(
!(
!(
!(
!(
!(
!(
!(
!(
!(
!(
!(
!(
!(
!(
!(
!(
!(
!(
!(!(
!(
!(
!(
!(
!(
!(
!(
!(
!(
!(
!(
!(
!(
!(
!(
!(
!(
!(
!(
!(
!(
!(
!(
!(!(
!(
!(
!(
!(
!(
!(
!(
!(
!(
!(
!(
!(
!(
!(
!(
!(
!(
!(
!(
!(
!(
!(
!(
!(
!(
!(
!(
!(
!( !(
!(
!(
!(!(
!(
!(
!(
!(
!(
!(!(
!(
!(
!(
!(
!(
!(
!(
!(
!(
!(
!(!(!(
!(
!(
!(
!(
!(
!(
!(
!(
!(
!(
!(
!(
!(
!(
!(
!(
!(
!(
!(
!(
!(
!(
!(
!(
!(
!(
!(
!(
!(
!(
!(
!(
!(
!(
!(
!(
!(
!(!(
!(
!(
!(
!(
!(
!(
!(
!(
!(
!(
!(
!(
!(
!(
!( !(
!(
!(
!(!(
!(
!(
!(
!(
!(
!(
!(
!(
!(
!(
!(
!(
!(
!(
!(!(
!(
!(
!(
!(
!(
!(
!(
!(
!(
!(!(
!(
!(
!(
!(
!(
!(
!(
!(
!(
!(
!(
!(
!(
!(!(
!(
!(
!(
!(
!(
!(
!(
!(
!(
!(
!(
!(
!(
!(
!(
!(
!(
!(
!(
!( !(!(
!(
!(
!(
!(
!(!( !(
!(
!(
!(
!(
!(
!(
!(
!(
!(
!(
!(
!(
!(
!(
!(
!(
!(
!(
!(
!( !(
!(
!(
!(
!(
!(
!(
!(
!( !(
!(
!(
!(
!(
!(
!(
!(
!(
!(
!(
!(
!(
!(
!(
!(
!(
!(
!(
!(
!(!(
!(
!(
!(
!(
!(
!(
!(
!(!(
!( !(
!(
!(
!(
!(!(
!(
!(
!(
!(
!(
!(
!(
!(
!(
!(
!(
!(
!(
!(
!(
!(
!(
!(
!(
!(
!(
!(
!(
!(
!(
!(
!(
!(
!(
!(
!(
!(
!(
!(
!(
!(
!(
!(
!(
!(
!(
!(
!(
!(
!(
!(
!(
!(
!(
!(
!(
!(
!( !(
!(
!(
!(!(
!(
!(
!(
!(
!(
!(
!(
!(
!(!(
!(
!(
!(
!(
!(
!(
!(
!(
!(
!(
!(
!(!(
!(
!(
!(
!(
!(
!(!(
!(
!(
!(
!(
!(
!(
!(
!(
!(
!(
!(
!(
!(
!(
!(
!(
!(
!(
!(
!(
!(
!(
!(
!(
!(
!(
!(
!(
!(
!(
!(
!(
!(
!(
!(!(
!(
!(
!(
!(
!(
!(
!(
!(
!(
!(
!(
!(
!(
!(
!(
!(!(
!(
!(
!(!(
!(
!(
!(
!(
!(
!(
!(
!(
!(
!(
!(
!(
!(
!(
!(
!(
!(
!(
!(
!(
!(
!(
!(
!(
!(
!(
!(
!(
!(
!(
!(
!(
!(
!(
!(
!(
!(
!(
!(
!(
!(
!(
!(
!(
!(
!(
!(
!(
!(!(
!(
!(
!(
!(
!(
!(
!( !(
!(
!(
!(
!(
!(
!(
!(
!(
!(
!(
!(
!(
!(
!(
!(
!(
!(
!(
!(
!(
!(!(
!(
!(
!(
!(
!(
!(
!(
!(
!(
!(
!(
!(
!(
!(
!(
!(
!(
!(
!(
!(
!(
!(
!(!(
!(
!(
!(
!(
!(
!(
!(
!(
!(
!(
!(
!(
!(
!(
!(
!(!(
!(
!(
!(!( !(
!(
!(
!(
!(
!(!( !(
!(
!(
!(
!(
!(
!(
!(
!(
!(
!(
!(
!(
!(
!(
!(
!(
!(
!(
!(
!(
!(
!(
!( !(
!(
!(
!(
!(
!(
!(
!(
!(
!(
!(
!(
!(
!( !(
!(
!(
!(
!(
!(
!(!(
!(
!(
!(
!(
!(
!(
!(
!(
!(
!(
!(
!(
!(
!(
!(
!(
!(
!(
!(
!(
!(
!(
!(
!(
!(
!(
!(
!(
!(
!(
!(
!(
!(
!(
!(
!(
!(
!(
!(
!(
!(
!(
!(
!(!(
!(
!(
!(
!(!(
!(
!(
!(
!(
!(
!(!(
!(
!(
!(
!(!(
!(
!(
!( !(
!(
!(
!(!(
!(
!(
!(
!(
!(
!(
!(
!(
!(
!(
!(
!(
!(
!(
!(
!(
!(
!(
!(
!(
!(
!(
!(
!(
!(
!(
!(
!(
!(
!(
!(
!(
!(
!(
!(
!(
!(
!(
!(
!(
!(
!(
!(
!(
!(
!(
!(
!(
!(
!(
!(
!(
!(
!(
!(
!(
!(
!(
!(
!(
!(
!(
!(
!(
!(
!(
!(!(
!(
!(
!(
!(
!(
!(
!(
!(
!(
!(
!(
!(
!(
!(
!(
!(
!(
!(
!(!(
!(
!(
!(
!(
!(
!(
!(
!(
!(
!(
!(
!(
!(
!(
!(
!(
!(
!(
!(
!(
!(
!(
!(
!(
!(
!(
!(
!(
!(
!(
!(
!(
!(
!(
!(
!(
!(
!(
!(
!(
!(!(
!(
!(
!(
!(
!(
!(
!(
!(
!(
!(
!(
!(
!(
!(
!(
!(
!(
!(
!(
!(
!(
!(
!(
!(
!(
!(
!(
!(
!(
!(
!(
Drawing Title
Drawing Status
Drawing No.32102902-EIAR-A1034
FinalScale @ A3
Job No.
0 0.2 0.4 0.6 0.8 1
Kilometres
This drawing is not to be used in whole in or part other than for the intended purposeand project as defined on this drawing. Refer to the contract for full terms and conditions.
1:12,500SEC7909
Drawn Check'd Appr'dPurpose of revisionRev. Date Rev'd
Legend
±
Greater Dublin Drainage Project
Project
Proposed Project Boundary
Proposed Outfall Pipeline Route (Marine Section)
Baldoyle Bay SPA
RPS estuarine survey area
!( Black-headed Gull
Copyright © Ordnance Survey Ireland.Licence number 3/3/34/Irish Water.Service Layer Credits: Sources: Esri, HERE, DeLorme, USGS,Intermap, INCREMENT P, NRCan, Esri Japan, METI, Esri China(Hong Kong), Esri Korea, Esri (Thailand), MapmyIndia, NGCC, ©OpenStreetMap contributors, and the GIS User Community
W:\7
909
SE
C -
RP
S B
elfa
st, W
W E
IS N
IS O
rnith
olog
y\Te
chn
ica
l\Gra
phi
cs\G
IS\m
xd\fi
gure
s\E
S_o
rnith
\ES
_tec
hrep
\sec
7909
_A10
1_S
peci
esD
istr
ibut
ion_
Dec
2014
Mar
2018
_DD
P.m
xd
Figure A10.34 Black-headed Gull Records in BaldoyleBay (Dec 2014 to March 2018)
17/10/17 Draft CH
CH RI RIInfrastructure updated1 19/03/18 KAG
0 RI RIKAG
CH RI RIAdditional survey data1 21/05/18 KAG

!(!(
!(
!(
!(
!(
!(
!(
!(
!(
!(
!(
!(
!(
!(
!(
!(
!(
!(
!(
!(
!(
!(
!(
!(!(
!(
!(
!(
!( !(
!(
!(
!(
!(
!(
!(
!(
!(
!(
!(
!(
!(
!(
!(
!(
!(
!(
!(
!(
!(
!(
!(
!(
!(
!(
!(
!(
!(
!(
!(
!(
!(
!(
!(
!(!(
!(
!(
!(
!(
!(
!(
!(
!(
!(
!(
!(
!(
!(
!(
!(
!(!(
!(
!(
!(
!(
!(
!(
!(
!(
!(
!(
!(
!(
!(!(
!(
!(
!(
!(
!(
!(
!(
!(
!(
!(
!(
!(
!(
!(
!(
!(
!(
!(
!(
!(
!(
!(
!(
!(
!(
!(
!(
!(
!(
!(
!(
!(
!(
!(
!(
!(
!(
!(
!(
!(
!(
!(
!(
!(
!(
!(
!(
!(
!(
!(
!(
!(
!(
!(
!(
!(
!(
!(
!(
!(
!(
!(
!(
!(
!(
!(
!(
!(
!(
!(
!(
!(
!(
!(
!(
!(
!(
!(
!(
!(
!(
!(
!(
!(
!(!(
!(
!(
!(
!(
!(
!(
!(
!(
!(
!( !(
!(
!(
!(
!(
!(
!(
!(
!(
!(
!(
!(
!(
!(
!(
!(
!(
!(
!(
!(
!(
!(!(
!(
!(
!(
!(
!(
!(
!(
!(
!(
!(
!(
!(
!(
!(
!(
!(
!(
Drawing Title
Drawing Status
Drawing No.32102902-EIAR-A1035
FinalScale @ A3
Job No.
0 0.2 0.4 0.6 0.8 1
Kilometres
This drawing is not to be used in whole in or part other than for the intended purposeand project as defined on this drawing. Refer to the contract for full terms and conditions.
1:12,500SEC7909
Drawn Check'd Appr'dPurpose of revisionRev. Date Rev'd
Legend
±
Greater Dublin Drainage Project
Project
Proposed Project Boundary
Proposed Outfall Pipeline Route (Marine Section)
Baldoyle Bay SPA
RPS estuarine survey area
!( Common Gull
Copyright © Ordnance Survey Ireland.Licence number 3/3/34/Irish Water.Service Layer Credits: Sources: Esri, HERE, DeLorme, USGS,Intermap, INCREMENT P, NRCan, Esri Japan, METI, Esri China(Hong Kong), Esri Korea, Esri (Thailand), MapmyIndia, NGCC, ©OpenStreetMap contributors, and the GIS User Community
W:\7
909
SE
C -
RP
S B
elfa
st, W
W E
IS N
IS O
rnith
olog
y\Te
chn
ica
l\Gra
phi
cs\G
IS\m
xd\fi
gure
s\E
S_o
rnith
\ES
_tec
hrep
\sec
7909
_A10
1_S
peci
esD
istr
ibut
ion_
Dec
2014
Mar
2018
_DD
P.m
xd
Figure A10.35 Common Gull Records in Baldoyle Bay(Dec 2014 to March 2018)
17/10/17 Draft CH
CH RI RIInfrastructure updated1 19/03/18 KAG
0 RI RIKAG
CH RI RIAdditional survey data1 21/05/18 KAG

!(!(
!(
!(
!(
!(
!(
!(
!(
!(
!(
!(
!(
!(
!(
!(
!(
!(
!(
!(
!(
!(
!(
!(
!(
!(
!(
!(
!(
!(
!(
!(
!(
!(
!(
!(
!(
!( !(
!(
!(
!(
!(
!(
!(
!(
!(
!(
!(
!(
!(
!(
!(
!(
!(
!(
!(
!(
!(
!(
!(
!(
!(
!(
!(
!(
!(
!(
!(
!(
!(
!(
!(
!(
!(
!(
!(
!(
!(
!(!(
!(!(
!(
!(
!(
!(
!(
!(
!(!(
!( !(
!(
!(
!(
!(
!(
!(!(
!(
!(
!(
!(
!(
!(
!(
!(
!(!(
!(
!(
!(
!(
!(
!(
!(
!(
!(
!(
!(
!(
!(
!(
!(!(
!(
!(
!(
!(
!(
!(
!(
!(
!(
!(
!(
!(
!(
!(
!(
!(
!(
!(
!(
!(
!(
!(
!(
!(
!(
!(
!(
!(
!(
!(
!(
!(
!(
!(
!(
!(
!(
!(
!(
!(
!(
!(
!(
!(
!(!(
!(
!(
!(
!(
!(
!(
!(
!(
!(
!(
!(
!(
!(
!(
!(
!(
!(
!(
!(
!(
!(
!(
!(!(
!(!(
!(
!(
!(
!(
!(
!(
!(
!(
!(
!(
!(
!(
!(
!(
!(
!(
!(
!(
!(
!(!(
!(
!(
!(
!(
!(
!(
!(
!(
!(
!(
!(
!(
!(
!(
!(
!(
!(
!(
!(
!(
!(!(
!(
!(!(
!(
!(
!(
!(
!(
!(!(
!(
!(
!(!(
!(
!(
!(
!(
!(
!(
!(
!(
!(
!(
!(
!(
!(
!(
!(
Drawing Title
Drawing Status
Drawing No.32102902-EIAR-A1036
FinalScale @ A3
Job No.
0 0.2 0.4 0.6 0.8 1
Kilometres
This drawing is not to be used in whole in or part other than for the intended purposeand project as defined on this drawing. Refer to the contract for full terms and conditions.
1:12,500SEC7909
Drawn Check'd Appr'dPurpose of revisionRev. Date Rev'd
Legend
±
Greater Dublin Drainage Project
Project
Proposed Project Boundary
Proposed Outfall Pipeline Route (Marine Section)
Baldoyle Bay SPA
RPS estuarine survey area
!( Great Black-backed Gull
Copyright © Ordnance Survey Ireland.Licence number 3/3/34/Irish Water.Service Layer Credits: Sources: Esri, HERE, DeLorme, USGS,Intermap, INCREMENT P, NRCan, Esri Japan, METI, Esri China(Hong Kong), Esri Korea, Esri (Thailand), MapmyIndia, NGCC, ©OpenStreetMap contributors, and the GIS User Community
W:\7
909
SE
C -
RP
S B
elfa
st, W
W E
IS N
IS O
rnith
olog
y\Te
chn
ica
l\Gra
phi
cs\G
IS\m
xd\fi
gure
s\E
S_o
rnith
\ES
_tec
hrep
\sec
7909
_A10
1_S
peci
esD
istr
ibut
ion_
Dec
2014
Mar
2018
_DD
P.m
xd
Figure A10.36 Great Black-backed Gull Records inBaldoyle Bay (Dec 2014 to March 2018)
17/10/17 Draft CH
CH RI RIInfrastructure updated1 19/03/18 KAG
0 RI RIKAG
CH RI RIAdditional survey data1 21/05/18 KAG

!(
!(
!(
!(!(
!(
!(
!(
!(
!(
!( !(
!( !(
!(
!(
!(
!(
!(
!(
!(!(
!(
!(
!(
!(!(
!(!(
!(
!(
!(!(
!(
!(
!(
!(
!(
!(
!(
!(
!(
!(
!(!(
!(
!(
!(!(
!(
!(
!(
!(
!(!(
!(
!(
!(
!(
!(
!(
!(
!(
!(
!(
!(
!(
!(
!(
!(
!(
!(
!(
!(
!(
!(
!(
!(
!(
!(
!(
!(
!(
!(
!(
!(
!(
!(
!(!(
!(
!(
!(
!(
!(
!(
!(
!(
!(
!(!(
!(
!(
!(
!(
!(
!(
!(
!(
!(
!(!(
!(
!(
!(!(
!(
!(
!(
!(
!(
!(
!(
!(!(
!(
!(
!(
!(
!(
!(
!(
!(
!(
!(
!(
!(
!(
!(
!(
!(
!(
!(
!(
!(
!(
!(
!(
!(
!(
!(
!(
!(
!(
!(
!(
!(
!(
!(
!(
!(
!(
!(
!(
!(
!(
!(
!(
!(
!(
!(
!(
!(
!(!(
!(
!(
!(
!(
!(
!(
!(
!(
!(
!(
!(
!(
!(
!(
!(
!(
!(
!(
!(
!(
!(
!(
!(
!(
!(
!(
!(
!(
!(
!(
!(
!(
!(
!(
!(!(
!(
!(
!(
!(
!(
!(
!(
!(
!(
!(
!(
!(
!(
!(
!(!(
!(
!(!(
!(
!(!(
!(
!(
!(
!(
!(
!(
!(
!(
!(
!(
!(
!(!(
!(
!(
!(
!(
!(
!(
!(
!(
!(
!(
!(
!(
!(
!(
!(
!(
!(
!(
!(
!(
!(
!(!(
!(
!(!(
!(
!(
!(
!(
!(
!(
!(
!(
!(
!(
!(
!(
!(
!(
!(
!(
!(
!(
!(
!(!(
!(
!(
!(
!(
!( !(
!(
!(
!(!(
!(
!(
!(
!(!(!(
!(
!(
!(
!(
!(
!(
!(
!(
!(
!(
!(
!(
!( !(
!(
!(
!(
!(
!(
!(
!(
!(
!(
!(
!(
!(!(
!(
!(
!(
!(
!(
!(
!(
!(
!(
!(
!(
!(
!(
!(
!(
!(
!(
!(
!(
!(
!(
!(
!(
!(!(
!(
!(
!(
!(
!(
!(
!(
!(
!(
!(
!(
!(
!(
!(
!(
!(
!(
!(
!(
!(
!(
!(
!(
!(
!(
!(
!(
!(
!(!(
!(
!(
!(
!(
!(
!(
!(
!(
!(
!(
!(
!(
!(
!(
!(
!(
!(
!(
!(
!( !(
!(
!(
!(
!(
!(
!(
!(!(
!( !(
!(
!(
!(
!(
!(
!(
!(!(
!(
!(
!(
!(!(
!(
!(!(
!(
!(!(
!(
!(
!(
!(
!(
!(
!(
!(
!(
!(
!(
!(
!(
!(
!(
!(
!(
!(
!(
!(
!(
!(
!(
!(
!(
!(
!(
!(
!(!(
!(
!(
!(!(
!(
!(
!(
!(
!(
!(
!(
!(
!(
!(
!(
!(
!(
!(
!(
!(
!(
!(
!(
!(
!(
!(
!(
!(
!(
!(
!(
!(
!(
!(
!(!(
!(
!(
!(
!(
!(
!(
!(
!(
!(
!(
!(!(
!(
!(
!(
!(
!(
!(
!(
!(
!(
!(
!(
!(
!(
!(
!(
!(
!(
!( !(
!(
!(!(
!(
!(
!(
!(
!(
!(
!(
!(
!(
!(
!(
!(
!(
!(
!(
!(
!(
!(
!(
!(
!( !(
!(
!(
!(
!(
!(
!(
!(
!(
!(
!(
!(
!(
!(!(
!(
!(
!(
!(
!(
!(
!(
!(
!(
!(
!(
!(
!(
!(
!(
!(
!(
!(
!(
!(!(
!(
!(
!(
!(
!(
!(
!(
!(
!(
!(
!(
!(
!( !(
!(
!(
!(
!(!(
!(
!(
!(
!(
!(
!(
!(
!(
!(
!(
!(
!(
!(
!(
!(
!(
!(
!(
!(
!(
!(
!(
!(
!(
!(
!(
!(
!(
!(
!(
!(
!(
!(
!(
!(
!(
!(
!(
!(
!(
!(
!(
!(
!(
!(
!(
!(
!(
!(!(
!(
!(
!(
!(
!(
!(
!(!(
!(
!(
!(
!(
!(
!(
!(
!(
!(
!(
!(
!(
!(!(
!(!(
!(
!(
!(
!(
!(
!(
!(
!(
!(
!(
!(
!(
!(
!(
!(
!(
!(
!(
!(
!(
!(
!(
!(
!(
!(
!(
!(
!(
!(
!(
!(
!(
!(
!(
!(!(
!(
!(
!(
!(
!(
!(
!(
!(
!(
!(
!(
!(
!(!(
!(
!(
!(
!(
!(
!(
!(
!(
!(
!(
!(
!(
!(
!(
!(
!(
!(
!(
!(
!(
!(
!(
!(
!(
!(
!(
!(
!(
!(
!(
!(
!(
!(
!(
!(!(
!(
!(
!(
!(
!(
!(
!(
!(
!(
!(
!(
!(
!(
!(
!(
!(
!(
!(
!(
!(
!(
!(
!(
!(
!(
!( !(
!(
!(
!(
!(
!(
!(
!(!(
!(
!(
!( !(
!(
!(
!(
!(
!(
!(
!(
!(
!(
!(
!(
!(
!(
!(
!(
!(
!(
!(
!(
!(
!(
!(
!(
!(
!(
!(
!(
!(
!(
!(
!(
!(
!(
!(
!(
!(
!(
!(
!( !(
!(
!( !(
!(
!(
!(
!(
!(
!(
!(
!(
!(
!(
!(
!(
!(
!(
!(
!(
!(
!(
!(
!(
!(
!(
!(
!(
!(
!(
!(
!(
!(
!(
!(
!(!(
!(
!(
!(
!(
!(
!(
!(
!(
!(
!(
!(
!(
!(
!(
!(
!(
!(
!(
!(
!(
!(
!(
!(
!(
!(!(
!(
!(
!(
!(
!(!(
!(
!(
!(
!(
!(
!(
!(
!(
!(
!(!(
!(
!(
!(
!(
!(
!(
!(
!(
!(
!(
!(
!(
!(
!(
!(
!(
!(
!(
!(
!(
!(
!(
!(
!(
!(
!(
!(
!(
!(
!(
!(
!(
!(
!(
!(
!(
!(
!(
!(
!(
!(
!(
!(
!(
!(
!(
!(
!(
!(
!(
!(
!(
!(
!(
!( !(
!(
!(
!(
!(
!(
!(
!(!(
!(
!(
!(
!(
!(
!(
!(
!(
!(
!(
!(!(
!(
!( !(
!(
!(
!(
!(
!(
!(
!(
!(
!(
!(
Drawing Title
Drawing Status
Drawing No.32102902-EIAR-A1037
FinalScale @ A3
Job No.
0 0.2 0.4 0.6 0.8 1
Kilometres
This drawing is not to be used in whole in or part other than for the intended purposeand project as defined on this drawing. Refer to the contract for full terms and conditions.
1:12,500SEC7909
Drawn Check'd Appr'dPurpose of revisionRev. Date Rev'd
Legend
±
Greater Dublin Drainage Project
Project
Proposed Project Boundary
Proposed Outfall Pipeline Route (Marine Section)
Baldoyle Bay SPA
RPS estuarine survey area
!( Herring Gull
Copyright © Ordnance Survey Ireland.Licence number 3/3/34/Irish Water.Service Layer Credits: Sources: Esri, HERE, DeLorme, USGS,Intermap, INCREMENT P, NRCan, Esri Japan, METI, Esri China(Hong Kong), Esri Korea, Esri (Thailand), MapmyIndia, NGCC, ©OpenStreetMap contributors, and the GIS User Community
W:\7
909
SE
C -
RP
S B
elfa
st, W
W E
IS N
IS O
rnith
olog
y\Te
chn
ica
l\Gra
phi
cs\G
IS\m
xd\fi
gure
s\E
S_o
rnith
\ES
_tec
hrep
\sec
7909
_A10
1_S
peci
esD
istr
ibut
ion_
Dec
2014
Mar
2018
_DD
P.m
xd
Figure A10.37 Herring Gull Records in Baldoyle Bay(Dec 2014 to March 2018)
17/10/17 Draft CH
CH RI RIInfrastructure updated1 19/03/18 KAG
0 RI RIKAG
CH RI RIAdditional survey data1 21/05/18 KAG

!(
!(
!(
!(
Drawing Title
Drawing Status
Drawing No.32102902-EIAR-A1038
FinalScale @ A3
Job No.
0 0.2 0.4 0.6 0.8 1
Kilometres
This drawing is not to be used in whole in or part other than for the intended purposeand project as defined on this drawing. Refer to the contract for full terms and conditions.
1:12,500SEC7909
Drawn Check'd Appr'dPurpose of revisionRev. Date Rev'd
Legend
±
Greater Dublin Drainage Project
Project
Proposed Project Boundary
Proposed Outfall Pipeline Route (Marine Section)
Baldoyle Bay SPA
RPS estuarine survey area
!( Kittiwake
Copyright © Ordnance Survey Ireland.Licence number 3/3/34/Irish Water.Service Layer Credits: Sources: Esri, HERE, DeLorme, USGS,Intermap, INCREMENT P, NRCan, Esri Japan, METI, Esri China(Hong Kong), Esri Korea, Esri (Thailand), MapmyIndia, NGCC, ©OpenStreetMap contributors, and the GIS User Community
W:\7
909
SE
C -
RP
S B
elfa
st, W
W E
IS N
IS O
rnith
olog
y\Te
chn
ica
l\Gra
phi
cs\G
IS\m
xd\fi
gure
s\E
S_o
rnith
\ES
_tec
hrep
\sec
7909
_A10
1_S
peci
esD
istr
ibut
ion_
Dec
2014
Mar
2018
_DD
P.m
xd
Figure A10.38 Kittiwake Records in Baldoyle Bay (Dec2014 to March 2018)
17/10/17 Draft CH
CH RI RIInfrastructure updated1 19/03/18 KAG
0 RI RIKAG
CH RI RIAdditional survey data1 21/05/18 KAG

!(
!(
!(
!(
!(
!(!(
!( !(
!(
!(
!(
!(
!(
!(
!(!(
!(
!(
!(
!(
!(
!(
!(
!(
!(
!(
!(
!(
!(!(
!(
!(
!(
!(
!(
!(
!(
!(
!(
!(
!(
!(
!(
!(
!(
!(
!(
!(
!(
!(
!(
!(
!(
!(
!(
!(
!(
!(
!(
!(!(
!(!(
!(
!(
!(
!(
!(
!(
!(
!(
!(
!(!(
!(
!(
!(
!(
!(
!(
!(
!(
!(
!(
!(
!(
!(
!(
!(
!(
!(
!(!(
!(
!(
!(
!(
!( !(
!(
!(
!(
!(
!(
!(
!(
!(
!(
!(
!(
!(
!(
!(
!(
!(
!(
!(
!(
!(
!(
!(
!(
!(
!(
!(
!(
!(
!(
!(
!(
!(
!(!(
!(
!(
!(
!(!(
!(
!(
!(
!(
!(
!(
!(
!(
!(
!(
!(
!(
!(
!(
!(
!(
!(
!(
!(
!(
!(
!(
!(
!(
!(
!(
!(
!(
!(
!(
!(
!(
!(
!(
!(
!(
!( !(
!(
!(
!(
!(
!(
!(
!(
!(
!(
!(
!(
!(
!(
!(
!(
!(
!(
!(
!(
!(
!(
!(
!(
!(
!(
!(
!(
!(
!(
!(
!(
!(
!(
!(
!(
!(
!(
!(
!(
!(
!(!(
!(
!(
!(
!(
!(
!(!(
!(
!(
!(
!(
!(
!(
!(
!(
!(
!(
!(
!(
!(
!(
!( !(
!(
!(
!( !(
!(
!(
!(
!(
!(!(
!(
!(
!(
!(
!(
!(
!(
!(
!(
!(
!( !(
!(
!(
!(
!(
!(
!(
!(
!(!(
!(
!(
!(
!(
!( !(
!(
!(
!(
!(
!(
!(
!(
!(
!(
!(
!(
!(
!(
!(
!(
!(
!(
!(
!(
!(
!(
Drawing Title
Drawing Status
Drawing No.32102902-EIAR-A1039
FinalScale @ A3
Job No.
0 0.2 0.4 0.6 0.8 1
Kilometres
This drawing is not to be used in whole in or part other than for the intended purposeand project as defined on this drawing. Refer to the contract for full terms and conditions.
1:12,500SEC7909
Drawn Check'd Appr'dPurpose of revisionRev. Date Rev'd
Legend
±
Greater Dublin Drainage Project
Project
Proposed Project Boundary
Proposed Outfall Pipeline Route (Marine Section)
Baldoyle Bay SPA
RPS estuarine survey area
!( Lesser Black-backed Gull
Copyright © Ordnance Survey Ireland.Licence number 3/3/34/Irish Water.Service Layer Credits: Sources: Esri, HERE, DeLorme, USGS,Intermap, INCREMENT P, NRCan, Esri Japan, METI, Esri China(Hong Kong), Esri Korea, Esri (Thailand), MapmyIndia, NGCC, ©OpenStreetMap contributors, and the GIS User Community
W:\7
909
SE
C -
RP
S B
elfa
st, W
W E
IS N
IS O
rnith
olog
y\Te
chn
ica
l\Gra
phi
cs\G
IS\m
xd\fi
gure
s\E
S_o
rnith
\ES
_tec
hrep
\sec
7909
_A10
1_S
peci
esD
istr
ibut
ion_
Dec
2014
Mar
2018
_DD
P.m
xd
Figure A10.39 Lesser Black-backed Gull Records inBaldoyle Bay (Dec 2014 to March 2018)
17/10/17 Draft CH
CH RI RIInfrastructure updated1 19/03/18 KAG
0 RI RIKAG
CH RI RIAdditional survey data1 21/05/18 KAG

!(
!(
!(
!(
!(!(
!(
!(
!(
!(
!(
!(
!(
!(
!(
!(
!(
!(
!(
!(!(
!(
!(
!(
!(
!(
!(
!(
!(
!(
!(
!(
!(
!(
!(
!(
!(
!(
!( !(
!(
!(
!(!(
!(
!(
!(
!(
!(
!(
!(
!(
!(
!(!(
!(
!(
!(
!(!(
!(
!(
!(
!(
!(
!(
!(!(
!( !(
!(
!(
!(
!(
!(!(
!(
!(
!(
!(
!(
!(!(
!(
!(
!(
!(
!(
!(
!(!(
!(!(
!(
!(
!(
!(!(
!(
!(
!(
!(
!(
!(
!(
!(
!(!(
!(
!(
!(
!(
!(
!(
!(!(
!(
!(
!(
!(!(
!(!(
!(
!(
!(
!(
!(
!(
!(
!(
!(
!(
!(
!(
!(
!(
!(
!(
!(
!(
!(
!(
!(
!(
!(
!(!(
!(!( !(
!(
!(
!(
!(
!(
!(
!(
!(
!(
!(
!(
!(
!(
!(
!(
!(
!(
!(
!(
!(
!(
!(
!(
!(
!(
!(
!(
!(
!(
!(
!( !(!(
!(
!(
!(
!(
!(!(
!(
!(
!(
!(
!(
!(
!(
!(
!(
!( !(
!(
!(
!(
!(
!(
!(
!(
!(
!(
!(!(
!(
!(
!(
!(
!(
!(
!(
!(
!(!(
!(
!(
!(
!(
!(
!(
!(
!(
!(
!(
!(
!(
!(
!(!(
!(
!(
!(
!(
!(
!(
!(
!(
!(
!(
!(
!(
!(
!(
!(
!(
!(
!(
!(
!(
!(
!(
!(
!(
!(
!(
!(
!(
!(
!(
!(
!(
!(
!(
!(
!(
!(
!(!(
!(
!(!(
!(
!(
!(
!(
!(
!( !(
!(
!(
!(
!(
!(
!(
!(
!(
!(
!(
!(
!(
!(
!(
!(!(
!(!(
!(
!(
!(
!(
!(
!(
!(!(
!(
!(
!(
!(
!(
!(
!(
!(
!(
!(
!(
!(
!(
!(
!(
!(!(
!(
!(
!(
!(
!(
!(
!(
!(
!(
!(
!(
!(
!(
!(
!(
!(
!(
!(
!(
!(!(
!(
!(
!(
!(
!(
!(
!(
!(
!(
!( !(
!(
!(
!(
!(!(
!(
!(
!(
!(
!(
!(
!(
!(
!(
!(
!(
!(
!(
!(
!(!(
!(
!(
!(
!(
!(
!(
!(
!(
!(!(
!(
!(!(
!(
!(
!(
!(
!(
!(
!(
!(
!(
!(
!(
!(
!(
!(
!( !(!(
!(
!(
!(!(!(
!(
!(
!(
!(
!(
!(
!(
!(
!(
!(
!(!(
!(
!(
!(
!(
!(
!(
!(
!(
!(
!(
!(!(
!(
!(
!(
!(
!(
!(
!(
!(
!(
!(
!(
!(
!(
!(
!(
!(
!(
!(
!(
!(
!(
!(
!(
!(
Drawing Title
Drawing Status
Drawing No.32102902-EIAR-A1040
FinalScale @ A3
Job No.
0 0.2 0.4 0.6 0.8 1
Kilometres
This drawing is not to be used in whole in or part other than for the intended purposeand project as defined on this drawing. Refer to the contract for full terms and conditions.
1:12,500SEC7909
Drawn Check'd Appr'dPurpose of revisionRev. Date Rev'd
Legend
±
Greater Dublin Drainage Project
Project
Proposed Project Boundary
Proposed Outfall Pipeline Route (Marine Section)
Baldoyle Bay SPA
RPS estuarine survey area
!( Little Egret
Copyright © Ordnance Survey Ireland.Licence number 3/3/34/Irish Water.Service Layer Credits: Sources: Esri, HERE, DeLorme, USGS,Intermap, INCREMENT P, NRCan, Esri Japan, METI, Esri China(Hong Kong), Esri Korea, Esri (Thailand), MapmyIndia, NGCC, ©OpenStreetMap contributors, and the GIS User Community
W:\7
909
SE
C -
RP
S B
elfa
st, W
W E
IS N
IS O
rnith
olog
y\Te
chn
ica
l\Gra
phi
cs\G
IS\m
xd\fi
gure
s\E
S_o
rnith
\ES
_tec
hrep
\sec
7909
_A10
1_S
peci
esD
istr
ibut
ion_
Dec
2014
Mar
2018
_DD
P.m
xd
Figure A10.40 Little Egret Records in Baldoyle Bay(Dec 2014 to March 2018)
17/10/17 Draft CH
CH RI RIInfrastructure updated1 19/03/18 KAG
0 RI RIKAG
CH RI RIAdditional survey data1 21/05/18 KAG

!(
!(
!(
!(
!(
!(
!(
!(
!(
!(
!(
!(
!(
!(
!(
!(
!(
!(
!(
!(
!(
!(
!(
!(
!(
!(
!(
!(!(!(!(!(
!(
!(
!(!(
!(!(
!(!(!(
!(
!(
Drawing Title
Drawing Status
Drawing No.32102902-EIAR-A1041
FinalScale @ A3
Job No.
0 0.2 0.4 0.6 0.8 1
Kilometres
This drawing is not to be used in whole in or part other than for the intended purposeand project as defined on this drawing. Refer to the contract for full terms and conditions.
1:12,500SEC7909
Drawn Check'd Appr'dPurpose of revisionRev. Date Rev'd
Legend
±
Greater Dublin Drainage Project
Project
Proposed Project Boundary
Proposed Outfall Pipeline Route (Marine Section)
Baldoyle Bay SPA
RPS estuarine survey area
!( Buzzard
Copyright © Ordnance Survey Ireland.Licence number 3/3/34/Irish Water.Service Layer Credits: Sources: Esri, HERE, DeLorme, USGS,Intermap, INCREMENT P, NRCan, Esri Japan, METI, Esri China(Hong Kong), Esri Korea, Esri (Thailand), MapmyIndia, NGCC, ©OpenStreetMap contributors, and the GIS User Community
W:\7
909
SE
C -
RP
S B
elfa
st, W
W E
IS N
IS O
rnith
olog
y\Te
chn
ica
l\Gra
phi
cs\G
IS\m
xd\fi
gure
s\E
S_o
rnith
\ES
_tec
hrep
\sec
7909
_A10
1_S
peci
esD
istr
ibut
ion_
Dec
2014
Mar
2018
_DD
P.m
xd
Figure A10.41 Buzzard Records in Baldoyle Bay (Dec2014 to March 2018)
17/10/17 Draft CH
CH RI RIInfrastructure updated1 19/03/18 KAG
0 RI RIKAG
CH RI RIAdditional survey data1 21/05/18 KAG

!(
!(
!(
!(
!(
!(
!(
!(
!(
!(!(
!(
Drawing Title
Drawing Status
Drawing No.32102902-EIAR-A1042
FinalScale @ A3
Job No.
0 0.2 0.4 0.6 0.8 1
Kilometres
This drawing is not to be used in whole in or part other than for the intended purposeand project as defined on this drawing. Refer to the contract for full terms and conditions.
1:12,500SEC7909
Drawn Check'd Appr'dPurpose of revisionRev. Date Rev'd
Legend
±
Greater Dublin Drainage Project
Project
Proposed Project Boundary
Proposed Outfall Pipeline Route (Marine Section)
Baldoyle Bay SPA
RPS estuarine survey area
!( Peregrine
Copyright © Ordnance Survey Ireland.Licence number 3/3/34/Irish Water.Service Layer Credits: Sources: Esri, HERE, DeLorme, USGS,Intermap, INCREMENT P, NRCan, Esri Japan, METI, Esri China(Hong Kong), Esri Korea, Esri (Thailand), MapmyIndia, NGCC, ©OpenStreetMap contributors, and the GIS User Community
W:\7
909
SE
C -
RP
S B
elfa
st, W
W E
IS N
IS O
rnith
olog
y\Te
chn
ica
l\Gra
phi
cs\G
IS\m
xd\fi
gure
s\E
S_o
rnith
\ES
_tec
hrep
\sec
7909
_A10
1_S
peci
esD
istr
ibut
ion_
Dec
2014
Mar
2018
_DD
P.m
xd
Figure A10.42 Peregrine Records in Baldoyle Bay(Dec 2014 to March 2018)
17/10/17 Draft CH
CH RI RIInfrastructure updated1 19/03/18 KAG
0 RI RIKAG
CH RI RIAdditional survey data1 21/05/18 KAG

!(
!(
!(!(
!(
!(
!(
!(
!(
!(
!(
!(
!(
!(
!(
!(
!(
!(
!(
!(
!(
!(
!(
!(!(
!(
!(!(
!(
!(
!(
!(
!(
!(
!(
!(
!(
!(
!(
!(
!(
!(
!(
!(
!(!(
!(
!(
!(
!(
!(
!(
!(
!(
!(
!(
!(
!(!(
!(
!(
!(!(
!(
!(
!(
!(
!(
!(
!(
!(
!(
!(
!(
!(
!(
!(
!(
!(
!(
!(!(
!(
!(
!(
!(
!(
!(
!(
!(
!(
!(
!(
!(
!(
!(
!(
!(
!(
!(
!(
!(
!(!(
!(
!(
!(
!(
!(
!(
!(
!(
!(
!(
!(
!(
!(
!(
!(
!(
!(
!(!(
!(
!(
!(
!(
!(
!(!(
!(
!(
!(
!(
!(
!(
!(
!(
!(
!(
!(
!(
!(
!(
!(
!(
!(
!(
!(
!(
!(
!(
!(
!(
!(
!(
!(
!(
!(
!(
!(
!(
!(
!(
!(
!(
!(
!(
!(
!(
!(
!(
!(
!(
!(
!(
!(
!(
!(
!( !(
!(
!(
!(
!(
!(
!(
!(
!(
!(
!(
!(
!(
!(
!(
!(
!(
!(
!(
!(
!(
!(
!(
!(
!(
!(
!(
!(
!(
!(
!(
!(
!(
!(
!(
!(
!(
!(
Drawing Title
Drawing Status
Drawing No.32102902-EIAR-A1043
FinalScale @ A3
Job No.
0 0.2 0.4 0.6 0.8 1
Kilometres
This drawing is not to be used in whole in or part other than for the intended purposeand project as defined on this drawing. Refer to the contract for full terms and conditions.
1:12,500SEC7909
Drawn Check'd Appr'dPurpose of revisionRev. Date Rev'd
Legend
±
Greater Dublin Drainage Project
Project
Proposed Project Boundary
Proposed Outfall Pipeline Route (Marine Section)
Baldoyle Bay SPA
RPS estuarine survey area
!( Cormorant
Copyright © Ordnance Survey Ireland.Licence number 3/3/34/Irish Water.Service Layer Credits: Sources: Esri, HERE, DeLorme, USGS,Intermap, INCREMENT P, NRCan, Esri Japan, METI, Esri China(Hong Kong), Esri Korea, Esri (Thailand), MapmyIndia, NGCC, ©OpenStreetMap contributors, and the GIS User Community
W:\7
909
SE
C -
RP
S B
elfa
st, W
W E
IS N
IS O
rnith
olog
y\Te
chn
ica
l\Gra
phi
cs\G
IS\m
xd\fi
gure
s\E
S_o
rnith
\ES
_tec
hrep
\sec
7909
_A10
1_S
peci
esD
istr
ibut
ion_
Dec
2014
Mar
2018
_DD
P.m
xd
Figure A10.43 Cormorant Records in Baldoyle Bay(Dec 2014 to March 2018)
17/10/17 Draft CH
CH RI RIInfrastructure updated1 19/03/18 KAG
0 RI RIKAG
CH RI RIAdditional survey data1 21/05/18 KAG

!(
!(!(
!(
!(
!(
!(
!(
!(
!(
!(
!(
!(
!(
!(
!(
!(
!(
!(
!(
!(
!(
!(
!(
!(
!(
!(
!(
!(
!(
!(
!(
!(
!(
!(
!(
!(
!(
!(
!(
!(
!(
!(
!(
!(
!(
!(
!(
!(
!(
!(
!(!(
!(
!(
!(
!(
!(
!(
!(
!(
!(
!(
!(
!(
!(
!(!(
!(
!(
!(
!(!(
!(
!(
!(
!(
!(
!(!(
!(
!(
!(
!(
!(
!(
!(
!(
!(
!(
!(
!(
!(
!(
!(
!(
!(
!(
!(
!(
!(
!(
!(
!(
!(!(
!(
!(
!(
!(
!(!(
!(
!(
!(
!(
!(
!(
!(
!(
!(
!(
!(
!(
!(
!(
!(
!(
!(
!(
!(
!(
!(
!(
!(
!(
!(
!(
!(
!(
!(
!(
!(
!(
!(
!(
!(
!(
!(
!(
!(
!(
!(
!(
!(
!(
!(
!(
!(
!(
!(
!(
!(
!(
!(
!(
!(
!(
!(
!(
!(
!(
!(
!(
!(
!(!(
!(
!(
!(
!(
!(
!(
!(
!(
!(
!(
!(
!(
!(
!(
!(
!(
!(
!(
!(
!(
!(
!(
!(
!(
!(
!(
!(
!(
!(
!(
!(
!(
!(
!(
!(
!(
!(
!(
!(
!(
!(
!(
!(
!(
!(
!(
!(
!(
!(
!(
!(
!(
!(
!(
!(
!(
!(
!(
!(
!(
!(
!(
!(
!(
!(
!(
!(
!(
!(
!(
!(
!(
!(
!(
!(
!(
!(
!(
!(
!(
!(
!(
!(
!(
!(
!(
!(
!(
!(
!(
!(
!(
!(
Drawing Title
Drawing Status
Drawing No.32102902-EIAR-A1044
FinalScale @ A3
Job No.
0 0.2 0.4 0.6 0.8 1
Kilometres
This drawing is not to be used in whole in or part other than for the intended purposeand project as defined on this drawing. Refer to the contract for full terms and conditions.
1:12,500SEC7909
Drawn Check'd Appr'dPurpose of revisionRev. Date Rev'd
Legend
±
Greater Dublin Drainage Project
Project
Proposed Project Boundary
Proposed Outfall Pipeline Route (Marine Section)
Baldoyle Bay SPA
RPS estuarine survey area
!( Shag
Copyright © Ordnance Survey Ireland.Licence number 3/3/34/Irish Water.Service Layer Credits: Sources: Esri, HERE, DeLorme, USGS,Intermap, INCREMENT P, NRCan, Esri Japan, METI, Esri China(Hong Kong), Esri Korea, Esri (Thailand), MapmyIndia, NGCC, ©OpenStreetMap contributors, and the GIS User Community
W:\7
909
SE
C -
RP
S B
elfa
st, W
W E
IS N
IS O
rnith
olog
y\Te
chn
ica
l\Gra
phi
cs\G
IS\m
xd\fi
gure
s\E
S_o
rnith
\ES
_tec
hrep
\sec
7909
_A10
1_S
peci
esD
istr
ibut
ion_
Dec
2014
Mar
2018
_DD
P.m
xd
Figure A10.44 Shag Records in Baldoyle Bay (Dec2014 to March 2018)
17/10/17 Draft CH
CH RI RIInfrastructure updated1 19/03/18 KAG
0 RI RIKAG
CH RI RIAdditional survey data1 21/05/18 KAG

!(
!(
!(
!(
!(
!(
!(
!(
!(
!(
!(
!(
!(
!(
!(
!(
!(
!(
!(
!(
!(
!(
!(
!(
!(
!(
!(
!(
!(
!(
!(
!(
!(
!(
!(
!(
!(
!(
!(
!(
!(
!(
!(
!(
!(
!(
!(
!(
!(
!(
Drawing Title
Drawing Status
Drawing No.32102902-EIAR-A1045
FinalScale @ A3
Job No.
0 0.2 0.4 0.6 0.8 1
Kilometres
This drawing is not to be used in whole in or part other than for the intended purposeand project as defined on this drawing. Refer to the contract for full terms and conditions.
1:12,500SEC7909
Drawn Check'd Appr'dPurpose of revisionRev. Date Rev'd
Legend
±
Greater Dublin Drainage Project
Project
Proposed Project Boundary
Proposed Outfall Pipeline Route (Marine Section)
Baldoyle Bay SPA
RPS estuarine survey area
!( Common Tern
Copyright © Ordnance Survey Ireland.Licence number 3/3/34/Irish Water.Service Layer Credits: Sources: Esri, HERE, DeLorme, USGS,Intermap, INCREMENT P, NRCan, Esri Japan, METI, Esri China(Hong Kong), Esri Korea, Esri (Thailand), MapmyIndia, NGCC, ©OpenStreetMap contributors, and the GIS User Community
W:\7
909
SE
C -
RP
S B
elfa
st, W
W E
IS N
IS O
rnith
olog
y\Te
chn
ica
l\Gra
phi
cs\G
IS\m
xd\fi
gure
s\E
S_o
rnith
\ES
_tec
hrep
\sec
7909
_A10
1_S
peci
esD
istr
ibut
ion_
Dec
2014
Mar
2018
_DD
P.m
xd
Figure A10.45 Common Tern Records in Baldoyle Bay(Dec 2014 to March 2018)
17/10/17 Draft CH
CH RI RIInfrastructure updated1 19/03/18 KAG
0 RI RIKAG
CH RI RIAdditional survey data1 21/05/18 KAG

!(
!(
!(
!(
!(
!(
!(
!(
!(
!(
!( !(
!(
!(
!(
!(
!(
!(
!(
!(
!(
!(
!(
!(
!(
!(
!(
!(
!(
!(
!(
!(
!(
!(
!(
!(
!(
!(
!(
!(
!(
!(
!(
!(
!(
!(
!(
!(
!(
!(
!(
!(
Drawing Title
Drawing Status
Drawing No.32102902-EIAR-A1046
FinalScale @ A3
Job No.
0 0.2 0.4 0.6 0.8 1
Kilometres
This drawing is not to be used in whole in or part other than for the intended purposeand project as defined on this drawing. Refer to the contract for full terms and conditions.
1:12,500SEC7909
Drawn Check'd Appr'dPurpose of revisionRev. Date Rev'd
Legend
±
Greater Dublin Drainage Project
Project
Proposed Project Boundary
Proposed Outfall Pipeline Route (Marine Section)
Baldoyle Bay SPA
RPS estuarine survey area
!( Sandwich Tern
Copyright © Ordnance Survey Ireland.Licence number 3/3/34/Irish Water.Service Layer Credits: Sources: Esri, HERE, DeLorme, USGS,Intermap, INCREMENT P, NRCan, Esri Japan, METI, Esri China(Hong Kong), Esri Korea, Esri (Thailand), MapmyIndia, NGCC, ©OpenStreetMap contributors, and the GIS User Community
W:\7
909
SE
C -
RP
S B
elfa
st, W
W E
IS N
IS O
rnith
olog
y\Te
chn
ica
l\Gra
phi
cs\G
IS\m
xd\fi
gure
s\E
S_o
rnith
\ES
_tec
hrep
\sec
7909
_A10
1_S
peci
esD
istr
ibut
ion_
Dec
2014
Mar
2018
_DD
P.m
xd
Figure A10.46 Sandwich Tern Records in Baldoyle Bay(Dec 2014 to March 2018)
17/10/17 Draft CH
CH RI RIInfrastructure updated1 19/03/18 KAG
0 RI RIKAG
CH RI RIAdditional survey data1 21/05/18 KAG

!(
!(
!(!(
!(
!(!(
!(
!(
!( !(!(!(
!(
!(
!(
!(
!(
!(!(
!(!(!(
!(
!(
!(!(
!(!( !(
!(
!(
!(
!(
!(
!(
!(!( !(!( !(
!(
!(
Drawing Title
Drawing Status
Drawing No.32102902-EIAR-A1047
FinalScale @ A3
Job No.
0 0.2 0.4 0.6 0.8 1
Kilometres
This drawing is not to be used in whole in or part other than for the intended purposeand project as defined on this drawing. Refer to the contract for full terms and conditions.
1:12,500SEC7909
Drawn Check'd Appr'dPurpose of revisionRev. Date Rev'd
Legend
±
Greater Dublin Drainage Project
Project
Proposed Project Boundary
Proposed Outfall Pipeline Route (Marine Section)
Baldoyle Bay SPA
RPS estuarine survey area
!( Common Sandpiper
Copyright © Ordnance Survey Ireland.Licence number 3/3/34/Irish Water.Service Layer Credits: Sources: Esri, HERE, DeLorme, USGS,Intermap, INCREMENT P, NRCan, Esri Japan, METI, Esri China(Hong Kong), Esri Korea, Esri (Thailand), MapmyIndia, NGCC, ©OpenStreetMap contributors, and the GIS User Community
W:\7
909
SE
C -
RP
S B
elfa
st, W
W E
IS N
IS O
rnith
olog
y\Te
chn
ica
l\Gra
phi
cs\G
IS\m
xd\fi
gure
s\E
S_o
rnith
\ES
_tec
hrep
\sec
7909
_A10
1_S
peci
esD
istr
ibut
ion_
Dec
2014
Mar
2018
_DD
P.m
xd
Figure A10.47 Common Sandpiper Records inBaldoyle Bay (Dec 2014 to March 2018)
17/10/17 Draft CH
CH RI RIInfrastructure updated1 19/03/18 KAG
0 RI RIKAG
CH RI RIAdditional survey data1 21/05/18 KAG

!(
!(
!(
!(
!(
!(
!(
!(
!(
!(
!(
!(!(
!(!(
!(
!(
!(
!(!(!(
!(
!(
!(
!( !(
!(
!(
!(
!(
!(
!(
!(
!(
!(
!(
!(
!(
!(
!(
!(
!(
!(
!(
!(
!(
!(
!(
!(
!(
!(
!(
!(
!(
!(
!(
!(
!(
!(
!(!(
!(
!(
!(!(
!(
!(
!(
!(
!(
!(
!(
!(
!(!(
!(
!(
!(
!(
!(
!(
!(
!(
!(
!(
!(
!(
Drawing Title
Drawing Status
Drawing No.32102902-EIAR-A1048
FinalScale @ A3
Job No.
0 0.2 0.4 0.6 0.8 1
Kilometres
This drawing is not to be used in whole in or part other than for the intended purposeand project as defined on this drawing. Refer to the contract for full terms and conditions.
1:12,500SEC7909
Drawn Check'd Appr'dPurpose of revisionRev. Date Rev'd
Legend
±
Greater Dublin Drainage Project
Project
Proposed Project Boundary
Proposed Outfall Pipeline Route (Marine Section)
Baldoyle Bay SPA
RPS estuarine survey area
!( Common Snipe
Copyright © Ordnance Survey Ireland.Licence number 3/3/34/Irish Water.Service Layer Credits: Sources: Esri, HERE, DeLorme, USGS,Intermap, INCREMENT P, NRCan, Esri Japan, METI, Esri China(Hong Kong), Esri Korea, Esri (Thailand), MapmyIndia, NGCC, ©OpenStreetMap contributors, and the GIS User Community
W:\7
909
SE
C -
RP
S B
elfa
st, W
W E
IS N
IS O
rnith
olog
y\Te
chn
ica
l\Gra
phi
cs\G
IS\m
xd\fi
gure
s\E
S_o
rnith
\ES
_tec
hrep
\sec
7909
_A10
1_S
peci
esD
istr
ibut
ion_
Dec
2014
Mar
2018
_DD
P.m
xd
Figure A10.48 Common Snipe Records in BaldoyleBay (Dec 2014 to March 2018)
17/10/17 Draft CH
CH RI RIInfrastructure updated1 19/03/18 KAG
0 RI RIKAG
CH RI RIAdditional survey data1 21/05/18 KAG

!( !(
!(!(
!(
!(
!(
!(
!(
!( !(
!(
!(
!(
!(
!(
!(
!(!( !(!(!( !(!(
!(!(!(
!(
!(
!(
!(
!(
!(
!(
!(
!(
!(!(
!(
!(
!(
!(
!(
!(
!(
!(
!(
!(
!(
!(
!(!(
!(
!(
!(
!(
!(
!(
!(
!(
!(
!(!(
!(
!(
!(
!(
!(
!(
!(
!(!(
!(
!(
!(
!(
!(
!(
!(
!(!(
!(
!(
!(
!(
!(
!(
!(
!(
!(
!(
!(
!(
!(
!(!(
!(!(
!(!(
!(
!(
!(
!(
!(
!(
!(
!(
!(
!(!(
!(
!(!(
!(
!(
!(
!(
!(
!(
!(
!(
Drawing Title
Drawing Status
Drawing No.32102902-EIAR-A1049
FinalScale @ A3
Job No.
0 0.2 0.4 0.6 0.8 1
Kilometres
This drawing is not to be used in whole in or part other than for the intended purposeand project as defined on this drawing. Refer to the contract for full terms and conditions.
1:12,500SEC7909
Drawn Check'd Appr'dPurpose of revisionRev. Date Rev'd
Legend
±
Greater Dublin Drainage Project
Project
Proposed Project Boundary
Proposed Outfall Pipeline Route (Marine Section)
Baldoyle Bay SPA
RPS estuarine survey area
!( Whimbrel
Copyright © Ordnance Survey Ireland.Licence number 3/3/34/Irish Water.Service Layer Credits: Sources: Esri, HERE, DeLorme, USGS,Intermap, INCREMENT P, NRCan, Esri Japan, METI, Esri China(Hong Kong), Esri Korea, Esri (Thailand), MapmyIndia, NGCC, ©OpenStreetMap contributors, and the GIS User Community
W:\7
909
SE
C -
RP
S B
elfa
st, W
W E
IS N
IS O
rnith
olog
y\Te
chn
ica
l\Gra
phi
cs\G
IS\m
xd\fi
gure
s\E
S_o
rnith
\ES
_tec
hrep
\sec
7909
_A10
1_S
peci
esD
istr
ibut
ion_
Dec
2014
Mar
2018
_DD
P.m
xd
Figure A10.49 Whimbrel Records in Baldoyle Bay(Dec 2014 to March 2018)
17/10/17 Draft CH
CH RI RIInfrastructure updated1 19/03/18 KAG
0 RI RIKAG
CH RI RIAdditional survey data1 21/05/18 KAG

!(
!(
!(
!(
!(
!(
!(
!(
!(
!(
!(
!(
!(
Drawing Title
Drawing Status
Drawing No.32102902-EIAR-A1050
FinalScale @ A3
Job No.
0 0.2 0.4 0.6 0.8 1
Kilometres
This drawing is not to be used in whole in or part other than for the intended purposeand project as defined on this drawing. Refer to the contract for full terms and conditions.
1:12,500SEC7909
Drawn Check'd Appr'dPurpose of revisionRev. Date Rev'd
Legend
±
Greater Dublin Drainage Project
Project
Proposed Project Boundary
Proposed Outfall Pipeline Route (Marine Section)
Baldoyle Bay SPA
RPS estuarine survey area
!( Kestrel
Copyright © Ordnance Survey Ireland.Licence number 3/3/34/Irish Water.Service Layer Credits: Sources: Esri, HERE, DeLorme, USGS,Intermap, INCREMENT P, NRCan, Esri Japan, METI, Esri China(Hong Kong), Esri Korea, Esri (Thailand), MapmyIndia, NGCC, ©OpenStreetMap contributors, and the GIS User Community
W:\7
909
SE
C -
RP
S B
elfa
st, W
W E
IS N
IS O
rnith
olog
y\Te
chn
ica
l\Gra
phi
cs\G
IS\m
xd\fi
gure
s\E
S_o
rnith
\ES
_tec
hrep
\sec
7909
_A10
1_S
peci
esD
istr
ibut
ion_
Dec
2014
Mar
2018
_DD
P.m
xd
Figure A10.50 Kestrel Records in Baldoyle Bay (Dec2014 to March 2018)
17/10/17 Draft CH
CH RI RIInfrastructure updated1 19/03/18 KAG
0 RI RIKAG
CH RI RIAdditional survey data1 21/05/18 KAG

!(
!(
!(
!(
!(
!(
!(
!(
!(
!(
!(
!( !(!(
!(!(
!(
Drawing Title
Drawing Status
Drawing No.32102902-EIAR-A1051
FinalScale @ A3
Job No.
0 0.2 0.4 0.6 0.8 1
Kilometres
This drawing is not to be used in whole in or part other than for the intended purposeand project as defined on this drawing. Refer to the contract for full terms and conditions.
1:12,500SEC7909
Drawn Check'd Appr'dPurpose of revisionRev. Date Rev'd
Legend
±
Greater Dublin Drainage Project
Project
Proposed Project Boundary
Proposed Outfall Pipeline Route (Marine Section)
Baldoyle Bay SPA
RPS estuarine survey area
!( Mediterranean Gull
Copyright © Ordnance Survey Ireland.Licence number 3/3/34/Irish Water.Service Layer Credits: Sources: Esri, HERE, DeLorme, USGS,Intermap, INCREMENT P, NRCan, Esri Japan, METI, Esri China(Hong Kong), Esri Korea, Esri (Thailand), MapmyIndia, NGCC, ©OpenStreetMap contributors, and the GIS User Community
W:\7
909
SE
C -
RP
S B
elfa
st, W
W E
IS N
IS O
rnith
olog
y\Te
chn
ica
l\Gra
phi
cs\G
IS\m
xd\fi
gure
s\E
S_o
rnith
\ES
_tec
hrep
\sec
7909
_A10
1_S
peci
esD
istr
ibut
ion_
Dec
2014
Mar
2018
_DD
P.m
xd
Figure A10.51 Mediterranean Gull Records in BaldoyleBay (Dec 2014 to March 2018)
17/10/17 Draft CH
CH RI RIInfrastructure updated1 19/03/18 KAG
0 RI RIKAG
CH RI RIAdditional survey data1 21/05/18 KAG
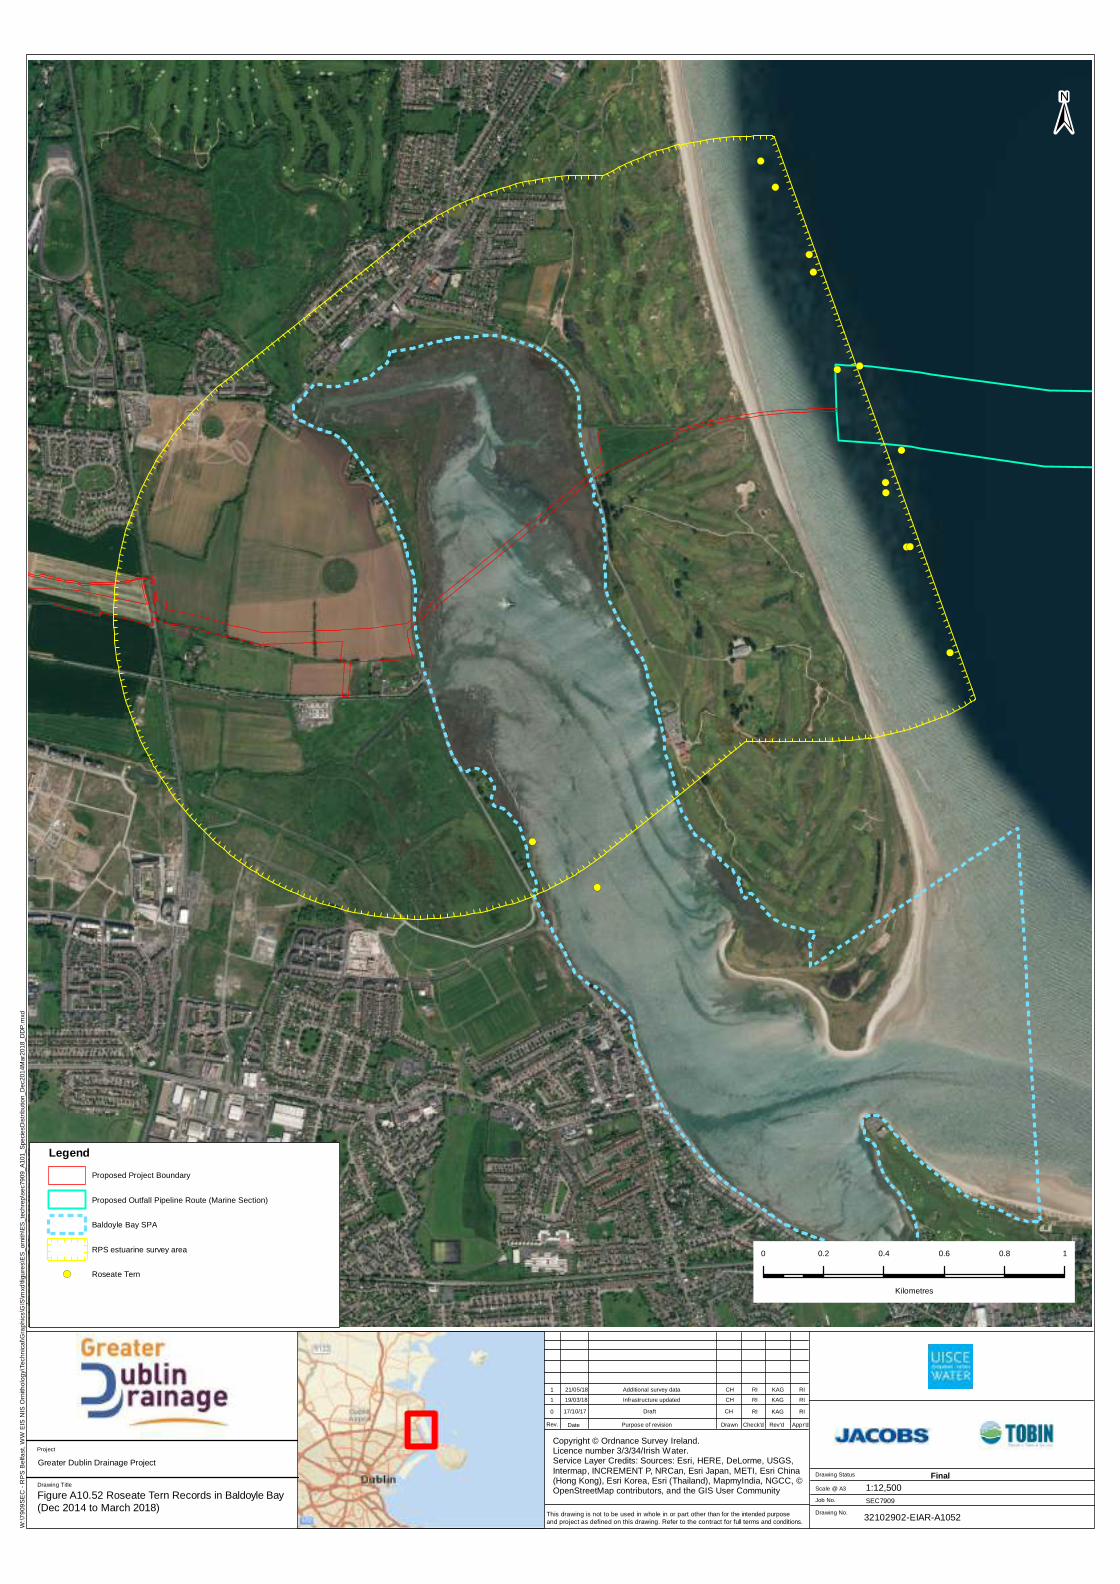
!(
!(
!(
!(
!(
!(
!(
!(
!(
!(
!(
!(
!(!(
Drawing Title
Drawing Status
Drawing No.32102902-EIAR-A1052
FinalScale @ A3
Job No.
0 0.2 0.4 0.6 0.8 1
Kilometres
This drawing is not to be used in whole in or part other than for the intended purposeand project as defined on this drawing. Refer to the contract for full terms and conditions.
1:12,500SEC7909
Drawn Check'd Appr'dPurpose of revisionRev. Date Rev'd
Legend
±
Greater Dublin Drainage Project
Project
Proposed Project Boundary
Proposed Outfall Pipeline Route (Marine Section)
Baldoyle Bay SPA
RPS estuarine survey area
!( Roseate Tern
Copyright © Ordnance Survey Ireland.Licence number 3/3/34/Irish Water.Service Layer Credits: Sources: Esri, HERE, DeLorme, USGS,Intermap, INCREMENT P, NRCan, Esri Japan, METI, Esri China(Hong Kong), Esri Korea, Esri (Thailand), MapmyIndia, NGCC, ©OpenStreetMap contributors, and the GIS User Community
W:\7
909
SE
C -
RP
S B
elfa
st, W
W E
IS N
IS O
rnith
olog
y\Te
chn
ica
l\Gra
phi
cs\G
IS\m
xd\fi
gure
s\E
S_o
rnith
\ES
_tec
hrep
\sec
7909
_A10
1_S
peci
esD
istr
ibut
ion_
Dec
2014
Mar
2018
_DD
P.m
xd
Figure A10.52 Roseate Tern Records in Baldoyle Bay(Dec 2014 to March 2018)
17/10/17 Draft CH
CH RI RIInfrastructure updated1 19/03/18 KAG
0 RI RIKAG
CH RI RIAdditional survey data1 21/05/18 KAG

!(
!(
!(
!(
!(
!(
!(
!(
!(
!(
!(
Drawing Title
Drawing Status
Drawing No.32102902-EIAR-A1053
FinalScale @ A3
Job No.
0 0.2 0.4 0.6 0.8 1
Kilometres
This drawing is not to be used in whole in or part other than for the intended purposeand project as defined on this drawing. Refer to the contract for full terms and conditions.
1:12,500SEC7909
Drawn Check'd Appr'dPurpose of revisionRev. Date Rev'd
Legend
±
Greater Dublin Drainage Project
Project
Proposed Project Boundary
Proposed Outfall Pipeline Route (Marine Section)
Baldoyle Bay SPA
RPS estuarine survey area
!( Ruff
Copyright © Ordnance Survey Ireland.Licence number 3/3/34/Irish Water.Service Layer Credits: Sources: Esri, HERE, DeLorme, USGS,Intermap, INCREMENT P, NRCan, Esri Japan, METI, Esri China(Hong Kong), Esri Korea, Esri (Thailand), MapmyIndia, NGCC, ©OpenStreetMap contributors, and the GIS User Community
W:\7
909
SE
C -
RP
S B
elfa
st, W
W E
IS N
IS O
rnith
olog
y\Te
chn
ica
l\Gra
phi
cs\G
IS\m
xd\fi
gure
s\E
S_o
rnith
\ES
_tec
hrep
\sec
7909
_A10
1_S
peci
esD
istr
ibut
ion_
Dec
2014
Mar
2018
_DD
P.m
xd
Figure A10.53 Ruff Records in Baldoyle Bay (Dec2014 to March 2018)
17/10/17 Draft CH
CH RI RIInfrastructure updated1 19/03/18 KAG
0 RI RIKAG
CH RI RIAdditional survey data1 21/05/18 KAG

±
Greater Dublin Drainage Project
Drawing Title
Project
Drawing Status
Drawing No.
This drawing is not to be used in whole in or part other than for the intended purposeand project as defined on this drawing. Refer to the contract for full terms and conditions.
32102902-EIAR-A1054
Final
Scale @A3
Drawn Check'd Appr'dPurpose of revisionRev. Date Rev'd
Client
Filepath
1:25,000
Key
Proposed Project Boundary
Proposed Outfall Pipeline Route(Marine Section)
SPA boundaries
Index of abundance
Black guillemot - all behaviours
1 - 10
11 - 20
21 - 30
31 - 40
41 - 50
51 - 60
61 - 70
W:\7909SEC - RPS Belfast, WW EIS NIS Ornithology\Technical\Graphics\GIS\mxd\f igures\ES_ornith\ES_techrep\sec7909_A1054_TY_onWaterMarToOct_VP2.mxd
0 500 1,000 1,500 2,000 2,500
m
Figure A10.54 Distribution of all on sea black guillemotrecords from Ireland's Eye VP during breeding season(March to October)
© Mapbox, © OpenStreetMap
Infrastructure updated1 06/06/2018 CH RI KG RI

±
Greater Dublin Drainage Project
Drawing Title
Project
Drawing Status
Drawing No.
This drawing is not to be used in whole in or part other than for the intended purposeand project as defined on this drawing. Refer to the contract for full terms and conditions.
32102902-EIAR-A1055
Final
Scale @A3
Drawn Check'd Appr'dPurpose of revisionRev. Date Rev'd
Client
Filepath
1:25,000
Key
Proposed Project Boundary
Proposed Outfall Pipeline Route(Marine Section)
SPA boundaries
Index of abundance
Cormorant - all behaviours
1 - 10
11 - 20
21 - 30
31 - 40
41 - 50
51 - 60
W:\7909SEC - RPS Belfast, WW EIS NIS Ornithology\Technical\Graphics\GIS\mxd\f igures\ES_ornith\ES_techrep\sec7909_A1055_CA_onWaterMarToOct_VP2.mxd
0 500 1,000 1,500 2,000 2,500
m
Figure A10.55 Distribution of all on sea cormorant recordsfrom Ireland's Eye VP during breeding season (March toOctober)
© Mapbox, © OpenStreetMap
Infrastructure updated1 06/06/2018 CH RI KG RI

±
Greater Dublin Drainage Project
Drawing Title
Project
Drawing Status
Drawing No.
This drawing is not to be used in whole in or part other than for the intended purposeand project as defined on this drawing. Refer to the contract for full terms and conditions.
32102902-EIAR-A1056
Final
Scale @A3
Drawn Check'd Appr'dPurpose of revisionRev. Date Rev'd
Client
Filepath
1:25,000
Key
Proposed Project Boundary
Proposed Outfall Pipeline Route(Marine Section)
SPA boundaries
Index of abundance
Fulmar - all behaviours
1 - 5
6 - 10
11 - 15
16 - 20
21 - 25
26 - 30
31 - 35
W:\7909SEC - RPS Belfast, WW EIS NIS Ornithology\Technical\Graphics\GIS\mxd\f igures\ES_ornith\ES_techrep\sec7909_A1056_F_onWaterMarToOct_VP2.mxd
0 500 1,000 1,500 2,000 2,500
m
Figure A10.56 Distribution of all on sea fulmar recordsfrom Ireland's Eye VP during breeding season (March toOctober)
© Mapbox, © OpenStreetMap
Additional survey data included2 06/06/2018 CH RI KG RI

±
Greater Dublin Drainage Project
Drawing Title
Project
Drawing Status
Drawing No.
This drawing is not to be used in whole in or part other than for the intended purposeand project as defined on this drawing. Refer to the contract for full terms and conditions.
32102902-EIAR-A1057
Final
Scale @A3
Drawn Check'd Appr'dPurpose of revisionRev. Date Rev'd
Client
Filepath
1:25,000
Key
Proposed Project Boundary
Proposed Outfall Pipeline Route(Marine Section)
SPA boundaries
Index of abundance
Gannet - all behaviours
3 - 25
26 - 50
51 - 75
76 - 100
101 - 125
126 - 150
W:\7909SEC - RPS Belfast, WW EIS NIS Ornithology\Technical\Graphics\GIS\mxd\f igures\ES_ornith\ES_techrep\sec7909_A1057_GX_onWaterMarToOct_VP2.mxd
0 500 1,000 1,500 2,000 2,500
m
Figure A10.57 Distribution of all on sea gannet recordsfrom Ireland's Eye VP during breeding season (March toOctober)
© Mapbox, © OpenStreetMap
Infrastructure updated1 06/06/2018 CH RI KG RI

±
Greater Dublin Drainage Project
Drawing Title
Project
Drawing Status
Drawing No.
This drawing is not to be used in whole in or part other than for the intended purposeand project as defined on this drawing. Refer to the contract for full terms and conditions.
32102902-EIAR-A1058
Final
Scale @A3
Drawn Check'd Appr'dPurpose of revisionRev. Date Rev'd
Client
Filepath
1:25,000
Key
Proposed Project Boundary
Proposed Outfall Pipeline Route(Marine Section)
SPA boundaries
Index of abundance
Great black-backed gull - allbehaviours
1 - 10
11 - 20
21 - 30
31 - 40
41 - 50
W:\7909SEC - RPS Belfast, WW EIS NIS Ornithology\Technical\Graphics\GIS\mxd\f igures\ES_ornith\ES_techrep\sec7909_A1058_GB_onWaterMarToOct_VP2.mxd
0 500 1,000 1,500 2,000 2,500
m
Figure A10.58 Distribution of all on sea great black-backed gull records from Ireland's Eye VP during breedingseason (March to October)
© Mapbox, © OpenStreetMap
Infrastructure updated1 06/06/2018 CH RI KG RI

±
Greater Dublin Drainage Project
Drawing Title
Project
Drawing Status
Drawing No.
This drawing is not to be used in whole in or part other than for the intended purposeand project as defined on this drawing. Refer to the contract for full terms and conditions.
32102902-EIAR-A1059
Final
Scale @A3
Drawn Check'd Appr'dPurpose of revisionRev. Date Rev'd
Client
Filepath
1:25,000
Key
Proposed Project Boundary
Proposed Outfall Pipeline Route(Marine Section)
SPA boundaries
Index of abundance
Guillemot - all behaviours
32 - 200
201 - 400
401 - 600
601 - 800
801 - 1000
W:\7909SEC - RPS Belfast, WW EIS NIS Ornithology\Technical\Graphics\GIS\mxd\f igures\ES_ornith\ES_techrep\sec7909_A1059_GU_onWaterMarToOct_VP2.mxd
0 500 1,000 1,500 2,000 2,500
m
Figure A10.59 Distribution of all on sea guillemot recordsfrom Ireland's Eye VP during breeding season (March toOctober)
© Mapbox, © OpenStreetMap
Additional survey data included2 06/06/2018 CH RI KG RI

±
Greater Dublin Drainage Project
Drawing Title
Project
Drawing Status
Drawing No.
This drawing is not to be used in whole in or part other than for the intended purposeand project as defined on this drawing. Refer to the contract for full terms and conditions.
32102902-EIAR-A1060
Final
Scale @A3
Drawn Check'd Appr'dPurpose of revisionRev. Date Rev'd
Client
Filepath
1:25,000
Key
Proposed Project Boundary
Proposed Outfall Pipeline Route(Marine Section)
SPA boundaries
Index of abundance
Guillemot or razorbill - all behaviours
3 - 75
76 - 150
151 - 225
226 - 300
301 - 375
376 - 450
W:\7909SEC - RPS Belfast, WW EIS NIS Ornithology\Technical\Graphics\GIS\mxd\f igures\ES_ornith\ES_techrep\sec7909_A1060_GRA_onWaterMarToOct_VP2.mxd
0 500 1,000 1,500 2,000 2,500
m
Figure A10.60 Distribution of all on sea guillemot orrazorbill records from Ireland's Eye VP during breedingseason (March to October)
© Mapbox, © OpenStreetMap
Additional survey data included2 06/06/2018 CH RI KG RI

±
Greater Dublin Drainage Project
Drawing Title
Project
Drawing Status
Drawing No.
This drawing is not to be used in whole in or part other than for the intended purposeand project as defined on this drawing. Refer to the contract for full terms and conditions.
32102902-EIAR-A1061
Final
Scale @A3
Drawn Check'd Appr'dPurpose of revisionRev. Date Rev'd
Client
Filepath
1:25,000
Key
Proposed Project Boundary
Proposed Outfall Pipeline Route(Marine Section)
SPA boundaries
Index of abundance
Herring gull - all behaviours
7 - 150
151 - 300
301 - 450
451 - 600
601 - 750
751 - 900
901 - 1050
W:\7909SEC - RPS Belfast, WW EIS NIS Ornithology\Technical\Graphics\GIS\mxd\f igures\ES_ornith\ES_techrep\sec7909_A1061_HG_onWaterMarToOct_VP2.mxd
0 500 1,000 1,500 2,000 2,500
m
Figure A10.61 Distribution of all on sea herring gullrecords from Ireland's Eye VP during breeding season(March to October)
© Mapbox, © OpenStreetMap
Additional survey data included2 06/06/2018 CH RI KG RI

±
Greater Dublin Drainage Project
Drawing Title
Project
Drawing Status
Drawing No.
This drawing is not to be used in whole in or part other than for the intended purposeand project as defined on this drawing. Refer to the contract for full terms and conditions.
32102902-EIAR-A1062
Final
Scale @A3
Drawn Check'd Appr'dPurpose of revisionRev. Date Rev'd
Client
Filepath
1:25,000
Key
Proposed Project Boundary
Proposed Outfall Pipeline Route(Marine Section)
SPA boundaries
Index of abundance
Kittiwake - all behaviours
9 - 75
76 - 150
151 - 225
226 - 300
301 - 375
376 - 450
W:\7909SEC - RPS Belfast, WW EIS NIS Ornithology\Technical\Graphics\GIS\mxd\f igures\ES_ornith\ES_techrep\sec7909_A1062_KI_onWaterMarToOct_VP2.mxd
0 500 1,000 1,500 2,000 2,500
m
Figure A10.62 Distribution of all on sea kittiwake recordsfrom Ireland's Eye VP during breeding season (March toOctober)
© Mapbox, © OpenStreetMap
Additional survey data included2 06/06/2018 CH RI KG RI

±
Greater Dublin Drainage Project
Drawing Title
Project
Drawing Status
Drawing No.
This drawing is not to be used in whole in or part other than for the intended purposeand project as defined on this drawing. Refer to the contract for full terms and conditions.
32102902-EIAR-A1063
Final
Scale @A3
Drawn Check'd Appr'dPurpose of revisionRev. Date Rev'd
Client
Filepath
1:25,000
Key
Proposed Project Boundary
Proposed Outfall Pipeline Route(Marine Section)
SPA boundaries
Index of abundance
Puffin - all behaviours
1 - 25
26 - 50
51 - 75
76 - 100
101 - 125
126 - 150
151 - 175
176 - 200
W:\7909SEC - RPS Belfast, WW EIS NIS Ornithology\Technical\Graphics\GIS\mxd\f igures\ES_ornith\ES_techrep\sec7909_A1063_PU_onWaterMarToOct_VP2.mxd
0 500 1,000 1,500 2,000 2,500
m
Figure A10.63 Distribution of all on sea puffin recordsfrom Ireland's Eye VP during breeding season (March toOctober)
© Mapbox, © OpenStreetMap
Additional survey data included2 06/06/2018 CH RI KG RI

±
Greater Dublin Drainage Project
Drawing Title
Project
Drawing Status
Drawing No.
This drawing is not to be used in whole in or part other than for the intended purposeand project as defined on this drawing. Refer to the contract for full terms and conditions.
32102902-EIAR-A1064
Final
Scale @A3
Drawn Check'd Appr'dPurpose of revisionRev. Date Rev'd
Client
Filepath
1:25,000
Key
Proposed Project
Proposed Outfall Pipeline Route(Marine Section)
SPA boundaries
Index of abundance
Razorbill - all behaviours
31 - 175
176 - 350
351 - 525
526 - 700
701 - 875
W:\7909SEC - RPS Belfast, WW EIS NIS Ornithology\Technical\Graphics\GIS\mxd\f igures\ES_ornith\ES_techrep\sec7909_A1064_RA_onWaterMarToOct_VP2.mxd
0 500 1,000 1,500 2,000 2,500
m
Figure A10.64 Distribution of all on sea razorbill recordsfrom Ireland's Eye VP during breeding season (March toOctober)
© Mapbox, © OpenStreetMap
Additional survey data included2 06/06/2018 CH RI KG RI

±
Greater Dublin Drainage Project
Drawing Title
Project
Drawing Status
Drawing No.
This drawing is not to be used in whole in or part other than for the intended purposeand project as defined on this drawing. Refer to the contract for full terms and conditions.
32102902-EIAR-A1065
Final
Scale @A3
Drawn Check'd Appr'dPurpose of revisionRev. Date Rev'd
Client
Filepath
1:25,000
Key
Proposed Project Boundary
Proposed Outfall Pipeline Route(Marine Section)
SPA boundaries
Index of abundance
Shag - all behaviours
1 - 50
51 - 100
101 - 150
151 - 200
201 - 250
251 - 300
W:\7909SEC - RPS Belfast, WW EIS NIS Ornithology\Technical\Graphics\GIS\mxd\f igures\ES_ornith\ES_techrep\sec7909_A1065_SA_onWaterMarToOct_VP2.mxd
0 500 1,000 1,500 2,000 2,500
m
Figure A10.65 Distribution of all on sea shag records fromIreland's Eye VP during breeding season (March toOctober)
© Mapbox, © OpenStreetMap
Additional survey data included2 06/06/2018 CH RI KG RI

rpsgroup.com/uk
APPENDIX 1 – ESTUARINE BIRD SURVEY EFFORT
Date Surveyor* Start Time
Finish Time
Effort Minimum Tide (m)
Mean Tide (m) Maximum Tide (m)
Survey Tidal Range (m)
Survey Tidal State**
Area surveyed
16/12/2014 AMcC 11:00 14:10 03:10 1.99 2.11 2.32 0.33 L Partial 22/12/2014 AMcC 09:40 12:00 02:20 4.44 4.80 4.95 0.51 H Partial 13/01/2015 AMcC 09:00 12:00 03:00 2.06 2.21 2.49 0.43 L Partial 13/01/2015 AMcC 12:00 15:00 03:00 2.49 3.20 3.85 1.36 T Partial 20/01/2015 KM 09:00 11:55 02:55 4.13 4.64 4.85 0.72 H Full 20/01/2015 KM 11:55 14:50 02:55 2.03 3.44 4.58 2.55 T Full 20/02/2015 NV 08:30 14:30 06:00 2.85 4.40 5.14 2.29 H Full 27/02/2015 NV 08:30 14:30 06:00 1.59 2.10 3.27 1.68 T Full 11/03/2015 NV 08:00 14:00 06:00 1.36 2.62 4.16 2.8 T Full 19/03/2015 NV 10:00 16:00 06:00 0.47 2.73 4.57 4.1 T Full 13/04/2015 NV 07:30 13:30 06:00 1.48 2.15 3.58 2.1 T Full 20/04/2015 NV 07:30 13:30 06:00 1.47 3.74 4.80 3.33 T Full 18/05/2015 NV 05:15 11:15 06:00 1.07 3.23 4.94 3.87 T Full 27/05/2015 NV 08:00 14:00 06:00 1.59 2.23 3.52 1.93 T Full 05/06/2015 NV 06:30 12:30 06:00 1.00 2.66 4.47 3.47 T Full 30/06/2015 NV 09:15 15:15 06:00 1.42 3.18 4.29 2.87 T Full 06/07/2015 NV 07:00 13:00 06:00 0.91 2.15 4.10 3.19 T Full 15/07/2015 NV 09:00 15:00 06:00 1.74 3.51 4.27 2.53 T Full 03/08/2015 NV 08:00 14:00 06:00 1.26 3.51 4.84 3.58 T Full 25/08/2015 NV 09:15 15:15 06:00 1.98 2.41 3.40 1.42 T Full 02/09/2015 NV 07:30 13:30 06:00 0.62 2.76 4.61 3.99 T Full 22/09/2015 NV 07:30 13:30 06:00 1.84 2.26 3.22 1.38 T Full 02/10/2015 NV 09:30 15:30 06:00 1.71 3.62 4.51 2.8 T Full 21/10/2015 NV 08:00 14:00 06:00 2.01 2.39 3.06 1.05 T Full 08/11/2015 NV 08:00 13:48 05:48 2.20 3.66 4.39 2.19 T Full 19/11/2015 NV 08:45 14:45 06:00 1.73 2.39 3.65 1.92 T Full 08/12/2015 NV 09:30 15:30 06:00 1.87 3.17 4.51 2.64 T Full 14/12/2015 NV 09:30 15:30 06:00 3.05 4.32 4.95 1.9 H Full 07/01/2016 NV 09:30 15:30 06:00 1.85 3.28 4.61 2.76 T Full 21/01/2016 NV 09:00 15:00 06:00 1.58 3.21 4.54 2.96 T Full 15/02/2016 NV 10:00 16:00 06:00 1.11 2.52 4.14 3.03 T Full 22/02/2016 NV 11:00 17:00 06:00 1.37 3.39 4.60 3.23 T Full 10/03/2016 NV 10:00 16:00 06:00 1.40 3.77 4.70 3.3 T Full 16/03/2016 NV 12:00 18:00 06:00 1.47 2.84 3.89 2.42 T Full 01/04/2016 NV 09:00 15:00 06:00 1.95 2.32 3.09 1.14 T Full 18/04/2016 NV 08:00 14:00 06:00 1.70 3.40 4.23 2.53 T Full 06/05/2016 NV 09:00 15:00 06:00 1.31 3.75 4.82 3.51 T Full 22/05/2016 NV 06:00 12:00 06:00 1.43 3.18 4.49 3.06 T Full

rpsgroup.com/uk
Date Surveyor* Start Time
Finish Time
Effort Minimum Tide (m)
Mean Tide (m) Maximum Tide (m)
Survey Tidal Range (m)
Survey Tidal State**
Area surveyed
16/03/2017 NV 07:00 13:00 06:00 1.07 2.62 4.44 3.37 T Full 28/03/2017 NV 09:20 15:20 06:00 1.91 4.04 4.88 2.97 T Full 12/04/2017 NV 11:30 17:30 06:00 1.05 3.17 4.60 3.55 T Full 26/04/2017 NV 05:38 11:38 06:00 1.12 3.37 4.68 3.56 T Full 17/05/2017 NV 05:20 16:20 11:00 1.60 2.76 4.03 2.43 T Full 18/05/2017 NV 11:00 17:00 06:00 1.85 3.04 3.92 2.07 T Full 12/06/2017 NV 05:10 11:10 06:00 1.37 2.15 3.68 2.31 T Full 28/06/2017 NV 12:30 18:30 06:00 2.17 3.87 4.57 2.4 T Full 13/07/2017 NV 12:00 18:00 06:00 2.05 3.61 4.27 2.22 T Full 19/07/2017 NV 08:00 14:00 06:00 1.46 2.51 4.21 2.75 T Full 01/08/2017 NV 05:50 11:50 06:00 1.84 3.06 4.03 2.19 T Full 21/08/2017 NV 06:00 12:00 06:00 1.51 3.55 4.62 3.11 T Full 05/09/2017 NV 09:10 15:10 06:00 1.88 3.69 4.52 2.64 T Full 12/09/2017 NV 10:30 16:30 06:00 1.76 3.45 4.40 2.64 T Full 12/10/2017 NV 10:40 16:40 06:00 1.80 3.25 4.36 2.56 T Full 26/10/2017 NV 13:00 18:00 05:00 3.21 3.85 4.15 0.94 H Full 06/11/2017 NV 09:00 15:00 06:00 2.80 4.16 4.85 2.05 H Full 20/11/2017 NV 08:30 14:30 06:00 2.82 4.20 4.81 1.99 H Full 01/12/2017 NV 08:20 14:20 06:00 1.24 3.07 4.16 2.92 T Full 11/12/2017 NV 08:15 14:15 06:00 1.82 2.25 3.19 1.37 T Full 11/01/2018 NV 08:45 14:45 06:00 1.84 2.41 3.61 1.77 T Full 22/01/2018 NV 08:50 14:50 06:00 1.54 3.22 4.47 2.93 T Full 01/02/2018 NV 08:20 14:20 06:00 2.82 4.08 4.73 1.91 H Full 27/02/2018 NV 07:00 13:00 06:00 2.19 3.72 4.36 2.17 T Full 16/03/2018 NV 07:00 13:00 06:00 2.63 4.04 4.67 2.04 T Full 28/03/2018 NV 09:20 15:20 06:00 1.01 2.50 4.30 3.29 T Full
Notes: * Surveyors: AMcC = Adam McClure, KM = Kevin Mawhinney, NV= Nick Veale. ** Tidal state for each survey is designated as follows. Surveys designated as 'high tide' (H) when survey mean tide >= mid height of the tide AND survey min tide >= highest low tide. Surveys designated as 'low tide'(L) when survey mean tide < the mid height of the tide AND survey max tide < lowest high tide. All other surveys are designate 'through the tide' 'T'
Table A10.1: Estuarine walkover survey effort December 2014 to March 2018

rpsgroup.com/uk
APPENDIX 2 – ESTUARINE BIRD SURVEY DATA
Species Year J F M A M J J A S O N D Original SPA
Citation*
Five Year Peak
Mean**
Two Year Peak Mean***
Bar-tailed godwit
2014 - - - - - - - - - - - 6
353 134 275
2015 20 0 33 0 0 1 16 35 30 117 273 257
2016 57 99 78 13 1 - - - - - - -
2017 - - 36 37 0 11 14 34 88 95 276 202
2018 81 201 36 - - - - - - - - -
Brent goose (LB)
2014 - - - - - - - - - - - 475
726 874 816
2015 543 296 364 403 0 0 0 0 8 174 706 803
2016 462 991 429 323 1 - - - - - - -
2017 - - 328 270 0 0 0 0 0 231 524 641
2018 569 481 328 - - - - - - - - -
Golden plover
2014 - - - - - - - - - - - 14
1810 914 3061
2015 2822 120 447 87 0 0 0 65 0 870 680 750
2016 0 1850 950 0 0 - - - - - - -
2017 - - 850 0 0 0 0 550 0 630 1700 1850
2018 950 3300 850 - - - - - - - - -
Grey plover
2014 - - - - - - - - - - - 7
200 122 487 2015 17 3 669 0 0 0 0 0 17 31 123 63
2016 7 77 304 6 0 - - - - - - -

rpsgroup.com/uk
Species Year J F M A M J J A S O N D Original SPA
Citation*
Five Year Peak
Mean**
Two Year Peak Mean***
2017 - - 136 0 0 0 0 0 13 31 113 79
2018 24 72 136 - - - - - - - - -
Ringed plover
2014 - - - - - - - - - - - 0
221 96 204
2015 0 0 0 12 46 25 47 101 234 48 110 138
2016 10 159 0 31 73 - - - - - - -
2017 - - 7 75 51 42 31 105 33 31 173 95
2018 25 148 7 - - - - - - - - -
Shelduck
2014 - - - - - - - - - - - 41
147 290 138
2015 175 140 127 158 59 26 79 35 25 54 69 101
2016 86 65 74 72 47 - - - - - - -
2017 - - 77 85 37 29 55 40 49 45 61 97
2018 70 71 87- - - - - - - - - -
Notes: - = no survey *Five year mean peak counts for the period 1995/96 – 1999/00 (I-WeBS) except for light-bellied brent goose (Robinson et al., 2004). **Five year mean peak for the period 2005/06 – 2009/10 (I-WeBS). ***Two year mean peak based on collected data (underlined and emboldened by species).
Table A10.2: Estuarine walkover peak monthly population estimates for bird species listed as Special Conservation Interests (SCIs) on Baldoyle Bay SPA citation

rpsgroup.com/uk
Species Year J F M A M J J A S O N D Original SPA
Citation*
Five Year Peak
Mean**
Two Year Peak Mean***
Black-tailed godwit
2014 - - - - - - - - - - - 33
72 204 166
2015 74 91 145 8 30 7 33 6 62 52 78 115
2016 61 77 61 29 16 - - - - - - -
2017 - - 116 12 34 6 30 10 47 58 121 92
2018 42 100 187 - - - - - - - - -
Curlew
2014 - - - - - - - - - - - 16
61 204 164
2015 12 28 58 34 36 31 60 58 238 93 125 49
2016 26 90 40 12 12 - - - - - - -
2017 - - 35 12 30 17 31 36 78 37 71 45
2018 21 42 31 - - - - - - - - -
Dunlin
2014 - - - - - - - - - - - 81
879 185 525
2015 109 393 279 24 166 0 32 98 623 409 472 618
2016 140 359 244 74 36 - - - - - - -
2017 - - 197 72 99 0 46 148 120 234 335 431
2018 72 253 199 - - - - - - - - -
Great crested grebe
2014 - - - - - - - - - - - 0
42 29 44
2015 0 0 2 3 0 0 0 0 0 12 55 17
2016 10 37 9 11 1 - - - - - - -
2017 - - 30 18 0 0 0 0 12 14 17 10
2018 11 32 30 - - - - - - - - -
Greenshank 2014 - - - - - - - - - - - 1
11 20 20 2015 1 1 14 4 0 1 1 7 5 5 5 9

rpsgroup.com/uk
Species Year J F M A M J J A S O N D Original SPA
Citation*
Five Year Peak
Mean**
Two Year Peak Mean***
2016 3 6 9 2 0 - - - - - - -
2017 - - 8 3 0 0 2 3 25 6 7 8
2018 3 6 8 - - - - - - - - -
Grey heron
2014 - - - - - - - - - - - 1
16 16 15
2015 2 1 4 5 5 6 6 11 11 11 16 17
2016 10 14 5 8 8 - - - - - - -
2017 - - 5 7 8 6 6 8 10 10 12 7
2018 8 9 8 - - - - - - - - -
Knot
2014 - - - - - - - - - - - 0
115 111 126
2015 0 102 47 0 0 0 0 0 0 4 0 8
2016 6 150 56 0 0 - - - - - - -
2017 - - 32 0 0 0 5 0 0 12 12 8
2018 0 79 32 - - - - - - - - -
Lapwing
2014 - - - - - - - - - - - 387
450 365 534
2015 295 236 12 6 7 9 8 9 15 305 446 336
2016 607 512 71 26 7 - - - - - - -
2017 - - 113 37 6 10 4 23 121 143 231 368
2018 424 461 256 - - - - - - - - -
Mallard
2014 - - - - - - - - - - - 114
46 212 185 2015 154 146 116 56 56 45 110 96 215 111 103 164
2016 99 78 75 85 68 - - - - - - -
2017 - - 108 73 90 68 104 97 100 105 75 110

rpsgroup.com/uk
Species Year J F M A M J J A S O N D Original SPA
Citation*
Five Year Peak
Mean**
Two Year Peak Mean***
2018 123 108 108 - - - - - - - - -
Oystercatcher
2014 - - - - - - - - - - - 49
531 837 739
2015 120 218 758 692 242 369 144 168 719 273 361 317
2016 197 216 320 257 96 - - - - - - -
2017 - - 181 171 162 95 118 174 217 168 221 305
2018 108 163 173 - - - - - - - - -
Pintail
2014 - - - - - - - - - - - 0
22 26 1
2015 2 0 0 0 0 0 0 0 0 0 0 0
2016 0 0 0 0 0 - - - - - - -
2017 - - 0 0 0 0 0 0 0 0 0 0
2018 0 0 0 - - - - - - - - -
Red-breasted merganser
2014 - - - - - - - - - - - 0
14 17 26
2015 1 1 7 5 0 0 0 10 16 28 30 15
2016 18 18 12 9 8 - - - - - - -
2017 - - 12 22 2 0 0 2 5 8 18 8
2018 12 8 12 - - - - - - - - -
Redshank
2014 - - - - - - - - - - - 23
224 314 294
2015 40 111 126 110 2 17 22 113 167 257 303 334
2016 111 146 137 61 7 - - - - - - -
2017 - - 105 54 8 9 67 57 207 87 142 254
2018 82 100 105 - - - - - - - - -
Sanderling 2014 - - - - - - - - - - - 0 26 21 50

rpsgroup.com/uk
Species Year J F M A M J J A S O N D Original SPA
Citation*
Five Year Peak
Mean**
Two Year Peak Mean***
2015 0 14 2 0 0 0 0 0 0 11 18 0
2016 0 16 45 8 0 - - - - - - -
2017 - - 30 33 0 0 0 0 0 0 55 34
2018 0 0 30 - - - - - - - - -
Teal
2014 - - - - - - - - - - - 161
124 238 328
2015 194 146 192 52 5 11 45 36 198 110 111 248
2016 172 367 144 46 43 - - - - - - -
2017 - - 96 47 8 6 46 46 46 87 133 156
2018 111 288 96 - - - - - - - - -
Turnstone
2014 - - - - - - - - - - - 1
43 77 74
2015 1 2 12 15 0 5 0 11 51 28 40 74
2016 19 38 62 32 0 - - - - - - -
2017 - - 74 30 0 12 8 9 22 30 29 71
2018 17 28 74 - - - - - - - - -
Notes: - = no survey *Five year mean peak counts for the period 1995/96 – 1999/00 (I-WeBS) with the exception of light-bellied brent goose (Robinson et al., 2004). **Five year mean peak for the period 2005/06 – 2009/10 (I-WeBS). ***Two year mean peak based on collected data (underlined and emboldened by species).
Table A10.3: Estuarine walkover peak monthly population estimates for other bird species (non-SCI) listed on Baldoyle Bay SPA citation

rpsgroup.com/uk
Species Category J F M A M J J A S O N D
Black guillemot**
Auks
2 2 2 4 2 2 2 2 2 4 2 2
Guillemot*,**** 2 4 0 1 0 2 2 6 1 9 3 20
Razorbill*,**** 2 2 0 1 6 1 5 2 2 4 2 2
Great northern diver Divers
3 3 1 1 0 0 0 0 0 1 6 2
Red-throated diver 3 3 16 7 1 0 0 0 3 16 9 14
Canada goose
Geese and Swans
73 0 0 0 0 0 0 0 0 35 0 0
Mute swan 6 7 13 5 5 13 13 15 10 9 10 12
Pink-footed goose 0 0 1 0 0 0 0 0 0 0 0 0
Black-necked grebe
Grebes, Ducks and Rails
0 0 0 0 0 0 0 0 0 0 14 0
Common scoter 85 70 196 75 73 0 0 43 22 51 233 85
Coot 2 2 0 4 3 1 2 0 1 1 1 0
Eider 0 0 0 3 0 0 0 0 0 3 0 0
Goldeneye 8 0 0 0 0 0 0 0 0 0 0 0
Little grebe 1 1 4 2 1 5 4 4 1 2 2 1
Long-tailed duck 4 3 0 2 0 0 0 0 0 0 0 0
Moorhen 8 8 10 12 7 6 4 4 8 9 6 6
Shoveler 0 0 0 0 0 0 0 2 0 0 2 2
Tufted duck 1 1 0 0 0 0 1 1 1 0 1 0
Wigeon 138 166 67 25 0 4 0 16 16 124 228 257
Black-headed gull
Gulls
112 203 93 110 68 66 80 155 404 332 306 224
Common gull 58 84 26 53 34 10 10 9 28 34 53 54
Great black-backed gull** 6 27 24 26 27 32 28 14 69 27 10 18
Herring gull* 84 181 111 131 154 292 167 114 331 216 190 95

rpsgroup.com/uk
Species Category J F M A M J J A S O N D
Kittiwake*,*** 2 1 6 0 0 0 0 0 0 0 3 0
Lesser black-backed gull 12 3 24 29 26 46 42 25 17 13 23 2
Mediterranean gull 0 2 0 0 0 0 4 3 4 1 2 0
Ring-billed gull 1 0 1 0 0 0 0 0 0 0 1 0
Blue tit
Other
0 1 0 0 0 0 0 0 0 0 0 0
Fulmar 0 0 0 0 0 0 0 0 0 0 0 1
Hooded crow 0 0 0 0 4 0 0 0 0 0 0 0
Kingfisher 0 0 0 0 0 0 0 0 0 0 0 1
Mistle thrush 0 0 1 0 0 0 0 0 0 0 0 0
Little egret 8 7 11 11 12 9 9 9 20 13 13 10
Pheasant 0 0 0 0 1 0 0 0 0 0 0 0
Red-legged partridge 0 1 0 0 0 0 0 0 0 0 0 0
Snow bunting 0 0 0 6 0 0 0 0 0 0 0 0
Song thrush 0 0 1 0 0 0 0 0 0 0 0 0
Stonechat 11 0 0 0 0 0 0 0 0 0 0 0
Wheatear 0 0 0 0 1 0 0 0 0 0 0 0
Buzzard
Raptors
1 2 2 3 3 1 1 1 0 1 1 1
Kestrel 1 1 1 1 1 0 1 2 1 0 0 0
Peregrine**,**** 1 2 0 2 1 0 0 1 1 1 0 1
Sparrowhawk 1 0 1 0 0 0 0 0 1 1 1 1
Cormorant* Shags and Cormorants
17 20 10 28 14 27 24 20 16 42 39 34
Shag** 3 8 6 7 6 5 7 7 10 11 10 2
Arctic tern Terns 0 0 0 2 3 5 3 0 0 0 0 0

rpsgroup.com/uk
Species Category J F M A M J J A S O N D
Black tern 0 0 0 0 0 0 0 2 0 0 0 0
Common tern 0 0 0 14 9 12 29 34 0 0 0 0
Roseate tern 0 0 0 0 1 2 4 11 7 0 0 0
Sandwich tern 0 0 4 9 15 5 15 10 42 0 0 0
Avocet
Waders
0 0 0 1 0 0 0 0 0 0 0 0
Common sandpiper 2 1 0 3 1 0 3 2 3 2 1 0
Snipe 7 35 5 6 1 0 0 2 4 5 3 6
Curlew sandpiper 0 0 0 0 0 0 0 0 0 3 6 0
Green sandpiper 0 0 0 0 0 0 1 0 0 0 0 0
Purple sandpiper 0 0 2 0 0 0 0 0 0 0 0 0
Ruff 0 1 0 0 0 0 4 7 8 2 0 0
Little stint 0 0 0 0 0 0 0 1 0 0 0 0
Whimbrel 0 0 62 53 76 3 5 5 4 5 6 0
Notes: * SCI of Ireland’s Eye SPA. ** Named bird species of Ireland’s Eye SPA. *** SCI of Howth Head Coast SPA. **** Named bird species of Howth Head Coast SPA.
Table A10.4: Estuarine walkover peak monthly population estimates for bird species not listed on Baldoyle Bay SPA citation

rpsgroup.com/uk
APPENDIX 3 – MARINE VP SURVEY EFFORT
Date VP ID Surveyor* Start Time Finish Time Survey Effort
Minimum Tide (m)
Mean Tide (m)
Maximum Tide (m)
Survey Tidal Range (m)
Survey Tidal State**
19/12/2014 2 AMcC 10:15 13:15 03:00 2.21 3.17 4.00 1.79 T 22/12/2014 1 AMcC 12:25 15:25 03:00 1.90 3.30 4.55 2.65 T 08/01/2015 2 AMcC 09:10 12:25 03:15 2.48 3.59 4.44 1.96 H 12/01/2015 1 AMcC 10:00 13:00 03:00 2.48 3.04 3.69 1.21 H 19/01/2015 1 AMcC 08:45 11:45 03:00 4.12 4.41 4.56 0.44 H 19/01/2015 2 AMcC 12:55 15:55 03:00 1.10 1.89 3.08 1.98 L 18/02/2015 2 KM 08:30 11:30 03:00 3.92 4.51 4.76 0.84 H 18/02/2015 1 KM 13:30 16:30 03:00 0.72 1.56 2.96 2.24 L 25/02/2015 2 KM 08:30 11:30 03:00 1.24 1.41 1.76 0.52 L 25/02/2015 1 KM 13:30 16:30 03:00 2.99 3.74 4.20 1.21 H 05/03/2015 2 NV 09:00 12:00 03:00 3.42 4.11 4.42 1 H 05/03/2015 1 NV 14:00 17:00 03:00 0.95 1.84 3.14 2.19 L 23/03/2015 2 NV 09:00 12:00 03:00 2.04 3.45 4.57 2.53 T 23/03/2015 1 NV 14:00 17:00 03:00 2.01 3.63 4.81 2.8 T 02/04/2015 2 NV 08:30 11:30 03:00 3.65 4.09 4.28 0.63 H 02/04/2015 1 NV 13:30 16:30 03:00 1.10 1.64 2.65 1.55 L 08/04/2015 2 NV 08:00 11:00 03:00 1.15 2.09 3.16 2.01 L 08/04/2015 1 NV 13:00 16:00 03:00 3.23 3.95 4.23 1 H 19/05/2015 1 NV 05:30 08:30 03:00 0.83 1.55 2.73 1.9 L 19/05/2015 2 NV 10:00 13:00 03:00 3.92 4.47 4.70 0.78 H 28/05/2015 2 NV 09:00 12:00 03:00 1.95 2.78 3.59 1.64 L 28/05/2015 1 NV 14:00 17:00 03:00 1.64 2.18 2.88 1.24 L 16/06/2015 2 NV 10:00 13:00 03:00 3.70 4.26 4.48 0.78 H 16/06/2015 1 NV 15:00 18:00 03:00 0.98 1.22 1.82 0.84 L 29/06/2015 2 NV 08:00 11:00 03:00 3.59 3.93 4.09 0.5 H 29/06/2015 1 NV 13:00 16:00 03:00 1.38 1.63 2.24 0.86 L 07/07/2015 1 NV 07:00 10:00 03:00 1.06 1.29 1.83 0.77 L 07/07/2015 2 NV 12:00 15:00 03:00 2.85 3.78 4.46 1.61 H 13/07/2015 1 NV 07:30 10:30 03:00 3.83 4.23 4.40 0.57 H 13/07/2015 2 NV 12:30 15:30 03:00 1.48 1.90 2.77 1.29 L 04/08/2015 2 NV 08:00 11:00 03:00 1.08 2.03 3.21 2.13 L 04/08/2015 1 NV 13:00 16:00 03:00 3.98 4.56 4.79 0.81 H 24/08/2015 2 NV 07:00 10:00 03:00 2.36 3.14 3.83 1.47 H 24/08/2015 1 NV 12:15 15:15 03:00 2.02 2.48 3.09 1.07 L 09/09/2015 1 NV 07:00 10:00 03:00 3.42 3.82 3.99 0.57 H 09/09/2015 2 NV 14:45 17:45 03:00 1.66 2.09 2.77 1.11 L 30/09/2015 1 NV 07:15 10:15 03:00 0.92 2.27 3.61 2.69 L 30/09/2015 2 NV 11:10 14:10 03:00 4.10 4.50 4.70 0.6 H

rpsgroup.com/uk
Date VP ID Surveyor* Start Time Finish Time Survey Effort
Minimum Tide (m)
Mean Tide (m)
Maximum Tide (m)
Survey Tidal Range (m)
Survey Tidal State**
01/10/2015 1 NV 08:00 11:00 03:00 1.02 2.32 3.59 2.57 L 01/10/2015 2 NV 13:00 16:00 03:00 4.00 4.44 4.63 0.63 H 22/10/2015 2 NV 11:45 14:45 03:00 2.04 2.33 2.83 0.79 L 22/10/2015 1 NV 15:30 18:30 03:00 3.20 3.77 4.16 0.96 H 05/11/2015 2 NV 08:00 11:00 03:00 2.65 3.28 3.88 1.23 H 06/11/2015 1 NV 12:10 15:10 03:00 2.26 2.41 2.66 0.4 L 23/11/2015 1 NV 07:45 10:45 03:00 3.84 4.29 4.47 0.63 H 23/11/2015 2 NV 11:30 14:30 03:00 1.26 2.01 3.19 1.93 L 03/12/2015 1 NV 09:00 12:00 03:00 2.06 2.19 2.45 0.39 L 04/12/2015 2 NV 10:00 13:00 03:00 2.23 2.33 2.53 0.3 L 09/12/2015 1 NV 10:30 13:30 03:00 2.76 3.79 4.46 1.7 H 10/12/2015 2 NV 09:30 12:30 03:00 3.83 4.31 4.50 0.67 H 15/12/2015 1 NV 09:00 12:00 03:00 2.03 3.17 4.22 2.19 T 16/12/2015 2 NV 09:30 12:30 03:00 1.99 3.02 4.06 2.07 T 06/01/2016 1 NV 09:00 12:00 03:00 3.01 3.77 4.24 1.23 H 08/01/2016 2 NV 10:00 13:00 03:00 3.35 4.28 4.73 1.38 H 19/01/2016 1 NV 09:00 12:00 03:00 1.79 2.68 3.66 1.87 L 23/01/2016 2 NV 10:00 13:00 03:00 3.77 4.39 4.65 0.88 H 06/02/2016 1 NV 13:45 16:45 03:00 1.78 2.05 2.64 0.86 L 10/02/2016 2 NV 12:30 15:30 03:00 2.87 4.22 4.93 2.06 H 17/02/2016 2 NV 11:00 14:00 03:00 1.54 1.71 2.07 0.53 L 18/02/2016 1 NV 10:30 13:30 03:00 1.56 2.30 3.27 1.71 L 08/03/2016 1 NV 09:00 12:00 03:00 4.24 4.68 4.87 0.63 H 15/03/2016 2 NV 14:30 17:30 03:00 3.48 3.95 4.14 0.66 H 18/03/2016 1 NV 12:00 15:00 03:00 1.40 1.56 1.99 0.59 L 21/03/2016 2 NV 14:30 17:30 03:00 1.04 1.26 1.82 0.78 L 04/04/2016 1 NV 08:00 11:00 03:00 3.55 4.19 4.43 0.88 H 04/04/2016 2 NV 13:30 16:30 03:00 1.38 1.55 1.90 0.52 L 12/04/2016 2 NV 12:00 15:00 03:00 3.01 3.93 4.55 1.54 H 17/04/2016 1 NV 07:30 10:30 03:00 3.49 3.97 4.14 0.65 H 04/05/2016 2 NV 13:00 16:00 03:00 1.03 1.29 1.96 0.93 L 09/05/2016 1 NV 06:30 09:30 03:00 0.78 1.55 2.79 2.01 L 25/05/2016 1 NV 15:00 18:00 03:00 1.67 2.81 3.91 2.24 T 26/05/2016 2 NV 14:30 17:30 03:00 2.58 3.57 4.19 1.61 H 14/06/2016 1 NV 06:30 09:30 03:00 3.15 3.79 4.08 0.93 H 14/06/2016 2 NV 12:30 15:30 03:00 1.70 1.97 2.50 0.8 L 30/06/2016 1 NV 05:00 08:00 03:00 3.69 4.21 4.43 0.74 H 30/06/2016 2 NV 08:45 11:45 03:00 1.79 2.87 3.95 2.16 T 08/07/2016 2 NV 14:00 17:00 03:00 2.86 3.88 4.39 1.53 H 12/07/2016 2 NV 11:15 14:15 03:00 1.61 2.11 2.79 1.18 L 17/07/2016 2 NV 12:30 15:30 03:00 1.46 2.02 2.92 1.46 L 22/07/2016 2 NV 11:00 14:00 03:00 3.76 4.27 4.48 0.72 H 15/03/2017 1 NV 06:40 09:40 03:00 0.84 1.53 2.61 1.77 L

rpsgroup.com/uk
Date VP ID Surveyor* Start Time Finish Time Survey Effort
Minimum Tide (m)
Mean Tide (m)
Maximum Tide (m)
Survey Tidal Range (m)
Survey Tidal State**
15/03/2017 2 NV 12:00 15:00 03:00 3.87 4.34 4.53 0.66 H 29/03/2017 2 NV 06:40 09:40 03:00 1.19 2.48 3.80 2.61 T 29/03/2017 1 NV 12:00 15:00 03:00 3.00 4.31 5.02 2.02 H 20/04/2017 1 NV 06:45 09:45 03:00 2.21 2.93 3.56 1.35 T 20/04/2017 2 NV 11:00 14:00 03:00 1.66 1.80 2.12 0.46 L 27/04/2017 1 NV 06:15 09:15 03:00 0.99 2.31 3.69 2.7 L 27/04/2017 2 NV 12:55 15:55 03:00 1.40 3.00 4.45 3.05 T 08/05/2017 1 NV 05:40 08:40 03:00 2.21 3.30 3.96 1.75 T 08/05/2017 2 NV 12:40 15:40 03:00 1.06 1.84 2.97 1.91 L 17/05/2017 1 NV 11:20 14:20 03:00 2.67 3.23 3.75 1.08 H 17/05/2017 2 NV 15:20 18:20 03:00 3.19 3.77 4.03 0.84 H 12/06/2017 2 NV 12:40 15:40 03:00 3.19 3.96 4.30 1.11 H 12/06/2017 1 NV 16:30 19:30 03:00 1.29 1.63 2.43 1.14 L 27/06/2017 2 NV 08:15 11:15 03:00 1.15 2.30 3.51 2.36 L 27/06/2017 1 NV 12:05 15:02 02:57 4.12 4.56 4.76 0.64 H 20/07/2017 2 NV 07:45 10:45 03:00 3.26 4.00 4.34 1.08 H 20/07/2017 1 NV 11:30 14:30 03:00 1.29 1.75 2.63 1.34 L 27/07/2017 1 NV 07:30 10:30 03:00 0.92 1.48 2.50 1.58 L 27/07/2017 2 NV 11:30 14:30 03:00 3.30 4.16 4.64 1.34 H 17/08/2017 1 NV 08:50 11:50 03:00 1.81 2.63 3.57 1.77 T 17/08/2017 2 NV 12:35 15:35 03:00 1.66 1.98 2.56 0.91 L 29/08/2017 2 NV 10:05 13:05 03:00 1.72 2.05 2.62 0.91 L 29/08/2017 1 NV 13:45 16:45 03:00 3.00 3.57 3.94 0.95 H 06/09/2017 2 NV 08:40 11:40 03:00 3.25 4.00 4.42 1.18 H 06/09/2017 1 NV 12:20 15:20 03:00 1.94 3.19 4.23 2.3 T 21/09/2017 1 NV 12:15 15:15 03:00 2.52 3.80 4.63 2.12 T 21/09/2017 2 NV 15:45 18:45 03:00 1.02 1.26 1.90 0.89 L 25/10/2017 2 NV 12:40 15:40 03:00 3.81 4.14 4.27 0.47 H 25/10/2017 1 NV 16:05 19:05 03:00 2.10 3.03 3.93 1.84 T 31/10/2017 1 NV 07:00 10:00 03:00 3.64 3.89 4.03 0.4 H 31/10/2017 2 NV 13:45 16:45 03:00 1.85 2.12 2.69 0.85 L 27/11/2017 1 NV 08:15 11:15 03:00 2.04 2.46 3.10 1.07 T 29/11/2017 1 NV 13:05 16:05 03:00 1.67 1.98 2.56 0.9 L 30/11/2017 2 NV 12:50 15:50 03:00 1.49 1.62 1.94 0.46 L 04/12/2017 1 NV 08:25 11:25 03:00 3.18 4.13 4.71 1.54 H 18/12/2017 2 NV 13:00 16:00 03:00 1.66 2.81 3.97 2.32 T 28/12/2017 1 NV 08:20 11:20 03:00 2.13 2.88 3.68 1.56 T 28/12/2017 2 NV 12:20 15:20 03:00 1.84 2.16 2.76 0.93 T 10/01/2018 1 NV 08:20 11:20 03:00 2.04 2.68 3.52 1.49 T 10/01/2018 2 NV 11:55 14:55 03:00 1.94 2.29 2.85 0.92 T 24/01/2018 2 NV 08:30 11:30 03:00 2.18 2.37 2.78 0.61 T 24/01/2018 1 NV 12:05 15:05 03:00 3.15 3.86 4.48 1.34 H 05/02/2018 1 NV 09:15 12:15 03:00 1.23 2.25 3.35 2.13 T

rpsgroup.com/uk
Date VP ID Surveyor* Start Time Finish Time Survey Effort
Minimum Tide (m)
Mean Tide (m)
Maximum Tide (m)
Survey Tidal Range (m)
Survey Tidal State**
05/02/2018 2 NV 13:00 16:00 03:00 3.86 4.33 4.52 0.67 H 22/02/2018 1 NV 07:30 10:30 03:00 1.28 1.44 1.80 0.53 L 22/02/2018 2 NV 11:20 14:20 03:00 2.17 3.12 3.96 1.8 T 15/03/2018 1 NV 06:40 09:40 03:00 3.00 3.95 4.69 1.7 H 15/03/2018 2 NV 12:00 15:00 03:00 1.98 3.15 4.32 2.35 T 29/03/2018 2 NV 06:40 09:40 03:00 3.07 3.95 4.56 1.5 H 29/03/2018 1 NV 12:00 15:00 03:00 1.05 2.21 3.60 2.56 T Notes: * Surveyors: AMcC = Adam McClure, KM = Kevin Mawhinney, NV= Nick Veale. ** Tidal state for each survey is designated as follows. Surveys designated as 'high tide' (H) when survey mean tide >= mid height of the tide AND survey min tide >= highest low tide. Surveys designated as 'low tide'(L) when survey mean tide < the mid height of the tide AND survey max tide < lowest high tide. All other surveys are designate 'through the tide' 'T'
Table A10.5: Coastal and marine VP survey effort December 2014 to March 2018

rpsgroup.com/uk
APPENDIX 4 – MARINE VP RECORDS
Species Ireland’s Eye SPA
Howth Head Coast SPA
Number of Surveys Species
Present (74 Surveys
Total)
Total Number of Individuals
Encountered on Sea During VP
Surveys
Total Number of Individuals
Encountered in Flight During VP Surveys
Peak VP Count (Birds on Sea in a
Single Survey)
Peak VP Count (Birds in Flight in a
Single Survey)
Peak VP Count
(All Birds in a
Single Survey)
Peak VP Month
Guillemot SCI Yes 60 1084 750 216 364 465 March
Razorbill SCI Yes 62 1557 771 388 188 453 March
Guillemot or razorbill SCI Yes 39 1089 218 400 33 424 October
Kittiwake SCI SCI 60 1207 1000 145 186 310 October
Herring gull SCI No 75 3709 1932 177 119 239 February
Fulmar Yes Yes 55 336 741 76 83 159 December
Great black-backed gull Yes No 74 746 746 61 43 97 February
Cormorant SCI No 73 476 472 47 34 69 January
Gannet Yes No 48 277 354 19 42 60 February
Shag Yes No 71 783 365 41 12 47 September
Cormorant or shag Yes No 3 31 3 29 3 29 October
Black guillemot Yes No 59 208 96 22 6 22 October
Peregrine Yes Yes 15 0 24 0 4 4 October
Puffin Yes No 4 2 4 1 2 2 March
Table A10.6: Frequency and number of species encounters and on sea/in flight/total peak counts from VP surveys during winter/passage season (species named in Ireland’s Eye
and/or Howth Head Coast SPA citations), sorted by peak VP count

rpsgroup.com/uk
Species Baldoyle Bay SPA Citation Status
Number of Surveys Species
Present (74 Surveys Total)
Number of Individuals
Encountered on Sea During VP
Surveys
Number of Individuals
Encountered in Flight During VP
Surveys
Peak VP Count (Birds on Sea in a
Single Survey)
Peak VP Count (Birds in Flight in a
Single Survey)
Peak VP Count (All Birds in a
Single Survey)
Peak VP Month
Great crested grebe Yes 46 1846 32 253 3 255 March
Oystercatcher Yes 63 1383 912 187 109 210 January
Sanderling Yes 17 453 230 82 51 105 December
Dunlin Yes 9 146 235 80 100 100 January
Red-breasted merganser Yes 39 456 99 72 18 90 March
Turnstone Yes 16 203 70 33 19 44 March
Brent goose (LB) SCI 39 107 569 39 39 39 February
Redshank Yes 5 84 4 36 4 36 January
Ringed plover SCI 5 0 89 0 21 21 March
Curlew Yes 18 49 61 13 11 16 November
Lapwing Yes 1 0 15 0 15 15 February
Bar-tailed godwit SCI 3 27 0 14 0 14 October
Black-tailed godwit Yes 1 0 12 0 12 12 November
Shelduck SCI 3 9 8 9 4 9 November
Grey heron Yes* 10 2 14 1 6 7 December
Mallard Yes 1 0 2 0 2 2 February
Notes
*Listed as ‘other important species’ of Baldoyle Bay SPA.
Table A10.7: Frequency and number of species encounters and on sea/in flight/total peak counts from VP surveys during winter/passage season (species named in Baldoyle Bay
SPA citation), sorted by peak VP count

rpsgroup.com/uk
Species Number of Surveys Species
Present (74 Surveys Total)
Number of Individuals
Encountered on Sea During VP
Surveys
Number of Individuals
Encountered in Flight During VP
Surveys
Peak VP Count (Birds on Sea in a Single Survey)
Peak VP Count (Birds in Flight in a Single Survey)
Peak VP Count (All Birds in a
Single Survey)
Peak VP Month
Common scoter 64 5616 696 443 53 478 January
Black-headed gull 55 1759 753 121 102 223 October
Canada goose 2 204 3 203 3 203 January
Red-throated diver 63 617 73 112 5 112 March
Sandwich tern 8 77 89 37 23 58 September
Pink-footed goose 1 0 49 0 49 49 March
Whimbrel 4 3 80 3 38 38 March
Manx shearwater 1 0 35 0 35 35 September
Bar-tailed godwit 5 71 0 25 0 25 October
Lesser black-backed gull 28 97 33 18 7 25 November
Common gull 36 135 66 22 7 23 November
Common or Arctic tern 1 0 23 0 23 23 September
Swallow 2 0 36 0 18 18 March
Goldcrest 1 11 0 11 0 11 March
Great northern diver 37 85 9 8 2 9 December
Black-throated diver 6 11 0 5 0 5 February
Common tern 1 2 3 2 3 5 September
Common eider 1 4 0 4 0 4 December
Little grebe 2 0 8 0 4 4 March
Long-tailed duck 5 12 0 4 0 4 January
Purple sandpiper 2 0 8 0 4 4 March
Mediterranean gull 4 5 2 2 1 2 September
Blackbird 1 0 2 0 2 2 November
Ring-billed gull 1 2 0 2 0 2 March
Slavonian grebe 1 2 0 2 0 2 March
Arctic skua 1 0 1 0 1 1 September
Black-necked grebe 1 1 0 1 0 1 March
Table A10.8: Frequency and number of species encounters and on sea/in flight/total peak counts from VP surveys during winter/passage season (non-SPA species), sorted by
peak VP count

rpsgroup.com/uk
Species Number of Surveys Species
Present (74 Surveys Total)
Number of Individuals
Encountered on Sea During VP
Surveys
Number of Individuals
Encountered in Flight During VP
Surveys
Peak VP Count (Birds on Sea in a Single Survey)
Peak VP Count (Birds in Flight in a Single Survey)
Peak VP Count (All Birds in a
Single Survey)
Peak VP Month
Unidentified gull 3 205 0 142 0 142 January
Unidentified wader 4 28 0 24 0 31 November
Table A10.9: Number of partially identified bird encounters and on sea/in flight/total peak counts from VP surveys during winter/passage season, sorted by peak VP count
Species Ireland’s Eye SPA
Howth Head Coast SPA
Number of Surveys Species
Present (56 Surveys
Total)
Number of Individuals
Encountered on Sea
During VP Surveys
Number of Individuals
Encountered in Flight
During VP Surveys
Peak VP Count
(Birds on Sea in a Single
Survey)
Peak VP Count (Birds in Flight in a
Single Survey)
Peak VP Count (All Birds in a
Single Survey)
Peak VP Month
Guillemot SCI Yes 51 7882 4541 1051 462 1513 June
Razorbill SCI Yes 55 6683 3571 705 333 1038 May
Kittiwake SCI SCI 56 2988 1773 477 87 557 May
Guillemot or razorbill Yes Yes 38 795 534 184 161 244 July
Gannet Yes No 54 1055 1268 143 133 225 June
Herring Gull SCI No 56 3070 1889 129 86 185 June
Puffin Yes No 33 740 322 151 55 173 June
Shag Yes No 56 1208 1075 60 84 129 July
Great Black-backed Gull Yes No 56 692 905 32 66 87 June
Cormorant SCI No 56 501 791 37 49 63 June
Fulmar Yes Yes 51 197 516 23 40 63 May
Black Guillemot Yes No 51 204 114 10 6 14 June
Peregrine Yes Yes 18 0 18 0 2 2 May, July
Cormorant or shag Yes No 4 3 1 1 1 1 May, July,
August
Table A10.10: Frequency and number of species encounters from VP surveys during breeding season (species named in Ireland’s Eye/Howth Head Coast SPA citations), sorted by
peak VP count

rpsgroup.com/uk
Species Baldoyle Bay SPA Citation Status
Number of Surveys Species
Present (56 Surveys Total)
Number of Individuals
Encountered on Sea During
VP Surveys
Number of Individuals
Encountered in Flight During VP Surveys
Peak VP Count (Birds on Sea in a Single Survey)
Peak VP Count (Birds in Flight
in a Single Survey)
Peak VP Count (All Birds in a
Single Survey)
Peak VP Month
Oystercatcher Yes 49 805 357 128 38 145 May
Ringed Plover SCI 9 136 73 38 32 70 June
Red-breasted Merganser Yes 15 117 22 37 7 44 August
Dunlin Yes 4 80 37 40 26 40 June
Black-tailed Godwit Yes 1 0 37 0 37 37 July
Curlew Yes 9 21 20 7 10 16 August
Redshank Yes 2 7 16 7 16 16 April
Great Crested Grebe Yes 7 55 5 14 2 15 April
Shelduck SCI 19 13 69 4 14 14 July
Brent Goose (light-bellied) SCI 3 0 30 0 24 13 April
Turnstone Yes 4 8 28 8 12 12 July
Bar-tailed Godwit Yes 1 1 0 1 0 1 May
Grey Heron Yes* 8 1 6 1 1 1 April, May, June, July,
August
Notes
*Listed as ‘other important species’ of Baldoyle Bay SPA.
Table A10.11: Frequency and number of species encounters from VP surveys during breeding season (species named in Baldoyle Bay SPA citation), sorted by peak VP count
Species Number of Surveys Species Present (56
Surveys Total)
Number of Individuals
Encountered on Sea During VP Surveys
Number of Individuals
Encountered in Flight During VP Surveys
Peak VP Count (Birds on Sea
in a Single Survey)
Peak VP Count (Birds in Flight
in a Single Survey)
Peak VP Count (All Birds in a Single Survey)
Peak VP Month
Black-headed gull 42 757 501 96 60 156 August
Manx shearwater 29 318 637 53 100 128 August
Common scoter 16 445 57 119 18 124 August
Common tern 23 123 435 17 94 109 August
Red-throated diver 13 122 13 52 3 52 April
Common gull 42 176 113 38 10 40 June

rpsgroup.com/uk
Species Number of Surveys Species Present (56
Surveys Total)
Number of Individuals
Encountered on Sea During VP Surveys
Number of Individuals
Encountered in Flight During VP Surveys
Peak VP Count (Birds on Sea
in a Single Survey)
Peak VP Count (Birds in Flight
in a Single Survey)
Peak VP Count (All Birds in a Single Survey)
Peak VP Month
Sandwich tern 49 295 455 19 32 37 May
Common or Arctic tern 26 84 185 18 17 24 June
Lesser black-backed gull 48 119 92 12 7 14 May
Tufted duck 2 0 20 0 11 14 June
Whimbrel 5 7 18 4 11 11 April
Little tern 2 1 10 1 10 10 August
Mediterranean gull 3 2 12 2 10 10 July
Common eider 2 16 0 8 0 8 April
Roseate tern 7 3 15 2 8 8 August
Long-tailed duck 1 6 0 6 0 6 April
Mute swan 1 0 4 0 4 4 July
Arctic tern 8 4 12 2 3 3 May, June
Great skua 9 2 13 1 3 3 June,
August
Kestrel 7 3 4 3 3 3 June
Blackbird 1 0 2 0 2 2 April
Feral pigeon 4 0 8 0 2 2 May, June
Greenfinch 2 1 2 1 2 2 July
Sparrowhawk 1 0 2 0 2 2 June
Arctic skua 4 0 4 0 1 1 July,
August
Little stint 1 0 1 0 1 1 July
Great northern diver 1 1 0 1 0 1 August
Ring-billed gull 1 1 0 1 0 1 July
Storm petrel 1 0 1 0 1 1 May
Table A10.12: Frequency and number of species encounters and on sea/in flight/total peak counts from VP surveys during breeding season (non-SPA species), sorted by peak VP
count

rpsgroup.com/uk
VP Number
Behaviour Code
VP Band 1 VP Band 2 VP Band 3 VP Band 4 Total
1
- 0 0 2 0 2
DP 0 0 55 95 150
FE 0 0 7 0 7
LO 0 15 85 219 319
PL 0 0 0 2 2
RO 0 4 15 29 48
SF 0 0 5 0 5
SU 0 0 3 32 35
Total 0 19 172 377 568
2
- 0 0 17 7 24
DP 98 32 156 187 473
FE 0 0 0 12 12
LO 132 1176 940 564 2812
PR 5 16 0 1 22
RO 15 30 54 58 157
SC 0 2 0 0 2
SF 0 20 25 41 86
SU 0 6 15 18 39
Total 250 1282 1207 888 3627
Grand Total 250 1301 1379 1265 4195
Table A10.13: Kittiwake behaviour and distance band distribution recorded during VP surveys (all months, all
survey years)
VP Number
Behaviour Code
VP Band 1 VP Band 2 VP Band 3 VP Band 4 Total
1
- 0 1 4 3 8
FE 4 41 257 157 459
LO 1 38 126 135 300
PR 0 5 8 0 13
Total 5 85 395 295 780
2
- 74 63 137
FE 46 271 581 253 1151
LO 4150 1331 795 278 6554
PL 0 0 0 1 1
PR 122 27 6 0 155
RO 181 7 0 0 188
Total 4573 1699 1382 532 8186
Grand Total 4578 1784 1777 827 8966
Table A10.14: Guillemot behaviour and distance band distribution recorded during VP surveys (all months, all
survey years)
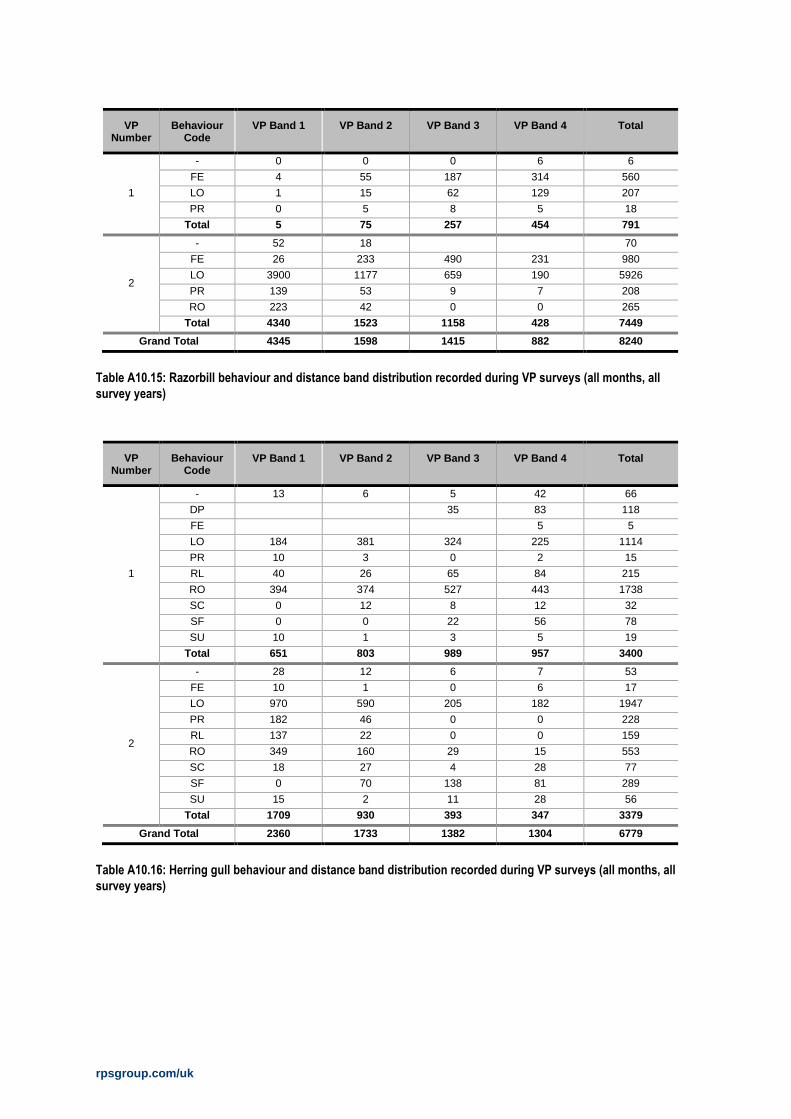
rpsgroup.com/uk
VP Number
Behaviour Code
VP Band 1 VP Band 2 VP Band 3 VP Band 4 Total
1
- 0 0 0 6 6
FE 4 55 187 314 560
LO 1 15 62 129 207
PR 0 5 8 5 18
Total 5 75 257 454 791
2
- 52 18 70
FE 26 233 490 231 980
LO 3900 1177 659 190 5926
PR 139 53 9 7 208
RO 223 42 0 0 265
Total 4340 1523 1158 428 7449
Grand Total 4345 1598 1415 882 8240
Table A10.15: Razorbill behaviour and distance band distribution recorded during VP surveys (all months, all
survey years)
VP Number
Behaviour Code
VP Band 1 VP Band 2 VP Band 3 VP Band 4 Total
1
- 13 6 5 42 66
DP 35 83 118
FE 5 5
LO 184 381 324 225 1114
PR 10 3 0 2 15
RL 40 26 65 84 215
RO 394 374 527 443 1738
SC 0 12 8 12 32
SF 0 0 22 56 78
SU 10 1 3 5 19
Total 651 803 989 957 3400
2
- 28 12 6 7 53
FE 10 1 0 6 17
LO 970 590 205 182 1947
PR 182 46 0 0 228
RL 137 22 0 0 159
RO 349 160 29 15 553
SC 18 27 4 28 77
SF 0 70 138 81 289
SU 15 2 11 28 56
Total 1709 930 393 347 3379
Grand Total 2360 1733 1382 1304 6779
Table A10.16: Herring gull behaviour and distance band distribution recorded during VP surveys (all months, all
survey years)

rpsgroup.com/uk
VP Number
Behaviour Code
VP Band 1 VP Band 2 VP Band 3 VP Band 4 Total
1
- 2 0 0 0 2
FE 36 100 77 43 256
LO 0 1 0 0 1
PR 79 59 50 84 272
RL 0 0 6 2 8
RO 27 0 8 10 45
SU 0 0 0 1 1
Total 144 160 141 140 585
2
- 0 2 0 1 3
FE 34 54 49 62 199
LO 3 1 0 9 13
PL 1 0 0 0 1
PR 100 26 0 0 126
RL 50 0 0 0 50
Total 188 83 49 72 392
Grand Total 332 243 190 212 977
Table A10.17: Cormorant behaviour and distance band distribution recorded during VP surveys (all months, all
survey years)
VP Number
Behaviour Code
VP Band 1 VP Band 2 VP Band 3 VP Band 4 Total
1
- 0 0 7 11 18
FE 0 0 2 0 2
LO 17 24 90 203 334
PR 4 0 0 3 7
RL 2 3 6 4 15
RO 32 16 45 101 194
SC 0 0 0 10 10
SF 0 0 12 21 33
SU 0 0 2 0 2
Total 55 43 164 353 615
2
- 8 0 7 8 23
FE 3 0 0 9 12
LO 57 106 143 239 545
PR 25 15 1 0 41
RL 8 0 0 0 8
RO 3 0 7 5 15
SC 2 9 0 12 23
SF 0 29 47 66 142
SU 2 0 4 8 14
Total 108 159 209 347 823
Grand Total 163 202 373 700 1438
Table A10.18: Great black-backed gull behaviour and distance band distribution recorded during VP surveys (all
months, all survey years)

rpsgroup.com/uk
VP Number
Behaviour Code
VP Band 1 VP Band 2 VP Band 3 VP Band 4 Total
1
- 0 0 0 1 1
LO 0 0 8 40 48
PR 0 0 0 4 4
SU 0 0 0 1 1
Total 0 0 8 46 54
2
- 1 0 4 1 6
LO 73 88 100 72 333
PR 20 15 3 0 38
RO 1 49 43 6 99
SU 0 0 0 3 3
Total 95 152 150 82 479
Grand Total 95 152 158 128 533
Table A10.19: Fulmar behaviour and distance band distribution recorded during VP surveys (all months, all survey
years)
VP Number
Behaviour Code
VP Band 1 VP Band 2 VP Band 3 VP Band 4 Total
1
- 1 5 0 11 17
CN 0 1 0 0 1
FE 148 323 104 48 623
LO 0 6 3 0 9
PR 6 15 3 9 33
RL 0 0 0 5 5
RO 2 0 0 0 2
Total 157 350 110 73 690
2
- 6 1 1 2 10
FE 334 265 140 69 808
LO 20 0 0 0 20
PR 297 49 0 0 346
RL 108 0 0 0 108
RO 0 8 0 0 8
SF 0 1 0 0 1
Total 765 324 141 71 1301
Grand Total 922 674 251 144 1991
Table A10.20: Shag behaviour and distance band distribution recorded during VP surveys (all months, all survey
years)

rpsgroup.com/uk
VP Number
Behaviour Code
VP Band 1 VP Band 2 VP Band 3 VP Band 4 Total
1
LO 0 0 7 43 50
PL 0 0 20 66 86
RO 0 0 0 1 1
Total 0 0 27 110 137
2
- 0 0 1 3 4
DP 0 0 2 0 2
FE 0 9 0 2 11
LO 80 144 124 170 518
PL 12 60 133 204 409
PR 134 76 9 3 222
RO 0 0 1 6 7
SF 0 3 0 0 3
SU 7 0 10 2 19
Total 233 292 280 390 1195
Grand Total 233 292 307 500 1332
Table A10.21: Gannet behaviour and distance band distribution recorded during VP surveys (all months, all survey
years)
VP Number
Behaviour Code
VP Band 1 VP Band 2 VP Band 3 VP Band 4 Total
1
FE 0 0 3 5 8
LO 0 0 2 5 7
Total 0 0 5 10 15
2
- 6 0 2 0 8
FE 0 7 8 4 19
LO 547 138 8 0 693
PR 5 2 0 0 7
Total 558 147 18 4 727
Grand Total 558 147 23 14 742
Table A10.22: Puffin behaviour and distance band distribution recorded during VP surveys (all months, all survey
years)

rpsgroup.com/uk
VP Number
Behaviour Code
VP Band 1 VP Band 2 VP Band 3 VP Band 4 Total
1
- 0 2 1 0 3
FE 6 42 57 59 164
RL 0 0 0 22 22
Total 6 44 58 81 189
2
- 3 9 0 0 12
FE 74 96 34 7 211
Total 77 105 34 7 223
Grand Total 83 149 92 88 412
Table A10.23: Black guillemot behaviour and distance band distribution recorded during VP surveys (all months, all
survey years)
VP Number
Behaviour Code
VP Band 1 VP Band 2 VP Band 3 VP Band 4 Total
1
- 3 1 11 1 16
FE 107 451 166 26 750
LO 8 459 99 122 688
PR 4 159 104 6 273
RO 0 0 2 4 6
SU 0 0 0 1 1
Total 122 1070 382 160 1734
2
FE 3 13 30 107 153
PR 0 4 0 10 14
Total 3 17 30 117 167
Grand Total 125 1087 412 277 1901
Table A10.24: Great crested grebe behaviour and distance band distribution recorded during VP surveys (all
months, all survey years)

rpsgroup.com/uk
VP Number
Behaviour Code
VP Band 1 VP Band 2 VP Band 3 VP Band 4 Total
1
- 11 0 0 0 11
FE 121 78 13 97 309
LO 11 0 0 12 23
RL 74 16 46 121 257
RO 554 100 182 689 1525
Total 771 194 241 919 2125
2
- 2 0 0 0 2
FE 20 0 0 0 20
LO 0 2 0 0 2
RL 8 0 0 0 8
RO 31 0 0 0 31
Total 61 2 0 0 63
Grand Total 832 196 241 919 2188
Table A10.25: Oystercatcher behaviour and distance band distribution recorded during VP surveys (all months, all
survey years)
VP Number
Behaviour Code
VP Band 1 VP Band 2 VP Band 3 VP Band 4 Total
1
FE 163 23 53 152 391
RO 0 0 0 18 18
SU 0 22 0 22 44
Total 163 45 53 192 453
2 Total 0 0 0 0 0
Grand Total 163 45 53 192 453
Table A10.26: Sanderling behaviour and distance band distribution recorded during VP surveys (all months, all
survey years)
VP Number
Behaviour Code
VP Band 1 VP Band 2 VP Band 3 VP Band 4 Total
1
FE 8 0 0 86 94
RO 22 0 12 98 132
Total 30 0 12 184 226
2 Total 0 0 0 0 0
Grand Total 30 0 12 184 226
Table A10.27: Dunlin behaviour and distance band distribution recorded during VP surveys (all months, all survey
years)

rpsgroup.com/uk
VP Number
Behaviour Code
VP Band 1 VP Band 2 VP Band 3 VP Band 4 Total
1
- 0 4 17 0 21
FE 24 349 70 12 455
LO 3 7 6 29 45
PR 0 17 22 0 39
Total 27 377 115 41 560
2
ED 2 0 0 0 2
FE 0 0 0 11 11
Total 2 0 0 11 13
Grand Total 29 377 115 52 573
Table A10.28: Red-breasted merganser behaviour and distance band distribution recorded during VP surveys (all
months, all survey years)
VP Number
Behaviour Code
VP Band 1 VP Band 2 VP Band 3 VP Band 4 Total
1
- 0 0 0 12 12
FE 6 22 0 12 40
PR 0 0 0 11 11
RO 53 0 33 36 122
Total 59 22 33 71 185
2
RL 4 0 0 0 4
RO 21 0 0 0 21
Total 25 0 0 0 25
Grand Total 84 22 33 71 210
Table A10.29: Turnstone behaviour and distance band distribution recorded during VP surveys (all months, all
survey years)
VP Number
Behaviour Code
VP Band 1 VP Band 2 VP Band 3 VP Band 4 Total
1
FE 0 0 0 8 8
RL 0 0 0 27 27
RO 0 0 4 52 56
Total 0 0 4 87 91
2 Total 0 0 0 0 0
Grand Total 0 0 4 87 91
Table A10.30: Redshank behaviour and distance band distribution recorded during VP surveys (all months, all
survey years)

rpsgroup.com/uk
VP Number
Behaviour Code
VP Band 1 VP Band 2 VP Band 3 VP Band 4 Total
1
- 7 0 0 0 7
FE 11 7 8 19 45
RO 60 8 16 0 84
Total 78 15 24 19 136
2 Total 0 0 0 0 0
Grand Total 78 15 24 19 136
Table A10.31: Ringed plover behaviour and distance band distribution recorded during VP surveys (all months, all
survey years)
VP Number
Behaviour Code
VP Band 1 VP Band 2 VP Band 3 VP Band 4 Total
1
- 7 6 2 0 15
DP 2 0 0 0 2
LO 192 165 82 75 514
PR 5 0 0 0 5
RL 22 34 80 93 229
RO 338 317 438 428 1521
SC 0 4 8 0 12
SF 0 0 2 20 22
SU 7 0 4 9 20
Total 573 526 616 625 2340
2
- 0 1 0 0 1
LO 4 7 63 40 114
PR 0 0 3 0 3
RO 0 0 15 27 42
SC 0 6 0 0 6
SF 0 0 7 3 10
Total 4 14 88 70 176
Grand Total 577 540 704 695 2516
Table A10.32: Black-headed gull behaviour and distance band distribution recorded during VP surveys (all months,
all survey years)

rpsgroup.com/uk
VP Number
Behaviour Code
VP Band 1 VP Band 2 VP Band 3 VP Band 4 Total
1
- 4 0 0 0 4
FE 0 0 1 0 1
LO 16 9 9 14 48
RL 2 0 22 4 28
RO 30 47 38 38 153
SC 0 0 0 2 2
SF 0 0 0 3 3
SU 1 0 0 0 1
Total 53 56 70 61 240
2
LO 5 16 11 10 42
RO 2 0 2 0 4
SC 2 4 0 0 6
SF 0 2 7 10 19
Total 9 22 20 20 71
Grand Total 62 78 90 81 311
Table A10.33: Common gull behaviour and distance band distribution recorded during VP surveys (all months, all
survey years)
VP Number
Behaviour Code
VP Band 1 VP Band 2 VP Band 3 VP Band 4 Total
1
- 0 0 2 0 2
LO 7 24 14 4 49
RL 0 4 5 6 15
RO 15 22 36 31 104
SF 0 0 1 0 1
Total 22 50 58 41 171
2
LO 2 6 10 8 26
RL 2 0 0 0 2
RO 5 3 0 0 8
SF 0 0 2 7 9
Total 9 9 12 15 45
Grand Total 31 59 70 56 216
Table A10.34: Lesser black-backed gull behaviour and distance band distribution recorded during VP surveys (all
months, all survey years)

rpsgroup.com/uk
VP Number
Behaviour Code
VP Band 1 VP Band 2 VP Band 3 VP Band 4 Total
1
- 0 2 1 2 5
FE 17 102 184 38 341
LO 0 39 93 87 219
PR 0 5 15 14 34
Total 17 148 293 141 599
2
- 0 0 1 2 3
FE 1 6 34 87 128
LO 0 1 0 5 6
PR 0 2 0 1 3
Total 1 9 35 95 140
Grand Total 18 157 328 236 739
Table A10.35: Red-throated diver behaviour and distance band distribution recorded during VP surveys (all months,
all survey years)
VP Number
Behaviour Code
VP Band 1 VP Band 2 VP Band 3 VP Band 4 Total
1
- 0 0 0 1 1
FE 0 7 16 32 55
LO 0 0 0 1 1
PR 0 0 1 0 1
2
Total 0 7 17 34 58
FE 0 3 10 14 27
LO 0 0 1 0 1
Total 0 3 11 14 28
Grand Total 0 10 28 48 86
Table A10.36: Great northern diver behaviour and distance band distribution recorded during VP surveys (all
months, all survey years)
VP Number
Behaviour Code
VP Band 1 VP Band 2 VP Band 3 VP Band 4 Total
1
- 16 0 0 89 105
FE 8 429 75 495 1294
LO 99 1175 256 1792 3531
PR 0 44 0 4 48
RO 15 0 0 29 44
Total 138 1648 331 2409 5022
2
FE 0 91 45 350 441
LO 0 47 0 546 598
Total 0 138 45 896 1039
Grand Total 138 1786 376 3305 6061
Table A10.37: Common scoter behaviour and distance band distribution recorded during VP surveys (all months,
all survey years)

rpsgroup.com/uk
VP Number
Behaviour Code
VP Band 1 VP Band 2 VP Band 3 VP Band 4 Total
1
DP 0 5 5 0 10
PL 9 51 13 16 89
Total 9 56 18 16 99
2
DP 0 0 4 6 10
PL 0 4 12 0 16
Total 0 4 16 6 26
Grand Total 9 60 34 22 125
Table A10.38: Common tern behaviour and distance band distribution recorded during VP surveys (all months, all
survey years)
VP Number
Behaviour Code
VP Band 1 VP Band 2 VP Band 3 VP Band 4 Total
1
DP 0 15 13 0 28
LO 0 1 0 0 1
PL 23 49 27 14 113
RL 0 3 0 52 55
RO 19 20 6 32 77
Total 42 88 46 98 274
2
- 0 0 0 6 6
DP 0 0 18 11 29
PL 0 3 19 41 63
Total 0 3 37 58 98
Grand Total 42 91 83 156 372
Table A10.39: Sandwich tern behaviour and distance band distribution recorded during VP surveys (all months, all
survey years)
VP Number
Behaviour Code
VP Band 1 VP Band 2 VP Band 3 VP Band 4 Total
1
LO 0 0 0 27 27
SU 0 0 0 27 27
Total 0 0 0 54 54
2
FE 0 0 0 7 7
LO 0 0 25 114 139
RO 0 0 11 10 21
SU 0 0 27 70 97
Total 0 0 63 201 264
Grand Total 9 60 63 255 318
Table A10.40: Manx shearwater behaviour and distance band distribution recorded during VP surveys (all months,
all survey years)

rpsgroup.com/uk
APPENDIX 5 – MARINE VP GRAPHS
Graph A10.1: Total number of guillemots or razorbills (gra), guillemots (GU) and razorbills (RA) recorded by month
during VP surveys (Velvet Strand and Ireland’s Eye) during entire survey programme
Graph A10.2: Total number of great black-backed gulls (GB), herring gulls (HG) and kittiwakes (KI) recorded by
month during VP surveys (Velvet Strand and Ireland’s Eye) during entire survey programme
Graph A10.3: Total number of fulmars (F.) recorded by month during VP surveys (Velvet Strand and Ireland’s Eye)
during entire survey programme

rpsgroup.com/uk
Graph A10.4: Total number cormorants (CA) and shags (SA) recorded by month during VP surveys (Velvet Strand
and Ireland’s Eye) during entire survey programme
Graph A10.5: Total number of gannets (GX) recorded by month during VP surveys (Velvet Strand and Ireland’s Eye)
during entire survey programme
Graph A10.6: Total number of puffins (PU) and black guillemots (TY) recorded by month during VP surveys (Velvet
Strand and Ireland’s Eye) during entire survey programme

rpsgroup.com/uk
Graph A10.7: Total number of peregrines (PE) recorded by month during VP surveys (Velvet Strand and Ireland’s
Eye) during entire survey programme
Graph A10.8: Total number of great crested grebes (GG), oystercatchers (OC) and sanderlings (SS) recorded by
month during VP surveys (Velvet Strand and Ireland’s Eye) during entire survey programme
Graph A10.9: Total number of dunlins (DN), red-breasted mergansers (RM) and turnstones (TT) recorded by month
during VP surveys (Velvet Strand and Ireland’s Eye) during entire survey programme

rpsgroup.com/uk
Graph A10.10: Total number of redshanks (RK) and ringed plovers (RP) recorded by month during VP surveys
(Velvet Strand and Ireland’s Eye) during entire survey programme
Graph A10.11: Total number of black-headed gulls (BH), common gulls (CM) and lesser black-backed gulls (LB)
recorded by month during VP surveys (Velvet Strand and Ireland’s Eye) during entire survey programme
Graph A10.12: Total number of great northern divers (ND) and red-throated divers (RH) recorded by month during
VP surveys (Velvet Strand and Ireland’s Eye) during entire survey programme

rpsgroup.com/uk
Graph A10.13: Total number of common scoters (CX) recorded by month during VP surveys (Velvet Strand and
Ireland’s Eye) during entire survey programme
Graph A10.14: Total number of Arctic terns (AE), common terns (CN), Sandwich terns (TE) and ‘commic’ (common
or Arctic) terns (UI) recorded by month during VP surveys (Velvet Strand and Ireland’s Eye) during entire survey
programme
Graph A10.15: Total number of Manx shearwaters (MX) recorded by month during VP surveys (Velvet Strand and
Ireland’s Eye) during entire survey programme

Environmental Impact Assessment Volume 2 of 4: Main Report
32102902/NIS
Appendix B Reef Assessment Reports

IRISH WATER
GREATER DUBLIN DRAINAGE
PHASE II IRELAND’S EYE REEF SURVEY
Date of Survey:
30/06/2015 - 02/07/2015
Prepared By: Client: Benthic Solutions Limited RPS Group Ltd Elanco Works West Pier Business Campus Marsh Road Dun Laoghaire, County Dublin Hoveton Ireland Norfolk NR12 8UH United Kingdom
Disclaimer:
This report has been produced in line with the requirements and objectives of the scope of work and contractual terms between Benthic Solutions Limited and the Client. The results are based upon expert interpretation. All interpretation and opinions contained herein are provided based upon the data collated as part of the survey, and other data provided by the Client and available within the public domain.
Reference Revision Date Issue Type Author QC Approved
1502 00 08/11/2015 DRAFT TM/KT/HL HL IW
1502 01 09/11/2015 FINAL TM/KT/HL HL IW

Ireland’s Eye Reef Survey BSL 1502 Revision 1 (FINAL) 1 November 2015
Contents Contents............................................................................................................................................ 1
1. Executive Summary ................................................................................................................... 4
2. Scope of Work ........................................................................................................................... 6
3. Historical Data ........................................................................................................................... 7
4. Site Selection ............................................................................................................................. 8
5. Field Operations Summary observations .................................................................................. 10
6. Results and Discussion ............................................................................................................. 11
6.1. Biotope Classification ....................................................................................................... 11
6.1.1. Littoral Station 1 ....................................................................................................... 11
6.1.2. Littoral Station 2 ....................................................................................................... 13
6.1.3. Littoral Station 3 ....................................................................................................... 17
6.1.4. Sublittoral Station 1 .................................................................................................. 20
6.1.5. Sublittoral Station 2 .................................................................................................. 23
6.1.6. Sublittoral Station 3 .................................................................................................. 28
6.1.7. Sublittoral Station 4 .................................................................................................. 31
6.2. Univariate Analyses .......................................................................................................... 35
6.3. Multivariate Analyses ....................................................................................................... 37
6.3.1. Littoral Stations ........................................................................................................ 37
6.3.2. Sublittoral Stations ................................................................................................... 38
7. Conclusion ............................................................................................................................... 40
8. References ............................................................................................................................... 41

Ireland’s Eye Reef Survey BSL 1502 Revision 1 (FINAL) 2 November 2015
List of Figures Figure 2.1 Ireland’s Eye Marine Community Types Designated by Rockabill to Dalkey Island SAC ....... 6
Figure 4.1 Composite Topography/Bathymetry of Irelands Eye with Proposed Survey Locations for
Sublittoral Transects (lines) and Littoral Coastlines (Stars) ................................................................. 9
Figure 6.1 Littoral Zones and Biotopes for Station L1 ....................................................................... 12
Figure 6.2 Littoral Zones and Biotopes for Station L2 ....................................................................... 15
Figure 6.3 Littoral Zones and Biotopes for Station L3 ....................................................................... 18
Figure 6.4 Sublittoral Zones and Biotopes for Station S1 .................................................................. 21
Figure 6.5 Sublittoral Zones and Biotopes for Station S2 .................................................................. 25
Figure 6.6 Sublittoral Zones and Biotopes for Station S3 .................................................................. 29
Figure 6.7 Sublittoral Zones and Biotopes for Station S4 .................................................................. 33
Figure 6.8 Distribution of Species per Phyla and Station .................................................................. 36
Figure 6.9 Dendrogram of Biotopes Recorded at the Littoral Stations .............................................. 37
Figure 6.10 MDS of Biotopes Recorded at the Littoral Stations ........................................................ 38
Figure 6.11 Dendrogram of Biotopes Recorded at the Sublittoral Stations ....................................... 39
Figure 6.12 MDS of Biotopes Recorded at the Sublittoral Stations ................................................... 39
List of Tables Table 2.1 Rockabill to Dalkey Island SAC Conservation Objectives ...................................................... 6
Table 4.1 Proposed Littoral and Sublittoral Locations......................................................................... 8
Table 5.1 Chronological Sequence of Field Operations ..................................................................... 10
Table 6.1 Species List for Station L1 with SACFOR Abundance Classifications for Each Biotope......... 13
Table 6.2 Species List for Station L2 with SACFOR Abundance Classifications for Each Biotope......... 16
Table 6.3 Species List for Station L3 with SACFOR Abundance Classifications for each Biotope......... 18
Table 6.4 Species List for Station S1 with SACFOR Abundance Classifications for Each Biotope ........ 22
Table 6.5 Species List for Station S2 with SACFOR Abundance Classifications for each Biotope ........ 25
Table 6.6 Species List for Station S3 with SACFOR Abundance Classifications for Each Biotope ........ 30
Table 6.7 Species List for Station S4 with SACFOR Abundance Classifications for Each Biotope ........ 33
Table 6.8 Number of Species per Phyla and Station ......................................................................... 36

Ireland’s Eye Reef Survey BSL 1502 Revision 1 (FINAL) 3 November 2015
Abbreviations
Abbreviation Meaning
ASML Aquatic Survey and Monitoring Limited
BSL Benthic Solutions Limited
CR.HCR.XFa.ByErSp.Sag Mixed turf of bryozoans and erect sponges with Sagartia elegans on tide-swept ciraclittoral rock
CR.HCR.XFa.FluCoAs Flustra foliacea and colonial ascidians on tide-swept moderately wave-exposed circalittoral rock
GDD Greater Dublin Drainage
CR.HCR.XFa.FluCoAs.Paur Polyclinum aurantium and Flustra foliacea on sand-scoured tide-swept moderately wave-exposed circalittoral rock
IR.HIR.KFaR.FoR Foliose red seaweeds on exposed lower infralittoral rock
IR.HIR.KFaR.FoR.Dic Foliose red seaweeds with dense Dictyota dichotoma and/or Dictyopteris membranacea on exposed lower infralittoral rock
IR.MIR.KR.Ldig Laminaria digitata on moderately exposed sublittoral fringe rock
IR.MIR.KR.Ldig.Ldig Laminaria digitata on moderately exposed sublittoral fringe bedrock
LR.FLR.Lic.Pra Prasiola stipitata on nitrate-enriched supralittoral or littoral fringe rock
LR.HLR.FR.Coff Corallina officinalis on exposed to moderately exposed lower eulittoral rock
LR.HLR.FR.Mas Mastocarpus stellatus and Chondrus crispus on very exposed to moderately exposed lower eulittoral rock
LR.HLR.MusB Mussel and/or barnacle communities
LR.HLR.MusB.Cht Chthamalus spp. on exposed eulittoral rock
LR.HLR.MusB.Sem Semibalanus balanoides on exposed to moderately exposed or vertical sheltered eulittoral rock
LR.LLR.F.Asc.FS Ascophyllum nodosum on full salinity mid eulittoral rock
LR.MLR.BF.Fser.R Fucus serratus and red seaweeds on moderately exposed lower eulittoral rock
LR.MLR.BF.FspiB Fucus spiralis on exposed to moderately exposed upper eulittoral rock
MDS Multi-Dimensional Scaling
MERC Marine and Environmental Resource Conservation Consultants
MNCR Marine Nature Conservation Review
MDS Multi-Dimensional Scaling
NPWS National Parks & Wildlife Service
ODM Ordnance Datum Malin
PRIMER Plymouth Routines In Multivariate Ecological Research
RIB Rigid-Inflatable Boat
SAC Special Areas of Conservation
SACFOR Superabundant, Abundant, Common, Frequent, Occasional and Rare
SD Standard Deviation

Ireland’s Eye Reef Survey BSL 1502 Revision 1 (FINAL) 4 November 2015
1. Executive Summary
The Irelands Eye is a small uninhabited islands located to the north of Howth head, located
within the Rockabill to Dalkey Island Special Area of Conservations (site code 3000), and is
designated for Annex 1 qualifying interest Reefs. As the site is within close proximity to the
proposed GDD outfall, these interests may be subject to plume effects from suspended
sediment during parts of the construction operation whilst dredging or be impacted by the
outfall plume itself. Field operations to acquire a detailed assessment of these qualifying
habitats was carried out and completed successfully at three littoral and four sublittoral
stations between the 30th June and 2nd of July 2015. These were based on a generic
assessment of biotopes using the standard (Marine Nature Conservation Review) MNCR-
style format. Identification and abundance of conspicuous fauna and flora were scaled
onsite using the SACFOR scheme (e.g. superabundant, abundant, common, frequent,
occasional and rare).
In the littoral zone, the biotopes ‘Corallina officinalis on exposed to moderately exposed
lower eulittoral rock/Laminaria digitata on moderately exposed sublittoral fringe rock
(LR.HLR.FR.Coff/IR.MIR.KR.Ldig) usually emerged from the sublittoral, followed by a zone
covered by seaweeds to a faunally dominated shore consisting of limpets, barnacles and
littorinids.
The sublittoral stations were characterised by Laminaria digitata forests in the shallower
part (IR.MIR.KR.Ldig.Ldig) and were usually replaced by the biotope ‘Foliose red seaweeds
with dense Dictyota dichotoma and/or Dictyopteris membranacea on exposed lower
infralittoral rock’ (IR.HIR.KFaR.FoR.Dic). The deeper extend was dominated by a ‘Mixed turf
of bryozoans and erect sponges with Sagartia elegans on tide-swept circalittoral rock’
(CR.HCR.XFa.ByErSp.Sag) or in the case of Sublittoral Station 2 ‘Flustra foliacea and colonial
ascidians on tide-swept moderately wave-exposed circalittoral rock’ (CR.HCR.XFa.FluCoAs).
The deeper biotope at Sublittoral Station 4 was categorised as a possible ‘Polyclinum
aurantium and Flustra foliacea on sand scoured tide-swept moderately wave-exposed
circalittoral rock’ (HCR.XFa.FluCoAs.Paur), probably due to the increased sedimentation
noted at this station.
Univariate analyses showed clear differences between the littoral and sublittoral stations in
terms of species richness with twice as many species recorded from the sublittoral area
(88.3±19.2SD as opposed to 44.7±11.6SD). Both littoral and sublittoral environments
indicated moderately high species diversity. Multivariate analyses revealed statistical
separation of biotopes with the vertical zonation of the fauna (by water depth or height on
the foreshore) constituting the dominant community patterns observed.
No species of particular nature conservation interest were noted during the any of the
surveys and no rare or particularly fragile biotopes were recorded. However natural siltation

Ireland’s Eye Reef Survey BSL 1502 Revision 1 (FINAL) 5 November 2015
levels were high in the sublittoral environment, a fact that has not appeared to have a
significant impact to the biological diversity in this area. Whilst, siltation levels are high in
the sublittoral environment, a significant increase in suspended sediment, particularly
during the summer months during peak algal growth, might cause some damage to the algal
biotopes present through reduced light penetration and availability. However, the
moderately strong tidal currents experienced in this area are sufficient to prevent the
deposition of significant silt material which might degrade the sublittoral benthic biotopes
through smothering and burial of the infralittoral and circalittoral communities. No species
of particular conservational interest were noted during the surveys and no rare or fragile
biotopes recorded.

Ireland’s Eye Reef Survey BSL 1502 Revision 1 (FINAL) 6 November 2015
2. Scope of Work
The proposed outfall route of the Greater Dublin Drainage (GDD) scheme, terminates at the
diffuser location 1km north-east of Ireland’s Eye, and falls within the Rockabill to Dalkey
Island SAC. The conservation objectives of the Rockabill to Dalkey Island SAC include Annex I
qualifying Reefs (Figure 2.1). To maintain the favourable conservation conditions of these
Reefs within the SAC, the following criteria are proposed by NPWS (as outlined in Table 2.1).
Table 2.1 Rockabill to Dalkey Island SAC Conservation Objectives Attribute Measure Target Notes
Habitat area Hectares The permanent area is stable
or increasing, subject to
natural processes. See Figure
2.1
Habitat area estimated as 182ha using
2010 and 2011 intertidal and subtidal
reef survey data (MERC, 2010, 2012a,
b), InfoMar bathymetry and the Arklow
to Skerries Islands Admiralty Chart
(1468_0)
Habitat
distribution
Occurrence Distribution is stable or
increasing, subject to natural
processes. See Figure 2.1
Distribution derived from 2010 and
2011 intertidal and subtidal reef survey
data (MERC, 2010, 2012a, b), InfoMar
bathymetry and the Arklow to Skerries
Islands Admiralty Chart (1468_0).
Community
structure
Biological
composition
Conserve the following
community types in a natural
condition: Intertidal reef
community complex; and
Subtidal reef community
complex. See Figure 2.1
Reef community mapping based on
2010 and 2011 intertidal and subtidal
reef survey data (MERC, 2010, 2012a,
b).
Figure 2.1 Ireland’s Eye Marine Community Types Designated by Rockabill to Dalkey Island SAC
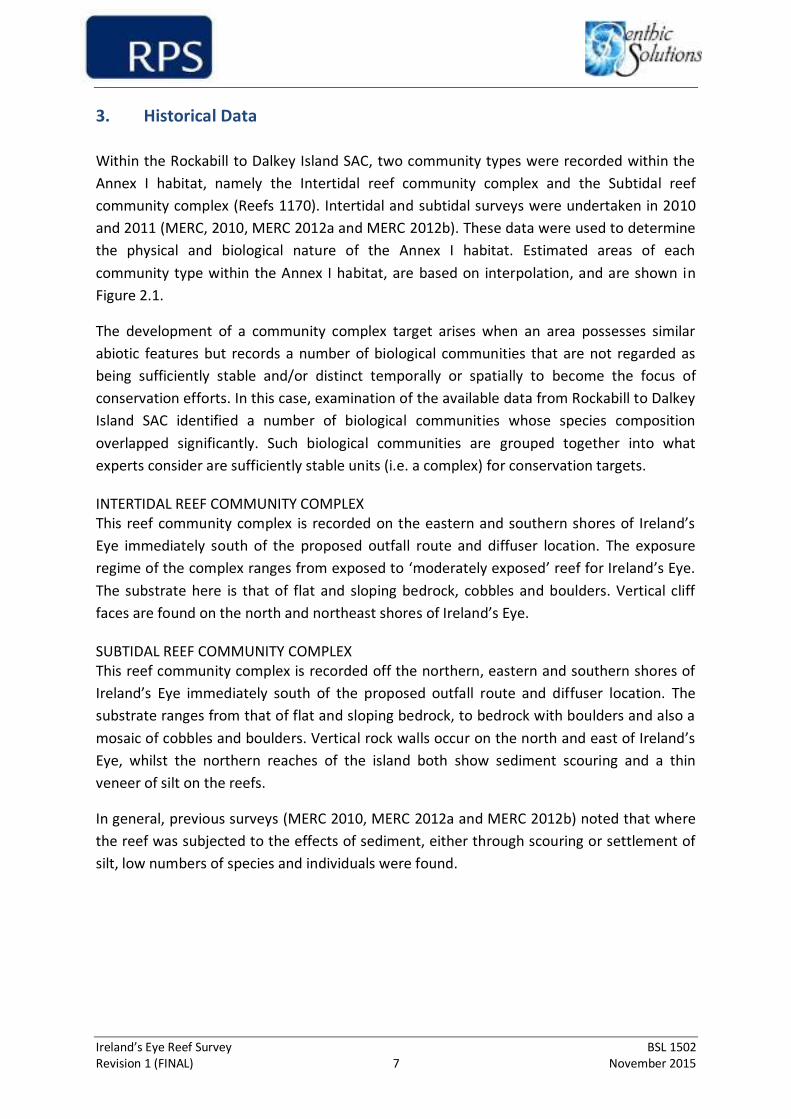
Ireland’s Eye Reef Survey BSL 1502 Revision 1 (FINAL) 7 November 2015
3. Historical Data
Within the Rockabill to Dalkey Island SAC, two community types were recorded within the
Annex I habitat, namely the Intertidal reef community complex and the Subtidal reef
community complex (Reefs 1170). Intertidal and subtidal surveys were undertaken in 2010
and 2011 (MERC, 2010, MERC 2012a and MERC 2012b). These data were used to determine
the physical and biological nature of the Annex I habitat. Estimated areas of each
community type within the Annex I habitat, are based on interpolation, and are shown in
Figure 2.1.
The development of a community complex target arises when an area possesses similar
abiotic features but records a number of biological communities that are not regarded as
being sufficiently stable and/or distinct temporally or spatially to become the focus of
conservation efforts. In this case, examination of the available data from Rockabill to Dalkey
Island SAC identified a number of biological communities whose species composition
overlapped significantly. Such biological communities are grouped together into what
experts consider are sufficiently stable units (i.e. a complex) for conservation targets.
INTERTIDAL REEF COMMUNITY COMPLEX This reef community complex is recorded on the eastern and southern shores of Ireland’s
Eye immediately south of the proposed outfall route and diffuser location. The exposure
regime of the complex ranges from exposed to ‘moderately exposed’ reef for Ireland’s Eye.
The substrate here is that of flat and sloping bedrock, cobbles and boulders. Vertical cliff
faces are found on the north and northeast shores of Ireland’s Eye.
SUBTIDAL REEF COMMUNITY COMPLEX This reef community complex is recorded off the northern, eastern and southern shores of
Ireland’s Eye immediately south of the proposed outfall route and diffuser location. The
substrate ranges from that of flat and sloping bedrock, to bedrock with boulders and also a
mosaic of cobbles and boulders. Vertical rock walls occur on the north and east of Ireland’s
Eye, whilst the northern reaches of the island both show sediment scouring and a thin
veneer of silt on the reefs.
In general, previous surveys (MERC 2010, MERC 2012a and MERC 2012b) noted that where
the reef was subjected to the effects of sediment, either through scouring or settlement of
silt, low numbers of species and individuals were found.

Ireland’s Eye Reef Survey BSL 1502 Revision 1 (FINAL) 8 November 2015
4. Site Selection
Following a review and combination of existing and surveyed bathymetric datasets, the
locations for sublittoral and littoral survey locations was based on a combination of seabed
topography, and site exposure. A total of four sublittoral locations and three littoral
locations were established for survey operations (outlined in Table 4.1, and presented in
Figure 4.1).
Table 4.1 Proposed Littoral and Sublittoral Locations Site Transect Easting Northing Description Depth (ODM)
S1 Start 728470.3 741625.0 Sublittoral: Northwest stack and discrete
sublittoral reef feature
-12.1
End 728369.1 741589.2 0.34
S2 Start 728745.5 741626.2 Sublittoral: Standard slope with boulder
field at base
-13.99
End 728752.9 741526.2 1.13
S3 Start 729161.4 740937.5 Sublittoral: Exposed southeast island
pinnacles
-11.81
End 729060.2 740969.6 0.26
S4 Start 729187.4 740556.2 Sublittoral: Exposed southeast islet
pinnacles
-10.50
End 729102.2 740624.0 0.01
L1 729033.1 741472.4 Littoral: Exposed northeast channel
between stack 0.04
L2 728910.9 741053.5 Littoral: Sheltered southeast inlet 0.80
L3 729077.5 740648.7 Littoral: Exposed southeast islet rocky coast 0.98 Geodesy based on Irish National Grid and vertical datum of Ordnance datum Malin Head (ODM)

Ireland’s Eye Reef Survey BSL 1502 Revision 1 (FINAL) 9 November 2015
Figure 4.1 Composite Topography/Bathymetry of Irelands Eye with Proposed Survey Locations for Sublittoral Transects
(lines) and Littoral Coastlines (Stars)

Ireland’s Eye Reef Survey BSL 1502 Revision 1 (FINAL) 10 November 2015
5. Field Operations Summary observations
Field survey operations were completed successfully at all proposed locations between the
30th June and 2nd of July 2015. A four man dive team, made up from representatives from
both MERC and ASML, was mobilised to site on the 29th June, with operations carried out
from an 8m RIB. Weather remained good throughout the survey period, with only localised
periods of marginal winds occurring on a couple of days. Consequently operations were
spread between the dive sites (four in total) and inter-tidal (three in total), to make the best
use of the prevailing conditions.
A summary of the field operations is outlined in Table 5.1.
Table 5.1 Chronological Sequence of Field Operations Day Date Operations Comment
1 29/06/15 Mobilisation to Howth ASML mobilised. MERC launched the 8m RIB service
vessel locally (Howth harbour).
2 30/06/15 Ops: Diving and intertidal 2 diving sites and 1 intertidal completed.
3 01/07/15 Ops: Diving and intertidal IW of BSL travels to site for oversight. 1 diving site
and 1 intertidal site completed.
4 02/07/15 Ops: Diving and intertidal
1 dive site completed in the morning and 1 intertidal
site completed in the afternoon. Vessel recovered
and survey personnel demobilised. IW onsite for
oversight.
5 03/07/15 Demobilisation from Howth ASML team demobilised back to the UK.
Field operations were based on a generic assessment of biotopes using the standard MNCR-
style (Marine Nature Conservation Review) format. Identification and abundance was scaled
onsite using the SACFOR (e.g. superabundant, abundant, common, frequent, occasional and
rare) scale on all the conspicuous flora and fauna within each biotope encountered. Taxa
that could not be readily identified were removed and later identified under a microscope
back at the field laboratory (i.e hotel).
During the intertidal survey, sites were selected from aerial photography to present
different exposures and the vertical profiles completed along all of the lower, middle and
upper shorelines at these locations. Each biological zone was photographed and surveyed.
The floral and faunal taxa were identified and abundance scale values allocated also using
the SACFOR protocol on all the conspicuous species in each biotope encountered.

Ireland’s Eye Reef Survey BSL 1502 Revision 1 (FINAL) 11 November 2015
6. Results and Discussion
This survey has collected semi-quantitative data from two moderately exposed littoral
stations (L1 and L3) and a sheltered station (L2). L1 is slightly modified by shading, wave
surge and nitrogenous enrichment and the L3 upper shore biotope was similarly enriched by
roosting seabirds. In the sublittoral, four stations (S1 to S4) were investigated of which all
were found to be heavily silted, but were moderately diverse. The photographs and data
presented herein may act as a comparison, against which future gross changes could be
qualitatively assessed.
In order to determine any significant differences between the stations surveyed, the
SACFOR scale was additionally categorised from 1 (rare) to 6 (superabundant). Basic
statistical analyses as well as multi-dimensional statistical techniques were applied to the
dataset to present the data as a cluster diagram and MDS plot. While useful to present
general trends within the datasets, due to the semi quantitative nature of the SACFOR
classifications, not too much reliance should be placed on the statistical analyses.
6.1. Biotope Classification
6.1.1. Littoral Station 1
Littoral Station 1 was located in the gully between the northeast stack and the main island,
and was characterised by a typically exposed shore, with the exposure to wave action
amplified by the effect of surge through the gully. There was also an effect of shading which
was apparent in a reduced algal component. The order of the biotopes ran from an algae
dominated LR.HLR.FR.Coff/IR.MIR.KR.Ldig (vi) through the lower middle shore
LR.HLR.FR.Mas (v) to a faunally dominated LR.HLR.MusB.Sem (iv) in the upper middle shore.
Then through the barnacles LR.HLR.MusB.Cht (iii), followed by a LR.HLR.MusB (ii) Porphyra
sp. band to a nitrate enriched LR.FLR.Lic.Pra (i) zone in the supralittoral where the copious
bird droppings from the nesting and roosting seabirds made their impact on the littoral
ecology.
Photographs from each littoral zone/biotope are shown in Figure 6.1, while a full species list
with the SACFOR classification is presented in Table 6.1.

Ireland’s Eye Reef Survey BSL 1502 Revision 1 (FINAL) 12 November 2015
vi: LR.HLR.FR.Coff/IR.MIR.KR.Ldig v: LR.HLR.FR.Mas
iv: LR.HLR.MusB.Sem iii: LR.HLR.MusB.Cht
ii: LR.HLR.MusB i: LR.FLR.Lic.Pra Figure 6.1 Littoral Zones and Biotopes for Station L1

Ireland’s Eye Reef Survey BSL 1502 Revision 1 (FINAL) 13 November 2015
Table 6.1 Species List for Station L1 with SACFOR Abundance Classifications for Each Biotope
MCS Code
Taxa L1
vi v iv iii ii i
Porifera
C05230 Hymeniacidon perlevis R Cnidaria
D11510 Actinia equina
O Annelida
P23040 Spirobranchus triqueter F P02770 Eulalia viridis F Arthropda
R00720 Chthamalus montagui
F R R01080 Semibalanus balanoides A C
S R
S26900 Carcinus maenas R Mollusca
W00500 Polyplacophora O W01340 Patella vulgata C A F C
W02390 Lacuna pallidula
O W02500 Littorina littorea
C
W02520 Melarhaphe neritoides
R R W02630 Littorina saxatilis
R R
W08170 Nucella lapillus
R W16500 Mytilus edulis O R R Bryozoa
Y06780 Electra pilosa O Rhodophyta
ZM00900 Porphyra umbilicalis
A R
ZM02420 Palmaria palmata R O R ZM03790 Hildenbrandia rubra O
ZM03840 Corallinaceae (enc) A ZM04010 Corallina caespitosa
R
ZM06050 Mastocarpus
R ZM06050 Mastocarpus stellatus C S A R
ZM07510 Lomentaria articulata R R ZM08240 Ceramium shuttleworthianum
R R R R
ZM09900 Membranoptera alata R ZM10800 Osmundea pinnatifida
R
ZM11170 Polysiphonia fucoides
R Ochrophyta
ZR06320 Laminaria digitata S Chlorophyta
ZS02400 Ulva sp. (flat) R R
R ZS02890 Prasiola stipitata
A
ZS03560 Cladophora rupestris
F
R Ascomycota
Verrucaria maura
C F
6.1.2. Littoral Station 2
The shore at Littoral Station 2 was a more sheltered inlet on the east coast of the island. The
protection from wave action afforded by the sheltering intertidal reef has allowed a series
of algal dominated biotopes to develop. Initially the LR.HLR.FR.Coff/IR.MIR.KR.Ldig (v)

Ireland’s Eye Reef Survey BSL 1502 Revision 1 (FINAL) 14 November 2015
emerged from the sublittoral and passes through a typical Fucus serratus and red seaweeds
LR.MLR.BF.Fser.R (iv) zone, to an Ascophyllum nodosum and Fucus vesiculosus
LR.LLR.F.Asc.FS (iii) biotope. Above this the spiral wrack and channel wrack mixed together
and form an LR.MLR.BF.FspiB (ii) biotope with limpets, barnacles and littorinids found
amongst the algae. This shore finished with a typical lichen zone dominated by the
nitrophilous yellow lichen Xanthoria parietina and the green algae Pasiola stipitata
LR.FLR.Lic.Pra (i) previously seen at station L1.
Photographs from each littoral zone/biotope are shown in Figure 6.2, while a full species list
with SACFOR classification is presented in Table 6.2.
v: LR.HLR.FR.Coff/IR.MIR.KR.Ldig, iv: LR.MLR.BF.Fser.R and iii: LR.LLR.F.Asc.FS
v
iv
iii

Ireland’s Eye Reef Survey BSL 1502 Revision 1 (FINAL) 15 November 2015
ii: LR.MLR.BF.FspiB
i: LR.FLR.Lic.Pra
Figure 6.2 Littoral Zones and Biotopes for Station L2
i
ii

Ireland’s Eye Reef Survey BSL 1502 Revision 1 (FINAL) 16 November 2015
Table 6.2 Species List for Station L2 with SACFOR Abundance Classifications for Each Biotope
MCS Code
Taxa L2
i ii iii iv v
Annelida
P23040 Spirobranchus triqueter
R
Arthropoda
R01080 Semibalanus balanoides R
O O R01200 Austrominius modestus
R
S01660 Amphipoda
R R Anurida maritima
R R
Mollusca
W01340 Patella vulgata
R O O W02500 Littorina littorea
R
W02630 Littorina saxatilis
R W08170 Nucella lapillus
R
Bryozoa
Y01390 Alcyonidium hirsutum
R Y06780 Electra pilosa
R
Rhodophyta
ZM00900 Porphyra umbilicalis
R ZM01160 Rhodothamniella floridula
R
ZM02160 Gelidium spinosum
R ZM02420 Palmaria palmata
R O F
ZM03840 Corallinaceae (enc)
O ZM06050 Mastocarpus stellatus
O C
ZM07510 Lomentaria articulata
O ZM08240 Ceramium shuttleworthianum
R R
ZM08830 Plumaria plumosa
R ZM09850 Hypoglossum hypoglossoides
R
ZM09900 Membranoptera alata
R ZM10780 Osmundea hybrida
R
ZM11150 Vertebrata lanosa
F Ochrophyta
ZR02490 Elachista fucicola
O ZR06320 Laminaria digitata
S
ZR06640 Ascophyllum nodosum
S R ZR06740 Fucus serratus
R S
ZR06750 Fucus spiralis
C ZR06760 Fucus vesiculosus
F R
ZR06810 Pelvetia canaliculata
C Chorophyta
ZS02400 Ulva sp. (tubular)
O ZS02400 Ulva sp. (flat)
R
R
ZS02890 Prasiola stipitata C ZS03400 Cladophora albida
R
ZS03560 Cladophora rupestris
R Ascomycota
Verrucaria maura F O
R Caloplaca thallincola A
Caloplaca marina O Tephromela atra var. atra R Xanthoria parietina R Tracheophyta
Armeria maritima R

Ireland’s Eye Reef Survey BSL 1502 Revision 1 (FINAL) 17 November 2015
6.1.3. Littoral Station 3
Littoral Station 3 was located at the southeast tip of the island partially separated from the
main island by a connecting intertidal reef. Here the type and order of the biotopes up to
the shore from the low tide level were somewhat similar to those of station L1, with the
addition of several other common algae species, probably present due to the improved light
regime on the open coast. The order of the biotopes again ran up from an algae dominated
LR.HLR.FR.Coff/IR.MIR.KR.Ldig (vi), Laminaria digitata forest (with occasional L. hyperborea)
with frequent patches of red algae dominated by coralline crusts. The lower middleshore
was dominated by Fucus serratus, Osmundea pinnatifida and Mastocarpus stellatus
LR.HLR.FR.Mas (v) and this continued into to a faunally dominated middle shore of
LR.HLR.MusB.Sem (iv), limpets, and Semibalanus balanoides barnacles, with a patchy canopy
of the bladderless ‘Bladder wrack’ Fucus evesiculosus. Above this mixed algae and barnacle
biotope, a barnacle dominated zone of LR.HLR.MusB.Cht (iii) was found, with all three
common native littoral barnacle species present (the two Chthamalus and one Semibalanus
species). Above this biotope, as with station L1, there was a LR.HLR.MusB (ii) Porphyra sp.
and Verrucaria maura band with sparse barnacles and littorinids sheltered in the crevices.
Finally, at the top of the shore, there was another nitrate enriched LR.FLR.Lic.Pra (i) Prasiola
stipitata zone found in the supralittoral.
Photographs from each littoral zone/biotope are shown in Figure 6.3, while a full species list
with SACFOR classification is presented in Table 6.3.
vi: LR.HLR.FR.Coff/ IR.MIR.KR.Ldig v: LR.HLR.FR.Mas

Ireland’s Eye Reef Survey BSL 1502 Revision 1 (FINAL) 18 November 2015
iv: LR.HLR.MusB.Sem iii: LR.HLR.MusB.Cht
ii: LR.HLR.MusB i: LR.FLR.Lic.Pra Figure 6.3 Littoral Zones and Biotopes for Station L3
Table 6.3 Species List for Station L3 with SACFOR Abundance Classifications for each Biotope
MCS Code
Taxa L3
i ii iii iv v vi
Porifera
C04840 Halichondria panicea R
C05230 Hymeniacidon perlevis R
Cnidaria
D06480 Dynamena pumila R
Annelida
P23020 Spirobranchus sp. R
Arthropoda
R00720 Chthamalus montagui R O
R00730 Chthamalus stellatus R
R01080 Semibalanus balanoides S S A A
R01100 Balanus crenatus O
R01200 Austrominius modestus F R
R01940 Copepoda (in small pools) P*
S26460 Cancer pagurus O
S26900 Carcinus maenas O
Mollusca
W00740 Lepidochitona cinerea R
W01320 Patella depressa F

Ireland’s Eye Reef Survey BSL 1502 Revision 1 (FINAL) 19 November 2015
MCS Code
Taxa L3
i ii iii iv v vi
W01340 Patella vulgata C C C F
W02520 Melarhaphe neritoides R C
W02562 Littorina obtusata/ mariae O
W02630 Littorina saxatilus R R C
W07360 Trivia sp. R
W08170 Nucella lapillus F
W16500 Mytilus edulis R R
Bryozoa
Y06640 Membranipora O
Y06780 Electra pilosa F
Y08720 Bugulina flabellata R
Chordata
ZD00060 Clavelina lepadiformis R
Rhodophyta
ZM00020 Rhodophyceae R
ZM00870 Porphyra linearis F
ZM00900 Porphyra umbilicalis R A
ZM02420 Palmaria palmata O R F
ZM02660 Dumontia contorta R R
ZM03790 Hildenbrandia rubra O R O
ZM03840 Corallinaceae (enc) R O C
ZM04010 Corallina caespitosa R
ZM04040 Corallina officinalis R
ZM06050 Mastocarpus R
ZM06050 Mastocarpus stellatus R R O C O
ZM07510 Lomentaria articulata R R
ZM08239 Ceramium secundatum R
ZM08240 Ceramium shuttleworthianum R R
ZM09850 Hypoglossum hypoglossoides R
ZM09900 Membranoptera alata O
ZM10120 Phycodrys rubens R
ZM10800 Osmundea pinnatifida O C
Ochrophyta
ZR02810 Leathesia marina R
ZR06320 Laminaria digitata A
ZR06330 Laminaria hyperborea F
ZR06740 Fucus serratus A
ZR06760 Fucus vesiculosus O
ZR06760 Fucus evesiculosus R A
Chlorophyta
ZS02400 Ulva sp. (tubular) C
ZS02400 Ulva sp. (flat) O F O R
ZS02890 Prasiola stipitata A
ZS03400 Cladophora albida R
ZS03560 Cladophora rupestris R O O
Ascomycota
Verrucaria mucosa O
Verrucaria maura F A O
Lichina pygmaea R

Ireland’s Eye Reef Survey BSL 1502 Revision 1 (FINAL) 20 November 2015
6.1.4. Sublittoral Station 1
This station was situated off the north-west corner of the island and here the reef ran on to
the muddy gravel at approximately 10.5m ODM. The rock surface in this vicinity was found
to be considerably silted. Just above the sediment interface this biotope was found to be
dominated by the feather-star Antedon bifida, the plumose anemone Metridium dianthus,
the common starfish and the barnacle Balanus crenatus. Other anemones such as Sagartia
elegans and Urticina felina, the soft coral Alcyonium digitatum were also frequently
encountered along with several sponge species (Haliclona simulans, Suberites ficus,
Halichondria panicea and Amphilectus fucorum). The hydroids (Obelia dichotoma) and
bryozoans (Flustra foliacea and Scrupocellaria spp.) were also common and the overall
biotope make-up was similar to the CR.HCR.XFa.ByErSp.Sag biotope – a ‘Mixed turf of
bryozoans and erect sponges with Sagartia elegans on tide-swept circalittoral rock’.
Above this community, the next biotope (ii) lay between 6-6.5m ODM and here the foliose
algae began to colonise the rock surface. This biotope was also heavily silted. This biotope
was characterised by the foliose brown algae Dictyota dichotoma and the foliose red algae
Delesseria sanguinea with numerous other small foliose species encountered as well, along
with the occasional large sugar kelp plant, Saccharina latissima. The faunal component of
this biotope was characterised by the anemones Urticina felina and Sagartia elegans, with
the brittle-star Ophiothrix fragilis, the hydroids Obelia spp., mussels, Balanus crenatus and
Pomatoceros spp. all of which were found within the silty sward. The biotope was situated
close to a IR.HIR.KFaR.FoR.Dic or Foliose red seaweeds with dense Dictyota dichotoma
and/or Dictyopteris membranacea on exposed lower infralittoral rock.
The final biotope encountered at S1 above the foliose algal zone, was a zone of stunted
Laminaria digitata kelp plants, with several other foliose red algae, such as Palmaria
palmata and Delesseria sanguinea. Beneath these algae, crusts of mussels and barnacles
were found, often being predated by the common starfish Asterias rubens. A probable
biotope for this assemblage is IR.MIR.KR.Ldig.Ldig.
Photographs from each littoral zone/biotope are shown in Figure 6.4, while a full species list
with SACFOR classification is presented in Table 6.4.

Ireland’s Eye Reef Survey BSL 1502 Revision 1 (FINAL) 21 November 2015
iii: CR.HCR.XFa.ByErSp.Sag iii: CR.HCR.XFa.ByErSp.Sag
iii: CR.HCR.XFa.ByErSp.Sag ii: IR.HIR.KFaR.FoR.Dic
ii: IR.HIR.KFaR.FoR.Dic i: IR.MIR.KR.Ldig.Ldig Figure 6.4 Sublittoral Zones and Biotopes for Station S1

Ireland’s Eye Reef Survey BSL 1502 Revision 1 (FINAL) 22 November 2015
Table 6.4 Species List for Station S1 with SACFOR Abundance Classifications for Each Biotope
MCS Code
Taxa S1
i ii iii
Porifera
C00350 Sycon ciliatum F R
C02210 Suberites ficus R
C04840 Halichondria panicea R O O
C05960 Amphilectus fucorum O O
C08630 Haliclona simulans F O
Red sponge crust R
Cnidaria
D01440 Tubularia indivisa O
D06760 Sertularia argentea O
D07300 Obelia dichotoma O O
D07310 Obelia geniculata F O R
D10240 Alcyonium digitatum C C
D11580 Anemonia viridis F
D11680 Urticina felina O C A
D12250 Metridium dianthus C C
D12310 Sagartia elegans O C C
D13700 Caryophyllia smithii R
Annelida
P23040 Spirobranchus triqueter F O
Arthropda
R01100 Balanus crenatus C S
S25020 Pisidia longicornis R R
S26460 Cancer pagurus F
S26720 Necora puber F A C
Mollusca
W12740 Doto coronata O O
W14030 Doris pseudoargus R
W16500 Mytilus edulis S R
Bryozoa
Y06640 Membranipora membranaceae F
Y06780 Electra pilosa F
Y06940 Flustra foliacea O
Y08360 Scrupocellaria sp. F
Y08720 Bugulina flabellata R
Echinodermata
ZB00110 Antedon bifida C S
ZB01900 Asterias rubens C A C
ZB02350 Ophiothrix fragilis O
ZB02680 Ophiactis balli R
ZB03000 Amphipholis squamata R
Chordata
ZD00060 Clavelina lepadiformis O R C
ZD00460 Morchellium argus O R R
ZD00640 Aplidium punctum O R R
ZD02090 Botryllus schlosseri R
ZG01500 Gadidae P R
ZG04380 Taurulus bubalis R R
ZG07050 Gobiidae R

Ireland’s Eye Reef Survey BSL 1502 Revision 1 (FINAL) 23 November 2015
MCS Code
Taxa S1
i ii iii
Rhodophyta
ZM02080 Bonnemaisonia asparagoides O O
ZM03230 Callophyllis laciniata O
ZM04040 Corallina officinalis R
ZM06310 Plocamium cartilagineum O O
ZM06820 Calliblepharis ciliata R R
ZM06880 Cystoclonium purpureum O F
ZM06930 Rhodophyllis divaricata O F
ZM08070 Ceramium sp. O O
ZM08460 Halurus flosculosus R
ZM09500 Cryptopleura ramosa F R
ZM09550 Delesseria sanguinea F F
ZM09850 Hypoglossum hypoglossoides O O
ZM09900 Membranoptera alata R
Brogniartella byssoides O
ZM10120 Phycodrys rubens R F
ZM10180 Erythroglossum laciniatum R
ZM11050 Polysiphonia elongata R
Ochrophyta
ZR04570 Dictyota dichotoma R C
ZR04780 Taonia atomaria R
ZR04970 Desmarestia aculeata O O
ZR04990 Desmarestia ligulata R
ZR05000 Desmarestia viridis R
ZR06320 Laminaria digitata S
ZR06360 Saccharina latissima O R
Chlorophyta
ZS02400 Ulva sp. (flat) R
ZS03920 Bryopsis plumosa R
6.1.5. Sublittoral Station 2
This station was situated in the middle of the north coast of the island and again, there was
evidence of a heavy silt burden. Here, the deeper sediment plains gave way to a steeply
inclined reef at a depth of circa 15.5m ODM. The reef is initially broken, with deposits of
muddy gravel lying between boulders and outcrops of sloping bedrock. The biotope on
these outcrops was dominated by the bryozoans Flustra foliacea, Scupocellaria sp. and
Bugulina flabellata. Other sub-dominant taxa of note were the hydroid Nemertesia
antennina and the soft coral Alcyonium digitatum, frequent erect sponges Hymeniacidon
perlevis, Amphilectus fucorum and Haliclona simulans, the hydroids Nemertesia antennina
and Obelia dichotoma as well as the tunicate Clavelina lepadiformis. A possible biotope tag
for this assemblage was CR.HCR.XFa.FluCoAs, or Flustra foliacea and colonial ascidians on
tide-swept moderately wave-exposed circalittoral rock.
Above this biotope, at 8.5m ODM, the Dictyota and foliose red algae biotope was again
found, as recorded at station L1. However, several new algal species were noted such as

Ireland’s Eye Reef Survey BSL 1502 Revision 1 (FINAL) 24 November 2015
Rhodymenia holmesii, Sphondylothamnion multifidum and Apoglossum ruscifolium amongst
the sward. Several new species of fish were also noted in this biotope, such as the ling
(Molva molva), the black goby (Gobius niger) as well as the Greater pipefish (Syngnathus
acus). Hence, the biotope was found to be close to IR.HIR.KFaR.FoR.Dic or Foliose red
seaweeds with dense Dictyota dichotoma and/or Dictyopteris membranacea on exposed
lower infralittoral rock.
As with station L1, above the foliose algal zone, there was again a zone of stunted Laminaria
digitata kelp plants, with numerous foliose red algae, mussels and starfish. The biotope
being IR.MIR.KR.Ldig.Ldig or Laminaria digitata on moderately exposed sublittoral fringe
rock.
Photographs from each littoral zone/biotope are shown in Figure 6.5, while a full species list
with SACFOR classification is presented in Table 6.5.
iii: CR.HCR.XFa.FluCoAs iii: CR.HCR.XFa.FluCoAs
iii: CR.HCR.XFa.FluCoAs iii: CR.HCR.XFa.FluCoAs

Ireland’s Eye Reef Survey BSL 1502 Revision 1 (FINAL) 25 November 2015
ii: IR.HIR.KFaR.FoR.Dic ii: IR.HIR.KFaR.FoR.Dic
i: IR.MIR.KR.Ldig.Ldig i: IR.MIR.KR.Ldig.Ldig Figure 6.5 Sublittoral Zones and Biotopes for Station S2
Table 6.5 Species List for Station S2 with SACFOR Abundance Classifications for each Biotope
MCS Code
Taxa S2
i ii iii
Porifera
C00350 Sycon ciliatum F F
C02210 Suberites ficus R R
C04810 Halichondria bowerbanki O
C04840 Halichondria panicea F
C05230 Hymeniacidon perlevis O F F
C05960 Amphilectus fucorum O F F
C06420 Myxilla sp. R R
C06840 Iophon hyndmani O
C08630 Haliclona simulans F F
Cnidaria
D01440 Tubularia indivisa R
D05260 Halecium halecinum O O
D05500 Aglaophenia sp. R R
D05780 Halopteris catharina F
D05970 Nemertesia antennina F F
D05990 Nemertesia ramosa O R
D06690 Sertularella polyzonias O
D06760 Sertularia argentea R
D07300 Obelia dichotoma O F F
D07310 Obelia geniculata F
D07320 Obelia longissima O

Ireland’s Eye Reef Survey BSL 1502 Revision 1 (FINAL) 26 November 2015
MCS Code
Taxa S2
i ii iii
D10240 Alcyonium digitatum F C F
D11680 Urticina felina R
D12310 Sagartia elegans R R
Annelida
P23020 Spirobranchus sp. F
P23040 Spirobranchus triqueter F R
Arthropoda
R01090 Balanus balanus R O
R01100 Balanus crenatus C F O
S01660 Amphipoda C C F
S10700 Caprellidae C C
S22100 Palaemon serratus O F F
S23220 Pandalus montagui F
S23600 Homarus gammarus R
S24650 Pagurus bernhardus R
S25850 Macropodia rostrata O O
S26460 Cancer pagurus R O O
S26720 Necora puber O O O
S26900 Carcinus maenas O
Mollusca
W12720 Doto sp. R R
Diapharodoris luteocincta R
W16500 Mytilus edulis C
Bryozoa
Y00030 Crisiidae F O O
Y01370 Alcyonidium diaphanum F F
Y06640 Membranipora sp. C
Y06780 Electra pilosa A F
Y06940 Flustra foliacea F C
Y07050 Chartella papyracea R O
Y07100 Securiflustra securifrons R
Y08360 Scrupocellaria sp. F C
Y08410 Scrupocellaria scruposa A
Y08530 Bicellariella ciliata O
Y08720 Bugulina flabellata R O C
Y08750 Bugulina plumosa R
Echinodermata
ZB00110 Antedon bifida R O O
ZB01900 Asterias rubens C C C
ZB02350 Ophiothrix fragilis C O
ZB03620 Echinus esculentus R R O
ZB04950 Thyone fusus O
Chordata
ZD00060 Clavelina lepadiformis R F F
ZD00640 Aplidium punctum R O O
ZD01880 Polycarpa scuba O
ZD01940 Dendrodoa grossularia R R
ZD02090 Botryllus schlosseri R R
ZG01500 Gadidae R R
ZG01960 Molva molva R

Ireland’s Eye Reef Survey BSL 1502 Revision 1 (FINAL) 27 November 2015
MCS Code
Taxa S2
i ii iii
ZG03760 Syngnathus acus R
ZG04340 Myoxocephalus scorpius R
ZG06050 Ctenolabrus rupestris R
ZG07000 Callionymus lyra R O
ZG07050 Gobiidae R
ZG07230 Gobius niger R R
ZG07440 Pomatoschistus pictus R
Rhodophyta
ZM02080 Bonnemaisonia asparagoides O R
ZM02420 Palmaria palmata O
ZM02560 Dilsea carnosa O R
ZM03230 Callophyllis laciniata O R
ZM03840 Corallinaceae (enc) F O
ZM05840 Phyllophora crispa F O
ZM05860 Phyllophora pseudoceranoides C
ZM06110 Chondrus crispus C
ZM06310 Plocamium cartilagineum F O
ZM06820 Calliblepharis ciliata F A
ZM06880 Cystoclonium purpureum O
ZM06930 Rhodophyllis divaricata F
ZM07230 Rhodymenia holmesii C
ZM07530 Lomentaria orcadensis R R
ZM07860 Aglaothamnion tenuissimum R
ZM08239 Ceramium secundatum R
ZM08460 Halurus flosculosus R
ZM09230 Sphondylothamnion multifidum R
ZM09400 Apoglossum ruscifolium R
ZM09500 Cryptopleura ramosa F C
ZM09550 Delesseria sanguinea F F
ZM09850 Hypoglossum hypoglossoides C
ZM09900 Membranoptera alata O
ZM10120 Phycodrys rubens F F
ZM10180 Erythroglossum laciniatum F
ZM10390 Heterosiphonia plumosa R R
Brogniartella byssoides O O
ZM11050 Polysiphonia elongata R
ZM11170 Polysiphonia fucoides R
ZM11370 Pterosiphonia parasitica R
Ochrophyta
ZR04570 Dictyota dichotoma F C
ZR04780 Taonia atomaria R
ZR04970 Desmarestia aculeata O
ZR04990 Desmarestia ligulata F
ZR06310 Laminaria sporelings R
ZR06320 Laminaria digitata S
ZR06330 Laminaria hyperborea A
ZR06360 Saccharina latissima C

Ireland’s Eye Reef Survey BSL 1502 Revision 1 (FINAL) 28 November 2015
6.1.6. Sublittoral Station 3
This station was located off the east coast of the island, slightly south of station L2. It was
exposed to the easterly winds and therefore moderately exposed to wave action. The reef
appeared out of the sediment at approximately 13.5m ODM and slopes gently up towards
the island. Again, the reef was heavily silted and the initial biotope was dominated by erect
sponges and hydroids, with species of note being Haliclona simulans, Halichondria panicea
and Nemertesia antennina. Also dominant were the hydrozoan Halecium halecinum,
Alcyonium digitatum, the anemones Sagartia elegans and Urticina felina, whilst the
decapods, Palaemon serratus, Cancer pagurus, Macropodia rostrata and Necora puber were
frequent constituent in this zone. The overall biotope make-up of this biotope was similar to
the CR.HCR.XFa.ByErSp.Sag biotope – a ‘Mixed turf of bryozoans and erect sponges with
Sagartia elegans on tide-swept circalittoral rock’.
Above this biotope at 8.5m ODM was the Dictyota dichotoma and foliose red algal
assemblage previously found at S1 and S2. Here the silt still formed a thick covering and the
Dictyota was possibly less abundant and hence several more delicate red algae were more
prominent, such as Rhodymenia ardissonei, Phycodrys rubens and Apoglossum ruscifolium.
As a result the community was possibly more similar to the IR.HIR.KFaR.FoR biotope or
Foliose red seaweeds on exposed lower infralittoral rock.
Finally at station S3 from 6.5m ODM upwards was a kelp zone with a dense understory of
foliose red algae and barnacles. Dominant red algae included Ploccamium cartilagineum,
Delesseria sanguinea and Cryptopleura ramosa, whilst the foliose brown algae were
dominated by Desmarestia spp. and Ectocarpaceae indet. Although the dominant kelp was
Laminaria digitata, L. hyperborea was present in the kelp forest. Hence the biotope was
consistent with S1 and S2, being IR.MIR.KR.Ldig.Ldig or Laminaria digitata on moderately
exposed sublittoral fringe rock.
Photographs from each littoral zone/biotope are shown in Figure 6.6, while a full species list
with SACFOR classification is presented in Table 6.6.

Ireland’s Eye Reef Survey BSL 1502 Revision 1 (FINAL) 29 November 2015
iii: CR.HCR.XFa.ByErSp.Sag iii: CR.HCR.XFa.ByErSp.Sag
ii: IR.HIR.KFaR.FoR ii: IR.HIR.KFaR.FoR
i: IR.MIR.KR.Ldig.Ldig
Figure 6.6 Sublittoral Zones and Biotopes for Station S3

Ireland’s Eye Reef Survey BSL 1502 Revision 1 (FINAL) 30 November 2015
Table 6.6 Species List for Station S3 with SACFOR Abundance Classifications for Each Biotope
MCS Code
Taxa S3
i ii iii
Porifera
C00350 Sycon ciliatum R
C02210 Suberites ficus R R
C04810 Halichondria bowerbanki R
C04840 Halichondria panicea O R O
C05230 Hymeniacidon perlevis O
C05960 Amphilectus fucorum R R
C06450 Myxilla incrustans R
C06780 Iophon nigricans R R
C08630 Haliclona simulans R A
Cnidaria
D01440 Tubularia indivisa R R
D05260 Halecium halecinum R O
D05970 Nemertesia antennina R R C
D05990 Nemertesia ramosa R R
D06760 Sertularia argentea R
D07300 Obelia dichotoma R
D07310 Obelia geniculata F O
D07430 Rhizocaullus verticillatus R R
D10240 Alcyonium digitatum F C
D11580 Anemonia viridis O
D11680 Urticina felina R F
D12310 Sagartia elegans O F C
Nemertea
G00780 Lineus longissimus R
Annelida
P23040 Spirobranchus triqueter O F O
Arthropoda
R01090 Balanus balanus R R R
R01100 Balanus crenatus C C R
S01660 Amphipoda O
S22100 Palaemon serratus O C C
S23220 Pandalus montagui R
S23600 Homarus gammarus R R
S25020 Pisidia longicornis O
S25850 Macropodia rostrata O C A
S26460 Cancer pagurus C F R
S26720 Necora puber A C A
S26900 Carcinus maenas C
Mollusca
W16500 Mytilus edulis R O
Bryozoa
Y00001 Bryozoa O O
Y01370 Alcyonidium diaphanum C C
Y06640 Membranipora sp. O
Y06780 Electra pilosa O
Y06940 Flustra foliacea O R
Y07050 Chartella papyracea O

Ireland’s Eye Reef Survey BSL 1502 Revision 1 (FINAL) 31 November 2015
MCS Code
Taxa S3
i ii iii
Y08790 Bugulina turbinata O
Echinodermata
ZB00110 Antedon bifida R O C
ZB01900 Asterias rubens C C C
ZB02350 Ophiothrix fragilis R
Chordata
ZD00060 Clavelina lepadiformis F F
ZD00460 Morchellium argus R
ZD00640 Aplidium punctum R R O
ZD01940 Dendrodoa grossularia R F C
ZG02080 Pollachius pollachius R R R
ZG04380 Taurulus bubalis R R R
ZG07050 Gobiidae R O R
ZG07400 Pomatoschistus R R
Rhodophyta
ZM02420 Palmaria palmata O
ZM03840 Corallinaceae (enc) F O
ZM04040 Corallina officinalis R
ZM06310 Plocamium cartilagineum C
ZM06820 Calliblepharis ciliata R
ZM06880 Cystoclonium purpureum R
ZM07230 Rhodymenia holmesii R
ZM07260 Rhodymenia ardissonei R
ZM07510 Lomentaria articulata R
ZM08239 Ceramium secundatum R
ZM09400 Apoglossum ruscifolium R
ZM09500 Cryptopleura ramosa A R
ZM09550 Delesseria sanguinea A R
ZM09850 Hypoglossum hypoglossoides R R
ZM09900 Membranoptera alata R
ZM10120 Phycodrys rubens R
ZM10180 Erythroglossum laciniatum F
ZM11050 Polysiphonia elongata R R
Ochrophyta
Chrysophyceae A
ZR00030 Ectocarpaceae indet. C
ZR04570 Dictyota dichotoma O F
ZR04970 Desmarestia aculeata R
ZR04990 Desmarestia ligulata O
ZR06320 Laminaria digitata A
ZR06330 Laminaria hyperborea R
6.1.7. Sublittoral Station 4
This station was located off the south east corner of the island, adjacent to station L3. The
reef emerged out of the sediment at approximately 14.9m ODM and rose at a shallow angle
towards the shore. Initially the reef sloped shore-wards relatively smoothly and latterly in a
series of steep ridges and gullies. Again the silt covering was significant but where rock

Ireland’s Eye Reef Survey BSL 1502 Revision 1 (FINAL) 32 November 2015
surfaces were less impacted by siltation, the community was again relatively rich,
comprising of encrusting assemblages of hydroids and bryozoans with frequent erect
sponges and anemones. The deepest reef biotope (iii) were dominated by the anemones
Urticina felina and Metridium dianthus and the bryozoans Flustra foliacea, Bugulina
flabellata and Scrupocellaria spp., whilst the sponges Halichondria bowerbanki, Amphilectus
fucorum and Haliclona simulans were also present. Several ascidian species also occurred in
the biotope, Polycarpa scuba and Dendrodoa grossularia being the most common along
with Polyclinum aurantium and Aplidium punctum which were also present. The biotope
therefore could be HCR.XFa.FluCoAs.Paur – ‘Polyclinum aurantium and Flustra foliacea on
sand scoured tide-swept moderately wave-exposed circalittoral rock’. This difference from
the other stations was probably brought about by the increased sedimentation regime
noted at this station.
Above this biotope, at 9m ODM, was the Dictyota dichotoma and foliose red algal
assemblage previously found at S1 and S2. Here again the silt still formed a thick covering
but the Dictyota was accompanied by numerous small foliose red algal species, such as
Hypoglossum hypoglossoides, Erythroglossum laciniatum and Rhodomenia holmesii. On the
vertical faces, Schottera nicaensis was noted and the delicate brown algae Taonia atomaria
was also recorded. Beneath the silt, a crust of the solitary ascidian Dendrodoa grossularia
and the barnacle Balanus crenatus was found along with the frequent clumps of sponges,
hydroids and bryozoans. The less common sponge Hemimycale columella was evident for
the first time in this biotope, as shown in the photo below. However, the biotope was still
found to be close to IR.HIR.KFaR.FoR.Dic or Foliose red seaweeds with dense Dictyota
dichotoma and/or Dictyopteris membranacea on exposed lower infralittoral rock.
Above the foliose algal zone, the Laminaria digitata forest was again present, with
understorey dominants of Phyllophora crispa and Chondrus crispus, amongst a crust of
mussels and the barnacle Balanus crenatus. The bryozoans Electra pilosa and
Membranipora membranaceae were frequently recorded on the algal thalli and Asterias
rubens was also present, feeding on the mussels. Occasional sugar kelp plants of Saccarhina
lattissima were also noted within the kelp forest, however the biotope would still be
recorded as IR.MIR.KR.Ldig.Ldig or Laminaria digitata on moderately exposed sublittoral
fringe rock.
Photographs from each littoral zone/biotope are shown in Figure 6.7, while a full species list
with SACFOR classification is presented in Table 6.7.

Ireland’s Eye Reef Survey BSL 1502 Revision 1 (FINAL) 33 November 2015
iii: HCR.XFa.FluCoAs.Paur iii: HCR.XFa.FluCoAs.Paur
ii: IR.HIR.KFaR.FoR.Dic ii: IR.HIR.KFaR.FoR.Dic Figure 6.7 Sublittoral Zones and Biotopes for Station S4
Table 6.7 Species List for Station S4 with SACFOR Abundance Classifications for Each Biotope
MCS Code
Taxa S4
i ii iii
Porifera
C00350 Sycon ciliatum O O C02210 Suberites ficus
R R
C04810 Halichondria bowerbanki
O O
C04840 Halichondria panicea F O C05230 Hymeniacidon perlevis F
C05960 Amphilectus fucorum
O O
C06450 Myxilla incrustans R C06780 Iophon nigricans
O O
C07750 Hemimycale columella
R C08630 Haliclona simulans
F F
C08900 Dysidea fragilis
R
Red sponge crust
O Cnidaria
D05260 Halecium halecinum
O
D05780 Halopteris catharina
O O
D05970 Nemertesia antennina
O F
D05990 Nemertesia ramosa
O O
D06690 Sertularella polyzonias
O
D06760 Sertularia argentea
R
D07300 Obelia dichotoma O F F
D07310 Obelia geniculata O

Ireland’s Eye Reef Survey BSL 1502 Revision 1 (FINAL) 34 November 2015
MCS Code
Taxa S4
i ii iii
D07430 Rhizocaullus verticillatus
O
D10240 Alcyonium digitatum O C F
D11680 Urticina felina R F C
D12250 Metridium dianthus
O C
D12310 Sagartia elegans R F F
D12480 Sagartiogeton undatus
R
Annelida
P23040 Spirobranchus triqueter R P20310 Lanice conchilega
O O
P23090 Serpula vermicularis
O Arthropoda
R01090 Balanus balanus
R C
R01100 Balanus crenatus C F C
S01660 Amphipoda
F F
S23600 Homarus gammarus
R
S24650 Pagurus bernhardus
O
S25850 Macropodia rostrata
F
S26460 Cancer pagurus O F F
S26690 Liocarcinus depurator
O
S26720 Necora puber F C C
Mollusca
W14030 Doris pseudoargus
R W16500 Mytilus edulis F
O
Bryozoa
Y00030 Crisiidae F F F
Y01370 Alcyonidium diaphanum F F F
Y06640 Membranipora sp. F Y06780 Electra pilosa C O
Y06940 Flustra foliacea
O O
Y08360 Scrupocellaria
F F
Y08530 Bicellariella ciliata
O
Y08720 Bugulina flabellata
O F
Porifera
ZB00110 Antedon bifida O F R
ZB01900 Asterias rubens C C C
ZB02350 Ophiothrix fragilis
O
ZB02680 Ophiactis balli
O O
ZB02780 Ophiopholis aculeata
O O
ZB03000 Amphipholis squamata
O R
Chordata
ZD00060 Clavelina lepadiformis O O O
ZD00340 Polyclinum aurantium
O
ZD00640 Aplidium punctum F O O
ZD00680 Didemnidae indet.
R
ZD01880 Polycarpa scuba
R R
ZD01940 Dendrodoa grossularia
F O
ZD02090 Botryllus schlosseri O R ZD02140 Botrylloides leachii R
Rhodophyta
ZM02080 Bonnemaisonia asparagoides
O

Ireland’s Eye Reef Survey BSL 1502 Revision 1 (FINAL) 35 November 2015
MCS Code
Taxa S4
i ii iii
ZM02420 Palmaria palmata F ZM02560 Dilsea carnosa
O
ZM03230 Callophyllis laciniata O O ZM03840 Corallinaceae (enc) F
ZM04040 Corallina officinalis O ZM05840 Phyllophora crispa F F
ZM05860 Phyllophora pseudoceranoides F ZM05940 Schottera nicaeensis
O
ZM06110 Chondrus crispus F ZM06310 Plocamium cartilagineum F O
ZM06820 Calliblepharis ciliata
R ZM06880 Cystoclonium purpureum F F ZM06930 Rhodophyllis divaricata
F
ZM07230 Rhodomenia holmesii
F R
ZM07530 Lomentaria orcadensis
R ZM08070 Ceramium sp. O O ZM08460 Halurus flosculosus
R
ZM09500 Cryptopleura ramosa O F ZM09550 Delesseria sanguinea F F ZM09850 Hypoglossum hypoglossoides
F
ZM10120 Phycodrys rubens F ZM10180 Erythroglossum laciniatum
F
Brogniartella byssoides O F ZM11160 Polysiphonia nigra
R
Ochrophyta
Chrysophyceae A ZR00030 Ectocarpaceae indet. C ZR04570 Dictyota dichotoma C C
ZR04780 Taonia atomaria
R ZR04970 Desmarestia aculeata O R ZR04990 Desmarestia ligulata R
ZR05000 Desmarestia viridis R R ZR06310 Laminaria sporelings
O R
ZR06320 Laminaria digitata S ZR06330 Laminaria hyperborea O ZR06360 Saccharina latissima F ZS03920 Bryopsis plumosa
R
6.2. Univariate Analyses
Univariate analyses revealed clear differences between the number of species from the
littoral and sublittoral stations. As expected, species richness was on average higher (twice
as high) in the sublittoral stations (88.3±19.2SD) compared to the numbers found in the
littoral stations (44.7±11.6SD; Table 6.8 & Figure 6.8). Nemerteans and echinoderms were
restricted to the sublittoral stations whereas Ascomycota and Tracheophyta were only
recorded in the littoral zones. The highest species richness was encountered at Sublittoral

Ireland’s Eye Reef Survey BSL 1502 Revision 1 (FINAL) 36 November 2015
Station S2 (109 species) with the lowest number of species being counted at Littoral Station
L1 (34 species).
Table 6.8 Number of Species per Phyla and Station
Phylum Littoral Station Sublittoral Station
L1 L2 L3 S1 S2 S3 S4
Porifera 1 0 2 6 9 9 12
Cnidaria 1 0 1 10 14 12 14
Nemertea 0 0 0 0 0 1 0
Annelida 2 1 1 1 2 1 3
Arthropoda 3 4 8 4 12 11 9
Mollusca 9 5 9 3 3 1 2
Bryozoa 1 2 3 5 12 7 8
Echinodermata 0 0 0 5 5 3 6
Chordata 0 0 1 7 14 8 8
Rhodophyta 12 13 18 17 30 18 25
Ochrophyta 1 7 6 7 8 7 11
Chlorophyta 3 5 5 2 0 0 1
Ascomycota 1 5 3 0 0 0 0
Tracheophyta 0 1 0 0 0 0 0
TOTAL 34 43 57 67 109 78 99
Average 44.7 88.3
Standard Deviation 11.6 19.2
0%
10%
20%
30%
40%
50%
60%
70%
80%
90%
100%
L1 L2 L3 S1 S2 S3 S4
Littoral Station Sublittoral Station
Tracheophyta
Ascomycota
Chlorophyta
Ochrophyta
Rhodophyta
Chordata
Echinodermata
Bryozoa
Mollusca
Arthropoda
Annelida
Nemertea
Cnidaria
Porifera
Figure 6.8 Distribution of Species per Phyla and Station

Ireland’s Eye Reef Survey BSL 1502 Revision 1 (FINAL) 37 November 2015
6.3. Multivariate Analyses
6.3.1. Littoral Stations
Multivariate analyses (PRIMER; Clarke and Warwick, 1994) of the littoral stations indicated
some statistical separation of biotopes such as LR.FLR.Lic.Pra and
LR.HLR.FR.Coff/IR.MIR.KR.Ldig. While the biotopes LR.HLR.MusB.Sem, LR.HLR.FR.Mas,
LR.LLR.F.Asc.FS and LR.MLR.BF.Fser.R could not be statistically distinguished (Figure 6.9).
L1 L3 L1 L3 L2 L2 L2 L1 L3 L2 L1 L3 L1 L3 L1 L3 L2
Station
100
80
60
40
20
0
Sim
ilarit
y
BiotopeLR.FLR.Lic.PraLR.HLR.MusBLR.HLR.MusB.ChtLR.HLR.MusB.SemLR.HLR.FR.MasLR.HLR.FR.Coff/IR.MIR.KR.LdigLR.MLR.BF.FspiBLR.LLR.F.Asc.FSLR.MLR.BF.Fser.R
Figure 6.9 Dendrogram of Biotopes Recorded at the Littoral Stations
The MDS plot indicated that throughout the Littoral stations, greater similarities existed
between the exposed stations L1 and L3, than compared with the more sheltered station L2,
although vertical zonation indicated similar biotopes throughout all three stations (Figure
6.10). Station L2 was located within a gully where water movement/wave exposure was
limited to the northeast direction only area and probably responsible for the absence of
sponge and cnidarian species.

Ireland’s Eye Reef Survey BSL 1502 Revision 1 (FINAL) 38 November 2015
StationL1L2L3
LR.FLR.Lic.Pra
LR.HLR.MusBLR.HLR.MusB.Cht
LR.HLR.MusB.Sem
LR.HLR.FR.Mas
LR.HLR.FR.Coff/IR.MIR.KR.Ldig
LR.FLR.Lic.Pra
LR.MLR.BF.FspiBLR.LLR.F.Asc.FS
LR.MLR.BF.Fser.R
LR.HLR.FR.Coff/IR.MIR.KR.Ldig
LR.FLR.Lic.PraLR.HLR.MusBLR.HLR.MusB.Cht
LR.HLR.MusB.SemLR.HLR.FR.Mas
LR.HLR.FR.Coff/IR.MIR.KR.Ldig
2D Stress: 0.09
Figure 6.10 MDS of Biotopes Recorded at the Littoral Stations
6.3.2. Sublittoral Stations
All four stations in the sublittoral areas were characterised by Laminaria digitata forest in
the shallows (IR.MIR.KR.Ldig.Ldig), below this zone, three of the four stations recorded the
biotope IR.HIR.KFaR.FoR.Dic. The deepest extent of the reef was the most variable, with
three different biotopes recorded at the four stations, with only Sublittoral Stations S1 and
S3 characterised by the same biotope of ‘Mixed turf of bryozoans and erect sponges with
Sagartia elegans on tide-swept circalittoral rock’.
The cluster and MDS plot for the sublittoral stations indicated some statistical separation of
biotopes, most notably that of IR.MIR.KR.Ldig.Ldig, with all four occurrences being
statistically indistinguishable (Figure 6.11). Stations S2 and S4 showed statistical separation
of biotopes from the other stations, whilst these two stations were also statistically
indeterminate within each depth zone (Figure 6.12). The subtle variations in biotope
composition geographically is probably due to differences within the seabed profiles and
morphology.

Ireland’s Eye Reef Survey BSL 1502 Revision 1 (FINAL) 39 November 2015
S3
S2
S4
S1
S1
S2
S4
S2
S4
S3
S3
S1
Station
100
80
60
40
20S
imila
rity
BiotopeIR.MIR.KR.Ldig.LdigIR.HIR.KFaR.FoR.DicCR.HCR.Xfa.ByErSp.SagCR.HCR.Xfa.FluCoAsIR.HIR.KFaR.FoRHCR.Xfa.FluCoAs.Paur
Figure 6.11 Dendrogram of Biotopes Recorded at the Sublittoral Stations
StationS1S2S3S4
IR.MIR.KR.Ldig.Ldig IR.HIR.KFaR.FoR.Dic
CR.HCR.Xfa.ByErSp.Sag
IR.MIR.KR.Ldig.Ldig
IR.HIR.KFaR.FoR.Dic
CR.HCR.Xfa.FluCoAs
IR.MIR.KR.Ldig.Ldig
IR.HIR.KFaR.FoRCR.HCR.Xfa.ByErSp.Sag
IR.MIR.KR.Ldig.Ldig
IR.HIR.KFaR.FoR.Dic HCR.Xfa.FluCoAs.Paur
2D Stress: 0.12
Figure 6.12 MDS of Biotopes Recorded at the Sublittoral Stations
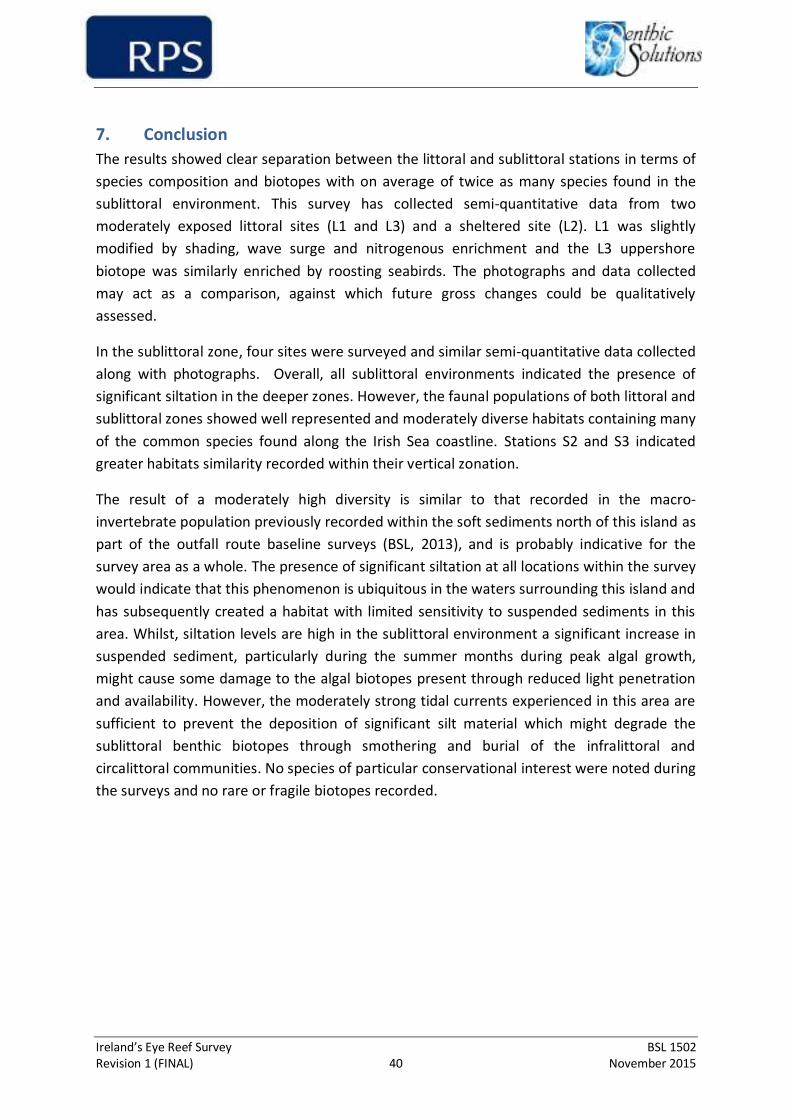
Ireland’s Eye Reef Survey BSL 1502 Revision 1 (FINAL) 40 November 2015
7. Conclusion
The results showed clear separation between the littoral and sublittoral stations in terms of
species composition and biotopes with on average of twice as many species found in the
sublittoral environment. This survey has collected semi-quantitative data from two
moderately exposed littoral sites (L1 and L3) and a sheltered site (L2). L1 was slightly
modified by shading, wave surge and nitrogenous enrichment and the L3 uppershore
biotope was similarly enriched by roosting seabirds. The photographs and data collected
may act as a comparison, against which future gross changes could be qualitatively
assessed.
In the sublittoral zone, four sites were surveyed and similar semi-quantitative data collected
along with photographs. Overall, all sublittoral environments indicated the presence of
significant siltation in the deeper zones. However, the faunal populations of both littoral and
sublittoral zones showed well represented and moderately diverse habitats containing many
of the common species found along the Irish Sea coastline. Stations S2 and S3 indicated
greater habitats similarity recorded within their vertical zonation.
The result of a moderately high diversity is similar to that recorded in the macro-
invertebrate population previously recorded within the soft sediments north of this island as
part of the outfall route baseline surveys (BSL, 2013), and is probably indicative for the
survey area as a whole. The presence of significant siltation at all locations within the survey
would indicate that this phenomenon is ubiquitous in the waters surrounding this island and
has subsequently created a habitat with limited sensitivity to suspended sediments in this
area. Whilst, siltation levels are high in the sublittoral environment a significant increase in
suspended sediment, particularly during the summer months during peak algal growth,
might cause some damage to the algal biotopes present through reduced light penetration
and availability. However, the moderately strong tidal currents experienced in this area are
sufficient to prevent the deposition of significant silt material which might degrade the
sublittoral benthic biotopes through smothering and burial of the infralittoral and
circalittoral communities. No species of particular conservational interest were noted during
the surveys and no rare or fragile biotopes recorded.

Ireland’s Eye Reef Survey BSL 1502 Revision 1 (FINAL) 41 November 2015
8. References
Benthic Solutions Limited, 2013. Baseline benthic environmental survey along the proposed Greater Dublin Drainage scheme outfall locations. Survey data reported within Environmental Impact Statement.
Clarke, K. R. and Warwick, R. M. (1994). Similarity-based testing for community pattern: the 2-way layout with no replication. Mar. Biol. 118: 167-176.
MERC (2010). Irish Sea Reef Survey Project Report. Carried out by MERC on behalf of National Parks and Wildlife Service, Department of Environment, Heritage and Local Government. MERC (2012a). Intertidal Reef Survey of Lambay Island SAC and SPA, Rockabill Island SPA, Ireland’s Eye SAC, Dalkey Islands SPA and Muglins. Carried out by MERC on behalf of the Marine Institute in partnership with National Parks and Wildlife Service, Department of Environment, Heritage and Local Government. MERC (2012b). Subtidal Reef Survey of Lambay Island SAC and SPA, Rockabill Island SPA,
Ireland’s Eye SAC, Dalkey Islands SPA and Muglins. Carried out by MERC on behalf of the
Marine Institute in partnership with National Parks and Wildlife Service, Department of
Environment, Heritage and Local Government.

Environmental Impact Assessment Volume 2 of 4: Main Report
32102902/NIS
Appendix C IWDG Report on Marine Mammals

0
Greater Dublin Drainage Project, Co. Dublin
Report on Marine Mammal Surveys
Final Report
Rossa Meade, Joanne O’Brien and Simon Berrow
Merchants Quay Kilrush, Co Clare
http://consulting.iwdg.ie
April 2017

0
Table of Contents
EXECUTIVE SUMMARY ................................................................................................................. 1
INTRODUCTION ........................................................................................................................... 5
METHODS .................................................................................................................................... 6
2.1 Study Area ............................................................................................................................. 6
2.2 Land-based Surveys ............................................................................................................... 7
2.3 Boat-based Surveys ............................................................................................................... 8
2.4 Static Acoustic Monitoring .................................................................................................. 10
2.5 Data Analysis ....................................................................................................................... 15
RESULTS .................................................................................................................................... 17
3.1 Land-based observations ..................................................................................................... 17
3.2 Boat-based surveys .............................................................................................................. 23
3.3 Static Acoustic Monitoring .................................................................................................. 36
DISCUSSION ............................................................................................................................... 52
4.1 Visual surveys ...................................................................................................................... 52
4.2 Static Acoustic Monitoring .................................................................................................. 54
4.3 Recommendations ............................................................................................................... 57
ACKNOWLEDGEMENTS .............................................................................................................. 58
REFERENCES .............................................................................................................................. 58
APPENDIX – Results from the Loughshinny Marine Mammal Surveys .......................................... 62
5.1 Land-based Observations .................................................................................................... 62
5.2 Boat-based Surveys ............................................................................................................. 66
5.3 Static Acoustic Monitoring .................................................................................................. 72
5.4 Discussion ............................................................................................................................ 78
5.5 Appendix References ........................................................................................................... 83

1
EXECUTIVE SUMMARY
A marine mammal survey using visual and static acoustic monitoring methodology was conducted
between March 2015 and September 2015 off Loughshinny and March 2015 and March 2017 off
Portmarnock, North Co. Dublin as part of the Greater Dublin Drainage (GDD) project. The study aimed
to assess the distribution, habitat use, seasonal occurrence and behaviour of marine mammals in the
study area and if possible derive density and abundance estimates for harbour porpoise.
Three integrated methods were used in line with best practice, these were land-based vantage point
surveys, boat-based transects and Static Acoustic Monitoring. Visual surveys were only carried out in
favourable weather conditions (Beaufort sea-state <2 and visibility >6km). Monthly land-based
surveys were conducted from sites at Loughshinny and Howth Head. Single platform line-transect boat
surveys were conducted bi-monthly following a pre-determined route and standardised design. Static
acoustic monitoring using C-PODs was conducted for six months at a single site off Loughshinny and
for 24 months at three locations off Portmarnock.
The software programme DISTANCE was used for calculating detection functions, which is the
probability of detecting an object a certain distance from the track-line and used to calculate the
density of animals on the track-line of the vessel. A detection function was calculated from each boat
survey, providing sufficient number of sightings were made to provide a robust estimate.
All C-POD data were analysed using only high probability clicks, which reduced the possibility of false
positives (i.e. recorded as present when there were in fact no dolphins or porpoise present). Harbour
porpoise detections were extracted as detection positive minutes per day and were analysed
statistically for temporal and geographical trends. Porpoise detections were analysed with respect to
season (spring, summer, autumn and winter), diel cycle (day and night-time), tidal state (ebb, flood,
slack high, slack low) and tidal phase (spring, neap) at a resolution of one hour. A Generalised Linear
Mixed Model (GLMM) was fitted to the binomial data using the glmer function in the lme4 package
developed for the statistical program R. Details of individual harbour porpoise click trains were
extracted and analysed.
Six monthly land-based surveys were conducted from the Martello Tower at Loughshinny. Twenty
hours of land-based monitoring was conducted over six survey days. The weather was favourable
throughout all surveys with no swell, sea state ≤2 and visibility of 6-20km. Precipitation was recorded
on two days in July and September. Marine mammals were sighted on 86% of land-based survey days

2
with harbour porpoise present on 67% and seal species present on 67% of days. Eleven (11) sightings
of harbour porpoise (23 individuals) and 12 seal sightings (12 individuals) were recorded. Ten (10) of
the seal sightings were identified as grey seals while two could not be identified to species level.
Harbour porpoise numbers peaked in September, however there was no peak in seal numbers.
Land-based survey effort conducted from Howth Head amounted to around 144 hours (23 surveys)
between 18 March 2015 and 11 March 2017. Environmental conditions were favourable with no swell,
sea-state <2 for 99% and visibility >6km for 97% of survey effort. Marine mammals were sighted on
100% of survey days with grey seals present on 100% and harbour porpoise present on 83% of days.
Two-hundred and sixty (260) sightings of grey seals totalling 325 individual animals, comprising 323
adults and two juveniles, were recorded with an average group size of one individual. Sighting rate for
grey seals was greatest in April 2015 although high numbers were also recorded in September 2015,
January 2016 and October 2016. One-hundred and sixty-seven (167) sightings of harbour porpoise
totalling 293 individual animals were recorded comprising 237 adults, 41 juveniles and 15 calves.
Mean group size for harbour porpoise from land-based watches was two individuals. Calves were
present between September and November 2015 and in August 2016. Harbour porpoise sighting rate
was greatest between August and January 2015 and August and October 2016 with mean group size
also increasing during this period.
A total of 897km of track-line was surveyed during eleven independent surveys, carried out from April
2015 to January 2017. Environmental conditions were favourable with visibility of >6km for 91% and
swell of <1m for 100% of survey effort. Sea-state <2 was recorded for all of eight of the eleven surveys
however sea-state of >2 was recorded for 8% of the survey carried out in April 2015, 36% in June 2015
and 46% during the December 2016. Marine mammals were sighted on all survey days with a total of
192 sightings of 251 individual animals. Four marine mammal species were recorded; harbour
porpoise, grey seal, harbour seal and minke whale. Seals were recorded on 91% of survey days with
the highest numbers of individuals recorded in November 2015. Grey seal sightings were distributed
evenly across the study area and all sightings recorded were of single adults. Two harbour seals were
sighted, one each in April and August 2015, both of which were of single adults. Single minke whales
were recorded in June 2015 and August 2016. Harbour porpoise were recorded on 100% of survey
days with the greatest number of sightings recorded in November 2015 and August 2016. Group size
also increased between August and November 2015 and in August 2016 with calves recorded during
these three surveys. The lowest number of sightings were in June 2015, June 2016 and December
2016.

3
Density estimates for harbour porpoises were calculated for seven of the eleven boat survey days but
not for surveys in June 2015, March 2016, June 2016 and December 2016 as the total number of
sightings during each survey were less than 10, which is considered too few to derive a reliable density
estimate. Mean group size was greater in August 2015 and August 2016 compared to other surveys,
suggesting a peak occurred in late summer, which was consistent with land-based observations.
Within the area surveyed, the density of harbour porpoise varied from 0.61 to 2.29 per km2 per survey
with a mean density of 1.32 harbour porpoise per km2, which is high for coastal sites in Ireland and
similar to previous surveys in the area. Density estimates increased during summer and early winter
(August-November) in 2015 and in August 2016, with lowest densities recorded in April 2015 and
February 2016.
A total of 189 days of Static Acoustic Monitoring data was collected off Loughshinny. Harbour porpoise
detections were recorded on 100% of days. The number of Porpoise Positive Minutes (PPM) ranged
from 8 to 475 per day with a mean of 139 PPM. Results showed that season had a significant effect on
the presence of porpoises at the site with a peak in autumn. Most porpoise detections were recorded
during early morning suggesting they were more active at the site during night-time and in the early
morning. Tidal cycle was not found to be a significant factor but tidal phase was, with highest
detections during spring cycles. A total of 100,421 porpoise click trains were recorded at Loughshinny
over the six month deployment, with 95% (95,509 trains) consistent with foraging, highlighting
Loughshinny as a very important feeding site.
Static Acoustic Monitoring was carried out at three sites simultaneously off Portmarnock for a total
duration of 750 days, between March 2015 and March 2017. All three sites were along the proposed
route of the discharge pipe ranging from 2.5km (GDD1) to 5km (GDD3) offshore. Detections were
recorded on average between 96-99% of days at each site. The number of PPM ranged from 3690 to
25089 per year between sites, with the mean ranging between 41.3 to 94.3 per day. The highest
detection rate was recorded across the autumn and winter months, during the hours of darkness (incl.
at dawn and dusk), during high tide and at the furthest offshore station (GDD3) during the neap cycle
of the tidal phase. The site in the middle of the SAM array (GDD2) had the highest overall detection
rate.
This survey, carried out over two years, using a range of survey techniques, has clearly demonstrated
that North County Dublin is a very important area for marine mammals. The waters off Loughshinny
are an important feeding area for harbour porpoise, especially during the autumn months, and at
night and during early morning and spring tides. The area off Portmarnock is important for both grey

4
seals and harbour porpoise, both of which were recorded throughout the year. Grey seals were
regularly present in small numbers and distributed throughout the survey area. Peaks in sightings from
Howth Head occurred during spring and autumn, coinciding with pupping and post-moult periods at
the local well-known breeding and haul out sites at Lambay Island, Skerries and Irelands Eye. Harbour
porpoise were also distributed throughout the site, with numbers increasing during late summer and
autumn in both 2015 and 2016, which may be due to seasonally abundant food sources such as sprat,
herring, Trisopterus spp. and gadoid species. Lower numbers were recorded during late spring/early
summer (March-June) which may be linked to an offshore movement of this species before calving.
Density estimates of harbour porpoise were high compared to coastal sites elsewhere in Ireland, and
emphasizes the importance of this site for this species as these were some of the highest densities for
this species recorded in Ireland to date. Static Acoustic Monitoring provided a high resolution (hourly)
insight into the use of this habitat across time and throughout the day and night. Harbour porpoise
were present almost daily at Portmarnock but were strongly influenced by seasonal, diel and tidal
factors.
Harbour porpoises and grey seals are both listed on Annex II of the Habitats Directive and are thus
entitled to strict protection, including their habitats. Extreme care must be taken to ensure the
proposed development does not degrade this habitat or cause undue disturbance to marine
mammals.

5
INTRODUCTION
The Irish Whale and Dolphin Group (IWDG) were sub-contracted by Techworks Marine to establish
the extent and nature of marine mammals in north County Dublin in connection with the Greater
Dublin Drainage (GDD) project. The GDD project proposes a new marine outfall pipe discharging 1km
north-east of Ireland’s Eye in north Dublin and 6km out to sea. The discharge is within the recently
designated Rockabill to Dalkey Island Special Area of Conservation which lists harbour porpoise as a
qualifying interest. The study aimed to assess the distribution, habitat use, seasonal occurrence and
behaviour of marine mammals in the study area and derive density and abundance estimates for
harbour porpoise. The results of this survey will be used to inform the most appropriate construction
methodology for the marine outfall pipe while minimising any impacts on marine mammals. The
survey commenced in March 2015 for two years within two defined study areas; i) Portmarnock and
ii) Loughshinny. The Portmarnock site was monitored for two years while Loughshinny for six months
from March 2015.
The survey used three independent methods: land‐based, boat‐based and Static Acoustic Monitoring
(SAM) to ensure a robust assessment was carried out. This is in line with best practice which
recommends a combination of visual and acoustic techniques especially if harbour porpoise
(Phocoena phocoena) are known to occur in the area, as they can be very difficult to observe in even
moderate sea conditions. Land‐based observations were conducted from vantage points with a good
field of view over the core study area, which avoided the possibility of disturbance and potential
displacement during boat‐based surveys (David, 2002). Boat‐based line transect surveys were
conducted to describe the broader -scale distribution and to derive density and abundance estimates.
Boat-based surveys can cover a large area including sites which are difficult to observe from land even
with good optics. However, all visual monitoring techniques can be influenced by variables such as
sea-state (Evans and Hammond, 2004; Teilmann, 2003; Palka, 1996; Clarke, 1982), observer variability
(Young and Peace, 1999), optics and height above sea level. Evans and Hammond (2004)
recommended that visual surveys should generally not be carried out in sea-states above Beaufort 2,
as the probability of detecting animals is markedly reduced above this. Static Acoustic Monitoring
(SAM) is a very useful tool for monitoring small cetaceans since it can be carried out without these
visual constraints, and does not influence their behaviour. SAM involves the detection and recording
of odontocete vocalisations or echolocation clicks and is especially useful for defining fine-scale
habitat use. Additionally, SAM can be used to study behaviour, such as foraging, approach behaviour
and communication. SAM however is spatially constrained as the detection distance for harbour

6
porpoise can be as little as 200‐300m and it cannot provide information on density or abundance but
can provide robust information on spatial and temporal trends. This report provides a detailed
exploration of marine mammal activity off Loughshinny Co. Dublin over a 6-month period and
Portmarnock Co. Dublin over a 24-month period.
METHODS
2.1 Study Area
The study area in north County Dublin, where the proposed outfall pipe will be constructed and
operated is adjacent to a number of high nature conservation sites for marine mammals, protected
under EU legislation. One of the three Special Areas of Conservation (SACs) which include harbour
porpoise as a qualifying interest; occurs within the study area. Rockabill to Dalkey Island SAC (Site
Code: 003000) was designated in 2012 while Lambay Island SAC (Site Code: 000204) with both grey
and harbour seal as qualifying interests also lies within the study area (Figure 1). The boundaries of
the current survey included both these protected sites and adjacent waters including the route of the
proposed outfall pipe.
Figure 1. Study area for GDD Marine Mammal Surveys showing the GDD Preferred Marine Outfall Area and
SACs within the Study Area ©National Parks and Wildlife Services SAC

7
2.2 Land-based Surveys
2.2.1 Land-based Observation Site
Land based observations were carried out from the Martello Tower at Loughshinny and from the
north-eastern cliffs of Howth Head. Both sites were selected as a suitable vantage points for land-
based observations based on their height above sea level and the field of view over the survey area
(Figure 2).
Figure 2. Location of Loughshinny and Howth Head land-based survey sites
2.2.2 Land-based Methodology
Land based observations were carried out for a duration of six months from Loughshinny and 24
months from Howth Head. Quantified effort watches, where time spent watching and weather
conditions are recorded, were carried out once a month during suitable weather conditions defined
as Beaufort sea-state <2 and in visibility of >6km. Each watch lasted for 420-560 minutes (7-8 hours)
and were carried out in 100 minute samples in accordance with IWDG standardised methodology for

8
their Inshore Cetacean Monitoring Programme (Berrow et al. 2010). Two observers were present at
the observation site to maximise search effort and assist in tracking as well as compliance with health
and safety.
Visual observations were made using a tripod-mounted scope (Opticron) equipped with a 20-60x
wide-angle eyepiece and handheld binoculars (7 x 50; Opticron). Environmental conditions (sea-state,
wind and weather variables) were recorded at the start of each observation and every 30 minutes
throughout the watch or when weather conditions changed. During watches, two types of visual
observations were conducted: scan sampling and focal follow observations (Mann, 1999).
2.2.2.1 Scan Sampling
During scan sampling, the study area (up to 5km from the observation site) was systematically scanned
using the telescope (observer 1) and binoculars (observer 2). For each sighting species, group size,
group composition, location, direction of travel and behaviour were recorded. The geographical
location of each sightings was recorded using a T107 Leica theodolite or, when the use of the
theodolite was restricted, by estimating distance (km) and bearing (degrees) from the observation site
using reticule binoculars.
2.2.2.2 Focal Follow Observations
Harbour porpoise were tracked using a T107 Leica theodolite to determine their habitat use. During
each surfacing the group size, composition, location and direction of travel were recorded along with
the behaviours described by Mann (1999). Focal follow observations or tracks began at the first
sighting of harbour porpoise and continued for as long as possible. Tracks ended when individuals
either moved out of sight, weather conditions deteriorated or when darkness fell. If the use of the
theodolite was restricted, location was determined by estimating distance (km) and bearing (degrees)
from the observation site using reticule binoculars.
2.3 Boat-based Surveys
Conventional single line-transect marine mammal surveys were carried out aboard MV Beluga along
a predetermined route. Four different routes were used; surveys 1-4 included coverage of the waters
off Loughshinny while surveys 5-11 targeted the Portmarnock area after surveys had been completed
off Loughshinny (Figure 3).

9
Figure 3. Line Transect Route for boat-based marine mammal surveys
2.3.1 Line Transect Methodology
Single platform line transect surveys were conducted every two months onboard a 13m cruiser with
flying bridge, MV Beluga which has a platform height of 3.1m. Surveys were carried out in sea‐state ≤2
and in visibility ≥6km. The vessel travelled at a speed of 9-10 knots, which was 2-3 times the typical
average speed of the target species as recommended by Dawson et al. (2008). This helped minimise
any potential missed sightings due to avoidance behaviour.
Three people were required on each survey; two primary observers and one operating the software
programme LOGGER (©IFAW). The primary observers were positioned on the flying bridge, which
Survey 1 Surveys 2, 3 & 4
Surveys 5, 6, 7, 10 & 11 Surveys 8 & 9

10
provided an eye-height above sea-level of between 4-5m depending on the height of the observer.
Primary observers scanned with the naked eye from dead ahead to 90º to port or starboard depending
on which side of the vessel they were positioned. During all transects, the position of the survey vessel
was tracked continuously through a GPS receiver fed directly into LOGGER software via a laptop.
Survey effort, including environmental conditions (sea-state, wind strength and direction, glare etc.)
were recorded directly onto LOGGER every 15 minutes.
When a sighting of a marine mammal was made, the position of the vessel and the angle and distance
of the sighting from the track of the vessel were recorded. The angle to the sighting from the vessels
course was recorded via an angle board attached to the vessel immediately in front of each observer.
Binoculars (Opticron 10x50 Marine, with graduated reticle) or a range-finder stick (JNCC approved)
were used to estimate distance to sighting, while the binoculars were used to confirm species
identification, group numbers, composition and behaviour. This data was communicated to the
LOGGER operator in the wheelhouse via a VHF radio. The team of three observers rotated positions
between each side of the vessel and LOGGER every hour to avoid bias on one side of the track line or
a decline in sighting detections due to fatigue.
2.4 Static Acoustic Monitoring
2.4.1 Study Area
Two CPODs were moored in one site (one as a control) around 3km east of Loughshinny, Co. Dublin
and approximately 6km north of Lambay Island (Figure 4). Additional deployments took place off
Portmarnock, Co. Dublin just north of Ireland’s Eye. Three locations, (GDD1, GDD2 and GDD3) were
monitored here with GDD1 closest to land at 2.5km offshore, GDD2 was 1km to the east of GDD2,
while GDD3 was a further 1.5 km from GDD2 and thus 5km offshore (Figure 4).

11
Figure 4. Map of deployment locations of C-PODs off Portmarnock (GDD1, GDD2 and GDD3) and Loughshinny (GDD4)
2.4.2 Static Acoustic Monitoring (SAM) Equipment
2.4.2.1 C-PODs
Once deployed at sea, the C-POD operates in a passive mode and is constantly listening for tonal clicks
within a frequency range of 20 to 160 kHz (Figure 5). When a tonal click is detected, the C-POD records
the time of occurrence, centre frequency, intensity, duration, bandwidth and frequency of the click
(Chelonia Ltd). Internally, the C-POD is equipped with a Secure Digital (SD) flash card, and all data are
stored on this card. Dedicated software, CPOD.exe, provided by the manufacturer, is used to process
the data from the SD card when connected to a PC via a card-reader. This allows for extraction of data
files under pre-determined parameters, as set by the user. C-PODs also record temperature at its
deployment depth. It should be noted that the C-POD does not record actual sound files, only
information about the tonal clicks it detects. The C-POD is a sound pressure level detector with a
threshold of 1Pa peak to peak at 130 kHz, with the frequency response shown below (Figure 6,
www.chelonian.co.uk). An estimated detection distance of 797.6m ±61m (75% of groups

12
recorded<400m) for C-PODs and bottlenose dolphins was generated in the Shannon Estuary, while
distances estimates of 441m ±42m (92% <400m) were calculated for harbour porpoise in Galway Bay
(O’Brien et al., 2013).
Figure 5. C-POD unit by Chelonia Ltd
Figure 6. Threshold for detection across various frequency bands between 20 and 200 kHz for the C-POD (note 1Pa p-p is the SI unit for pressure and correctly represents the threshold) © Chelonia Ltd.
Through the C-POD.exe software, data can be viewed, analysed and exported. Additionally, the
software can be used to change settings of individual SD cards. The C-POD.exe software includes
automatic click train detection, which is continually evolving as Chelonia Ltd receives more feedback
from their clients. C-POD.exe can be run on any version of Windows and requires an external USB card
Hydrophone
element
Screw top end
and safety line
attached to
middle

13
reader, which reads the SD card into the directory. Version 2.044 (October, 2014) was used for all
analyses. C-POD.exe software allows the user to extract click trains under five classification
parameters but only the porpoise like category was used for this analyses of the long-term dataset
(Figure 7).
Figure 7. Screen grab of C-POD.exe, showing a harbour porpoise click train
2.4.3 C-POD Calibration
Calibration of C-PODs is important in order to facilitate a comparison of acoustic detection results
collected by different units across various locations. Chelonia Ltd calibrates all units to a standard prior
to dispatch. These calibrations are carried out in the lab under controlled conditions and thus Chelonia
highly recommends that further calibrations are carried out in the field prior to their employment in
monitoring programmes instead of further tank tests (Nick Tregenza, Chelonia Ltd., pers. comm.). Field
calibrations are especially important where projects use several units aimed at comparing detections
across a number of sites. If units of differing sensitivities are used, then these data do not truly reflect
the activity at a site. For example, a low detection rate may be attributed to a less sensitive C-POD,
with a lower detection threshold, which in turn leads to a lower detection range, while the opposite
holds for a very sensitive unit. It is fundamental that differences between units are determined prior
to their deployment as part of any project, to allow for the generation of correction factors which can
be applied to the resulting data. Field trials should be carried out in high density areas in order to

14
determine the detection function (O’Brien et al. 2013). The field calibration of new units should be
carried out in conjunction with a reference C-POD, where a single unit is used solely for calibrations
and is deemed a reference. This allows for the incidence where new units are acquired over the course
of a project to be calibrated with the reference.
All units used to carry out SAM during the present project were deployed together in the Shannon
Estuary prior to monitoring. C-PODs 549, 795, 796,950 and 1524 were deployed for a total of 13 days
(Figure 33), and a second deployment consisting of C-PODs 169, 172, 173, 487 and 1147 for a total of
23 days (Figure 34). This allowed enough time to establish if sensitivity would be a confounding factor
between units before been deployed as part of the present study.
Upon recovery of the units during monitoring, data were extracted under two categories, 1) NBHF
(porpoise band) and 2) Other (dolphin band) using the C-POD.exe software (Version 2.044, October,
2014). These data were in the form of Excel.xlsx files using C.POD.exe software and analysed as
Detection Positive Minutes (DPM) across hourly segments. Statistical analyses were carried out using
the program R (R Development Core Team, 2011). All combinations of C-POD pairs were modelled
using an orthogonal regression of DPM across hourly segments. This was compared to a null model,
assuming no variation in C-POD detections, a = 0 and b = 1, and used to assess C-POD performance.
An error margin of ±20% DPM per hour was plotted along the null model to distinguish between an
acceptable level of variation in C-POD performance and problematic variation due to faulty or highly
sensitive units (Tregenza pers comm.). From these graphs it is possible to determine successful or
unsuccessful C-POD combinations. The mean intercept and gradient values of the orthogonal model
for each C-POD pair were extracted and used to create centipede plots where, deviation from 0 on
the horizontal axis, of mean intercept values and deviation from 1 on the horizontal axis, of mean
gradient values indicated deviations from the null model. This was also used to identify if only one or
two POD combinations were unsuccessful and also the extent of variability within the intercept and
gradient values. Results were then used to highlight poor performing units or very sensitive units, if
they existed and a correction factor can be generated and applied to the data.
2.4.4 Moorings
C-PODs were deployed as part of Techworks Marine’s heavy weight mooring systems deployed to
monitor current and turbidity over the same duration (Figure 8).

15
Figure 8. Heavy weight mooring deployed with C-POD attached (image updated from TechWorks Marine mooring diagram)
2.5 Data Analysis
2.5.1 Visual Observations
Visual survey data for land and boat-based surveys (i.e. sighting, effort and weather information) was
compiled into a Microsoft Access database and Microsoft Excel. Maps of study areas and marine
mammal sightings were created with ArcMap 10.2.
2.5.1.1 Density and abundance estimation
Distance sampling was used to derive a density estimate and to calculate a corresponding abundance
estimate for the study area where possible. The software programme DISTANCE (Version 5, University
of St Andrews, Scotland) was used for calculating the detection function, which is the probability of
detecting an object a certain distance from the track-line. The detection function was used to calculate
the density of animals on the track-line of the vessel. During this survey, we assume that all animals
on the track-line were observed, i.e., that g(0) = 1, which is not correct but testing this would require
a double platform survey which is not practical at small coastal sites. This assumption is consistent
with previous small scale coastal sites in Ireland (see Berrow et al. 2014), to enable comparisons across
sites. The DISTANCE software allows the user to select a number of models in order to identify the
most appropriate for the data. It also allows truncation of sighting outliers when estimating variance
in group size and testing for evasive movement prior to detection.

16
To calculate density, “day” was used as the sample regime with sightings used as sampling
observations. Estimates of abundance and density obtained via the DISTANCE modelling process are
presented for each survey day. The overall pooled abundance/density estimate was derived from data
from both survey days combined. This was necessary in order to obtain sufficient sightings for a robust
estimate using the DISTANCE model (the minimum required is 40—60; Buckland et al. 2001). In
conducting this pooled analysis, we assumed that there were no significant changes in distribution
within each site between sample days or any immigration into or emigration out of the site.
The data were fitted to a number of models available in the DISTANCE software. The Half-Normal
model with cosine adjustments was found to best fit according to the Akaike Information Criterion
delivered by the model. The recorded data were grouped into equal distance intervals of 0-25m, 25-
50m up to 200m for the first survey and 0-30m, 30-60m up to 300m for the second survey and both
surveys combined. The DISTANCE model determines the influence of cluster size on variability by using
a size-bias regression method with the log(n) of cluster size plotted against the corresponding
estimated detection function g(x).
A Chi-squared test associated with the estimation of each detection function is delivered by the
DISTANCE model. If found to be statistically significant it indicated that the detection function was a
good fit and that the corresponding estimates were robust. The proportions of the variability
accounted for by the encounter rates, detection probability and group size (cluster size) are presented
with each detection function. Variability associated with the encounter rate reflects the number of
sightings on each track-line. The detection probability reflects how far the sightings were from the
track-line and cluster size reflects the range of estimated group sizes recorded on each survey.
2.5.2 Static Acoustic Monitoring
All C-POD data were analysed using only high probability clicks. Both dolphin and porpoise detections
were extracted as detection positive minutes per day (DPM), but only porpoise detections were
analysed statistically. Dolphin detections were present but upon visual validation were found to be
false positives. False positives are very short click trains, similar to a dolphin echolocation click train
and can occur due to background sounds in the marine environment. As recommended by the
manufacturers, a validation overview was carried out on the data, where 10% of all detected trains
were visually inspected on cpod.exe to verify they were rightly assigned to harbour porpoise. Of this
10%, 1% of trains were classified as false positives, and therefore analysis of the porpoise detections
proceeded with the classification of hourly variables into the following categories; season (spring,

17
summer, autumn and winter), diel cycle (day and night-time), tidal state (ebb, flood, slack high, slack
low) and tidal phase (spring, neap). The term PPM represents the number of minutes in a day or an
hour that harbour porpoises were acoustically detected. Seasonal categorisations were assigned
according to the seasons spring (February, March, April), summer (May, June, July), autumn (August,
September, October) and winter (November, December, January). Data files in the format porpoise
minutes per hour (PPM/h) were classified into day and night-time categories using local times of
sunrise and sunset times, obtained from the U.S. Naval Observatory, who provide the sun rise and
sunset data in a readily available format (www.aa.usno.navy.mil/data/docs/RS). Hourly data segments
were further categorised into each of the four tidal states, where three hours were assigned to each
state (one hour either side of the hour). Files were further split to correspond with tidal phase (spring
and neap cycles) using admiralty data (WXTide 32) where two days either side of the highest tidal
height was deemed spring, and two days either side of the least difference in tidal height between
high and low tide was deemed neap, all other days were classified as transitional.
All data were analysed using the program R. R is a language and environment for statistical computing
and graphics. It is free software, available at http://www.r-project.org/index.html. The software
compiles and runs on a wide range of UNIX platforms, Windows and MacOS. R provides a wide variety
of linear and nonlinear modelling, classical statistical tests, time-series analysis, classification,
clustering and graphical techniques (R Development Core Team, 2011). R is designed around a true
computer language, similar to the S language. The effective programming language includes
conditionals, loops, user-defined recursive functions and input and output facilities. A Generalized
Linear Mixed-effect Model (GLMM) was fitted to the binomial data using the glmer function in the
lme4 package developed for R. C-POD ID number was included as a random factor to further take into
account variability between units. Akaike’s information criterion (AIC) and a histogram of fitted
residuals were used as diagnostic tools for model selection. Wald chi-squared tests were computed
for each variable and predicted proportions of Porpoise Positive Hours (PPH) were extracted across
all levels and displayed as box plots using the HH package developed for R.
RESULTS
3.1 Land-based observations
Land-based monitoring was carried out monthly from 18 March 2015 until 11 March 2017. Just under
144 hours of monitoring was conducted over 23 independent surveys. Half day surveys were carried

18
out from March to 07 September 2015 when Loughshinny was also surveyed in the same day. Full
days surveys off Howth Head commenced on 19 September 2015.
3.1.1 Environmental Conditions
Environmental conditions were favourable during nearly all of the land-based surveys. Swell of less
than 1m was recorded on 100% of survey days. Sea-state 0 was recorded for 23% of total survey effort,
sea-state 1 for 54%, sea-state 2 for 21% and sea-state 3 for 1% (Figure 9). Visibility of 1-5km was
recorded for 3% of total survey effort, 6-10km for 21%, 11-15km for 7%, 16-20km for 36% and greater
than 20km for 32% (Figure 10).
Figure 9. Beaufort Sea-state (%) recorded during land-based surveys from Howth Head
Figure 10. Percentage visibility (km) recorded during land-based surveys from Howth Head
0%
10%
20%
30%
40%
50%
60%
70%
80%
90%
100%
ss0 ss1 ss2 ss3
0%
10%
20%
30%
40%
50%
60%
70%
80%
90%
100%
vis 1-5 vis 6-10 vis 11-15 vis 16-20 vis >20

19
3.1.2 Scan sampling marine mammal sightings
Marine mammals were sighted on 100% of survey days with harbour porpoise present on 83% and
seals present on 100% of days. A total of two marine mammal species were recorded during the survey
period; harbour porpoise and grey seal.
3.1.2.1 Harbour Porpoise
One hundred and sixty-seven (167) sightings of harbour porpoise were recorded totalling 293 animals
(Table 1). A total of 237 adults, 41 juveniles and 15 calves were recorded and sightings had an average
group size of two animals. Calves were only recorded between September and November 2015 and
in August 2016.
Table 1. Summary of harbour porpoise sightings recorded during Howth Head land-based observations. Grey shaded rows show half-day surveys.
Date No. sightings No. animals Adults Juveniles Calves Range of group size
18/03/2015 0 0 - - - - 21/04/2015 2 3 3 - - 1-2 23/05/2015 0 0 - - - - 14/07/2015 0 0 - - - - 12/08/2015 1 4 3 1 - - 07/09/2015 6 18 11 2 5 2-4 19/09/2015 15 28 22 1 5 1-5 03/10/2015 3 6 4 1 1 1-3 04/11/2015 11 19 14 3 2 1-5 16/01/2016 11 29 23 6 - 1-12 06/03/2016 2 2 2 - - 1 22/03/2016 6 7 6 1 - 1-2 04/04/2016 0 0 - - - - 22/05/2016 4 5 5 - - 1-2 05/06/2016 1 2 2 - - - 14/07/2016 7 13 13 - - 1-3 14/08/2016 43 66 59 5 2 1-3 15/09/2016 8 14 12 2 - 1-3 09/10/2016 31 60 43 17 - 1-4 26/11/2016 1 1 1 - - - 17/12/2016 5 5 5 - - 1 22/01/2017 4 5 3 2 - 1-2 11/03/2017 6 6 6 - - 1
TOTAL 167 293 237 41 15
Sighting rate was calculated as the number of sightings and number of animals per hour of effort in
order to compare the half day and full day surveys. Harbour porpoise sighting rate was consistently
higher during late summer and autumn, between August and January 2015 and August and October
2016 (Figure 11). Group size also increased during this period (Table 1).

20
Figure 11. Harbour porpoise sighting rate for Howth Head land-based surveys
The greatest number of the harbour porpoise sightings were recorded to the northeast of the
observation site, where animals were often recorded swimming in a tidal current close to the cliffs
(Figure 12).
Figure 12. Distribution of harbour porpoise sightings off Howth Head
0
1
2
3
4
5
6
7
8
9
10
18
/03
/20
15
18
/04
/20
15
18
/05
/20
15
18
/06
/20
15
18
/07
/20
15
18
/08
/20
15
18
/09
/20
15
18
/10
/20
15
18
/11
/20
15
18
/12
/20
15
18
/01
/20
16
18
/02
/20
16
18
/03
/20
16
18
/04
/20
16
18
/05
/20
16
18
/06
/20
16
18
/07
/20
16
18
/08
/20
16
18
/09
/20
16
18
/10
/20
16
18
/11
/20
16
18
/12
/20
16
18
/01
/20
17
18
/02
/20
17
No. sightings/hr No. animals/hr

21
3.1.2.2 Grey seals
Two hundred and sixty (260) sightings of grey seals were recorded totalling 325 animals. A total of 323
adults and two juveniles were recorded and sightings had an average group size of one animal.
Sighting rate for grey seals was more consistent over the survey period with less consistent peaks.
Rate was greatest in April 2015 although high numbers were also recorded in September 2015,
January 2016 and October 2016. Group size also increased during this time (Figure 13).
Grey seal distribution was more westerly than harbour porpoise and individuals were often recorded
feeding within close proximity to the northern cliffs of Howth Head (Figure 14).
Figure 13. Grey seal sighting rate for Howth Head land-based surveys
0
1
2
3
4
5
6
7
Seals (no. sightings per hr) Seals (no. individuals per hr)

22
Figure 14. Distribution of grey seal sightings off Howth Head
3.1.2.3 Focal Follow Observations
When possible, harbour porpoise were tracked during each surfacing event to gain an understanding
of their behaviour. Four focal follows were obtained over four days in September 2015, March 2016
and January and March 2017. In September 2015, a group of harbour porpoise comprising of two
adults and one calf was tracked for 20 minutes. Single adult harbour porpoise were tracked for 59
minutes in March 2016, 24 minutes in January 2017 and 53 minutes in March 2017. With the exception
of March 2016, all focal follows tracked harbour porpoise in a visible tidal current on the northwest
coast of Howth Head (Figure 15).

23
Figure 15. Focal follow tracking of harbour porpoise from the Howth Head site during 2015, 2016 and 2017
3.2 Boat-based surveys
Eleven boat-based marine mammal surveys were conducted onboard MV Beluga from April 2015 to
January 2017 (Table 2). Track-lines were staggered to provide good coverage of the site and to ensure
all habitats were surveyed (see Figure 3).
3.2.1 Environment
Environmental conditions were generally favourable throughout the boat-based surveys. Swell of less
than 1m was recorded for 100% of survey effort. Visibility was greater >6km with the exception of the
November 2015 where visibility was reduced to >3km due to sea fog. Sea-state of >2 was recorded for
8% during April 2015, 36% during the June 2015 survey and 46% during the December 2016 where
sea-state was greater than forecast (Figure 16).

24
Figure 16. Beaufort Sea-state (%) recorded during boat-based surveys
3.2.2 Boat-based Marine Mammal Sightings
Marine mammals were recorded on 100% of boat-based surveys (Table 2, Figures 17-27). Species
recorded comprised of harbour porpoise, grey seal, harbour seal and minke whale.
Table 2. Summary of marine mammal sightings and predominant sea-state from boat-based surveys
Date No. harbour porpoise sightings
No. seal sightings
No. harbour porpoise
individuals
No. seal individuals
No. other marine
mammals
Predominant sea-state
(0-2)
20/04/2015 11 2 15 2 0 2 10/06/2015 3 1 3 1 1 Minke whale 2-3 11/08/2015 20 2 37 2 0 1 01/11/2015 30 8 35 8 0 1 25/02/2016 16 4 17 4 0 1 06/03/2016 8 2 9 2 0 2 03/06/2016 2 1 2 1 0 2 14/08/2016 39 0 58 0 1 Minke whale 1 09/10/2016 12 2 16 2 0 2 01/12/2016 3 1 3 1 0 2 19/01/2017 23 2 31 2 0 0
Total 167 25 226 25 2
0%
10%
20%
30%
40%
50%
60%
70%
80%
90%
100%
ss0 ss1 ss2 ss3

25
Figure 17. Trackline and sightings recorded during boat survey 1 (April 2015)
Figure 18. Trackline and sightings recorded during boat survey 2 (June 2015)
Figure 19. Trackline and sightings recorded during boat survey 3 (August 2015)
Figure 20. Trackline and sightings recorded during boat survey 4 (November 2015)

26
Figure 21. Trackline and sightings recorded during boat survey 5 (February 2016)
Figure 22. Trackline and sightings recorded during boat survey 6 (March 2016)
Figure 23. Trackline and sightings recorded during boat survey 7 (June 2016)
Figure 24. Trackline and sightings recorded during boat survey 8 (August 2016)

27
Figure 25. Trackline and sightings recorded during boat survey 9 (October 2016)
Figure 26. Trackline and sightings recorded during boat survey 10 (December 2016)
Figure 27. Trackline and sightings recorded during boat survey11 (January 2017)

28
3.2.2.1 Seal species and minke whale
Seals were recorded on 91% of survey days with the highest numbers of individuals recorded during
November 2015 (Table 3, Figure 28 ). Grey seal sightings were distributed evenly across the study area
and all sightings were of single adult individuals. Only two harbour seals were sighted, one during the
April and one in August 2015 surveys, both of which were single adults. Single minke whales were
recorded during two surveys, one in June 2015 and one in August 2016 (Table 3, Figure 29).
Table 3. Summary of seal sightings recorded during boat-based surveys
Date No. seal sightings No. seal individuals Other marine
mammals
20/04/2015 2 2 0
10/06/2015 1 1 1 Minke whale
11/08/2015 2 2 0
01/11/2015 8 8 0
25/02/2016 4 4 0
06/03/2016 2 2 0
03/06/2016 1 1 0
14/08/2016 0 0 1 Minke whale
09/10/2016 2 2 0
01/12/2016 1 1 0
19/01/2017 2 2 0
Figure 28. Number of seal sightings recorded during boat-based surveys
0
1
2
3
4
5
6
7
8
9
No. seal sightings

29
Figure 29. Geographic distribution of seal sightings and minke whales recorded during boat-based surveys

30
3.2.2.2 Harbour porpoise
Harbour porpoise were recorded on 100% of survey days with the greatest number of sightings
recorded in November 2015 and August 2016 (Table 4, Figure 30). Group sizes also increased between
August and November in 2015 and in August 2016. The lowest number of sightings were recorded in
June 2015, June 2016 and December 2016 however sea-state was higher during these surveys which
would increase the likelihood of missed sightings, therefore these results must be treated with
caution. Calves were only recorded in August 2015, November 2015 and August 2016. Harbour
porpoise sightings were regularly distributed across the study area (Figure 31).
Table 4. Summary of harbour porpoise sightings recorded during boat-based surveys
Date No. HP sightings
No. HP individuals
Adults Juveniles Calves Range in group size
20/04/2015 11 15 15 - - 1-3
10/06/2015 3 3 3 - - -
11/08/2015 20 37 32 4 1 1-3
01/11/2015 30 35 32 2 1 1-2
25/02/2016 16 17 17 - - 1-2
06/03/2016 8 9 8 1 - 1-2
03/06/2016 2 2 2 - - -
14/08/2016 39 58 47 6 5 1-5
09/10/2016 12 16 15 1 - 1-3
01/12/2016 3 3 3 - - -
19/01/2017 23 31 28 3 - 1-4
202 17 7 Average: 1.35
Figure 30. Number of harbour porpoise sightings and individuals recorded during boat-based surveys
0
10
20
30
40
50
60
70
No. HP sightings No. HP individuals

31
Figure 31. Geographic distribution of harbour porpoise recorded during boat-based surveys

32
3.2.2.2.1 Density and abundance estimation
Density estimates for harbour porpoises calculated for seven of the eleven survey days and not for
surveys two (June 2015), six (March 2016), seven (June 2016) and ten (December 2016) as the number
of sightings were less than 10 and too few to derive a reliable density estimate. The detection
functions for all surveys combined could not be calculated as the area surveyed was reduced during
the winter period and after Loughshinny was removed from survey obligations.
Evasive reactions of porpoises from the survey vessel were most evident on all surveys but especially
on surveys 1, 5, 8 and 9 with a peak in sightings some 30-100m from the track-line (Figure 32), most
likely resulting in an underestimate of animal density. Variation in cluster size was greater during the
surveys 1 and 9 which contributed a greater proportion of the variability. Mean group (cluster) size
was greater on surveys 3 (August 2015) and 8 (August 2016) compared to the other surveys,
suggesting a peak occurred in late summer which is consistent with land-based observations. Adults
will have calved before this period and calves were recorded during both the August 2015 and August
2016 surveys. Calves are unlikely to have weaned which may contribute to this elevated group size.
Density and abundance estimates for harbour porpoise for the Greater Dublin Drainage Marine
Mammal Surveys are shown in Table 6. The density estimates increased during summer and early
winter (August-November) in 2015 and during August 2016. Densities were lowest in April 2015 and
February 2016. The total number of sightings used in the April 2015 (11), February 2016 (16) and
October 2016 (12) surveys were low and results should be treated with caution. The track-line
surveyed in February was around 25% less than in the previous surveys to account for shorter day
length. Also the area surveyed was less than in previous surveys as Loughshinny had been dropped as
an area of interest at the end of summer 2015. Areas of high densities of harbour porpoise to the
north of the study site were therefore not surveyed which will reduce the reported density estimate.
These changes to survey design should be taken into account however the trend to increased densities
during late summer and early winter coincided with peak sighting rate from land-based watches.

33
Table 5. Model data used in the harbour porpoise abundance and density estimation process for the Greater Dublin Drainage project (Note: A half-normal model with cosine series adjustments and sightings data truncated at 200m for surveys 1, 8 and 9 and 300m for surveys 3, 4, 5 and 11).
Sample
Day
Track
length
(km)
Area
surveyed
(km2)
Number
of
sightings
Chi2
P value
Effective
Strip
Width (m)
Variability (D)
Detection Cluster
1 78 197 11 0.924 104.65 67.6 32.4
3 75 189 20 0.602 148.78 84.1 15.9
4 75 189 30 0.542 141.8 89.0 11.0
5 60 85 16 0.193 190.42 100 00.0
8 89 201 39 0.093 105.1 77.9 22.1
9 89 201 12 0.464 97.35 73.1 26.9
11 89 201 23 0.930 206.9 82.5 17.5
Table 6. Estimated density, abundance (N) and group sizes of harbour porpoise recorded for the Greater Dublin Drainage project.
Sample
Day Date
N
(95% CI)
SE
CV
Density
(per km2)
Mean group size
(95% CI)
1 Apr-15 154
(77-306) 54 0.33 0.78
1.44 (1.00-2.12)
3 Aug-15 361
(192-681) 114 0.32 1.91
1.85 (1.48-2.30)
4 Nov-15 332
(245-449) 50 0.36 1.76
1.17 (1.12-1.31)
51 Feb-16 52
(31-86) 12 0.23 0.61 1.00
8 Aug-16 460
(339-625) 70 0.15 2.29
1.53 (1.25-1.85)
9 Oct-16 197
(111-349) 54 0.28 0.97
1.37 (1.00-1.89)
11 Jan-17 179
(117-275) 38 0.21 0.89
1.35 (1.07-1.69)
1 – smaller area surveyed

34
Survey 1: April 2015
Survey 3: 11 August 2015
Survey 4: 1 November 2015

35
Survey 5: 25 February 2016
Survey 8: 14 August 2016
Survey 9: 9 October 2016

36
Figure 32. Detection functions for density estimates for boat-based surveys with sufficient number of sightings to analyse in DISTANCE.
3.3 Static Acoustic Monitoring
3.3.1 C-POD Calibrations
All units used over the duration of the present study were calibrated (Figure 33-Figure 38). From these
trials, there were some differences in sensitivities between units but that individual unit performance
was within the acceptable error margin of ±20% DPM per hour (Figure 35-Figure 38) and therefore no
correction factor was applied to the data to make it comparable (O’Brien et al. 2013). During analysis
of the long-term dataset, differences in sensitivities between units is accounted for by treating C-POD
number as a random factor when running the GLMM and additionally C-PODs were deployed
randomly between sites over the duration of the study.
Survey 11: 19 January 2017

37
Figure 33. Detection Positive Minutes from all C-PODs deployed during calibration trial 1 in the Shannon Estuary.
Figure 34. Detection Positive Minutes from all C-PODs deployed during calibration trial 2 in the Shannon Estuary.
0
20
40
60
80
100
120
140
160
C795 C1524 C796 C950 C549
TOTA
L D
PM
C-POD NUMBER
Calibration trial 1: Shannon Estuary (13 days)
0
50
100
150
200
250
c487 c169 c173 c172 c1147
TOTA
L D
PM
C-POD NUMBER
Calibration trial 2: Shannon Estuary (23 days)

38
Figure 35. Orthogonal regression plot of C-POD comparisons in calibration trial, in blue, with a null model where each unit performs exactly the same, in black and an acceptable error margin of ±20%, in grey from Calibration 1, January 2015.
Figure 36. Centipede plot of the intercept and slope values (±std), of the orthogonal regression plots, for each pod performance comparison in calibration trail 1 at Money Point, January 2015. Deviation from the red dotted lines, 0 on the intercept plot and 1 on the gradient plot, indicates deviation from the null model assuming no variation. Plot indicates that a greater extent of variation is found within the gradient values.
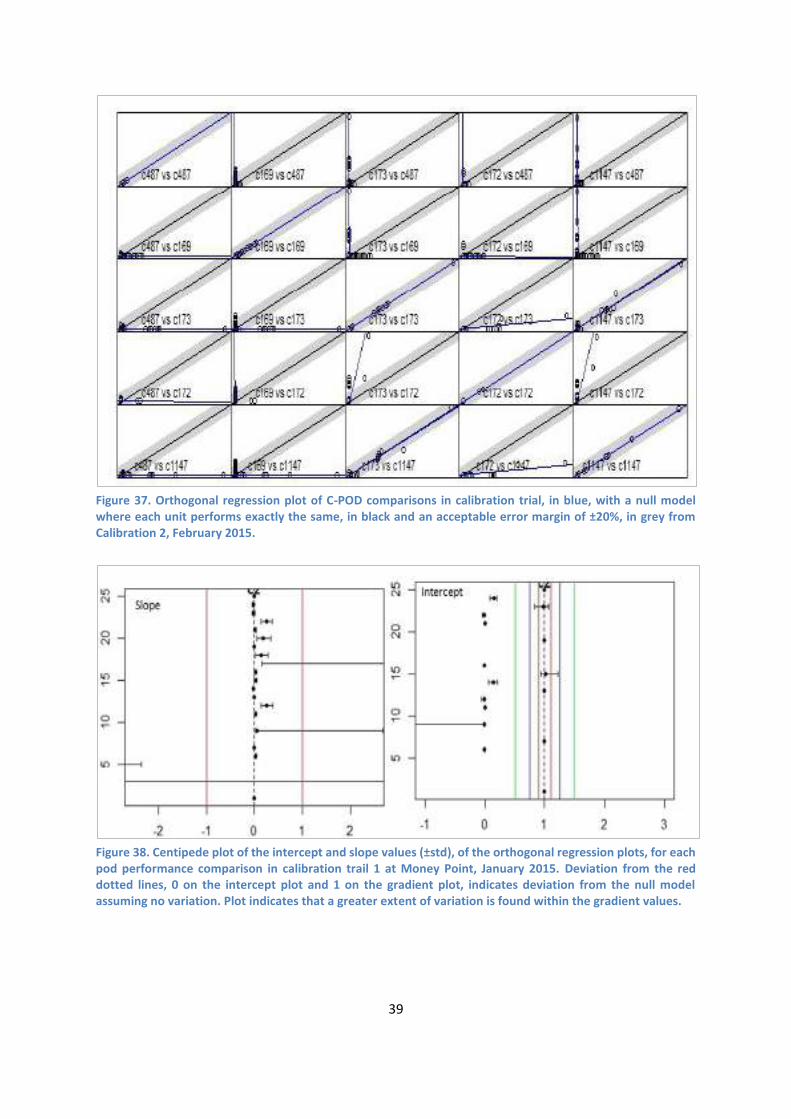
39
Figure 37. Orthogonal regression plot of C-POD comparisons in calibration trial, in blue, with a null model where each unit performs exactly the same, in black and an acceptable error margin of ±20%, in grey from Calibration 2, February 2015.
Figure 38. Centipede plot of the intercept and slope values (±std), of the orthogonal regression plots, for each pod performance comparison in calibration trail 1 at Money Point, January 2015. Deviation from the red dotted lines, 0 on the intercept plot and 1 on the gradient plot, indicates deviation from the null model assuming no variation. Plot indicates that a greater extent of variation is found within the gradient values.

40
3.3.2 Overview of SAM results
SAM using C-PODs was carried out at Portmarnock at three sites simultaneously for a duration of 750
days (between March 2015 and March 2017). The number of monitoring days at each site varied due
to a number of reasons but mainly interference with moorings and gear missing upon retrieval (Table
7). This did not impact significantly on the dataset as monitoring over such a long-term period ensured
enough replication was achieved across years and a range of factors which are thought to influence
presence. Detections were recorded 96-99% of days on average at each site (Table 7). The number of
Porpoise Positive Minutes (PPM) ranged from 3690 to 25089 per year, between sites, with mean
DPM/day ranging between 41.3 to 94.3 (Table 7; Figure 39). Very few dolphin detections were
recorded and most of those were determined to be false positives and therefore were not used for
analyses. A monitoring index was calculated as the mean number of detection positive minutes per
hour for porpoises (Table 7). This index can be compared across locations, or with results from
previous studies in Ireland and was used to compare the present dataset with that recorded in 2015
from Loughshinny, Co. Dublin (approx. 14 km north of the Portmarnock site).
Table 7. Summary of all deployments across 3 GDD sites from 2015 to 2017 (N=750 days).
Location Year No. of days monitored
No. of data days
Total PPM % PPDs Mean
DPM/Day Mean
DPM/hr %DPM
GDD1 2015 294 294 24728 98 84.1 3.5 5.8
2016 366 187 3680 94 20.6 0.81 1.4
2017 90 75 1443 95 19.2 0.80 1.3
Total 750 556 (74%) 29,851 x̅=96% 41.3 1.7 2.8
GDD2 2015 294 211 11396 97 54.0 2.3 3.8
2016 366 258 25089 99 97.2 4.1 6.7
2017 90 75 9894 99 131.9 5.5 9.2
Total 750 544 (72%) 46,379 x̅=98% 94.3 4.0 6.6
GDD3 2015 294 228 14486 100 63.5 2.6 4.4
2016 366 227 12820 99 56.5 2.4 3.9
2017 90 75 3960 97 52.8 2.2 3.7
Total 750 530 (71%) 31,266 x̅=99% 57.6 2.4 3.0

41
Figure 39. Porpoise Positive Minutes per day (PPMs) recorded each year across sites. The duration of sampling differed between years; days monitored in 2015 (294), days monitored in 2016 (366) and days monitored in 2017 (90).
3.3.2.1 Generalized linear mixed-effect model (GLMM) analyses
As this was a long-term study with monitoring taking place across three years and at three sites,
analyses using GLMM were used to assess differences between years and then at the completion of
the monitoring, data from all three years from each site were compiled and assessed as one long
dataset, allowing for a detailed assessment of fine scale use of the area.
3.3.2.2 GDD 1
GDD1 was the closest site to shore, approx. 2.5 km, and was the shallowest location at a depth of
5.1m. Results across years showed that each of the four factors (season, diel, tidal cycle and tidal
phase) were significant during 2015, while in 2016 only season and diel were found to be significant.
When all data were compiled, all factors were found to be significant (Table 8).
0
5000
10000
15000
20000
25000
30000
2015 2016 2017
Total Porpoise Positive Minutes (PPM) per year across sites
GDD1 GDD2 GDD3

42
Table 8. Results from GLMM’s per year and all data combined from GDD1.
Location Year Variable Χ2 df P-value
GDD1 2015
Season Diel T.P T.C
212.2 212.2 192.3 212.2
4 4 3 4
0.000 0.000 0.000 0.000
GDD1 2016
Season Diel T.P T.C
140.1 140.1 53.7 42.0
4 4 3 4
0.000 0.000
0.1 0.1
GDD1 2017
Season Diel T.P T.C
167.5 167.5 128.7 168.6
4 4 3 4
0.000 0.000 0.000 0.000
GDD all years combined
Season Diel T.P T.C
277.9 204.2 144.3 204.2
4 4 3 4
0.000 0.000 0.000 0.000
Data are presented as box plots, which help to visualise the results. In 2015, there were significantly
more detections at GDD1 during the autumn, winter and summer months when compared with spring
(χ2= 212, p<0.000). Significantly more detections were recorded during the hours of darkness and the
intermittent hours between dawn and dusk (χ2= 212.2, p<0.000), as well as during the tidal phase
spring (χ2= 192.3, p<0.000) and tidal cycle low (χ2= 212.2, p<0.000), Figure 40)).
Figure 40. Predicted proportion of detection positive hours, in the narrow band high frequency channel at GDD1 (Co. Dublin) Mar 2015-Dec 2015 across the four variables of season; diel, where D =day, E= evening, M= morning and N = night; tidal phase, where Trans.=transitional phase, NT= neap tide and ST=spring tide; and tidal cycle, where E =ebb, L = slack low, F= flood and H=slack high.

43
In 2016, season was found to be a significant factor again but detections in spring was found to be
significantly higher compared with 2015, where most detections were during the spring months (χ2=
140.1, p<0.000). Similarly to 2015, more detections were recorded during the hours of darkness and
the intermittent hours between dawn and dusk (χ2= 140.1, p<0.000), but tidal phase (χ2= 53.7, p=1.3)
and tidal cycle (χ2= 42.0, p=1.7) were not significant (Figure 41).
Figure 41. Predicted proportion of detection positive hours, in the narrow band high frequency channel at GDD1 (Co. Dublin) Jan - Dec 2016 across the four variables of season; diel, where D =day, E= evening, M= morning and N = night; tidal phase, where Trans.=transitional phase, NT= neap tide and ST=spring tide; and tidal cycle, where E =ebb, L = slack low, F= flood and H=slack high.
Monitoring only took place in 2017 between January and March but the data were still processed as
before with just two seasons, winter and spring. All factors were found to be significant (Table 8,
Figure 42).

44
Figure 42. Predicted proportion of detection positive hours, in the narrow band high frequency channel at GDD1 (Co. Dublin) Jan - Mar 2017 across the four variables of season; diel, where D =day, E= evening, M= morning and N = night; tidal phase, where Trans.=transitional phase, NT= neap tide and ST=spring tide; and tidal cycle, where E =ebb, L = slack low, F= flood and H=slack high.
The last analyses on data from GDD1 was to combine all dataset collected across the 556 days, which
showed that three of the four factors were significant. Significantly more detections occurred in
Autumn (χ2= 279.9, p<0.000), with most detections during the night and in morning hours (χ2= 204.2,
p<0.000), while significantly more detections were recorded at slack high tide (χ2= 168.6, p<0.000),
which is plausible given this site, is very shallow (Figure 43).
Figure 43. Predicted proportion of detection positive hours, in the narrow band high frequency channel at GDD1 (Co. Dublin), all days, Mar 2016 - Mar 2017 (556 days) across the four variables of season; diel, where D =day, E= evening, M= morning and N = night; tidal phase, where Trans.=transitional phase, NT= neap tide and ST=spring tide; and tidal cycle, where E =ebb, L = slack low, F= flood and H=slack high.

45
3.3.2.3 GDD 2
GDD2 was the middle site, approximately 1km from GDD1 and 1.5km from GDD3 and at a depth of
approximately 14m. Results (Table 9) show a lot of variability between years and across factors, but
when all years were combined it was evident that all factors except tidal phase were significant.
Table 9. Results from GLMM’s per year and all data combined from GDD2.
Location Year Variable Χ2 df P-value
GDD2 2015
Season Diel T.P T.C
371.5 371.5 38.3 458.4
4 4 3 4
0.000 0.000 0.2 0.000
GDD2 2016
Season Diel T.P T.C
80.4 80.4 21.1 29.2
4 4 3 4
0.000 0.000 0.1 0.000
GDD2 2017
Season Diel T.P T.C
164.4 164.4 53.7 170.6
4 4 3 4
0.000 0.000 0.1 0.000
GDD2 all years combined
Season Diel T.P T.C
105.5 760.5 144.3 59.9
4 4 3 4
0.000 0.000 0.3 0.000
Box plots below help visualise the results from GDD2 demonstrating there were significantly more
detections during the winter, autumn and summer months when compared with spring (χ2= 212,
p<0.000) in 2015, following similar trends to GDD1 but in the following year (2016). Significantly more
detections were recorded during the hours of darkness and the intermittent hours between dawn and
dusk (χ2= 212.2, p<0.000). Tidal cycle had significantly more detections during the flood tide, while no
significant trends were found for tidal phase (Figure 44).

46
Figure 44. Predicted proportion of detection positive hours, in the narrow band high frequency channel at GDD2 (Co. Dublin) Mar – Dec 2015 across the four variables of season; diel, where D =day, E= evening, M= morning and N = night; tidal phase, where Trans.=transitional phase, NT= neap tide and ST=spring tide; and tidal cycle, where E =ebb, L = slack low, F= flood and H=slack high.
At GDD2, results for 2016 showed season to be a significant factor, similar to results from GDD1 from
2015, with detections in spring significantly higher (χ2= 140.1, p<0.000). Similarly to 2015 across sites,
more detections were recorded during the hours of darkness and the intermittent hours between
dawn and dusk (χ2= 140.1, p<0.000), and during high tide (χ2= 29.2, p<0.000), with tidal phase having
no significant effect (χ2= 21.1, p=7.0; Figure 45).
Figure 45. Predicted proportion of detection positive hours, in the narrow band high frequency channel at GDD2 (Co. Dublin) Jan – Dec 2016 across the four variables of season; diel, where D =day, E= evening, M= morning and N = night; tidal phase, where Trans.=transitional phase, NT= neap tide and ST=spring tide; and tidal cycle, where E =ebb, L = slack low, F= flood and H=slack high.

47
At GDD2 in 2017, results showed all factors to be significant except tidal phase (Table 9; Figure 46).
Figure 46. Predicted proportion of detection positive hours, in the narrow band high frequency channel at GDD2 (Co. Dublin) Jan – Mar 2017 across the four variables of season; diel, where D =day, E= evening, M= morning and N = night; tidal phase, where Trans.=transitional phase, NT= neap tide and ST=spring tide; and tidal cycle, where E =ebb, L = slack low, F= flood and H=slack high.
As for GDD1, all data from GDD2 were combined across years for the 544 days monitored and results
showed that three of the four factors were significant. In this instance, significantly more detections
occurred during winter (χ2= 279.9, p<0.000), with most detections during the night and morning hours
(χ2= 204.2, p<0.000), while significantly more detections were recorded at slack high tide (χ2= 168.6,
p<0.000), which is plausible given this site, is very shallow (Figure 47).
Figure 47. Predicted proportion of detection positive hours, in the narrow band high frequency channel at GDD2 (Co. Dublin), March 2015 – Mar 2017 (544 days) across the four variables of season; diel, where D =day, E= evening, M= morning and N = night; tidal phase, where Trans.=transitional phase, NT= neap tide and ST=spring tide; and tidal cycle, where E =ebb, L = slack low, F= flood and H=slack high.

48
3.3.2.4 GDD 3
GDD3 was the furthest site offshore, 1.5km from GDD2, and 2.5km from GDD1 (5km from land) and
in a depth of approximately 24m. Similarly, for GDD3, the same analytical approach was followed and
results showed all factors to be significant in 2015, 2016 and 2017. It was clear that there was a lot of
variability between years and across factors (Table 10), but when all years were combined it was
evident that all factors except tidal cycle were significant at GDD3.
Table 10. Results from GLMM’s per year and all data combined from GDD3.
Location Year Variable Χ2 df P-value
GDD3 2015
Season Diel T.P T.C
30.5 30.5 30.4 16.4
4 4 3 4
0.000 0.000 0.000 0.000
GDD3 2016
Season Diel T.P T.C
119.4 119.4 43.9 29.9
4 4 3 4
0.000 0.000
1.0 0.000
GDD3 2017
Season Diel T.P T.C
279.0 340.0 26.3 38.3
4 4 3 4
0.000 0.000
1.3 0.000
GDD3 all years combined
Season Diel T.P T.C
105.5 760.5 144.3 59.9
4 4 3 4
0.000 0.000 0.000
3.0
For GDD3 2015, results showed significantly more detections occurred across spring, summer and
autumn when compared with winter. Although no significant difference was apparent in the box plot,
the Walds test showed significance existed (χ2= 30.5, p<0.000). Tidal phase and tidal cycle were also
significant although again not apparent from the diagram (Table 10, Figure 48).

49
Figure 48. Predicted proportion of detection positive hours, in the narrow band high frequency channel at GDD3 (Co. Dublin) Mar– Dec 2015 across the four variables of season; diel, where D =day, E= evening, M= morning and N = night; tidal phase, where Trans.=transitional phase, NT= neap tide and ST=spring tide; and tidal cycle, where E =ebb, L = slack low, F= flood and H=slack high.
GDD3 for 2016 showed similar results to GDD1 and 2 where season showed significantly more
detections during the spring and winter months (χ2= 119.4, p<0.000), and across diel cycle night and
morning (χ2= 119.4, p<0.000). Significantly, more detections were recorded during the neap phase of
the tide (χ2= 43.9, p<0.000), and during slack periods of the tidal cycle (χ2= 29.9, p<0.000; Figure 49).
Figure 49. Predicted proportion of detection positive hours, in the narrow band high frequency channel at GDD3 (Co. Dublin) Jan– Dec 2016 across the four variables of season; diel, where D =day, E= evening, M= morning and N = night; tidal phase, where Trans.=transitional phase, NT= neap tide and ST=spring tide; and tidal cycle, where E =ebb, L = slack low, F= flood and H=slack high.

50
At GDD3 in 2017, results showed all factors to be significant except tidal phase (Table 10; Figure 50),
and mirroring the results of GDD3 2016.
Figure 50. Predicted proportion of detection positive hours, in the narrow band high frequency channel at GDD3 (Co. Dublin) Jan – Mar 2017 across the four variables of season; diel, where D =day, E= evening, M= morning and N = night; tidal phase, where Trans.=transitional phase, NT= neap tide and ST=spring tide; and tidal cycle, where E =ebb, L = slack low, F= flood and H=slack high.
All GDD3 data across years were combined for the 530 days monitored at the site and results showed
that all four factors were significant. In this instance significantly more detections occurred in Autumn
(χ2= 279.1, p<0.000), with most detections during the night and morning hours (χ2= 340, p<0.000),
while significantly more detections were recorded the neap tidal phase (χ2= 65.5, p<0.000) at slack
high tide (χ2= 38.3, p<0.000; Figure 51).

51
Figure 51. Predicted proportion of detection positive hours, in the narrow band high frequency channel at GDD3 (Co. Dublin) all months, March 2015 to March 2017 across the four variables of season; diel, where D =day, E= evening, M= morning and N = night; tidal phase, where Trans.=transitional phase, NT= neap tide and ST=spring tide; and tidal cycle, where E =ebb, L = slack low, F= flood and H=slack high.
In summary, results across all days monitored at each of the sites showed harbour porpoise to be
present on average 98% of days monitored. The highest presence was detected across the autumn
and winter months, during the hours of darkness (incl. dawn and dusk), during high tide and at GDD3
during the neap cycle of the tidal phase (Table 11). The site with the highest overall detections was
GDD2.
Table 11. Significant results from the long-term dataset at each site (*no significance).
Significant factors GDD1 GDD2 GDD3
Season Autumn Winter Autumn
Diel Night Night Night
Tidal phase * * Neap
Tidal cycle High High High

52
DISCUSSION
A combination of visual and acoustic, land and boat-based methodologies has provided a very
detailed, high resolution assessment of the marine mammal community and its use of the site in line
with best international practice. Visual surveys provided information on species identification,
distribution and abundance and behaviour while acoustic data provided high resolution information
on the use of the site by harbour porpoise including diel, tidal and temporal patterns.
4.1 Visual surveys
Marine mammals were recorded on 100% of survey days demonstrating the importance of the area
for this important group of high nature conservation animals. Species recorded comprised of harbour
porpoise, grey seal, harbour seal and minke whale.
Harbour porpoise were recorded on 83% of land-based surveys and 100% of boat-based surveys.
Abundance was lowest from May to July, 2015 and from April to June, 2016. Harbour porpoise in Irish
waters move offshore during spring and early summer, which is believed to associated with calving
(Wall et al. 2013) and trends during the present study were consistent with this. Harbour porpoise
abundance increased between August and January 2015 and between August and October 2016.
Group size also increased during this period which coincided with a peak in sightings of young animals.
In the North Atlantic, harbour porpoise calves are born in mid to late summer (Rogan & Berrow, 1996,
Lockyer, 2003; Learmonth et al. 2014) and reliant on their mothers for 8-10 months (Learmonth et al.
2014). Female harbour porpoise may time calving so that high energetic demands such as lactation
coincides with the availability of seasonally abundant local prey (Learmonth et al. 2014). In Irish
waters, harbour porpoise feed primarily on fish with Trisopterus and gadoid species being important
(Rogan & Berrow 1996, IWDG 2009, Hernandez-Milian 2014). The peak in abundance of harbour
porpoise may therefore be attributed to the inshore movement of porpoise to feed on locally
abundant prey. The increase in group size recorded during this time is most likely due to the presence
of nursing calves.
The area has also been shown to be important for grey seals with individuals recorded on 100% of
land-based surveys and 91% of boat surveys. Sightings were highest in April 2015 which coincided with
the end of the male moulting season and January 2016 which coincided with the end of the female
moult (Kiely et al. 2000). High numbers were also recorded in September 2015, November 2015 and
October 2016 which spans the grey seal breeding and pupping season (Ó Cadhla, 2007). Sightings

53
largely consisted of single adults although two juveniles were recorded in September 2015 beside
Ireland’s Eye. Seals tended to occupy more westerly waters than the harbour porpoise and were often
seen following fishing boats, feeding and hauling out on Ireland’s Eye at low tide.
Few other marine mammal species were recorded. Although Lambay Island SAC is designated for both
grey seal and harbour seal, only two individual harbour seals were recorded during this study, one
each in April and August 2015. Two sightings of single minke whales were recorded during two boat-
surveys, one in June 2015 and one in August 2016. These records are similar to a previous study where
minke whales were recorded from late April to early August off north Co. Dublin (Wall et al. 2013).
4.1.1 Density and abundance for harbour porpoise
For seven of the eleven surveys carried out, the number of sightings were sufficient to derive density
and abundance estimates for harbour porpoise. Within the area surveyed, the density of harbour
porpoise varied from 0.61 to 2.29 harbour porpoise per km2, with a mean density of 1.32, which was
similar to previous surveys in the area (Table 12). Densities were lowest in April 2015 and February
2016, peaking in August 2015, November 2015 and August 2016, with lower but still relatively high
densities in October 2016 and January 2017.
Harbour porpoise densities were previously derived for two sites off Co Dublin in 2008 and for the
Rockabill to Dalkey Island SAC in 2013 and 2016. The area surveyed off North County Dublin was
similar to the area surveyed in the present study. Density estimates from North County Dublin in 2008
varied considerably but the highest density of porpoises recorded at any site in Ireland so far was
recorded at 6.93 porpoises per km2 in August 2008. However estimates during other surveys during
2008 were much lower, which resulted in an overall density estimate of 2.03 harbour porpoise per
km2.
Table 12. Density, abundance and group size estimates for harbour porpoise in North County Dublin
Location Year
Area
(km2)
Mean group
size
Density
(per km2)
Abundance ± SE
(95% CI)
CV Reference
Greater Dublin Drainage 2015-17 201 1.39 1.32 248 - This report
Rockabill to Dalkey Island SAC 2016 273 1.62 1.55 424±45 (335-536) 0.10 O’Brien and Berrow (2016)
Rockabill to Dalkey Island SAC 2013 273 1.47 1.44 391±25 (344-445) 0.06 Berrow and O’Brien (2013)
North County Dublin 2008 104 1.41 2.03 211±47 (137-327) 0.23 Berrow et al. (2008a)
Dublin Bay 2008 116 1.19 1.19 138±33 (86-221) 0.24 Berrow et al. (2008a)

54
If we use the average of the overall density estimates from 2008 for the two sites it equates to 1.61
which is higher but similar to the present survey. A previous wider-scale line-transect survey in the
north Irish Sea, to the east and north of the current SAC, derived a density estimate of 1.59±0.22
porpoises per km2 (Berrow et al. 2011). This was also of a similar magnitude to that calculated from
the present survey.
Density estimates within the Rockabill to Dalkey Island SAC were greater in 2016 than presented here
but only by 10-15% which suggests the present study area is very favourable for porpoise with
densities similar to those within an SAC. Indeed, there was remarkable consistency in density
estimates across all surveys carried out in North County Dublin since 2013 which were consistently
elevated compared to sites surveyed elsewhere in Ireland (Berrow et al. 2014).
Thus this survey has, despite quite considerable variability in density estimates, provided a mean
density very similar to previous studies. This density is high and emphasizes the importance of this site
for this species as these are some of the highest densities of harbour porpoise recorded to date in
Ireland.
4.2 Static Acoustic Monitoring
Cetaceans live in an acoustic world and increasingly attempts have been made to develop acoustic
monitoring techniques rather than relying on visual methods, where efficacy is dependent on light,
weather conditions and sea-state, especially for species such as the elusive harbour porpoise. Their
reliance on vocalisations for navigation and communication is essential and therefore acoustic
monitoring is a very valuable tool for determining presence and assessing fine-scale habitat use. The
main advantage of acoustic monitoring is that it can provide information on species that spend up
95% of the time underwater and thus can be difficult to observe (Read & Westgate 1995). Patterns of
cetacean presence have been described over seasonal scales (Canning et al. 2008, Bolt et al. 2009;
Simon et al. 2010, Gilles et al. 2011, O’Brien et al. 2013), diel cycles (Cox & Read 2004, Carlström 2005,
Todd et al. 2009, O’Brien et al. 2013) and tidal patterns (Marubini et al. 2009, O’Brien et al. 2013). In
order to evaluate the importance of an area, it is fundamental that the presence of small odontocetes
is fully understood and this requires monitoring over varying time scales. Although SAM can provide
a much more complex account of cetacean activity at a site in comparison to visual monitoring, it
cannot present accurate estimates of abundance for which visual surveys are required.

55
The aim of the present study was to produce a detailed assessment of the use of the site by marine
mammals and to provide baseline data. Cetacean occurrence in the general area was achieved
through visual surveys but detailed information on the use of the proposed route of the discharge
pipe off Portmarnock sites was achieved through static acoustic monitoring. The data collected at
Portmarnock was compared with the smaller dataset collected off Loughshinny, which was treated as
a control site and with other regional sites.
The acoustic data demonstrated that the all three sites monitored along the proposed route of the
outfall pipe off Portmarnock are used consistently by harbour porpoises on a daily basis. However,
presence was greater during autumn and winter, during hours of darkness and at slack high tides.
When the data from Portmarnock are compared to Loughshinny data collected in 2015 (Meade et al.
2015) results were similar with autumn having the highest detections, however, only six months were
monitored. Tidal cycle was not significant at Loughshinny in contrast to Portmarnock, where more
detections were recorded during spring tidal phase. Monitoring index at Loughshinny was high at
9.8%, while at Portmarnock values ranged between 2.8 and 6.6 across sites, suggesting Loughshinny
is the most important site monitored for harbour porpoise during the GDD project.
Trends in the presence of harbour porpoise with diel cycle on the east coast of Ireland have been
found to differ geographically, but they are consistently more active at night. The reasons for
increased nocturnal activity are uncertain but could be linked to an increase in prey abundance or
activity in the absence of light, as suggested by Todd et al. (2009).
The results from Portmarnock and Loughshinny are compared to other sites around Ireland (Table 13).
Some of the highest DPM’s recorded to date were from Loughshinny, especially given deployments
were only for six months. Some of the early studies used T-PODs, which are an earlier version of the
C-POD. Previous work by O’Brien et al. (2013) showed that C-PODs recorded on average, seven times
more data than T-PODs during simultaneous deployments in Galway Bay. However, it is clear that
deployments from the east coast have a greater number of detections per deployment from any other
monitored site in the country. Previous deployment off Howth Head recorded 12.2 DPM/hr, in
comparison to the present study with an average across sites of 2.7. However, the Howth deployment
was over a short duration using a T-POD. The Portmarnock dataset is similar to that at Spiddal in
Galway Bay with a similar number of deployment days. Galway Bay is not a designated SAC while the
Portmarnock area lies within the boundaries of the Rockabill to Dalkey SAC. When the present data is
compared with other deployments around Ireland, such as the Blasket Islands SAC, the number of
detections from Co. Dublin were still much greater.

56
Table 13. Monitoring results from SAM across Ireland (green line denotes data collection using T-PODs so some caution necessary when interpreting results.
County Site Total days
DPD
%
Total PPM
%DPM Mean DPM/day
Mean DPM/hr
Reference
Dublin GDD1 556 96 29,851 2.8 41.3 1.7 Present study
Dublin GDD2 544 98 46,379 6.6 94.3 4.0 Present study
Dublin GDD3 540 99 31,266 3.0 57.6 2.4 Present study
Dublin Loughshinny 189 100 26,281 9.6 137 5.8 Meade et al., 2015
Galway Spiddal 572 541 27,902 3.4 48.8 2.0 O'Brien et al., 2013
Kerry Inishtooskert 264 236 3930 1.04 14.9 0.6 O'Brien et al., 2013
Kerry Wild Bank 289 221 2097 0.51 7.3 0.3 O'Brien et al., 2013
Kerry The Gob 52 49 3015 4.1 58.0 2.4 O'Brien et al., 2013
Dublin Howth 47 100 13718 10.1 291.9 12.2 Berrow et al. (2008a)
Cork Castlepoint 63 100 1379 2.0 21.9 0.9 Berrow et al. (2008a)
Cork Sherkin 23 44 707 1.0 30.7 1.3 Berrow et al. (2008a)
Cork Galley Head 63 30 1614 2.4 25.6 1.1 Berrow et al. (2008a)
It is clear from both the visual and acoustic surveys that North County Dublin is an important area for
marine mammals, especially harbour porpoise. Marine mammals were present during 100% of visual
surveys although abundance did vary throughout the year. The site is also important for grey seals
which were recorded throughout the year. Grey seals can be sensitive to disturbance particularly
during the breeding season (Kiely et al. 2000), which occurs from August to December (O’Cadhla,
2007). The proposed outfall site is 8km to Lambay Island SAC which is the most important site for grey
seals on the east coast of Ireland (Kiely et al. 2000).
Harbour porpoise numbers increased in late summer during both 2015 and 2016 which coincided with
the presence of calves and may be due to seasonally abundant food sources such as sprat, herring and
Trisopterus and gadoid species. Reduced numbers were recorded during late spring/early summer
which may be associated with an offshore movement of this species before calving. The density
estimate of harbour porpoise was high and emphasizes the importance of this site for this species as
these are some of the highest densities recorded in Ireland to date. Acoustic monitoring provided an
insight into the habitat use of the site across time and diel and tidal cycles, which could not be
recorded from visual surveys. Harbour porpoise were present almost daily at the Portmarnock site,
with their presence influenced by seasonal, diel and tidal factors.

57
4.3 Recommendations
Harbour porpoises and grey seals, both of which are listed under Annex II of the Habitats Directive,
are entitled to strict protection including their habitat, and extreme care must be taken to ensure the
proposed development does not degrade this habitat or cause undue disturbance. These results will
serve to inform protocols of best practice if work goes ahead and thus ensure the presence of marine
mammals in the area is not negatively impacted upon.
Mitigation measures should take into account the acoustic disturbance of marine mammals at the site
and any associated noise input or long-term potential disturbance should be reviewed to minimise
displacement and to prevent habitat exclusion or hearing impacts such TTS or PTS. Mitigation
measures should be in accordance with the NPWS document “Guidance to Manage the Risk to Marine
Mammals from Man-made Sound Sources in Irish Waters” to ensure impacts through habitat exclusion
or noise impacts are minimised. In order to assess if any displacement of harbour porpoise occurs, we
recommend acoustic monitoring is carried out at a control site such as the Loughshinny site during
and after installation works, with additional monitoring close to the actual outfall point post
construction.

58
ACKNOWLEDGEMENTS
We would like to thank skipper Jeff Brownlee and crew of the MV Beluga who have been extremely
helpful during the boat-based surveys. Thanks to TechWorks Marine for maintaining the SAM
moorings and carrying out CPOD deployments and retrievals. Thanks also to the IWDG survey team
Darren Craig, Clodagh Russell, Hannah Keogh, Laura Kavanagh, Meadhbh Quinn, Stephanie Levesque,
Michael Marrinan, Isabel Baker and Gary Kett for contributing to land and boat surveys.
REFERENCES
Akamatsu, T., Wang, D., Wang, K., Li, S. and Dong, S., 2010. Scanning sonar of rolling porpoises during prey capture dives. Journal of Experimental Biology, 213 (1), pp.146-152.
Berrow, S.D. and O’Brien, J., 2013. Harbour porpoise surveys in Rockabill to Dalkey Island SAC, 2013. Report to the National Parks and Wildlife Service. Irish Whale and Dolphin Group, pp. 37.
Berrow, S.D., Hickey, R., O’Brien, J. O’Connor, I. and McGrath, D., 2008a. Harbour Porpoise Survey 2008. Report to the National Parks and Wildlife Service. Irish Whale and Dolphin Group, pp. 31.
Berrow, S.D., Hickey, R., O’Connor, I. and McGrath, D., 2008b. Small Cetacean Site Investigations Survey 2008. Report to the National Parks and Wildlife Service. Irish Whale and Dolphin Group, pp. 25.
Berrow, S.D., Hickey, R., O'Connor, I. and McGrath, D., 2014. Density estimates of harbour porpoises phocoena phocoena at eight coastal sites in Ireland. In Biology and Environment: Proceedings of the Royal Irish Academy, 114 (1), pp. 19-34.
Berrow, S.D., O’Brien, J., O’Connor, I. and McGrath, D., 2009. Abundance estimate and acoustic monitoring of harbour porpoise Phocoena phocoena in the Blasket Islands candidate Special Area of Conservation. Biology and Environment, Proceeding of the Royal Irish Academy, pp. 35-46.
Berrow, S.D., Whooley, P., O’Connell, M. and Wall, D., 2010. Irish Cetacean Review (2000-2009). Irish Whale and Dolphin Group, pp. 60.
Bolt, H.E., Harvey, P.V., Mandleberg, L. and Foote, A., 2009. Occurrence of killer whales in Scottish inshore waters: temporal and spatial patterns relative to the distribution of declining harbour seal populations. Aquatic Conservation: Marine and Freshwater Ecosystems, 19 (6), pp. 671-675.
Buckland, S.T., Anderson, D.R., Burnham, K.P., Laake, J.L., Borchers, D.L. and Thomas, L., 2001. An Introduction to Distance Sampling: Estimating abundance of biological populations. Oxford University Press, Oxford, UK.

59
Canning, S.J., Santos, M.B., Reid, R.J., Evans, P.G., Sabin, R.C., Bailey, N. and Pierce, G.J., 2008. Seasonal distribution of white-beaked dolphins (Lagenorhynchus albirostris) in UK waters with new information on diet and habitat use. Journal of the Marine Biological Association of the UK, 88 (06), pp. 1159-1166.
Carlström, J., 2005. Diel variation in echolocation behavior of wild harbor porpoises. Marine Mammal Science, 21 (1), pp. 1-12.
Clarke, R., 1982. An index of sighting conditions for surveys of whales and dolphins. Report of the International Whaling Commission, 32, pp. 559-561.
Cox, T.M., Read, A.J., Solow, A. and Tregenza, N., 2001. Will harbour porpoises (Phocoena phocoena) habituate to pingers?. Journal of Cetacean Research and Management, 3 (1), pp. 81-86.
David, L., 2002. Disturbance to Mediterranean cetaceans caused by vessel traffic. Report prepared for the ACCOBAMS Secretariat, Monaco, pp. 21.
Dawson, S., Wade, P., Slooten, E. and Barlow, J., 2008. Design and field methods for sighting surveys of cetaceans in coastal and riverine habitats. Mammal Review, 38 (1), pp. 19-49.
Evans, P.G. and Hammond, P.S., 2004. Monitoring cetaceans in European waters. Mammal review, 34 (1‐2), pp. 131-156.
Gilles, A., Adler, S., Kaschner, K., Scheidat, M. and Siebert, U., 2011. Modelling harbour porpoise seasonal density as a function of the German Bight environment: implications for management. Endangered species research, 14 (2), pp. 157-169.
Hernandez-Milian, G. 2014. Trophic role of small cetaceans and seals in Irish waters. Ph.D. thesis, University College Cork, Cork, Ireland, pp. 402.
Herzing, D.L., 2000. Acoustics and social behavior of wild dolphins: implications for a sound society. In Hearing by whales and dolphins, Springer New York, pp. 225-272.
IWDG (2009) Muc Mhara – Ireland’s smallest whale. Proceedings of the 2nd Irish Whale and Dolphin Group International Whale Conference (Eds. Berrow, S.D. and Deegan, B.) 19th -21st September 2008, Killiney, Co. Dublin.
Kiely, O., Lidgard, D.C., McKibben, M., Baines, M.E. & Connolly, N., 2000. Grey Seals: Status and Monitoring in the Irish & Celtic Seas. Maritime Ireland/Wales INTERREG report No. 3. Marine Institute, 80 Harcourt St., Dublin.
Koschinski, S., Diederichs, A. and Amundin, M., 2008. Click train patterns of free-ranging harbour porpoises acquired using T-PODs may be useful as indicators of their behaviour. J. Cetacean Res. Manage, 10 (2), pp. 147-155.
Learmonth, J.A., Murphy, S., Luque, P.L., Reid, R.J., Patterson, I.A.P., Brownlow, A., Ross, H.M., Barley, J.P., Begona Santos, M. and Pierce, G.J., 2014. Life history of harbor porpoises (Phocoena phocoena) in Scottish (UK) waters. Marine Mammal Science, 30 (4), pp. 1427-1455.

60
Leeney, R.H., Carslake, D. and Elwen, S.H., 2011. Using static acoustic monitoring to describe echolocation behaviour of Heaviside's dolphins (Cephalorhynchus heavisidii) in Namibia. Aquatic Mammals, 37 (2), pp. 151.
Lockyer, C., 2003. Harbour porpoises (Phocoena phocoena) in the North Atlantic: Biological parameters. NAMMCO Scientific Publications, 5, pp. 71-89.
Mann, J., 1999. Behavioral sampling methods for cetaceans: a review and critique. Marine mammal science, 15 (1), pp. 102-122.
Marubini, F., Gimona, A., Evans, P.G., Wright, P.J. and Pierce, G.J., 2009. Habitat preferences and interannual variability in occurrence of the harbour porpoise Phocoena phocoena off northwest Scotland. Marine Ecology Progress Series, 381, pp. 297-310.
Meade, R., O’Brien, J. and Berrow, S., 2016. Greater Dublin Drainage Marine Mammal Monitoring: Loughshinny. Final report to Jacobs Engineering by IWDG Consulting, pp. 36.
Miller, L.A., Pristed, J., Møshl, B. and Surlykke, A., 1995. The click‐sounds of narwhals (Monodon monoceros) in Inglefield bay, northwest Greenland. Marine Mammal Science, 11 (4), pp. 491-502.
Ó Cadhla, O., Keena, T., Strong, D., Duck, C. and Hiby, L., 2013. Monitoring of the breeding population of grey seals in Ireland, 2009 - 2012. Irish Wildlife Manuals, No. 74. National Parks and Wildlife Service, Department of the Arts, Heritage and the Gaeltacht, Dublin, Ireland, pp. 18.
Ó Cadhla, O., Strong, D., O’Keeffe, C., Coleman, M., Cronin, M., Duck, C., Murray, T., Dower, P., Nairn, R., Murphy, P., Smiddy, P., Saich, C., Lyons, D. & Hiby, A.R., 2008. An assessment of the breeding population of grey seals in the Republic of Ireland, 2005. Irish Wildlife Manuals No. 34. National Parks & Wildlife Service, Department of the Environment, Heritage and Local Government, Dublin, Ireland, pp. 60.
O’Brien, J. and Berrow, S.D., 2015. Harbour porpoise surveys in Roaringwater Bay and Islands SAC, 2015. Report to the National Parks and Wildlife Service, Department of Arts, Heritage and the Gaeltacht. Irish Whale and Dolphin Group. pp. 43.
O’Brien, J. and Berrow, S.D., 2016. Harbour porpoise surveys in Rockabill to Dalkey Island SAC, 2016. Report to the National Parks and Wildlife Service, Department of Arts, Heritage, Regional, Rural and Gaeltacht Affairs. Irish Whale and Dolphin Group. pp. 23.
O’Brien, J., Beck, S., Wall, D., Pierini, A., and Hansen, S., 2013. Marine Mammals and Megafauna in Irish Waters, behaviour, distribution and habitat use. Work Package 2: Developing Acoustic Monitoring Techniques. PReCAST Final Report – Marine Research Sub-programme 2007-2013, pp 1-205.
Palka, D., 1996. Effects of Beaufort sea state on the sightability of harbor porpoises in the Gulf of Maine. Report of the International Whaling Commission, 46, pp. 575-582.
Read, A.J. and Westgate, A.J., 1997. Monitoring the movements of harbour porpoises (Phocoena phocoena) with satellite telemetry. Marine Biology, 130 (2), pp. 315-322.

61
Rogan, E. and Berrow, S.D., 1996. A review of harbour porpoises. Phocoena phocoena, in Irish waters. Report of the International Whaling Commission, 46, pp. 595-606.
Ryan, C., Berrow, S.D., Pierini, A., O‘Brien, J., O’Connor, I. and McGrath, D., 2010. Inshore Boat-based Surveys for Cetaceans. Report to the National Parks and Wildlife Service. Irish Whale and Dolphin Group, pp. 33.
Simon, M., Nuuttila, H., Reyes-Zamudio, M.M., Ugarte, F., Verfub, U. and Evans, P.G., 2010. Passive acoustic monitoring of bottlenose dolphin and harbour porpoise, in Cardigan Bay, Wales, with implications for habitat use and partitioning. Journal of the Marine Biological Association of the United Kingdom, 90 (08), pp. 1539-1545.
Teilmann, J., 2003. Influence of sea state on density estimates of harbour porpoises (Phocoena phocoena). Journal of Cetacean Research and Management, 5 (1), pp. 85-92.
Todd, V.L.G., Pearse, W.D., Tregenza, N., Lepper, P.A. and Todd, I.B., 2009. Diel echolocation activity of harbour porpoises (Phocoena phocoena) around the North Sea offshore gas installations. ICES Journal of Marine Science 66 (4) pp. 734-745.
Villadsgaard, A., Wahlberg, M. and Tougaard, J., 2007. Echolocation signals of wild harbour porpoises, Phocoena phocoena. Journal of Experimental Biology, 210 (1), pp. 56-64.
Wahlberg, M., 2002. The acoustic behaviour of diving sperm whales observed with a hydrophone array. Journal of Experimental Marine Biology and Ecology, 281 (1), pp. 53-62.
Wall D., Murray C., O'Brien J., Kavanagh L., Wilson C., Ryan C., Glanville B., Williams D., Enlander I., O'Connor I., McGrath D., Whooley P. and Berrow S., 2013. Atlas of the distribution and relative abundance of marine mammals in Irish offshore waters 2005 - 2011. Irish Whale and Dolphin Group, Merchants Quay, Kilrush, Co Clare. ISBN 0-9540552-7-6.
Young, R.F. and Peace, S., 1999. Using simultaneous counts by independent observers to correct for observer variability and missed sightings in a shore-based survey of bottlenose dolphins, Tursiops truncatus. J. Cetacean Res. Manage, 1 (3), pp. 279-287.

62
APPENDIX – Results from the Loughshinny Marine Mammal Surveys
5.1 Land-based Observations
Land-based monitoring commenced on 18 March and finished on 7 September 2015. Twenty hours of
monitoring was conducted over six surveys throughout the monitoring period (Table 14).
5.1.1 Environment
The weather was favourable throughout the surveys with no swell, sea state ≤2and visibility of 6-
20km. Precipitation was recorded on two days in July and September. On 13 July, rain was recorded
for 39% of the survey. Thirty one (31%) of the rain was recorded as light intermittent and eight (8%)
was recorded as heavy. On 07 September, light intermittent rain was recorded for 13% of the survey
(Table 14).
Table 14. Environmental conditions recorded during the Loughshinny land-based surveys
Date Sea state
(predominant)
Swell
(m)
Visibility
(km)
Cloud cover
(*/8)
Precipitation
(%)
Precipitation
Intensity 18 March 1 0 6-10 0 0 -
21 April 1 0 16-20 0 0 -
23 May 1 0 16-20 7 0 -
13 July 2 0 16-20 8 46 Light intermittent
12 August 1 0 16-20 2 0 -
7 September 1 0 16-20 8 13 Light intermittent
5.1.2 Marine Mammal Sightings
Marine mammals were sighted on 86% of land-based survey days. Two marine mammal species were
recorded; harbour porpoise and grey seal. Harbour porpoise were present on 67% of days with a peak
in numbers recorded in September (Figure 52, Figure 53). Two harbour porpoise calves were recorded
during the September survey. Seal species were present on 67% of days (Figure 54, Figure 55). All seal
sightings were of adult individuals and consisted of 10 grey seals and two unidentified seal species.

63
Figure 52. Number of harbour sightings and individuals recorded during Loughshinny land-based surveys
Figure 53. Distribution and group size of harbour porpoise sightings off Loughshinny
0
2
4
6
8
10
12
14
Harbour porpoise (sightings) Harbour porpoise (individuals)

64
Figure 54. Number of seal sightings recorded during Loughshinny land-based surveys (all single adults)
Figure 55. Distribution of seal sightings off Loughshinny
0
1
2
3
4
Seal sp. (sightings)

65
Table 15. Summary of Loughshinny land-based marine mammal surveys showing percentage sea state during survey.
Date
Sea state
(% of total survey time)
Number of harbour porpoise sightings
Number of seal
sightings
Number of harbour porpoise
individuals
Number of seal
individuals
0 1 2 3
18 March 0 66 33 0 2 5 2 5
21 April 0 100 0 0 0 2 0 2 23 May 40 60 0 0 3 1 4 1 14 July 0 8 92 0 0 0 0 0 12 August 31 69 0 0 3 0 3 0 7 September 7 93 0 0 3 4 14* 4
Total 11 12 23 12
*includes 2 calves
5.1.2.1 Focal Follow Observations
Two focal follows were obtained over two days in March and May. During March, a single adult
harbour porpoise was tracked with every behaviour recorded for a total of 18 minutes and in May, an
individual adult harbour porpoise was followed for 26 minutes (Figure 56).
Figure 56. Focal follow tracks of single harbour porpoise during March and May 2015 from Loughshinny land-based site

66
5.2 Boat-based Surveys
A boat-based survey was attempted on 19 March but fog prevented the vessel from leaving Dun
Laoghaire harbour. Three successful surveys were carried out on 20 April, 10 June and 11 August 2015.
5.2.1 Environment
Environmental conditions were generally favourable with the exception of the June survey (Table 16)
which although 64% of effort was within the targeted sea state (≤2), was not ideal for detecting
harbour porpoises. Weather forecasts for the day consistently reported light winds of 5-7kts from NE
for the survey day and minimal swell. We experienced 10 and up to 14kts during the survey with an
occasional moderate swell. Even during the survey the forecasts checked (at least three independent
forecasts) stated light winds however sea-state was greater than predicted. These local variations
have been experienced before during IWDG surveys at this location (e.g. Berrow and O’Brien 2013).
Table 16. Environmental conditions recorded during boat-based marine mammals surveys
Date Sea state (%) Predominant swell
(m) Predominant visibility
(km) 0 1 2 3
20 April 0 27 65 8 1 16-20 10 June 0 14 50 36 0 16-20 11 August 17 63 20 0 0 16-20
5.2.2 Marine Mammal Sightings
Marine mammals were sighted on 100% of survey days (Table 17). Four marine mammal species were
recorded during the survey period; harbour porpoise, grey seal, harbour seal and minke whale (Figure
57, Figure 58, Figure 59). All sightings were of adults with the exception of the August survey where
four juvenile harbour porpoise and one calf were recorded.
Table 17. Summary of boat-based marine mammal surveys covering Loughshinny in 2015
Date
No. of harbour porpoise sightings
No. of seal sightings
No. of harbour porpoise
individuals
No. of seal individuals
No. of other marine mammals
20 April 11 2 15 2 0 10 June 3 1 3 1 1 (minke whale) 11 August 20 2 37 2 0 Total 34 5 55 5

67
Figure 57. Map of transect line and marine mammal sightings for April 2015 boat-based survey

68
Figure 58. Map of transect line and marine mammal sightings for June 2015 boat-based survey

69
Figure 59. Map of transect line and marine mammal sightings for August 2015 boat-based survey

70
5.2.2.1 Density and abundance estimation
Density estimates for harbour porpoises calculated for two of the three survey days and not for survey
two as the number of sightings (n=5) were too few to derive a reliable density estimate. The detection
functions for harbour porpoise during all surveys are shown graphically (Figure 60). Using the Chi-
squared test for goodness of fit to the DISTANCE model data for the first survey were poor (P=0.92)
but for survey 2 better (P=0.62).
Evasive reactions of porpoises from the survey vessel were most evident on survey 1, with a peak in
sightings some 50-100m from the track-line (Figure 60), most likely resulting in an underestimate of
animal density. Variation in cluster size was greater during the first survey which contributed a greater
proportion of the variability.
Mean group (cluster) size was greater on survey 3 (1.85±0.20) compared to survey 1 (1.44±0.27)
suggesting a trend of increasing group size with time which was consistent with land-based
observations.
Table 18. Model data used in the harbour porpoise abundance and density estimation process for the Greater Dublin Drainage project(Note: A half-normal model with cosine series adjustments and sightings data truncated at 200m for Survey 1 and 300m for Survey 2 and Overall analysis was used).
Sample
Day
Chi2
P value
Effective Strip
Width (m)
Number of sightings
Mean Cluster size
± SE Variability (%)
Detection Encounter Cluster
1
0.924
104.65
11
1.44±0.27
67.6
-
32.4
3 0.602 148.78 20 1.85±0.20 84.1 - 15.9
Overall
0.811
144.2
31
1.68±0.15
38.3
55.0
6.7
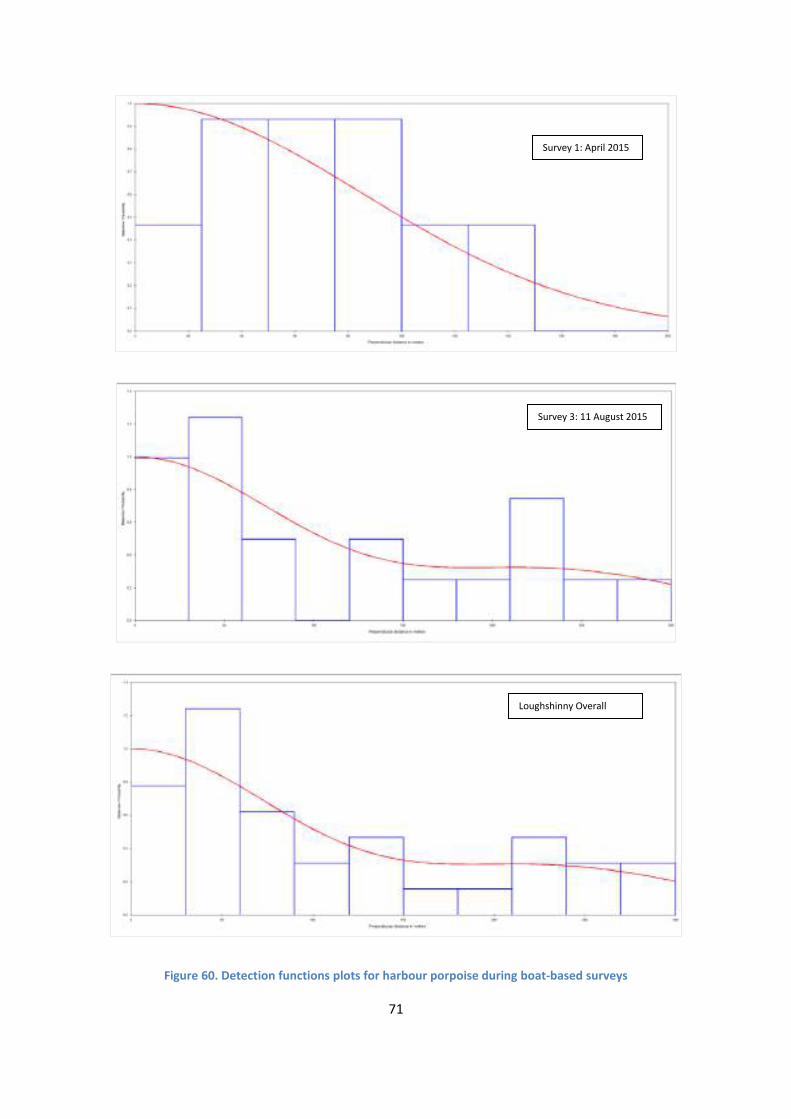
71
Figure 60. Detection functions plots for harbour porpoise during boat-based surveys
Survey 1: April 2015
Survey 3: 11 August 2015
Loughshinny Overall

72
Density and abundance estimates for harbour porpoise in the Rockabill to Dalkey Island SAC are shown
in Table 19. The density estimates were quite different between surveys with highest densities on
survey 3 correlating with the survey with the greatest number of sightings as the track length and area
surveyed were the same. This produced an overall abundance estimate of 256±93 porpoises with 95%
Confidence Intervals of between 87-751 porpoises and a CV of 0.37.
Table 19. Estimated density, abundance (N) and group sizes of harbour porpoise recorded for the Greater Dublin Drainage project
Sample
Day
N
(95% CI)
SE CV
Density
(per km2)
Mean group size
(95% CI)
1 154 (77-306) 54 0.33 0.78 1.44 (1.00-2.12)
3 361 (192-681) 114 0.32 1.91 1.85 (1.48-2.30)
Overall1 256 (87-751) 93 0.37 1.31 1.67 (1.39-2.01)
1 – includes combined sightings and effort data from both surveys
5.3 Static Acoustic Monitoring
5.3.1 C-POD Calibrations
All units used over the duration of the present study were calibrated as part the long-term GDD
monitoring project (Loughshinny and Portmarnock). Results of both trials are presented below (Figure
61-66). From the calibration trials, results showed that there were some discrepancies between units.
Further exploration into individual unit performance showed that C-POD performance was within the
acceptable error margin of ±20% DPM per hour (Figure 63-Figure 66) and therefore no correction
factor was required to be applied to the data to make it comparable (O’Brien et al. 2013). During
analysis of the long-term dataset, differences in sensitivities between units is accounted for by
inserting the C-POD number as a random factor when running the generalized linear mixed-effect
models.
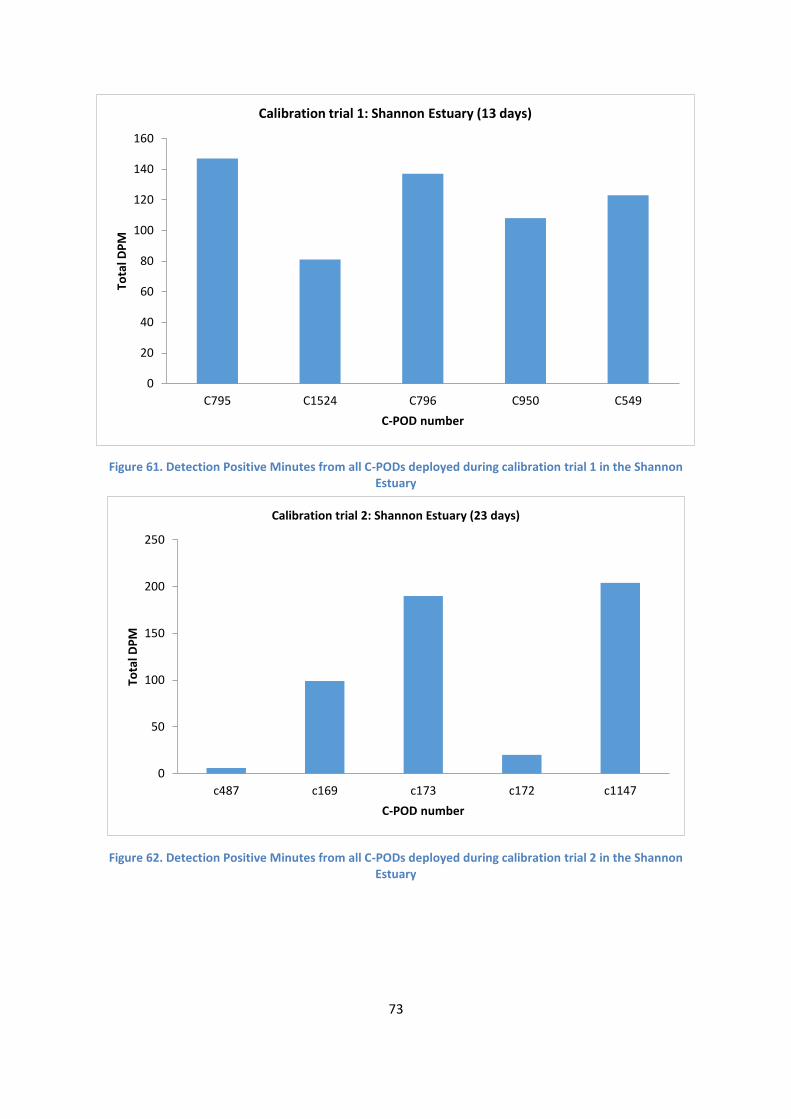
73
Figure 61. Detection Positive Minutes from all C-PODs deployed during calibration trial 1 in the Shannon Estuary
Figure 62. Detection Positive Minutes from all C-PODs deployed during calibration trial 2 in the Shannon Estuary
0
20
40
60
80
100
120
140
160
C795 C1524 C796 C950 C549
Tota
l DP
M
C-POD number
Calibration trial 1: Shannon Estuary (13 days)
0
50
100
150
200
250
c487 c169 c173 c172 c1147
Tota
l DP
M
C-POD number
Calibration trial 2: Shannon Estuary (23 days)

74
Figure 63. Orthogonal regression plot of C-POD comparisons in calibration trial, in blue, with a null model where each unit performs exactly the same, in black and an acceptable error margin of ±20%, in grey from Calibration 1, January 2015
Figure 64. Centipede plot of the intercept and slope values (±std), of the orthogonal regression plots, for each pod performance comparison in calibration trail 1 at Money Point, January 2015.Deviation from the red dotted lines, 0 on the intercept plot and 1 on the gradient plot, indicates deviation from the null model assuming no variation. Plot indicates that a greater extent of variation is found within the gradient values

75
Figure 65. Orthogonal regression plot of C-POD comparisons in calibration trial, in blue, with a null model where each unit performs exactly the same, in black and an acceptable error margin of ±20%, in grey from Calibration 2, February 2015
Figure 66. Centipede plot of the intercept and slope values (±std), of the orthogonal regression plots, for each pod performance comparison in calibration trail 1 at Money Point, January 2015.Deviation from the red dotted lines, 0 on the intercept plot and 1 on the gradient plot, indicates deviation from the null model assuming no variation. Plot indicates that a greater extent of variation is found within the gradient values

76
5.3.2 Static Acoustic Monitoring
Static Acoustic Monitoring using C-PODs was carried out at Loughshinny for a total of 189 days.
Detections were recorded on 100% of days (Table 20). The number of Porpoise Positive Minutes (PPM)
ranged from 8 to 475 per day with a mean of 139 PPM (Figure 67). Very few dolphin detections were
recorded and those that were determined to be false positives. A monitoring index of the mean
number of detection positive minutes per hour for porpoises was generated (Table 20). This unit of
measurement can be compared across locations, or with results from previous studies that have taken
place. This index will serve as a means to compare Loughshinny with the similar data derived from
Portmarnock as part of the current study but additionally facilitate comparison with other sites
regionally.
Table 20. Deployment summary from Loughshinny
Location No of days
Dates CPOD PPM % days
detected Mean
DPM/Day Mean
DPM/hr %DPM
Loughshinny
90
13 Mar-10 Jun
c950
7893
100
87.7
3.7
6.1
Loughshinny 99 10 Jun-16 Sep c487 18388 100 185.8 7.7 12.9
TOTAL 189 26281 100 137 5.8 9.6
Figure 67. Porpoise Positive Minutes per dat (PPMs) recorded over the deployment period (March to September (139 days)).

77
5.3.2.1 Generalized linear mixed-effect model (GLMM) analyses
Results from the generalized linear mixed-effect model (GLMM) analyses (Figure 68) showed that
season had a significant effect on the presence of porpoises at the site. A significant peak in porpoise
detections was recorded during the autumn (χ2= 174.5, p<0.000). Most porpoise detections were
recorded during the diel phase morning, and from the raw data this peak can be seen during the early
morning (χ2= 174.5, p<0.000) showing they are more active at the site during night-time and early
morning hours. Tidal cycle was not found to be a significant factor in the presence of porpoises off
Loughshinny (χ2= 5.3, p<0.2) but tidal phase was, with significantly more detection recorded during
spring cycles (χ2= 9.2, p<0.02). The box plots below show the distribution of the data or each of the
variables, with the usual box plot format, representing the median, quartiles and outliers.
Figure 68. Predicted proportion of detection positive hours, in the narrow band high frequency channel at Loughshinny (Co. Dublin) Mar-Sept, 2015 across the four variables of season; diel, where D =day, E= evening, M= morning and N = night; tidal phase, where Trans.=transitional phase, NT= neap tide and ST=spring tide; and tidal cycle, where E =ebb, L = slack low, F= flood and H=slack high.

78
5.3.3 Assessment of usage of the site
Feeding buzzes and click bursts have been described in many odontocete species (Herzing, 2000;
bottlenose dolphin; Miller et al., 1995; narwhal, Leeney et al., 2011; Heaviside’s dolphin). Variation in
ICI has been used as an indicator of certain behaviours in cetaceans (Wahlberg, 2002; Carlström, 2005;
Koschinski et al., 2008; Akamastu et al, 2010; and Leeney et al., 2011). The minimum ICI (MinICI) has
been deemed the most appropriate value as the software often splits trains when the ICI is long
(Carlström, 2005). This has been employed in recent cetacean studies using T-PODs (Todd et al., 2009;
and Leeney et al., 2011). Carlström (2005) deemed a MinICI of less than 10ms (MinICI<10ms) to be an
appropriate identification of probable foraging, based on the shape of frequency distribution graphs
generated from the mean of the distribution of the MinICIs.
A total of 100,421 NBHF click trains were recorded at Loughshinny over the 6 month deployment. The
average number of clicks per train was 13.5, with on average 131 clicks recorded per second, and with
an average frequency of 128.1 kHz across all deployments. Click trains were classified into two
categories based on the data presented above, where the category foraging was applied to trains with
MinICI<10ms. All other trains were defined as “Other” as no definite behaviour category could be
attributed. Results showed 95% (95,509 trains) of the total click trains recorded fell under the category
foraging, highlighting Loughshinny as a very important feeding site. Modelling of the dataset according
to the factors as previously done was not repeated given that 95% of trains were classed as foraging,
showing that porpoises present at Loughshinny are feeding and more significantly during the times of
night and morning, during the autumn and spring tidal cycle.
Table 21. Train details from porpoise detections at Loughshinny, Co. Dublin
No of trains Foraging Other Min frequency Max Frequency clx per train
100421 95509 4911 124 132.4 13
5.4 Discussion
Despite the poor summer weather experienced during 2015, we successfully carried out this survey in
favourable conditions. Only one boat-based survey was compromised with around 40% of effort above
that stated in the contract. Although conducted over only over a relatively short duration the results
do provide an insight into the use of the area by marine mammals and demonstrate its importance
for harbour porpoise.

79
Although limited observations were made there was evidence of an increase in use of the site through
the survey period peaking in September. A notable observation included a large group of 14 harbour
porpoise in early September. This group contained two calves and was the only sighting of calves
during the land-based surveys. Berrow and O'Brien (2013) showed a similar pattern of harbour
porpoise numbers and group size increasing off North Co. Dublin in late August. No marine mammals
were recorded during the July land-based survey, probably largely due to the sea state ≤2 for 92% of
the sampling which could decrease the likelihood of sightings. Two focal follows of harbour porpoise
were carried out in March and May for 18 minutes and 26 minutes respectively. During focal follows,
harbour porpoise were tracked swimming in tidal currents. This and the presence of feeding gulls
suggests that these individuals were foraging in the area.
For two of the three boat surveys carried out, the number of sightings were sufficient to derive density
and abundance estimates. The track-lines surveyed an area to the south and a lesser extent to the
north of the Loughshinny site. It is important to try and obtain as many sightings as possible to derive
robust density estimates. During the two surveys analysed track-lines were 78 and 75km in length and
sightings numbered a total of 11 and 20 respectively.
Within the area surveyed the number of sightings of harbour porpoise per survey varied considerably
but the overall density estimate was quite consistent, to previous surveys in the area (Table 22).
Harbour porpoise density estimates were previously generated for two Dublin sites in 2008 and for
Rockabill to Dalkey Island SAC in 2013. North County Dublin was similar to the area surveyed in the
present study. Density estimates in North County Dublin in 2008 varied very considerably and the
highest density of porpoises recorded at any site in Ireland so far was recorded in August 2008 (i.e.,
6.93 porpoises per km2). However other individual survey estimates during 2008 were much lower, so
this single survey had a strong influence on the overall pooled density estimate of 2.03 animals per
km2.
If we take the average of the overall density estimates in 2008 for the two sites it equates to 1.61
which is quite similar to 1.31 porpoises per km2 from the present survey. The CV of the present density
estimate is high (CV=0.32) compared to the other surveys but this was based on only two survey days
while all others used data from six survey days. A previous wider-scale line-transect survey in the north
Irish Sea, to the east and north of the current SAC, delivered a density estimate of 1.59±0.22 porpoises
per km2 (Berrow et al. 2011). This was also of a similar magnitude to that derived from the present
survey. These density estimates are some the highest recorded anywhere in Ireland (Berrow et al.
2014).
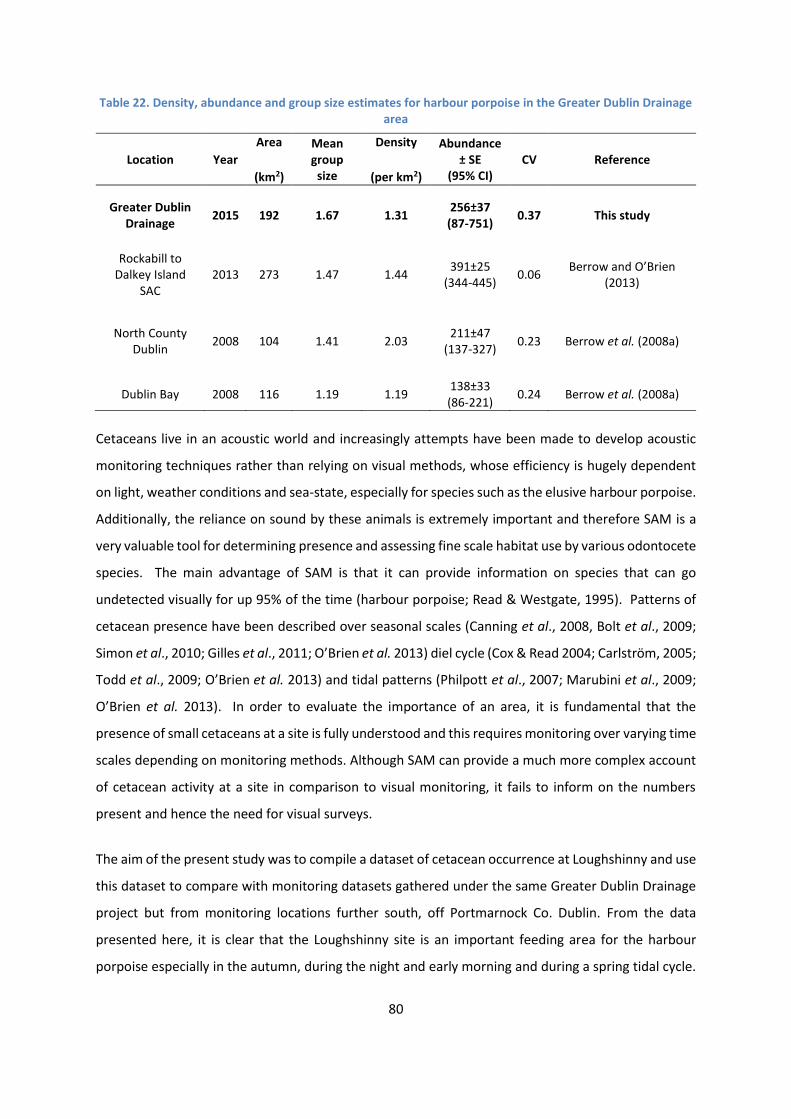
80
Table 22. Density, abundance and group size estimates for harbour porpoise in the Greater Dublin Drainage area
Location Year
Area
(km2)
Mean group
size
Density
(per km2)
Abundance ± SE
(95% CI) CV Reference
Greater Dublin Drainage
2015 192 1.67 1.31 256±37
(87-751) 0.37 This study
Rockabill to Dalkey Island
SAC 2013 273 1.47 1.44
391±25 (344-445)
0.06 Berrow and O’Brien
(2013)
North County Dublin
2008 104 1.41 2.03 211±47
(137-327) 0.23 Berrow et al. (2008a)
Dublin Bay 2008 116 1.19 1.19 138±33 (86-221)
0.24 Berrow et al. (2008a)
Cetaceans live in an acoustic world and increasingly attempts have been made to develop acoustic
monitoring techniques rather than relying on visual methods, whose efficiency is hugely dependent
on light, weather conditions and sea-state, especially for species such as the elusive harbour porpoise.
Additionally, the reliance on sound by these animals is extremely important and therefore SAM is a
very valuable tool for determining presence and assessing fine scale habitat use by various odontocete
species. The main advantage of SAM is that it can provide information on species that can go
undetected visually for up 95% of the time (harbour porpoise; Read & Westgate, 1995). Patterns of
cetacean presence have been described over seasonal scales (Canning et al., 2008, Bolt et al., 2009;
Simon et al., 2010; Gilles et al., 2011; O’Brien et al. 2013) diel cycle (Cox & Read 2004; Carlström, 2005;
Todd et al., 2009; O’Brien et al. 2013) and tidal patterns (Philpott et al., 2007; Marubini et al., 2009;
O’Brien et al. 2013). In order to evaluate the importance of an area, it is fundamental that the
presence of small cetaceans at a site is fully understood and this requires monitoring over varying time
scales depending on monitoring methods. Although SAM can provide a much more complex account
of cetacean activity at a site in comparison to visual monitoring, it fails to inform on the numbers
present and hence the need for visual surveys.
The aim of the present study was to compile a dataset of cetacean occurrence at Loughshinny and use
this dataset to compare with monitoring datasets gathered under the same Greater Dublin Drainage
project but from monitoring locations further south, off Portmarnock Co. Dublin. From the data
presented here, it is clear that the Loughshinny site is an important feeding area for the harbour
porpoise especially in the autumn, during the night and early morning and during a spring tidal cycle.

81
Winter could not be analysed as monitoring only lasted six months at this particular site. In order to
try to understand the relevance of these detections, comparisons can be made with other locations
from around the coast where SAM was previously carried out. The index of mean porpoise positive
minute per hour (PPM/hr) were compared across eight sites, with varying durations of monitoring. By
using the mean PPM/hr, we can compare across sites for different monitoring durations (Table 23).
Data highlighted in green were collected using T-PODs an earlier version of the C-POD. Previous work
by O’Brien et al. (2013) has shown that C-PODs recorded an average of seven times more data than T-
PODs during simultaneous deployments in Galway Bay and thus data are biased downwards.
However, it is clear that more DPM’s are recorded per deployment from sites in Dublin than anywhere
else. Previous deployment off Howth Head yielded 12.2DPM/hr, in comparison to the present study
of 5.8. However, the Howth deployment was over a shorter duration but data was gathered using a T-
POD.
When the present CPOD data are compared with other deployments around Ireland, such as the
Blasket Islands SAC, the detections from Co. Dublin were much greater. These results support visual
survey results by Berrow et al. (2014) where abundance estimates for North County Dublin produced
some of the highest density estimates to date (e.g. O’Brien and Berrow, 2015).
Table 23. Monitoring results from SAM across Ireland (green line denotes data collection using T-PODs so some caution necessary when interpreting results.
County Site Total
days
%
DPD
Total
PPM %PPM
Mean
DPM/day
Mean
DPM/hr Reference
Dublin Loughshinny 189 100 26281 9.6 137 5.8 This study
Galway Spiddal 572 541 27902 3.4 48.8 2.0 O'Brien et al., 2013
Kerry Inishtooskert 264 236 3930 1.04 14.9 0.6 O'Brien et al., 2013
Kerry Wild Bank 289 221 2097 0.51 7.3 0.3 O'Brien et al., 2013
Kerry The Gob 52 49 3015 4.1 58.0 2.4 O'Brien et al., 2013
Dublin Howth 47 100 13718 10.1 291.9 12.2 Berrow et al. (2008a)
Cork Castlepoint 63 100 1379 2.0 21.9 0.9 Berrow et al. (2008a)
Cork Sherkin 23 44 707 1.0 30.7 1.3 Berrow et al. (2008a)
Cork Galley Head 63 30 1614 2.4 25.6 1.1 Berrow et al. (2008a)
Although SAM does not provide information on the numbers of animals using a site, it has given an
insight into the temporal patterns of habitat use of the site which could not be identified from visual

82
monitoring alone. Loughshinny is an important feeding site for porpoises who are present on a daily
basis, especially during the hours of darkness and early mornings.
As harbour porpoises (Annex II species of the Habitats Directive) are present at such significant levels,
strict habitat protection should be ensured at the site, and due care must be taken to ensure any
development does not degrade this habitat or cause undue disturbance. These visual SAM results will
serve to inform protocols of best practice for the area if work is to go ahead and thus ensure the
presence of small cetaceans in the area is not negatively impacted upon.

83
5.5 Appendix References
Akamatsu, T.; Wang, D.; Wang, K.; Li, S. and Dong, S. (2010) Scanning sonar of rolling porpoises during prey capture dives. The Journal of Experimental Biology, 213, 146
Berrow, S.D., Hickey, R., O’Brien, J. O’Connor, I. and McGrath, D. (2008a) Harbour Porpoise Survey 2008. Report to the National Parks and Wildlife Service. Irish Whale and Dolphin Group, 31pp.
Berrow, S.D. and O’Brien, J. (2013). Harbour porpoise SAC survey 2013. Report to the National Parks and Wildlife Service, Department of Arts, Heritage and the Gaeltacht. Irish Whale and Dolphin Group. pp. 37.
Berrow, S., Hickey, R., O’Connor, I. and McGrath, D. (2014) Density estimates of harbour porpoise (Phocoena phocoena) at eight coastal sites in Ireland. Biology and Environment 114B (1), 19-34.
Bolt, H.E.; Harvey, P.V.; Mandleberg, L. and Foote, A.D. (2009) Occurrence of killer whales in Scottish inshore waters: temporal and spatial patterns relative to the distribution of declining harbour seal populations. Aquatic Conservation, 19, 671–675.
Carlström, J (2005) Diel variation in echolocation behaviour of wild harbour porpoises. Marine Mammal Science 21, 1, 1-12.
Canning, S.J.; Santos, M.B.; Reid, R.J.; Evans, P.G.H.; Sabin, R.C.; Bailey, N. and Pierce, G.J. (2008): Seasonal distribution of white-beaked dolphins (Lagenorhynchus albirostris) in UK waters with new information on diet and habitat use. Journal of the Marine Biological Association of the United Kingdom 88, 6, 1159-1166.
Cox, T.M.; Read, A.J.; Solow, A. and Tregenza, N.J.C. (2001) Will harbour porpoises (Phocoena phocoena) habituate to pingers? Journal of Cetacean Research and Management, 3(1), 81-86.
Gilles, A., Adler, S., Kaschner, K., Scheidat, M. and Siebert, U. (2011) Modelling harbour porpoise seasonal density as a function of the German Bight environment: implications for management. Endangered Species Research 14, 157-169.
Herzing, D.L (2000) Acoustic and social behavior of wild dolphins: implications for a sound society. In: Hearing by Whales and Dolphins. Au WWL, Popper and Fay RR (eds). Springer-Verlag, New York, 225-272.
Koschinski, S.; Diederichs, A. and Amundin, M. (2008) Click train patterns of free ranging harbour porpoises acquired using T-PODs may be useful as indicators of their behavior. Journal of Cetacean Research and Management, 10, 2, 147-155.
Leeney, R.H.; Carslake, D and Elwen, S.H. (2011) Using Static Acoustic Monitoring to Describe Echolocation Behaviour of Heaviside’s Dolphins (Cephalorhynchus heavisidii) in Namibia. Aquatic Mammals, 37, 2, 151-160.

84
Marubini, F.; Gimona, A.; Evans, P.G.H.; Wright, P.J. and Pierce, G.J. (2009) Habitat preferences and interannual variability in occurrence of the harbour porpoise (Phocoena phocoena) off northwest Scotland. Marine Ecology Progress Series, 381, 5, 297–310.
Miller, L.A.; Pristed, J.; Mohl, B. and Surlykke, A. (1995) The click-sounds of narwhals (Monodon monoceros) in Inglefield Bay, Northern Greenland. Marine Mammal Science, 11, 4, 491-502.
O’Brien, J., Beck, S., Wall, D., Pierini, A., and Hansen, S. (2013). Marine Mammals and Megafauna in Irish Waters, behaviour, distribution and habitat use. Work Package 2: Developing Acoustic Monitoring Techniques. PReCAST Final Report – Marine Research Sub-programme 2007-2013, pp1-205.
O’Brien, J. and Berrow, S.D. (2015). Harbour porpoise surveys in Roaringwater Bay and Islands SAC, 2015. Report to the National Parks and Wildlife Service, Department of Arts, Heritage and the Gaeltacht. Irish Whale and Dolphin Group. pp. 43.
Read A.J. and Westgate A.J. (1997) Monitoring the movements of harbour porpoises (Phocoena phocoena) with satellite telemetry. Mar Biol, 130,315–322.
Simon, M., Nuuttila, H., Reyes-Zamudio, M.M., Ugarte, F., Verfuß, U.K. and Evans, P.H. (2010) Passive acoustic monitoring of bottlenose dolphin and harbour porpoise with implications for habitat use and partitioning. Journal of the Marine Biological Association of the United Kingdom 90, 8, 1-7. 13
Todd, V.L.G., Pearse, W.D., Tregenza, N., Lepper, P.A. and Todd, I.B. (2009) Diel echolocation activity of harbour porpoises (Phocoena phocoena) around the North Sea offshore gas installations. ICES Journal of Marine Science 66, 4, 734-745.
Wahlberg, M. (2002) The acoustic behaviour of diving sperm whales observed with a hydrophone array. Journal of Experimental Marine Biology and Ecology, 281, 53– 62.

Environmental Impact Assessment Volume 2 of 4: Main Report
32102902/NIS
Appendix D Quiet Oceans - Underwater Noise Modelling Report

Modeling Dredging & Piling Noise Offshore Dublin
Brief Technical Report
Identification
Document reference QO.20170329.01.RAP.001.04A
Beneficiary TechWorks Marine
Customer Laboratori d'Aplicacions Bioacústiques
Contract number N/A
PROJET DOC CHRONO VER IND CLIENT ACRO DATE TYPE CLASS
QO.20170329.01 RAP 001 04 A LAB GDD 29.03.2017 PROD DR

Modeling Dredging & Piling Noise Offshore Dublin
Brief Technical Report
Référence :QO.20170329.01.RAP.001.04A
Page 2/29
Document history
Version Ind. Authorship Date Released Description
04 A T. Folegot 20.04.2018 20.04.2018 Integration of LAB comments
03 A T. Folegot 16.03.2018 16.03.2018 Integration of beneficiary comments –Correction of Dedging source level correction
02 A T. Folegot 26.07.2017 28.07.2017 Add piling scenario and important disclaimer
01 A T. Folegot 29.03.2017 30.03.2017 Initial version
Citation
T. Folegot (2017), Modeling Dredging & Piling Noise Offshore Dublin, Brief Technical Report, Quiet-Oceans, QO.20170329.01.RAP.001.04A

Modeling Dredging & Piling Noise Offshore Dublin
Brief Technical Report
Référence :QO.20170329.01.RAP.001.04A
Page 3/29
Table of content
Chapitre I. Context and objectives .......................................................................................................................... 6
I.1. Context .................................................................................................................................................. 6
I.2. Project information .................................................................................................................................. 6
I.3. Objectives and Scope of Work ................................................................................................................. 6
Chapitre II. Introduction to Quonops© ................................................................................................................... 7
Chapitre III. General principles of noise mapping ................................................................................................... 9
III.1. Key ocean variables affecting sound propagation ............................................................................... 10
III.2. Underwater noise modelling ............................................................................................................... 11
III.2.1. Modelling bellow 2kHz .............................................................................................................. 11
III.2.2. Modelling above 2kHz ............................................................................................................... 11
III.3. Calibration of the maps ....................................................................................................................... 12
Chapitre IV. Input data and assumptions .............................................................................................................. 13
IV.1. Noise introduced in the marine environment from dredging ............................................................. 16
IV.2. Noise introduced in the marine environment from piling .................................................................. 16
Chapitre V. Noise maps produced ......................................................................................................................... 18
V.1. Important disclaimers ........................................................................................................................... 18
V.2. Summary of maps produced ................................................................................................................ 18
V.3. Delivery ................................................................................................................................................ 18
V.3.1. File name ................................................................................................................................... 18
V.3.2. Dimensions ................................................................................................................................ 19
V.3.3. Variables .................................................................................................................................... 19
V.4. Selection of noise maps ........................................................................................................................ 21
V.5. Noise maps of dredging ........................................................................................................................ 21
V.6. Noise maps of piling a 600mm pile ...................................................................................................... 25

Modeling Dredging & Piling Noise Offshore Dublin
Brief Technical Report
Référence :QO.20170329.01.RAP.001.04A
Page 4/29
Terms and definitions
This section defines the technical terms used in the report.
1/3rd-octave frequency band
A frequency band with one third of an octave bandwidth. One octave is a doubling of frequency, whereas one third of an octave is a frequency ratio of 21/3 ≈ 1.26 between the highest and the lowest. [1] [2]
Bandwidth
The frequency range within which a recording system is sensitive. The frequency range (in Hertz) is obtained by subtracting the lower from the upper cut-off frequency.
Broadband level
The sound pressure level obtained over a wide frequency range with defined bandwidth.
Center frequency
The geometric mean of the lower and upper cut-off frequencies. Please note that the intensities should be averaged before converted into decibels.
Sound
The term “sound” is used to refer to the acoustic energy radiated from a vibrating object, with no particular reference for its function or potential effect. “Sounds” include both meaningful signals and “noise” (defined below), which may have either no particular impact or may have a range of adverse effects.
Noise
Noise is in direct contrast to signals, but always depending on the receiver and the context. What one receiver considers noise may be a signal to another receiver and even for the same receiver can the exact same sound be either signal or noise, depending on context.
“Noise” can be used in a more restrictive sense where adverse effects of sound are specifically described or when referring to specific technical distinctions such as “masking noise” or “ambient noise”.
Ambient noise
That part of the total noise background observed with a non-directional hydrophone, which is not due to the hydrophone and its manner of mounting (self-noise), or to some identifiable localized source of noise.
Environmental background noise not of direct interest during a measurement or observation; may be from sources near and far, distributed and discrete, but excludes sounds produced by measurement equipment, such as cable flutter.
For a specified signal, all sound in the absence of that signal except that resulting from the deployment, operation or recovery of the recording equipment and its associated platform.
Natural ambient noise
Ambient noise in the absence of any contribution from anthropogenic sources.
Continuous sound
Imprecise term meaning a sound for which the mean square sound pressure is approximately independent of averaging time.
A sound with no clear definable beginning or end with no bandwidth restrictions and a large time bandwidth product when the frequency range is broadband. Continuous sounds have finite power, but may have infinite or at least undefined energy.

Modeling Dredging & Piling Noise Offshore Dublin
Brief Technical Report
Référence :QO.20170329.01.RAP.001.04A
Page 5/29
Sound pressure
The difference between instantaneous total pressure and pressure that would exist in the absence of sound. Instantaneous pressure at time t.
p(t) in [Pa]
Reference pressure
1 µPa in underwater acoustics. p0 in [Pa]
Sound exposure
The integral of the square of the sound pressure over a stated time interval or event.
E in [µPa²s], 𝐸 = ∫ 𝑝(𝑡)2𝑇
0𝑑𝑡, with T being the time period of the event of interest.
Sound Pressure Level
SPL in [dB re 1 µPa]
𝑆𝑃𝐿 = 10 ∙ 𝑙𝑜𝑔10
1𝑇⁄ ∫ 𝑝(𝑡)2𝑑𝑡
𝑇
0
𝑝02 = 10 ∙ 𝑙𝑜𝑔10 (
𝑝𝑟𝑚𝑠
𝑝0)
2= 20 ∙ 𝑙𝑜𝑔10 (
𝑝𝑟𝑚𝑠
𝑝0)
with T = integration time.
Sound Exposure Level
SEL in [dB re 1 µPa²s]
𝑆𝐸𝐿 = 10 ∙ 𝑙𝑜𝑔10 (𝐸
𝑝02 𝑇0
) = 𝑆𝑃𝐿 + 10𝑙𝑜𝑔10(𝑇)
With reference time T0 = 1 s
With T being the time period of the event of interest in seconds.
Percentile level
A percentile corresponds to the proportion of time and space for which the noise exceeds a given level. This concept is widespread even in everyday life. For example, the average income of the top 10% of income earners or the “income threshold corresponding to the 90th or to the 95th percentile”, i.e. the income earned by the poorest individual among the top 10% or top 5% richest individuals. Meanwhile, the 50th percentile corresponds to the median salary. For underwater noise, the percentile, or exceedance level, is meant to describe the noise level occurring at least.
In the context of underwater noise, it is defined as the level LN that is exceeded for N percent of the time interval considered. For example, L1 is the level that is exceeded 1% of the time. This is accomplished by (1) ordering all measured levels in the time interval numerically in descending order and (2) and picking the value 1% of the rows below the top of this ordered list. Both steps can be done together in Matlab with the quantile or prctile function (available in the Statistics Toolbox).
The L1 is a measure for the maximum level. It is a more robust estimate than taking just the maximum observed level, since the latter may be an outlier caused by a single event, such as rattling of the anchoring system or other types of self-noise. Accordingly, L99 and L95 are used to describe the minimum level. L50 is the median level.

Modeling Dredging & Piling Noise Offshore Dublin
Brief Technical Report
Référence :QO.20170329.01.RAP.001.04A
Page 6/29
Chapitre I. Context and objectives
I.1. Context
As part of a data processing contract Techworks Marine has asked the Laboratori d'Aplicacions Bioacústiques to include noise level maps for pile driving and dredging operations. Quiet-Oceans has been asked to provide the propagation modelling for a few selected frequencies of interest.
I.2. Project information
The outfall pipeline consists of two elements, a tunnel section running from the Coast Road to approx. 500m off the beach, and a dredged section from this interface point to the final outfall point. The tunnel section will be constructed using a micro-tunnelling machine.
The dredged section will be constructed using Back Hoe Dredgers (BHD) and Trailer Suction Hopper Dredgers (TSHD) with the BHD working from the inshore outwards and the TSHD working from the Outfall point towards the inshore.
The dredging operation includes an excavation phase with material either side cast or placed in barrages for deposition a short distance away from the trench, and a backfilling phase where the excavated material will be replaced over the installed pipe.
I.3. Objectives and Scope of Work
Quiet-Oceans expert team was not involved in the definition of the Scope Of Work (SOW).
This work is solely meant to provide an indication of the noise propagation properties in the underwater environment where the construction will take place, taking into account the sources of interest, and does not constitute a noise impact assessment. No calibrated source recordings were available to evaluate the modelling results.
When there is interest in a noise impact study the internationally agreed methodology to assess the noise risks towards the marine species consist in the following steps [3] [9] :
Baseline broadband mapping of the existing noise;
Broadband calculation of the exceedance level of each individual project activities above the baseline (noise footprint calculation [10] );
Perceived levels in the bandwidth of sensitivity for the species potentially exposed to the noise of the project (high frequency cetaceans, mid frequency cetaceans, high frequency cetaceans, pinnipeds, 3 categories of fish (with/without swim bladders, with/without sensitive cells), sea turtles and larvae;
PTS, TTS, behavioural and masking risk areas mapping based on the perceived levels for each class of species.
Since noise impact study was not the interest mentioned in the Scope Of Work provided to Quiet-Oceans, a few specific frequencies for propagation modelling have been requested by the Laboratori d'Aplicacions Bioacústiques:
to map the noise propagation of the dredging activity at one specific position for three frequencies: 125Hz, 1kHz and 8kHz third-octaves for a single environmental condition corresponding to a March situation;
to map the noise from one piling activity at one specific position for two frequencies: : 125Hz and 1kHz third-octaves for a single environmental condition corresponding to a March situation.
Therefore, this report is limited a brief technical description, briefly explaining the modelling assumptions and giving a limited number if illustrations of the noise maps produced. Raw data of the modelled maps have been delivered jointly to the report for further exploitation.

Modeling Dredging & Piling Noise Offshore Dublin
Brief Technical Report
Référence :QO.20170329.01.RAP.001.04A
Page 7/29
Chapitre II. Introduction to Quonops©
Quiet-Oceans operates since 2010 the proprietary Quonops© ocean noise-monitoring and prediction system developed and owned by the company and protected by an international patent [3] . In a similar manner to weather forecasting systems, Quonops© produces an estimate of the spatio-temporal distribution of noise levels generated by human activities at sea, aggregating multiple sources, and assessing short-, mid- and long term source contributions to the global noise field (Figure 1). As demonstrated in a number of international projects, Quonops© caters for a broad range of maritime activities, including:
maritime traffic [3] [6] ;
oil exploration [7] ;
underwater warfare exercises;
offshore construction [8] ;
fossil-fuel extraction;
offshore wind-power construction and operations [9] ;
underwater drilling and blasting operations.
Based on physical acoustic propagation models, Quonops© considers the reality of the area through input data and has been largely validated through in-situ measurements over the last 6 years.
The outputs from Quonops© are tailored to the requirements of existing and emerging national and international regulations regarding underwater noise, the conservation of habitats and marine ecosystems, and the protection of marine species [10] .
The production of statistical soundscapes effectively characterizes the spatio-temporal emergence of anthropogenic noise from the real environmental conditions of the area. The system also supports underwater noise impact assessments and assists in the formulation of optimized planning and focused mitigation of maritime industrial activities in terms of environmental compliance. Quonops© brings together relevant information and data into a noise prediction platform to deliver a series of services, such as:
the geo-referenced mapping of statistical, historical or real-time human and environmental situation of the areas of interest,
the geo-referenced mapping of noise pollution according to given ocean-meteorological and human scenarios.
Such a tool aims to support management decisions by assessing, quantifying and prioritizing direct and indirect anthropogenic pressures on marine life, according to the emerging national and international regulations on underwater noise, especially the descriptor 11 of the European Marine Strategy Framework Directive [11] .
Quonops© is able to provide:
real-time regional survey of shipping noise and natural noise from waves;
historical statistical regional noise maps at a daily, weekly, quarterly and/or annual resolution;
noise maps of single or multiple customized noise sources through a large selection of maritime activities.

Modeling Dredging & Piling Noise Offshore Dublin
Brief Technical Report
Référence :QO.20170329.01.RAP.001.04A
Page 8/29
Figure 1 : Principle of Quonos©, Quiet-Oceans’ underwater noise prediction and monitoring system.

Modeling Dredging & Piling Noise Offshore Dublin
Brief Technical Report
Référence :QO.20170329.01.RAP.001.04A
Page 9/29
Chapitre III. General principles of noise mapping
The noise received at a particular position in the marine environment depends on the characteristics of the sound source(s) and the propagation through the marine environment (Figure 2). Noise propagation and therefore noise levels are mainly determined by the following (Table 2):
Bathymetry (underwater terrain); The nature of the seabed (sediment type); Oceanographic conditions such as temperature and salinity, currents, sea level; Weather conditions such as the wind (and consequently waves) and rainfall intensity.
Figure 2: In the warm upper layer of the ocean, sound is refracted toward the surface. As sound waves travel deeper into colder water, they slow down and are refracted towards the seafloor, creating a shadow zone. Image courtesy of the National Academy of
Sciences. Source: www.dosits.org.

Modeling Dredging & Piling Noise Offshore Dublin
Brief Technical Report
Référence :QO.20170329.01.RAP.001.04A
Page 10/29
III.1. Key ocean variables affecting sound propagation
Sound propagation losses increase as water depth lessens, and this is a cumulative loss effect which applies to shoaling caused by bathymetry and tidal fluctuations together. The effect is linked to the interaction of sound waves with the interfaces of the oceanic waveguide (surface and seabed). Furthermore, it should be noted that ocean waves (waves at the sea surface) tend to surge as they encounter shallower water, which increases their contribution to the ambient noise.
Propagation losses are more significant when the seabed is loose and fine-grained (i.e. silt absorbs sound waves better than gravel). However, the denser the sediment, the more reverberant it is; sound waves with significant angles of incidence on sediment are better reflected when the sediment is dense.
Wind generated ocean-surface waves propagate and absorb sound waves, an effect that increases with increasing sea-state. However, the noise generated by surging waves also increases the level of ambient noise. In other words, rough seas increase natural noise levels, but other noise sources do not carry as far as they would in calm conditions.
In shallow water, sedimentary particles are mobilized by currents and/or waves, and noise is generated when sedimentary particles collide with each other. The coarser the sediment and faster the speed of sound in the sediment, the higher the noise level.
Rainfall exerts a negligible effect on underwater sound propagation; however the sound generated by droplets falling on the sea surface does contribute to an increase in natural noise levels.
Table 1: Effect of physical properties of the ocean environment on acoustic propagation and noise generation.
Influence noise propagation Generate noise and contribute to
ambient noise
Bathymetry
Bottom parameters
Temperature/salinity
Sea level
Currents
Wind/waves
Rain
indicates that the effect exists indicates that the effect does not exist or is marginal.

Modeling Dredging & Piling Noise Offshore Dublin
Brief Technical Report
Référence :QO.20170329.01.RAP.001.04A
Page 11/29
III.2. Underwater noise modelling
Underwater modelling benefits from more than 50 years of scientific and operational development for military purposes, ranging from basic propagation modelling to more sophisticated sonar performance modelling. The military research in the field of experimental ocean acoustics has involved extensive equipment, with typically at least one ship and often an assortment of at-sea platforms equipped with sound projectors and receiving arrays. The objective of this research was to incorporate the acoustic propagation phenomena into a theoretical and numerical formalism, which gives a quantitative prediction of the sound field for arbitrary ocean environments. The progress in the field of numerical computing has largely contributed to the development of the modelling capability.
There are essentially five types of models (computer solutions to the wave equation) to describe sound propagation in the sea: spectral, normal mode, ray, and parabolic equation models, and direct finite-difference, or finite-element solutions of the full wave equation. All these models permit the ocean environment to vary with depth. Models also permit horizontal variations in the environment, i.e., slopping bottom or spatially variable oceanography [13] .
The acoustic models accurately reflect the propagation of noise in the water column in realistic oceanographic conditions by resolving the Helmholtz Equation, the State Equation:
),(1
002
2
2rrtt
t
p
cp
pc 2 00
p
t
v
02 0 pvfj
where p is the acoustic pressure, c is the sound speed in the medium (water or sediment), t is time, 0t the
instant of emission of the signal, and r the three-dimensional position of observation and 0r the three-
dimensional position of the source, assumed to be punctual.
III.2.1. Modelling bellow 2kHz
For frequencies bellow 2kHz, we have used state-of-the-art parabolic equation [14] [15] [16] [17] . Developed before World War II, and widely used in many areas of physics, parabolic equation methods are based on fast Fourier transforms. It has become the most popular wave-theory technique for solving range dependent problems in ocean acoustics. It consists in a parabolic approximation of the Helmholtz equation into an elliptic wave equation. We have used the model developed by Collins et al. which is among the state-of-the-art parabolic equation implementation which especially solves the equation for elastic media, such as the marine environment.
III.2.2. Modelling above 2kHz
For frequencies above 2 kHz, we have used an energy distribution to Gaussian beams approach to limit calculation times. Used since the early 1960’s, the ray modelling is based on a high frequency approximation. Ray methods are still used extensively in operational environment where speed is critical and where the environmental uncertainties pose more constraints on the accuracy. Quonops© use Bellhop [18] which is among the state-of-the-art ray tracing codes which handles Gaussian ray bundles to somewhat overcome the high frequency approximation.

Modeling Dredging & Piling Noise Offshore Dublin
Brief Technical Report
Référence :QO.20170329.01.RAP.001.04A
Page 12/29
Table 2: Validation of Quonops through in-situ acoustic measurements in a very large number of different marine environments and projects.
Project
Name Year Area Type of noise Effort Partners
ERATO 2011 Atlantic Ocean Shipping and
natural
6 hydrophones,
24 hours French Hydrographic Office (France)
STRIVE 2011 Irish seas Shipping and
natural
1 hydrophone, 21
days
Environmental Protection Agency, Cork
University (Ireland)
AQUO 2013-
2015
Mediterranean
Sea
Shipping and
natural
1 hydrophone, 9
months
Laboratory of Bioacoustics Applications,
Barcelona (Spain)
AQUO 2013-
2015 North-sea Shipping
Cross-models
validation
TNO (Netherland), FOI (Sweden), Leiden
university (Netherland)
MaRVEN 2013 -
2015 North-sea
Piling noise &
Windfarm
operation
2 hydrophones
DHI (Denmark), Royal Belgian Institute of
Natural Sciences (Belgium), European
Commission
NRL 2013-
2014 Indian Ocean
Shipping and
natural
2 hydrophones, 7
months Biotope (La Réunion)
FEC-COU 2013 English Channel Shipping and
natural
4 hydrophones,
20 days EMF, EDF, WPD (France)
SNA 2013 Atlantic Ocean Shipping and
natural
3 hydrophones,
20 days EMF, EDF, WPD (France)
BENTHOSCOPE 2015 English Channel Tidal device in
operation
1 hydrophone, 1
day Marine Energy France (France)
POSTE H 2013 Indian Ocean
Vibrodriving Shipping and
natural
2 hydrophones Biotope (La Réunion)
ETM 2014 Caribbean Shipping and
natural
1 hydrophone, 30
days AKUO (France)
JETSKI 2014 Atlantic Ocean Watercraft 1 hydrophone Marine Protected Area (France)
PORTIER 2014 2016
Mediterranean
Sea
Shipping and
natural
2 hydrophones, 5
months BYTP (France)
EMDT 2015-
2016 English Channel
Shipping and
natural
4 hydrophones,
12 months ENGIE (France)
EMYN 2015-
2016 Atlantic Ocean
Shipping and
natural
4 hydrophones,
12 months ENGIE (France)
GOEMONIER 2016 Atlantic Ocean Fishing device 1 hydrophone Marine Protected Area (France)
III.3. Calibration of the maps
It is essential to bear in mind that no underwater noise measurements made with hydrophones have been used to calibrate the noise maps. An active acoustic calibration measurement is strongly recommended.

Modeling Dredging & Piling Noise Offshore Dublin
Brief Technical Report
Référence :QO.20170329.01.RAP.001.04A
Page 13/29
Chapitre IV. Input data and assumptions
The data used to perform the modelling describes:
the bathymetry of the area provided by EMODNet [20] and illustrated in Figure 3;
the coast line of the area provided by [21] ;
the sediment provided by EMODNet [20] ; The original sediment data has a spatial resolution of 1/40°. The EMODnet database classifies the sediments into 6 categories:
Boulders & bedrock;
Till/diamincton;
Coarse-grained sediment;
Mixed sediment;
Muddy sand and sand;
Mud and sandy mud.
The geo-acoustic parameters used in the acoustic model as boundary conditions are reported in Table 4. Since the sediments being assumed to be fluid-elastic, the geo-acoustic parameters are limited to
density (in ton per m3), compressional speed (m/s) and compressional attenuation (in dB/, being the acoustic wavelength) as illustrated in Figure 4. Shear waves propagating in solid materials are neglected.
the sound speed derived from temperature and salinity of the sea water provided by the Copernicus Marine Environment Monitoring Service (CMEMS) which provides regular and systematic reference information on the physical state, variability and dynamics of the ocean and marine ecosystems for the global ocean and the European regional seas. The Mackenzie equation (1981) has been used to derive temperature and salinity into sound speed (Figure 5):
In which T is the temperature in degrees Celsius, S is the salinity in parts per thousand, and D is the depth in meters. The range of validity: temperature 2 to 30 °C, salinity 25 to 40 parts per thousand, depth 0 to 8000 m.
the sea-state or sea surface roughness provided by the Wave Watch 3 model.
The type and source of data used is summarized in Table 3. The background noise is set using the Wenz model [22] for natural noise derived from the surface roughness of the sea in the area.
Table 3 : Summary of the input data used for the modelling
Data Type Provider Coverage Spatial resolution
Bathymetry EMODNet European seas 7.5"
Coast line Open Street Map World -
Sediment EMODNET European seas 7.5"
Temperature Copernicus Ocean World 5'
Salinity Copernicus Ocean World 5'
Surface roughness Wave Watch 3 World 30'

Modeling Dredging & Piling Noise Offshore Dublin
Brief Technical Report
Référence :QO.20170329.01.RAP.001.04A
Page 14/29
Figure 3: Bathymetric map used for modelling offshore Dublin extracted from [20]
Figure 4: Distribution of values of compressional attenuation of sound (left), compressional sound speed (middle), and density (right) of the sediment provided by [20] .

Modeling Dredging & Piling Noise Offshore Dublin
Brief Technical Report
Référence :QO.20170329.01.RAP.001.04A
Page 15/29
Table 4: Bottom characteristics used for modelling.
Sediment Name
Density Compressional Speed Compressional Attenuation
Ton/m3 m/s dB/lambda
Mean Uncertainty Mean Uncertainty Mean Uncertainty
Boulders & bedrock
2,50 0,08 3 820 23 0,75 0,04
Till/diamincton 2,50 0,08 2 750 23 0,75 0,04
Coarse-grained sediment
2,37 0,10 2 122 315 0,88 0,07
Mixed sediment
2,03 0,26 1 855 79 0,89 0,01
Muddy sand and sand
1,53 0,22 1708 70 0,91 0,06
Mud and sandy mud
1,16 0,03 1517 32 0,37 0,41
Figure 5: Sound speed profiles in the area the 17th
of March 2017 provided by CMEMS.

Modeling Dredging & Piling Noise Offshore Dublin
Brief Technical Report
Référence :QO.20170329.01.RAP.001.04A
Page 16/29
IV.1. Noise introduced in the marine environment from dredging
The Scope of Work describe a dredged section using Back Hoe Dredgers (BHD) and Trailer Suction Hopper Dredgers (TSHD) with the BHD working from the inshore outwards and the TSHD working from the Outfall point towards the inshore. For modelling, the Scope of Work has requested to consider as sources a Trailing Suction Hopper Dredger (TSHD) (see illustration Figure 6).
The location for modelling is at 53.4169° latitude and -6.075° longitude, offshore Dublin, which correspond to the far end of the dredging track length (about 4 km offshore). The physical geometry of the sound source is modelled as two points of generation: 50% of the generated energy is at 6m depth to describe the noise from the vessel, and 50% of the energy is located close to the bottom to describe the noise generated by the suction pipe.
The activity selected for the modelling is the flattening and removal of rocks. The wideband source level is derived from [24] and [25] and estimated at 188 dB ref 1µPa in the 50Hz to 89 kHz. Detailed source levels for the frequencies modelled are reported in Table 5.
Table 5 : Source levels used for modelling the dredging activities
Source level
dB ref1µPa²@1m
Sound Pressure Level in the 125Hz 1/3 octave
Sound Pressure Level in the 1kHz 1/3 octave
Sound Pressure Level in the 8kHz 1/3 octave
TSHD 175.5 173.4 172.2
Figure 6 : Illustratio of a Trailing Suction Hopper Dredger (TSHD)) (vessel name: Bartolomeu Dias)
Source : Jan De Nul
IV.2. Noise introduced in the marine environment from piling
We will consider as sources the piling of 600mm piles using an impact hammer (see illustration).
The location for modelling the piling is at 53.42466° latitude and -6.098955° longitude, offshore Dublin. During a piing phase, the sounds generated are impulsive. In order to translate the potential impacts more accurately, the scientific community (NOAA, 2016) now agrees to quantify the level as Sound Exposure Level (SEL), expressed in dB 1μPa².s). The sound exposure energy corresponds to the acoustic energy received at a point, integrated over a given frequency band and over the significant duration of the sound pulse (Ti). In this study, Ti is chosen to be 100ms, according to the literature (De Jong, et al., 2008), for example.

Modeling Dredging & Piling Noise Offshore Dublin
Brief Technical Report
Référence :QO.20170329.01.RAP.001.04A
Page 17/29
Earlier modeling and measurement research programs have shown that the level of sound exposure in water increases logarithmically as a function of the diameter of the pile, which makes it possible to extrapolate with confidence measurements reported in the literature. The source levels used in the modeling study are derived from measurement taken at the Q7 and OWEZ construction projects (De Jong et al., 2008), Beatrice (Talisman Energy et al., 2004) and Horns Rev II (ITAP, 2008).
The piling source is modelled using an ensemble of four punctual sources. 40% f the total energy is at the bottom end of the pile, while 60% of the energy is equally distributed along the pile. Detailed source levels for the frequencies modelled are reported in Table 6.
Table 6 : Source levels used for modelling the piling activities
Source level
dB ref1µPa²@1m
Sound Pressure Level in the 125Hz 1/3 octave
Sound Pressure Level in the 1kHz 1/3 octave
Sound Pressure Level in the 8kHz 1/3 octave
600mm diameter pile driving
Per stroke
186 dB ref1µPa²@1m 172 dB ref1µPa²@1m Not modelled as
requested in the Scope of Work

Modeling Dredging & Piling Noise Offshore Dublin
Brief Technical Report
Référence :QO.20170329.01.RAP.001.04A
Page 18/29
Chapitre V. Noise maps produced
V.1. Important disclaimers
Maps have been produced at 125Hz, 1kHz and 8kHz third-octaves (for dredging). Therefore, the levels obtained cannot be directly compared to cetaceans’ nor seals’ PTS or TTS thresholds, since the thresholds are valid for the total energy contained in the audibility band of the species (NOAA, 2016), which is much larger than a third-octave band. To be able to compare and estimate a risk area, modelling should be performed for the full audibility band of each species, which has not been required by the costumer. For example, the source level in the auditory band of seals for a single-stroke piling of a 600mm diameter pile is 178 dB ref1µPa²@1m, while the source level in the 1kHz third-octave band is only 172 dB ref1µPa²@1m, which makes a significant difference.
The maps are purely modelling maps using the best known description of the environment. Usually, an acoustic calibration measurement is needed to ground truth the maps and reduce uncertainties.
V.2. Summary of maps produced
For each scenario (dredging and piling), a total of 21 maps have been produced and delivered in a NetCdf Format. The noise maps correspond to:
March 2017 environmental context;
The full water column;
Three third-octave bands, centred at 125 Hz, 1kHz and 8 kHz (only for dredging) as required by the
costumer ;
Seven percentiles, 0th (maximum), 10th, 25th, 50th, 75th, 90th and 100th (minimum) percentiles to
characterise the variability of the sound field with depth;
Three depth ranges (Surface to -15m, 30m to the bottom, and the full water column).
V.3. Delivery
Quiet-Oceans has delivered noise ambient maps in NetCDF format version 4. Files format respect principals rules of NetCdf Climate and Forecast (CF) Metadata Conventions release 1 [23] .The NetCdf provided is described by :
global attributes : attributes used for context, history or versioning file ;
dimensions : scalar data that describes dimensions for the variables contained in file ;
variables : vectors or matrix that describes the data.
The following sections detail the content of the delivered data.
V.3.1. File name
Files are named as follow: Dredging_DublinNorth_20170330.nc for the dredging scenario and Piling_600mm_DublinNorth_20170728.nc for the piling scenario.

Modeling Dredging & Piling Noise Offshore Dublin
Brief Technical Report
Référence :QO.20170329.01.RAP.001.04A
Page 19/29
V.3.2. Dimensions
The dimensions of the variables contained in the delivered Netcdf are detailed in Table 7.
Table 7: Summary of the dimensions of the variables contained in the delivered Netcdf files.
Group Name Value
Statut
(Mandatory, Optionnal)
AcousticData Lat number of latitudes, configuration dependent M
Lon number of longitudes, configuration dependent M
frequency number of frequency O
percentile number of percentiles, configuration dependent M
Layer Number of immersion layers M
maxLayerNameLen Max length of layer names M
V.3.3. Variables
A variable can be associated with attributes. When CF conventions describes it, standard attributes are mentioned:
standard_name : name for variable according to CF conventions
long_name : description for variable according to CF conventions
units : : units according to UD Units Unidata dictionnary
valid_min : minimal value for data validation
valid_max : maximal value for data validation
For geographic reference, SPL is linked to a coordinate reference system (CRS) which defines all the parameters attached to a mapping projection :
grid_mapping_name : naming of projection as defined in conventions
(Appendix F. Grid Mappings). In our case, latitute_longitude is equivalent to geodesic projection in
which coordinates positions are latitude and longitude,
epsg_code : EPSG code (4326) for correspondant geodesic projection with WGS84 ellipsoid
longitude_of_prime_meridian : longitude of prime meridian in geodesic projection
semi_major_axis : half the major axis of the ellipsoid linked to the projection
inverse_flattening : 1/flattening of the ellipsoid linked to the projection
Table 8: Description of the variables of the Netcdf delivered.
Name Dimensions Datatype Statut (Mandatory/ Optionnal)
Attributes Description
layer Layer int8 M
Standard_name Layer
Long_name Layer
bounds layer_bnds
layer_names layer_names
Immersion field.

Modeling Dredging & Piling Noise Offshore Dublin
Brief Technical Report
Référence :QO.20170329.01.RAP.001.04A
Page 20/29
Name Dimensions Datatype Statut (Mandatory/ Optionnal)
Attributes Description
layer_names Layer, maxLayerNameLen
char M Immersion identification (Ex : High, Low, Full).
layer_bnds layer, nv int M unit m
positive down Immersion bounds
frequency frequency int O
Standard_name frequency
long_name Central band frequency
units Hz
order_convention IEC 61260 : 1995";
order_octave 3.0
percentile percentile int8 M
Standard_name percentile
Long_name percentile
comment QO definition : The value above which a given percentage of observations in a group of observations fall
unit Percent
Lon Lon double M
Standard_name longitude
Long_name longitude
comment None
unit degrees_east
lat Lat double M
Standard_name latitude
Long_name latitude
comment None
unit degrees_north
energy layer, frequency percentile, lon, lat
single O
crs Single M
grid_mapping_name latitude_longitude
epsg_code EPSG:4326
longitude_of_prime_meridian 0.0; // double
semi_major_axis 6378137.0; // double
inverse_flattening 298.257223563; // double

Modeling Dredging & Piling Noise Offshore Dublin
Brief Technical Report
Référence :QO.20170329.01.RAP.001.04A
Page 21/29
V.4. Selection of noise maps
This section gives a non-exhaustive overview of the noise maps for dredging. The maps reported hereafter are only for illustration purposes, and shows either the maximum levels or the 5th percentile (or exceedance level) for the full water column for the 125 Hz, 1kHz and 8 kHz third-octave bands.
All raw data of modelled maps have been delivered in a Netcdf format for further exploitation by the customer.
V.5. Noise maps of dredging

Modeling Dredging & Piling Noise Offshore Dublin
Brief Technical Report
Référence :QO.20170329.01.RAP.001.04A
Page 22/29
5th percentile levels at
125 Hz 1/3 octave band

Modeling Dredging & Piling Noise Offshore Dublin
Brief Technical Report
Référence :QO.20170329.01.RAP.001.04A
Page 23/29
5th percentile levels at 1kHz 1/3 octave band

Modeling Dredging & Piling Noise Offshore Dublin
Brief Technical Report
Référence :QO.20170329.01.RAP.001.04A
Page 24/29
5th percentile levels at 8kHz 1/3 octave band

Modeling Dredging & Piling Noise Offshore Dublin
Brief Technical Report
Référence :QO.20170329.01.RAP.001.04A
Page 25/29
V.6. Noise maps of piling a 600mm pile

Modeling Dredging & Piling Noise Offshore Dublin
Brief Technical Report
Référence :QO.20170329.01.RAP.001.04A
Page 26/29
Piling 600mm diameter
Maximum 1sec SEL levels at 125 Hz 1/3 octave band

Modeling Dredging & Piling Noise Offshore Dublin
Brief Technical Report
Référence :QO.20170329.01.RAP.001.04A
Page 27/29
Maximum 1sec SEL levels at 1kHz 1/3 octave band

Modeling Dredging & Piling Noise Offshore Dublin
Brief Technical Report
Référence :QO.20170329.01.RAP.001.04A
Page 28/29
Bibliographie
[1] ANSI S1.11-2004: Specification for Octave-Band and Fractional-Octave-Band Analog and Digital Filters,
American National Standard Institute, USA, Reaffirmed by ANSI 2009.
[2] IEC 1995 (EN 61260), Electroacoustics - Octave-band and fractional-octave-band filters, International
Electrotechnical Commission, Geneva, Switzerland, 1996.
[3] Folegot, T., Clorennec, D.,(2014), From Footprint prediction to risk assessment and focused mitigation,
Proceedings of the ECS/ASCOBANS/ACCOBAMS Joint Workshop on introducing noise into the marine
environment – what are the requirements for an impact assessment for marine mammals ?, European
Cetacean Society’s 28th Annual Conference, Liege, Belgium, 6th April 2014
[4] Folegot, Thomas, Method for monitoring, predicting and reducing the level of acoustic energy of a
plurality of sources in an aquatic environment and method for monitoring, predicting, and reducing
the risk of noise annoyance for marine species, European Union Patent EP2488839, 10 October 2009.
[5] Folegot, Thomas, Ship traffic noise distribution in the Strait of Gibraltar: an exemplary case for
monitoring global ocean noise, Conference on the effect of noise on aquatic life. Cork, Ireland:
Springer, 2010.
[6] Folegot, T., Clorennec, D., Brunet, P., Six, L., Chavanne, R., van der Schaar, M., et al. (2015). Monitoring
Long Term Ocean Noise in European, Proceedings of the IEEE OCEANS International Conference, .
Genova, June 2015.
[7] Sutton, G., Jessopp, M., Folegot, T., Clorennec D. (2013), Mapping the spatio-temporal distribution of
underwater noise in Irish Waters, Environmental Protection Agency, STRIVE Programme 2007-2013,
technical report 2011-W-MS-7
[8] F. Thomsen, A. Gill, M. Kosecka, M. Andersson, M. Andre, S. Degraer, T. Folegot, J. Gabriel, A. Judd, T.
Neumann, A. Norro, D. Risch, D. Wood et B. Wilson (2015), MaRVEN: Environmental Impacts of Noise,
Vibrations and Electromagnetic Emissions from Marine Renewable Energy, Editor: European
Commission, Brussels, 2015.
[9] T. Folegot, D. Clorennec, A. Norro, A. Gill et F. Thomsen, (2016), Modelling the risk of noise exposure
to marine life during offshore wind farms construction and operation, 4th International Conference on
the Effects of Noise on Aquatic Life, Dublin, Ireland, 2016.
[10] C. Audoly, C. Rousset, E. Baudin and T. Folegot (2016), AQUO Project: Research on solutions for the
mitigation of shipping noise and its impact on the marine fauna, a Synthesis of guidelines,
International Conference and Exhibition on Underwater Acoustics, Athens, Greece, 2016.
[11] EC (2010), Criteria and methodological standards on good environmental status (GES) of marine
waters, Directive 2010/477/EC, Euroean Commission, Brussels, 2010.
[12] Haw-Jye, S., & Hillson, R. (2006). A software workbench for estimating the effects of cumulative sound
exposure in marine mammals. IEEE Journal of Oceanic Engineering, vol.31, no.1, pp.8-21.

Modeling Dredging & Piling Noise Offshore Dublin
Brief Technical Report
Référence :QO.20170329.01.RAP.001.04A
Page 29/29
[13] Jensen, F. B., Kuperman, W. A., Porter, M. B., & Schmidt, H. (2000), Computational Ocean Acoustics,
AIP Series in Modern Acosutics and Signal Processing, Springer.
[14] Collins, M. D. (1994). Generalization of the Split-Step Pade. J. Acoust. Soc. Am., 96, 382-385.
[15] Collins, M. D., Kuperman, W. A., & Siegman, W. L. (1995). Parabolic Equation for poro-elastic media. J.
Acous. Soc. Am, 98(3), 1645-1656.
[16] Collins, M. D., Cederberg, R. J., & King, D. B. (1996). Comparison of Algorithms for Solving Parabolic
Wave Equations. J. Acoust. Soc. Am., 100, 178-182.
[17] Collins, M. D. (1991). A higher-order energy conserving parabolic equation for range-dependent ocean
depth, sound speed and density. J. Acoust. Soc. Am. 89, 1068–1075.
[18] Porter, M. B., & Reiss, E. L. (1984). A numerical method for ocean-acoustic normal modes. Journal of
the Acoustical Society of America, 76, 244-252.
[19] Reine K., C. D. (2012). Characterization of underwater sounds produced by a backhoe dredge
excavating rock and gravel. DOER Technical Notes Collection (ERDC TN-DOER-E36), 1-29. [Publication
2].
[20] EMODnet, 2012: Seabed substrate data (version 28.6.2012) made available by the EMODnet
(European Marine Observation and Data Network) Geology project, funded by the European
Commission Directorate General for Maritime Affairs and Fisheries. http://www.emodnet-geology.eu.
[21] OpenStreetMap Foundation, 2017, OpenStreetMap® is open data, licensed under the Open Data
Commons Open Database License (ODbL); http://www.openstreetmap.org, march 2017.
[22] Wenz, G. (1962). Acoustic Ambient Noise in the Ocean: Spectra and Sources. J. Acosut. Soc. Am.,
34:1936-1956.
[23] http://cfconventions.org/Data/cf-conventions/cf-conventions-1.6/build/cf-conventions.pdf.
[24] Parvin (2008), Assessment of underwater noise from dredging operations on the Hastings shingle
bank,
[25] Robinson S.P., Theobald, P.D., Hayman, G, Wang, L.-S., Lepper, P. A., Humphrey, V.F., Mumford, S.
(2011), Measurement of underwater noise arising from marine aggregate dredging operations Final
Report, MALSF (MEPF Ref no. 09/P108), Published February 2011.

Environmental Impact Assessment Volume 2 of 4: Main Report
32102902/NIS
Appendix E Site-Specific Detailed Conservation Objectives List Links

Site Name Type Conservation Objectives Date Link
Baldoyle Bay SPA 27/02/2013 https://www.npws.ie/sites/default/files/protected-sites/conservation_objectives/CO004016.pdf
Ireland's Eye SPA 21/02/2018 https://www.npws.ie/sites/default/files/protected-sites/conservation_objectives/CO004117.pdf
North Bull Island SPA 09/03/2015 https://www.npws.ie/sites/default/files/protected-sites/conservation_objectives/CO004006.pdf
Malahide Estuary SPA 16/08/2013 https://www.npws.ie/sites/default/files/protected-sites/conservation_objectives/CO004025.pdf
Howth Head Coast SPA 21/02/2018 https://www.npws.ie/sites/default/files/protected-sites/conservation_objectives/CO004113.pdf
South Dublin Bay and River Tolka Estuary SPA 09/03/2015 https://www.npws.ie/sites/default/files/protected-sites/conservation_objectives/CO004024.pdf
Rogerstown Estuary SPA 20/05/2013 https://www.npws.ie/sites/default/files/protected-sites/conservation_objectives/CO004015.pdf
Lambay Island SPA 21/02/2018 https://www.npws.ie/sites/default/files/protected-sites/conservation_objectives/CO004069.pdf
Dalkey Island SPA 21/02/2018 https://www.npws.ie/sites/default/files/protected-sites/conservation_objectives/CO004172.pdf
Skerries Islands SPA 21/02/2018 https://www.npws.ie/sites/default/files/protected-sites/conservation_objectives/CO004122.pdf
Rockabill SPA 08/05/2013 https://www.npws.ie/sites/default/files/protected-sites/conservation_objectives/CO004122.pdf
Baldoyle Bay SAC 19/11/12 https://www.npws.ie/sites/default/files/protected-sites/conservation_objectives/CO000199.pdf
Rockabill to Dalkey Island SAC 07/05/13 https://www.npws.ie/sites/default/files/protected-sites/conservation_objectives/CO003000.pdf
North Dublin Bay SAC 06/11/2013 https://www.npws.ie/sites/default/files/protected-sites/conservation_objectives/CO000206.pdf
Malahide Estuary SAC 17/05/13 https://www.npws.ie/sites/default/files/protected-sites/conservation_objectives/CO000205.pdf
Howth Head SAC 06/12/16 https://www.npws.ie/sites/default/files/protected-sites/conservation_objectives/CO000202.pdf
Rogerstown Estuary SAC 14/08/13
https://www.npws.ie/sites/default/files/protected-sites/conservation_objectives/CO000208.pdf
South Dublin Bay SAC 22/08/2013
https://www.npws.ie/sites/default/files/protected-sites/conservation_objectives/CO000210.pdf
Lambay Island SAC 22/07/2013
https://www.npws.ie/sites/default/files/protected-sites/conservation_objectives/CO000204.pdf

Environmental Impact Assessment Volume 2 of 4: Main Report
32102902/NIS
Appendix F Vessel Management Plan

rpsgroup.com/uk
23 May 2018
Project Number: SEC7909
RPS Belford House, 3rd Floor, 59 Belford Road, Edinburgh, EH4 3DE
Tel: 0131 555 5011 Fax: 0131 555 4911 Email: [email protected]
Greater Dublin Drainage
Appendix F
Vessel Management Plan

rpsgroup.com/uk
QUALITY MANAGEMENT
Prepared by: Name: Dr Rob Iredale Title: Principal Ornithologist
Signature:
Authorised by: Name: Dr Simon Zisman Title: Senior Director
Signature:
Current Status: Final
Issue Date: 23 May 2018 Revision Number: 20180523_F1
Revision Notes: -
Project File Path: W:\7909SEC - RPS Belfast, WW EIS NIS Ornithology\Technical\Reports\EIS\2017_12_05_VMP\2017_12_05_GDD_VMP_dv5.docx
This report has been prepared within the RPS Planning and Development Quality Management
System to British Standard EN ISO 9001 : 2008
COPYRIGHT © RPS
REPORT TEMPLATE
TYPE: Planning
ISSUE DATE: 18 May 2011
REVISION NUMBER: 1
REVISION DATE: 26 April 2012

rpsgroup.com/uk
CONTENTS
1. VESSEL REPRESENTATIVE SIGNATURE PAGE .................................................................. 1
2. INTRODUCTION ........................................................................................................................ 2
Background ................................................................................................................................ 2 Purpose and Structure of Document .......................................................................................... 2
3. VMP DETAILS ........................................................................................................................... 3
What Does the VMP Entail? ...................................................................................................... 3 Who Does the VMP Apply to? ................................................................................................... 3 When Does the VMP Apply? ..................................................................................................... 3 Where Does the VMP Apply? .................................................................................................... 3 How is the VMP Implemented? .................................................................................................. 4 Why Does the VMP Need to be Implemented? ......................................................................... 4 Introduction ................................................................................................................................ 5 Procedure ................................................................................................................................... 5
FIGURES
Figure 1 Vessel management restrictions Figure 2 Vessel management restrictions

1 rpsgroup.com/uk
1. VESSEL REPRESENTATIVE SIGNATURE PAGE
1.1 By signing this page, you confirm that as a vessel representative:
• Have read, understand, and will comply with the information contained in this document;
• Will ensure that the master and crew of the vessel you represent are shown this document, and confirm that they have read, understood and will abide by it; and
• Will ensure that at least one copy of this document is kept onboard the vessel in question at all times, in a location it can be easily accessed for reference.
Name Vessel Signature Date

2 rpsgroup.com/uk
2. INTRODUCTION
Background
2.1 Chapter 10, Marine Ornithology, of the Environmental Impact Assessment Report (EIAR) for the Greater Dublin Drainage project (GDD; “the project”) has assessed the potential for impacts on marine birds during the construction and operation of the project.
2.2 During the breeding season (April to August), high numbers of birds are present in the
vicinity of the proposed subsea pipeline route between Velvet Strand and Ireland’s Eye, where there is a large seabird colony on the cliffs. The island and surrounding waters are designated as a Special Protection Area (SPA), which means that it is one of Ireland’s most important sites for seabirds. No activity that would result in adverse effect on site integrity can be permitted. This includes the construction and operation of the project and the operation of vessels associated with it. The “site” applies to the nests of qualifying bird species on the cliffs, and to qualifying species that are using the sea for foraging, loafing and other activities.
2.3 A chart showing the Ireland’s Eye SPA boundary with reference to the project is presented in Figure 1.
2.4 In the EIAR, it was identified that the production of a suitable vessel management plan (VMP) would serve two purposes with respect to the impact assessment for the construction of the project:
• Increase in confidence of prediction of the Negligible impact significance on the seabird colony of Ireland’s Eye during the April to August breeding season (i.e. adult birds and chicks at their nest sites), by providing clear instructions to vessels regarding the SPA location to help them avoid approaching it.
• Reduction in the impact significance of flightless auk chicks (generally guillemot or razorbill) attempting to leave the area along with adults at the end of the breeding season, by providing an ornithological watching brief, and clear protocol applicable only at this time of year.
Purpose and Structure of Document
2.5 Chapter 3 of this document details the following aspects of the VMP: • What it entails; • Who it applies to; • When it applies to them; • Where it applies; • How it is administered, and by whom; and • Why it needs to be implemented.
2.6 Annex 1 provides a version of this information which is designed to be quickly referred to by those responsible for controlling vessels operating in support of the project.
2.7 Whilst they should read the details of the VMP to ensure it is fully understood, it is envisaged that Annex 1 will be the ‘operational’ section of the VMP that should be referred to by vessel operators when working on the project.

3 rpsgroup.com/uk
3. VMP DETAILS
What Does the VMP Entail?
3.1 The VMP contains two conditions, both of which must be met.
3.2 Condition A requires that all vessels associated with the project do not unnecessarily approach, and never cross the boundary of the Ireland’s Eye SPA when working on the project, unless there is a risk to human safety in not doing so. The SPA boundary is shown on Figure 2 along with a box. The outline of this box represents the boundary of the exclusion area.
3.3 Condition B requires that between July and August, a bird observer will be positioned either on Ireland’s Eye or a vessel to observe the distribution of flightless, rafting auks on the water that are attempting to leave the colony at the end of the breeding season. The direction that these birds travel in when on the water is heavily influenced by local weather conditions. The observer will be in communication with all of the vessels onsite and possesses the authority to instruct them. If it is judged that flightless birds are drifting towards vessels working on the project, the observer has the authority to request via the Marine Co-ordinator that boats leave the area as soon as it is safe for them to do so. Vessels will be expected to move in a north-westerly direction unless otherwise instructed. Vessels can return to their previous work areas when an “all clear” has been given by the bird observer (via the Marine Co-ordinator).
Who Does the VMP Apply to?
3.4 The VMP applies to any vessel conducting any operations concerned with the construction of the project. Vessels working closer to Ireland’s Eye are more likely to have to consider the VMP in their day to day activities.
3.5 A nominated representative for each project vessel must sign the table in Section 1 once they have read and understood the VMP, and agreed to the conditions above the table. A copy of the VMP must be carried by each vessel.
When Does the VMP Apply?
3.6 Condition A of the VMP applies throughout the construction phase of the project, at all times of day, and all times of year.
3.7 Condition B of the VMP applies at all times of day between the dates 8th to 31st July inclusive.
Where Does the VMP Apply?
3.8 Condition A of the VMP relates specifically to the boundary of the Ireland’s Eye SPA. This location in relation to the subsea section of the project is provided in Figure 1. Regardless of where vessels are working, all vessels associated with the project should be given a copy of this VMP.
3.9 Condition B of the VMP does not refer to any specific boundaries, but is more likely to apply to vessels working on the marine diffuser section of the project where the subsea pipeline terminates. The likelihood of flightless auks encountering vessels will generally decrease the further towards the coast of the mainland a vessel is. Nevertheless, as with Condition A, all vessels associated with the project should be given a copy of this plan.

4 rpsgroup.com/uk
How is the VMP Implemented?
3.10 The contractor will be responsible for ensuring that the conditions of the VMP are met.
Any site induction for vessels will include information on the VMP, and a copy of the plan must be read and signed by a representative from each vessel. A copy of the VMP must be carried by each vessel.
3.11 Where possible, the position of vessels undertaking work will be routinely reviewed to ensure that vessels working under the VMP are compliant.
Why Does the VMP Need to be Implemented?
3.12 Ireland’s Eye, and the area of sea which surrounds it, is an SPA. This means that it is
one of Ireland’s most important sites for seabirds and is subject to high levels of environmental protection.
3.13 No activity that would result in adverse effect on site integrity can be permitted. This includes the construction and operation of the project and the operation of vessels associated with it. Measures are required to ensure the vessels operating as part of the construction of the project are aware of the SPA boundary location, and do not cross it, or approach it unnecessarily. This is the first objective of the VMP.
3.14 The protection afforded by SPA status applies to the nests of qualifying bird species on the cliffs, the waters around Ireland’s Eye which form part of the SPA, and to qualifying species that are using the sea (both inside and outside the SPA boundary) for foraging, loafing and other activities.
3.15 Most of the birds that are part of the SPA population use areas of sea beyond the SPA boundary. However, they will not be substantially impacted by the construction of the project, as they are mobile and can use areas of sea not occupied by vessels associated with the project. However, certain elements of the bird assemblage are more sensitive. This is because their offspring, which are hatched on rock ledges on the cliffs of Ireland’s Eye, are flightless when leaving the nest. When they drop into the sea and try to leave the area at the end of the breeding season, they and the adult that accompanies them are especially sensitive to vessel disturbance. The second objective of the VMP is to reduce the risk of such issues occurring. This only occurs in a period of several weeks from 8th to 31st July each year, so this is the only time at which this part of the VMP will apply.

5 rpsgroup.com/uk
ANNEX 1: GREATER DUBLIN DRAINAGE: VMP
Introduction
During construction of the Greater Dublin Drainage (GDD), a Vessel Management Plan (VMP) must be adhered to. The purpose of the VMP is twofold:
1. To avoid all vessels associated with the project unnecessarily approaching or crossing the boundary of the Ireland’s Eye Special Protection Area (SPA) at all times.
2. To protect flightless rafting auks originating from the SPA in July and August.
Particular winds and currents can cause these flightless auks to drift towards GDD working areas. A procedure is required to ensure their safety, and to avoid disturbance and collision with employed vessels.
The Ireland’s Eye SPA is located in close proximity to the GDD subsea section and diffuser, and the accompanying chart shows the location. This memo outlines the protocol and its implementation at GDD.
Procedure Marine Coordination
The Marine Co-ordinator will ensure that every vessel associated with the project is acquainted with the VMP. This is ensured by incorporating the below procedure in the Masters’ induction and in the Marine Coordination Procedure which is handed to every vessel working on the project. The Marine Co-ordinator will periodically ensure that vessels continue to understand and adhere to the VMP. Point 1 of the VMP is relevant at all times. During July and August, the Marine Co-ordinator will ensure added awareness of the VMP procedure, particularly point 2, by incorporating a general reminder of the rafting Auk procedures in the coordination meetings held at site. In addition, a bird observer will be appointed by the contractor. They will be on site providing a watching brief during this time. These observations will occur from Ireland’s Eye at all times of operation between the following dates: 8th July to 31st July. Should the surveyor identify groups of auks drifting towards the vessel working area the Marine Co-ordinator would be informed and vessels may be requested to stand down from the working area until such time that the birds have left. If currents or winds for several days have come from a south-easterly direction, extra attention to the possibility of rafting auks must be highlighted on the daily coordination meetings. Upon receipt of a rafting auk sighting (from either vessels or the dedicated observer) the Marine Co-ordinator must inform all vessels on site immediately and remind vessels to follow the procedure for such an event. The Marine Co-ordinator will keep all vessels up to date with sightings of rafting auks.

6 rpsgroup.com/uk
Vessels If rafting auks are sighted within or close to the WMR wind farm area all vessels are obliged to:
• Immediately report the sighting to the Marine Coordination with exact position of sighting
• When within 1000m of Ireland’s reduce speed to less 10 knots
• If working within 500m of sighting vacate this area as soon as it is safe to do so to at least 1000m. Leave the area in north-westerly direction unless other instructed by Marine Coordination
• Keep extra lookout for rafting auks and report to the Marine Coordination immediately if sighted

rpsgroup.com/uk
FIGURES
Figure 1 Vessel management restrictions Figure 2 Vessel management restrictions

500 m buffer stand off zone
1000 m buffer stand off zone
6°0'0"W
6°1'0"W
6°1'0"W
6°2'0"W
6°2'0"W
6°3'0"W
6°3'0"W
6°4'0"W
6°4'0"W
6°5'0"W
6°5'0"W
6°6'0"W
6°6'0"W
6°7'0"W
6°7'0"W
6°8'0"W
6°8'0"W
6°9'0"W
6°9'0"W
6°10'0"W
6°10'0"W
6°11'0"W
6°11'0"W
6°12'0"W
6°12'0"W
6°13'0"W
53°2
8'0"
N
53°2
8'0"
N
53°2
7'0"
N
53°2
7'0"
N
53°2
6'0"
N
53°2
6'0"
N
53°2
5'0"
N
53°2
5'0"
N
53°2
4'0"
N
53°2
4'0"
N
53°2
3'0"
N
53°2
3'0"
N
53°2
2'0"
N
53°2
2'0"
N
53°2
1'0"
N
53°2
1'0"
N
53°2
0'0"
N
53°2
0'0"
N
686000
686000
688000
688000
690000
690000
692000
692000
694000
694000
696000
696000
698000
698000
5914
000
5914
000
5916
000
5916
000
5918
000
5918
000
5920
000
5920
000
5922
000
5922
000
5924
000
5924
000
5926
000
5926
000
5928
000
5928
000
Drawing Title
Drawing Status
Drawing No.32102902
FinalScale @ A3
Job No.
DO NOT SCALE
This drawing is not to be used in whole in or part other than for the intended purposeand project as defined on this drawing. Refer to the contract for full terms and conditions.
1:50,00032102902
Drawn Check'd Appr'dPurpose of revisionRev. Date Rev'd
±
Figure 1 Vessel management restrictions
Greater Dublin Drainage ProjectProject
Service Layer Credits: Sources: Esri, HERE, DeLorme, USGS,Intermap, INCREMENT P, NRCan, Esri Japan, METI, Esri China(Hong Kong), Esri Korea, Esri (Thailand), MapmyIndia, NGCC, ©OpenStreetMap contributors, and the GIS User Community© Crown Copyright, 2017. All rights reserved. License No.EKEMS451807. Not to be used for Navigation.Coordinate system: UTM 29 N
The vessel exclusion zone is described by a rectangle with lowerleft and upper right corners:
53°23'44.808" N 6°4'32.381" W; 53°24'46.795" N 6°3'4.605" W-6.075661, 53.395210; -6.051279, 53.413569 (decimal degrees)694430, 5920284; 695971, 5922265 (UTM Zone 29 North)
The 500 m buffer stand off zone is described by a rectangle withlower left and upper right corners:
53°23'29.311"N 6°5'0.478"W; 53°25'2.241"N 6°2'36.476"W-6.083466, 53.390537; -6.043465, 53.418229 (decimal degrees)693931, 5919784; 696471, 5922764 (UTM Zone 29 North)
The 1000 m buffer stand off zone is described by a rectanglewith lower left and upper right corners:
53°23'13.813"N 6°5'28.569"W; 53°25'17.686"N 6°2'8.341"W-6.091269, 53.385863; -6.035650, 53.422889 (decimal degrees)693431, 5919284; 696970, 5923263 (UTM Zone 29 North)
0 0.25 0.5 0.75 1
Nautical Miles
0 0.25 0.5 0.75 1 1.25 1.5 1.75 2
Kilometres
Legend
Proposed Outfall Pipeline Route (Marine Section)
Ireland's Eye SPA
Vessel Exclusion Zone
Vessel stand off areas
CH Draft DraftStand off zone addeda 26/02/18 Draft

500 m buffer stand off zone
1000 m buffer stand off zone
6°1'0"W
6°1'0"W
6°2'0"W
6°2'0"W
6°3'0"W
6°3'0"W
6°4'0"W
6°4'0"W
6°5'0"W
6°5'0"W
6°6'0"W
6°6'0"W
6°7'0"W
53°2
6'0"
N
53°2
6'0"
N
53°2
5'0"
N
53°2
5'0"
N
53°2
4'0"
N
53°2
4'0"
N
53°2
3'0"
N
53°2
3'0"
N53
°22'
0"N
692000
692000
694000
694000
696000
696000
698000
698000
5918
000
5918
000
5920
000
5920
000
5922
000
5922
000
5924
000
5924
000
Drawing Title
Drawing Status
Drawing No.32102902
FinalScale @ A3
Job No.
DO NOT SCALE
This drawing is not to be used in whole in or part other than for the intended purposeand project as defined on this drawing. Refer to the contract for full terms and conditions.
1:25,00032102902
Drawn Check'd Appr'dPurpose of revisionRev. Date Rev'd
±
Figure 2 Vessel management restrictions
Greater Dublin Drainage ProjectProject
Service Layer Credits: Sources: Esri, HERE, DeLorme, USGS,Intermap, INCREMENT P, NRCan, Esri Japan, METI, Esri China(Hong Kong), Esri Korea, Esri (Thailand), MapmyIndia, NGCC, ©OpenStreetMap contributors, and the GIS User Community© Crown Copyright, 2017. All rights reserved. License No.EKEMS451807. Not to be used for Navigation.Coordinate system: UTM 29 N
The vessel exclusion zone is described by a rectangle with lowerleft and upper right corners:
53°23'44.808" N 6°4'32.381" W; 53°24'46.795" N 6°3'4.605" W-6.075661, 53.395210; -6.051279, 53.413569 (decimal degrees)694430, 5920284; 695971, 5922265 (UTM Zone 29 North)
The 500 m buffer stand off zone is described by a rectangle withlower left and upper right corners:
53°23'29.311"N 6°5'0.478"W; 53°25'2.241"N 6°2'36.476"W-6.083466, 53.390537; -6.043465, 53.418229 (decimal degrees)693931, 5919784; 696471, 5922764 (UTM Zone 29 North)
The 1000 m buffer stand off zone is described by a rectanglewith lower left and upper right corners:
53°23'13.813"N 6°5'28.569"W; 53°25'17.686"N 6°2'8.341"W-6.091269, 53.385863; -6.035650, 53.422889 (decimal degrees)693431, 5919284; 696970, 5923263 (UTM Zone 29 North)
0 0.25 0.5 0.75 1
Nautical Miles
0 0.25 0.5 0.75 1 1.25 1.5 1.75 2
Kilometres
Legend
Proposed Outfall Pipeline Route (Marine Section)
Ireland's Eye SPA
Vessel Exclusion Zone
Vessel stand off areas
CH Draft DraftStand off zone addeda 26/02/18 Draft