Appendix A - Example 2.3
83
LRFD Substructure Example 3 Hammerhead Pier on Spread Footing 1 Hammerhead Pier On Spread Footing This example illustrates the substructure design of a hammerhead pier cap with a single column supported on a spread footing on rock for a three span precast prestressed box beam bridge. The bridge has spans of 85’-3”, 86’-6” and 85’- 3” resulting in equal lengths of the modified AASHTO BII-48 box beam in all spans. The bridge has zero skew. Standard ADOT 32-inch f-shape barriers will be used resulting in a bridge configuration of 1’-5” barrier, 12’-0” outside shoulder, one 12’-0” lane, a 4’-0” inside shoulder and a 1’-5” barrier. The overall out-to-out width of the bridge is 30’-10”. A plan view and typical section of the bridge are shown in Figures 1 and 2. The following legend is used for the references shown in the left-hand column: [2.2.2] LRFD Specification Article Number [2.2.2-1] LRFD Specification Table or Equation Number [C2.2.2] LRFD Specification Commentary [A2.2.2] LRFD Specification Appendix [BDG] ADOT Bridge Design Guideline Superstructure Design Example 3 demonstrates the basic design features for the design of the superstructure for a three span precast prestressed box beam bridge using LRFD. Critical dimensions and loads are repeated here for ease of reference. Bridge Geometry Span lengths 85.25, 86.50, 85.25 ft Bridge width 30.83 ft Roadway width 28.00 ft Superstructure depth 3.17 ft Box beam moment of inertia 171,153 in 4 Loads DC Superstructure 816.3 kips DW Superstructure 66.2 kips Substructure This example demonstrates basic design features for design of a hammerhead pier supported on a spread footing on rock. The substructure has been analyzed in accordance with the AASHTO LRFD Bridge Design Specifications, 4 th Edition, 2007 and the 2008 Interim Revisions. Geotechnical The spread footing is designed to be supported on non erodible rock found at a depth of 6 feet below existing groundline. Per the geotechnical engineer, the rock is sound (Class I) with a rock mass rating (RMR) of 85. The bearing resistance of the rock mass for service limit state is 10 ksf corresponding to a tolerable settlement of ½ inch while the factored bearing resistance for strength limit state is 60 ksf. For sliding resistance assume a factored interface coefficient of friction value of 0.45 and the sliding resistance factor of 0.80.
Transcript of Appendix A - Example 2.3

LRFD Substructure Example 3 Hammerhead Pier on Spread Footing
1
Hammerhead Pier On Spread Footing
This example illustrates the substructure design of a hammerhead pier cap with a single column supported on a spread footing on rock for a three span precast prestressed box beam bridge. The bridge has spans of 85’-3”, 86’-6” and 85’-3” resulting in equal lengths of the modified AASHTO BII-48 box beam in all spans. The bridge has zero skew. Standard ADOT 32-inch f-shape barriers will be used resulting in a bridge configuration of 1’-5” barrier, 12’-0” outside shoulder, one 12’-0” lane, a 4’-0” inside shoulder and a 1’-5” barrier. The overall out-to-out width of the bridge is 30’-10”. A plan view and typical section of the bridge are shown in Figures 1 and 2. The following legend is used for the references shown in the left-hand column:
[2.2.2] LRFD Specification Article Number [2.2.2-1] LRFD Specification Table or Equation Number [C2.2.2] LRFD Specification Commentary [A2.2.2] LRFD Specification Appendix [BDG] ADOT Bridge Design Guideline
Superstructure Design Example 3 demonstrates the basic design features for the design of the superstructure for a three span precast prestressed box beam bridge using LRFD. Critical dimensions and loads are repeated here for ease of reference. Bridge Geometry
Span lengths 85.25, 86.50, 85.25 ft Bridge width 30.83 ft Roadway width 28.00 ft Superstructure depth 3.17 ft Box beam moment of inertia 171,153 in4
Loads DC Superstructure 816.3 kips DW Superstructure 66.2 kips
Substructure This example demonstrates basic design features for design of a hammerhead pier supported on a spread footing on rock. The substructure has been analyzed in accordance with the AASHTO LRFD Bridge Design Specifications, 4th Edition, 2007 and the 2008 Interim Revisions. Geotechnical The spread footing is designed to be supported on non erodible rock found at a depth of 6 feet below existing groundline. Per the geotechnical engineer, the rock is sound (Class I) with a rock mass rating (RMR) of 85. The bearing resistance of the rock mass for service limit state is 10 ksf corresponding to a tolerable settlement of ½ inch while the factored bearing resistance for strength limit state is 60 ksf. For sliding resistance assume a factored interface coefficient of friction value of 0.45 and the sliding resistance factor of 0.80.

LRFD Substructure Example 3 Hammerhead Pier on Spread Footing
2
Figure 1
Figure 2
LRFD Substructure Example 3 Hammerhead Pier on Spread Footing
3
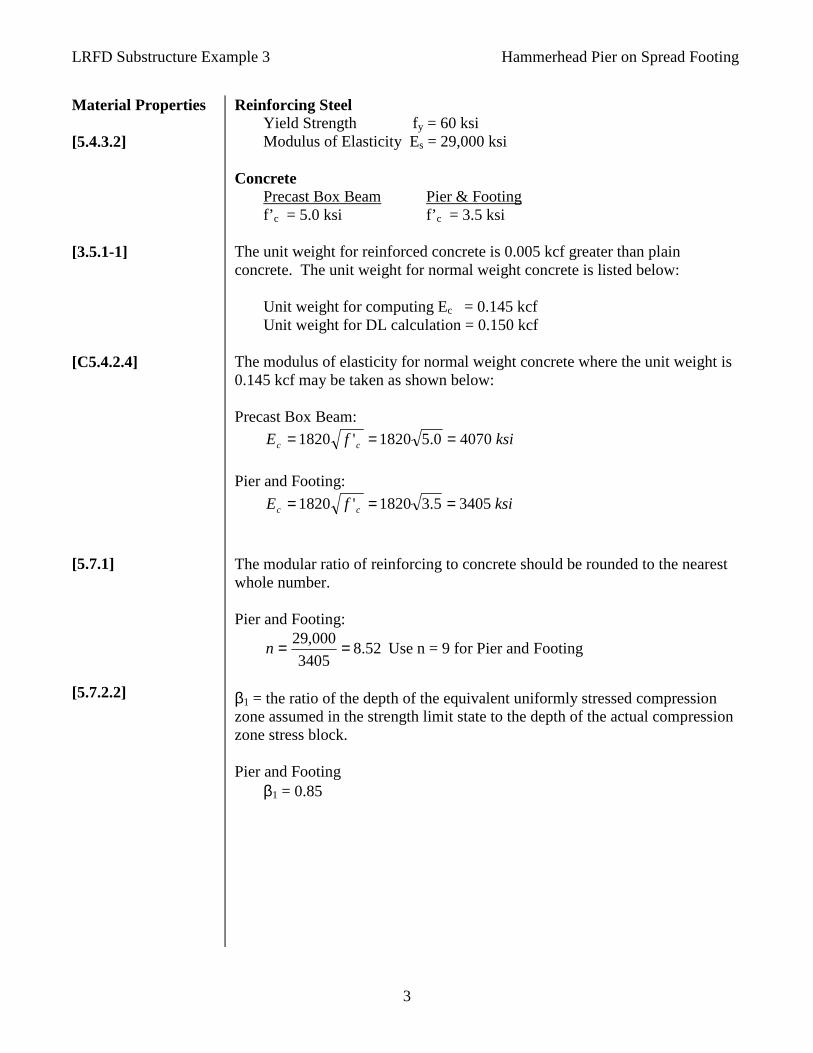
Material Properties [5.4.3.2] [3.5.1-1] [C5.4.2.4] [5.7.1] [5.7.2.2]
Reinforcing Steel Yield Strength fy = 60 ksi Modulus of Elasticity Es = 29,000 ksi
Concrete
Precast Box Beam Pier & Footing f’ c = 5.0 ksi f’c = 3.5 ksi
The unit weight for reinforced concrete is 0.005 kcf greater than plain concrete. The unit weight for normal weight concrete is listed below:
Unit weight for computing Ec = 0.145 kcf Unit weight for DL calculation = 0.150 kcf
The modulus of elasticity for normal weight concrete where the unit weight is 0.145 kcf may be taken as shown below: Precast Box Beam:
ksifE cc 40700.51820'1820 ===
Pier and Footing:
ksifE cc 34055.31820'1820 ===
The modular ratio of reinforcing to concrete should be rounded to the nearest whole number. Pier and Footing:
52.83405
000,29 ==n Use n = 9 for Pier and Footing
β1 = the ratio of the depth of the equivalent uniformly stressed compression zone assumed in the strength limit state to the depth of the actual compression zone stress block.
Pier and Footing
β1 = 0.85
LRFD Substructure Example 3 Hammerhead Pier on Spread Footing
4
Modulus of Rupture [5.4.2.6]
The modulus of rupture for normal weight concrete has several values. When used to calculate service level cracking, as specified in Article 5.7.3.4 for side reinforcing or in Article 5.7.3.6.2 for determination of deflections, the following equation should be used for the substructure:
ksiff cr 449.05.324.0'24.0 ===
When the modulus of rupture is used to calculate the cracking moment of a member for determination of the minimum reinforcing requirement as specified in Article 5.7.3.3.2, the following equation should be used for the substructure:
ksiff cr 692.05.337.0'37.0 ===
Soil Properties The soil above the rock has the following properties:
Depth 6.00 feet γs 0.110 kcf
The rock layer has the following properties:
Bearing Resistance 10.0 ksf service with ½ inch settlement 60.0 ksf strength Sliding Resistance 0.45 coefficient of friction 0.80 sliding resistance factor

LRFD Substructure Example 3 Hammerhead Pier on Spread Footing
5
Limit States [1.3.2] [1.3.2.1-1] [1.3.2.1-2] [1.3.2.1-3] [1.3.3] [1.3.4] [1.3.5] [BDG]
In the LRFD Specification, the general equation for design is shown below:
∑ =≤ rniii RRQ ϕγη
For loads for which a maximum value of γi is appropriate:
95.0≥= IRDi ηηηη
For loads for which a minimum value of γi is appropriate:
0.11 ≤=
IRDi ηηη
η
Ductility For strength limit state for conventional design and details complying with the LRFD Specifications and for all other limit states:
ηD = 1.0
Redundancy For the strength limit state for conventional levels of redundancy and for all other limit states:
ηR = 1.0 Operational Importance For the strength limit state for typical bridges and for all other limit states:
ηI = 1.0 For an ordinary structure with conventional design and details and conventional levels of ductility, redundancy, and operational importance, it can be seen that ηi = 1.0 for all cases. Since multiplying by 1.0 will not change any answers, the load modifier ηi has not been included in this example. For actual designs, the importance factor may be a value other than one. The importance factor should be selected in accordance with the ADOT Bridge Design Guidelines.
LRFD Substructure Example 3 Hammerhead Pier on Spread Footing
6
SUBSTRUCTURE Loads Section 3
[10.8.2] [10.8.3]
Loads There are several major changes and some minor changes concerning the determination of loads. The permanent loads must be kept separate since different load factors apply to different load types for different conditions. The live load is new as seen in the superstructure design. The dynamic load allowance is a constant rather than a function of the span. The Longitudinal Force in the Standard Specifications has been modified and replaced by the Braking Force. The wind and wind on live load are similar but the wind has a modification factor for elevations above 30 feet. While the vertical wind pressure is the same, the specification now clarifies how to apply the force to the proper limit state.
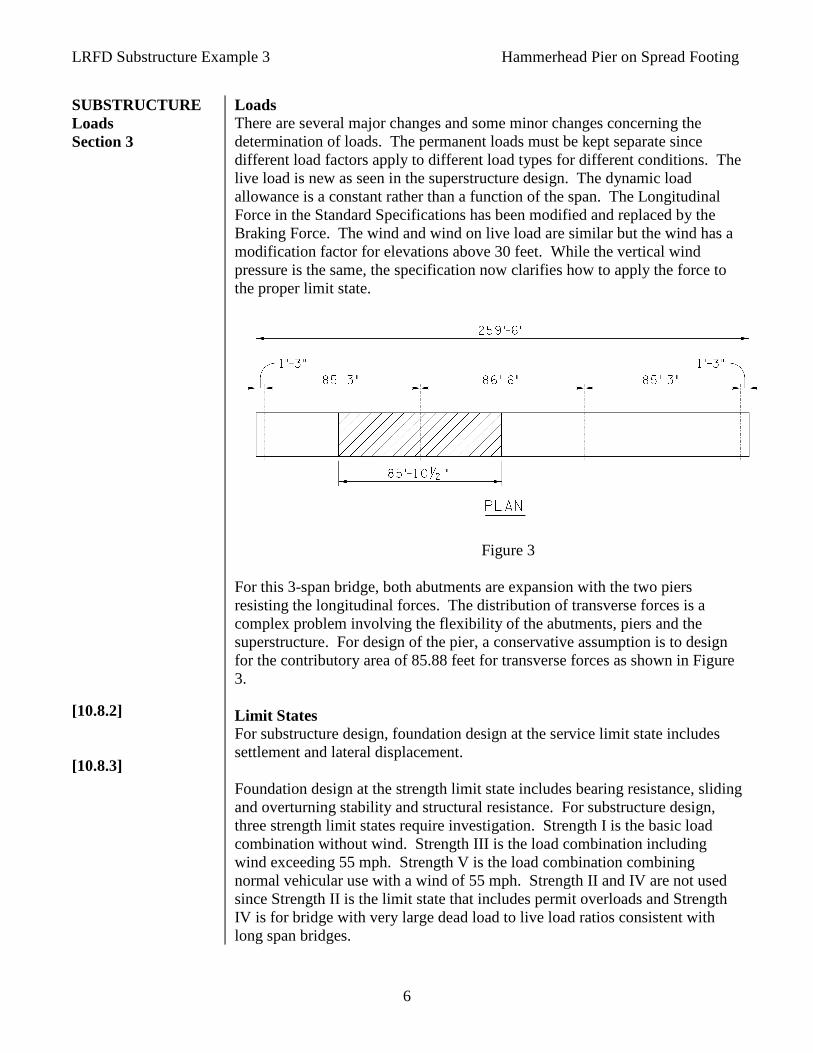
Figure 3 For this 3-span bridge, both abutments are expansion with the two piers resisting the longitudinal forces. The distribution of transverse forces is a complex problem involving the flexibility of the abutments, piers and the superstructure. For design of the pier, a conservative assumption is to design for the contributory area of 85.88 feet for transverse forces as shown in Figure 3.
Limit States For substructure design, foundation design at the service limit state includes settlement and lateral displacement. Foundation design at the strength limit state includes bearing resistance, sliding and overturning stability and structural resistance. For substructure design, three strength limit states require investigation. Strength I is the basic load combination without wind. Strength III is the load combination including wind exceeding 55 mph. Strength V is the load combination combining normal vehicular use with a wind of 55 mph. Strength II and IV are not used since Strength II is the limit state that includes permit overloads and Strength IV is for bridge with very large dead load to live load ratios consistent with long span bridges.

LRFD Substructure Example 3 Hammerhead Pier on Spread Footing
7
A diagram showing the general dimensions for the pier follows:
Figure 4

LRFD Substructure Example 3 Hammerhead Pier on Spread Footing
8
[3.5]
[3.5.1]
PERMANENT LOADS DC – Dead Load Structural Components The self-weight of the precast box beams and the weight from all other non-composite dead loads are based on simple span reaactions. The dead load pier reactions per box beam are:
Box Beam 0.798(85.50) = 68.23 k Int Diaphragms 0.821(3) = 2.46 k End Diaphragms 0.821(18.00 / 12.00)(2) = 2.46 k Non-Comp DL 0.373(84.00 + 2.50) = 32.26 k CIP Pier Diaph 0.150(2.75)(4.00)(1.0) = 1.65 k Total = 107.06 k
Figure 5
The dead load reaction from the barriers based on a continuous beam analysis is 9.55 kips per box beam assuming the load is equally distributed to all the beams.
DC superstructure = 107.06 + 9.55 = 116.61 kips per box beam. Total DC superstructure = (7 beams)(116.61) = 816.3 k
LRFD Substructure Example 3 Hammerhead Pier on Spread Footing
9
DC Pier
DC pier cap = 0.150[(5.50)(32.00)(8.00) – 0.50(2)(5.50)(13.00)(4.00)] = 168.3 k DC column = 0.150[(4.00)(6.00)(25.00)] = 90.0 k DC = 816.3 + 168.3 + 90.0 = 1074.6 k
DC Footing
DC footing = 0.150[(21.00)(20.00)(3.00)] = 189.0 k DC = 1074.6 + 189.0 = 1263.6 k
DW – Dead Load Wearing Surfaces and Utilities The DW load includes the future wearing surface and utility loads. This bridge has no utilities. The reaction from the future wearing surface based on a continuous beam analysis is 9.46 kips per box beam assuming the load is equally distributed to all beams.
DW = (7 beams)(9.46) = 66.22 k EV – Vertical Earth Pressure The LRFD Specification does not provide data on unit weights of well compacted soils. For this example use a vertical earth pressure based on a unit weight of 0.110 kcf for the soil placed over the footing. In actual design use the values specified in the Geotechnical Report.
EV = (0.110)[(21.00)(20.00) – (6.00)(4.00)](3.00) = 130.68 k

LRFD Substructure Example 3 Hammerhead Pier on Spread Footing
10
[3.6.1.1] [3.6.1.1.1]
TRANSIENT LOADS LL – Vehicular Live Load The number of design lanes is the integer part of the traffic opening divided by 12. For this bridge the number of design lanes equals 28 ÷ 12 = 2. For the reaction apply the multiple presence factor, m. The maximum pier reaction from live load for the HL93 equals 89.36 k (design truck) plus 59.32 k (design lane) = 148.68 kips per vehicle. For each wheel line the reaction is half that amount or 74.34 kips. The maximum uplift from live load equals -10.0 k (design truck) plus -5.2 k (design lane) = –15.2 kips per vehicle. While several combinations of possible live load locations exist, engineering judgment and experience can reduce the number to a few critical locations as follows: Live Load 1
This live load is located 2 feet from the left side barrier producing maximum moments and shears on the pier cap overhang and maximum moments on the column and footing in one direction.
Live Load 2 This live load is located 6 feet from Live load 1 adding to the axial load but reducing the moment in the column and footing.
Figure 6
LL 1 M trans = 74.34(12.00 + 6.00) = 1338 ft-k LL 2 M trans = 74.34(0.00 – 6.00) = -446 ft-k
LRFD Substructure Example 3 Hammerhead Pier on Spread Footing
11
[3.6.2] [3.6.2.1-1] [3.6.1.1.2] [3.6.1.1.2-1]
IM – Dynamic Load Allowance Dynamic load allowance equal to 33% is applied to the design truck but not the design lane load for the design of the pier cap and column. The dynamic load allowance is 0.33(89.36) = 29.49 kips per vehicle. The dynamic load allowance for uplift is 0.33(-10.0) = –3.3 kips per vehicle. The dynamic load allowance is not included for design of the footing. Live load and Dynamic Load Allowance For the superstructure design, the combination of the live load plus dynamic load allowance yields a load of (148.68 + 29.49) = 178.17 kips per vehicle or 89.09 kips per wheel. The uplift reaction is (-15.2 – 3.3) = -18.5 kips.
LL + IM 1 M trans = 89.09(12.00 + 6.00) = 1604 ft-k LL + IM 2 M trans = 89.09(0.00 – 6.00) = -535 ft-k
Multiple Presence Factor Since the critical moment and shear in the pier overhang is the result of a single vehicle the multiple presence factor of 1.20 must be used. When both live loads are used the multiple presence factor equals 1.00. The critical axial force and moment from live load including the multiple presence factor is:
Pmax = (148.68)(2 vehicles)(1.0) = 297.4 k Pmin = (-15.2)(2 vehicles)(1.0) = -30.4 k M trans = (1338)(1 vehicle)(1.20) = 1606 ft-k
The critical axial force and moment from live load plus dynamic load allowance including the multiple presence factor is:
Pmax = (148.68 + 29.49)(2 vehicles)(1.0) = 356.4 k Pmin = (-15.2 – 3.3)(2 vehicles)(1.0) = -37.0 k M trans = (1604)(1 vehicles)(1.20) = 1925 ft-k
LRFD Substructure Example 3 Hammerhead Pier on Spread Footing
12
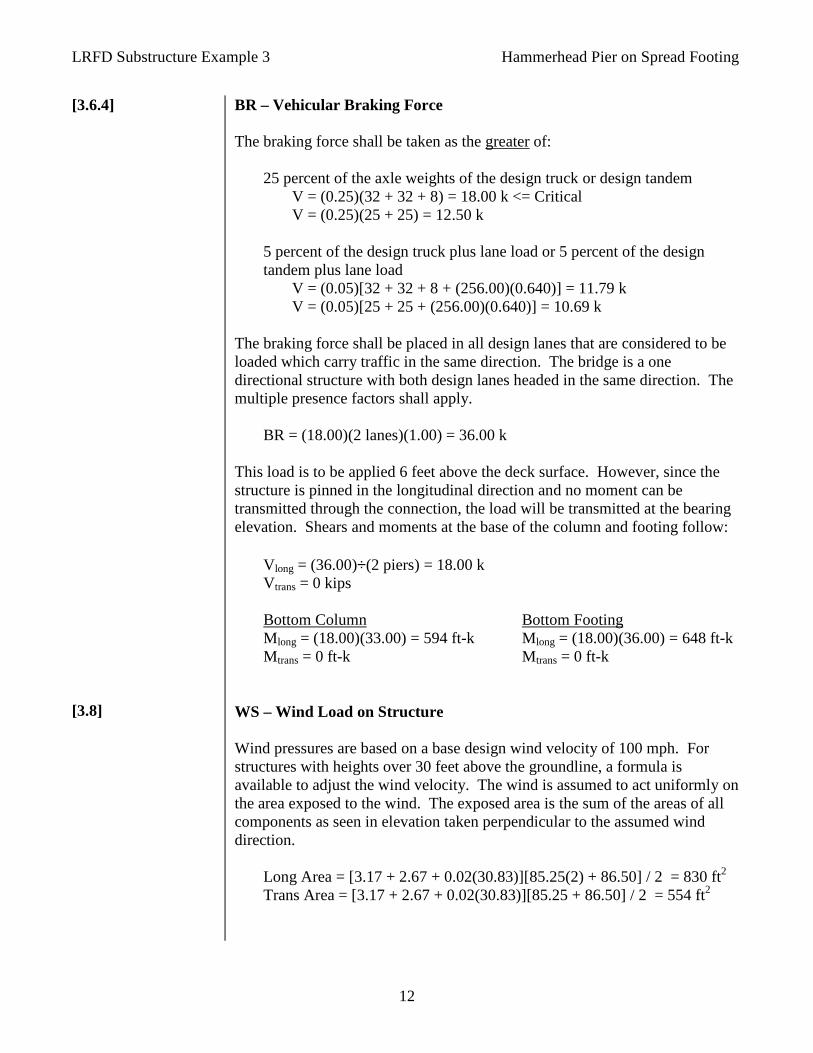
[3.6.4] [3.8]
BR – Vehicular Braking Force The braking force shall be taken as the greater of:
25 percent of the axle weights of the design truck or design tandem V = (0.25)(32 + 32 + 8) = 18.00 k <= Critical V = (0.25)(25 + 25) = 12.50 k
5 percent of the design truck plus lane load or 5 percent of the design tandem plus lane load
V = (0.05)[32 + 32 + 8 + (256.00)(0.640)] = 11.79 k V = (0.05)[25 + 25 + (256.00)(0.640)] = 10.69 k
The braking force shall be placed in all design lanes that are considered to be loaded which carry traffic in the same direction. The bridge is a one directional structure with both design lanes headed in the same direction. The multiple presence factors shall apply.
BR = (18.00)(2 lanes)(1.00) = 36.00 k
This load is to be applied 6 feet above the deck surface. However, since the structure is pinned in the longitudinal direction and no moment can be transmitted through the connection, the load will be transmitted at the bearing elevation. Shears and moments at the base of the column and footing follow:
V long = (36.00)÷(2 piers) = 18.00 k Vtrans = 0 kips
Bottom Column Bottom Footing M long = (18.00)(33.00) = 594 ft-k Mlong = (18.00)(36.00) = 648 ft-k M trans = 0 ft-k Mtrans = 0 ft-k
WS – Wind Load on Structure Wind pressures are based on a base design wind velocity of 100 mph. For structures with heights over 30 feet above the groundline, a formula is available to adjust the wind velocity. The wind is assumed to act uniformly on the area exposed to the wind. The exposed area is the sum of the areas of all components as seen in elevation taken perpendicular to the assumed wind direction.
Long Area = [3.17 + 2.67 + 0.02(30.83)][85.25(2) + 86.50] / 2 = 830 ft2
Trans Area = [3.17 + 2.67 + 0.02(30.83)][85.25 + 86.50] / 2 = 554 ft2

LRFD Substructure Example 3 Hammerhead Pier on Spread Footing
13
Wind on Superstructure [3.8.1.2.2]
For this problem the wind sees a superstructure depth of 6.46 feet. Since the soffit is 30 feet above the ground, the wind velocity and corresponding superstructure pressure should be adjusted based on the average superstructure height above the ground equal to 30.00 + 6.46 / 2 = 33.23 feet. The design wind velocity is:
=
0
30 ln5.2Z
Z
V
VVV
BoDZ
For a structure in open country the following variables are used.
V0 = 8.20 Z0 = 0.23
In the absence of better criteria assume that V30 = VB = 100 mph.
( ) ( ) 10223.0
23.33ln
100
10020.85.2 =
⋅⋅=DZV mph
The design wind pressure may be determined as:
( )BB
DZBD PP
VPP 04.1
000,10
102
000,10
22
===
The base pressure for girder bridges corresponding to the 100 mph wind is 0.050 psf. The minimum wind loading shall not be less than 0.30 klf. Since the wind exposure depth of 6.46 feet is greater than 6 feet this criteria is satisfied. The AASHTO LRFD 2008 Interim Revision provided an approximate method for girder bridges with spans 125 feet or less and a maximum height of 30 feet above ground or water level. The spans are less than the 125 specified but the height of the bridge exceeds the 30 feet limit. Therefore, the general method will be used 0 Degree Skew Angle
V long = (830)(0.000)(1.04) = 0.00 k Vtrans = (554)(0.050)(1.04) = 28.81 k
15 Degree Skew Angle V long = (830)(0.006)(1.04) = 5.18 k Vtrans = (554)(0.044)(1.04) = 25.35 k
30 Degree Skew Angle V long = (830)(0.012)(1.04) = 10.36 k Vtrans = (554)(0.041)(1.04) = 23.62 k
LRFD Substructure Example 3 Hammerhead Pier on Spread Footing
14
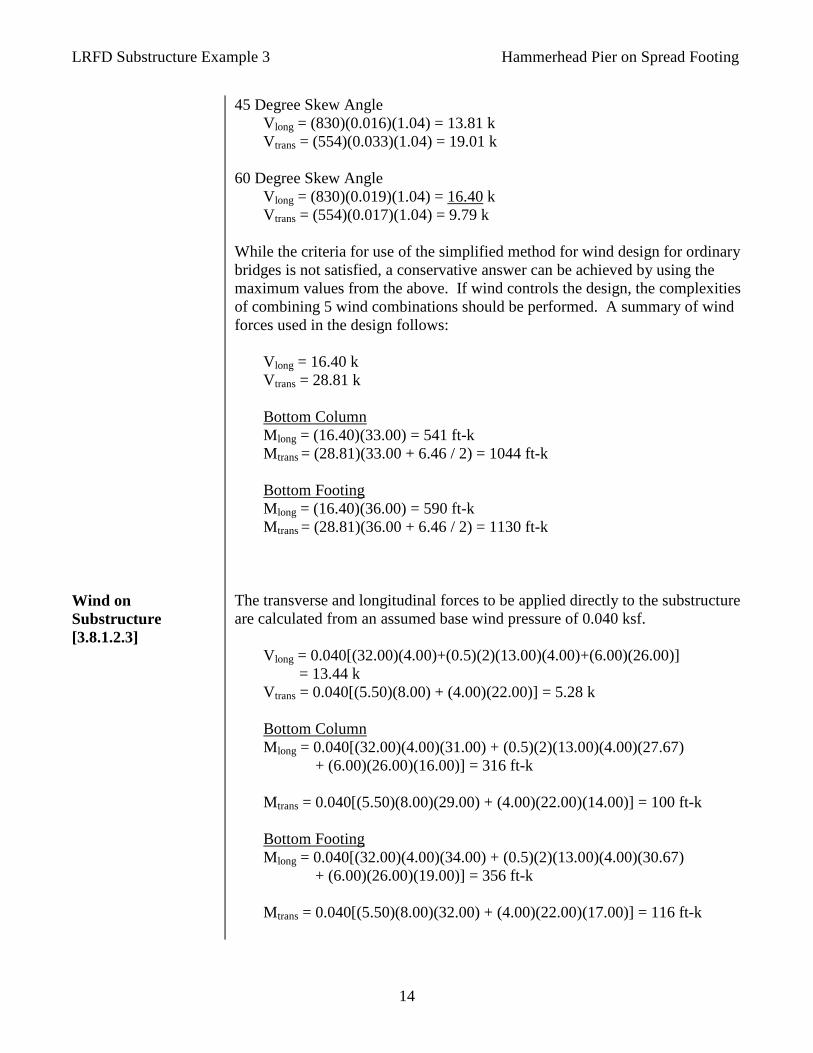
Wind on Substructure [3.8.1.2.3]
45 Degree Skew Angle V long = (830)(0.016)(1.04) = 13.81 k Vtrans = (554)(0.033)(1.04) = 19.01 k
60 Degree Skew Angle
V long = (830)(0.019)(1.04) = 16.40 k Vtrans = (554)(0.017)(1.04) = 9.79 k
While the criteria for use of the simplified method for wind design for ordinary bridges is not satisfied, a conservative answer can be achieved by using the maximum values from the above. If wind controls the design, the complexities of combining 5 wind combinations should be performed. A summary of wind forces used in the design follows:
V long = 16.40 k Vtrans = 28.81 k Bottom Column M long = (16.40)(33.00) = 541 ft-k M trans = (28.81)(33.00 + 6.46 / 2) = 1044 ft-k Bottom Footing M long = (16.40)(36.00) = 590 ft-k M trans = (28.81)(36.00 + 6.46 / 2) = 1130 ft-k
The transverse and longitudinal forces to be applied directly to the substructure are calculated from an assumed base wind pressure of 0.040 ksf.
V long = 0.040[(32.00)(4.00)+(0.5)(2)(13.00)(4.00)+(6.00)(26.00)] = 13.44 k Vtrans = 0.040[(5.50)(8.00) + (4.00)(22.00)] = 5.28 k Bottom Column M long = 0.040[(32.00)(4.00)(31.00) + (0.5)(2)(13.00)(4.00)(27.67) + (6.00)(26.00)(16.00)] = 316 ft-k M trans = 0.040[(5.50)(8.00)(29.00) + (4.00)(22.00)(14.00)] = 100 ft-k Bottom Footing M long = 0.040[(32.00)(4.00)(34.00) + (0.5)(2)(13.00)(4.00)(30.67) + (6.00)(26.00)(19.00)] = 356 ft-k M trans = 0.040[(5.50)(8.00)(32.00) + (4.00)(22.00)(17.00)] = 116 ft-k
LRFD Substructure Example 3 Hammerhead Pier on Spread Footing
15
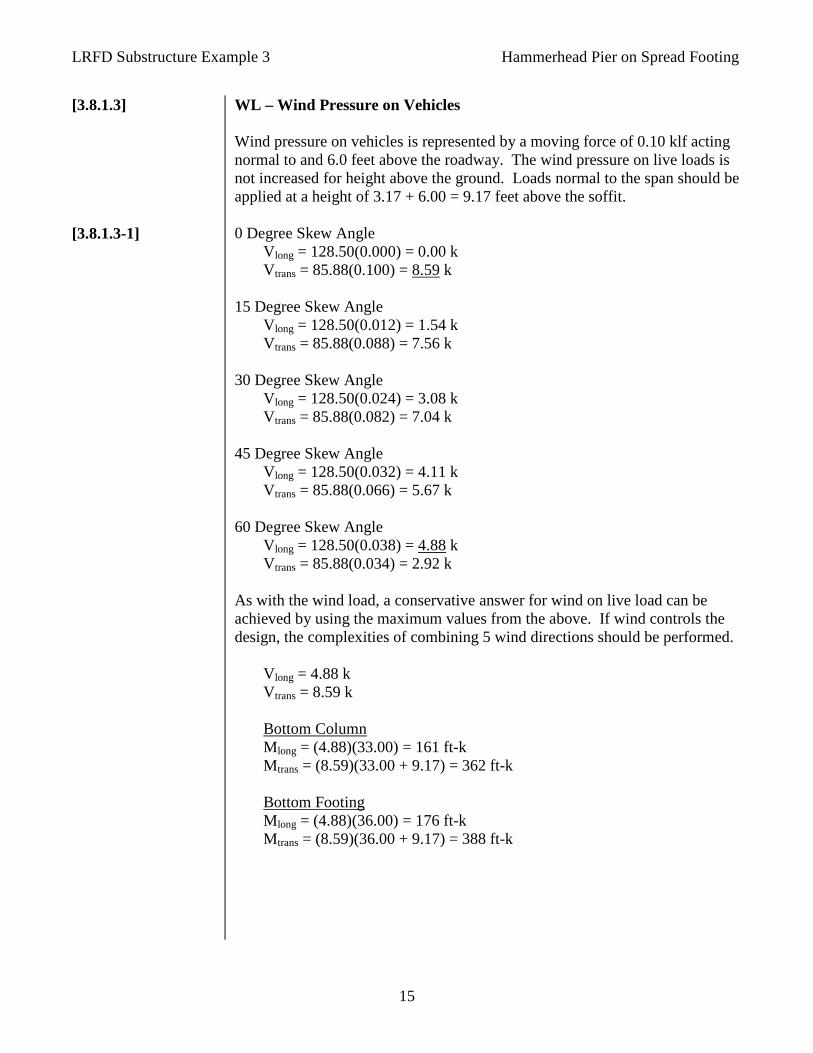
[3.8.1.3] [3.8.1.3-1]
WL – Wind Pressure on Vehicles Wind pressure on vehicles is represented by a moving force of 0.10 klf acting normal to and 6.0 feet above the roadway. The wind pressure on live loads is not increased for height above the ground. Loads normal to the span should be applied at a height of 3.17 + 6.00 = 9.17 feet above the soffit. 0 Degree Skew Angle
V long = 128.50(0.000) = 0.00 k Vtrans = 85.88(0.100) = 8.59 k
15 Degree Skew Angle
V long = 128.50(0.012) = 1.54 k Vtrans = 85.88(0.088) = 7.56 k
30 Degree Skew Angle
V long = 128.50(0.024) = 3.08 k Vtrans = 85.88(0.082) = 7.04 k
45 Degree Skew Angle
V long = 128.50(0.032) = 4.11 k Vtrans = 85.88(0.066) = 5.67 k
60 Degree Skew Angle
V long = 128.50(0.038) = 4.88 k Vtrans = 85.88(0.034) = 2.92 k
As with the wind load, a conservative answer for wind on live load can be achieved by using the maximum values from the above. If wind controls the design, the complexities of combining 5 wind directions should be performed.
V long = 4.88 k Vtrans = 8.59 k Bottom Column M long = (4.88)(33.00) = 161 ft-k M trans = (8.59)(33.00 + 9.17) = 362 ft-k Bottom Footing M long = (4.88)(36.00) = 176 ft-k M trans = (8.59)(36.00 + 9.17) = 388 ft-k
LRFD Substructure Example 3 Hammerhead Pier on Spread Footing
16
Uniform Temperature [BDG] Creep & Shrinkage [BDG]
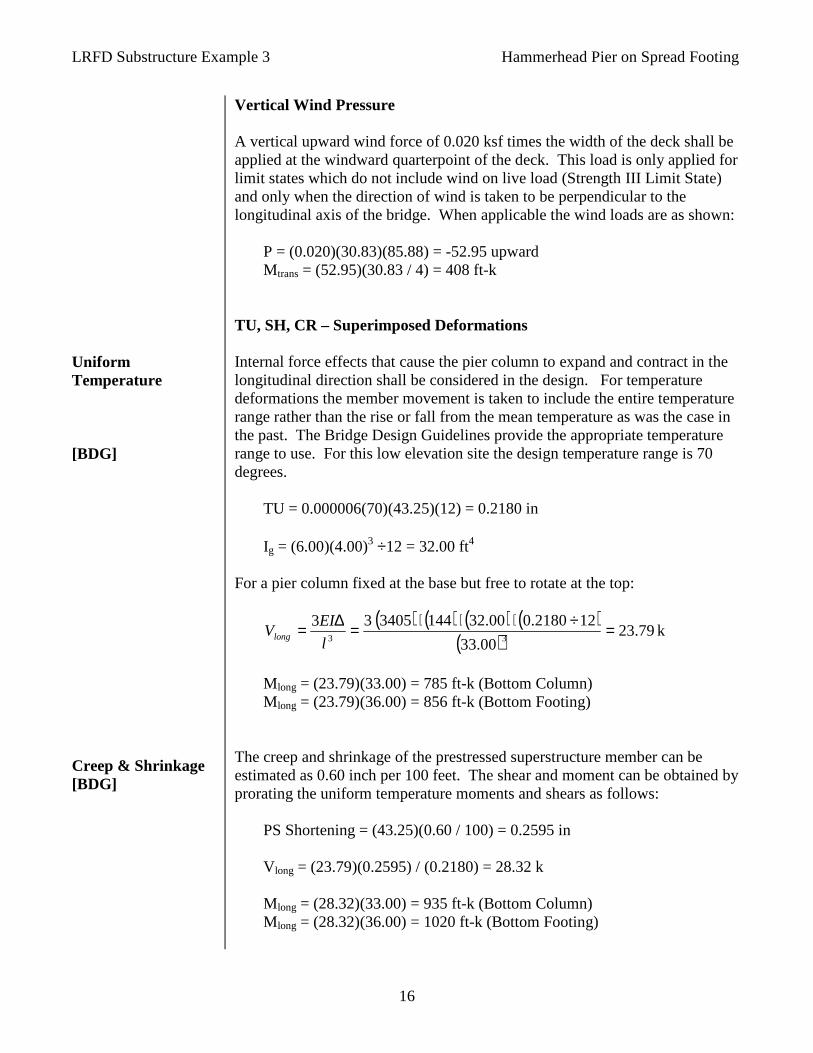
Vertical Wind Pressure
A vertical upward wind force of 0.020 ksf times the width of the deck shall be applied at the windward quarterpoint of the deck. This load is only applied for limit states which do not include wind on live load (Strength III Limit State) and only when the direction of wind is taken to be perpendicular to the longitudinal axis of the bridge. When applicable the wind loads are as shown:
P = (0.020)(30.83)(85.88) = -52.95 upward M trans = (52.95)(30.83 / 4) = 408 ft-k
TU, SH, CR – Superimposed Deformations Internal force effects that cause the pier column to expand and contract in the longitudinal direction shall be considered in the design. For temperature deformations the member movement is taken to include the entire temperature range rather than the rise or fall from the mean temperature as was the case in the past. The Bridge Design Guidelines provide the appropriate temperature range to use. For this low elevation site the design temperature range is 70 degrees.
TU = 0.000006(70)(43.25)(12) = 0.2180 in
Ig = (6.00)(4.00)3 ÷12 = 32.00 ft4
For a pier column fixed at the base but free to rotate at the top:
( ) ( ) ( ) ( )( )
79.2300.33
122180.000.3214434053333
=÷⋅⋅⋅=∆=l
EIVlong k
M long = (23.79)(33.00) = 785 ft-k (Bottom Column) M long = (23.79)(36.00) = 856 ft-k (Bottom Footing)
The creep and shrinkage of the prestressed superstructure member can be estimated as 0.60 inch per 100 feet. The shear and moment can be obtained by prorating the uniform temperature moments and shears as follows:
PS Shortening = (43.25)(0.60 / 100) = 0.2595 in
V long = (23.79)(0.2595) / (0.2180) = 28.32 k M long = (28.32)(33.00) = 935 ft-k (Bottom Column) M long = (28.32)(36.00) = 1020 ft-k (Bottom Footing)

LRFD Substructure Example 3 Hammerhead Pier on Spread Footing
17
SE - Differential Settlement Differential Settlement will be a minor load for this bridge. The foundation is supported on rock and the differential settlement will only apply for loads applied after the deck is made continuous (composite dead loads consisting of the barriers and the future wearing surface). Geotechnical information is usually not available early in the design, therefore the bridge engineer should determine a conservative amount of settlement that the bridge can sustain to eliminate the need for redesign later. For this structure most of the settlement will take place prior to the spans being made continuous. A very conservative assumption would be to assume that the structure may see ¼ inch settlement. The following fixed end moments result. Spans 1 and 3:
( ) ( ) ( ) ( )( ) ( )[ ] 58212
25.8512
25.07153,17140706622
=÷⋅
⋅⋅⋅⋅=∆= beams
L
EIFEM ft-k
Span 2:
( ) ( ) ( ) ( )( ) ( )[ ] 56612
50.8612
25.07153,17140706622
=÷⋅
⋅⋅⋅⋅=∆= beams
L
EIFEM ft-k
The above fixed end moments were input into a continuous beam program to yield the corresponding output. Since the top of the pier and abutments are pinned the horizontal shear and moments equal zero for the substructures. The maximum reaction at Pier 1 is caused by settlement of Abutment 1 and Pier 2 only with the maximum reaction equal to 13.3 kips. The maximum uplift at Pier 1 is caused by settlement of Pier 1 and Abutment 2 only with the minimum reaction equal to -13.3 kips. Bridge Group Design Guidelines for foundations have not been finalized at this time. Refer to these guidelines for clarification on this issue.

LRFD Substructure Example 3 Hammerhead Pier on Spread Footing
18
[3.7] [3.7.3.1-1]
WA - Stream Force For the design event, the Bridge Hydraulics Report has provided the following data:
Depth of flow 15.0 feet Velocity 9.0 ft/sec Scour depth 15.0 feet (theoretical calculated scour)
The Geotechnical Foundation Report has described the soil layer 6 feet below the groundline as a non-erodible rock. Therefore the design scour depth is 6 feet instead of the 15 feet calculated scour reported in the Drainage Report. The stream is assumed to be directed at an angle of attack of 15 degrees from the theoretical normal direction. Debris is assumed to accumulate on the pier for the upper 12 feet. The LRFD Specification uses the term longitudinal to mean along the direction of the stream flow which is in the transverse direction of the bridge creating possible confusion. The longitudinal (transverse bridge direction) uniformly distributed pressure from stream flow may be taken as:
( ) ( )113.0
1000
0.94.1
1000
22
=⋅==VC
p D ksf
where
CD = drag coefficient taken from Table 3.7.3.1-1. = 1.4 for square-ended piers or for lodged debris V = design velocity of water for the design event.
For the longitudinal (transverse bridge direction) direction with debris the effective width of the column is 4 feet plus 2 feet debris on each side for a width of 8 feet.
w = (0.113)(8.00) = 0.904 k/ft (Column with Debris) w = (0.113)(4.00) = 0.452 k/ft (Column) w = (0.113)(20.00) = 2.260 k/ft (Footing)
Longitudinal (transverse bridge direction) Shear and Moment:
Vcol = (0.904)(12.00) + (0.452)(6.00) = 13.56 k
Mcol = (0.904)(12.00)(12.00) + (0.452)(6.00)(3.00) = 138 ft-k

LRFD Substructure Example 3 Hammerhead Pier on Spread Footing
19
[3.7.3.2-1]
V footing = (0.904)(12.00) + (0.452)(6.00) + (2.260)(3.00) = 20.34 k M footing = (0.904)(12.00)(15.00) + (0.452)(6.00)(6.00) + (2.260)(3.00)(1.50) = 189 ft-k
For a 15 degree angle of attack, the lateral (longitudinal bridge direction) uniformly distributed pressure may be taken as:
( ) ( )065.0
1000
0.98.0
1000
22
=⋅==VC
p L ksf
where
p = lateral pressure (ksf) CL = lateral drag coefficient specified in Table 3.7.3.2-1 = 0.8 by interpolation from Table
This lateral (longitudinal bridge direction) pressure is applied to the appropriate area as follows:
w = (0.065)(2.00 + 6.00 + 2.00) = 0.650 k/ft (Column with Debris) w = (0.065)(6.00) = 0.390 k/ft (Column) w = (0.065)(21.00) = 1.365 k/ft (Footing)
Shear and Moment:
Vcol = (0.650)(12.00) + (0.390)(6.00) = 10.14 k Mcol = (0.650)(12.00)(12.00) + (0.390)(6.00)(3.00) = 101 ft-k
V footing = (0.650)(12.00) + (0.390)(6.00) + (1.365)(3.00) = 14.24 k M footing = (0.650)(12.00)(15.00) + (0.390)(6.00)(6.00) + (1.365)(3.00)(1.50) = 137 ft-k
For this example problem, only the design event forces have been calculated. In an actual design the superflood must also be considered. Refer to the Bridge Hydraulic Guidelines for additional information. Since the footing is founded on non-erodible rock the scour depth will not change but the velocity and corresponding stream forces will increase for the super flood event.

LRFD Substructure Example 3 Hammerhead Pier on Spread Footing
20
A summary of unfactored axial forces, shears and moments is shown below. Bottom of Column Load Pmax Pmin Vlong Vtrans Mlong M trans k k k k ft-k ft-k DC 1074.6 1074.6 0 0 0 0 DW 66.2 0 0 0 0 0 EV 0 0 0 0 0 0 LL+IM 356.4 -37.0 0 0 0 1925 BR 0 0 18.00 0 594 0 WA 0 0 10.14 13.56 101 138 WSsuper 0 0 16.40 28.81 541 1044 WSsub 0 0 13.44 5.28 316 100 WS 0 0 29.84 34.09 857 1144 WSvert 0 -53.0 0 0 0 408 WL 0 0 4.88 8.59 161 362 TU 0 0 23.79 0 785 0 CR+SH 0 0 28.32 0 935 0 SE 13.3 -13.3 0 0 0 0
Bottom of Footing Load Pmax Pmin Vlong Vtrans Mlong M trans k k k k ft-k ft-k DC 1263.6 1263.6 0 0 0 0 DW 66.2 0 0 0 0 0 EV 130.7 0 0 0 0 0 LL 297.4 -30.4 0 0 0 1606 BR 0 0 18.00 0 648 0 WA 0 0 14.24 20.34 137 189 WSsuper 0 0 16.40 28.81 590 1130 WSsub 0 0 13.44 5.28 356 116 WS 0 0 29.84 34.09 946 1246 WSvert 0 -53.0 0 0 0 408 WL 0 0 4.88 8.59 176 388 TU 0 0 23.79 0 856 0 CR+SH 0 0 28.32 0 1020 0 SE 13.3 -13.3 0 0 0 0

LRFD Substructure Example 3 Hammerhead Pier on Spread Footing
21
[3.4.1-1]
LOAD COMBINATIONS STRENGTH I
Max = 1.25DC + 1.50DW + 1.35EV + 0.50(CR + SH) + 1.75(LL + IM + BR) + 1.00WA + 0.50TU + 1.00SE Min = 0.90DC + 0.65DW + 1.00EV + 0.50(CR + SH) + 1.75(LL + IM + BR) + 1.00WA + 0.50TU + 1.00SE
STRENGTH III
Max = 1.25DC + 1.50DW + 1.35EV + 0.50(CR + SH) + 1.00WA + 1.40(WS + WSvert) + 0.50TU + 1.00SE Min = 0.90DC + 0.65DW + 1.00EV + 0.50(CR + SH) + 1.00WA +1.40(WS + WSvert) + 0.50TU + 1.00SE
STRENGTH V Max = 1.25DC + 1.50DW + 1.35EV + 0.50(CR + SH) + 1.35(LL + IM + BR) + 1.00WA + 0.40WS + 1.00WL + 0.50TU + 1.00SE Min = 0.90DC + 0.65DW + 1.00EV + 0.50(CR + SH) + 1.35(LL + IM + BR) + 1.00WA + 0.40WS + 1.00WL + 0.50TU + 1.00SE
SERVICE I Max = 1.00(DC + DW + EV + CR + SH) + 1.00(LL + IM + BR) + 1.00WA + 0.30WS + 1.00WL + 1.00TU + 1.00SE
Since the creep and shrinkage forces were determined based on use of the gross moment of inertia of the columns a 0.50 load factor is appropriate for all strength limit states.

LRFD Substructure Example 3 Hammerhead Pier on Spread Footing
22
Pier Cap Design [3.6.3.1] [5.8.1.1]
A strut-and-tie analysis is demonstrated in this example but is not required by Bridge Group. Each designer should determine the appropriateness of the analysis method for each situation when performing an actual design. Step 1 – Determine Structural Model The sectional model of analysis is appropriate for the design of a pier cap where the assumptions of traditional beam theory are valid. However, the strut-and-tie model should be considered for situations in which the distance between the centers of the applied load and the supporting reactions is less than twice the member thickness. Components in which the distance from the point of zero shear to the face of the support is less than twice the depth or in which a load causing more than one-half of the shear at a support is closer than twice the depth from the face of the support may be considered to be deep components and require a strut-and-tie analysis. For this problem the webs are closer than twice the section depth so the strut-and-tie model is used. A strut-and-tie model is used to determine the internal force effects near supports and the points of application of concentrated loads. A strut-and-tie analysis is a strength limit state analysis. As such no service limit state analysis is performed. The exterior node is under the bearing pad that is assumed to be 12 inches wide. Each interior node is under two bearing pads; one from each adjacent box beam.A section showing the relationship between the transverse frame model and the typical section is shown in Figure 7 below.
Figure 7

LRFD Substructure Example 3 Hammerhead Pier on Spread Footing
23
Step 2 – Create Strut-and-Tie Model A half section of the strut-and-tie model showing the nodes, angles and dimensions in inches is shown in Figure 8. In determining the model, consideration must be given to the required depth of struts, ties and the nodal zone. Establishing geometry requires trial and error in which member sizes are assumed, the truss geometry is established, member forces are determined, and the assumed member sizes verified. The top tie is located 6.5 inches from the top and the bottom strut is located 5.5 inches normal to the bottom. The support reactions and moments can be found from equilibrium since the structural element is statically determinate.
Figure 8

LRFD Substructure Example 3 Hammerhead Pier on Spread Footing
24
Step 3 – Determine Loads In a strut-and-tie analysis the location of the applied load affects the answer. For a pier cap supporting precast members, the loads are applied at the top nodes. For this problem, Strength I Limit State with one live load case will be investigated. The live load case will consist of the live load placed two feet from the barrier face to produce the maximum moment and shear. The pier cap weight is distributed to the nodes based on the contributing span of the nodes based on simple span reactions. Figure 9 shows the nodal loads due to the cap self-weight. The factored node concentrated loads are shown below:
Node A/P: R = 1.25(0.150)(5.50)(4.00)(4.00+5.23) / 2 = 19.04 k Node C/N: R = 1.25(0.150)(5.50)(4.00)(5.23+6.46) / 2 = 24.11 k Node E/L: R = 1.25(0.150)(5.50)(4.00)(6.46+7.69) / 2 = 29.18 k Node G/J: R = 1.25(0.150)(5.50)[1.00)(7.69+8.00) / 2 +
(3.00)(8.00)] = 32.84 k Total R = 2[19.04 + 24.11 + 29.18 + 32.84] = 210.34 k
Figure 9

LRFD Substructure Example 3 Hammerhead Pier on Spread Footing
25
The dead load from the superstructure is concentrated in the box beam webs. Each beam end is supported by two elastomeric bearing pads. The support mechanism of bearing pads and a cast-in-place diaphragm complicates the assumption of how the load is transmitted to the pier cap. The non-composite dead loads clearly are transmitted through the bearing pads. The other loads are mainly carried through the cast-in-place concrete diaphragm. For this problem the loads will be assumed to act as concentrated loads through the bearing pads.
Node A/P: R = 1.25(116.61) / 2 + 1.50(9.46) / 2 = 79.98 k Node C/N: R = 1.25(116.61) + 1.50(9.46) = 159.95 k Node E/L: R = 1.25(116.61) + 1.50(9.46) = 159.95 k Node G/J: R = 1.25(116.61) + 1.50(9.46) = 159.95 k Total R = 2[79.98 + (3)(159.95)] = 1119.66 k
Figure 10
LRFD Substructure Example 3 Hammerhead Pier on Spread Footing
26
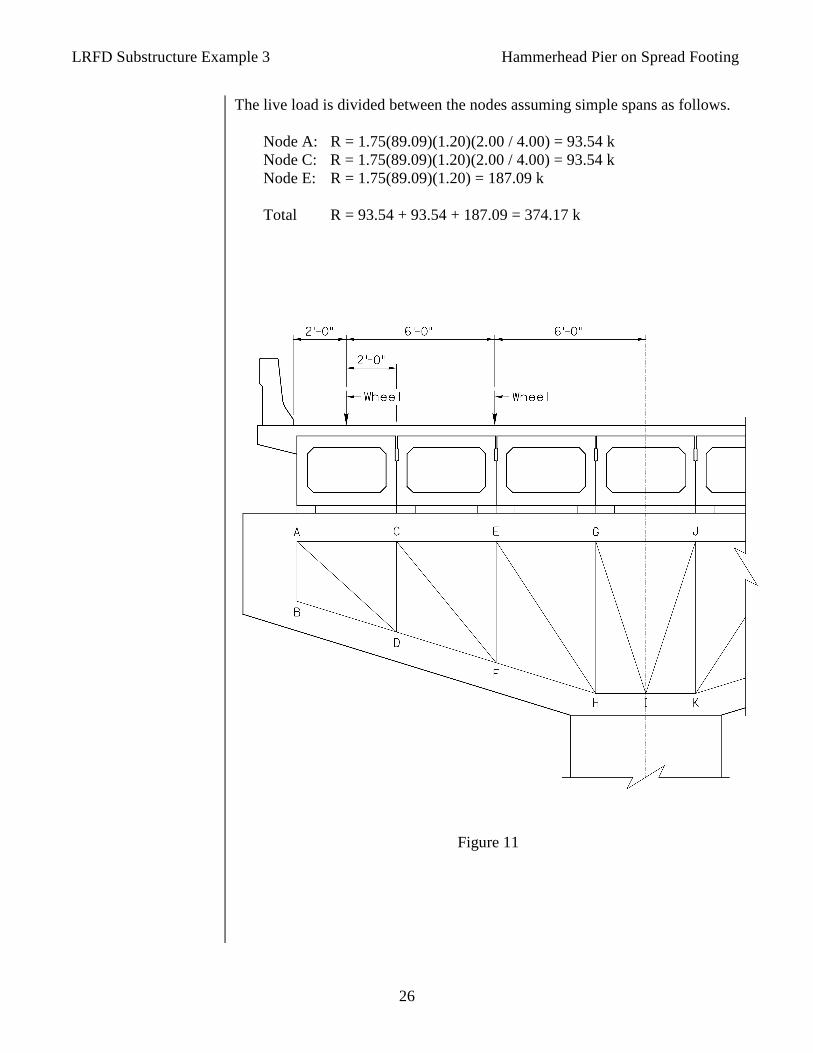
The live load is divided between the nodes assuming simple spans as follows. Node A: R = 1.75(89.09)(1.20)(2.00 / 4.00) = 93.54 k Node C: R = 1.75(89.09)(1.20)(2.00 / 4.00) = 93.54 k Node E: R = 1.75(89.09)(1.20) = 187.09 k Total R = 93.54 + 93.54 + 187.09 = 374.17 k
Figure 11

LRFD Substructure Example 3 Hammerhead Pier on Spread Footing
27
Step 4 – Determine Reactions The pier cap in this problem is integral with the column. This restraint is modeled to preserve the equations of equilibrium and compatibility. The column is divided into three equally spaced nodes. For the 72 inch wide column Node H is 12 inches from one face, Node I is at the center of the column and Node K is 12 inches from the opposite face. For an applied uniform vertical load each node will have the same contributory area and same resulting reaction. The bending moment is handled with a couple between Node H and Node K resulting in equal but opposite axial loads at the nodes. The pier cap has symmetrical dead loads so only the live load produces a moment. See Figure 12.
R = 210.34 + 1119.66 + 374.17 = 1704.17 k M = 1.75(89.09)(1.20)(12.00) + 1.75(89.09)(1.20)(6.00) = 3367.60 ft-k
The reactions at the restraint nodes are as follows: Node H:
R = 1704.17 / 3 + 3367.60 / 4.00 = 1409.96 ft-k
Node I: R = 1704.17 / 3 = 568.05 k
Node K: R = 1704.17 / 3 – 3367.60 / 4.00 = -273.84 ft-k
Figure 12

LRFD Substructure Example 3 Hammerhead Pier on Spread Footing
28
Step 5 – Determine Member Forces A summation of external loads applied at the various nodes follows:
Node Cap DL Super LL+IM Reaction Total A 19.04 79.98 93.54 192.56 C 24.11 159.95 93.54 277.60 E 29.18 159.95 187.09 376.22 G 32.84 159.95 192.79 H 1`409.96 1409.96 I 568.05 568.05 J 32.84 159.95 192.79 K -273.84 -273.84 L 29.18 159.95 189.13 N 24.11 159.95 184.06 P 19.04 79.98 99.02
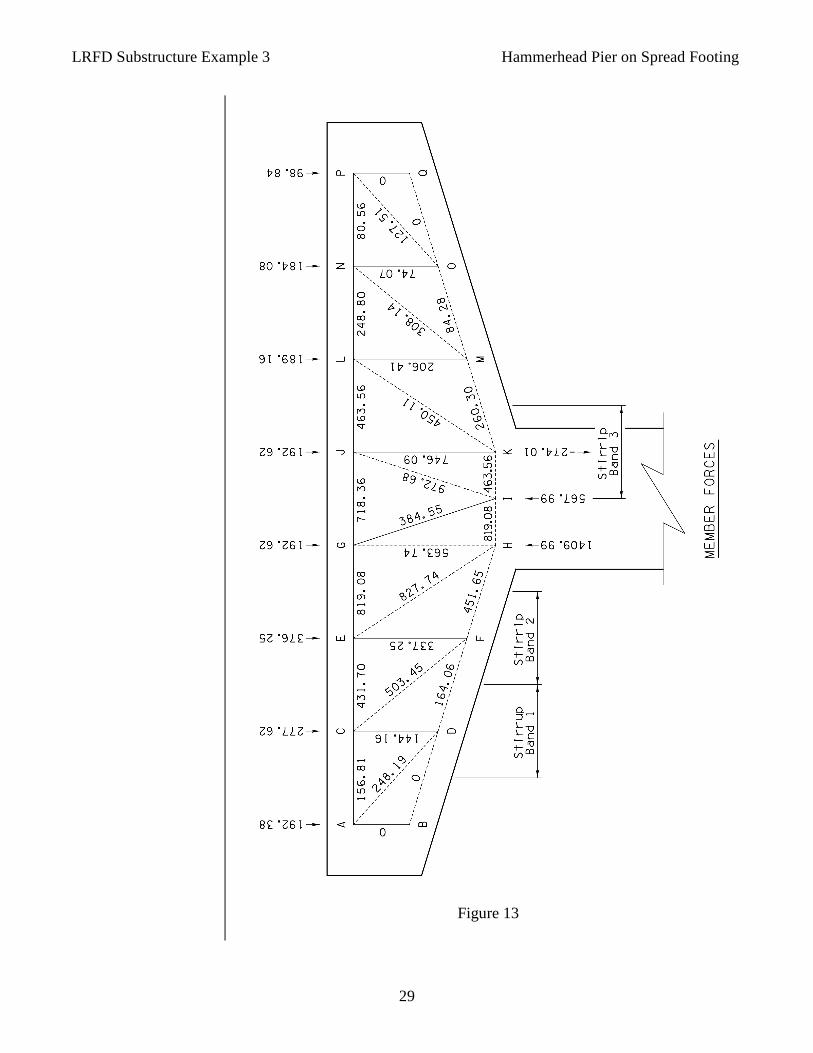
With the geometry of the model established and the applied loads and reactions determined, the force in each member is calculated. Starting with Node B the unknown forces in Members B-D and B-A are calculated by summing the vertical and horizontal forces equal to zero. Next sum the vertical and horizontal forces equal to zero for Node A where Members A-C and A-D are calculated. This method is continued until all the member forces are known. When the last node is evaluated there will be no unknown member forces. Summing the forces in both directions provides a summation of the error in the model. If the transverse frame model is not the same of that used for the strut-and-tie model, errors will be introduced in addition to the expected rounding errors due the number of separate calculations. The strut-and-tie model is shown in Figure 13 with applied loads, reactions, and tension and compression member forces. The maximum tension of 839 kips occurs in top Member E-G near the face of the column. The maximum shear occurs in Member E-F with a tension force of 333 kips. The maximum compressive force of 812 kips occurs in Member E-H.
LRFD Substructure Example 3 Hammerhead Pier on Spread Footing
29
Figure 13

LRFD Substructure Example 3 Hammerhead Pier on Spread Footing
30
Step 6 – Provide Crack Control Reinforcing Due to the presence of concentrated loads within a distance less than the member depth from the face of the column support, all the nodes are considered D-regions. In D-regions crack control reinforcing in the form of orthogonal grids on both faces is required. Some reinforcing may be required to be located in the interior of the member. The minimum ratio of reinforcing to gross concrete area is 0.003. The required area of reinforcing per foot depth is:
As = (0.003)(12.00)(66.00) = 2.38 in2 Use 6 - #6 as minimum reinforcement in both horizontal and vertical directions with As = (6)(0.44) = 2.64 in2. The maximum spacing of this reinforcing is 12 inches. For the vertical reinforcing, use #6 stirrups with six legs. Use #6 at 12 inch spacing for the horizontal reinforcing. Since the minimum crack control reinforcing often controls the design, it is useful to know the required minimum prior to determining actual required reinforcing. Step 7 – Capacity of Tension Ties (a) Top Reinforcement over column The maximum tension at the face of the column occurs in Member E-G. The required area of tension tie reinforcement, Ast, is calculated as follows:
( ) ( ) 54.156090.0
839 ===y
ust
f
PA
ϕ in2
Use 16 - #9 bars with an As = 16.00 in2 (b) Top Reinforcement for Member C-E The required area of tension tie reinforcement, Ast, for Member C–E is calculated as follows:
( ) ( ) 22.86090.0
444 ===y
ust f
PA
ϕ in2
Use 10 - #9 bars with an As = 10.00 in2

LRFD Substructure Example 3 Hammerhead Pier on Spread Footing
31
(c) Vertical Stirrup Band 1 The vertical tension force in Stirrup Band 1 of 143 kips occurs in Member C-D. This tension force is resisted by stirrups within a certain length of the beam as indicated by the stirrup bands. Using #6 stirrups with 6 legs, the number of stirrups, n, required in the band is:
( ) ( ) ( ) ( ) 0.16044.0690.0
143 ===yst
u
fA
Pn
ϕ Use 4 stirrups minimum
Use minimum reinforcing of #6 stirrups with 6 legs spaced at 12 inches. (d) Vertical Stirrup Band 2 The vertical tension force in Stirrup Band 2 of 333 kips occurs in Member E-F. Using #6 stirrups with 6 legs, the number of stirrups, n, required in the band is:
( ) ( ) ( ) ( ) 3.26044.0690.0
333 ===yst
u
fA
Pn
ϕ Use 4 stirrups minimum
Use minimum reinforcing of #6 stirrups with 6 legs spaced at 12 inches. (e) Vertical Stirrup Band 3 The vertical tension force in Stirrup Band 3 of 746 kips occurs in Member G-H. This tension force is resisted by stirrups within the stirrup band width. Using #6 stirrups with 6 legs, the number of stirrups, n, required in the band is:
( ) ( ) ( ) ( ) 23.56044.0690.0
746 ===yst
u
fA
Pn
ϕ Use 6 stirrups
The required spacing, s, within the 48.0 inch band is:
2.923.5
00.48 =≤s in
Use 6 - #6 stirrups with 6 legs spaced at 9 inches maximum.

LRFD Substructure Example 3 Hammerhead Pier on Spread Footing
32
Step 8 – Check Anchorage of Tension Tie (a) Top Longitudinal Reinforcement
The top 16 - #9 rebar must be developed at the inner edge of Node E. By inspection this node will have adequate embedment. However, half the reinforcing can be terminated after the development length beyond Node E. The required development length is:
( ) ( ) ( )1.40
5.3
6000.125.1
'
25.1=⋅⋅==
c
ybd
f
fAl in
but not less than 0.4dbfy = 0.4(1.128)(60) = 27.1 in
Since more than 12 inches of fresh concrete is poured below the reinforcement, the bars are considered top bars for development length. Since the bars are spaced at 8 inches, they qualify for a reduction of 0.8 for widely spaced bars. The adjusted development length is:
ld = (40.1)(1.4)(0.8) = 44.9 inches . Cut 6 #9 top reinforcing bars a minimum of 44.9 inches beyond the inside face of Node E. By independent analysis 4 - #9 reinforcing bars must be properly developed beyond the inside face of Node A to resist the force in Member A-C. The available embedment length equals 24.00 + 12.00 – 2.00 clear = 34.00 inches. Since the required development length exceeds this value the bars must be hooked. The basic development length of a hooked #9 reinforcing bar is:
( ) ( )9.22
5.3
128.10.38
'
0.38===
c
bdh
f
dl inches
Where side cover normal to the plane of the hook is not less than 2.5 inches and for a 90 degree hook the cover on the bar extension beyond the hook is not less than 2.0 inches a modification factor of 0.7 may be applied. The modified development length is (0.7)(22.9) = 16.0 inches. Therefore, the #9 reinforcement is adequate developed beyond Node A with a standard hook.

LRFD Substructure Example 3 Hammerhead Pier on Spread Footing
33
(b) Vertical Stirrups The vertical stirrups must be developed beyond the inner edge of the nodes. The required development length is:
( ) ( ) ( )6.17
5.3
6044.025.1
'
25.1=⋅⋅==
c
ybd
f
fAl in
but not less than 0.4dbfy = 0.4(0.750)(60) = 18.0 in
The available embedment length is 13 inches minus 2.5 inches clear or 10.5 inches. Therefore the stirrups must be hooked. The basic development length of a hooked #6 stirrup is:
( ) ( )2.15
5.3
750.00.38
'
0.38===
c
bdh
f
dl inches
Where side cover normal to the plane of the hook is not less than 2.5 inches and for a 90 degree hook the cover on the bar extension beyond the hook is not less than 2.0 inches a modification factor of 0.7 may be applied. The modified development length is (0.7)(15.2) = 10.6 inches. Since the available embedment length is approximately equal to the required development length, the stirrups are adequately developed.

LRFD Substructure Example 3 Hammerhead Pier on Spread Footing
34
Step 9 – Capacity of Struts Strut E-H carries the highest compression force of 812 kips. Since this strut is anchored at Joint E that also anchors tension Ties C-E, E-G and E-F (See Figure 30), this is the most critical strut. The effective cross sectional area of a strut by considering the available concrete area and the anchorage conditions at the ends of the strut. When a strut is anchored by reinforcement, the effective concrete area may be considered to extend a distance of up to six bar diameters from the anchored bar. See Figures 14 and 15 for determination of the depth and width of the strut.
Figure 14

LRFD Substructure Example 3 Hammerhead Pier on Spread Footing
35
The effective cross sectional area is:
la sinθs = [6(1.128)(2) + 3(12.00)] sin(60.94) = 43.30 inches weffective = 2[2.38 + 6(1.128)] + 4[(2)(6)(1.128)] = 72.44 inches Therefore, the entire width is effective Acs = (43.30)(66.00) = 2858 in2
Figure 15 The limiting compressive stress in the strut, fcu, is usually controlled by the tensile strain in the tie that is at the smallest angle to the strut. For this problem both tensile strains will be investigated. From the geometry of the truss, the angle between tension Tie E-G and Strut E-H is 60.94 degrees. The tensile strain in Tie E-G is:
( ) ( )310808.1
2900000.16
839 −−=== xEA
P
sst
usε

LRFD Substructure Example 3 Hammerhead Pier on Spread Footing
36
The tensile strain the horizontal Tie C-E is:
( ) ( )310957.0
2900000.16
444 −−=== xEA
P
sst
usε
At the center of the node the horizontal strain will be the average of the two horizontal members joining at the node. The average strain is:
εs = (1.808 x 10⁻³ + 0.957 x 10⁻³) / 2 = 1.383 x 10⁻³ The principal strain, ε1, is determined as follows:
ε1 = εs + (εs + 0.002) cot2αs
ε1 = 1.383 x 10⁻³ + (1.383 x 10⁻³ + 0.002) cot2(60.94) = 2.428 x 10⁻³ The limiting compressive stress, fcu, in the Strut E-H is:
cc
cu ff
f '85.01708.0
'
1
≤+
=ε
( ) ( ) ( ) 98.25.385.089.210428.21708.0
5.33
=≤=+
= −xf cu ksi
If the vertical Tie E-F is considered, the tension strain is:
( ) ( ) ( ) ( )310087.1
29000444.06
333 −=== xEA
P
sst
usε
From this tie the principle strain is:
ε1 = 1.087 x 10⁻³ + (1.087 x 10⁻³ + 0.002) cot2(29.06) = 11.09 x 10⁻³
Since this is greater than the previously calculated value for principle strain, this tie will govern the compressive capacity of the strut.
( ) ( ) ( ) 98.25.385.030.11009.111708.0
5.33
=≤=+
= −xf cu

LRFD Substructure Example 3 Hammerhead Pier on Spread Footing
37
The nominal resistance of the strut is based on the limiting stress, fcu, and the strut dimensions. The nominal resistance is:
Pn = fcuAcs = (1.30)(2858) = 3715 kips The factored resistance of the strut is:
Pr = ϕPn = (0.70)(3715) = 2601 kips > Pu = 812 kips Step 10 – Node Regions The concrete compression stress in the node region of the strut shall not exceed 0.65 ϕ f’ c for node regions anchoring tension ties in more than one direction. For Node E:
( ) ( ) ( ) 59.15.370.065.0'65.0 === cc ff ϕ ksi
The nodal zone compressive stress is:
284.02858
812 ==cf ksi
The tension tie reinforcing shall be uniformly distributed over an effective area of concrete. Check to ensure that the tension ties are sufficiently spread out in the effective anchorage area. The effective anchorage area is equal to twice the depth to the top tie or 2(6.50) = 13.0 inches. The nodal zone stress to anchor the tension tie is:
( ) ( ) 978.000.6600.13
839 =⋅
=cf ksi
For this nodal zone the limiting nodal zone stress is:
fc = 0.65 ϕ f’ c = (0.65)(0.70)(3.5) = 1.593 ksi Since the stress is less than the limiting stress the criteria is satisfied.
LRFD Substructure Example 3 Hammerhead Pier on Spread Footing
38
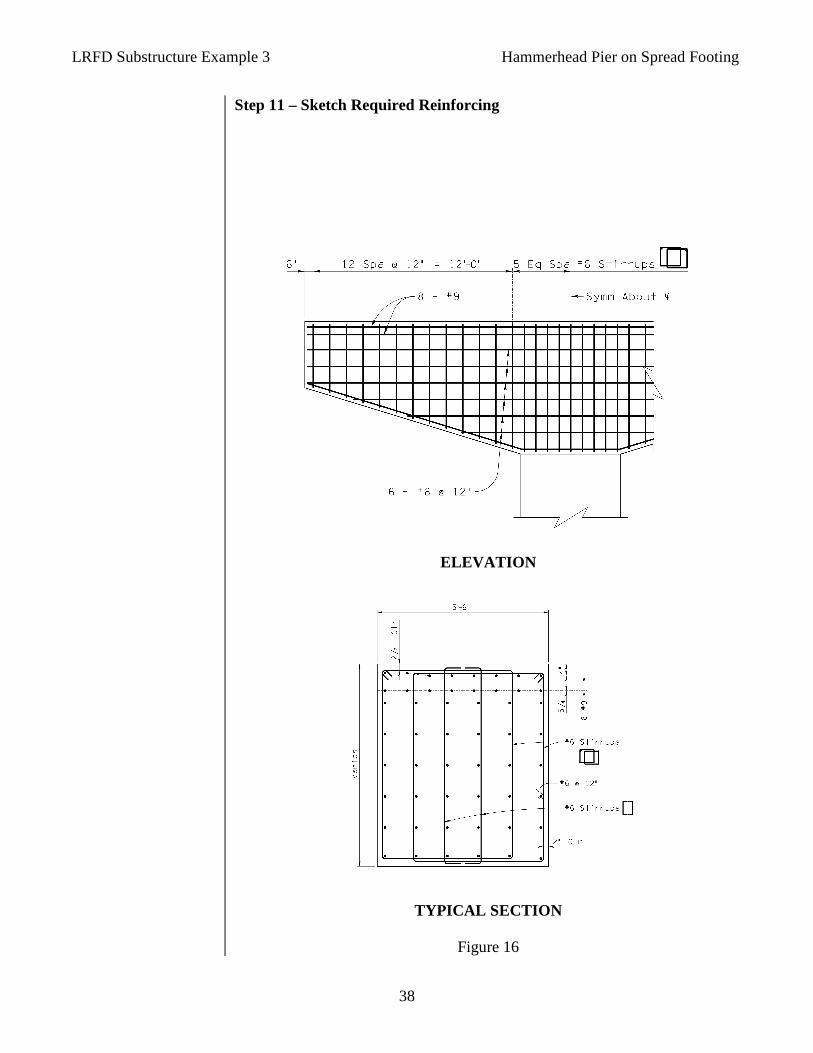
Step 11 – Sketch Required Reinforcing
ELEVATION
TYPICAL SECTION
Figure 16

LRFD Substructure Example 3 Hammerhead Pier on Spread Footing
39
Column Design [5.7.4] [3.4.1]
The column is designed as a compression member under axial load and moment. A summary of moments and axial loads at the bottom of the column in both the longitudinal and transverse directions is required. A summary of values is shown below: Bottom of Column Axial Loads and Moments
Load Pmax Pmin Mtrans Mlong DC 1074.6 1074.6 0 0 DW 66.2 0 0 0 LL + IM 356.4 -37.0 1925 0 WA 0 0 138 101 BR 0 0 0 594 WS super 0 0 1044 541 WS sub 0 0 100 316 WS 0 0 1144 857 WS vert 0 -53.0 408 0 WL 0 0 362 161 TU 0 0 0 785 CR + SH 0 0 0 935 SE 13.3 -13.3 0 0
The strength limit states load factor for TU is 0.50 since the analysis is based on gross section properties. The column must be designed for the strength limit states. Several strength limit states will be investigated to determine the critical one. STRENGTH I
Max = 1.25DC + 1.50DW + 0.50(CR + SH) + 1.75(LL + IM + BR) + 1.00WA + 0.50TU + 1.00SE Min = 0.90DC + 0.65DW + 0.50(CR + SH) + 1.75(LL + IM + BR) + 1.00WA + 0.50TU + 1.00SE
Bottom of Column
Pmax = 1.25(1074.6) + 1.50(66.2) + 1.75(356.4) + 1.00(13.3) = 2080 k Pmin = 0.90(1074.6) + 0.65(0) + 1.75(-37.0) + 1.00(-13.3) = 889 k M trans = 1.25(0) + 1.50(0) + 1.75(1925) + 1.00(138) = 3507 ft-k M long = 1.25(0) + 1.50(0) + 0.50(935) + 1.75(594) + 1.00(101) + 0.50(785) = 2001 ft-k

LRFD Substructure Example 3 Hammerhead Pier on Spread Footing
40
STRENGTH III
Max = 1.25DC + 1.50DW + 0.50(CR + SH) + 1.00WA + 1.40(WS + WSvert) + 0.50TU + 1.00SE Min = 0.90DC + 0.65DW + 0.50(CR + SH) + 1.00WA + 1.40(WS + WSvert) + 0.50TU + 1.00SE
Bottom of Column
Pmax = 1.25(1074.6) + 1.50(66.2) + 1.00(13.3) = 1456 k Pmin = 0.90(1074.6) + 0.65(0) + 1.40(-53.0) +1.00(-13.3) = 880 k M trans = 1.25(0) + 1.50(0) + 1.00(138) + 1.40(1144 + 408) = 2311 ft-k M long = 1.25(0) + 1.50(0) + 0.50(935) + 1.00(101) + 1.40(857) + 0.50(785) = 2161 ft-k
STRENGTH V
Max = 1.25DC + 1.50DW + 0.50(CR + SH) + 1.35(LL + IM + BR) + 1.00WA + 0.40WS + 1.00WL + 0.50TU + 1.00SE Min = 0.90DC + 0.65DW + 0.50(CR + SH) + 1.35(LL + IM + BR) + 1.00WA + 0.40WS + 1.00WL + 0.50TU + 1.00SE
Bottom of Column
Pmax = 1.25(1074.6) + 1.50(66.2) + 1.35(356.4) + 1.00(13.3) = 1937 k Pmin = 0.90(1074.6) + 0.65(0) + 1.35(-37.0) + 1.00(-13.3) = 904 k
M trans = 1.25(0) + 1.50(0) + 1.35(1925) + 1.00(138) + 0.40(1144) + 1.00(362) = 3556 ft-k
M long = 1.25(0) + 1.50(0) + 0.50(935) + 1.35(594) + 1.00(101) + 0.40(857) + 1.00(161) + 0.50(785) = 2267 ft-k

LRFD Substructure Example 3 Hammerhead Pier on Spread Footing
41
Longitudinal Column Design Slenderness Effects [5.7.4.3] [C5.7.4.3] [C4.6.2.5-1] [5.7.4.3-1] [5.7.4.3-2]
A review of the group load combinations does not indicate an obvious critical limit state. Therefore the slenderness effects will be considered for all three strength limit states. For members not braced against sidesway, the effects of slenderness shall be considered where the slenderness ratio Klu/r is greater than 22. The effects of slenderness must be considered separately in each direction as the moment of inertia of the column varies with each direction. The radius of gyration for a rectangular section may be taken as 0.30 times the overall dimension in the direction in which stability is being considered. For the longitudinal direction: r = 0.30(4.00) = 1.20 ft. For members not braced against sidesway, k is determined with due consideration for the effects of cracking and reinforcement on the relative stiffness and may not be taken less than 1.0. For a member free at the top but fixed at the base, the design value of k = 2.1 is obtained from the alignment chart. The slenderness ratio is calculated as follows:
( ) ( )8.57
20.1
00.331.2 =⋅=r
klu
Since the slenderness ratio is greater than 22, slenderness effects must be considered. Since the slenderness ratio is less than 100 the approximate moment magnifier method may be used. In lieu of a more precise method, EI shall be taken as the greater of:
d
ssgc IE
IE
EIβ+
+=
15
d
gc IE
EIβ+
=1
5.2
The first equation will control for large percentages of reinforcement. The second equation will control when the reinforcing percentage is small. At this stage the reinforcing pattern is usually not known, requiring that Is be estimated or ignored. See Figure 17 for the reinforcing pattern for this problem.
LRFD Substructure Example 3 Hammerhead Pier on Spread Footing
42
[4.5.3.2.2b-5] [4.5.3.2.2b-3] [4.5.3.2.2b-4]
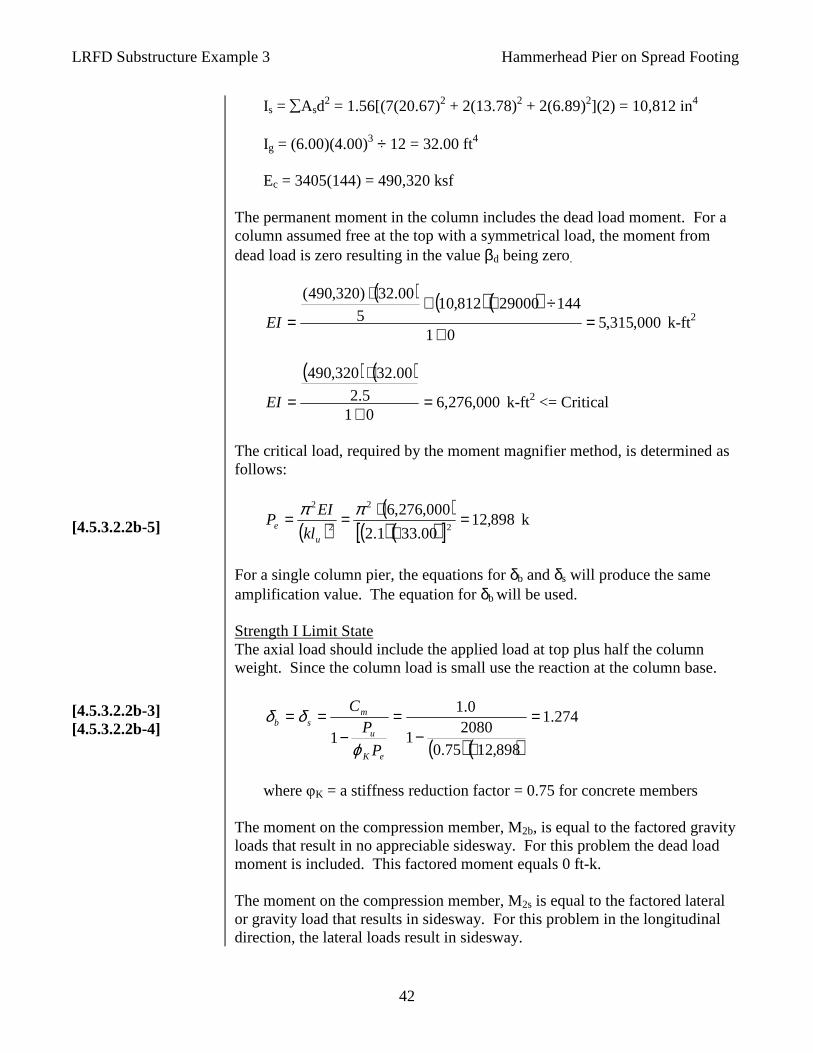
Is = ∑Asd2 = 1.56[(7(20.67)2 + 2(13.78)2 + 2(6.89)2](2) = 10,812 in4
Ig = (6.00)(4.00)3 ÷ 12 = 32.00 ft4 Ec = 3405(144) = 490,320 ksf
The permanent moment in the column includes the dead load moment. For a column assumed free at the top with a symmetrical load, the moment from dead load is zero resulting in the value βd being zero.
( ) ( ) ( )
000,315,501
14429000812,105
00.32)320,490(
=+
÷⋅+⋅
=EI k-ft2
( ) ( )
000,276,6015.2
00.32320,490
=+
⋅
=EI k-ft2 <= Critical
The critical load, required by the moment magnifier method, is determined as follows:
( )( )
( ) ( )[ ] 898,1200.331.2
000,276,62
2
2
2
=⋅
⋅== ππ
u
ekl
EIP k
For a single column pier, the equations for δb and δs will produce the same amplification value. The equation for δb will be used. Strength I Limit State The axial load should include the applied load at top plus half the column weight. Since the column load is small use the reaction at the column base.
( ) ( )274.1
898,1275.0
20801
0.1
1=
⋅−
=−
==
eK
u
msb
P
PC
ϕ
δδ
where φK = a stiffness reduction factor = 0.75 for concrete members
The moment on the compression member, M2b, is equal to the factored gravity loads that result in no appreciable sidesway. For this problem the dead load moment is included. This factored moment equals 0 ft-k. The moment on the compression member, M2s is equal to the factored lateral or gravity load that results in sidesway. For this problem in the longitudinal direction, the lateral loads result in sidesway.

LRFD Substructure Example 3 Hammerhead Pier on Spread Footing
43
[4.5.3.2.2b-1]
The magnified longitudinal moments are increased to reflect effects of deformation as follows:
Mc = δbM2b + δsM2s
Mc = 1.274(0) + 1.274(2001) = 2549 ft-k
Strength III Limit State
( ) ( )177.1
898,1275.0
14561
1
1
1 =
⋅−
=−
==
eK
usb
P
P
ϕ
δδ
Mc = 1.177(0) + 1.177(2161) = 2543 ft-k
Strength V Limit State
( ) ( )250.1
898,1275.0
19371
1
1
1 =
⋅−
=−
==
eK
usb
P
P
ϕ
δδ
Mc = 1.250(0) + 1.250(2267) = 2834 ft-k
These magnified moments are used with the factored axial load to design the compression member.
LRFD Substructure Example 3 Hammerhead Pier on Spread Footing
44
Transverse Column Design [5.7.4.3] [4.6.2.5-1] [5.7.4.3-1] [5.7.4.3-2]
The effects of deformation on the moments in the transverse direction must also be considered. The radius of gyration for a rectangular section may be taken as 0.30 times the overall dimension in the direction in which stability is being considered. For the transverse direction: r = 0.30(6.00) = 1.80 ft. For a member free at the top but fixed at the base, the design value of k = 2.1 is obtained from the alignment chart. The slenderness ratio is calculated as follows:
( ) ( )5.38
80.1
00.331.2 =⋅=r
klu
Since the slenderness ratio is greater than 22, slenderness effects must be considered in the transverse direction. Since the slenderness ratio is less than 100 the moment magnifier method can be used. In lieu of a more precise method, EI shall be taken as the greater of:
d
ssgc IE
IE
EIβ+
+=
15
d
gc IE
EIβ+
=1
5.2
The first equation will control for large percentages of reinforcement. The second equation will control when the reinforcing percentage is small. At this stage the reinforcing pattern is usually not known requiring that Is be estimated or ignored. See Figure 17 for the reinforcing pattern for this problem.
Is = ∑Asd2 = 1.56[(7(32.67)2 + 2(21.78)2 + 2(10.89)2](2) = 27,011 in4
Ig = (4.00)(6.00)3 ÷ 12 = 72.00 ft4
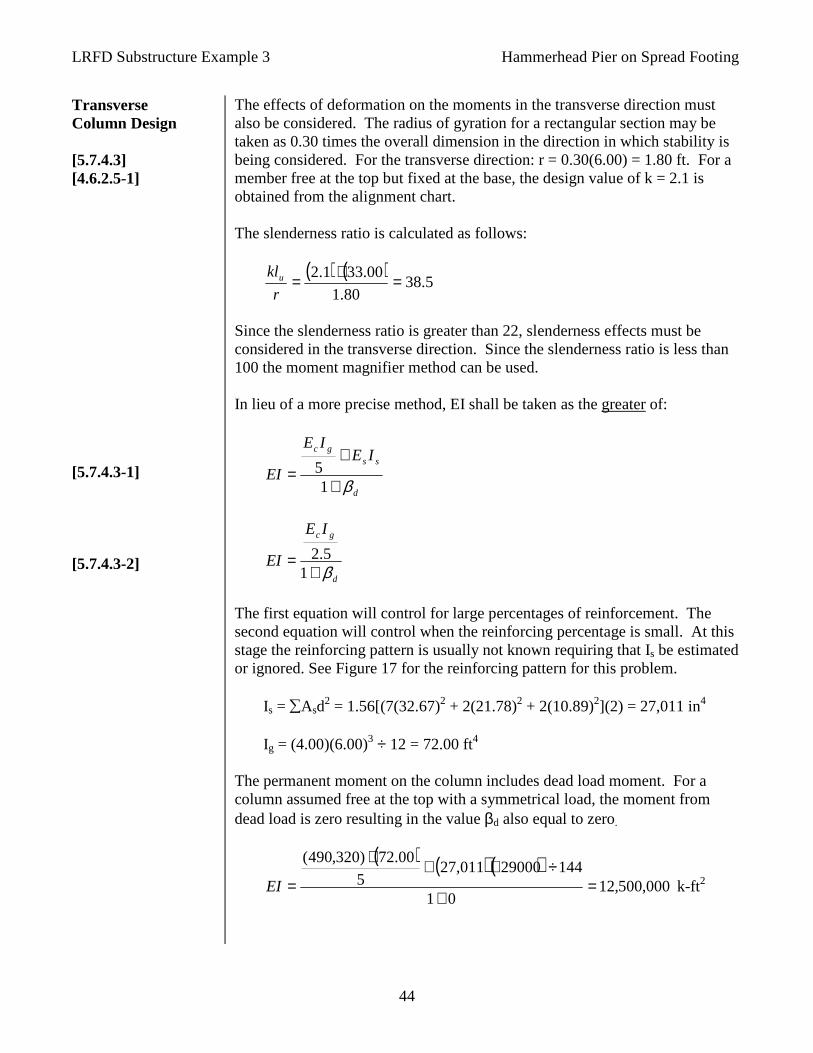
The permanent moment on the column includes dead load moment. For a column assumed free at the top with a symmetrical load, the moment from dead load is zero resulting in the value βd also equal to zero.
( ) ( ) ( )
000,500,1201
14429000011,275
00.72)320,490(
=+
÷⋅+⋅
=EI k-ft2
LRFD Substructure Example 3 Hammerhead Pier on Spread Footing
45
[4.5.3.2.2b-5] [4.5.3.2.2b-3] [4.5.3.2.2b-4] [4.5.3.2.2b-1]
( ) ( )
000,121,14015.2
00.72320,490
=+
⋅
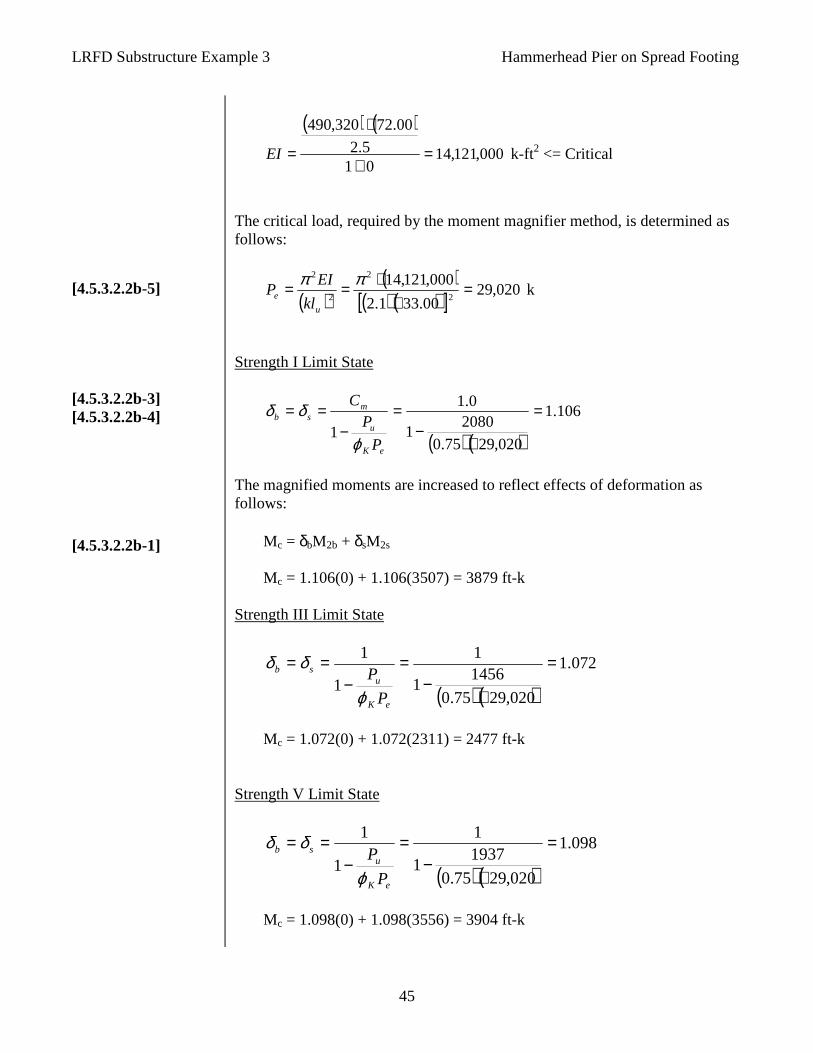
=EI k-ft2 <= Critical
The critical load, required by the moment magnifier method, is determined as follows:
( )( )
( ) ( )[ ] 020,2900.331.2
000,121,142
2
2
2
=⋅
⋅== ππ
u
ekl
EIP k
Strength I Limit State
( ) ( )106.1
020,2975.0
20801
0.1
1=
⋅−
=−
==
eK
u
msb
P
PC
ϕ
δδ
The magnified moments are increased to reflect effects of deformation as follows:
Mc = δbM2b + δsM2s
Mc = 1.106(0) + 1.106(3507) = 3879 ft-k
Strength III Limit State
( ) ( )072.1
020,2975.0
14561
1
1
1 =
⋅−
=−
==
eK
usb
P
P
ϕ
δδ
Mc = 1.072(0) + 1.072(2311) = 2477 ft-k
Strength V Limit State
( ) ( )098.1
020,2975.0
19371
1
1
1 =
⋅−
=−
==
eK
usb
P
P
ϕ
δδ
Mc = 1.098(0) + 1.098(3556) = 3904 ft-k
LRFD Substructure Example 3 Hammerhead Pier on Spread Footing
46
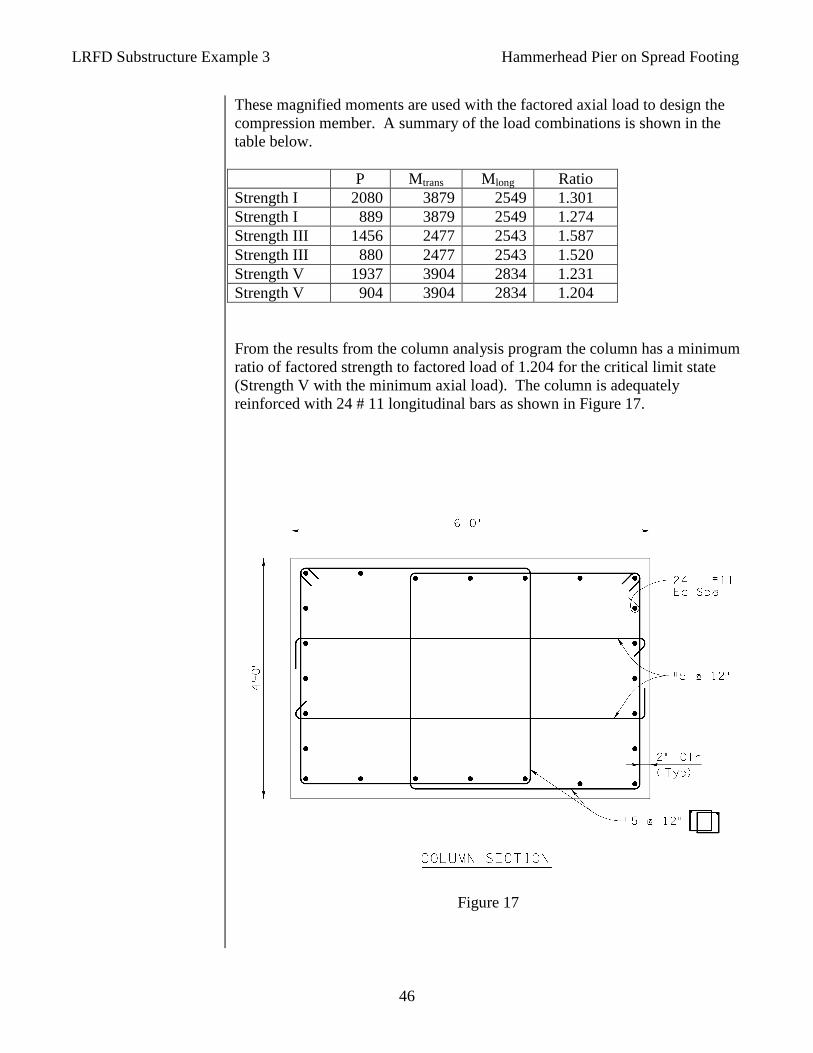
These magnified moments are used with the factored axial load to design the compression member. A summary of the load combinations is shown in the table below. P Mtrans Mlong Ratio Strength I 2080 3879 2549 1.301 Strength I 889 3879 2549 1.274 Strength III 1456 2477 2543 1.587 Strength III 880 2477 2543 1.520 Strength V 1937 3904 2834 1.231 Strength V 904 3904 2834 1.204 From the results from the column analysis program the column has a minimum ratio of factored strength to factored load of 1.204 for the critical limit state (Strength V with the minimum axial load). The column is adequately reinforced with 24 # 11 longitudinal bars as shown in Figure 17.
Figure 17

LRFD Substructure Example 3 Hammerhead Pier on Spread Footing
47
Column Shear [5.8] [3.4.1]
Step 1 – Determine Shear Shear design is based on strength limit states. The transverse and longitudinal column shears are taken from the loads as shown in the following table.
Load Vtrans Vlong k k DC 0 0 DW 0 0 LL + IM 0 0 BR 0 18.0 WA 13.6 10.1 WS super 28.8 16.4 WS sub 5.3 13.4 WS 34.1 29.8 WL 8.6 4.9 TU 0 23.8 CR + SH 0 28.3 SE 0 0
Weight of the column 0.15(4.0)(6.0)(25.0) = 90.0 k STRENGTH I Max = 1.25DC + 1.50DW + 0.50(CR + SH) + 1.75(LL + IM + BR)
+ 1.00WA + 0.50TU + 1.00SE Pmin = 0.90(1074.6 – 90.0) + 1.75(-37.0) + 1.00(-13.3) = 808 k Vtrans = 1.25(0) + 1.50(0) + 0.50(0) + 1.75(0) + 1.00(13.6) + 0.5(0) + 1.00(0) = 13.6 k V long = 1.25(0) + 1.50(0) + 0.50(28.3) + 1.75(18.0) + 1.00(10.1) + 0.50(23.8) + 1.00(0) = 67.7 k
STRENGTH III
Max = 1.25DC + 1.50DW + 0.50(CR + SH) + 1.00WA + 1.40(WS + WSvert) + 0.50TU + 1.00SE Pmin = 0.90(1074.6 – 90.0) + 1.40(-53.0) + 1.00(-13.3) = 799 k Vtrans = 1.25(0) + 1.50(0) + 0.50(0) + 1.00(13.6) + 1.40(34.1) + 0.50(0) + 1.00(0) = 61.3 k
V long = 1.25(0) + 1.50(0) + 0.50(28.3) + 1.00(10.1) + 1.40(29.8) + 0.50(23.8) + 1.00(0) = 77.9 k <= Critical
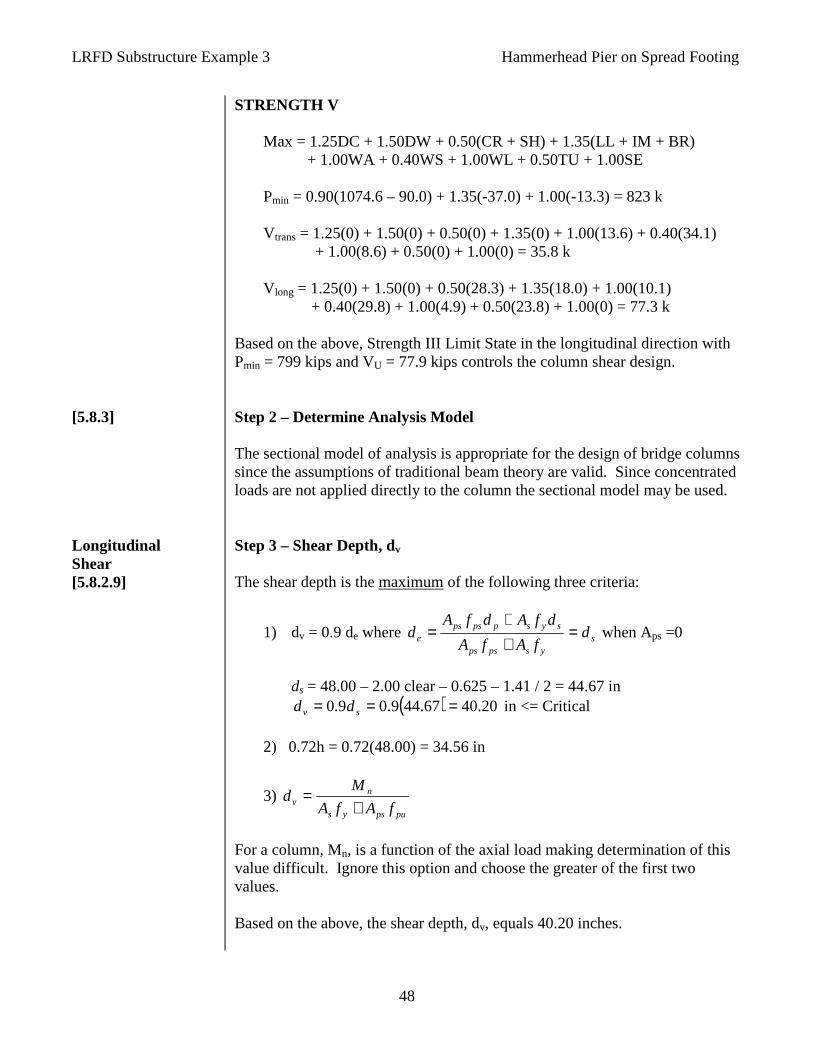
LRFD Substructure Example 3 Hammerhead Pier on Spread Footing
48
[5.8.3] Longitudinal Shear [5.8.2.9]
STRENGTH V Max = 1.25DC + 1.50DW + 0.50(CR + SH) + 1.35(LL + IM + BR) + 1.00WA + 0.40WS + 1.00WL + 0.50TU + 1.00SE Pmin = 0.90(1074.6 – 90.0) + 1.35(-37.0) + 1.00(-13.3) = 823 k Vtrans = 1.25(0) + 1.50(0) + 0.50(0) + 1.35(0) + 1.00(13.6) + 0.40(34.1) + 1.00(8.6) + 0.50(0) + 1.00(0) = 35.8 k
V long = 1.25(0) + 1.50(0) + 0.50(28.3) + 1.35(18.0) + 1.00(10.1) + 0.40(29.8) + 1.00(4.9) + 0.50(23.8) + 1.00(0) = 77.3 k
Based on the above, Strength III Limit State in the longitudinal direction with Pmin = 799 kips and VU = 77.9 kips controls the column shear design. Step 2 – Determine Analysis Model The sectional model of analysis is appropriate for the design of bridge columns since the assumptions of traditional beam theory are valid. Since concentrated loads are not applied directly to the column the sectional model may be used.
Step 3 – Shear Depth, dv The shear depth is the maximum of the following three criteria:
1) dv = 0.9 de where syspsps
sysppspse d
fAfA
dfAdfAd =
++
= when Aps =0
ds = 48.00 – 2.00 clear – 0.625 – 1.41 / 2 = 44.67 in ( ) 20.4067.449.09.0 === sv dd in <= Critical
2) 0.72h = 0.72(48.00) = 34.56 in
3) pupsys
nv fAfA
Md
+=
For a column, Mn, is a function of the axial load making determination of this value difficult. Ignore this option and choose the greater of the first two values.
Based on the above, the shear depth, dv, equals 40.20 inches.
LRFD Substructure Example 3 Hammerhead Pier on Spread Footing
49
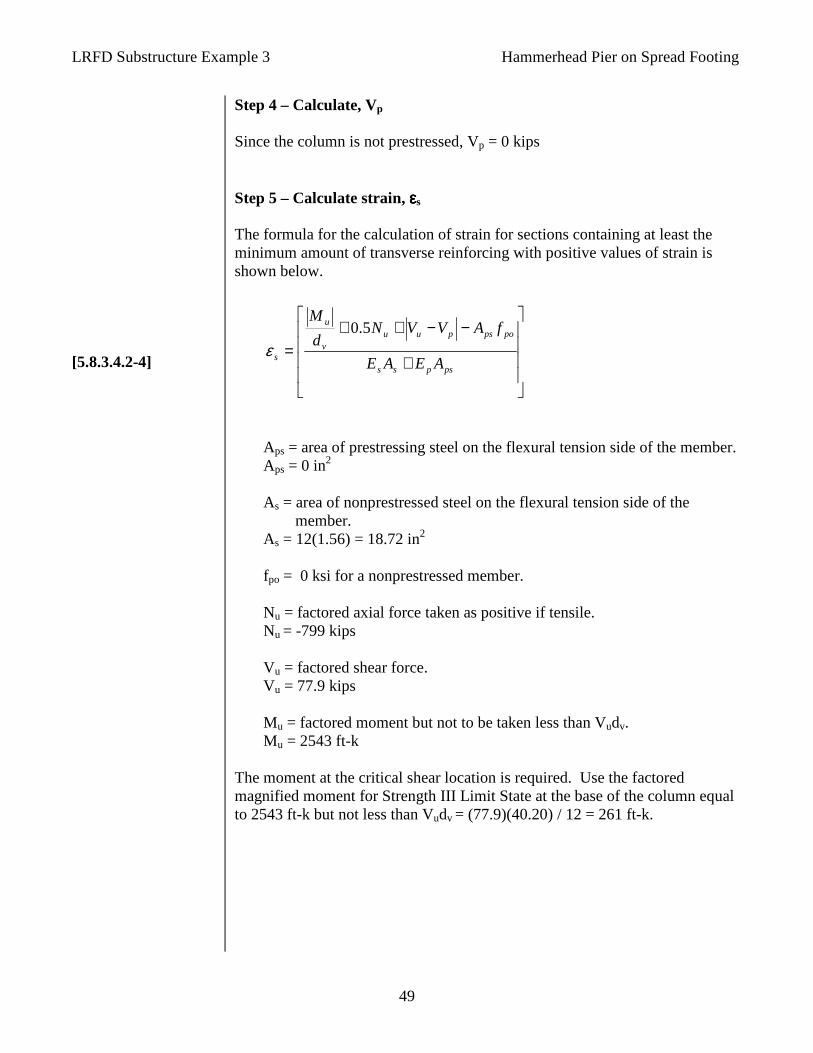
[5.8.3.4.2-4]
Step 4 – Calculate, Vp Since the column is not prestressed, Vp = 0 kips Step 5 – Calculate strain, εεεεs The formula for the calculation of strain for sections containing at least the minimum amount of transverse reinforcing with positive values of strain is shown below.
+
−−++=
pspss
popspuuv
u
s AEAE
fAVVNd
M5.0
ε
Aps = area of prestressing steel on the flexural tension side of the member. Aps = 0 in2
As = area of nonprestressed steel on the flexural tension side of the member. As = 12(1.56) = 18.72 in2 fpo = 0 ksi for a nonprestressed member. Nu = factored axial force taken as positive if tensile. Nu = -799 kips Vu = factored shear force. Vu = 77.9 kips
Mu = factored moment but not to be taken less than Vudv. Mu = 2543 ft-k
The moment at the critical shear location is required. Use the factored magnified moment for Strength III Limit State at the base of the column equal to 2543 ft-k but not less than Vudv = (77.9)(40.20) / 12 = 261 ft-k.

LRFD Substructure Example 3 Hammerhead Pier on Spread Footing
50
[5.8.3.4.2-4] [5.8.3.4.2-1] [5.8.3.4.2-3] [5.8.3.3-3] [5.8.2.4]
( ) ( ) ( ) ( ) ( )
( ) ( ) ( ) ( )
⋅+⋅
⋅−−+−⋅+⋅
=02850072.1829000
0009.7779950.020.40
122543
sε
εs = 0.000806
Since the value is positive the correct formula was used. The 2008 Interim Revisions now provide for a method of direct calculation of the variables θ and β.
( ) ( )( ) 99.2000806.07501
8.4
7501
8.4 =⋅+
=+
=sε
β
( ) ( ) 8.31000806.0350029350029 =⋅+=+= sεθ degrees
Step 6 - Calculate Concrete Shear Strength, Vc The nominal shear resistance from concrete, Vc, is calculated as follows:
vvcc dbfV '0316.0 β=
( ) ( ) ( ) 6.51120.4000.725.399.20316.0 =⋅⋅⋅⋅=cV kips
Step 7 - Determine Required Vertical Reinforcement, Vs
Since Vu = 77.9 < 0.5ϕVc = (0.5)(0.9)(511.6) = 230.2 k transverse reinforcing is not required. However, the formula for strain with the minimum transverse reinforcement was used. Verify that the minimum requirement is satisfied with use of transverse reinforcement of #5 at 12 inches.

LRFD Substructure Example 3 Hammerhead Pier on Spread Footing
51
[5.8.2.5-1] [5.8.2.9-1] [5.8.2.7-1] [5.8.3.5-1]
Step 8 – Minimum Transverse Reinforcement
y
vcv f
sbfA '0316.0≥
( ) ( )
85.060
0.1200.725.30316.0 =⋅⋅≥vA in2
AV provided = 4(0.31) = 1.24 in2
Therefore the minimum transverse reinforcement is supplied. Step 9 – Maximum Spacing Transverse Reinforcement
( )( ) ( ) 030.0
20.4000.7290.0
090.09.77=
⋅⋅⋅−
=−
=vw
pu
u db
VVv
ϕϕ
ksi
Since vu = 0.030 < 0.125f’c = (0.125)(3.5) = 0.438 ksi smax = 0.8dv = 0.8(40.20) = 32.2 but not greater than 24.0 inches
Therefore, the maximum transverse spacing requirement is satisfied. Step 10 - Longitudinal Reinforcement In addition to vertical reinforcement, shear requires a minimum amount of longitudinal reinforcement. The requirement for longitudinal reinforcement follows:
θφφφ
cot5.05.0
−−++≥+ ps
v
u
c
u
fv
upspsys VV
VN
d
MfAfA
Note that the Specification states that the area of longitudinal reinforcement need not be greater than the area required to resist the maximum moment alone. This requirement cannot be applied to members that are designed for axial load and moment. Since the column is adequately reinforced the above exemption is used.
Therefore the column is adequately reinforced for longitudinal shear using #5 at 12 inches. In an actual design the shear in the transverse direction would require investigation.

LRFD Substructure Example 3 Hammerhead Pier on Spread Footing
52
Footing Design [5.13.3] [10.5.2] [10.5.3]
General The methods used to estimate loads for the design of foundations using LRFD are fundamentally no different than procedures used in the past for ASD. What has changed is the use of factored loads for evaluation of foundation stability (bearing resistance, sliding resistance and limiting eccentricity for spread footing foundations). The design of foundations supporting bridge piers should consider all limit states loading conditions applicable to the structure being designed. The following Strength Limit States may control the design and should be investigated:
Strength I Limit State will control for high live to dead load ratios. Strength III or V will control for structures subjected to high wind loads
All loads at the top of the footing are the same as those at the bottom of the column except for the dynamic load allowance which does not apply to design of foundations. A spread footing foundation will be evaluated for the following failure conditions:
1. Bearing Resistance – Strength Limit States 2. Settlement – Service I Limit State 3. Sliding Resistance – Strength Limit States 4. Limiting Eccentricity (Overturning) – Strength Limit States 5. Overall Stability – Service I Limit State 6. Structural Resistance – Service I and Strength Limit States

LRFD Substructure Example 3 Hammerhead Pier on Spread Footing
53
[11.6.3] [3.4.1]
1. Bearing Resistance Bearing resistance check is a strength limit state. The appropriate Strength Limit States are I, III and V. The maximum bearing load will be found by applying the maximum load factors to each applicable load. The factored bearing resistance will be provided in the Geotechnical Foundation Report. The factored bearing resistance of the rock is 60 ksf. The load factors and load combinations are shown below: Strength I (max) Limit State:
Strength I = 1.25DC + 1.50DW + 1.35EV + 0.50(CR + SH) + 1.75(LL + BR) + 1.00WA + 0.50TU + 1.00SE Pmax = 1.25(1263.6) + 1.50(66.2) + 1.35(130.7) + 1.75(297.4 + 0) + 1.00(0) + 0.50(0) + 1.00(13.3) = 2389 k
Longitudinal For second order effects, the axial load should include the applied load at the top plus half the column weight. For a hammerhead pier the entire cap should be added with half the remaining column weight. Since the column load in this example is small, conservatively use the reaction at the base of the column.
Pu = 1.25(1074.6) + 1.50(66.2) + 1.75(297.4) + 1.00(13.3) = 1976 k
( ) ( )257.1
898,1275.0
19761
0.1
1=
⋅−
=−
==
eK
u
msb
P
PC
ϕ
δδ
For a footing founded on rock the column will be fixed at the top of the footing. To determine the moment at the base of the footing, the moment magnifier should be applied to the moment at the base of the column and added to the moment caused by the shear times the footing thickness plus the loads directly applied to the footing. A conservative alternate method would be to apply the moment magnifier to the moment at the base of the footing. Both methods will be shown for this case but subsequent calculations will only use the later method. Method 1 (primary moment at top of footing)
M long = 1.25(0) + 1.50(0) + 1.35(0) + 0.50(935) + 1.75(0 + 594) + 1.00(101) + 0.50(785) + 1.00(0) = 2001 ft-k
At base of footing:
M long = (1.257)(2001) + (67.7)(3.00) + (1.365)(3.00)2 ÷ 2 = 2724 ft-k
LRFD Substructure Example 3 Hammerhead Pier on Spread Footing
54
[11.6.1.4]
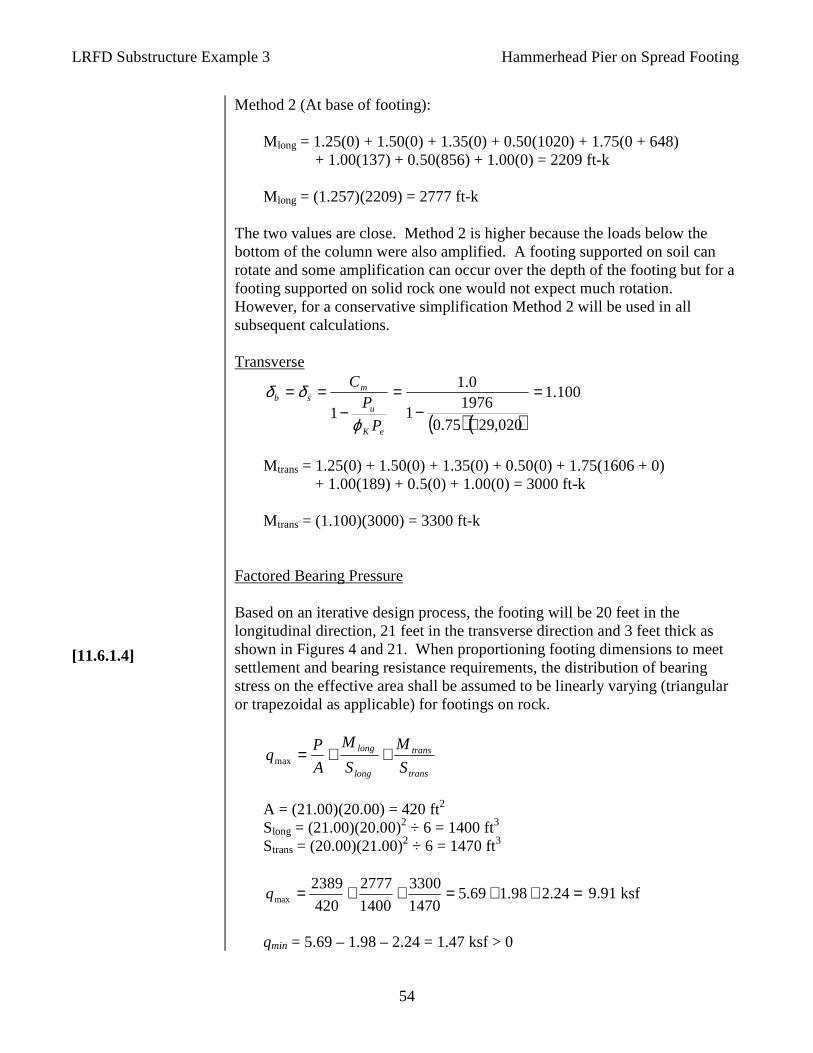
Method 2 (At base of footing): M long = 1.25(0) + 1.50(0) + 1.35(0) + 0.50(1020) + 1.75(0 + 648) + 1.00(137) + 0.50(856) + 1.00(0) = 2209 ft-k M long = (1.257)(2209) = 2777 ft-k
The two values are close. Method 2 is higher because the loads below the bottom of the column were also amplified. A footing supported on soil can rotate and some amplification can occur over the depth of the footing but for a footing supported on solid rock one would not expect much rotation. However, for a conservative simplification Method 2 will be used in all subsequent calculations.
Transverse
( ) ( )100.1
020,2975.0
19761
0.1
1=
⋅−
=−
==
eK
u
msb
P
PC
ϕ
δδ
M trans = 1.25(0) + 1.50(0) + 1.35(0) + 0.50(0) + 1.75(1606 + 0) + 1.00(189) + 0.5(0) + 1.00(0) = 3000 ft-k M trans = (1.100)(3000) = 3300 ft-k
Factored Bearing Pressure Based on an iterative design process, the footing will be 20 feet in the longitudinal direction, 21 feet in the transverse direction and 3 feet thick as shown in Figures 4 and 21. When proportioning footing dimensions to meet settlement and bearing resistance requirements, the distribution of bearing stress on the effective area shall be assumed to be linearly varying (triangular or trapezoidal as applicable) for footings on rock.
trans
trans
long
long
S
M
S
M
A
Pq ++=max
A = (21.00)(20.00) = 420 ft2 Slong = (21.00)(20.00)2 ÷ 6 = 1400 ft3 Strans = (20.00)(21.00)2 ÷ 6 = 1470 ft3
=++=++= 24.298.169.51470
3300
1400
2777
420
2389maxq 9.91 ksf
qmin = 5.69 – 1.98 – 2.24 = 1.47 ksf > 0

LRFD Substructure Example 3 Hammerhead Pier on Spread Footing
55
[3.4.1]
Since there is no uplift for this load case, the factored bearing pressures are as shown above. Strength III (max) Limit State:
Strength III = 1.25DC + 1.50DW + 1.35EV + 0.50(CR + SH) + 1.00WA + 1.40WS + 0.50TU + 1.00SE Pmax = 1.25(1263.6) + 1.50(66.2) + 1.35(130.7) + 0.50(0) + 1.00(0) + 1.40(0) + 0.50(0) + 1.00(13.3) = 1869 k
Longitudinal
Pu = 1.25(1074.6) + 1.50(66.2) + 1.00(13.3) = 1456 k
( ) ( )177.1
898,1275.0
14561
0.1
1=
⋅−
=−
==
eK
u
msb
P
PC
ϕ
δδ
M long = 1.25(0) + 1.50(0) + 1.35(0) + 0.50(1020) + 1.00(137) + 1.40(946) + 0.50(856) + 1.00(0) = 2399 ft-k
M long = (1.177)(2399) = 2824 ft-k
Transverse
( ) ( )072.1
020,2975.0
14561
0.1
1=
⋅−
=−
==
eK
u
msb
P
PC
ϕ
δδ
M trans = 1.25(0) + 1.50(0) + 1.35(0) + 0.50(0) + 1.00(189) + 1.40(1246 + 408) + 0.5(0) + 1.00(0) = 2505 ft-k M trans = (1.072)(2505) = 2685 ft-k
Factored Bearing Pressure
30.883.102.245.41470
2685
1400
2824
420
1869max =++=++=q ksf
qmin = 4.45 – 2.02 – 1.83 = 0.60 ksf > 0
LRFD Substructure Example 3 Hammerhead Pier on Spread Footing
56
[3.4.1]
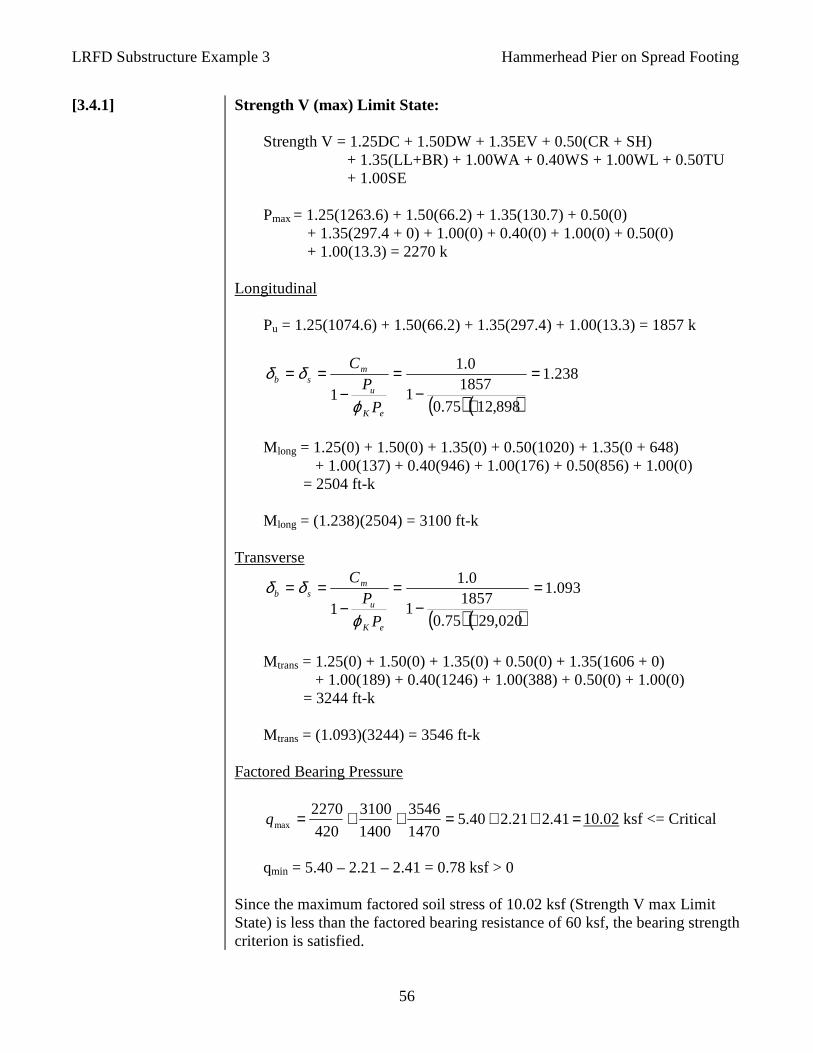
Strength V (max) Limit State:
Strength V = 1.25DC + 1.50DW + 1.35EV + 0.50(CR + SH) + 1.35(LL+BR) + 1.00WA + 0.40WS + 1.00WL + 0.50TU + 1.00SE Pmax = 1.25(1263.6) + 1.50(66.2) + 1.35(130.7) + 0.50(0) + 1.35(297.4 + 0) + 1.00(0) + 0.40(0) + 1.00(0) + 0.50(0) + 1.00(13.3) = 2270 k
Longitudinal
Pu = 1.25(1074.6) + 1.50(66.2) + 1.35(297.4) + 1.00(13.3) = 1857 k
( ) ( )238.1
898,1275.0
18571
0.1
1=
⋅−
=−
==
eK
u
msb
P
PC
ϕ
δδ
M long = 1.25(0) + 1.50(0) + 1.35(0) + 0.50(1020) + 1.35(0 + 648) + 1.00(137) + 0.40(946) + 1.00(176) + 0.50(856) + 1.00(0) = 2504 ft-k M long = (1.238)(2504) = 3100 ft-k
Transverse
( ) ( )093.1
020,2975.0
18571
0.1
1=
⋅−
=−
==
eK
u
msb
P
PC
ϕ
δδ
M trans = 1.25(0) + 1.50(0) + 1.35(0) + 0.50(0) + 1.35(1606 + 0) + 1.00(189) + 0.40(1246) + 1.00(388) + 0.50(0) + 1.00(0) = 3244 ft-k M trans = (1.093)(3244) = 3546 ft-k
Factored Bearing Pressure
=++=++= 41.221.240.51470
3546
1400
3100
420
2270maxq 10.02 ksf <= Critical
qmin = 5.40 – 2.21 – 2.41 = 0.78 ksf > 0
Since the maximum factored soil stress of 10.02 ksf (Strength V max Limit State) is less than the factored bearing resistance of 60 ksf, the bearing strength criterion is satisfied.

LRFD Substructure Example 3 Hammerhead Pier on Spread Footing
57
[11.5.2] [BDG] [3.4.1]
2. Settlement Settlement is a service limit state. For a multi-span bridge differential settlement can cause unacceptable structural distress in the bridge. There are also limits to total settlement to ensure a smooth ride and for aesthetics. The Geotechnical Foundation Report will provide information on settlement typically in the form of settlement versus factored bearing stress. The bridge engineer will determine the amount of deformation the structure can tolerate and ensure that the service limit bearing stress does not exceed the factored resistance for the given deformation. For a footing on spread footings supported on rock the maximum elastic settlement will generally be less than ½ inch. For the multi-span precast box beam bridge, where continuity is considered for only the composite dead loads, the maximum settlement should be less than ½ inch. Based on this tolerable total settlement, the factored bearing stress for the given settlement is 10.0 ksf. The maximum allowable rotation is 0.000625 radians to avoid in-depth analysis. For this problem the allowable settlement is 0.000625(86.50)(12) = 0.65 inches. An in-depth analysis is not required but will be performed to demonstrate how the analysis is performed Service I Limit State:
Service I = 1.00(DC + DW + EV + CR + SH) + 1.00(LL + BR) + 1.00WA + 0.30WS + 1.00WL + 1.00TU + 1.00SE
Pmax = 1.00(1263.6 + 66.2 + 130.7) + 1.00(297.4) + 1.00(13.3) = 1771 k
Longitudinal For second order effects, the axial load should include the applied load at the top plus half the column weight. For a hammerhead pier the entire cap should be added with half the remaining column weight. Since the column load in this example is small, conservatively use the reaction at the base of the column.
Pcol = 1.00(1074.6 + 66.2 + 0) + 1.00(297.4) + 1.00(13.3) = 1452 kips
( ) ( )177.1
898,1275.0
14521
0.1
1=
⋅−
=−
==
eK
u
msb
P
PC
ϕ
δδ
M long = 1.00(0 + 0 + 0 + 1020) + 1.00(0 + 648) + 1.00(137) + 0.30(946) + 1.00(176) + 1.00(856) + 1.00(0) = 3121 ft-k M long = (1.177)(3121) = 3673 ft-k

LRFD Substructure Example 3 Hammerhead Pier on Spread Footing
58
[11.6.1.4]
Transverse
( ) ( )071.1
020,2975.0
14521
0.1
1=
⋅−
=−
==
eK
u
msb
P
PC
ϕ
δδ
M trans = 1.00(0 + 0 + 0 + 0) + 1.00(1606 + 0) + 1.00(189) + 0.30(1246) + 1.00(388) + 1.00(0) + 1.00(0) = 2557 ft-k
M trans = (1.071)(2557) = 2739 ft-k
When proportioning footing dimensions to meet settlement and bearing resistance requirements, the distribution of bearing stress on the effective area shall be assumed to be linearly varying (triangular or trapezoidal as applicable) for footings on rock.
trans
trans
long
long
S
M
S
M
A
Pq ++=max
70.886.162.222.41470
2739
1400
3673
420
1771max =++=++=q ksf
qmin = 4.22 – 2.62 – 1.86 = -0.26 ksf < 0
Since uplift occurs use of the above formula for qmax underestimates the actual maximum stress. It is not desirable to have any uplift in a footing but it is not always avoidable for pier footings with moments in both directions. When uplift occurs, the determination of the maximum soil stress is very difficult and involves trial and error methods. Curves such as Figure 4.4.7.1.1.1C in the AASHTO Standard Specifications 17th Edition 2002 may be used to obtain an approximate solution. The result of using this curve is that the maximum soil stress is computed to be 8.86 ksf which is slightly higher than that determined above.
qr = ϕqn = (1.0)(8.86) = 8.86 ksf
Since the service limit bearing resistance of 10.0 ksf is greater than the applied service bearing pressure of 8.86 ksf, the settlement criterion is satisfied.

LRFD Substructure Example 3 Hammerhead Pier on Spread Footing
59
[11.6.3.6] [10.6.3.3] [11.5.3]
[10.5.5-1]
[3.4.1]
3. Sliding Resistance Spread footings must be designed to resist lateral loads without sliding failure of the foundation. The sliding resistance of a footing on rock is based on the normal stress and the interface friction between the foundation and the rock. The Geotechnical Foundation Report should provide the interface friction value and the resistance factor for sliding for use in design. The Strength Limit States are used for this analysis. However, since the resistance is based on the reaction, minimum factors are used for all vertical loads. The most critical case is for the pier footing overburden soil to be removed, so EV will be taken as zero assuming scour has occurred.
From given geotechnical data, the factored interface coefficient of friction is 0.45 and the resistance factor is 0.80. Strength I (min) Limit State:
Max Strength I = 1.25DC + 1.50DW + 1.35EV + 0.50(CR + SH) + 1.75(LL+BR) + 1.00WA + 0.50TU + 1.00SE Min Strength I = 0.90DC + 0.65DW + 1.00EV + 0.50(CR + SH) + 1.75(LL+BR) + 1.00WA + 0.50TU + 1.00SE
Pmin = 0.90(1263.6) + 0.65(0) + 1.00(0) + 0.50(0) + 1.75(-30.4 + 0) + 1.00(0) + 0.50(0) + 1.00(-13.3) = 1071 k V long = 1.25(0) + 1.50(0) + 1.35(0) + 0.50(28.32) + 1.75(0 + 18.00) + 1.00(14.24) + 0.50(23.79) + 1.00(0) = 71.8 k V trans = 1.25(0) + 1.50(0) + 1.35(0) + 0.50(0) + 1.75(0 + 0) + 1.00(20.34) + 0.50(0) + 1.00(0) = 20.3 k
( ) ( ) kVu 6.743.208.71 22 =+=
Vn = (0.45)(1071) = 482 k Vr = ϕτVn = (0.80)(482) = 386 k

LRFD Substructure Example 3 Hammerhead Pier on Spread Footing
60
[3.4.1] [3.4.1]
Strength III (min) Limit State:
Max Strength III = 1.25DC + 1.50DW + 1.35EV + 0.50(CR + SH) + 1.00WA + 1.40WS + 0.50TU + 1.00SE Min Strength III = 0.90DC + 0.65DW + 1.00EV + 0.50(CR + SH) + 1.00WA + 1.40WS + 0.50TU + 1.00SE
Pmin = 0.90(1263.6) + 0.65(0) + 1.35(0) + 0.50(0) + 1.00(0) + 1.40(-53.0) + 0.50(0) + 1.00(-13.3) = 1050 k
V long = 1.25(0) + 1.50(0) + 1.35(0) + 0.50(28.32) + 1.00(14.24) + 1.40(29.84) + 0.50(23.79) + 1.00(0) = 82.1 k V trans = 1.25(0) + 1.50(0) + 1.35(0) + 0.50(0) + 1.00(20.34) + 1.40(34.09) + 0.50(0) + 1.00(0) = 68.1 k
( ) ( ) kVu 7.1061.681.82 22 =+=
Vn = (0.45)(1050) = 473 k Vr = ϕτVn = (0.80)(473) = 378 k
Strength V (min) Limit State: Max Strength V = 1.25DC + 1.50DW + 1.35EV + 0.50(CR + SH) + 1.35(LL+BR) + 1.00WA + 0.40WS + 1.00WL + 0.50TU + 1.00SE Min Strength V = 0.90DC + 0.65DW + 1.00EV + 0.50(CR + SH) + 1.35(LL+BR) + 1.00WA + 0.40WS + 1.00WL + 0.50TU + 1.00SE Pmin = 0.90(1263.6) + 0.65(0) + 1.00(0) + 0.50(0) + 1.35(-30.4 + 0) + 1.00(0) + 0.40(0) + 1.00(0) + 0.50(0) + 1.00(-13.3) = 1083 k V long = 1.25(0) + 1.50(0) + 1.35(0) + 0.50(28.32) + 1.35(0 + 18.00) + 1.00(14.24) + 0.40(29.84) + 1.00(4.88) + 0.50(23.79) + 1.00(0) = 81.4 k V trans = 1.25(0) + 1.50(0) + 1.35(0) + 0.50(0) + 1.35(0 + 0) + 1.00(20.34) + 0.40(34.09) + 1.00(8.59) + 0.50(0) + 1.00(0) = 42.6 k

LRFD Substructure Example 3 Hammerhead Pier on Spread Footing
61
[11.6.3.3]
( ) ( ) kVu 9.916.424.81 22 =+=
Vn = (0.45)(1083) = 487 k Vr = ϕτVn = (0.80)(487) = 390 k
Since the factored sliding resistance for all limit states exceeds the factored sliding force, the sliding resistance criterion is satisfied.
4. Limiting Eccentricity (Overturning) Spread footing foundations must be designed to resist overturning which results from lateral and eccentric vertical loads. For LRFD, the criteria were revised to reflect the factoring of loads. As a result, the eccentricity of footings for factored loads must be less than 3/8B and 3/8L for footings on rock. These new limits were developed by direct calibration with ASD. The effect of factoring the loads is to increase the eccentricity of the load resultant such that the permissible eccentricity is increased.
The appropriate Strength Limit States are I, III and V. The maximum eccentricity will be found by applying the maximum load factors to each lateral or eccentrically applied load but to apply the minimum load factors to the resisting loads. The load combinations are the same as for sliding except moments are grouped instead of lateral loads. The maximum moments were previously calculated to determine the bearing pressure. Strength I (min) Limit State
Max Strength I = 1.25DC + 1.50DW + 1.35EV + 0.50(CR + SH) + 1.75(LL+BR) + 1.00WA + 0.50TU + 1.00SE Min Strength I = 0.90DC + 0.65DW + 1.00EV + 0.50(CR + SH) + 1.75(LL+BR) + 1.00WA + 0.50TU + 1.00SE Pmin = 0.90(1263.6) + 0.65(0) + 1.00(0) + 0.50(0) + 1.75(-30.4 + 0) + 0.50(0) + 1.00(-13.3) = 1071 k M long = 2777 ft-k M trans = 3300 ft-k elong = 2777 / 1071 = 2.59 ft < 3/8B = (3/8)(20.00) = 7.50 ft etrans = 3300 / 1071 = 3.08 ft < 3/8L = (3/8)(21.00) = 7.88 ft

LRFD Substructure Example 3 Hammerhead Pier on Spread Footing
62
Strength III (min) Limit State Max Strength III = 1.25DC + 1.50DW + 1.35EV + 0.50(CR + SH) + 1.00WA + 1.40WS + 0.50TU + 1.00SE Min Strength III = 0.90DC + 0.65DW + 1.00EV + 0.50(CR + SH) + 1.00WA + 1.40WS + 0.50TU + 1.00SE
Pmin = 0.90(1263.6) + 0.65(0) + 1.00(0) + 0.50(0) + 1.00(0) + 1.40(-53.0) + 0.50(0) + 1.00(-13.3) = 1050 k M long = 2824 ft-k M trans = 2685 ft-k elong = 2824 / 1050 = 2.69 ft < 7.50 ft etrans = 2685 / 1050 = 2.56 ft < 7.88 ft
Strength V (min) Limit State
Max Strength V = 1.25DC + 1.50DW + 1.35EV + 0.50(CR + SH) + 1.35(LL+BR) + 1.00WA + 0.40WS +1.00WL + 0.50TU + 1.00SE Min Strength V = 0.90DC + 0.65DW + 1.00EV + 0.50(CR + SH) + 1.35(LL+BR) + 1.00WA + 0.40WS +1.00WL + 0.50TU + 1.00SE Pmin = 0.90(1263.6) + 0.65(0) + 1.00(0) + 0.50(0) + 1.35(-30.4 + 0) + 1.00(0) + 0.40(0) + 1.00(0) + 0.50(0) + 1.00(-13.3) = 1083 k M long = 3100 ft-k M trans = 3546 ft-k elong = 3100 / 1083 = 2.86 ft < 7.50 ft etrans = 3546 / 1083 = 3.27 ft < 7.88 ft
Since the eccentricity for each strength limit state is within the allowable limit, the pier is stable.
LRFD Substructure Example 3 Hammerhead Pier on Spread Footing
63
5. Overall Stability Overall stability is a service limit state that depends upon the properties and orientation of the joints of the supporting rock mass. Satisfying the design criteria is the responsibility of the geotechnical engineer. The results of this analysis should be included in the Geotechnical Foundation Report.

LRFD Substructure Example 3 Hammerhead Pier on Spread Footing
64
[11.6.4] Transverse Design
6. Structural Resistance All parts of the footing must satisfy the appropriate strength and serviceability requirements. In this example service limit state is investigated first since it will often control the amount of reinforcing in a footing. The transverse direction will be investigated first. To determine the critical moment and shear the distribution of the soil stress must be known. A one foot wide strip will be used for the analysis and design of the footing. A linear variation in the soil stress is assumed for the structural design of the footing. Service I Limit State
Pmax = 1771 k M trans = 2739 ft-k Area = (20.00)(21.00) = 420 ft2 Strans = (20.00)(21.00)2 ÷ 6 = 1470 ft3 fmax = 1771 / 420 + 2739 / 1470 = 6.080 ksf fmin = 1771 / 420 - 2739 / 1470 = 2.353 ksf
Figure 18

LRFD Substructure Example 3 Hammerhead Pier on Spread Footing
65
[5.13.3.4] Control of Cracking [5.7.3.4] [5.7.3.4-1]
At the face of support: fsupport = 6.080 – (6.080 – 2.353)(7.50) / (21.00) = 4.749 ksf M trans = 4.749(7.50)2 ÷ 2 + (6.080 – 4.749)(7.50)2 ÷ 3
- 1.00(0.15)(3.00)(7.50)2 ÷ 2 – 1.00(0.11)(3.00)(7.50)2 ÷ 2 = 136.58 ft-k/ft Try #10 @ 6 inches
As = (1.27)(12 / 6) = 2.540 in2/ft
The footing must be checked for cracking loads. This section applies to all members in which tension in the cross-section exceeds 80 percent of the modulus of rupture at service limit state.
( ) ( ) ksif r 359.05.324.080.080.0 =⋅=
The stress in the footing under service loads is:
( ) ( ) 322
25926
0.360.12
6in
bhSc =⋅== /ft
( ) ( )
ksiS
Mf
c
ss 632.0
2592
0.1258.136 =⋅==
Since the service limit stress exceeds 80 percent of the cracking load stress, the crack control criteria must be satisfied.
csss
e df
s 2700
−≤β
γ
in which:
( )c
cs dh
d
−+=
7.01β
dc = 3.00 clr + 1.27 + 1.27 / 2 = 4.91 in
( ) 226.191.400.367.0
91.41 =
−⋅+=sβ
γe = 0.75 for class 2 exposure since the footing is exposed to soil and water.
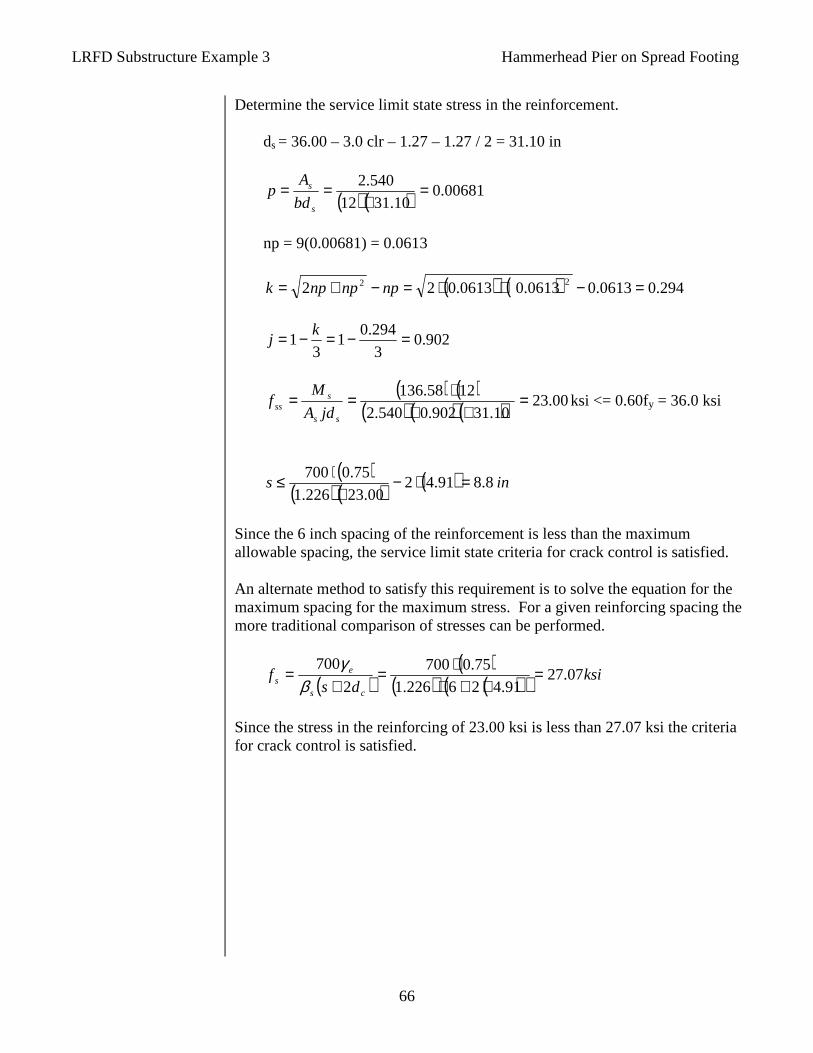
LRFD Substructure Example 3 Hammerhead Pier on Spread Footing
66
Determine the service limit state stress in the reinforcement.
ds = 36.00 – 3.0 clr – 1.27 – 1.27 / 2 = 31.10 in
( ) ( ) 00681.010.3112
540.2 =⋅
==s
s
bd
Ap
np = 9(0.00681) = 0.0613
( ) ( ) 294.00613.00613.00613.022 22 =−+⋅=−+= npnpnpk
902.03
294.01
31 =−=−= k
j
( ) ( )
( ) ( ) ( ) 00.2310.31902.0540.2
1258.136 =⋅⋅
⋅==ss
sss jdA
Mf ksi <= 0.60fy = 36.0 ksi
( )( ) ( ) ( ) ins 8.891.42
00.23226.1
75.0700 =⋅−⋅
⋅≤
Since the 6 inch spacing of the reinforcement is less than the maximum allowable spacing, the service limit state criteria for crack control is satisfied. An alternate method to satisfy this requirement is to solve the equation for the maximum spacing for the maximum stress. For a given reinforcing spacing the more traditional comparison of stresses can be performed.
( )( )
( ) ( )( ) ksids
fcs
es 07.27
91.426226.1
75.0700
2
700=
⋅+⋅⋅=
+=
βγ
Since the stress in the reinforcing of 23.00 ksi is less than 27.07 ksi the criteria for crack control is satisfied.

LRFD Substructure Example 3 Hammerhead Pier on Spread Footing
67
[3.4.1] [5.13.3.4] [5.8.2.9] [5.8.3.2]
Strength I Limit State
Pmax = 2389 k M trans = 3300 ft-k fmax = 2389 / 420 + 3300 / 1470 = 7.933 ksf fmin = 2389 / 420 - 3300 / 1470 = 3.443 ksf
At the face of support: fsupport = 7.933 – (7.933 – 3.443)(7.50) / (21.00) = 6.329 ksf MUtrans = 6.329(7.50)2 ÷ 2 + (7.933 – 6.329)(7.50)2 ÷ 3 – 1.25(0.15)(3.00)(7.50)2 ÷ 2 – 1.35(0.11)(3.00)(7.50)2 ÷ 2 = 179.73 ft-k/ft <= Critical
The shear depth, dv, is determined as the greatest of the following criteria:
de = 36.00 – 3.00 clr – 1.27(1.5) = 31.10 in a = (2.540)(60) / [0.85(3.5)(12)] = 4.27 in 1) dv = 31.10 – 4.27 / 2 = 28.97 in <= Critical but not less than: 2) 0.9 de = (0.9)(31.10) = 27.99 in 3) 0.72 h = (0.72)(36.00) = 25.92 in Use dv = 28.97 in
At the distance “dv” from the face of the support:
Edge distance = 7.50 – 28.97 ÷ 12 = 5.086 ft fdv = 7.933 – (7.933 – 3.443)(5.086) / (21.00) = 6.846 ksf
Vdv = (7.933 + 6.846)(5.086) ÷2 – 1.25(0.15)(3.00)(5.086) – 1.35(0.11)(3.00)(5.086) = 32.46 k/ft <= Critical
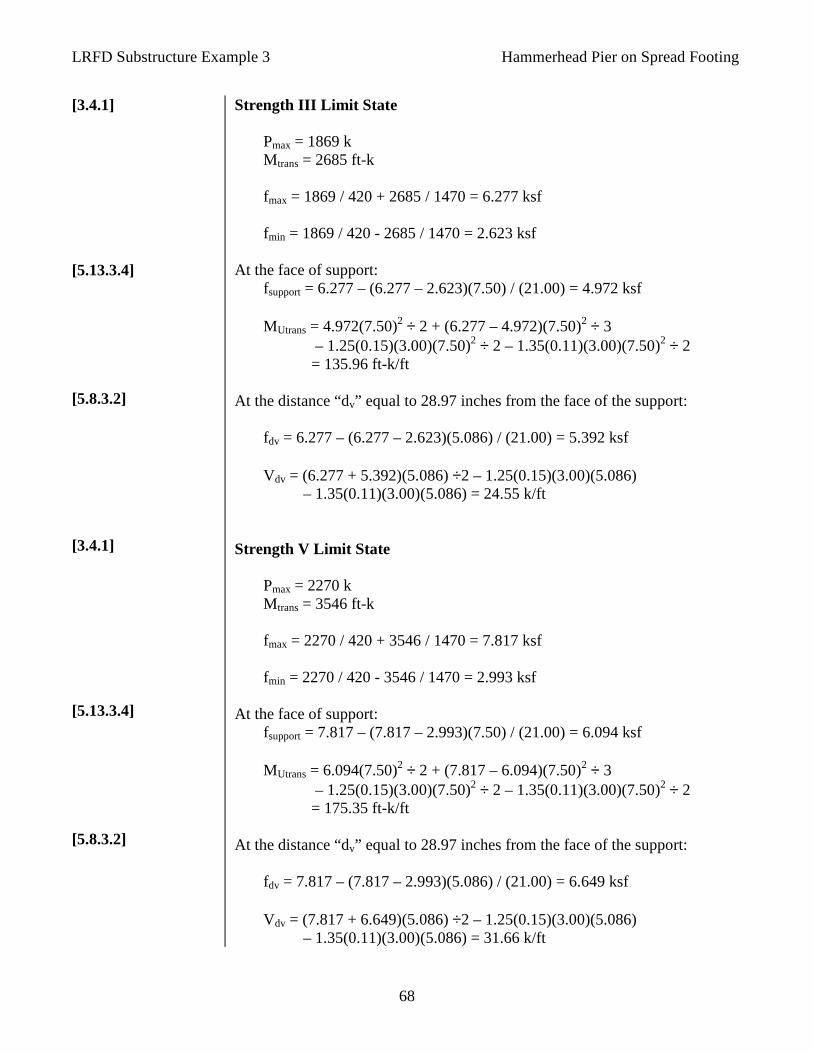
LRFD Substructure Example 3 Hammerhead Pier on Spread Footing
68
[3.4.1] [5.13.3.4] [5.8.3.2] [3.4.1] [5.13.3.4] [5.8.3.2]
Strength III Limit State
Pmax = 1869 k M trans = 2685 ft-k fmax = 1869 / 420 + 2685 / 1470 = 6.277 ksf fmin = 1869 / 420 - 2685 / 1470 = 2.623 ksf
At the face of support: fsupport = 6.277 – (6.277 – 2.623)(7.50) / (21.00) = 4.972 ksf
MUtrans = 4.972(7.50)2 ÷ 2 + (6.277 – 4.972)(7.50)2 ÷ 3 – 1.25(0.15)(3.00)(7.50)2 ÷ 2 – 1.35(0.11)(3.00)(7.50)2 ÷ 2 = 135.96 ft-k/ft
At the distance “dv” equal to 28.97 inches from the face of the support: fdv = 6.277 – (6.277 – 2.623)(5.086) / (21.00) = 5.392 ksf Vdv = (6.277 + 5.392)(5.086) ÷2 – 1.25(0.15)(3.00)(5.086) – 1.35(0.11)(3.00)(5.086) = 24.55 k/ft
Strength V Limit State
Pmax = 2270 k M trans = 3546 ft-k fmax = 2270 / 420 + 3546 / 1470 = 7.817 ksf fmin = 2270 / 420 - 3546 / 1470 = 2.993 ksf
At the face of support: fsupport = 7.817 – (7.817 – 2.993)(7.50) / (21.00) = 6.094 ksf
MUtrans = 6.094(7.50)2 ÷ 2 + (7.817 – 6.094)(7.50)2 ÷ 3 – 1.25(0.15)(3.00)(7.50)2 ÷ 2 – 1.35(0.11)(3.00)(7.50)2 ÷ 2 = 175.35 ft-k/ft
At the distance “dv” equal to 28.97 inches from the face of the support:
fdv = 7.817 – (7.817 – 2.993)(5.086) / (21.00) = 6.649 ksf
Vdv = (7.817 + 6.649)(5.086) ÷2 – 1.25(0.15)(3.00)(5.086) – 1.35(0.11)(3.00)(5.086) = 31.66 k/ft
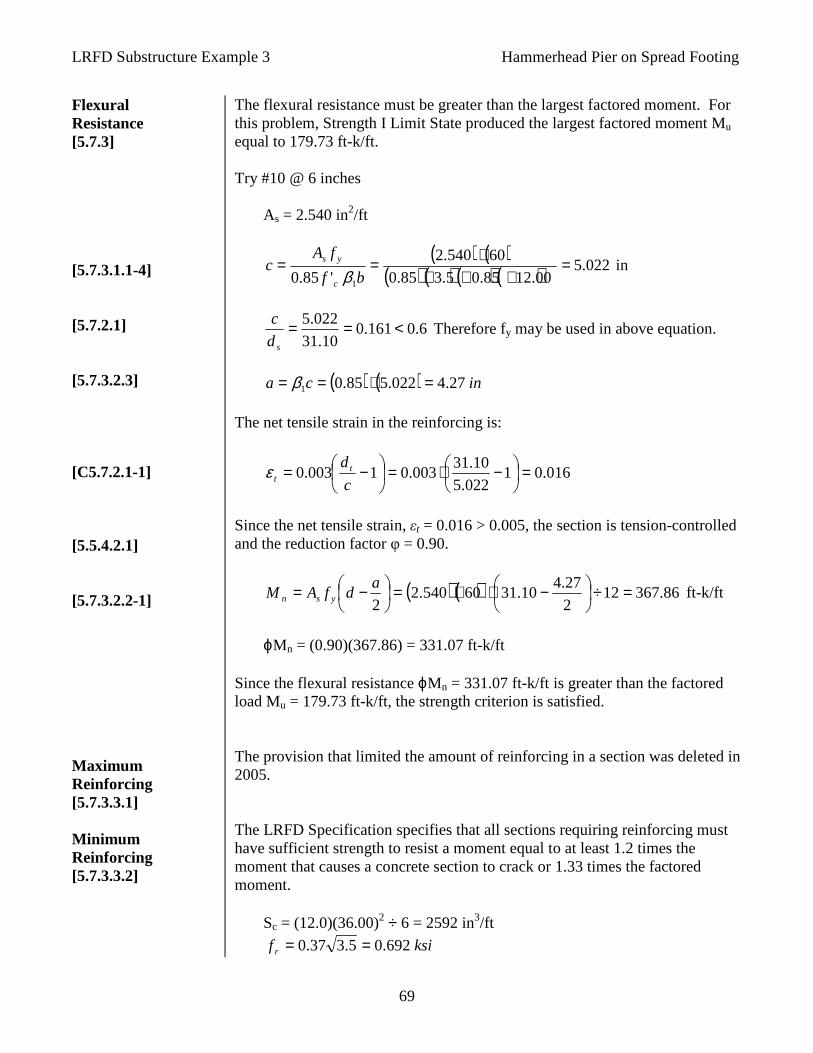
LRFD Substructure Example 3 Hammerhead Pier on Spread Footing
69
Flexural Resistance [5.7.3] [5.7.3.1.1-4] [5.7.2.1] [5.7.3.2.3] [C5.7.2.1-1] [5.5.4.2.1] [5.7.3.2.2-1] Maximum Reinforcing [5.7.3.3.1] Minimum Reinforcing [5.7.3.3.2]
The flexural resistance must be greater than the largest factored moment. For this problem, Strength I Limit State produced the largest factored moment Mu equal to 179.73 ft-k/ft. Try #10 @ 6 inches
As = 2.540 in2/ft
( ) ( )( ) ( ) ( ) ( ) 022.5
00.1285.05.385.0
60540.2
'85.0 1
=⋅⋅⋅
⋅==bf
fAc
c
ys
β in
6.0161.010.31
022.5 <==sd
c Therefore fy may be used in above equation.
( ) ( ) inca 27.4022.585.01 =⋅== β
The net tensile strain in the reinforcing is:
016.01022.5
10.31003.01003.0 =
−⋅=
−=c
d ttε
Since the net tensile strain, εt = 0.016 > 0.005, the section is tension-controlled and the reduction factor φ = 0.90.
( ) ( ) 86.367122
27.410.3160540.2
2=÷
−⋅⋅=
−= adfAM ysn ft-k/ft
ϕMn = (0.90)(367.86) = 331.07 ft-k/ft
Since the flexural resistance ϕMn = 331.07 ft-k/ft is greater than the factored load Mu = 179.73 ft-k/ft, the strength criterion is satisfied.
The provision that limited the amount of reinforcing in a section was deleted in 2005.
The LRFD Specification specifies that all sections requiring reinforcing must have sufficient strength to resist a moment equal to at least 1.2 times the moment that causes a concrete section to crack or 1.33 times the factored moment.
Sc = (12.0)(36.00)2 ÷ 6 = 2592 in3/ft
ksif r 692.05.337.0 ==
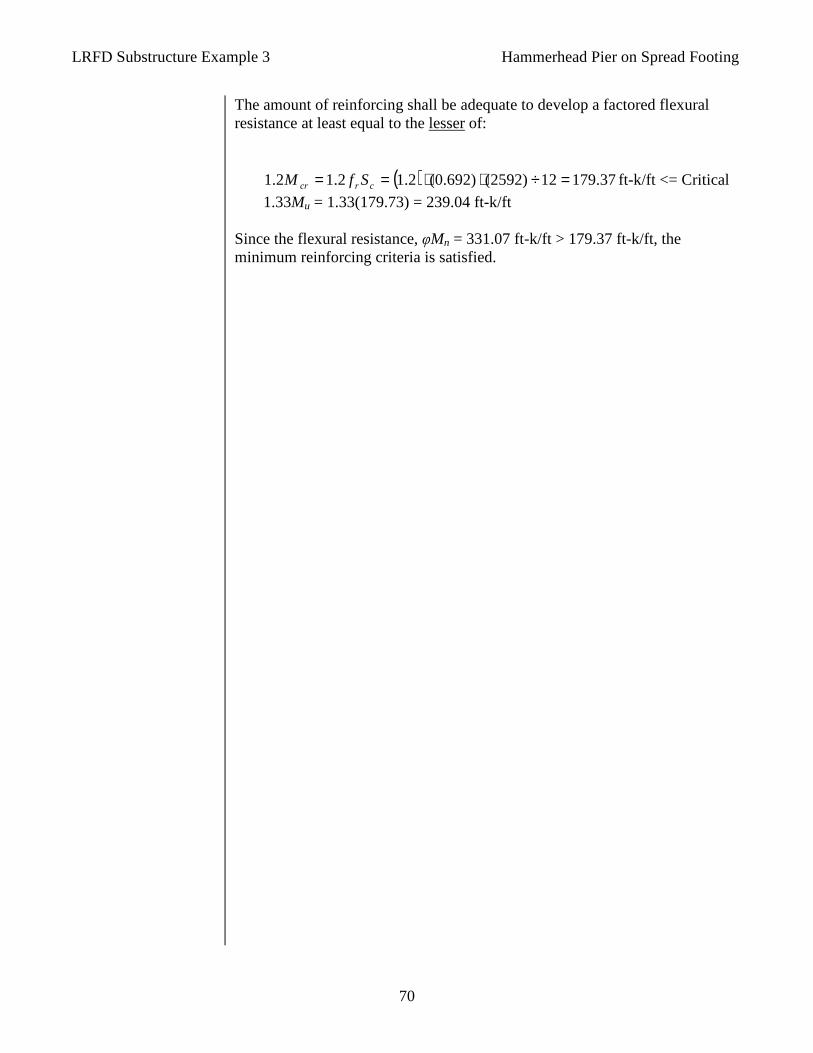
LRFD Substructure Example 3 Hammerhead Pier on Spread Footing
70
The amount of reinforcing shall be adequate to develop a factored flexural resistance at least equal to the lesser of:
( ) 37.17912)2592()692.0(2.12.12.1 =÷⋅⋅== crcr SfM ft-k/ft <= Critical
1.33Mu = 1.33(179.73) = 239.04 ft-k/ft
Since the flexural resistance, φMn = 331.07 ft-k/ft > 179.37 ft-k/ft, the minimum reinforcing criteria is satisfied.
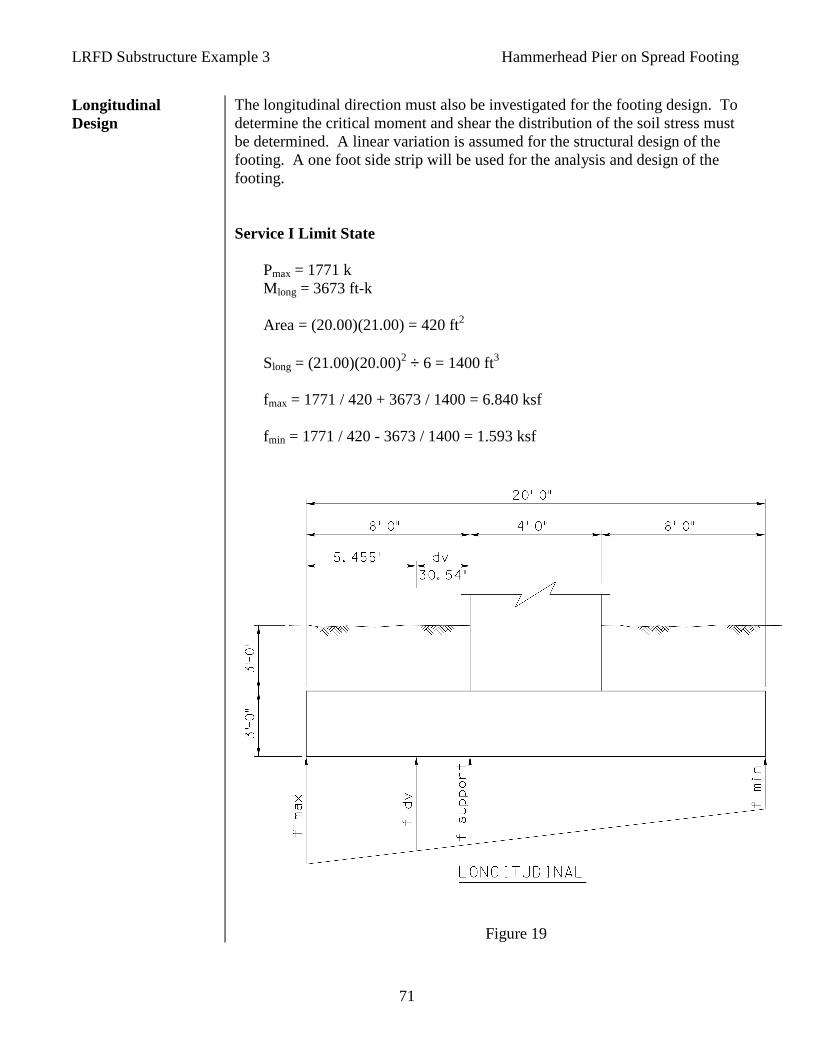
LRFD Substructure Example 3 Hammerhead Pier on Spread Footing
71
Longitudinal Design
The longitudinal direction must also be investigated for the footing design. To determine the critical moment and shear the distribution of the soil stress must be determined. A linear variation is assumed for the structural design of the footing. A one foot side strip will be used for the analysis and design of the footing. Service I Limit State
Pmax = 1771 k M long = 3673 ft-k Area = (20.00)(21.00) = 420 ft2 Slong = (21.00)(20.00)2 ÷ 6 = 1400 ft3 fmax = 1771 / 420 + 3673 / 1400 = 6.840 ksf fmin = 1771 / 420 - 3673 / 1400 = 1.593 ksf
Figure 19

LRFD Substructure Example 3 Hammerhead Pier on Spread Footing
72
[5.13.3.4] Control of Cracking [5.7.3.4] [5.7.3.4-1]
At the face of support: fsupport = 6.840 – (6.840 – 1.593)(8.00) / (20.00) = 4.741 ksf M long = 4.741(8.00)2 ÷ 2 + (6.840 – 4.741)(8.00)2 ÷ 3 – 1.00(0.15)(3.00)(8.00)2 ÷ 2 – 1.00(0.11)(3.00)(8.00)2 ÷ 2 = 171.53 ft-k/ft
Try #10 @ 7 inches
As = (1.27)(12 / 7) = 2.177 in2/ft
The footing must be checked for cracking loads. This section applies to all members in which tension in the cross-section exceeds 80 percent of the modulus of rupture at service limit state.
( ) ( ) ksif r 359.05.324.080.080.0 =⋅=
The stress in the footing under service loads is:
( ) ( ) 322
25926
0.360.12
6in
bhSc =⋅== /ft
( ) ( )
ksiS
Mf
c
ss 794.0
2592
0.1253.171 =⋅==
Since the service limit stress exceeds 80 percent of the cracking load stress, the crack control criteria must be satisfied.
csss
e df
s 2700
−≤β
γ
in which:
( )c
cs dh
d
−+=
7.01β
dc = 3.00 clr + 1.27 / 2 = 3.64 in
( ) 161.164.300.367.0
64.31 =
−⋅+=sβ
γe = 0.75 for class 2 exposure since the footing is exposed to soil and water.
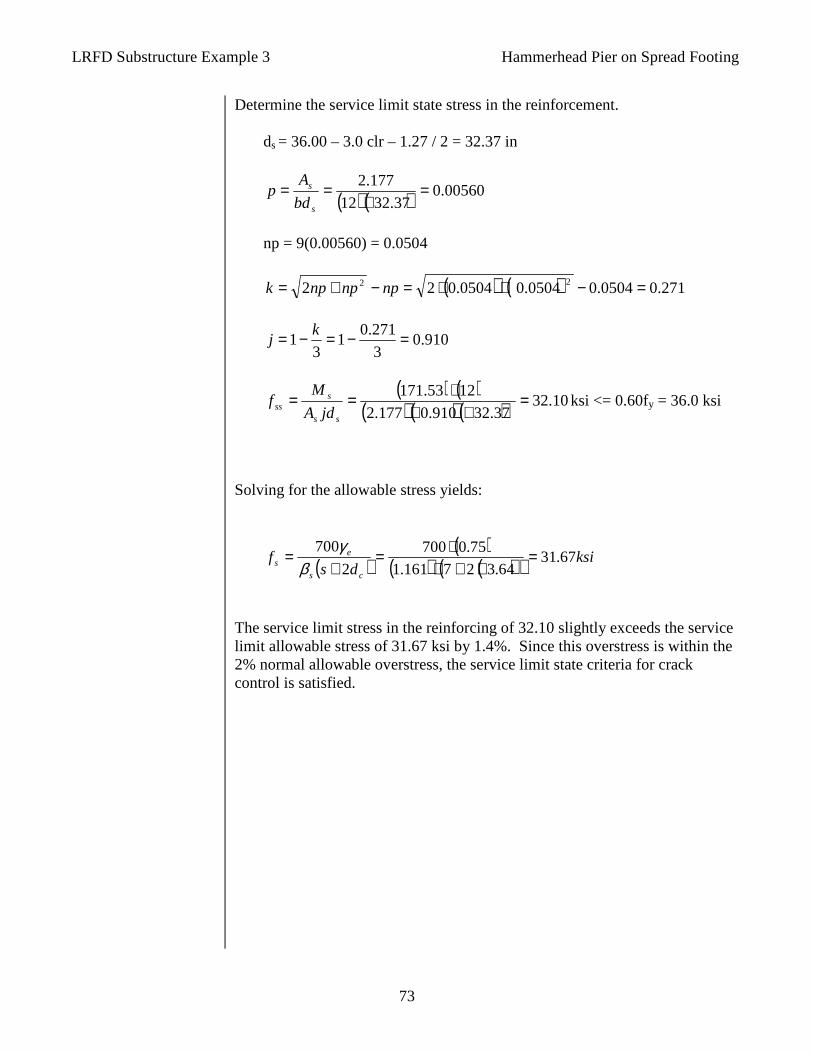
LRFD Substructure Example 3 Hammerhead Pier on Spread Footing
73
Determine the service limit state stress in the reinforcement.
ds = 36.00 – 3.0 clr – 1.27 / 2 = 32.37 in
( ) ( ) 00560.037.3212
177.2 =⋅
==s
s
bd
Ap
np = 9(0.00560) = 0.0504
( ) ( ) 271.00504.00504.00504.022 22 =−+⋅=−+= npnpnpk
910.03
271.01
31 =−=−= k
j
( ) ( )
( ) ( ) ( ) 10.3237.32910.0177.2
1253.171 =⋅⋅
⋅==ss
sss jdA
Mf ksi <= 0.60fy = 36.0 ksi
Solving for the allowable stress yields:
( )( )
( ) ( )( ) ksids
fcs
es 67.31
64.327161.1
75.0700
2
700=
⋅+⋅⋅=
+=
βγ
The service limit stress in the reinforcing of 32.10 slightly exceeds the service limit allowable stress of 31.67 ksi by 1.4%. Since this overstress is within the 2% normal allowable overstress, the service limit state criteria for crack control is satisfied.

LRFD Substructure Example 3 Hammerhead Pier on Spread Footing
74
[3.4.1] [5.13.3.4] [5.8.2.9] [5.8.3.2]
Strength I Limit State
Pmax = 2389 k M long = 2777 ft-k fmax = 2389 / 420 + 2777 / 1400 = 7.672 ksf fmin = 2389 / 420 - 2777 / 1400 = 3.705 ksf
At the face of support
fsupport = 7.672 – (7.672 – 3.705)(8.00) / (20.00) = 6.085 ksf M long = 6.085(8.00)2 ÷ 2 + (7.672 – 6.085)(8.00)2 ÷ 3 – 1.25(0.15)(3.00)(8.00)2 ÷ 2 – 1.35(0.11)(3.00)(8.00)2 ÷ 2 = 196.32 ft-k/ft <= Critical
The shear depth, dv, is determined as the greatest of the following criteria:
de = 36.00 – 3.00 clr – 1.27 / 2 = 32.37 in a = (2.177)(60) / [0.85(3.5)(12)] = 3.66 in 1) dv = 32.37 – 3.66 / 2 = 30.54 in <= Critical but not less than: 2) 0.9 de = (0.9)(32.37) = 29.13 in 3) 0.72 h = (0.72)(36.00) = 25.92 in Use dv = 30.54 in
At the distance “dv” from the face of the support:
Edge distance = 8.00 – 30.54 ÷ 12 = 5.455 ft fdv = 7.672 – (7.672 – 3.705)(5.455) / (20.00) = 6.590 ksf
Vdv = (7.672 + 6.590)(5.455) ÷2 – 1.25(0.15)(3.00)(5.455) – 1.35(0.11)(3.00)(5.455) = 33.40 k/ft <= Critical

LRFD Substructure Example 3 Hammerhead Pier on Spread Footing
75
[5.13.3.4] [5.8.3.2] [5.13.3.4] [5.8.3.2]
Strength III Limit State
Pmax = 1869 k M long = 2824 ft-k fmax = 1869 / 420 + 2824 / 1400 = 6.467 ksf fmin = 1869 / 420 - 2824 / 1400 = 2.433 ksf
At the face of support: fsupport = 6.467 – (6.467 – 2.433)(8.00) / (20.00) = 4.853 ksf
M long = 4.853(8.00)2 ÷ 2 + (6.467 – 4.853)(8.00)2 ÷ 3 – 1.25(0.15)(3.00)(8.00)2 ÷ 2 – 1.35(0.11)(3.00)(8.00)2 ÷ 2 = 157.47 ft-k/ft
At the distance “dv” equal to 30.54 inches from the face of the support: fdv = 6.467 – (6.467 – 2.433)(5.455) / (20.00) = 5.367 ksf Vdv = (6.467 + 5.367)(5.455) ÷2 – 1.25(0.15)(3.00)(5.455) – 1.35(0.11)(3.00)(5.455) = 26.78 k/ft
Strength V Limit State
Pmax = 2270 k M long = 3100 ft-k fmax = 2270 / 420 + 3100 / 1400 = 7.619 ksf fmin = 2270 / 420 - 3100 / 1400 = 3.190 ksf
At the face of support: fsupport = 7.619 – (7.619 – 3.190)(8.00) / (20.00) = 5.847 ksf
M long = 5.847(8.00)2 ÷ 2 + (7.619 – 5.847)(8.00)2 ÷ 3 – 1.25(0.15)(3.00)(8.00)2 ÷ 2 – 1.35(0.11)(3.00)(8.00)2 ÷ 2 = 192.65 ft-k/ft
At the distance “dv” equal to 30.54 inches from the face of the support: fdv = 7.619 – (7.619 – 3.190)(5.455) / (20.00) = 6.411 ksf Vdv = (7.619 + 6.411)(5.455) ÷2 – 1.25(0.15)(3.00)(5.455) – 1.35(0.11)(3.00)(5.455) = 32.77 k/ft
LRFD Substructure Example 3 Hammerhead Pier on Spread Footing
76
Flexural Resistance [5.7.3] [5.7.33.1.1-4] [5.7.2.1] [5.7.3.2.3] [C5.7.2.1-1] [5.5.4.2.1] [5.7.3.2.2-1] Maximum Reinforcing [5.7.3.3.1] Minimum Reinforcing [5.7.3.3.2]
The flexural resistance must be greater than the largest factored moment. For this problem, Strength I Limit State produced the largest factored moment equal to 196.32 ft-k/ft. Try #10 @ 7 inches
As = 2.177 in2/ft ds = 36.00 – 3.00 clr – 1.27 / 2 = 32.37 in
( ) ( )( ) ( ) ( ) ( ) 304.4
00.1285.05.385.0
60177.2
'85.0 1
=⋅⋅⋅
⋅==bf
fAc
c
ys
β in
6.0133.037.32
304.4 <==sd
c Therefore fy may be used in above equation.
( ) ( ) inca 66.3304.485.01 =⋅== β
The net tensile strain in the reinforcing is:
020.01304.4
37.32003.01003.0 =
−⋅=
−=c
d ttε
Since the net tensile strain, εt = 0.020 > 0.005, the section is tension-controlled and the reduction factor φ = 0.90.
( ) ( ) 43.332122
66.337.3260177.2
2=÷
−⋅⋅=
−= adfAM ysn ft-k/ft
ϕMn = (0.90)(332.43) = 299.19 ft-k/ft
Since the flexural resistance ϕMn = 299.19 ft-k/ft is greater than the factored load Mu = 196.32 ft-k/ft, the strength criterion is satisfied. The provision that limited the amount of reinforcing in a section was deleted in 2005.
The LRFD Specification specifies that all sections requiring reinforcing must have sufficient strength to resist a moment equal to at least 1.2 times the moment that causes a concrete section to crack or 1.33 times the factored moment.
Sc = (12.0)(36.00)2 ÷ 6 = 2592 in3/ft
ksif r 692.05.337.0 ==

LRFD Substructure Example 3 Hammerhead Pier on Spread Footing
77
The amount of reinforcing shall be adequate to develop a factored flexural resistance at least equal to the lesser of:
( ) 37.17912)2592()692.0(2.12.12.1 =÷⋅⋅== crcr SfM ft-k/ft <= Critical
1.33Mu = 1.33(196.32) = 261.11 ft-k/ft
Since the flexural resistance, φMn = 299.19 ft-k/ft > 179.37 ft-k/ft, the minimum reinforcing criteria is satisfied.

LRFD Substructure Example 3 Hammerhead Pier on Spread Footing
78
Distribution [5.13.3.5] Development Length [5.11.2.1.1] [5.11.2.1.3]
Reinforcing in a footing must be properly distributed. For a rectangular shaped footing, the reinforcing in the long direction (transverse moment) may be equally distributed across the width of the footing. In the short direction (longitudinal moment), a portion of the total reinforcing as specified below shall be distributed uniformly across the width equal to the length of the short side.
05.100.20
00.21 ==β
SDsSDsSDsBWs AAAA ⋅⋅⋅⋅ =
+=
+= 978.0
105.1
2
1
2
β
Since the area is close to 1.0, ignore the requirement. The reinforcing must be properly developed on both sides of the critical section. The minimum available development length is (7.50)(12) – 2 clear = 88 inches. The required development length of a #10 reinforcing bar is:
( ) ( ) ( )9.50
5.3
6027.125.1
'
25.1=⋅⋅==
c
ybd
f
fAl inches
but not less than: ( ) ( ) ( ) 5.306027.14.04.0 =⋅⋅=yb fd inches
Modification factors that reduce ld:
Not less than 6 inch spacing 0.8 Excess Reinforcing: 196.32 / 299.19 = 0.656
Required development:
ld = (0.8)(0.656)(50.9) = 26.7 inch Since the available development length is greater than the required, the development length criterion is satisfied.

LRFD Substructure Example 3 Hammerhead Pier on Spread Footing
79
Transverse Footing Shear [5.8] [5.8.1.1] [5.8.3.2] [5.8.2.9] [5.8.3.4.1] [5.8.3.3-3] ] [5.8.3.3-1] [5.8.3.3-2]
Determine Shear The maximum factored one-way shear in the footing is the Strength I Limit State value of 32.46 k/ft. Determine Analysis Model The sectional model of analysis is appropriate for the design of pier footings since the assumptions of traditional beam theory are valid. Since concentrated loads are not applied directly to the footings the sectional model may be used.
Shear Depth, dv The shear depth has previously been calculated as dv equal to 28.97 inches.
Estimate Crack Angle θθθθ For concrete footings the simplified procedure may be used.
β = 2.0 θ = 45°
Calculate Concrete Shear Strength, Vc The nominal shear resistance from concrete, Vc, is calculated as follows:
vvcc dbfV '0316.0 β=
( ) ( ) ( ) 10.4197.2800.125.30.20316.0 =⋅⋅⋅⋅=cV k/ft
The nominal shear strength is the lesser of:
Vn = Vc + Vs + Vp = 41.10 k/ft <= Critical Vn = 0.25f’cbvdv + Vp = 0.25(3.5)(12.00)(28.97) + 0 = 304.19 k/ft ϕVn = (0.90)(41.10) = 36.99 k/ft > Vu = 32.46 k/ft
Since the factored applied shear in the transverse direction is less than the strength, the one-way shear criterion is satisfied.

LRFD Substructure Example 3 Hammerhead Pier on Spread Footing
80
Longitudinal Footing Shear [5.8] [5.8.1.1] [5.8.3.2] [5.8.2.9] [5.8.3.4.1] [5.8.3.3-3] [5.8.3.3-1] [5.8.3.3-2]
Determine Shear The maximum factored one-way shear in the footing is the Strength I Limit State value of 33.40 k/ft.
Determine Analysis Model The sectional model of analysis is appropriate for the design of pier footings since the assumptions of traditional beam theory are valid. Since concentrated loads are not applied directly to the footings the sectional model may be used.
Shear Depth, dv The shear depth has previously been calculated as dv equal to 30.54 inches.
Estimate Crack Angle θθθθ For concrete footings the simplified procedure may be used.
β = 2.0 θ = 45°
Calculate Concrete Shear Strength, Vc The nominal shear resistance from concrete, Vc, is calculated as follows:
vvcc dbfV '0316.0 β=
( ) ( ) ( ) 33.4354.3000.125.30.20316.0 =⋅⋅⋅⋅=cV k/ft
The nominal shear strength is the lesser of:
Vn = Vc + Vs + Vp = 43.33 k/ft <= Critical Vn = 0.25f’cbvdv + Vp = 0.25(3.5)(12.00)(30.54) + 0 = 320.67 k/ft ϕVn = (0.90)(43.33) = 39.00 k/ft > Vu = 33.40 k/ft
Since the factored applied shear in the transverse direction is less than the strength, the shear criterion is satisfied.

LRFD Substructure Example 3 Hammerhead Pier on Spread Footing
81
Two-Way Shear [5.13.3.6.1]
Two-way shear shall also be checked for the footing. For investigation of two-way shear the maximum vertical load will be the controlling limit state. Strength I Limit State controls with a factored axial load at the top of the footing of:
Pmax = 1.25(1074.6) + 1.50(66.2) + 1.75(297.4) + 1.00(13.3) = 1976.3 kips For the effective shear depth use the average of the shear depth in the two different directions.
dv = (28.97 + 30.54) ÷ 2 = 29.76 inches The perimeter is taken at a distance of dv / 2 from the face of the column.
Trans = 72.00 + 28.97 = 100.97 inches Long = 48.00 + 30.54 = 78.54 inches
bo = (100.97 + 78.54)(2) = 359.02 inches
In addition to the reaction from the bottom of the column, the weight of the footing and cover soil inside the shear perimeter will also add to the shear.
Footing: 1.25(0.150)(3.00)(78.54)(100.97) / 144 = 31.0 k Soil: 1.35(0.110)(3.00)[(78.54)(100.97) / 144 - (4)(6)] = 13.8 k
Figure 20

LRFD Substructure Example 3 Hammerhead Pier on Spread Footing
82
[5.13.3.6.3-1] Development Length [5.11.2.4]
The soil reaction at the base of the footing must be subtracted from this applied load to determine the net shear acting on the footing. Since all four sides of the perimeter are considered, the effect of the bending moments is canceled and can be ignored.
Pmax = 1.25(1263.6) + 1.50(66.2) + 1.35(130.7) + 1.75(297.4) + 1.00(13.3) = 2389 kips fsoil = 2389 / 420 = 5.688 ksf Rsoil = 5.688(100.97)(78.54) / 144 = 313.2 kips
V2way = 1976.3 + 31.0 + 13.8 – 313.2 = 1707.9 kips
The equation for the nominal shear resistance of the concrete is:
vocvocc
n dbfdbfV '126.0'126.0
063.0 ≤
+=
β
05.100.20
00.21 ==cβ
( ) ( ) 365876.2902.3595.305.1
126.0063.0 =⋅⋅
+=nV kips
( ) ( ) 251976.2902.3595.3126.0 =⋅⋅≤nV kips
The shear strength of the footing for two-way shear from the concrete is:
ϕVn = (0.90)(2519) = 2267 kips ≥ Vu = 1708 kips
∴The two-way shear criterion is satisfied. The vertical column reinforcing must be adequately developed into the footing. The #11 reinforcement will be hooked with an available embedment length of 36.00 – 3.00 clr – 1.27(2) = 30.5 inches. The required development length of a hooked reinforcing bar is:
( ) ( )6.28
5.3
41.10.38
'
0.38=⋅==
c
bhb
f
dl in
Since the available length is greater than the required, the development length of the vertical column reinforcing into the footing is satisfied.
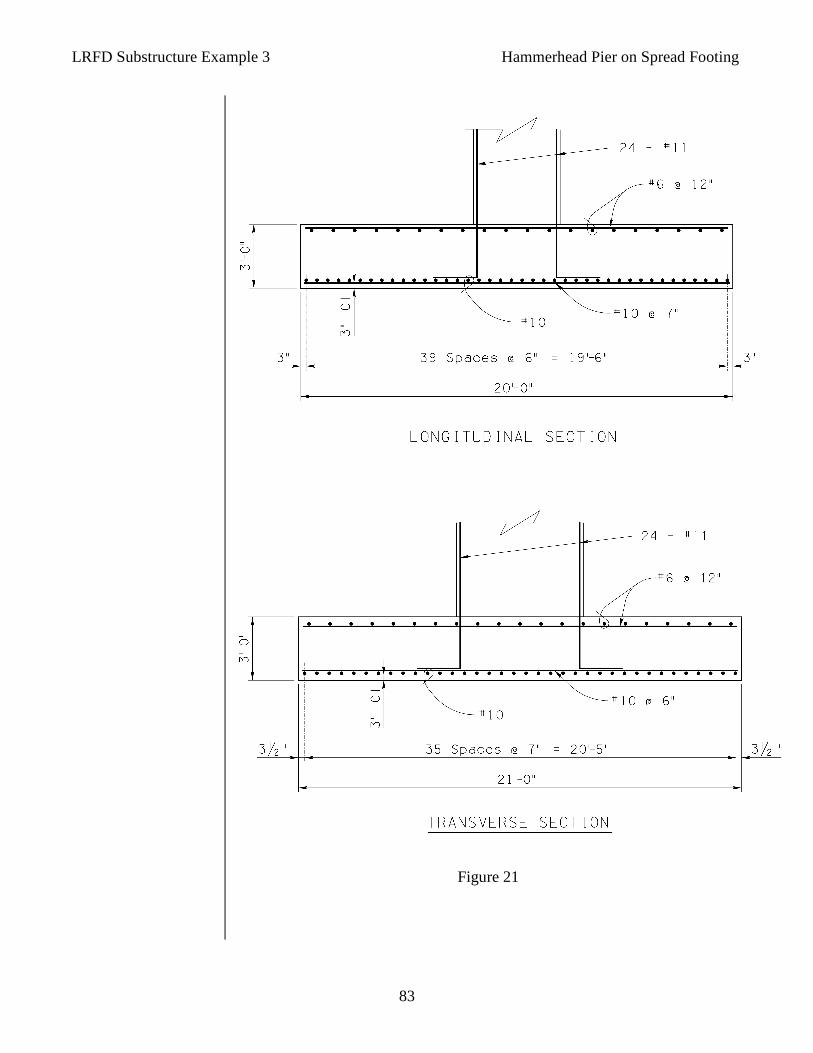
LRFD Substructure Example 3 Hammerhead Pier on Spread Footing
83
Figure 21