Appendix A : Data Dictionary · Graph map #1 w/ meridians and parallels removed. UTM projection....
56
159 Appendix A : Data Dictionary
Transcript of Appendix A : Data Dictionary · Graph map #1 w/ meridians and parallels removed. UTM projection....

159
Appendix A : Data Dictionary

160
Data Feature Class Attribute Value Description Page #
allyn1 15-minute Allyns' Bight Digital Line Arc none (37)Graph map #1 w/ meridians and parallelsremoved. UTM projection.
allynf01 Original Arc/Info coverage converted from Arc none (37)15-minute Allyns' Bight Digital Line Graphmap #1. UTM projection.
aranarea Grid of subwatershed delineated from the Grid none integer 63,291 cells 70Aransas River USGS gauge (drainpt1)using the clipfdr flow direction grid.
arancov Equivalent polygon coverage of the Polygon none 70aranarea grid. Created using gridpoly
aranlu Land Use coverage specific to the Polygon lusecat same as lusecat for sanlu coverage. 126subwatershed delineated from theAransas River TNRCC SWQM gauge.Created by clipping the sanlu coveragewith the araptcov coverage.
aranpt Single cell grid identifying the location of Grid none 126the TNRCC SWQM station # 12948 on theAransas River. All other cells have valuesof NODATA.
aranrain Precipitation grid specific to the Grid Precip- varies Precipitation values in each grid-cell 81subwatershed delineated from the depth are in units of millimeters/year.Aransas River USGS gauge. 761 - 860 mm/year.
* All arc, polygon, and point coverages and all grids are projected in TSMS-Albers coordinates unless otherwise
specified.
** The Page # field lists the location within the document where the data layer is first referenced. Page #'s in
parentheses ( ) indicate that the data are not explicitly called out on the page, but that the process described on
the page has been performed in the creation of the data layer.

161
Data Feature Class Attribute Value Description Page #
araptcov Equivalent polygon coverage of the Polygon none 126arptarea grid. Created using the gridpolycommand.
arlugrid Equivalent 100-meter cellsize grid of the Grid land use varies between the lusecat 12 values specifed 126aranlu coverage. Created using polygrid for the sanluse coverage.with the lusecat attribute specified for grid-cell values.
arptarea Grid of subwatershed delineated from the Grid none 126Aransas River TNRCC SWQM station(aranpt) using the clipfdr flow direction grid.
arrunoff Grid of cumulative runoff from each land Grid runoff varies Cumulative runoff values in each grid- 126use specified in the arlugrid grid. Created volume cell are in units of cubic meters / year.using the zonalsum command, summing 6730 - 41,141,650 cub. meters/yr.values from the runoff grid based onzonal regions specified in arlugrid.
attrib.dat Arc/Info file of expected mean INFO lusecat same as lusecat for sanluse coverage 93concentration data. Created from the tn 0 - 4.4 (mg/L) total nitrogen emcemc3a.dat text file. Used to assign EMC tkn 0 - 1.7 (mg/L) total kjeldahl nitrogen emcattributes to the land use coverage, sanlu. nn 0 - 1.6 (mg/L) nitrate + nitrite emc
tp 0 - 1.3 (mg/L) total phosphorus emcdp 0 - 0.48 (mg/L) dissolved phosphorus emcss 0 - 107 (mg/L) total suspended solids emcds 0 - 1225 (mg/L) total dissolved solids emcpb 0 - 15 (ug/L) total lead emccu 0 - 15 (ug/L) total copper emczn 0 - 245 (ug/L) total zinc emccd 0 - 1.05 (ug/L) total cadmium emccr 0 - 10 (ug/L) total chromium emcni 0 - 11.8 (ug/L) total nickel emc
bod 0 - 25.5 (mg/L) biological oxygen demand emccod 0 - 116 (mg/L) chemical oxygen demand emco&g 0 - 9 (mg/L) oil & grease emc

162
Data Feature Class Attribute Value Description Page #
fcol 0 - 53,000 (col/100 mL) fecal coliform emcfstr 0 - 56,000 (col/100 mL) fecal streptococci emc
attribut.dat Arc/Info table, built from a text file, INFO stations- integer 1-5 48including USGS gauge station-id number idand name. Used to add attributes to the stat-num 08189200 USGS stream gauge stationstations coverage. 08189300 identification number.
081895000818970008189800
stat-nam Copano Stream or Creek that gauge is locatedMedio on.
MissionAransasChiltipin
balugrid Equivalent 100-meter cellsize grid of the Grid land use varies between the lusecat 12 values specifed (126)bayptlu coverage. Created using polygrid for the sanluse coverage.with the lusecat attribute specified for grid-cell values.
barriers Polygon coverage of the barrier islands Polygon none 67included in the final digital line graphhydrography coverage. Converted fromArcView shapefile and sanpolys coverage.
barunoff Grid of cumulative runoff from each land Grid runoff varies Cumulative runoff values in each grid- (126)use specified in the balugrid grid. Created volume cell are in units of cubic meters / year.using the zonalsum command, summing 35,530 - 106,393,580 cub. meters/yr.values from the runoff grid based onzonal regions specified in balugrid.
basin Appended coverage of the covsheds, Polygon none 76covtrim, baybuff, and barriers coverages.
bayarea Grid of subwatershed delineated from the Grid none (126)Copano Bay SWQM station # 12945(baypt) using the clipfdr flow direction grid.
163
Data Feature Class Attribute Value Description Page #
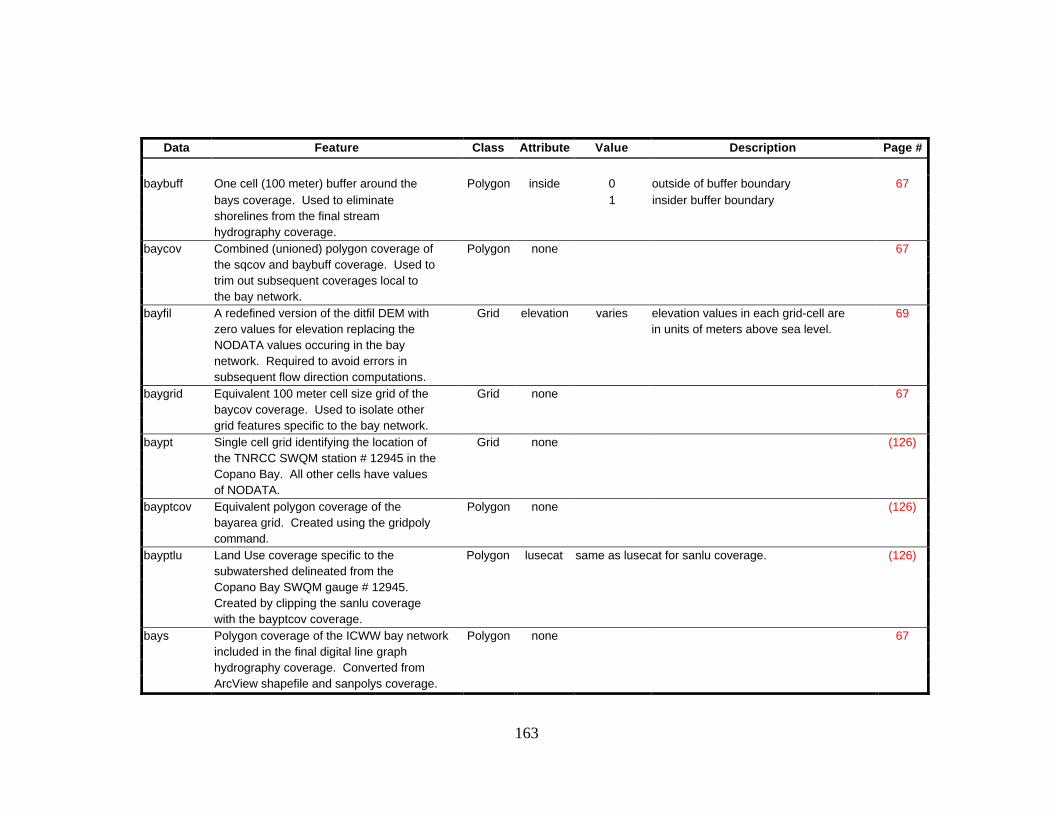
baybuff One cell (100 meter) buffer around the Polygon inside 0 outside of buffer boundary 67bays coverage. Used to eliminate 1 insider buffer boundaryshorelines from the final streamhydrography coverage.
baycov Combined (unioned) polygon coverage of Polygon none 67the sqcov and baybuff coverage. Used totrim out subsequent coverages local tothe bay network.
bayfil A redefined version of the ditfil DEM with Grid elevation varies elevation values in each grid-cell are 69zero values for elevation replacing the in units of meters above sea level.NODATA values occuring in the baynetwork. Required to avoid errors insubsequent flow direction computations.
baygrid Equivalent 100 meter cell size grid of the Grid none 67baycov coverage. Used to isolate othergrid features specific to the bay network.
baypt Single cell grid identifying the location of Grid none (126)the TNRCC SWQM station # 12945 in theCopano Bay. All other cells have valuesof NODATA.
bayptcov Equivalent polygon coverage of the Polygon none (126)bayarea grid. Created using the gridpolycommand.
bayptlu Land Use coverage specific to the Polygon lusecat same as lusecat for sanlu coverage. (126)subwatershed delineated from theCopano Bay SWQM gauge # 12945.Created by clipping the sanlu coveragewith the bayptcov coverage.
bays Polygon coverage of the ICWW bay network Polygon none 67included in the final digital line graphhydrography coverage. Converted fromArcView shapefile and sanpolys coverage.

164
Data Feature Class Attribute Value Description Page #
bcdem Merged grid of the the 4 Beeville and Grid elevation varies elevation values in each grid-cell are 41Corpus Christi Digital Elevation Model in units of meters above sea level.mapsheets. Geographic coordinates
bcdemalb Reprojected version of the merged Digital Grid elevation varies elevation values in each grid-cell are 41Elevation Model . in units of meters above sea level.
bee1 15-minute Beeville Digital Line Arc none 37Graph map #1 w/ meridians and parallelsremoved. UTM projection.
bee2 15-minute Beeville Digital Line Arc none (37)Graph map #2 w/ meridians and parallelsremoved. UTM projection.
bee3 15-minute Beeville Digital Line Arc none (37)Graph map #3 w/ meridians and parallelsremoved. UTM projection.
bee4 15-minute Beeville Digital Line Arc none (37)Graph map #4 w/ meridians and parallelsremoved. UTM projection.
bee5 15-minute Beeville Digital Line Arc none (37)Graph map #5 w/ meridians and parallelsremoved. UTM projection.
bee6 15-minute Beeville Digital Line Arc none (37)Graph map #6 w/ meridians and parallelsremoved. UTM projection.
bee7 15-minute Beeville Digital Line Arc none (37)Graph map #7 w/ meridians and parallelsremoved. UTM projection.
bee8 15-minute Beeville Digital Line Arc none (37)Graph map #8 w/ meridians and parallelsremoved. UTM projection.
beedeme Initial grid created from Beeville East 3" Grid elevation varies elevation values in each grid-cell are 41Digital Elevation Model mapsheet. in units of meters above sea level.Projected in Geographic coordinates.

165
Data Feature Class Attribute Value Description Page #
beedemw Initial grid created from Beeville West 3" Grid elevation varies elevation values in each grid-cell are 41Digital Elevation Model mapsheet. in units of meters above sea level.Projected in Geographic coordinates.
beef01 Original Arc/Info coverage converted from Arc none 3715-minute Beeville Digital Line Graphmap #1. UTM projection.
beef02 Original Arc/Info coverage converted from Arc none (37)15-minute Beeville Digital Line Graph.map #2. UTM projection.
beef03 Original Arc/Info coverage converted from Arc none (37)15-minute Beeville Digital Line Graph.map #3. UTM projection.
beef04 Original Arc/Info coverage converted from Arc none (37)15-minute Beeville Digital Line Graph.map #4. UTM projection.
beef05 Original Arc/Info coverage converted from Arc none (37)15-minute Beeville Digital Line Graph.map #5. UTM projection.
beef06 Original Arc/Info coverage converted from Arc none (37)15-minute Beeville Digital Line Graph.map #6. UTM projection.
beef07 Original Arc/Info coverage converted from Arc none (37)15-minute Beeville Digital Line Graph.map #7. UTM projection.
beef08 Original Arc/Info coverage converted from Arc none (37)15-minute Beeville Digital Line Graph.map #8. UTM projection.
beeload Point source phosphorus load grid for the Grid Load 32,694 Annual Point source phosphorus load 120Beeville point source identified in the at the Beeville location in units ofbeepoint grid. All other cells have values kg/year.of zero.

166
Data Feature Class Attribute Value Description Page #
beelu Cleaned version of the original Beeville Polygon none 44land use coverage. Standard Albersprojection.
beenit Point source nitrogen load grid for the Grid Load 71,498 Annual Point source nitrogen load (120)Beeville point source identified in the at the Beeville location in units ofbeepoint grid. All other cells have values kg/year.of zero.
beepoint Single cell grid identifying the presumed Grid none 120location of a Beeville point source alongthe Aransas River. All other cells havevalues of NODATA.
beernof Cell-based phosphorus loading grid Grid Load varies Cell-based load values in each grid 121created by adding the nonpoint source cell are in units of mg-mm/L-year.loading grid (phosrnof) and the Beeville 0 - 3,269,400 mg-mm/L-yr.point source loading grid (beeload).
bord Border of the digitally delineated San Arc none 79Antonio-Nueces Basin, created from anArcView shapefile by selecting only thosesanbasin polygons corresponding to thebasin, i.e. exluding the trimshed polygons.
border Cleaned version of the bord coverage. Polygon none 79bordgrid Equivalent 100 meter cellsize grid of the Grid none 81
sanbord coverage. Created using polygrid.cadconc Grid of predicted cadmium concentrations Grid Concen- varies Concentration values in each grid-cell (102)
due to nonpoint sources. Created by tration are in units of micrograms/Liter.dividing the cumulative cadmium load grid 0 - 2.0 ug/L(cadload) by the annual cumulative runoffgrid (runoffac).
cadgrid Initial 100-meter cellsize grid of total Grid Cd EMC 0 Barren/Water/Wetland EMC (95)cadmium EMC values. Created by (ug/L) 0.75 Urban Residential EMCconverting the sanlu coverage (with the cd 0.96 Urban Commercial EMCattribute specified) to a grid using polygrid. 2 Urban Industrial EMC
167
Data Feature Class Attribute Value Description Page #
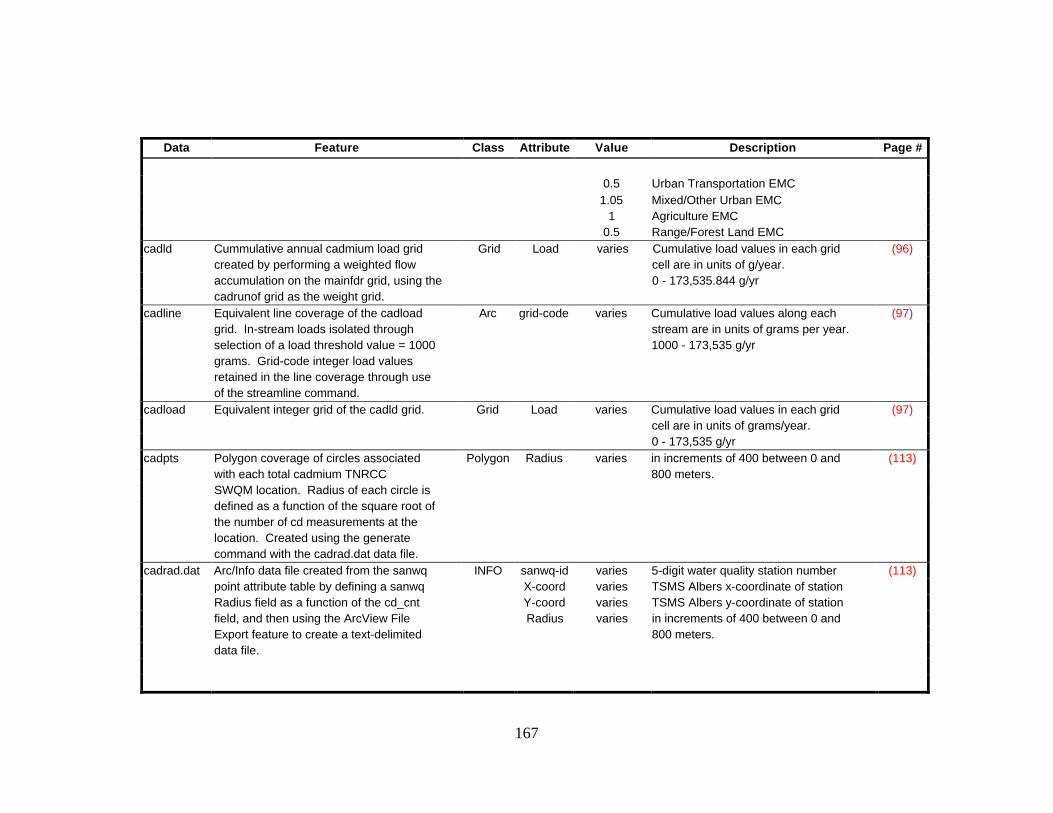
0.5 Urban Transportation EMC1.05 Mixed/Other Urban EMC
1 Agriculture EMC0.5 Range/Forest Land EMC
cadld Cummulative annual cadmium load grid Grid Load varies Cumulative load values in each grid (96)created by performing a weighted flow cell are in units of g/year.accumulation on the mainfdr grid, using the 0 - 173,535.844 g/yrcadrunof grid as the weight grid.
cadline Equivalent line coverage of the cadload Arc grid-code varies Cumulative load values along each (97)grid. In-stream loads isolated through stream are in units of grams per year.selection of a load threshold value = 1000 1000 - 173,535 g/yrgrams. Grid-code integer load valuesretained in the line coverage through useof the streamline command.
cadload Equivalent integer grid of the cadld grid. Grid Load varies Cumulative load values in each grid (97)cell are in units of grams/year.0 - 173,535 g/yr
cadpts Polygon coverage of circles associated Polygon Radius varies in increments of 400 between 0 and (113)with each total cadmium TNRCC 800 meters.SWQM location. Radius of each circle isdefined as a function of the square root ofthe number of cd measurements at thelocation. Created using the generatecommand with the cadrad.dat data file.
cadrad.dat Arc/Info data file created from the sanwq INFO sanwq-id varies 5-digit water quality station number (113)point attribute table by defining a sanwq X-coord varies TSMS Albers x-coordinate of stationRadius field as a function of the cd_cnt Y-coord varies TSMS Albers y-coordinate of stationfield, and then using the ArcView File Radius varies in increments of 400 between 0 andExport feature to create a text-delimited 800 meters.data file.
168
Data Feature Class Attribute Value Description Page #
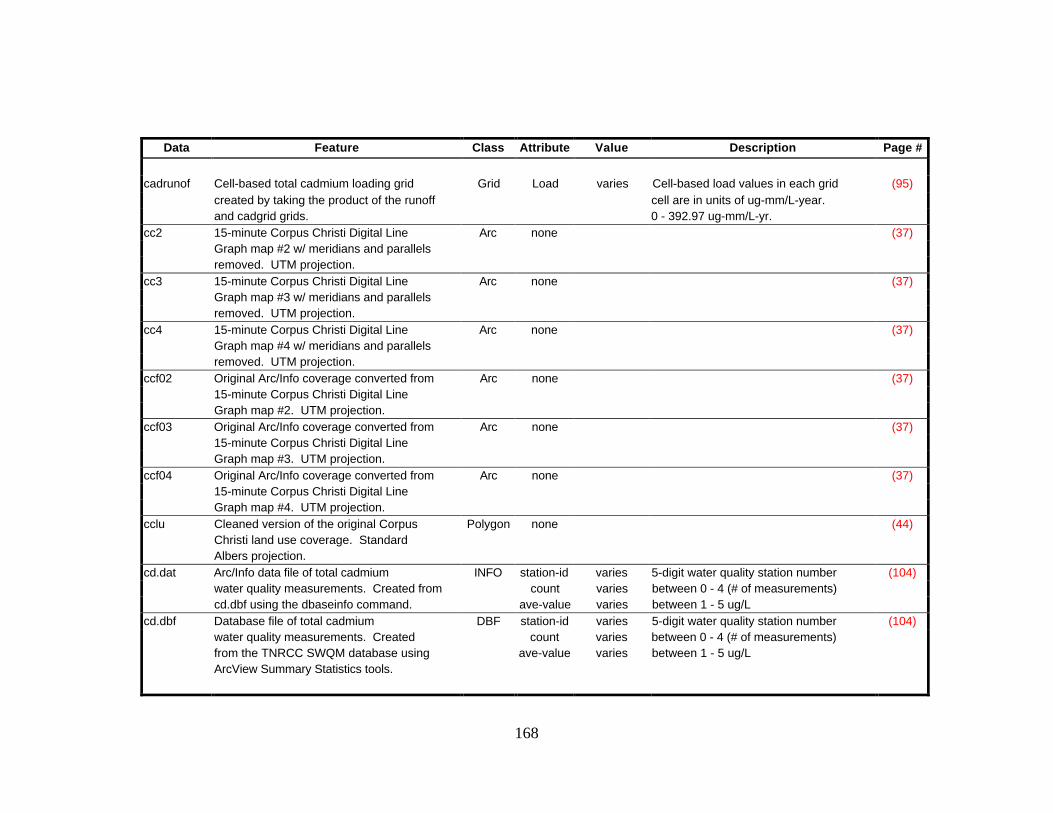
cadrunof Cell-based total cadmium loading grid Grid Load varies Cell-based load values in each grid (95)created by taking the product of the runoff cell are in units of ug-mm/L-year.and cadgrid grids. 0 - 392.97 ug-mm/L-yr.
cc2 15-minute Corpus Christi Digital Line Arc none (37)Graph map #2 w/ meridians and parallelsremoved. UTM projection.
cc3 15-minute Corpus Christi Digital Line Arc none (37)Graph map #3 w/ meridians and parallelsremoved. UTM projection.
cc4 15-minute Corpus Christi Digital Line Arc none (37)Graph map #4 w/ meridians and parallelsremoved. UTM projection.
ccf02 Original Arc/Info coverage converted from Arc none (37)15-minute Corpus Christi Digital LineGraph map #2. UTM projection.
ccf03 Original Arc/Info coverage converted from Arc none (37)15-minute Corpus Christi Digital LineGraph map #3. UTM projection.
ccf04 Original Arc/Info coverage converted from Arc none (37)15-minute Corpus Christi Digital LineGraph map #4. UTM projection.
cclu Cleaned version of the original Corpus Polygon none (44)Christi land use coverage. StandardAlbers projection.
cd.dat Arc/Info data file of total cadmium INFO station-id varies 5-digit water quality station number (104)water quality measurements. Created from count varies between 0 - 4 (# of measurements)cd.dbf using the dbaseinfo command. ave-value varies between 1 - 5 ug/L
cd.dbf Database file of total cadmium DBF station-id varies 5-digit water quality station number (104)water quality measurements. Created count varies between 0 - 4 (# of measurements)from the TNRCC SWQM database using ave-value varies between 1 - 5 ug/LArcView Summary Statistics tools.

169
Data Feature Class Attribute Value Description Page #
cdcon Final nonpoint cadmium concentration Arc grid-code varies Concentration values along each (102)coverage. Created by clipping the cdline stream are in units of ug/L x 1000.arc coverage with the mainland template. 0 - 1770
cdconstr Grid of predicted nonpoint cadmium Grid Concen- varies Concentration values in each grid-cell (102)concentrations occuring in the stream tration are in units of micrograms/Liter.network of the basin. Created using the 0 - 1.77 ug/LCon statement with the introfac andcadconc grids.
cdline Equivalent line coverage of the cdconstr Arc grid-code varies Concentration values along each (102)grid. Concentrations multiplied by 1000 to stream are in units of ug/L x 1000.retain significant figures. Grid-code integer 0 - 1770concentration values retained in the linecoverage through use of the streamlinecommand.
cdload Final total cadmium cumulative load Arc grid-code varies Cumulative load values along each (97)coverage. Created by clipping the cadline stream are in units of grams per year.arc coverage with the mainland template. 1000 - 173,535 g/yr
cdpts Cleaned version of the cadpts coverage. Polygon Radius varies in increments of 400 between 0 and (113)Joined with data from the cd.dat data file. 800 meters.
station-id varies 5-digit water quality station numbercount varies between 0 - 4 (# of measurements)
ave-value varies between 0 - 5 ug/Lchilarea Grid of subwatershed delineated from the Grid none integer 32,233 cells (70)
Chiltipin Creek USGS gauge (drainpt5)using the clipfdr flow direction grid.
chilcov Equivalent polygon coverage of the Polygon none (70)chilarea grid. Created using the gridpolycommand.
chilrain Precipitation grid specific to the Grid Precip- varies Precipitation values in each grid-cell (81)subwatershed delineated from the depth are in units of millimeters/year.Chiltipin Creek USGS gauge. 811 - 877 mm/year.

170
Data Feature Class Attribute Value Description Page #
clipfdr Flow direction grid with ditfdr values Grid direction same as for the sanfdr grid. 69assigned to mainland cells and NODATAvalues assigned to bays and islands.
colugrid Equivalent 100-meter cellsize grid of the Grid land use varies between the lusecat 12 values specifed (126)copalu coverage. Created using polygrid for the sanluse coverage.with the lusecat attribute specified for grid-cell values.
copacov Equivalent polygon coverage of the Polygon none (70)coparea grid. Created using the gridpolycommand.
copalu Land Use coverage specific to the Polygon lusecat same as lusecat for sanlu coverage. (126)subwatershed delineated from theCopano Creek SWQM gauge # 13660(USGS flow gauge). Created by clipping thesanlu coverage with copacov.
coparain Precipitation grid specific to the Grid Precip- varies Precipitation values in each grid-cell (81)subwatershed delineated from the depth are in units of millimeters/year.Copano Creek USGS gauge. 893 - 938 mm/year.
coparea Grid of subwatershed delineated from the Grid none integer 20,782 cells (70)Copano Creek USGS gauge (drainpt3)using the clipfdr flow direction grid.
corpdeme Initial grid created from Corpus Christi Grid elevation varies elevation values in each grid-cell are 41East 3" Digital Elevation Model mapsheet. in units of meters above sea level.Projected in Geographic coordinates.
corpdemw Initial grid created from Corpus Christi Grid elevation varies elevation values in each grid-cell are 41West 3" Digital Elevation Model mapsheet. in units of meters above sea level.Projected in Geographic coordinates.
corunoff Grid of cumulative runoff from each land Grid runoff varies Cumulative runoff values in each grid- (126)use specified in the colugrid grid. Created volume cell are in units of cubic meters / year.using the zonalsum command, summing 196,200 - 21,440,430 cub. meters/yr.values from the runoff grid based onzonal regions specified in colugrid.

171
Data Feature Class Attribute Value Description Page #
covsheds Cleaned version of the subsheds Polygon none 76coverage.
covstr Equivalent line coverage of the str1 grid. Arc none 63Created using the Gridline command.
covstr1 Equivalent line coverage of the ditstr1 grid. Arc none 70Created using the Gridline command.
covtrim Cleaned version of the trimshed coverage. Polygon none 76ditacc8 Grid of accumulation zones in the region. Grid zone # same as for the ditlnk8 grid 75
Created using the zonlamax command withthe ditfac and ditlnk8 grids. Assigns thevalues of each ditlnk8 reach to all cells inthe associated accumulation zones.
ditfac Flow accumulation grid created from the Grid accumu- varies integer number of cells that fall 69clipfdr flow direction grid. lation upstream of each cell.
ditfdr Flow direction grid built from the "burned Grid direction same as for the sanfdr grid. 69in" bayfil DEM.
ditfil Processed Digital Elevation Model with all Grid elevation varies elevation values in each grid-cell are 69"pits" of the ditstrm DEM filled to the level in units of meters above sea level.of the lowest elevation neighboring cell.
ditlnk8 Grid of stream reaches in the San Antonio- Grid reach # varies 75Nueces basin region, created using thestreamlink command with the clipfdr andditstr8 grids.
ditout8 Grid of outlet cells for each accumulation Grid outlet same as for the ditlnk8 grid 75zone in the region. Created using the Con cell #statement with the ditacc8, ditlnk8, andditfac grids.

172
Data Feature Class Attribute Value Description Page #
ditshd8 Grid of subwatersheds in the San Antonio- Grid water- same as for the ditlnk8 grid 75Nueces region. Based on the selection of shed #8000 cells for the ditstr8 grid, each of thesesubwatersheds are at least 80 sq km inarea. Created using the watershedcommand with the clipfdr and ditout8 grids.
ditstr1 Grid of flow accumulation cells with value Grid accumu- varies from 1000 to the maximum value of 70greater than a threshold of 1000. Results lation the ditfac gridin strings of cells that represent the largerstreams in the basin.
ditstr8 Grid of flow accumulation cells with value Grid accumu- varies from 8000 to the maximum value of 75greater than a threshold of 8000. Results lation the ditfac gridin strings of cells that represent the largeststreams in the basin.
ditstrm "Burned-In" Digital Elevation Model created Grid elevation varies elevation values in each grid-cell are 69by artificially raising the elevations of all in units of meters above sea level.off-stream cells in the strmgrid grid by 5meters and specifying in-stream grid cellswith a zero elevation value.
drainpt1 Single cell grid identifying the location of Grid none 70the USGS Aransas River stream gauge.All other cells have values of NODATA.
drainpt2 Single cell grid identifying the location of Grid none (70)the USGS Mission River stream gauge.All other cells have values of NODATA.
drainpt3 Single cell grid identifying the location of Grid none (70)the USGS Copano Creek stream gauge.All other cells have values of NODATA.
drainpt4 Single cell grid identifying the location of Grid none (70)the USGS Medio Creek stream gauge.All other cells have values of NODATA.

173
Data Feature Class Attribute Value Description Page #
drainpt5 Single cell grid identifying the location of Grid none (70)the USGS Chiltipin Creek stream gauge.All other cells have values of NODATA.
fec_col.dat Arc/Info data file of fecal coliform INFO station-id varies 5-digit water quality station number (104)water quality measurements. Created from count varies between 0 - 17 (# of measurements)fec_col.dbf using the dbaseinfo command. ave-value varies between 0 - 462 colonies / 100 mL
fec_col.dbf Database file of fecal coliform DBF station-id varies 5-digit water quality station number (104)water quality measurements. Created count varies between 0 - 17 (# of measurements)from the TNRCC SWQM database using ave-value varies between 0 - 462 colonies / 100 mLArcView Summary Statistics tools.
fecalpts Polygon coverage of circles associated Polygon Radius varies in increments of 300 between 0 and (113)with each fecal coliform TNRCC 1200 meters.SWQM location. Radius of each circle isdefined as a function of the square root ofthe number of fec_col measurements atthe location. Created using the generatecommand with the fecrad.dat data file.
feccon Final nonpoint fecal coliform Arc grid-code varies Concentration values along each (102)concentration coverage. Created by stream are in units of colonies perclipping the feclin arc coverage with the 100 mL.mainland template. 0 - 8996 colonies / 100 mL
fecconc Grid of predicted fecal coliform Grid Concen- varies Concentration values in each grid-cell (102)concentrations due to nonpoint sources. tration are in units of colonies per 100 mL.Created by dividing the cumulative fecal 0 - 8996 colonies/100 mLcoliform load grid (feclload) by the annualcumulative runoff grid (runoffac).
fecld Cummulative annual fecal coliform load Grid Load varies Cumulative load values in each grid (96)grid created by performing a weighted flow cell are in units of trillion colonies/year.accumulation on the mainfdr grid, using the 0 - 1469.786 trillion colonies/yearfeclrnof grid as the weight grid.
feclgrid Initial 100-meter cellsize grid of fecal Grid Fecal 0 Agricul/Barren/Water/Wetland EMC (95)coliform EMC values. Created by Coliform 20,000 Urban Residential EMC

174
Data Feature Class Attribute Value Description Page #
converting the sanlu coverage (with the EMC 6,900 Urban Commercial EMCfcol attribute specified) to a grid using (colonies 9,700 Urban Industrial EMCpolygrid. /100 mL) 53,000 Urban Transportation EMC
22,400 Mixed/Other Urban EMC200 Range/Forest Land EMC
feclin Equivalent line coverage of the feconstr Arc grid-code varies Concentration values along each (102)grid. Grid-code integer concentration stream are in units of colonies pervalues retained in the line coverage 100 mL.through use of the streamline command. 0 - 8996 colonies/100 mL
fecline Equivalent line coverage of the feclload Arc grid-code varies Cumulative load values along each (97)grid. In-stream loads isolated through stream are in units of trillion coloniesselection of a load threshold value = 100 per year.trillion colonies. Grid-code integer load 100 - 1469 trillion colonies/yr.values retained in the line coverage thruuse of the streamline command.
feclload Equivalent integer grid of the fecld grid. Grid Load varies Cumulative load values in each grid (97)cell are in units of trillion colonies/year.0 - 1469 trillion colonies/yr
fecload Final fecal coliform cumulative load Arc grid-code varies Cumulative load values along each (97)coverage. Created by clipping the fecline stream are in units of trillion coloniesarc coverage with the mainland template. per year.
100 - 1469 trillion colonies/yr.feclrnof Cell-based fecal coliform loading grid Grid Load varies Cell-based load values in each grid (95)
created by taking the product of the runoff cell are in units of col-mm/100 mL-year.and feclgrid grids. 0 - 10,413,663 colony-mm/100 mL-yr.
feconstr Grid of predicted nonpoint fecal coliform Grid Concen- varies Concentration values in each grid-cell (102)concentrations occuring in the stream tration are in units of colonies per 100 mL.network of the basin. Created using the 0 - 8996 colonies/100 mLCon statement with the introfac andfecconc grids.
fecpts Cleaned version of the fecalpts coverage. Polygon Radius varies in increments of 300 between 0 and (113)Joined with data from the fec_col.dat data 1200 meters.

175
Data Feature Class Attribute Value Description Page #
file. station-id varies 5-digit water quality station numbercount varies between 0 - 17 (# of measurements)
ave-value varies between 0 - 462 colonies / 100 mLfecrad.dat Arc/Info data file created from the sanwq INFO sanwq-id varies 5-digit water quality station number (113)
point attribute table by defining a sanwq X-coord varies TSMS Albers x-coordinate of stationRadius field as a function of the fec_cnt Y-coord varies TSMS Albers y-coordinate of stationfield, and then using the ArcView File Radius varies in increments of 300 between 0 andExport feature to create a text-delimited 1200 meters.data file.
geobuff Equivalent of hucbuff coverage reprojected Polygon inside 0 outside of buffer boundary 53to Geographic coordinates. 1 insider buffer boundary
goli5 15-minute Goliad Digital Line Arc none (37)Graph map #5 w/ meridians and parallelsremoved. UTM projection.
goli6 15-minute Goliad Digital Line Arc none (37)Graph map #6 w/ meridians and parallelsremoved. UTM projection.
goli7 15-minute Goliad Digital Line Arc none (37)Graph map #7 w/ meridians and parallelsremoved. UTM projection.
goli8 15-minute Goliad Digital Line Arc none (37)Graph map #8 w/ meridians and parallelsremoved. UTM projection.
golif05 Original Arc/Info coverage converted from Arc none (37)15-minute Goliad Digital Line Graph map#5. UTM projection.
golif06 Original Arc/Info coverage converted from Arc none (37)15-minute Goliad Digital Line Graph map#6. UTM projection.
golif07 Original Arc/Info coverage converted from Arc none (37)15-minute Goliad Digital Line Graph map#7. UTM projection.

176
Data Feature Class Attribute Value Description Page #
golif08 Original Arc/Info coverage converted from Arc none (37)15-minute Goliad Digital Line Graph map#8. UTM projection.
huc250 Original 1:250,000-scale HUC coverage of Polygon huc varies 8-digit Hydrologic Unit Code identifies 32the U.S. imported from a .e00 file. water resources region, subregion,Standard Albers projection. accounting unit, and cataloging unit.
hucbuff 5 kilometer buffer around the sanhucs Polygon inside 0 outside of buffer boundary 41coverage. Used as a coarse template to 1 insider buffer boundaryclip other coverages or trim grids.
hucs Intermediate coverage of the 5 HUCs Polygon huc 12100404 West San Antonio Bay HUC 32representing the San Antonio-Nueces 12100405 Aransas Bay HUCBasin. Standard Albers projection. 12100406 Mission HUC
12100407 Aransas HUC12110201 North Corpus Christi Bay HUC
hucsan Intermediate reprojected coverage of the Polygon huc same as huc for the hucs coverage 325 San Antonio-Nueces HUCs
introfac Equivalent integer grid of cumulative runoff Grid Runoff varies Cumulative runoff values in each grid- 100in units of cubic feet per second. Flow cell are in units of cubic feet/second.
0 - 324 cfslanduse Appended land use map of the Beeville Polygon landuse- 0 Unknown 44
and Corpus Christi mapsheets. id 11 ResidentialAnderson Land Use Classification is used 12 Commercial Servicesto distinguish between land use types. 13 IndustrialStandard Albers projection. 14 Transportation, Comunications
15 Industrial and Commercial16 Mixed Urban or Built-Up Land17 Other Urban or Built-Up Land21 Cropland and Pasture22 Orchards, Groves, Vineyards, Nursery23 Confined Feeding Operations31 Herbaceous Rangeland32 Shrub and Brush Rangeland

177
Data Feature Class Attribute Value Description Page #
33 Mixed Rangeland41 Deciduous Forest Land42 Evergreen Forest Land43 MIxed Forest Land51 Streams and Canals52 Lakes53 Reservoirs54 Bays and Estuaries61 Forested Wetlands62 Nonforested Wetlands71 Dry Salt Flats72 Beaches73 Sandy Areas Other Than Beaches74 Bare Exposed Rock75 Strip Mines, Quarries, Gravel Pits76 Transitional Areas77 Mixed Barren Land
200000 Unknownlanuse Reprojected version of the appended land Polygon lanuse-id same as landuse-id for landuse coverage 44
use coverage. Includes the full Beevilleand Corpus Christi mapsheets.
lbe28096 Initial land use coverage of the Beeville Polygon none 441:250,000-scale mapsheet imported fromuncompressed .e00 file. Standard Albersprojection.
lco27096 Initial land use coverage of the Corpus Polygon none (44)Christi 1:250,000-scale mapsheetimported from uncompressed .e00 file.Standard Albers projection.
lonlat.dat Raw data file of longitude and latitude data, Text longitude varies between -97.1122 and -97.6564 47in decimal degrees, used to build the latitude varies betweeen 28.0467 and 28.4828stations coverage.

178
Data Feature Class Attribute Value Description Page #
luse Dissolved (no boundary lines) land use Polygon luse-id same as landuse-id for landuse coverage 44coverage with Anderson classification.
m2lugrid Equivalent 100-meter cellsize grid of the Grid land use varies between the lusecat 12 values specifed (126)mis2lu coverage. Created using polygrid for the sanluse coverage.with the lusecat attribute specified for grid-cell values.
m2runoff Grid of cumulative runoff from each land Grid runoff varies Cumulative runoff values in each grid- (126)use specified in the m2lugrid grid. Created volume cell are in units of cubic meters / year.using the zonalsum command, summing 31,260 - 109,195,880 cub. meters/yr.values from the runoff grid based onzonal regions specified in m2lugrid.
main Polygon coverage of the mainland basin Polygon none 96region buffered by one cell width (100meters). Created by buffering the coveragecalled mainland
mainfdr Flow direction grid created by storing ditfdr Grid direction same as for the sanfdr grid. 96values into the cells of the maingrid gridand storing values of NODATA elsewhere.This grid was created in order to correctfor an anomaly with the use of thestreamline command, so that arccoverages converted from string gridswould extend for the full intended length.
maingrid Equivalent 100-meter cellsize grid of the Grid none 96main coverage, created using the polygridcommand.
mainland Polygon coverage of the mainland basin Polygon none 96region reselected from the baycovcoverage.
mediarea Grid of subwatershed delineated from the Grid none integer 52,708 cells (70)Medio Creek USGS gauge (drainpt4)using the clipfdr flow direction grid.
179
Data Feature Class Attribute Value Description Page #
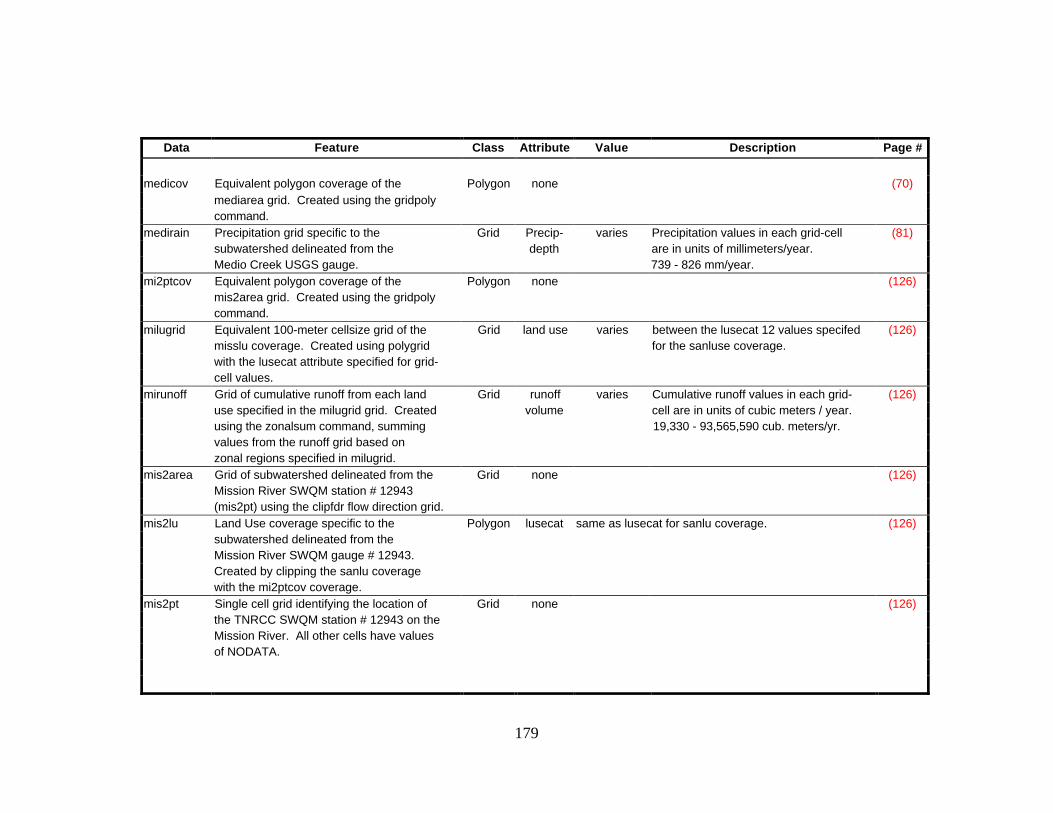
medicov Equivalent polygon coverage of the Polygon none (70)mediarea grid. Created using the gridpolycommand.
medirain Precipitation grid specific to the Grid Precip- varies Precipitation values in each grid-cell (81)subwatershed delineated from the depth are in units of millimeters/year.Medio Creek USGS gauge. 739 - 826 mm/year.
mi2ptcov Equivalent polygon coverage of the Polygon none (126)mis2area grid. Created using the gridpolycommand.
milugrid Equivalent 100-meter cellsize grid of the Grid land use varies between the lusecat 12 values specifed (126)misslu coverage. Created using polygrid for the sanluse coverage.with the lusecat attribute specified for grid-cell values.
mirunoff Grid of cumulative runoff from each land Grid runoff varies Cumulative runoff values in each grid- (126)use specified in the milugrid grid. Created volume cell are in units of cubic meters / year.using the zonalsum command, summing 19,330 - 93,565,590 cub. meters/yr.values from the runoff grid based onzonal regions specified in milugrid.
mis2area Grid of subwatershed delineated from the Grid none (126)Mission River SWQM station # 12943(mis2pt) using the clipfdr flow direction grid.
mis2lu Land Use coverage specific to the Polygon lusecat same as lusecat for sanlu coverage. (126)subwatershed delineated from theMission River SWQM gauge # 12943.Created by clipping the sanlu coveragewith the mi2ptcov coverage.
mis2pt Single cell grid identifying the location of Grid none (126)the TNRCC SWQM station # 12943 on theMission River. All other cells have valuesof NODATA.

180
Data Feature Class Attribute Value Description Page #
missarea Grid of subwatershed delineated from the Grid none integer 176,619 cells (70)Mission Creek USGS gauge (drainpt2)using the clipfdr flow direction grid.
misscov Equivalent polygon coverage of the Polygon none (70)missarea grid. Created using gridpoly.
misslu Land Use coverage specific to the Polygon lusecat same as lusecat for sanlu coverage. (126)subwatershed delineated from theMission River SWQM gauge # 12944(USGS flow gauge). Created by clipping thesanlu coverage with misscov.
missrain Precipitation grid specific to the Grid Precip- varies Precipitation values in each grid-cell (81)subwatershed delineated from the depth are in units of millimeters/year.Mission River USGS gauge. 739 - 945 mm/year.
niconstr Grid of predicted nonpoint nitrogen Grid Concen- varies Concentration values in each grid-cell (102)concentrations occuring in the stream tration are in units of milligrams/Liter.network of the basin. Created using the 0 - 4.4 mg/LCon statement with the introfac andnitconc grids.
nitconc Grid of predicted nitrogen concentrations Grid Concen- varies Concentration values in each grid-cell (102)due to nonpoint sources. Created by tration are in units of milligrams/Liter.dividing the cumulative nitrogen load grid 0 - 4.4 mg/L(nitload) by the annual cumulative runoffgrid (runoffac).
nitgrid Initial 100-meter cellsize grid of total Grid Nitrogen 0 Water/Wetland EMC (95)nitrogen EMC values. Created by EMC 1.82 Urban Residential EMCconverting the sanlu coverage (with the tn (mg/L) 1.34 Urban Commercial EMCattribute specified) to a grid using polygrid. 1.26 Urban Industrial EMC
1.86 Urban Transportation EMC1.57 Mixed/Other Urban EMC4.4 Agriculture EMC0.7 Range/Forest Land EMC1.5 Barren Lands EMC

181
Data Feature Class Attribute Value Description Page #
nitld Cummulative annual nitrogen load grid Grid Load varies Cumulative load values in each grid (96)created by performing a weighted flow cell are in units of kg/year.accumulation on the mainfdr grid, using the 369,122.406 kg/yrnitrunof grid as the weight grid.
nitline Equivalent line coverage of the nitload Arc grid-code varies Cumulative load values along each (97)grid. In-stream loads isolated through stream are in units of kg/year.selection of a load threshold value = 1000 1000 - 369,122 kg/yrkg. Grid-code integer load values retainedin the line coverage through use of thestreamline command.
nitload Equivalent integer grid of the nitld grid. Grid Load varies Cumulative load values in each grid (97)cell are in units of kg/year.0 - 369,122 kg/yr
nitpts Cleaned version of the nitropts coverage. Polygon Radius varies in increments of 200 between 0 and (113)Joined with data from the sanwq.pat data 1000 meters.file. station-id same as for sanwq coverage
tn_cnt same as for sanwq coveragetn_avg same as for sanwq coverage
nitrad.dat Arc/Info data file created from the sanwq INFO sanwq-id varies 5-digit water quality station number (113)point attribute table by defining a sanwq X-coord varies TSMS Albers x-coordinate of stationRadius field as a function of the tn_cnt Y-coord varies TSMS Albers y-coordinate of stationfield, and then using the ArcView File Radius varies in increments of 200 between 0 andExport feature to create a text-delimited 1000 meters.data file.
nitropts Polygon coverage of circles associated Polygon Radius varies in increments of 200 between 0 and (113)with each total nitrogen TNRCC 1000 meters.SWQM location. Radius of each circle isdefined as a function of the square root ofthe number of measurements at thelocation. Created using the generatecommand with the nitrad.dat data file.

182
Data Feature Class Attribute Value Description Page #
nitrunof Cell-based total nitrogen loading grid Grid Load varies Cell-based load values in each grid (95)created by taking the product of the runoff cell are in units of mg-mm/L-year.and nitgrid grids. 0 - 1031.3 mg-mm/L-yr.
no2.dat Arc/Info data file of nitrite nitrogen INFO station-id varies 5-digit water quality station number (104)water quality measurements. Created from count varies between 0 - 19 (# of measurements)no2.dbf using the dbaseinfo command. ave-value varies between 0 - 0.92 mg/L
no2.dbf Database file of nitrite nitrogen DBF station-id varies 5-digit water quality station number (104)water quality measurements. Created count varies between 0 - 19 (# of measurements)from the TNRCC SWQM database using ave-value varies between 0 - 0.92 mg/LArcView Summary Statistics tools.
no3.dat Arc/Info data file of nitrate nitrogen INFO station-id varies 5-digit water quality station number (104)water quality measurements. Created from count varies between 0 - 39 (# of measurements)no3.dbf using the dbaseinfo command. ave-value varies between 0 - 6.57 mg/L
no3.dbf Database file of nitrate nitrogen DBF station-id varies 5-digit water quality station number (104)water quality measurements. Created count varies between 0 - 39 (# of measurements)from the TNRCC SWQM database using ave-value varies between 0 - 6.57 mg/LArcView Summary Statistics tools.
p_ann Original grid of annual precipitation for the Grid Precip- varies Precipitation values in each grid-cell 52U.S. Converted from the ASCII file depth are in units of millimeters/year.prism_us.ann. Geographic coordinates.
p_ann2 Precipitation grid for the San Antonio- Grid Precip- varies Precipitation values in each grid-cell 53Nueces basin region. Mapextent reduced depth are in units of millimeters/year.from p_ann. Geographic coordinates. 733 - 1010 mm/year.
phcon Final nonpoint phosphorus concentration Arc grid-code varies Concentration values along each 102coverage. Created by clipping the phline stream are in units of mg/L x 1000.arc coverage with the mainland template. 0 - 1299
phconstr Grid of predicted nonpoint phosphorus Grid Concen- varies Concentration values in each grid-cell 102concentrations occuring in the stream tration are in units of milligrams/Liter.network of the basin. Created using the 0 - 1.3 mg/LCon statement with the introfac andphosconc grids.
183
Data Feature Class Attribute Value Description Page #
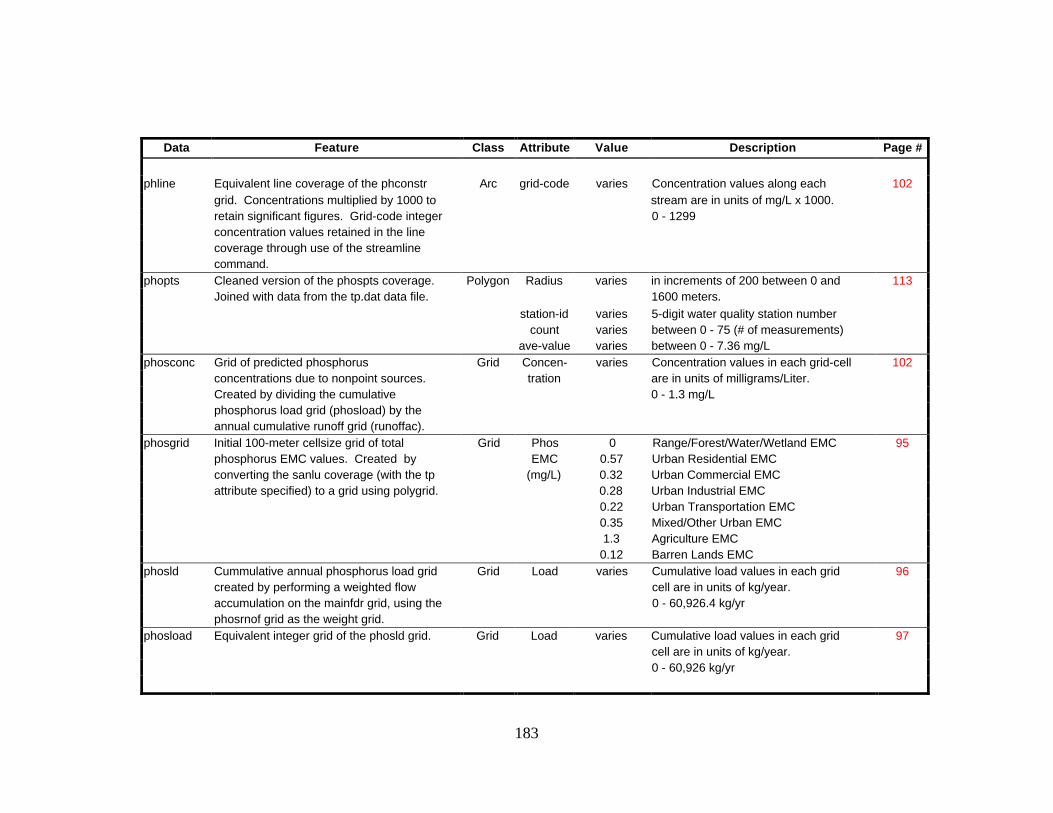
phline Equivalent line coverage of the phconstr Arc grid-code varies Concentration values along each 102grid. Concentrations multiplied by 1000 to stream are in units of mg/L x 1000.retain significant figures. Grid-code integer 0 - 1299concentration values retained in the linecoverage through use of the streamlinecommand.
phopts Cleaned version of the phospts coverage. Polygon Radius varies in increments of 200 between 0 and 113Joined with data from the tp.dat data file. 1600 meters.
station-id varies 5-digit water quality station numbercount varies between 0 - 75 (# of measurements)
ave-value varies between 0 - 7.36 mg/Lphosconc Grid of predicted phosphorus Grid Concen- varies Concentration values in each grid-cell 102
concentrations due to nonpoint sources. tration are in units of milligrams/Liter.Created by dividing the cumulative 0 - 1.3 mg/Lphosphorus load grid (phosload) by theannual cumulative runoff grid (runoffac).
phosgrid Initial 100-meter cellsize grid of total Grid Phos 0 Range/Forest/Water/Wetland EMC 95phosphorus EMC values. Created by EMC 0.57 Urban Residential EMCconverting the sanlu coverage (with the tp (mg/L) 0.32 Urban Commercial EMCattribute specified) to a grid using polygrid. 0.28 Urban Industrial EMC
0.22 Urban Transportation EMC0.35 Mixed/Other Urban EMC1.3 Agriculture EMC0.12 Barren Lands EMC
phosld Cummulative annual phosphorus load grid Grid Load varies Cumulative load values in each grid 96created by performing a weighted flow cell are in units of kg/year.accumulation on the mainfdr grid, using the 0 - 60,926.4 kg/yrphosrnof grid as the weight grid.
phosload Equivalent integer grid of the phosld grid. Grid Load varies Cumulative load values in each grid 97cell are in units of kg/year.0 - 60,926 kg/yr

184
Data Feature Class Attribute Value Description Page #
phospts Polygon coverage of circles associated Polygon Radius varies in increments of 200 between 0 and 113with each total phosphorus TNRCC 1600 meters.SWQM location. Radius of each circle isdefined as a function of the square root ofthe number of measurements at thelocation. Created using the generatecommand with the rad.dat data file.
phosrnof Cell-based total phosphorus loading grid Grid Load varies Cell-based load values in each grid 95created by taking the product of the runoff cell are in units of mg-mm/L-year.and phosgrid grids. 0 - 304.7 mg-mm/L-yr.
rad.dat Arc/Info data file created from the sanwq INFO sanwq-id varies 5-digit water quality station number 113point attribute table by defining a sanwq X-coord varies TSMS Albers x-coordinate of stationRadius field as a function of the tp_cnt Y-coord varies TSMS Albers y-coordinate of stationfield, and then using the ArcView File Radius varies in increments of 200 between 0 andExport feature to create a text-delimited 1600 meters.data file.
rainbfcv Equivalent coverage of the rainbuff grid. Polygon grid-code varies Precipitation values in each polygon 53Converted using the Gridpoly command. are in units of millimeters/year.
733 - 1010 mm/year.rainbuff Final reprojected precipitaton grid. Grid Precip- varies Precipitation values in each grid-cell 53
Converted from the p_ann2 grid. depth are in units of millimeters/year.733 - 1010 mm/year.
rofaccfs Equivalent runoff grid in units of cubic feet Grid Runoff varies Typical runoff values in each grid- 100per second. Converted from the runoffac Flow cell are in units of cubic feet/second.grid. 0 - 324.757 cfs
rofaccov Final typical streamflow coverage, created Arc grid-code varies Typical flow values along each 100by clipping the rofaclin arc coverage with stream are in units of cubic feet / sec.the mainland template. 1 - 324 cfs.
rofaclin Equivalent line coverage of the introfac Arc grid-code varies Typical flow values along each 100grid. In-stream flows isolated through stream are in units of cubic feet / sec.selection of a flow threshold value = 1 cfs. 1 - 324 cfs.Grid-code integer flow values retained

185
Data Feature Class Attribute Value Description Page #
in the line coverage through use of thestreamline command.
runoff Final runoff grid created by zero-filling the Grid Runoff varies Runoff values in each grid-cell are in 88NODATA grid cells from runoffeq. depth units of millimeters/year.Created using the isnull command. 0 - 248 mm/yr
runoffac Cumulative annual runoff grid. Created by Grid Runoff varies Cumulative runoff values in each grid- 100performing a weighted flow accumulation volume cell are in units of cubic meters/year.on the mainfdr grid, using runoff as the 0 - 290,430,464 cubic meters/yearweight grid.
runoffcv Equivalent polygon coverage of the runoff Polygon Runoff varies Runoff values in each polygon are in 88grid. Converted using the Gridpoly and depth units of millimeters/year.int commands. 0 - 248 mm/yr
runoffeq Original grid of cell-based runoff values Grid Runoff varies Runoff values in each grid-cell are in 88created by applying the rainfall/runoff depth units of millimeters/year.mathematical relationship to the sanpyr 0 - 248 mm/yrprecipitation grid.
sabay1 15-minute San Antonio Bay Digital Line Arc none (37)Graph map #1 w/ meridians and parallelsremoved. UTM projection.
sabay5 15-minute San Antonio Bay Digital Line Arc none (37)Graph map #5 w/ meridians and parallelsremoved. UTM projection.
sabayf01 Original Arc/Info coverage converted from Arc none (37)15-minute San Antonio Bay Digital LineGraph map #1. UTM projection.
sabayf05 Original Arc/Info coverage converted from Arc none (37)15-minute San Antonio Bay Digital LineGraph map #5. UTM projection.
sanbasin Cleaned version of the basin polygon Polygon none 79coverage. Includes all San Antonio-Nueces subwatersheds plus 3 borderingsubwatersheds from trimshed.

186
Data Feature Class Attribute Value Description Page #
sanbord Final coverage of the San Antonio-Nueces Polygon none 79border, created by reselecting only theoutside polygon from the border coverage.
sanfac Initial Flow Accumulation grid for the basin Grid accumu- varies integer number of cells that fall 63built from the sanfdr grid. Identifies the lation upstream of each cell.total number of cells draining to eachcell in the grid.
sanfdr Initial Flow Direction Grid for the basin Grid direction 1 East 63built from the sanfil grid identifying the 2 Southeastpredominant direction of the flow of runoff 4 Southfrom each grid cell. 8 Southwest
16 West32 Northwest64 North128 Northeast
sanfil Processed Digital Elevation Model with all Grid elevation varies elevation values in each grid-cell are 63"pits" filled to the level of the lowest in units of meters above sea level.elevation neighboring grid cell.
sangages Final reprojected version of the USGS Point stat-num same as for the stations coverage 49Stream gauge point coverage. stat-nam same as for the stations coverage
sanhucs Final cleaned and reprojected coverage of Polygon huc same as huc for the hucs coverage 32the 5 San Antonio-Nueces HUCs
sanhyd Final hydrography digital line graph Arc none 79coverage of the San Antonio-Nuecesbasin, created by clipping the sanhydrocoverage with sanbord.
sanhydro Reprojected coverage of the appended Arc none 38Digital Line Graph hydrography maps inthe region.
sanlu Final land use coverage of the San Polygon lusecat same as lusecat for sanluse coverage 79Antonio-Nueces basin, created by clipping tn 0 - 4.4 (mg/L) total nitrogen emcthe sanluse coverage with sanbord. tkn 0 - 1.7 (mg/L) total kjeldahl nitrogen emc

187
Data Feature Class Attribute Value Description Page #
nn 0 - 1.6 (mg/L) nitrate + nitrite emctp 0 - 1.3 (mg/L) total phosphorus emcdp 0 - 0.48 (mg/L) dissolved phosphorus emcss 0 - 107 (mg/L) total suspended solids emcds 0 - 1225 (mg/L) total dissolved solids emcpb 0 - 15 (ug/L) total lead emccu 0 - 15 (ug/L) total copper emczn 0 - 245 (ug/L) total zinc emccd 0 - 1.05 (ug/L) total cadmium emccr 0 - 10 (ug/L) total chromium emcni 0 - 11.8 (ug/L) total nickel emc
bod 0 - 25.5 (mg/L) biological oxygen demand emccod 0 - 116 (mg/L) chemical oxygen demand emco&g 0 - 9 (mg/L) oil & grease emcfcol 0 - 53,000 (col/100 mL) fecal coliform emcfstr 0 - 56,000 (col/100 mL) fecal streptococci emc
sanlus Reselected land use coverage to eliminate Polygon sanlus-id same as luse-id for luse coverage except no value 44the unknown category, which was seen to 200000 is includeddefine the Gulf of Mexico.
sanluse Redefined land use coverage, created by Polygon lusecat 0 Unknown 92dissolving boundaries between 11 Residentialsubcategory polygons for Agriulture, 12 Commercial ServicesRangeland, Forestland, Water, Wetland, 13 Industrialand Barren land use categories of the 14 Transportation, Comunicationssanlus coverage. 16 Mixed Urban or Built-Up Land
17 Other Urban or Built-Up Land20 Agriculture30 Rangeland40 Forest Land50 Water Bodies60 Wetlands70 Barren Land Uses

188
Data Feature Class Attribute Value Description Page #
sanpolys Cleaned polygon coverage of sanrivs4 arc Polygon none 67coverage. Performed to isolate the baynetwork & barrier islands in the coverage.
sanpyr Precipitation grid specific to the boundary Grid Precip- varies Precipitation values in each grid-cell 81of the San Antonio-Nueces border. depth are in units of millimeters/year.Created using the Con statement with the 739 - 985 mm/year.rainbuff and bordgrid grids.
sanrivs4 Final edited digital line graph coverage of Arc none 67hydrography in the San Antonio-Nuecesbasin. Created by using ArcEdit with thesanhydro coverage to eliminate lakes anddisappearing streams.
sanutm Appended coverage of 15-minute Digital Arc none 38Line Graph hydrography maps for the SanAntonio-Nueces region. UTM projection.
sanwq Final reprojected point coverage of TNRCC Point station-id varies character representation of sanwq-id 56SWQM stations. Appended with average tp_cnt varies # of total phosphorus measurementsconcentration values and # of samples between 0 - 75for a number of pollutant constituents tp_avg varies between 0 - 7.36 mg/L
tkn_cnt varies # of total kjeldahl nitrogen measmts.between 0 - 46
tkn_avg varies between 0 - 9.90 mg/Lno2_cnt varies # of total nitrate measurements
between 0 - 19no2_avg varies between 0 - 0.92 mg/Lno3_cnt varies # of total nitrite measurements
between 0 - 39no3_avg varies between 0 - 6.57 mg/Ltn_cnt varies "calculated" # of tot nitrogen measmts
= (tkn_cnt + no2_cnt + no3_cnt) / 3between 0 - 31

189
Data Feature Class Attribute Value Description Page #
tn_avg varies "calculated" tot nitrogen avg conc= tkn_avg + no2_avg + no3_avgbetween 0 - 15.51 mg/L
cd_cnt varies # of cadmium measurementsbetween 0 - 4
cd_avg varies between 0 - 5 ug/Lfec_cnt varies # of fecal coliform measurements
between 0 - 17fec_avg varies between 0 - 462 colonies / 100 mLX-coord varies TSMS Albers x-coordinate of stationY-coord varies TSMS Albers y-coordinate of station
shed8cov Equivalent polygon coverage of the Polygon none 75ditshd8 grid. Created using the gridpolycommand.
sndemalb Final Digital Elevation Model of the San Grid elevation varies elevation values in each grid-cell are 41Antonio-Nueces basin area. in units of meters above sea level.
snrainyr Final precipitation coverage of the San Polygon grid-code varies Precipitation values in each polygon 79Antonio-Nueces basin, created by clipping are in units of millimeters/year.the rainbfcv coverage with sanbord. 739 - 985 mm/year.
sqcov Equivalent coverage of the grid sqgrid. Polygon none 67Built in order to combine (union) with thebaybuff coverage.
sqgrid A single value grid spanning the extent Grid integer 1 67of the other study area grids, defined bythe sanfil grid.
stations Point coverage of USGS Stream Gauges Point stat-num 08189200 USGS stream gauge station 47built using the lonlat.dat data file. 08189300 identification number.Geographic Coordinates. 08189500
0818970008189800
stat-nam Copano Stream or Creek that gauge is locatedMedio on.
190
Data Feature Class Attribute Value Description Page #
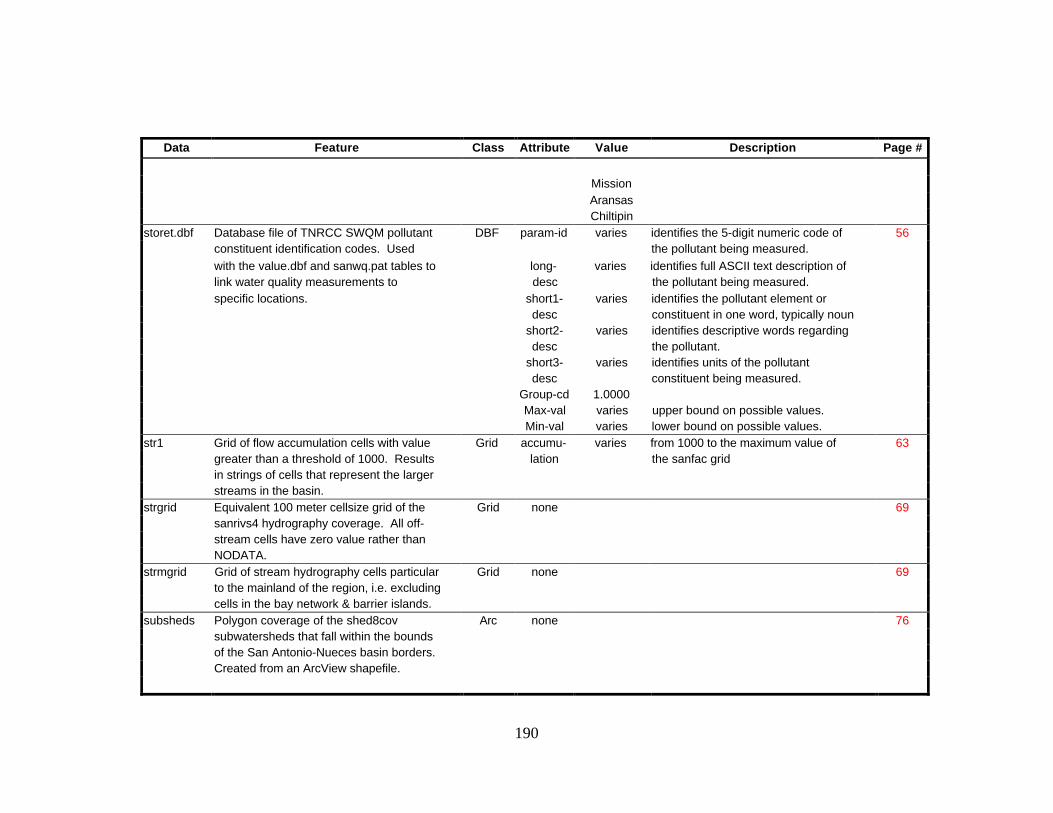
MissionAransasChiltipin
storet.dbf Database file of TNRCC SWQM pollutant DBF param-id varies identifies the 5-digit numeric code of 56constituent identification codes. Used the pollutant being measured.with the value.dbf and sanwq.pat tables to long- varies identifies full ASCII text description oflink water quality measurements to desc the pollutant being measured.specific locations. short1- varies identifies the pollutant element or
desc constituent in one word, typically nounshort2- varies identifies descriptive words regardingdesc the pollutant.
short3- varies identifies units of the pollutantdesc constituent being measured.
Group-cd 1.0000Max-val varies upper bound on possible values.Min-val varies lower bound on possible values.
str1 Grid of flow accumulation cells with value Grid accumu- varies from 1000 to the maximum value of 63greater than a threshold of 1000. Results lation the sanfac gridin strings of cells that represent the largerstreams in the basin.
strgrid Equivalent 100 meter cellsize grid of the Grid none 69sanrivs4 hydrography coverage. All off-stream cells have zero value rather thanNODATA.
strmgrid Grid of stream hydrography cells particular Grid none 69to the mainland of the region, i.e. excludingcells in the bay network & barrier islands.
subsheds Polygon coverage of the shed8cov Arc none 76subwatersheds that fall within the boundsof the San Antonio-Nueces basin borders.Created from an ArcView shapefile.

191
Data Feature Class Attribute Value Description Page #
tkn.dat Arc/Info data file of total kjeldahl nitrogen INFO station-id varies 5-digit water quality station number (104)water quality measurements. Created from count varies between 0 - 46 (# of measurements)tkn.dbf using the dbaseinfo command. ave-value varies between 0 - 9.9 mg/L
tkn.dbf Database file of total kjeldahl nitrogen DBF station-id varies 5-digit water quality station number (104)water quality measurements. Created count varies between 0 - 46 (# of measurements)from the TNRCC SWQM database using ave-value varies between 0 - 9.9 mg/LArcView Summary Statistics tools.
tncon Final nonpoint nitrogen concentration Arc grid-code varies Concentration values along each (102)coverage. Created by clipping the tnline stream are in units of mg/L x 1000.arc coverage with the mainland template. 0 - 4400
tnline Equivalent line coverage of the niconstr Arc grid-code varies Concentration values along each (102)grid. Concentrations multiplied by 1000 to stream are in units of mg/L x 1000.retain significant figures. Grid-code integer 0 - 4400concentration values retained in the linecoverage through use of the streamlinecommand.
tnload Final total nitrogen cumulative load Arc grid-code varies Cumulative load values along each (97)coverage. Created by clipping the nitline stream are in units of kg/year.arc coverage with the mainland template. 1000 - 369,122 kg/yr
tnrnof Cell-based nitrogen loading grid Grid Load varies Cell-based load values in each grid (121)created by adding the nonpoint source cell are in units of mg-mm/L-year.loading grid (nitrunof) and the Beeville 0 - 7,149,842.5 mg-mm/L-yr.point source loading grid (beenit).
tonitcon Final point + nonpoint nitrogen Arc grid-code varies Concentration values along each (121)concentration coverage. Created by stream are in units of mg/L x 1000.clipping the tonitlin arc coverage with the 0 - 15,509mainland template.
tonitlin Equivalent line coverage of the tonitstr Arc grid-code varies Concentration values along each (121)grid. Concentrations multiplied by 1000 to stream are in units of mg/L x 1000.retain significant figures. Grid-code integer 0 - 15,509concentration values retained in the linecoverage through use streamline.

192
Data Feature Class Attribute Value Description Page #
tonitstr New grid of predicted nonpoint & point Grid Concen- varies Concentration values in each grid-cell (121)nitrogen concentrations occuring in tration are in units of milligrams/Liter.the stream network of the basin. Created 0 - 15.51 mg/Lusing the Con statement with the introfacand totnconc grids.
tophocon Final point + nonpoint phosphorus Arc grid-code varies Concentration values along each 121concentration coverage. Created by stream are in units of mg/L x 1000.clipping the topholin arc coverage with the 0 - 6600mainland template.
topholin Equivalent line coverage of the tophostr Arc grid-code varies Concentration values along each 121grid. Concentrations multiplied by 1000 to stream are in units of mg/L x 1000.retain significant figures. Grid-code integer 0 - 6600concentration values retained in the linecoverage through use of the streamlinecommand.
tophostr New grid of predicted nonpoint & point Grid Concen- varies Concentration values in each grid-cell 121phosphorus concentrations occuring in tration are in units of milligrams/Liter.the stream network of the basin. Created 0 - 6.6 mg/Lusing the Con statement with the introfacand totpconc grids.
totnconc New grid of predicted nitrogen Grid Concen- varies Concentration values in each grid-cell (121)concentrations from both nonpoint and tration are in units of milligrams/Liter.point sources. Created by dividing the new 0 - 15.51 mg/Lnitrogen load grid (totnload) by theannual cumulative runoff grid (runoffac).
totnload New total nitrogen load grid created by Grid Load varies Cumulative load values in each grid (121)performing a weighted flow accumulation cell are in units of kg/year.on the mainfdr grid, using tnrnof as the 0 - 369,122.41 kg/yrweight grid.
totpconc New grid of predicted phosphorus Grid Concen- varies Concentration values in each grid-cell 121concentrations from both nonpoint and tration are in units of milligrams/Liter.point sources. Created by dividing the new 0 - 6.6 mg/L

193
Data Feature Class Attribute Value Description Page #
phosphorus load grid (totpload) by theannual cumulative runoff grid (runoffac).
totpload New total phosphorus load grid created by Grid Load varies Cumulative load values in each grid 121performing a weighted flow accumulation cell are in units of kg/year.on the mainfdr grid, using beernof as the 0 - 90,479.46 kg/yrweight grid.
tp.dat Arc/Info data file of total phosphorus INFO station-id varies 5-digit water quality station number 104water quality measurements. Created from count varies between 0 - 75 (# of measurements)tp.dbf using the dbaseinfo command. ave-value varies between 0 - 7.36 mg/L
tp.dbf Database file of total phosphorus water DBF station-id varies 5-digit water quality station number 104quality measurements. Created from the count varies between 0 - 75 (# of measurements)TNRCC SWQM database using ArcView ave-value varies between 0 - 7.36 mg/LSummary Statistics tools.
tpline Equivalent line coverage of the phosload Arc grid-code varies Cumulative load values along each 97grid. In-stream loads isolated through stream are in units of kg/year.selection of a load threshold value = 1000 1000 - 60,926 kg/yrkg. Grid-code integer load values retainedin the coverage through use of streamline.
tpload Final total phosphorus cumulative load Arc grid-code varies Cumulative load values along each 97coverage. Created by clipping the tpline stream are in units of kg/year.arc coverage with the mainland template. 1000 - 60,900 kg/yr
trimshed Polygon coverage of those shed8cov Arc none 76subwatersheds that, along with subshedsand baybuff, completely enclose theundelineated (near shore) portions of theSan Antonio-Nueces Coastal Basin.Created from an ArcView shapefile.
value.dbf Database file of TNRCC SWQM pollutant DBF station-id varies 5-digit water quality station number 56concentration measurement values. Used on-seg- 0with the storet.dbf and sanwq.pat tables to flg 1link water quality measurements to seg-id varies identifies the 4-digit TNRCC segmentspecific locations. where the sample was taken.

194
Data Feature Class Attribute Value Description Page #
enddate varies identifies last date of a series ofmeasurements
tag varies 7-character id with one letter and 6numerals
storet- varies identifies the 5-digit numeric code ofcode the pollutant being measured.gtlt < or > flag that is set when measurement is
below or above a threshold valuevalue varies the measured value of the pollutant
constituent.weighfac Weighted flow accumulation grid Grid potential varies from 0 - 2,244,562,432 cubic meters 80
representing potential runoff in the basin. runoff per yearCreated with the clipfdr and rainbuff grids.
wqsites Original point coverage of TNRCC SWQM Point none 56stations. Imported from the snwqsites.e00file. Projected in Albers withmeasurement units of feet specified.

195
Appendix B : Programs/AMLs

196
Attrib.aml
/* attrib.aml ------ to be run from the Arc prompt, this aml defines items for the/* attrib.dat data file and then fills them with raw expected mean concentration/* data from the emc3a.dat file./*tablesdefine attrib.dat/*lusecat /*Item Name: land use category8 /*Item Width: 88 /*Item Output Width: 8i /*Item Type: integer/*tn /*Item Name: total nitrogen5 /*Item Width: 55 /*Item Output Width: 5n /*Item Type: numeric2 /*Item Decimal Places: 2/*tkn /*Item Name: total kjeldahl nitrogen5 /*Item Width: 55 /*Item Output Width: 5n /*Item Type: numeric2 /*Item Decimal Places: 2/*nn /*Item Name: nitrate + nitrite (mg/L as N)5 /*Item Width: 55 /*Item Output Width: 5n /*Item Type: numeric2 /*Item Decimal Places: 2/*tp /*Item Name: total phosphorus5 /*Item Width: 55 /*Item Output Width: 5n /*Item Type: numeric2 /*Item Decimal Places: 2/*dp /*Item Name: dissolved phosphorus5 /*Item Width: 55 /*Item Output Width: 5n /*Item Type: numeric2 /*Item Decimal Places: 2/*

197
ss /*Item Name: suspended solids5 /*Item Width: 55 /*Item Output Width: 5n /*Item Type: numeric1 /*Item Decimal Places: 1/*ds /*Item Name: dissolved solids4 /*Item Width: 44 /*Item Output Width: 4i /*Item Type: integer/*pb /*Item Name: total lead5 /*Item Width: 55 /*Item Output Width: 5n /*Item Type: numeric1 /*Item Decimal Places: 1/*cu /*Item Name: total copper5 /*Item Width: 55 /*Item Output Width: 5n /*Item Type: numeric1 /*Item Decimal Places: 1/*zn /*Item Name: total zinc5 /*Item Width: 55 /*Item Output Width: 5n /*Item Type: numeric1 /*Item Decimal Places: 1/*cd /*Item Name: total cadmium5 /*Item Width: 55 /*Item Output Width: 5n /*Item Type: numeric2 /*Item Decimal Places: 2/*cr /*Item Name: total chromium5 /*Item Width: 55 /*Item Output Width: 5n /*Item Type: numeric1 /*Item Decimal Places: 1/*ni /*Item Name: total nickel5 /*Item Width: 55 /*Item Output Width: 5n /*Item Type: numeric

198
1 /*Item Decimal Places: 1/*bod /*Item Name: biological oxygen demand5 /*Item Width: 55 /*Item Output Width: 5n /*Item Type: numeric1 /*Item Decimal Places: 1/*cod /*Item Name: chemical oxygen demand5 /*Item Width: 55 /*Item Output Width: 5n /*Item Type: numeric1 /*Item Decimal Places: 1/*o&g /*Item Name: oil & grease4 /*Item Width: 44 /*Item Output Width: 4n /*Item Type: numeric1 /*Item Decimal Places: 1/*fcol /*Item Name: fecal coliform7 /*Item Width: 77 /*Item Output Width: 7i /*Item Type: integer/*fstr /*Item Name: fecal streptococci7 /*Item Width: 77 /*Item Output Width: 7i /*Item Type: integer/*~ /*Item Name: <return>/*add from emc3a.datquit&return

199
Dlgmerge.aml
/* An ARC AML FOR PREPARING DLG DATA FOR REGIONAL ANALYSIS/*/* prepared by Bill Saunders, University of Texas at Austin/* Center for Research in Water Resources/* GIS in Water Resources Research group/*/* AML NAME: dlgmerge.aml (run from the "Arc" prompt)/* FUNCTION: Prepares selected DLG data for analysis with respect to a/* particular hydrologic or political region./* INPUTS:/* -all compressed ("zipped") DLG files corresponding to the region of/* interest. These zipped files are downloaded from the USGS EROS Data/* Center at http://sun1.cr.usgs.gov/eros-home.html. Alternatively the/* DLG files can be accessed from US Geodata 1:100,000-Scale DLG Data/* Compact Disc (USGS, 1993)./* -a projection file that will allow for conversion from utm map/* coordinates to whatever projection is desired./* -a polygon coverage delineating the boundary of the hydrologic or/* political region of interest./*/********************************************************************/* BEGIN AML EXECUTION/*/* Assuming that zipped DLG files have been downloaded from CD-ROM (in this/* case, 5 hydro files using the following commands):/*/* cp /cdrom/100k_dlg/beeville/be3hydro.zip .//* cp /cdrom/100k_dlg/goliad/be1hydro.zip .//* cp /cdrom/100k_dlg/allyns_b/cc2hydro.zip .//* cp /cdrom/100k_dlg/corpus_c/cc1hydro.zip .//* cp /cdrom/100k_dlg/sananbay/be4hydro.zip .//*/*/* The first set of commands below MUST ALWAYS BE CHANGED by the user of the/* AML. Store the number of zipped DLG files into the variable dlgnum./* Then, for each zipped DLG file, define sequential variables called dlg# as/* the first 3 characters of each of the zipped files./* Store the name of your projection file (in this case, utmtsms.prj) into/* the variable prjfname./* Store the name of your hydrologic or political boundary coverage (in this/* case, sanbord) into the variable border./* Finally, specify the type of files that you are using -- the only valid

200
/* entries for this variable (filetype) are hydro, roads, rail, and mtran./*&sv dlgnum = 5&sv dlg1 = be1&sv dlg2 = be3&sv dlg3 = be4&sv dlg4 = cc1&sv dlg5 = cc2&sv prjfname = utmtsms.prj&sv border = sanbord&sv filetype = hydro/*/*&if %filetype% eq hydro &then &sv abbr = hy&if %filetype% eq roads &then &sv abbr = rd&if %filetype% eq rail &then &sv abbr = rr&if %filetype% eq mtran &then &sv abbr = mt/*/* This part of the AML unzips all of the compressed files to create 15-minute/* map files. Each 15-minute map file is first converted into an Arc/Info/* line coverage. Then, the borders of each of the 15-minute map files are/* trimmed away from the coverage so that those 15-minute meridians and/* parallels will not appear in the final appended coverage./*&sv count = 1&do &while %count% le %dlgnum% &sv filename = [value dlg%count%] &sv count = %count% + 1 &sys unzip %filename%%filetype%.zip &sv count2 = 1 &do &while %count2% le 8 &do &while [exists %filename%%abbr%f0%count2% -file] dlgarc optional %filename%%abbr%f0%count2% %filename%f0%count2% &sv x = [delete %filename%%abbr%f0%count2% -file] build %filename%f0%count2% line reselect %filename%f0%count2% %filename%0%count2% line # line res rpoly# > 1 ~ n y res lpoly# > 1

201
~ n n kill %filename%f0%count2% all &end &sv count2 = %count2% + 1 &end&end/*/* This part of the AML merges, or "appends", all of the 15-minute map file/* coverages together and then builds line topology for the resultant coverage,/* called "bigmap"./*append bigmap&sv count = 1&do &while %count% le %dlgnum% &sv filename = [value dlg%count%] &sv count = %count% + 1 &sv count2 = 1 &do &while %count2% le 8 &do &while [exists %filename%0%count2% -cover] %filename%0%count2% &sv count2 = %count2% + 1 &end &sv count2 = %count2% + 1 &end&end~yybuild bigmap line/*/* Once "bigmap" has been created, each of the coverages that were merged to/* build it are no longer necessary. This part of the AML kills off all of/* the intermediate level coverages used to append "bigmap"./*&sv count = 1&do &while %count% le %dlgnum% &sv filename = [value dlg%count%] &sv count = %count% + 1 &sv count2 = 1 &do &while %count2% le 8 &do &while [exists %filename%0%count2% -cover] kill %filename%0%count2% all &sv count2 = %count2% + 1
202
&end &sv count2 = %count2% + 1 &end&end/*/* The "bigmap" coverage is then reprojected to the desired map projection/* and coordinates. The projection file must be located in the same directory/* as the coverage being projected./*project cover bigmap bigprj %prjfname%/*/* Finally, a polgyon coverage of the hydrologic or political boundary of/* interest is used to "clip" out the hydrologic features specific to that/* region. The final coverage is called "dlgcov"./*clip bigprj %border% dlgcov linekill bigmap allkill bigprj all/*&return/******************************end of AML****************************

203
Montflow.f
program monthflow
character script*13integer month,day,year,mon,yr,yer(50)real dayflow,volmo,monthflo(12),yrflo(50),totflo,avganl
open (unit = 20, file = 'chiltip.dat',status = 'old')
c ** input data file -- CHANGE NAME for new run
open (unit = 30, file = 'chilvmon.dat',status = 'unknown')
c ** output data file -- CHANGE NAME for new run
c ** the following are initial values for month, monthly volume, andC ** counters. CHANGE VALUE of mon to the first month of your data set
mon = 7volmo = 0.0i = 1k = 1
10 read (20,15) month,day,year,dayflow
c ** Had to perform (awk '{print $1,$2}' aransas.gage > arans.dat)c ** because date and flow values were seperated by 1 tab and NOT 6c ** SPACES. My format statement originally had 6x for the spacesc ** between the year and dayflow. Resulted in values of 0.0 beingc ** read in for dayflow!!
15 format (i2,1x,i2,1x,i4,1x,f7.2)
c ** check for end-of-file
if (month .ne. 0) then
c ** when the month of the input data changes, write out the total cumc ** volume for the previous month (volmo) and save the value in a matrixc ** variable called monthflo(i)
if (month .ne. mon) thenwrite (30,16) mon,yr,volmo

204
16 format (i2,2x,i4,2x,f11.1)monthflo(i) = volmoi = i + 1
c ** when mon=12 (i.e. at the end of a year), reset the i counter to 1.c ** Also, if the i counter is in sequence with the mon counter, then ac ** full year's worth of data has been accumulated, so sum all of thec ** 12 values of monthflo and store them in a matrix variable calledc ** yrflo(k).
if (mon .eq. 12) thenif (i .eq. 13) then
yrflo(k) = 0do 17, j = 1,i-1yer(k) = yryrflo(k) = yrflo(k) + monthflo(j)
17 continuek = k + 1
endifi = 1
endif
c ** set mon = the value of month read in from the input table and definec ** the first monthly value of volmo as the measured flow value (cfs)c ** multiplied by 86400 sec/day and .028317 cub meters/cub ft. Thec ** resulting volume has units of cubic meters.
mon = monthvolmo = dayflow*.028317*86400goto 10
endif
c ** when mon = the value of month from the input table, incorporate thec ** new value of dayflow into the accumulating value of volmo.
volmo = volmo+dayflow*.028317*86400yr = yeargoto 10
endifwrite (30,*)
c ** once all monthly values of volume have been calculated, print out thec ** cumulative volumes for each FULL year (i.e. yrflo(l))
do 20, l = 1,k-1

205
write (30,18) yer(l),yrflo(l)18 format (i4,2x,f12.1)
totflo = totflo + yrflo(l)20 continue
c ** once all yearly values of volume have been calculated, average themc ** over the number of FULL years worth of data accumulated and establishc ** an averge annual value for stream volume.
avganl = totflo / (k-1)write (30,*)script = 'Avg Annual = 'write (30,21) script,avganl
21 format (a13,f12.1)write (*,*) 'Done'stopend

206
al72tsms.prj
/* This is a projection file to convert coverages from geographic coordinates (specified in/* decimal seconds with WGS72 datum) to the TSMS-Albers projection./*inputprojection geographicdatum WGS72units dsparameters/*outputprojection albersdatum WGS84units metersparameters27 25 0034 55 00-100 00 0031 10 001000000.01000000.0END

207
alb-tsms.prj
/* This is a projection file to convert coverages from the standard Albers projection to the/* TSMS-Albers projection./*inputprojection albersunits metersdatum NAD27spheroid CLARKE1866parameters29 30 0.00045 30 0.000-96 00 0.00023 00 0.0000.000000.00000/*outputprojection albersunits metersdatum NAD83spheroid GRS1980parameters27 25 0.00034 55 0.000-100 0 0.00031 10 0.0001000000.000001000000.00000end
208
geotsms.prj
/* This is a projection file to convert coverages from geographic coordinates (specified in/* decimal degrees with NAD83 datum) to the TSMS-Albers projection./*inputprojection geographicunits dddatum NAD83spheroid GRS1980parameters/*outputprojection albersunits metersdatum NAD83spheroid GRS1980parameters27 25 0034 55 00-100 00 0031 10 001000000.01000000.0END
209
tsmsgeo.prj
/* This is a projection file to convert coverages from the TSMS-Albers projection to/* geographic coordinates (specified in decimal degrees with NAD83 datum)./*inputprojection albersunits metersdatum NAD83spheroid GRS1980parameters27 25 0034 55 00-100 00 0031 10 001000000.01000000.0/*outputprojection geographicunits dddatum NAD83spheroid GRS1980parametersEND

210
utmtsms.prj
/* This is a projection file to convert coverages from the Universal Transverse Mercator/* projection (zone 14) to the TSMS-Albers projection./*inputprojection utmunits metersdatum NAD27spheroid Clarke1866zone 14parameters/*outputprojection albersunits metersdatum NAD83spheroid GRS1980parameters27 25 0034 55 00-100 00 0031 10 001000000.01000000.0END

211
wqtsms.prj
/* This is a projection file written to convert TNRCC SWQM data from an Albers projection/* specified in units of feet and with specific latitude/longitude parameters to theTSMS-Albers/* projection./*inputprojection albersunits feetdatum NAD27spheroid Clarke1866parameters25 48 0037 00 00-99 00 0031 24 000.00.0/*outputprojection albersunits metersdatum NAD83spheroid GRS1980parameters27 25 0034 55 00-100 00 0031 10 001000000.01000000.0END

212
Appendix C : List of Acronyms

213
AGCHEM Agrichemical Soil Nutrient ModelAGNPS Agricultural Nonpoint Source Pollution ModelAML Arc Macro LanguageANSWERS Areal Nonpoint Source Watershed Environment Response SimulationARMSED U.S. Army Watershed Sediment RoutineCCBNEP Corpus Christi Bay National Estuary ProgramCD-ROM Compact Disc-Read Only MemoryCHRIS Chemical-Hydrologic Resource Information SystemCREAMS Chemicals, Runoff, and Erosion from Agricultural Management SystemsCWA Clean Water ActDEM Digital Elevation ModelDLG Digital Line GraphEMC Expected Mean ConcentrationEPA Environmental Protection AgencyERDAS Earth Resources Data Analysis SystemEROS Earth Resources Observation SystemsESRI Environmental Systems Research InstituteGBNEP Galveston Bay National Estuary ProgramGIRAS Geographical Information Retrieval Analysis SystemGIS Geographic Information SystemsGLEAMS Groundwater Loading Effects of Agricultural Management SystemsGRASS Geographic Resources Analysis Support SystemGRS80 Geodetic Reference System of 1980HSPF Hydrological Simulation Program - FORTRANHTML Hyper Text Markup LanguageHUC Hydrologic Unit CodeIRIS Integrated River Information SystemLOADSS Lake Okeechobee Agricultural Decision Support SystemLULC Land Use/Land CoverMULTSED Multiple Watershed Sediment RoutineMUSLE Modified Universal Soil Loss EquationNAD27 North American Datum of 1927NAD83 North American Datum of 1983NEP National Estuary ProgramNO2 Nitrite NitrogenNO3 Nitrate NitrogenNOAA National Oceanic and Atmospheric AdministrationNPDES National Pollutant Discharge Elimination SystemPAT Point (or Polygon) Attribute TablePRISM Parameter-elevation Regressions on Independent Slopes ModelQUAL2E Enhanced Stream Water Quality ModelRUSLE Revised Universal Soil Loss EquationSCS Soil Conservation ServiceSIMPLE Spatially Integrated Model for Phosphorus Loading and ErosionSLAMM Source Loading and Management Model

214
SMoRMod Soil Moisture-based Runoff ModelSNOTEL Snowpack TelemetrySTORET Storage and Retrieval of U.S. Waterways Parametric DataSWAT Soil Water and Assessment ToolSWMM Stormwater Management ModelSWQM Surface Water Quality MonitoringSWRRB Simulator for Water Resources in Rural BasinsTDWR Texas Department of Water ResourcesTKN Total Kjeldahl NitrogenTNRCC Texas Natural Resource Conservation CommissionTSMS Texas State Mapping SystemTWDB Texas Water Development BoardUSA-CERL U.S. Army Construction Engineering Research LaboratoryUSDA-NRCS U.S. Department of Agriculture Natural Resource Conservation ServiceUSGS United States Geological SurveyUSLE Universal Soil Loss EquationUTM Universal Transverse MercatorVAT Value Attribute TableVirGIS Virginia Geographic Information SystemWAIS Wide Area Information ServersWGEN Weather Generation Model