Appendix A: Analytical Methods (i) Method of qualitative ...
50
127 Appendix A: Analytical Methods (i) Method of qualitative and quantitative analysis of the component of aqueous extract of G. lucidum Aqueous extract of G. lucidum Identification of Ganoderic acid and Adenosine Assay TLC HPLC UV HPLC Ganoderic acid A Adenosine Ganoderic acid A Adenosine Total polysaccharides 5g of dried powder of G. lucidum Add 200 mL of distilled water Remove water by rotary evaporator Reflux for 8 hrs at 100˚C Cool the solution then filter
Transcript of Appendix A: Analytical Methods (i) Method of qualitative ...

127
Appendix A: Analytical Methods
(i) Method of qualitative and quantitative analysis of the component of
aqueous extract of G. lucidum
Aqueous extract of G. lucidum
Identification of Ganoderic acid and
Adenosine
Assay
TLC HPLC UV HPLC
Ganoderic
acid A
Adenosine
Ganoderic
acid A
Adenosine
Total
polysaccharides
5g of dried powder of G. lucidum
Add 200 mL of distilled water
Remove water by rotary evaporator
Reflux for 8 hrs at 100˚C
Cool the solution then filter

128
(ii) Determination of total polysaccharides content in aqueous extract of G.
lucidum
The total polysaccharide content of the hot aqueous extract was determined
using the phenol-sulphuric acid method with D-glucose as a reference (DuBois et al.,
1956). Briefly, 1 mL of 5% phenol was added to 1 mL of sample solution, followed by
5 mL of concentrated H2SO4. The absorbance was measured using a spectrophotometer
(Shimadzu series 1601 UV/Vis) after 10 minutes at 483 nm.
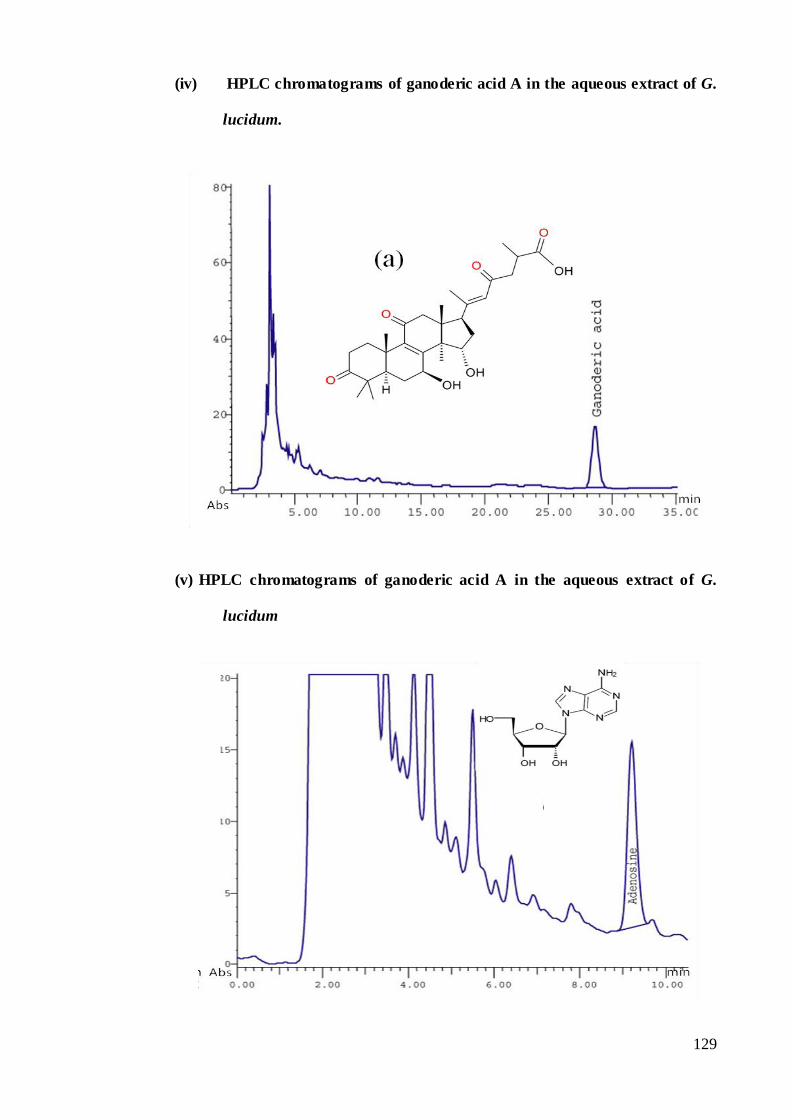
(iii) Quantification of ganoderic acid and adenosine using HPLC
For determination of ganoderic acid A, Perkin Elmer Series 200 liquid
chromatography equipped with a Perkin Elmer Series 200 UV detector was used. The
detector signal was recorded by the Turbochrom workstation software. The column
used was Hypersil BDS C18 (4.6 × 250 mm) with Alltech refillable C18 Guard column
(10 × 4.6 mm) (Alltech, USA). The mobile phase consisted of 5% acetic acid in
methanol and the flow rate was 1.0 mL/min. The calibration curve was prepared by
injecting a series of ganoderic acid A (Sigma) reference standard dilutions.
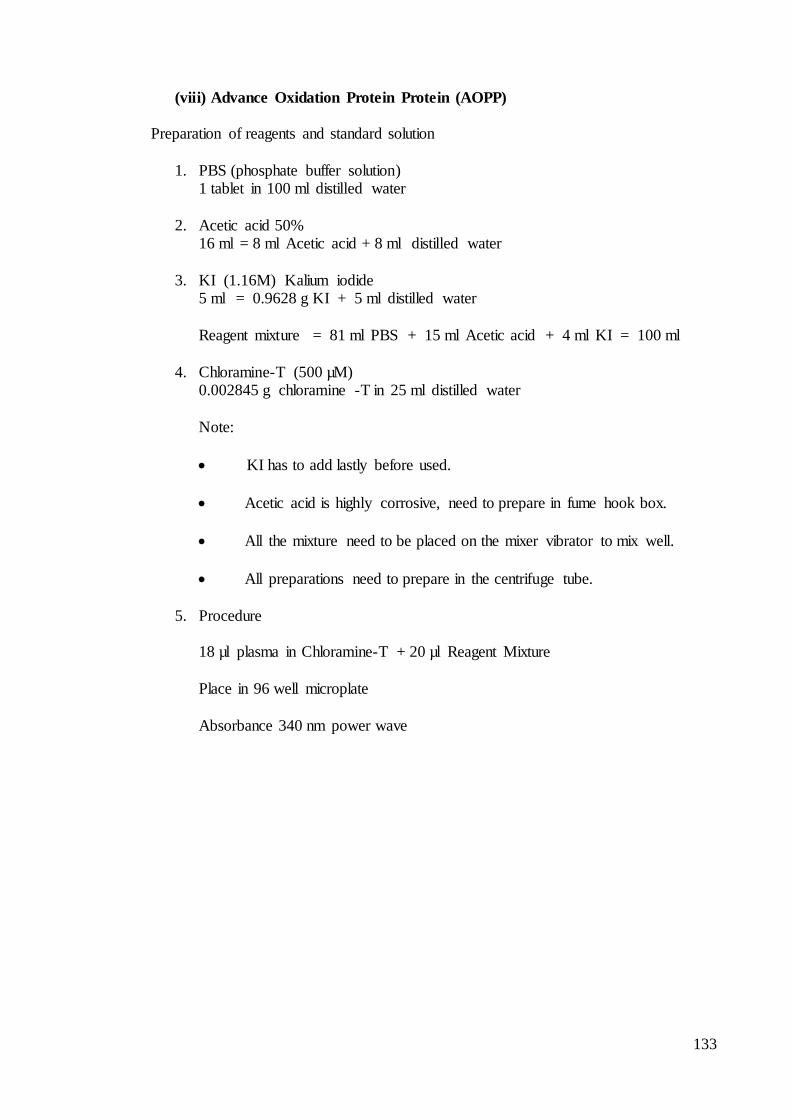
Quantification and validation of adenosine was also performed in Perkin Elmer Series
200 liquid chromatography as mentioned. The mobile phase was methanol: 10 mM
monobasic potassium phosphate (15:85), pH 5.0 and the flow rate was 1.5 mL/min.
Both ganoderic acid A and adenosine were quantified by means of calibration curves
obtained from commercial standards of these compounds (Sigma).
129
(iv) HPLC chromatograms of ganoderic acid A in the aqueous extract of G.
lucidum.
(v) HPLC chromatograms of ganoderic acid A in the aqueous extract of G.
lucidum

130
(vi) CUPRAC assay
Preparation of solution:
1. Copper 1.0 x 10 ֿ ² M
0.4262 copper + 250 ml dH2O
2. Neocuproine 7.5 x 10 ֿ ³ M
0.078 g Neocuproine + 50 ml 45 % ethanol
3. Ammonium acetate buffer solution (1M, PH 7)
19.27 g Ammonium acetate + 250 ml dH2O
Procedure of assay
1 ml copper + 1 ml Neocuproine + 1 ml Ammonium acetate buffer
+ 1 ml extract (Blank = dH2O) If serum use 10 µL + dH2O 1090 µL
Mixed in sequence and leave for 30 min, read at absorbance 450 nm
Standard curve for CUPRAC assay
Ab
sorb
an
ce at 4
50
nm
Vitamin C (mg/mL)

131
(vii) Lipid Hydroperoxides Assay
Preparation of reagent and standard solution.
1. 10.3mM 1-methyl-2-phenylindole (MPI) in acetonitrile
0.0213g MPI in 100ml acetonitrile
2. 5M HCl - (2x dilution from stock HCl 37%).
3. Preparation of standard solution 1,1,3,3-tetraethoxypropane (TEP, 0, 2.5, 5, 10,
15, 20 μM)
1mM (stock A)
12.5μl TEP in 50ml (total) dH2O
(20μM)
1ml stock A in 50ml (total) dH2O
200μl stock A in 50ml (total) dH2O
2x dilution 3/4x dilution
10 μM 15 μM
2x dilution
5 μM
2x dilution
2.5 μlM

132
4. Procedure
150 μl standard/sample
+ 375 μl MPI (10.3mM) in acetonitrile
+ 225 μl HCl (5M)
Incubate in water bath: 45oC, 40 minutes
Centrifuge: 10 000rpm, 5 minutes
Absorbance reading
586nm, 200μl per well
5. Standard curve for LHP assay
Ab
sorb
an
ce at 5
86n
m
µmol/L of Tetraethoxypropane
133
(viii) Advance Oxidation Protein Protein (AOPP)
Preparation of reagents and standard solution
1. PBS (phosphate buffer solution) 1 tablet in 100 ml distilled water
2. Acetic acid 50% 16 ml = 8 ml Acetic acid + 8 ml distilled water
3. KI (1.16M) Kalium iodide 5 ml = 0.9628 g KI + 5 ml distilled water
Reagent mixture = 81 ml PBS + 15 ml Acetic acid + 4 ml KI = 100 ml
4. Chloramine-T (500 µM) 0.002845 g chloramine -T in 25 ml distilled water
Note:
KI has to add lastly before used.
Acetic acid is highly corrosive, need to prepare in fume hook box.
All the mixture need to be placed on the mixer vibrator to mix well.
All preparations need to prepare in the centrifuge tube.
5. Procedure
18 µl plasma in Chloramine-T + 20 µl Reagent Mixture
Place in 96 well microplate
Absorbance 340 nm power wave

134
6. Standard curve
(ix) Preparation of streptozotocin solution (STZ)
1. Citric Acid, M = 210.14 g/mol
0.1M = 2.101 g citric acid in 100 ml distilled water
2. Sodium Citrate, M = 294.10 g/mol
0.1M = 2.941 g in 100 ml dH2O
3. Citrate Buffer 0.1 M
25 ml (1) + 25 ml (2) + 50 ml dH2O
4. STZ dosage preparation (45 mg /kg /ml)
22.5mg / 500 µl buffer = 45 mg / kg / ml

135
(x) Automated tissue processing
Process Duration (hours)
Dehydration
1. 10% Formalin
2. 10% Formalin
3. 70% Ethanol 1
4. 95% Ethanol 2
5. 95% Ethanol 3
6. 95% Ethanol 4
7. Absolute Ethanol 1
8. Absolute Ethanol 2
1
1
1
1
1
1
1
1½
Clearing
9. Alcohol : Xylene (1 : 1)
10. Xylene 1
11. Xylene 2
1
1
1½
Embedding
12. Paraffin wax 1
13. Paraffin wax 2
1½
1½
Total 14½

136
(xi) Hematoxylene and eosin staining
Process (solution) Time duration
Dewaxing
1. Xylene 1
2. Xylene 2
3 min
3 min
Dehydration
3. Absolute Alcohol
4. 95% Alcohol 1
5. 95% Alcohol 2
6. 70% Alcohol
2 min
2 min
2 min
2 min
Bring section to water
Running water
3 min
Staining
7. Harris’ Haematoxylin
8. Running water
9. 0.5% Acid Alcohol
10. Running water
11. 2% Sodium Acetate
12. Running water
13. Rinse in 80% Alcohol
14. Eosin
10 min
Remove colour
2-3 dips
2-3 min
2-3 dips
2-3 min
2-3 dips
5 min
Continue next page

137
Dehydration
15. 95% Alcohol 1
16. 95% Alcohol 2
17. Absolute Alcohol 1
18. Absolute Alcohol 2
5 sec
2 min
2 min
2 min
Clearing
19. Xylene 1
20. Xylene 2
21. Xylene 3
2 min
2 min
3 min
(xii) Masson’s Trichrome staining
Suitable for staining nuclei, cytoplasm, erythrocytes, keratin, muscle fibers, collagen,
mucus
Stock solution:
1. Bouin’s Solution – from Sigma, add glacial acetic acid (to 5%) just before use.
2. Alcoholic hematoxylin stock solution (solution A):
Hematoxylin from Sigma H9627 5 g + 95% Ethanol 500 mL
Dissolve over gentle heat– do not boil. Label with date and initials, store at room
temperature up to 1 year.
3. 10% ferric chloride stock solution (solution B)
Ferric chloride (Iron III chloride) Sigma F7134 5.8 g
Milli-Pure water 495 ml + glacial acetic acid 5 ml
Dissolve ferric chloride in 50 ml water, add acetic acid last, store at room
temperature for up to 1 year.
138
4. Acid fuchsin, 1% aqueous stock solution
Dissolve 1 g acid fuchsin (Sigma #857408) in 100 mL Milli-Pure water. Label
and store at room temperature.
Biebrick scarlet, 1% aqueous stock solution
Dissolve 10 g biebrich scarlet (aka Ponceau BS, Sigma #B6008) in 1000 mL
Milli-Pure water. Label and store at room temperature.
5. Aniline blue stock solution
Component to make 250 mL
Aniline Blue (CAS #66687-07-8) 6.25 g
Glacial acetic acid 5.0 mL
Distilled water 250 mL
Store at room temperature for up to 1 year.
6. Phosphomolybdic - Phosphotungstic acid solution
Component to make 250 mL
Phosphomolybdic acid (Sigma #221856) 3.125 g
Phosphotungstic acid (Sigma #P4006) 3.125 g
Distilled Water 250 mL
Store at room temperature for up to 1 year.
7. Working solution
1% Acetic Acid Solution
Component to make 250 mL
Glacial acetic acid 2.5 mL
Distilled Water 247.5 mL
Make fresh just before use.
139
8. Weigert’s hematoxylin – working solution
Component to make 250 mL
Solution A – Alcoholic Hematoxylin Stock 125 mL
Solution B – 10% Ferric Chloride Stock 125 mL
Prepare just before use. Discard in “Hematoxylin Waste” container.
9. Biebrich scarlet - Acid fuchsin solution – working solutionn
Component to make 250 mL
Biebrich scarlet, 1% stock 222.5 ml
Acid fuchsin, 1% stock 25 ml
Glacial Acetic Acid 2.5ml
Prepare just before use.
Can be used for a maximum of two runs if within 24 hours.
10. Aniline blue working solution
Component to make 250 mL
Aniline Blue Stock Solution 250 ml
Glacial acetic acid 5.0 ml
Add glacial acetic acid just before using.
PROCEDURE:
**Always run a control slide with every stain**
1. Deparaffinize and re-hydrate tissues to PBS*
2. Distilled water* 1 min.
3. Mordant in Bouin’s – in fume hood, covered Overnight
4. Running tap water rinse – until yellow color clears 1 min.
5. Distilled water rinse 1 min.

140
6. Weigert’s Hematoxylin working solution* 12 min.
a. Discard after use.
7. Running tap water rinse 10 min.
8. Distilled water rinse 1 min.
9. Biebrich scarlet-acid fuchsin solution 1 min.
Solution may be used twice only, then discarded.
10. Distilled water rinse 1 quick dip only
11. Phosphomolybdic-phosphotungstic acid solution 30 min.
Discard after use.
12. Aniline blue solution* 10 min.
Solution may be used twice only, then discarded.
13. Distilled water rinse 1 quick dip only
14. 1% Acetic acid solution 4 min.
Discard after use.
15. 95% Ethanol 2 x 1 min.
16. 100% Ethanol 2 x 1 min.
17. Formula 83 3 x 1 min.
18. Mount with Permount
Results: Cytoplasm, keratin, muscle fibers, Erythrocytes – red
Nuclei – black
Collagen and mucus – blue / green

141
Appendix B: Statistic Analysis
(i) Period of Re-epithelisation
Table 2: ANOVA: Period of re-epithelialisation in normal rats
Analysis of Variance (Spreadsheet 1)
Marked effects are significant at p< 0.05000
Variable SS
effect
df
effect
MS
effect
SS
error
df
error
MS
Error
F P
Rate 5.555556 5 1.111111 20.66667 30 0.688889 1.612903
Table 1: Descriptive Statistics: Period of re-epithelialisation in normal rats
Breakdown Table of Descriptive Statistic
Treatment N Means Std. Error Std. Dev. Minimum Maximum
Negative 6 13.16667 0.16666 0.408248 13.00000 14.00000
Positive 6 12.83333 0.16666 0.408248 12.00000 13.0000
5% Ext 6 13.33333 0.21081 0.516398 13.00000 14.00000
10% Ext 6 12.16667 0.30731 0.752773 11.00000 13.00000
15% Ext 6 12.66667 0.49441 1.211060 11.00000 14.00000
20% Ext 6 12.50000 0.50000 1.224745 11.00000 14.00000
All groups 36 12.77778 0.14426 0.865567 11.00000 14.00000

142
Table 3: Duncan Variable rate Tests: Period of re-epithelialisation in normal rats
Duncan test; variable rate (Spreadsheet) Approximate Probabilities for Post Hoc tests Error: Between MS= 0.68889, df= 30.000
Cell
No.
Treatment (1)
13.167
(2)
12.833
(3)
13.333
(4)
12.167
(5)
12.667
(6)
12.500
1 Negative 0.492 0.731 0.070 0.334 0.214
2 Positive 0.492 0.334 0.214 0.731 0.518293
3 5% Ext 0.731 0.334 0.038 0.214 0.130
4 10% Ext 0.070 0.214 0.038 0.334 0.492
5 15% Ext 0.334 0.731 0.214 0.334 0.731
6 20% Ext 0.214 0.518 0.130 0.492 0.731
Marked effects are significant at p< 0.050
Table 4: Dunnett Variable rate Test: Period of re-epithelialisation in normal rats
Cell No. Treatment (1) 13.167
1 Negative
2 Positive 0.932197
3 5% Ext 0.996483
4 10% Ext 0.163478
5 15% Ext 0.745852
6 20% Ext 0.506827
Marked effects are significant at p< 0.050
143
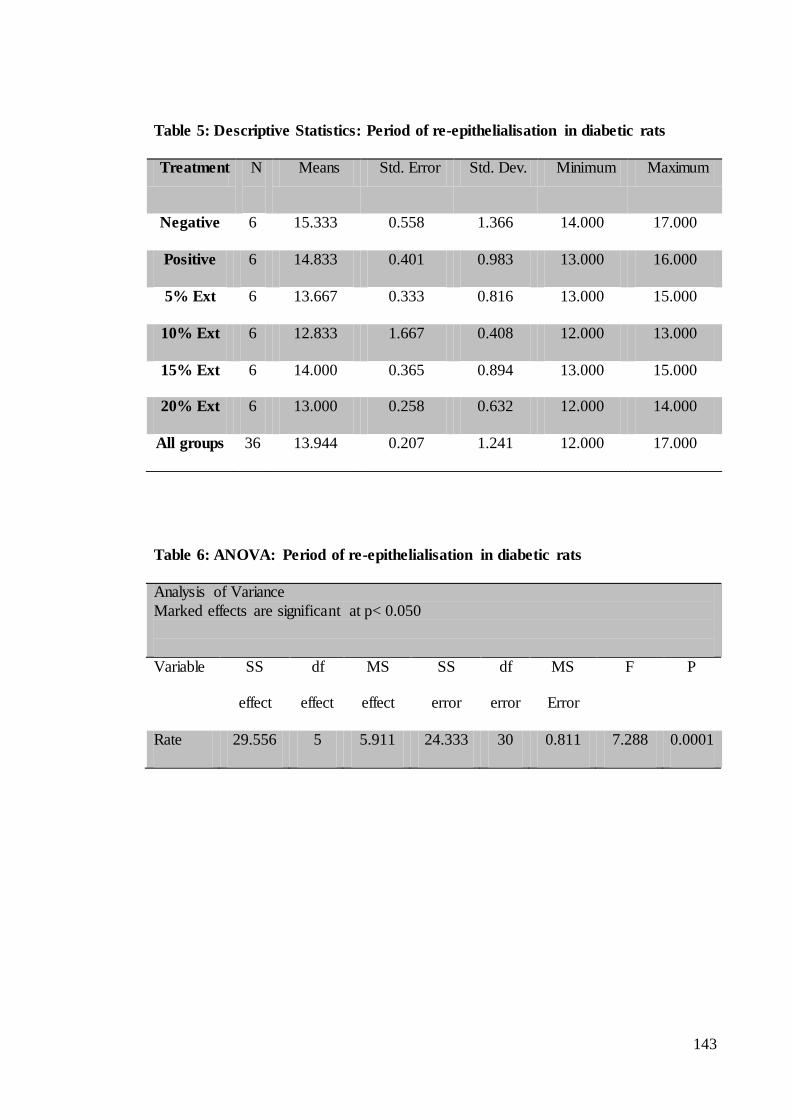
Table 6: ANOVA: Period of re-epithelialisation in diabetic rats
Analysis of Variance
Marked effects are significant at p< 0.050
Variable SS
effect
df
effect
MS
effect
SS
error
df
error
MS
Error
F P
Rate 29.556 5 5.911 24.333 30 0.811 7.288 0.0001
Table 5: Descriptive Statistics: Period of re-epithelialisation in diabetic rats
Treatment N
Means Std. Error Std. Dev. Minimum Maximum
Negative 6 15.333 0.558 1.366 14.000 17.000
Positive 6 14.833 0.401 0.983 13.000 16.000
5% Ext 6 13.667 0.333 0.816 13.000 15.000
10% Ext 6 12.833 1.667 0.408 12.000 13.000
15% Ext 6 14.000 0.365 0.894 13.000 15.000
20% Ext 6 13.000 0.258 0.632 12.000 14.000
All groups 36 13.944 0.207 1.241 12.000 17.000
144
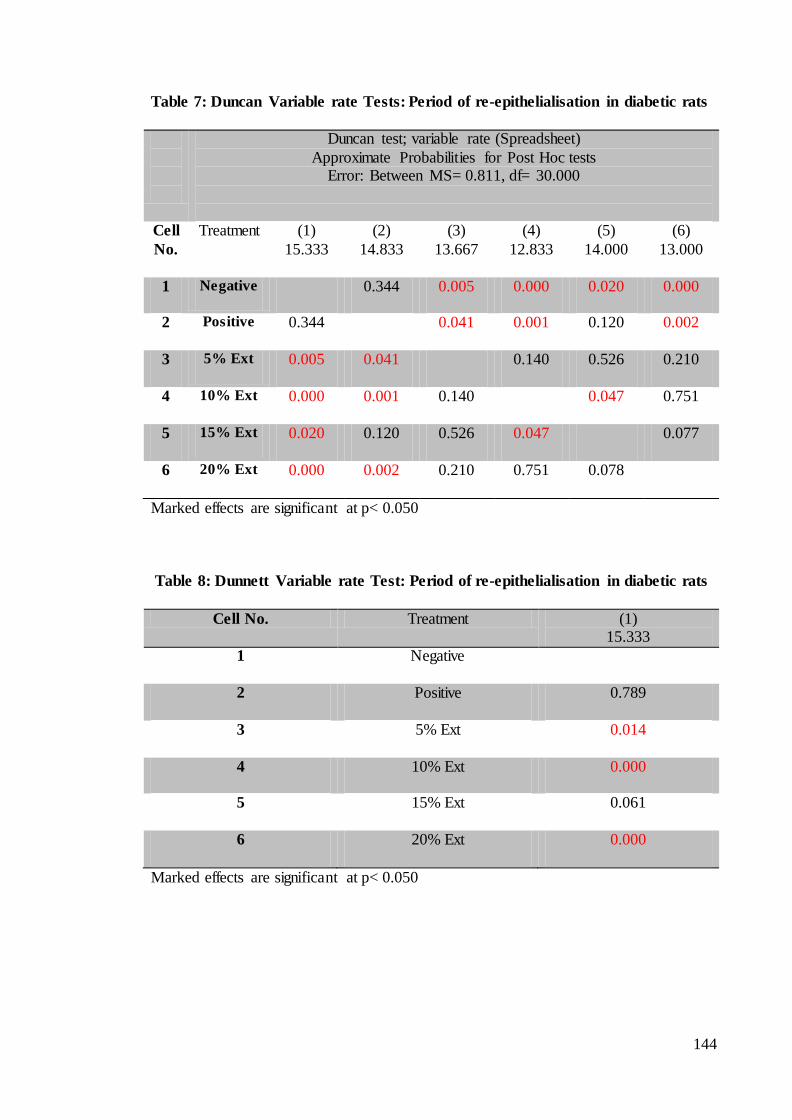
Table 7: Duncan Variable rate Tests: Period of re-epithelialisation in diabetic rats
Duncan test; variable rate (Spreadsheet)
Approximate Probabilities for Post Hoc tests Error: Between MS= 0.811, df= 30.000
Cell
No.
Treatment (1)
15.333
(2)
14.833
(3)
13.667
(4)
12.833
(5)
14.000
(6)
13.000
1 Negative 0.344 0.005 0.000 0.020 0.000
2 Positive 0.344 0.041 0.001 0.120 0.002
3 5% Ext 0.005 0.041 0.140 0.526 0.210
4 10% Ext 0.000 0.001 0.140 0.047 0.751
5 15% Ext 0.020 0.120 0.526 0.047 0.077
6 20% Ext 0.000 0.002 0.210 0.751 0.078
Marked effects are significant at p< 0.050
Table 8: Dunnett Variable rate Test: Period of re-epithelialisation in diabetic rats
Cell No. Treatment (1) 15.333
1 Negative
2 Positive 0.789
3 5% Ext 0.014
4 10% Ext 0.000
5 15% Ext 0.061
6 20% Ext 0.000
Marked effects are significant at p< 0.050
145
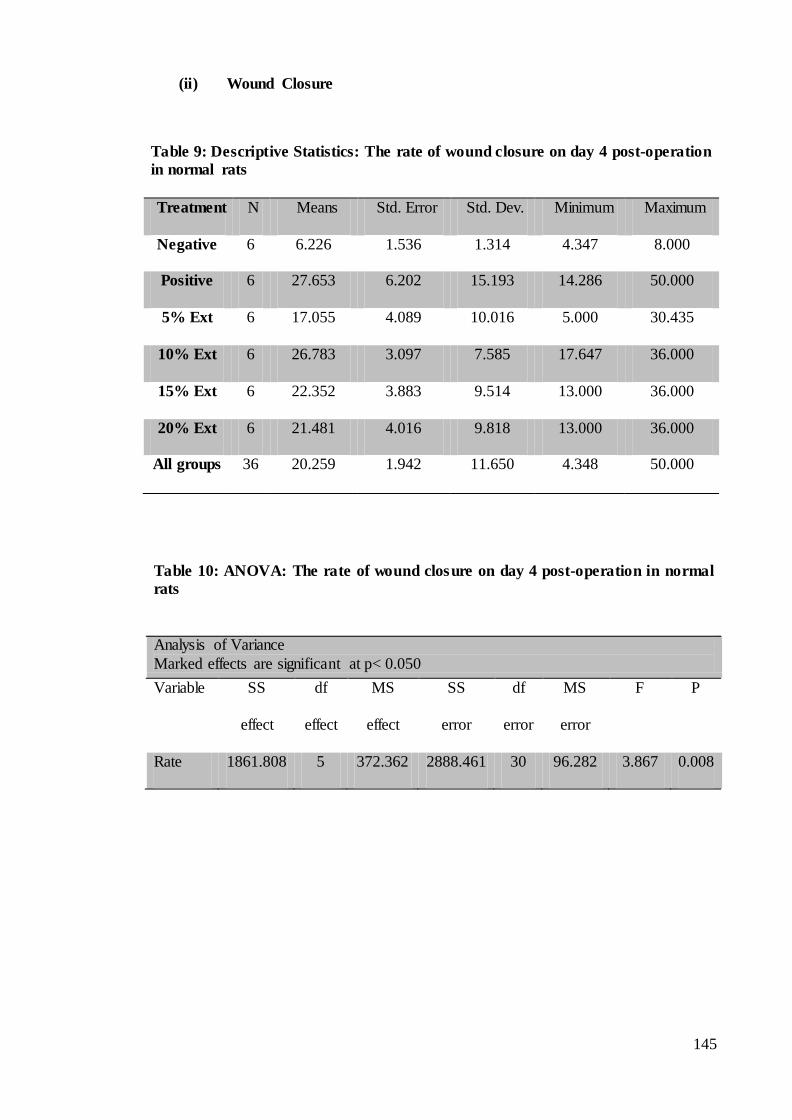
(ii) Wound Closure
Table 10: ANOVA: The rate of wound closure on day 4 post-operation in normal
rats
Analysis of Variance
Marked effects are significant at p< 0.050
Variable SS
effect
df
effect
MS
effect
SS
error
df
error
MS
error
F P
Rate 1861.808 5 372.362 2888.461 30 96.282 3.867 0.008
Table 9: Descriptive Statistics: The rate of wound closure on day 4 post-operation
in normal rats
Treatment N Means Std. Error Std. Dev. Minimum Maximum
Negative 6 6.226 1.536 1.314 4.347 8.000
Positive 6 27.653 6.202 15.193 14.286 50.000
5% Ext 6 17.055 4.089 10.016 5.000 30.435
10% Ext 6 26.783 3.097 7.585 17.647 36.000
15% Ext 6 22.352 3.883 9.514 13.000 36.000
20% Ext 6 21.481 4.016 9.818 13.000 36.000
All groups 36 20.259 1.942 11.650 4.348 50.000

146
Table 11: Duncan Variable rate Tests: The rate of wound closure on day 4 post-
operation in normal rats
Duncan test; variable rate (Spreadsheet)
Approximate Probabilities for Post Hoc tests Error: Between MS= 96.282, df= 30.000
Cell
No.
Treatment (1)
6.227
(2)
27.653
(3)
17.055
(4)
26.784
(5)
22.352
(6)
21.481
1 Negative 0.002 0.066 0.002 0.013 0.015
2 Positive 0.002 0.104 0.879 0.385 0.330
3 5% Ext 0.066 0.104 0.126 0.386 0.441
4 10% Ext 0.002 0.879 0.126 0.440 0.385
5 15% Ext 0.013 0.386 0.386 0.440 0.879
6 20% Ext 0.015 0.330 0.441 0.385 0.879
Marked effects are significant at p< 0.050
Table 12: Dunnett Variable rate Test: The rate of wound closure on day 4 post-
operation in normal rats
Cell No. Treatment (1) 6.227
1 Negative
2 Positive 0.003
3 5% Ext 0.226
4 10% Ext 0.004
5 15% Ext 0.032
6 20% Ext 0.046
Marked effects are significant at p< 0.050

147
Table 13: Descriptive Statistics: The rate of wound closure on day 4 post-operation
in diabetic rats
Table 14: ANOVA: The rate of wound closure on day 4 post-operation in diabetic
rats
Analysis of Variance
Marked effects are significant at p< 0.050
Variable SS
effect
df
effect
MS
effect
SS
error
df
error
MS
error
F P
Rate 58906.55 5 11781.31 13730.78 30 457.693 25.741 0.000
Treatment N Means Std. Error Std. Dev. Minimum Maximum
Negative 6 -78.418 7.846 19.220 -112.500 -64.706
Positive 6 29.689 6.172 15.118 9.091 46.667
5% Ext 6 -11.915 10.494 25.705 -50.000 26.667
10% Ext 6 4.512 6.894 16.886 -22.222 20.000
15% Ext 6 -66.710 13.070 32.015 -90.000 -25.000
20% Ext 6 -62.407 5.437 13.318 -80.000 -50.000
All groups 36 -30.873 7.593 45.556 -112.500 46.667
148
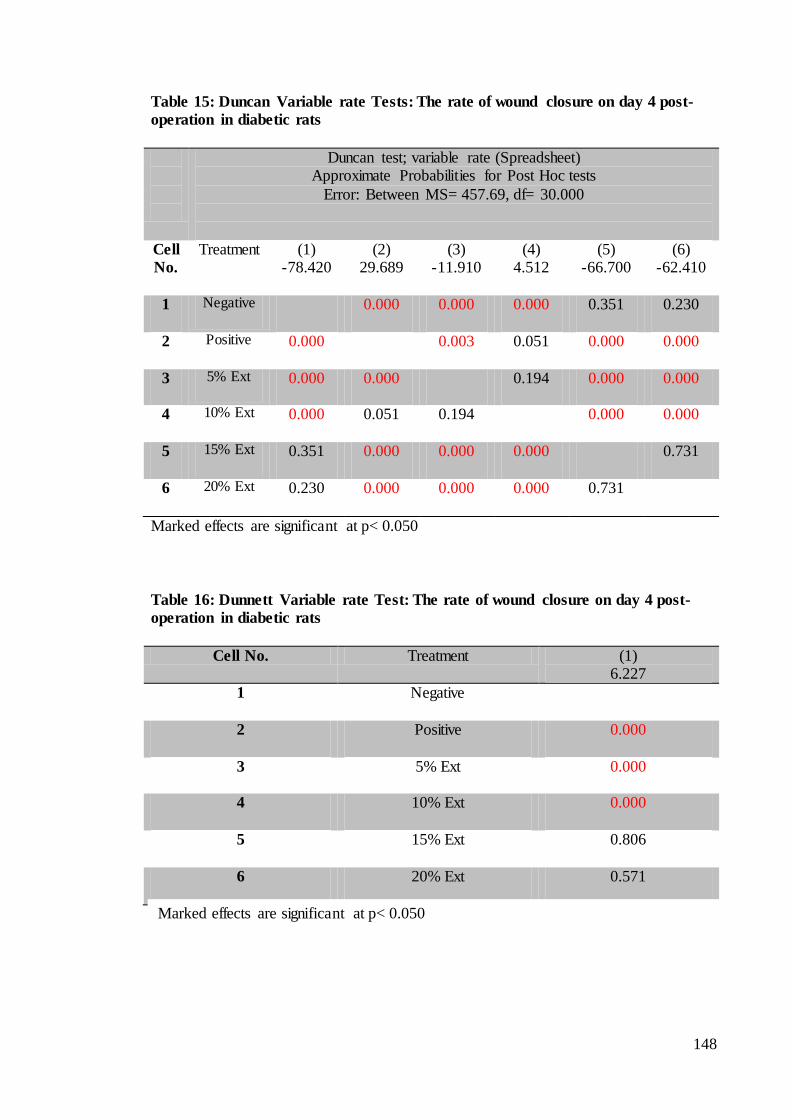
Table 15: Duncan Variable rate Tests: The rate of wound closure on day 4 post-
operation in diabetic rats
Duncan test; variable rate (Spreadsheet) Approximate Probabilities for Post Hoc tests
Error: Between MS= 457.69, df= 30.000
Cell
No.
Treatment (1) -78.420
(2) 29.689
(3) -11.910
(4) 4.512
(5) -66.700
(6) -62.410
1 Negative 0.000 0.000 0.000 0.351 0.230
2 Positive 0.000 0.003 0.051 0.000 0.000
3 5% Ext 0.000 0.000 0.194 0.000 0.000
4 10% Ext 0.000 0.051 0.194 0.000 0.000
5 15% Ext 0.351 0.000 0.000 0.000 0.731
6 20% Ext 0.230 0.000 0.000 0.000 0.731
Marked effects are significant at p< 0.050
Table 16: Dunnett Variable rate Test: The rate of wound closure on day 4 post-
operation in diabetic rats
Cell No. Treatment (1) 6.227
1 Negative
2 Positive 0.000
3 5% Ext 0.000
4 10% Ext 0.000
5 15% Ext 0.806
6 20% Ext 0.571
Marked effects are significant at p< 0.050

149
Table 17: Descriptive Statistics: The rate of wound closure on day 8 post-operation
in normal rats
Table 18: ANOVA: The rate of wound closure on day 8 post-operation in normal
rats
Analysis of Variance Marked effects are significant at p< 0.050
Variable SS
effect
df
effect
MS
effect
SS
error
df
error
MS
error
F P
Rate 2827.289 5 565.458 4742.133 30 158.071 3.577 0.012
Treatment N Means Std. Error Std. Dev. Minimum Maximum
Negative 6 49.129 7.084 17.351 26.667 70.000
Positive 6 68.712 4.864 11.915 53.333 85.000
5% Ext 6 65.511 4.226 10.352 55.556 78.947
10% Ext 6 67.319 3.016 7.388 60.000 77.273
15% Ext 6 75.284 5.351 13.106 50.000 86.364
20% Ext 6 75.830 5.352 13.110 50.000 86.364
All groups 36 66.964 2.451 14.706 26.667 86.364

150
Table 19: Duncan Variable rate Tests: The rate of wound closure on day 8 post-
operation in normal rats
Duncan test; variable rate (Spreadsheet)
Approximate Probabilities for Post Hoc tests Error: Between MS= 158.07, df= 30.000
Cell
No.
Treatment (1)
49.129
(2)
68.712
(3)
65.512
(4)
67.319
(5)
75.284
(6)
75.830
1 Negative 0.018 0.032 0.023 0.002 0.002
2 Positive 0.018 0.682 0.849 0.373 0.363
3 5% Ext 0,032 0.682 0.805 0.229 0.214
4 10% Ext 0.023 0.849 0.805 0.309 0.294
5 15% Ext 0.002 0.373 0.229 0.309 0.941
6 20% Ext 0.002 0.363 0.214 0.294 0.941
Marked effects are significant at p< 0.050
Table 20: Dunnett Variable rate Test: The rate of wound closure on day 8 post-
operation in normal rats
Cell No. Treatment (1)
49.129
1 Negative
2 Positive 0.046
3 5% Ext 0.117
4 10% Ext 0.070
5 15% Ext 0.005
6 20% Ext 0.004
Marked effects are significant at p< 0.050

151
Table 21: Descriptive Statistics: The rate of wound closure on day 8 post-operation
in diabetic rats
Table 22: ANOVA: The rate of wound closure on day 8 post-operation in diabetic
rats
Analysis of Variance Marked effects are significant at p< 0.050
Variable SS
effect
df
effect
MS
effect
SS
error
df
error
MS
error
F P
Rate 1486.358 5 297.272 3662.345 30 122.078 2.4345 0.058
Treatment N Means Std. Error Std. Dev. Minimum Maximum
Negative 6 54.743 3.732 9.142 42.857 64.706
Positive 6 54.743 3.732 9.142 42.857 64.706
5% Ext 6 47.629 7.366 18.044 18.750 66.667
10% Ext 6 58.535 4.326 10.596 40.000 70.000
15% Ext 6 44.304 2.628 6.438 35.000 52.632
20% Ext 6 40.417 3.787 9.276 33.333 58.333
All groups 36 50.062 2.021 12.129 18.750 70.000
152
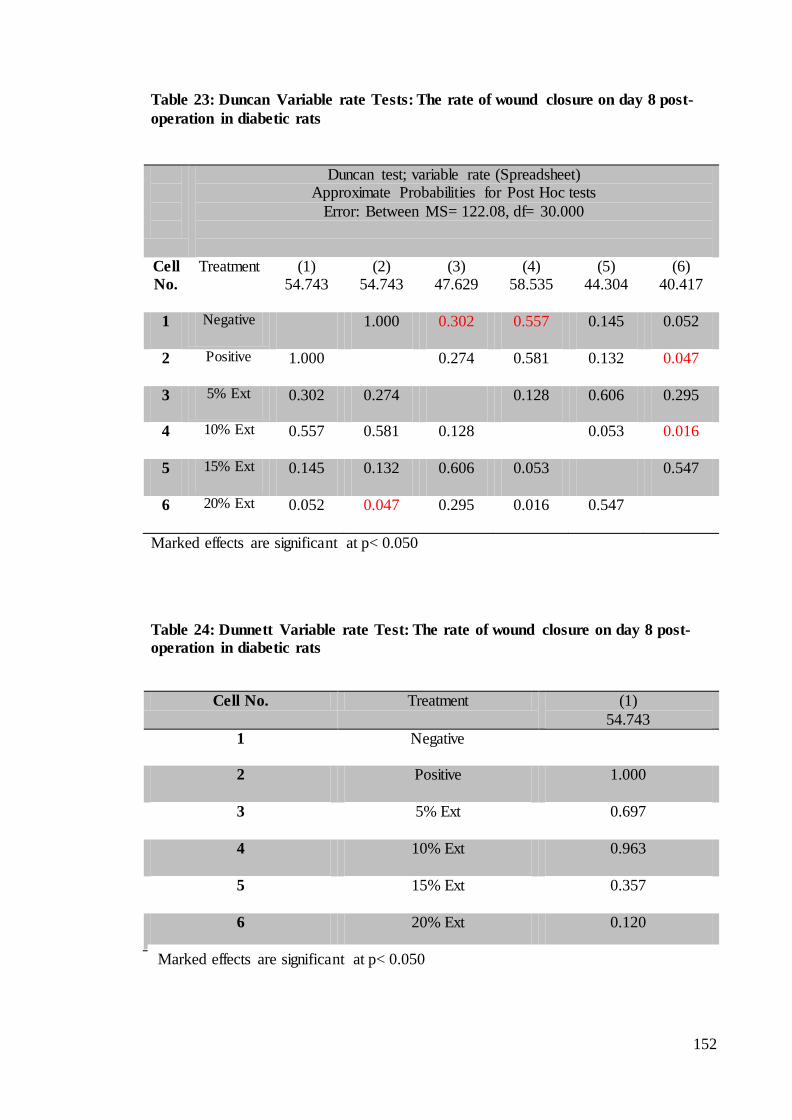
Table 23: Duncan Variable rate Tests: The rate of wound closure on day 8 post-
operation in diabetic rats
Duncan test; variable rate (Spreadsheet) Approximate Probabilities for Post Hoc tests
Error: Between MS= 122.08, df= 30.000
Cell
No.
Treatment (1) 54.743
(2) 54.743
(3) 47.629
(4) 58.535
(5) 44.304
(6) 40.417
1 Negative 1.000 0.302 0.557 0.145 0.052
2 Positive 1.000 0.274 0.581 0.132 0.047
3 5% Ext 0.302 0.274 0.128 0.606 0.295
4 10% Ext 0.557 0.581 0.128 0.053 0.016
5 15% Ext 0.145 0.132 0.606 0.053 0.547
6 20% Ext 0.052 0.047 0.295 0.016 0.547
Marked effects are significant at p< 0.050
Table 24: Dunnett Variable rate Test: The rate of wound closure on day 8 post-
operation in diabetic rats
Cell No. Treatment (1)
54.743
1 Negative
2 Positive 1.000
3 5% Ext 0.697
4 10% Ext 0.963
5 15% Ext 0.357
6 20% Ext 0.120
Marked effects are significant at p< 0.050

153
Table 25: Descriptive Statistics: The rate of wound closure on day 12 post-
operation in normal rats
Table 26: ANOVA: The rate of wound closure on day 12 post-operation in normal
rats
Analysis of Variance Marked effects are significant at p< 0.050
Variable SS
effect
df
effect
MS
effect
SS
error
df
error
MS
error
F P
Rate 364.085 5 72.817 478.939 30 15.965 4.561 0.003
Treatment N Means Std. Error Std. Dev. Minimum Maximum
Negative 6 90.689 2.022 4.954 85.090 97.222
Positive 6 96.114 1.679 4.411 90.000 100.000
5% Ext 6 90.295 2.289 5.607 84.211 100.000
10% Ext 6 98.780 0.559 1.370 97.059 100.000
15% Ext 6 96.235 1.508 3.694 89.990 100.000
20% Ext 6 96.767 1.108 2.715 93.182 100.000
All groups 36 94.813 0.818 4.908 84.211 100.000

154
Table 27: Duncan Variable rate Tests: The rate of wound closure on day 12 post-
operation in normal rats
Duncan test; variable rate (Spreadsheet)
Approximate Probabilities for Post Hoc tests Error: Between MS= 158.07, df= 30.000
Cell
No.
Treatment (1)
90.689
(2)
96.114
(3)
90.295
(4)
98.780
(5)
96.235
(6)
96.767
1 Negative 0.026 0.866 0.003 0.029 0.021
2 Positive 0.026 0.022 0.301 0.959 0.792
3 5% Ext 0.866 0.022 0.002 0.023 0.016
4 10% Ext 0.003 0.301 0.002 0.307 0.390
5 15% Ext 0.029 0.959 0.023 0.307 0.819
6 20% Ext 0.021 0.792 0.016 0.390 0.819
Marked effects are significant at p< 0.050
Table 28: Dunnett Variable rate Test: The rate of wound closure on day 12 post-
operation in normal rats
Cell No. Treatment (1) 90.689
1 Negative
2 Positive 0.097
3 5% Ext 1.000
4 10% Ext 0.006
5 15% Ext 0.087
6 20% Ext 0.053
Treatment N Means Std. Error Std. Dev. Minimum Maximum
Marked effects are significant at p< 0.050

155
Table 29: Descriptive Statistics: The rate of wound closure on day 12 post-
operation in diabetic rats
Table 30: ANOVA: The rate of wound closure on day 12 post-operation in
diabetic rats
Analysis of Variance
Marked effects are significant at p< 0.050
Variable SS
effect
df
effect
MS
effect
SS
error
df
error
MS
error
F P
Rate 4978.420 5 995.684 2520.681 30 84.023 11.850 0.000
Negative 6 62.323 3.693 9.047 50.000 76.471
Positive 6 70.273 3.772 9.239 57.143 81.250
5% Ext 6 82.600 6.347 15.548 62.500 100.000
10% Ext 6 96.818 2.016 4.938 90.000 100.000
15% Ext 6 85.560 2.635 6.454 75.000 90.000
20% Ext 6 90.648 2.206 5.403 83.333 100.000
All groups 36 81.370 2.440 14.638 50.000 100.000
156
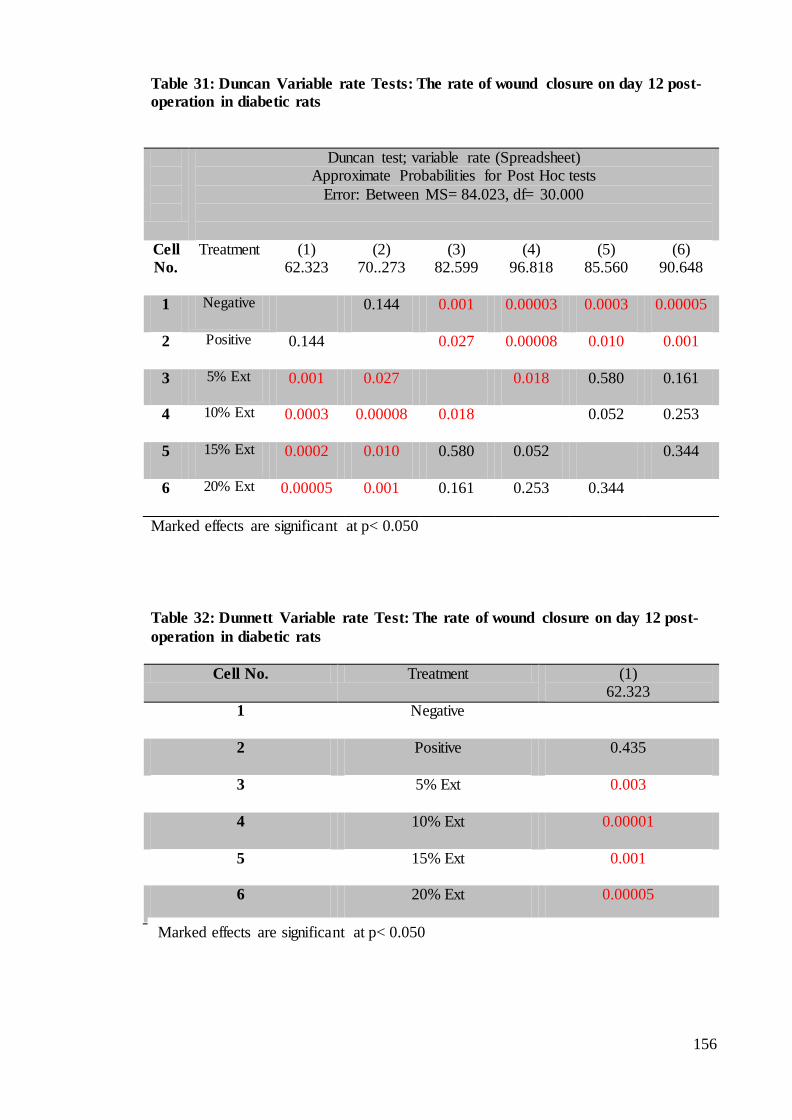
Table 31: Duncan Variable rate Tests: The rate of wound closure on day 12 post-
operation in diabetic rats
Duncan test; variable rate (Spreadsheet) Approximate Probabilities for Post Hoc tests
Error: Between MS= 84.023, df= 30.000
Cell
No.
Treatment (1) 62.323
(2) 70..273
(3) 82.599
(4) 96.818
(5) 85.560
(6) 90.648
1 Negative 0.144 0.001 0.00003 0.0003 0.00005
2 Positive 0.144 0.027 0.00008 0.010 0.001
3 5% Ext 0.001 0.027 0.018 0.580 0.161
4 10% Ext 0.0003 0.00008 0.018 0.052 0.253
5 15% Ext 0.0002 0.010 0.580 0.052 0.344
6 20% Ext 0.00005 0.001 0.161 0.253 0.344
Marked effects are significant at p< 0.050
Table 32: Dunnett Variable rate Test: The rate of wound closure on day 12 post-
operation in diabetic rats
Cell No. Treatment (1) 62.323
1 Negative
2 Positive 0.435
3 5% Ext 0.003
4 10% Ext 0.00001
5 15% Ext 0.001
6 20% Ext 0.00005
Marked effects are significant at p< 0.050

157
(iii) CUPRAC value
Table 34: ANOVA: CUPRAC values in the serum of normal rats
Analysis of Variance
Marked effects are significant at p< 0.050
Variable SS
effect
df
effect
MS
effect
SS
error
df
error
MS
error
F P
Rate 4978.420 5 995.684 2520.681 30 84.023 11.850 0.000009
Table 33 : Descriptive Statistics: CUPRAC values in the serum of normal rats
Treatment N Means Std. Error Std. Dev. Minimum Maximum
Negative 6 0.126 0.013 0.032 0.080 0.172
Positive 6 0.089 0.009 0.022 0.072 0.133
5% Ext 6 0.238 0.039 0.095 0.150 0.414
10% Ext 6 0.237 0.024 0.059 0.166 0.340
15% Ext 6 0.259 0.020 0.048 0.221 0.352
20% Ext 6 0.256 0.022 0.053 0.208 0.358
All groups 36 0.201 0.014 0.086 0.072 0.414

158
Table 35: Duncan Variable rate Tests: CUPRAC values in the serum of normal
rats
Duncan test; variable rate (Spreadsheet)
Approximate Probabilities for Post Hoc tests Error: Between MS= 0.0319, df= 30.000
Cell
No.
Treatment (1)
.12600
(2)
.08883
(3)
.23767
(4)
.23700
(5)
.25867
(6)
.25617
1 Negative .263845 .002557 .002050 .000711 .000740
2 Positive .263845 .000192 .000176 .000059 .000069
3 5% Ext .002557 .000192 .983939 .549979 .575101
4 10% Ext .002050 .000176 .983939 .551561 .585236
5 15% Ext .000711 .000059 .549979 .0551561 .939531
6 20% Ext .000740 .0000069 .575101 .585236 .939531
Marked effects are significant at p< 0.050
Table 36: Dunnett Variable rate Test: CUPRAC values in the serum of normal
rats
Cell No. Treatment (1) 62.323
1 Negative
2 Positive 0.681
3 5% Ext 0.008
4 10% Ext 0.008
5 15% Ext .0015
6 20% Ext .0018
Marked effects are significant at p< 0.050
159
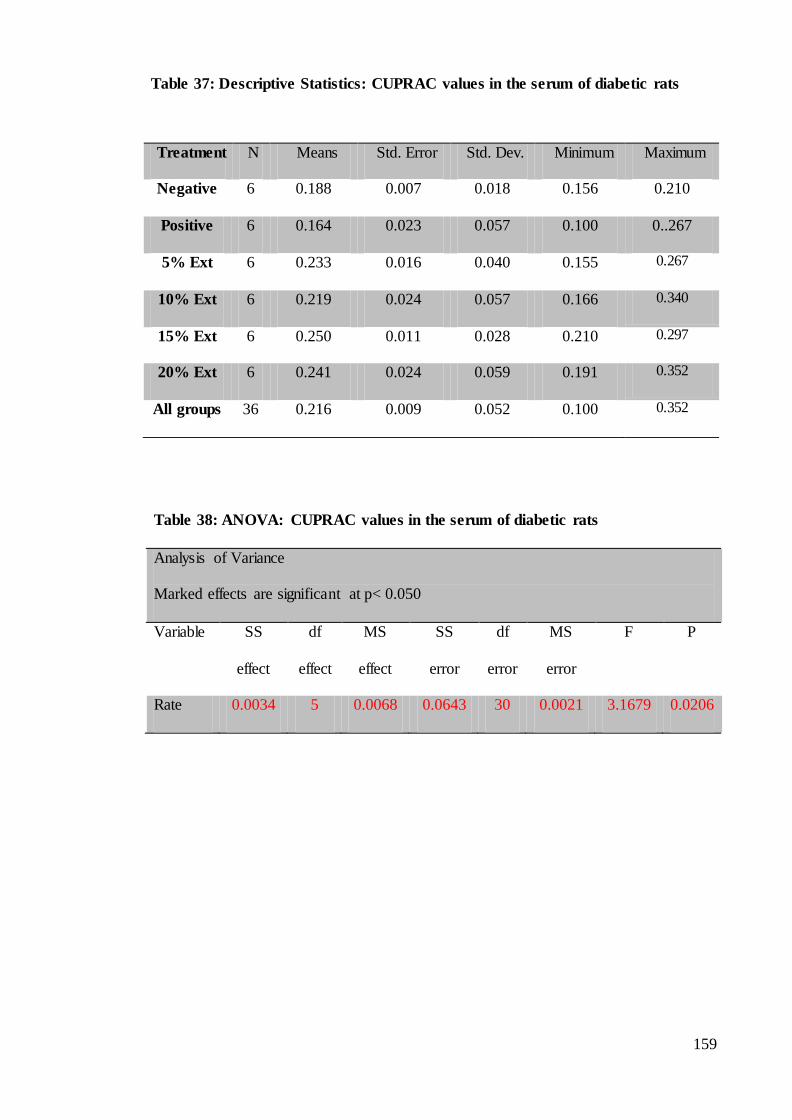
Table 37: Descriptive Statistics: CUPRAC values in the serum of diabetic rats
Table 38: ANOVA: CUPRAC values in the serum of diabetic rats
Analysis of Variance
Marked effects are significant at p< 0.050
Variable SS
effect
df
effect
MS
effect
SS
error
df
error
MS
error
F P
Rate 0.0034 5 0.0068 0.0643 30 0.0021 3.1679 0.0206
Treatment N Means Std. Error Std. Dev. Minimum Maximum
Negative 6 0.188 0.007 0.018 0.156 0.210
Positive 6 0.164 0.023 0.057 0.100 0..267
5% Ext 6 0.233 0.016 0.040 0.155 0.267
10% Ext 6 0.219 0.024 0.057 0.166 0.340
15% Ext 6 0.250 0.011 0.028 0.210 0.297
20% Ext 6 0.241 0.024 0.059 0.191 0.352
All groups 36 0.216 0.009 0.052 0.100 0.352
160
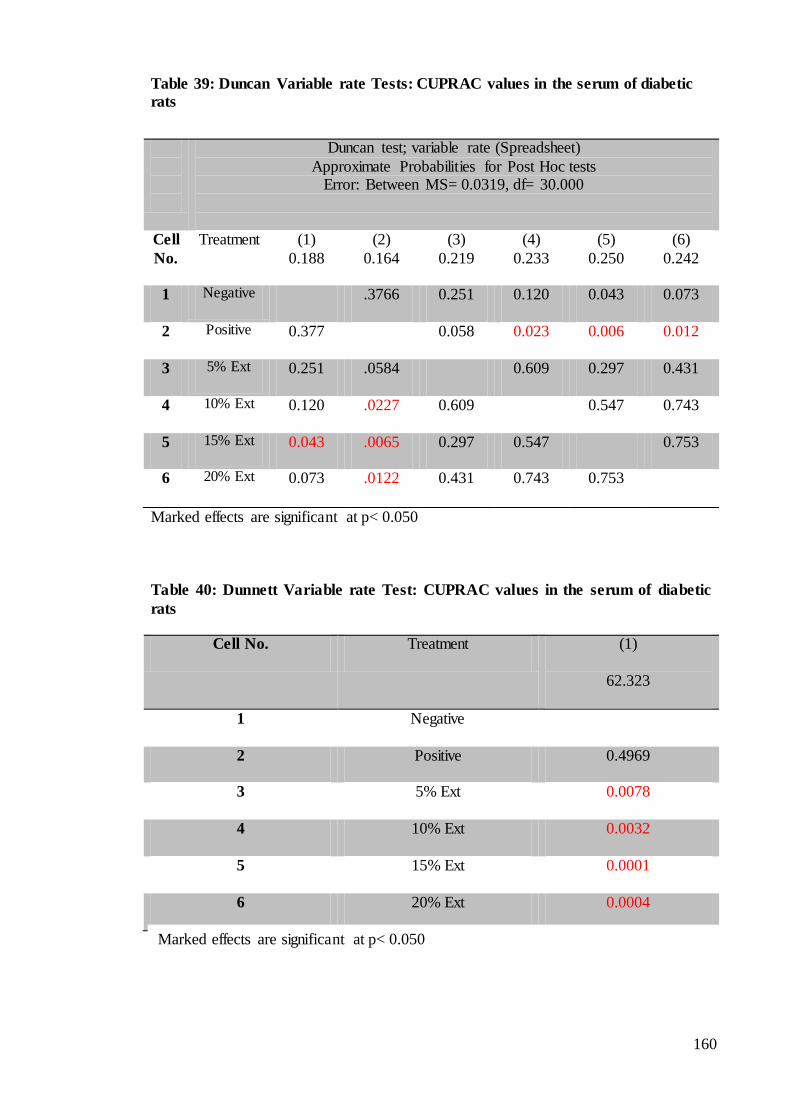
Table 39: Duncan Variable rate Tests: CUPRAC values in the serum of diabetic
rats
Duncan test; variable rate (Spreadsheet)
Approximate Probabilities for Post Hoc tests Error: Between MS= 0.0319, df= 30.000
Cell
No.
Treatment (1)
0.188
(2)
0.164
(3)
0.219
(4)
0.233
(5)
0.250
(6)
0.242
1 Negative .3766 0.251 0.120 0.043 0.073
2 Positive 0.377 0.058 0.023 0.006 0.012
3 5% Ext 0.251 .0584 0.609 0.297 0.431
4 10% Ext 0.120 .0227 0.609 0.547 0.743
5 15% Ext 0.043 .0065 0.297 0.547 0.753
6 20% Ext 0.073 .0122 0.431 0.743 0.753
Marked effects are significant at p< 0.050
Table 40: Dunnett Variable rate Test: CUPRAC values in the serum of diabetic
rats
Cell No. Treatment (1)
62.323
1 Negative
2 Positive 0.4969
3 5% Ext 0.0078
4 10% Ext 0.0032
5 15% Ext 0.0001
6 20% Ext 0.0004
Table 41 : Descriptive Statistics: AOPP values in the serum of normal rat
Marked effects are significant at p< 0.050
161
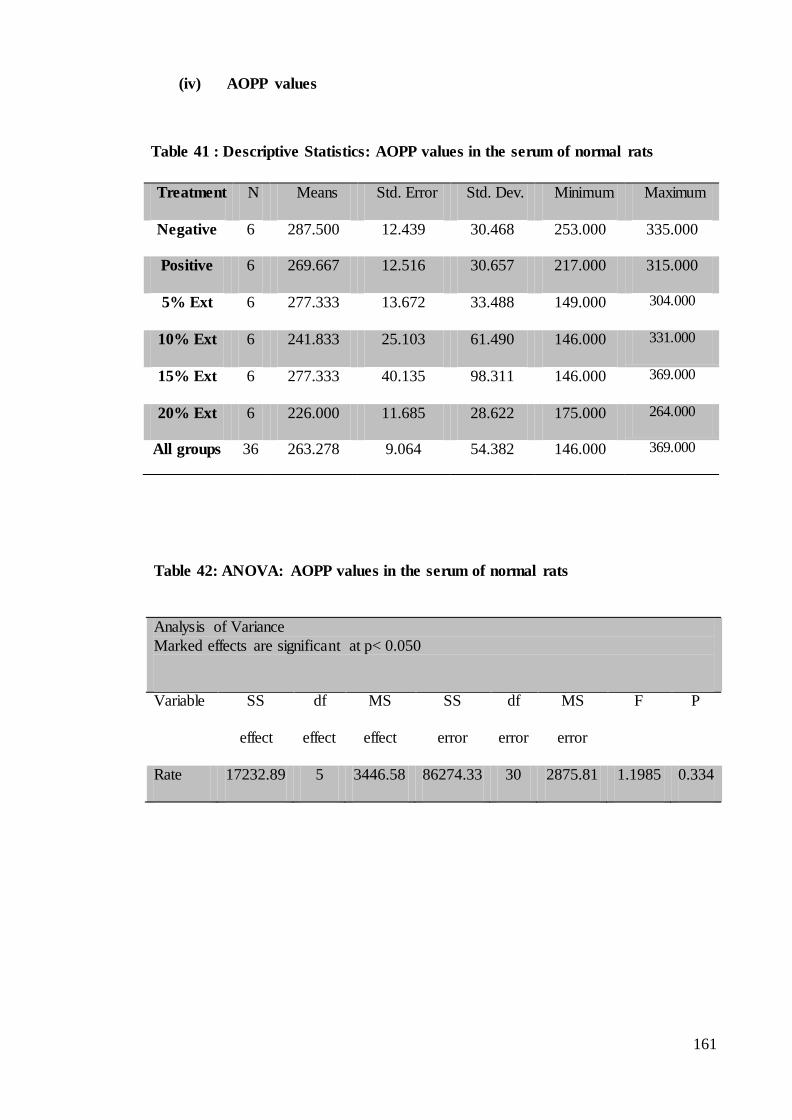
(iv) AOPP values
Table 42: ANOVA: AOPP values in the serum of normal rats
Analysis of Variance
Marked effects are significant at p< 0.050
Variable SS
effect
df
effect
MS
effect
SS
error
df
error
MS
error
F P
Rate 17232.89 5 3446.58 86274.33 30 2875.81 1.1985 0.334
Table 41 : Descriptive Statistics: AOPP values in the serum of normal rats
Treatment N Means Std. Error Std. Dev. Minimum Maximum
Negative 6 287.500 12.439 30.468 253.000 335.000
Positive 6 269.667 12.516 30.657 217.000 315.000
5% Ext 6 277.333 13.672 33.488 149.000 304.000
10% Ext 6 241.833 25.103 61.490 146.000 331.000
15% Ext 6 277.333 40.135 98.311 146.000 369.000
20% Ext 6 226.000 11.685 28.622 175.000 264.000
All groups 36 263.278 9.064 54.382 146.000 369.000

162
Table 43: Duncan Variable rate Tests: AOPP values in the serum of normal rats
Duncan test; variable rate (Spreadsheet)
Approximate Probabilities for Post Hoc tests Error: Between MS= 2875.8, df= 30.000
Cell
No.
Treatment (1)
287.50
(2)
269.67
(3)
277.33
(4)
241.83
(5)
277.33
(6)
226.00
1 Negative 0.605 0.760 0.198 0.745 0.089
2 Positive 0.605 0.806 0.376 0.818 0.193
3 5% Ext 0.760 0.806 0.288 1.000 0.140
4 10% Ext 0.198 0.376 0.288 0.305 0.613
5 15% Ext 0.745 0.818 1.000 0.305 0.148
6 20% Ext 0.089 0.193 0.140 0.613 0.148
Marked effects are significant at p< 0.050
Table 44: Dunnett Variable rate Test: AOPP values in the serum of normal rats
Cell No. Treatment (1)
287.50
1 Negative
2 Positive 0.968
3 5% Ext 0.997
4 10% Ext 0.452
5 15% Ext 0.997
6 20% Ext 0.197
Marked effects are significant at p< 0.050

163
Table 45: Descriptive Statistics: AOPP values in the serum of diabetic rats
Table 46: ANOVA: AOPP values in the serum of normal rats
Analysis of Variance Marked effects are significant at p< 0.050
Variable SS
effect
df
effect
MS
effect
SS
error
df
error
MS
error
F P
Rate 46820.56 5 9364.11 724278.3 30 24142.61 0.388 0.853
Treatment N Means Std. Error Std. Dev. Minimum Maximum
Negative 6 615.67 50.772 124.365 506.000 811.000
Positive 6 620.000 71.939 176.214 344.000 824.000
5% Ext 6 555.333 61.496 150.633 350.000 756.000
10% Ext 6 544.667 56.560 138.640 343.000 760.000
15% Ext 6 536.500 65.748 161.049 312.000 732.000
20% Ext 6 536.500 71.286 174.614 355.000 846.000
All groups 36 567.556 24.783 148.430 312.000 846.000
164
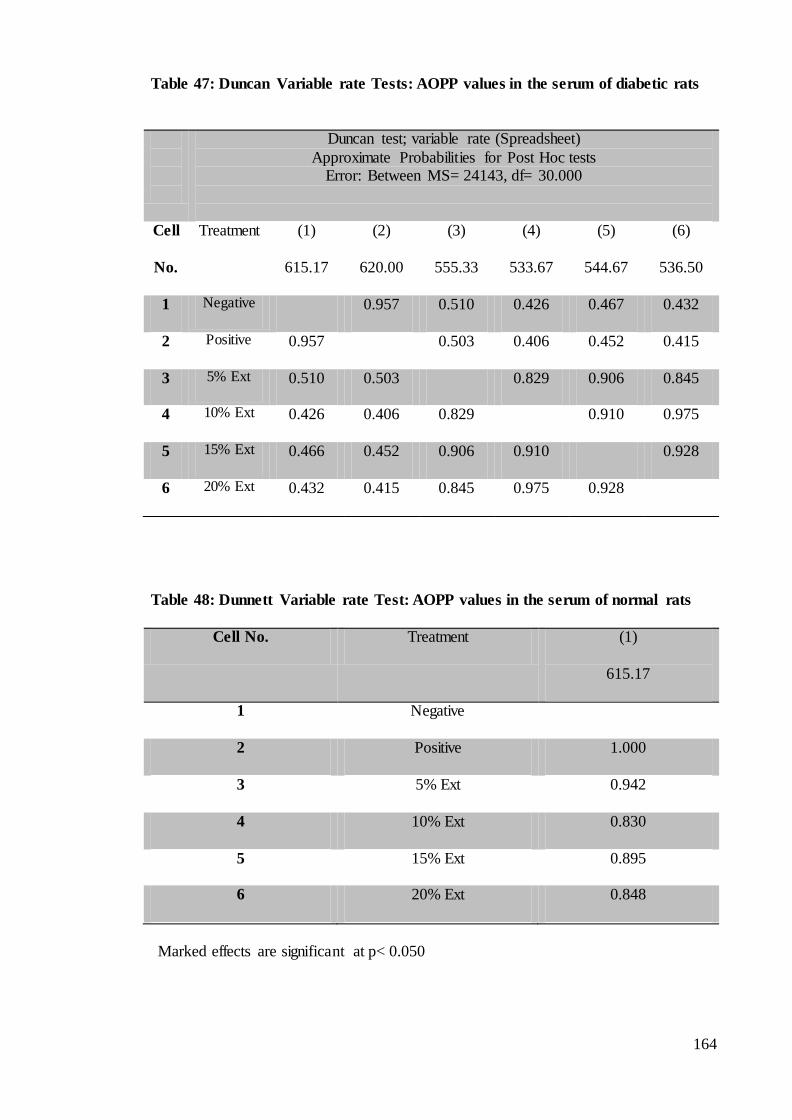
Table 47: Duncan Variable rate Tests: AOPP values in the serum of diabetic rats
Duncan test; variable rate (Spreadsheet)
Approximate Probabilities for Post Hoc tests Error: Between MS= 24143, df= 30.000
Cell
No.
Treatment (1)
615.17
(2)
620.00
(3)
555.33
(4)
533.67
(5)
544.67
(6)
536.50
1 Negative 0.957 0.510 0.426 0.467 0.432
2 Positive 0.957 0.503 0.406 0.452 0.415
3 5% Ext 0.510 0.503 0.829 0.906 0.845
4 10% Ext 0.426 0.406 0.829 0.910 0.975
5 15% Ext 0.466 0.452 0.906 0.910 0.928
6 20% Ext 0.432 0.415 0.845 0.975 0.928
Table 48: Dunnett Variable rate Test: AOPP values in the serum of normal rats
Cell No. Treatment (1)
615.17
1 Negative
2 Positive 1.000
3 5% Ext 0.942
4 10% Ext 0.830
5 15% Ext 0.895
6 20% Ext 0.848
Table 35: Duncan’s multiple range tests: AOPP values in diabetic rats
Marked effects are significant at p< 0.050

165
(v) LHP Value
Table 49: Descriptive Statistics: LHP values in the serum of normal rat
Table 50: ANOVA: LHP values in the serum of normal rats
Analysis of Variance
Marked effects are significant at p< 0.050
Variable SS
effect
df
effect
MS
effect
SS
error
df
error
MS
error
F P
Rate 3.858 5 0.772 120.020 30 4.000674 0.193 0.963
Treatment N Means Std. Error Std. Dev. Minimum Maximum
Negative 6 15.505 0.477 1.096 13.800 16.990
Positive 6 15.377 0.718 1.760 13.250 17.750
5% Ext 6 16.158 0.483 1.183 14.440 17.750
10% Ext 6 15.992 0.766 1.875 12.690 18.190
15% Ext 6 16.252 0.375 3.369 12.880 22.250
20% Ext 6 15.688 0.757 1.855 13.440 18.690
All groups 36 15.829 0.314 1.881 12.690 22.250

166
Table 51: Duncan Variable rate Tests: LHP values in the serum of normal rats
Duncan test; variable rate (Spreadsheet)
Approximate Probabilities for Post Hoc tests Error: Between MS=4.0007, df= 30.000
Cell
No.
Treatment (1)
15.505
(2)
15.377
(3)
16.158
(4)
15.992
(5)
16.252
(6)
15.688
1 Negative 0.912 0.612 0.695 0.571 0.875
2 Positive 0.912 0.553 0.633 0.513 0.802
3 5% Ext 0.612 0.553 0.886 0.936 0.705
4 10% Ext 0.695 0.633 0.886 0.834 0.794
5 15% Ext 0.571 0.513 0.936 0.834 0.662
6 20% Ext 0.875 0.802 0.705 0.795 0.662
Marked effects are significant at p< 0.050
Table 52: Dunnett Variable rate Test: LHP values in the serum of normal rats
Cell No. Treatment (1)
15.505
1 Negative
2 Positive 1.000
3 5% Ext 0.970
4 10% Ext 0.992
5 15% Ext 0.950
6 20% Ext 1.000
Table 53: Descriptive Statistics: LHP values in the serum of diabetic rats
Marked effects are significant at p< 0.050
167
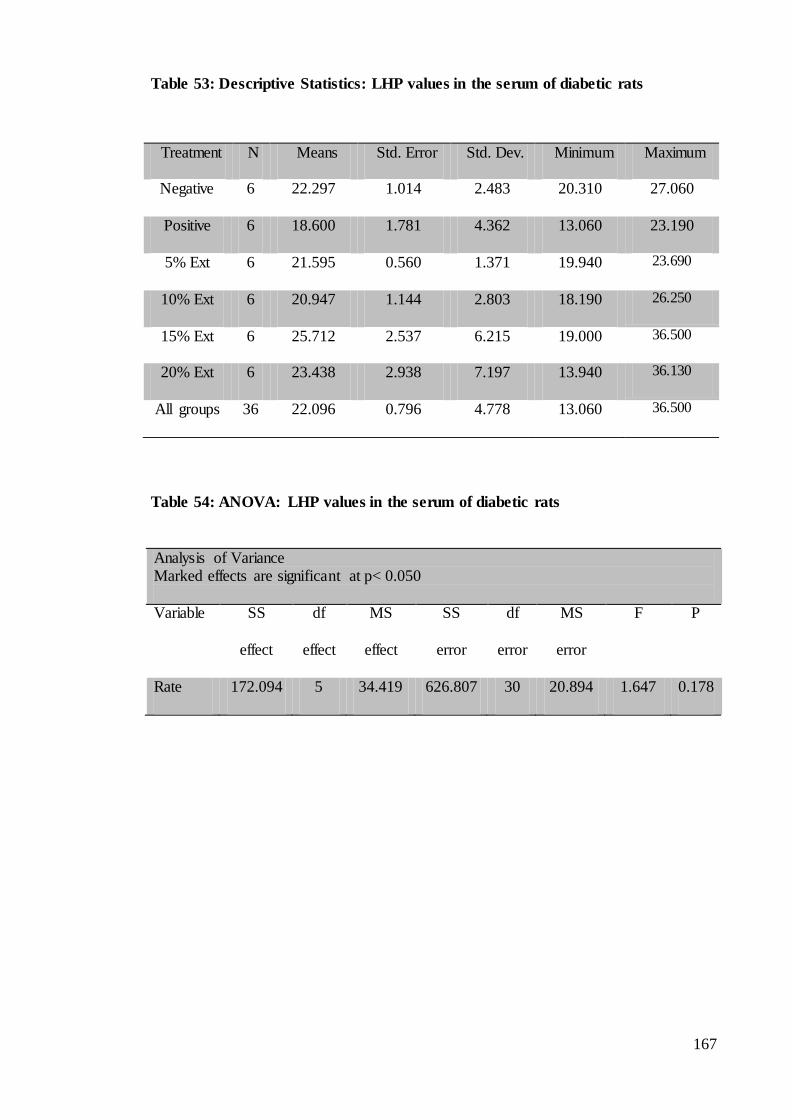
Table 53: Descriptive Statistics: LHP values in the serum of diabetic rats
Table 54: ANOVA: LHP values in the serum of diabetic rats
Analysis of Variance Marked effects are significant at p< 0.050
Variable SS
effect
df
effect
MS
effect
SS
error
df
error
MS
error
F P
Rate 172.094 5 34.419 626.807 30 20.894 1.647 0.178
Treatment N Means Std. Error Std. Dev. Minimum Maximum
Negative 6 22.297 1.014 2.483 20.310 27.060
Positive 6 18.600 1.781 4.362 13.060 23.190
5% Ext 6 21.595 0.560 1.371 19.940 23.690
10% Ext 6 20.947 1.144 2.803 18.190 26.250
15% Ext 6 25.712 2.537 6.215 19.000 36.500
20% Ext 6 23.438 2.938 7.197 13.940 36.130
All groups 36 22.096 0.796 4.778 13.060 36.500

168
Table 55: Duncan Variable rate Tests: LHP values in the serum of diabetic rats
Duncan test; variable rate (Spreadsheet) Approximate Probabilities for Post Hoc tests
Error: Between MS=20.894, df= 30.000
Cell
No.
Treatment (1) 22.297
(2) 18.600
(3) 21.595
(4) 20.947
(5) 25.712
(6) 23.428
1 Negative 0.211 0.792 0.634 0.232 0.671
2 Positive 0.211 0.293 0.381 0.022 0.111
3 5% Ext 0.792 0.293 0.808 0.164 0.519
4 10% Ext 0.634 0.381 0.808 0.116 0.400
5 15% Ext 0.232 0.022 0.164 0.116 0.394
6 20% Ext 0.671 0.111 0.519 0.400 0.394
Table 56: Dunnett Variable rate Test: LHP values in the serum of normal rats
Cell No. Treatment (1) 22.297
1 Negative
2 Positive 0.500
3 5% Ext 0.999
4 10% Ext 0.980
5 15% Ext 0.573
6 20% Ext 0.991
Marked effects are significant at p< 0.050

169
Appendix C: Raw Data
Table 1: Streptozotocin injection and Blood Glucose Reading
Rats Body Weight/g STZ Injection/ mL
Blood Glucose Mmol/L
1 188 0.19 7.0
2 151 0.15 15.2
3 194 0.19 25.8
4 211 0.21 22.9
5 169 0.17 4.2
6 209 0.21 18.2
7 188 0.19 7.0
8 156 0.16 11.4
9 208 0.21 5.4
10 198 0.20 18.1
11 169 0.17 18.4
12 159 0.16 22.2
13 175 0.18 6.9
14 156 0.16 11.4
15 177 0.18 9.9
16 201 0.20 18.3
17 190 0.19 19.9
18 163 0.16 4.7
19 160 0.16 25.8
20 190 0.19 27.2
21 177 0.18 9.9
22 159 0.16 6.7
23 164 0.16 23.1
24 188 0.19 22.6
25 274 0.27 21.3
26 176 0.18 18.9
27 156 0.16 22.8
28 159 0.16 6.7
29 163 0.15 19.9
30 152 0.15 19.6
331 178 0.15 14.9
32 163 0.15 19.8
33 153 0.15 24.7
34 149 0.16 25.1
35 149 0.15 25.0
36 135 0.15 14.7
37 141 0.15 16.2
38 145 0.15 23.3
39 141 0.15 12.1
40 151 0.15 16.7
41 155 0.16 13.1
42 150 0.15 14.7

170
Table 2: Record of body weight before and after experiment for normal rats
Rats B. Wt before/ g B. Wt after/ g
1 154 206
2 173 284
3 168 170
4 132 216
5 122 155
6 149 204
7 120 163
8 121 103
9 127 176
10 159 190
11 152 272
12 164 271
Table 3: Record of body weight before and after experiment for diabetic rats
Replicate B. Wt before/ g B. Wt after/ g
1 164 133
2 188 157
3 194 183
4 211 189
5 165 165
6 209 195
7 163 172
8 152 150
9 162 158
10 160 134
11 153 139
12 190 132
Table 4: Body weight of normal rats at day 1, day 7 and day 14
Rats Day 0 Day 7 Day 14 1 154 178 206
2 173 220.5 250 3 127 150 176 4 132 190 216 5 159 179 190 6 149 170 204

171
Table 5: Body weight of diabetic rats at day 1, day 7 and day 14
Rats Day 0 Day 7 Day 14
1 164 159 133
2 188 167 157
3 194 181 183
4 211 197 189
5 165 157 149
6 209 202 195
Table 6: Blood glucose reading of STZ-induced rats on day 7 post-injection
B.G. Day 7 Negative Positive 5% 10% 15% 20%
15.2 19.9 23.1 9.9 22.3 21.8
17.4 19.6 22.6 18.3 27 18.9
9.7 14.9 25.8 19.9 17.9 26.7
18.2 19.8 22.9 22.8 24.3 21.9
21.6 24.7 18.1 25.8 24.1 33.3
33.3 25.1 18.2 27.2 25.4 20.1
Table 7: Period of re-epithelialisation (normal rats)
Replicate Negative Positive 5% Ext 10% Ext 15% Ext 20% Ext
1 13.00 13.00 13.00 11.00 12.00 11.00
2 13.00 13.00 13.00 13.00 12.00 14.00
3 13.00 12.00 14.00 13.00 13.00 12.00
4 13.00 13.00 13.00 12.00 11.00 14.00
5 13.00 13.00 13.00 12.00 14.00 12.00
6 14.00 13.00 14.00 12.00 14.00 12.00
Table 8: Period of re-epithelialisation (diabetic rats)
Replicate Negative Positive 5% 10% 15% 20%
1 17.00 13.00 15.00 13.00 13.00 13.00
2 15.00 15.00 13.00 13.00 13.00 13.00
3 15.00 15.00 14.00 12.00 15.00 13.00
4 14.00 15.00 14.00 13.00 14.00 12.00
5 17.00 15.00 13.00 13.00 14.00 13.00
6 14.00 16.00 13.00 13.00 15.00 14.00

172
Table 9: Rate of wound closure (mm2) treated with aqueous cream (normal rats)
Replicate Day 4 Day 8 Day 12
1 13.89 96.15 243.06
2 17.25 95.00 212.73
3 17.50 142.86 217.50
4 20.00 93.75 235.29
5 13.89 87.50 234.38
6 10.87 100.00 217.39
Table 10: Rate of wound closure (mm2) treated with intrasite gel (normal rats)
Replicate Day 4 Day 8 Day 12
1 71.43 152.25 230.77
2 98.73 133.33 225.00
3 90.00 160.71 250.00
4 102.94 171.88 242.19
5 73.53 187.50 243.75
6 93.75 175.00 250.00
Table 11: Rate of wound closure (mm2) treated with 5% mushroom extract
(normal rats)
Replicate Day 4 Day 8 Day 12
1 37.50 152.78 214.25
2 38.82 197.37 250.00
3 39.47 157.89 212.50
4 32.00 163.89 222.22
5 44.44 194.44 250.00
6 51.09 166.30 250.00
Table 12: Rate of wound closure (mm2) treated with 10% mushroom extract
(normal rats)
Replicate Day 4 Day 8 Day 12
1 56.82 161.76 250.00
2 90.00 161.76 246.25
3 69.12 189.50 250.00
4 64.00 153.57 245.00
5 81.82 193.18 250.00
6 90.00 175.00 245.00

173
Table 13: Rate of wound closure (mm2) treated with 15% mushroom extract
(normal rats)
Replicate Day 4 Day 8 Day 12
1 78.13 205.63 240.63
2 57.50 150.00 239.29
3 59.09 215.91 250.00
4 56.82 185.00 250.00
5 90.00 193.18 224.98
6 43.75 204.55 238.64
Table 14: Rate of wound closure (mm2) treated with 20% mushroom extract
(normal rats)
Replicate Day 4 Day 8 Day 12
1 78.13 205.63 240.63
2 57.50 125.00 239.29
3 59.09 215.91 250.00
4 50.00 193.18 250.00
5 62.50 193.18 232.95
6 90.00 204.55 238.64
Table 15: Rate of wound closure (mm2) treated with aqueous cream (diabetic
rats)
Replicate Day 4 Day 8 Day 12
1 -125.00 32.00 125.00
2 -150.00 31.25 156.25
3 -138.24 44.12 161.76
4 -126.47 44.12 191.18
5 -105.56 39.75 138.89
6 -114.71 44.12 161.76
Table 16: Rate of wound closure (mm2) treated with intrasite gel (diabetic rats)
Replicate Day 4 Day 8 Day 12
1 38.46 107.14 142.86
2 37.50 113.64 159.09
3 40.75 150.00 166.67
4 53.13 161.76 191.18
5 50.00 132.35 191.18
6 75.00 156.25 203.13

174
Table 17: Rate of wound closure (mm2) treated with 5% mushroom extract
(diabetic rats)
Replicate Day 4 Day 8 Day 12
1 -22.50 100.00 220.00
2 -18.75 107.14 178.57
3 -16.67 125.00 216.67
4 -15.63 118.75 187.50
5 -16.67 125.00 250.00
6 -16.67 150.00 250.00
Table 18: Rate of wound closure (mm2) treated with 10% mushroom extract
(diabetic rats)
Replicate Day 4 Day 8 Day 12
1 27.78 166.67 250.00
2 22.73 136.36 230.00
3 20.00 125.00 240.00
4 25.00 150.00 245.00
5 22.22 166.67 237.50
6 25.00 150.00 250.00
Table 19: Rate of wound closure (mm2) treated with 15% mushroom extract
(diabetic rats)
Replicate Day 4 Day 8 Day 12
1 16.00 125.00 225.00
2 18.42 131.58 223.68
3 27.78 111.11 222.22
4 25.00 109.38 187.50
5 17.50 100.00 200.00
6 20.00 87.50 225.00
Table 20: Rate of wound closure (mm2) treated with 20% mushroom extract
(diabetic rats)
Replicate Day 4 Day 8 Day 12
1 10.00 100.00 225.00
2 20.00 83.33 222.22
3 15.00 100.00 225.00
4 16.67 145.83 250.00
5 8.33 93.75 229.17
6 16.67 83.33 208.33
175
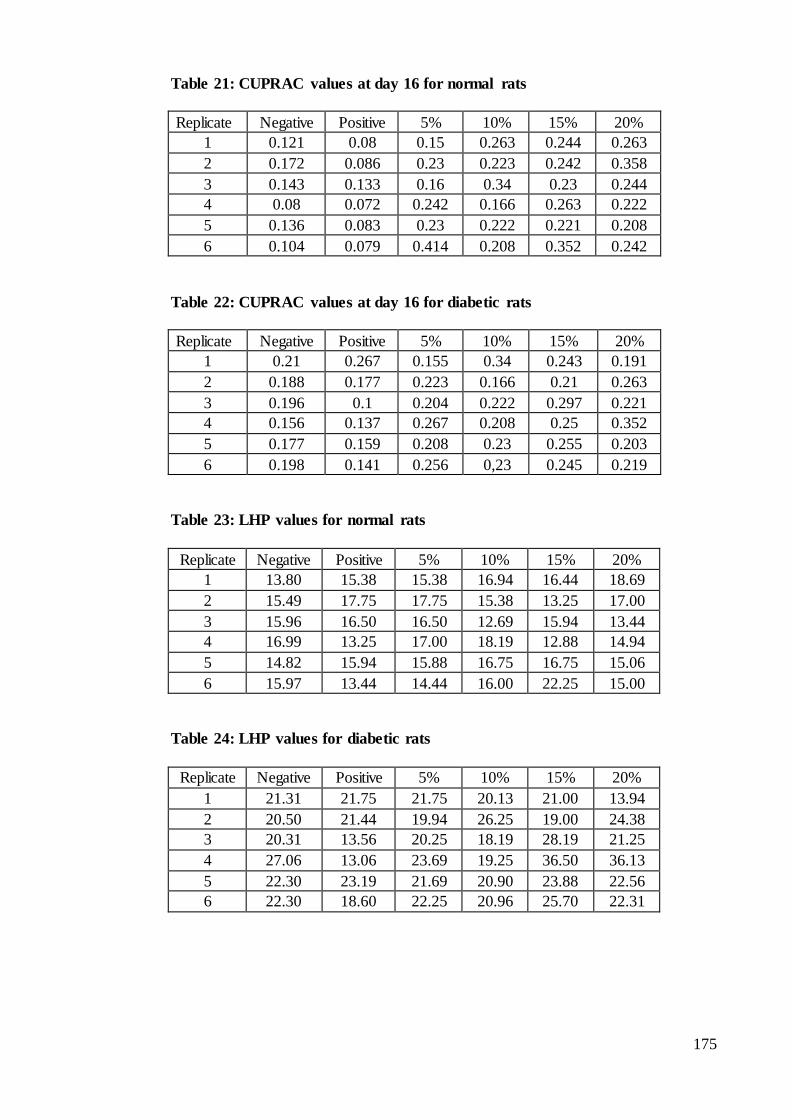
Table 21: CUPRAC values at day 16 for normal rats
Replicate Negative Positive 5% 10% 15% 20%
1 0.121 0.08 0.15 0.263 0.244 0.263
2 0.172 0.086 0.23 0.223 0.242 0.358
3 0.143 0.133 0.16 0.34 0.23 0.244
4 0.08 0.072 0.242 0.166 0.263 0.222
5 0.136 0.083 0.23 0.222 0.221 0.208
6 0.104 0.079 0.414 0.208 0.352 0.242
Table 22: CUPRAC values at day 16 for diabetic rats
Replicate Negative Positive 5% 10% 15% 20%
1 0.21 0.267 0.155 0.34 0.243 0.191
2 0.188 0.177 0.223 0.166 0.21 0.263
3 0.196 0.1 0.204 0.222 0.297 0.221
4 0.156 0.137 0.267 0.208 0.25 0.352
5 0.177 0.159 0.208 0.23 0.255 0.203
6 0.198 0.141 0.256 0,23 0.245 0.219
Table 23: LHP values for normal rats
Replicate Negative Positive 5% 10% 15% 20%
1 13.80 15.38 15.38 16.94 16.44 18.69
2 15.49 17.75 17.75 15.38 13.25 17.00
3 15.96 16.50 16.50 12.69 15.94 13.44
4 16.99 13.25 17.00 18.19 12.88 14.94
5 14.82 15.94 15.88 16.75 16.75 15.06
6 15.97 13.44 14.44 16.00 22.25 15.00
Table 24: LHP values for diabetic rats
Replicate Negative Positive 5% 10% 15% 20%
1 21.31 21.75 21.75 20.13 21.00 13.94
2 20.50 21.44 19.94 26.25 19.00 24.38
3 20.31 13.56 20.25 18.19 28.19 21.25
4 27.06 13.06 23.69 19.25 36.50 36.13
5 22.30 23.19 21.69 20.90 23.88 22.56
6 22.30 18.60 22.25 20.96 25.70 22.31

176
Table 25: AOPP values for normal rats
Replicate Negative Positive 5% 10% 15% 20%
1 288 260 212 331 159 229
2 292 280 286 265 345 231
3 256 265 297 149 325 175
4 253 305 275 261 146 264
5 301 217 290 241 369 227
6 335 291 304 204 320 230
Table 26: AOPP values for diabetic rats
Replicate Negative Positive 5% 10% 15% 20%
1 811 598 680 576 312 564
2 550 824 560 508 455 559
3 506 598 756 459 719 846
4 534 344 555 343 500 390
5 730 800 350 760 732 355
6 560 556 431 556 550 505