Appendix 5.4a Construction Methodology - epd.gov.hk · Public Fill 91.98 91.98 87.91 87.91 82.73...
16
Appendix 5.4a Construction Methodology
Transcript of Appendix 5.4a Construction Methodology - epd.gov.hk · Public Fill 91.98 91.98 87.91 87.91 82.73...

Appendix 5.4a
Construction Methodology


Month 15
May 2018 to November 2018
Silt Curtain
A5
A2A3
A5
ID Activities
A1 Silt CurtainA2 Stone Column & Seawall Construction
A3 Stone Column & Seawall Construction &Geotextile/Sand Blanket & Marine Band Drains
A4 Geotextile/Sand Blanket & Marine Band Drains
A5Geotextile/Sand Blanket & Marine Band Drains &Under water Reclamation Filling
A6 Under water Reclamation FillingA7 Above water Reclamation FillingA8 Surcharge
A5
A2
ID Activities
B1 High PR Residential Foundations
B2 High PR Residential Foundations &High PR Residential Superstructure
B3 High PR Residential SuperstructureC1 Medium PR Residential/GIC Foundations
C2
Medium PR Residential/GIC Foundations &Medium PR Residential/GIC Superstructure
C3 Medium PR Residential/GIC Superstructure
Silt Curtain
SeawallFillingAbove waterTentative location for access for silt curtain
Legends
Schematic Diagram of Key Construction Phases

Month 21 May 2019 to November 2019
Silt Curtain
ID Activities
A1 Silt CurtainA2 Stone Column & Seawall Construction
A3 Stone Column & Seawall Construction &Geotextile/Sand Blanket & Marine Band Drains
A4 Geotextile/Sand Blanket & Marine Band Drains
A5Geotextile/Sand Blanket & Marine Band Drains &Under water Reclamation Filling
A6 Under water Reclamation FillingA7 Above water Reclamation FillingA8 Surcharge
ID Activities
B1 High PR Residential Foundations
B2 High PR Residential Foundations &High PR Residential Superstructure
B3 High PR Residential SuperstructureC1 Medium PR Residential/GIC Foundations
C2
Medium PR Residential/GIC Foundations &Medium PR Residential/GIC Superstructure
C3 Medium PR Residential/GIC Superstructure
A6
A6
A5A7A7
A4
A5
A4A4
A2
A4A4A4
A4
Silt Curtain
SeawallFillingAbove waterTentative location for access for silt curtain
Legends

November 2019 to May 2020
Silt Curtain
ID Activities
A1 Silt CurtainA2 Stone Column & Seawall Construction
A3 Stone Column & Seawall Construction &Geotextile/Sand Blanket & Marine Band Drains
A4 Geotextile/Sand Blanket & Marine Band Drains
A5Geotextile/Sand Blanket & Marine Band Drains &Under water Reclamation Filling
A6 Under water Reclamation FillingA7 Above water Reclamation FillingA8 Surcharge
ID Activities
B1 High PR Residential Foundations
B2 High PR Residential Foundations &High PR Residential Superstructure
B3 High PR Residential SuperstructureC1 Medium PR Residential/GIC Foundations
C2
Medium PR Residential/GIC Foundations &Medium PR Residential/GIC Superstructure
C3 Medium PR Residential/GIC Superstructure
A7
A7
A6A8A8
A4
A5
A5A5
A4
A4A4A5
A5
Month 31
Silt Curtain
SeawallFillingAbove water
Tentative location for access for silt curtain
Legends
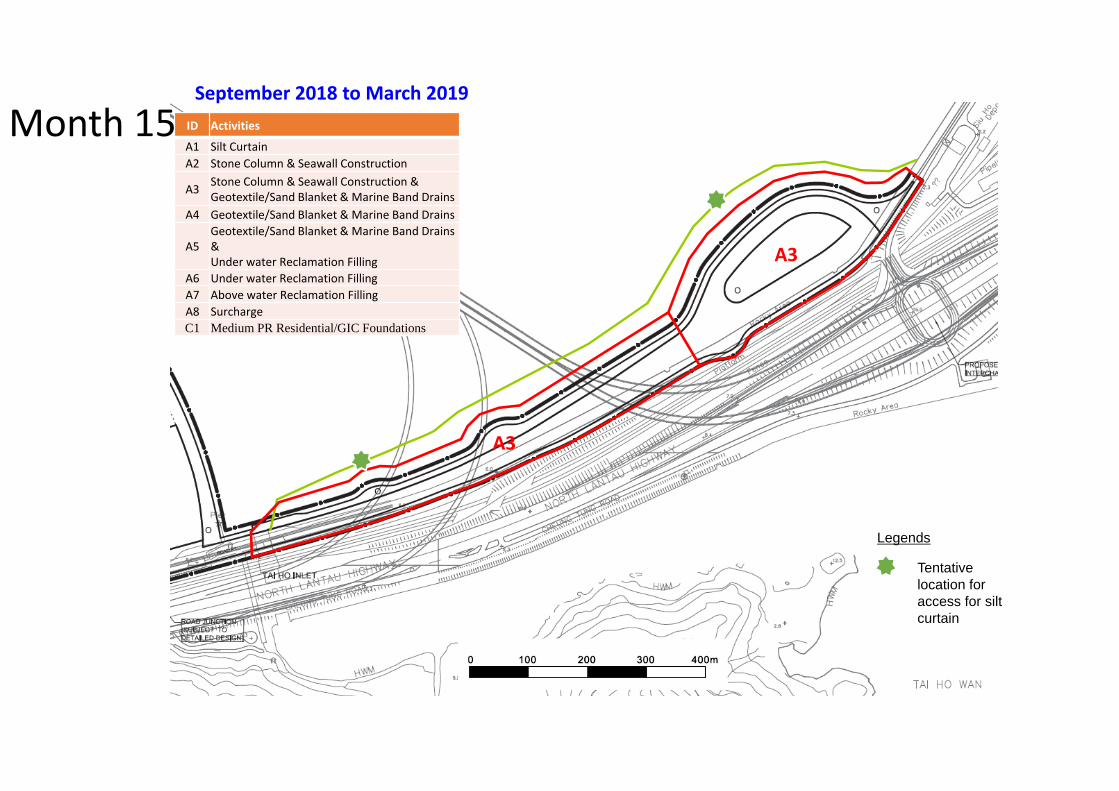
September 2018 to March 2019
A3
A3
ID Activities
A1 Silt CurtainA2 Stone Column & Seawall Construction
A3 Stone Column & Seawall Construction &Geotextile/Sand Blanket & Marine Band Drains
A4 Geotextile/Sand Blanket & Marine Band Drains
A5Geotextile/Sand Blanket & Marine Band Drains &Under water Reclamation Filling
A6 Under water Reclamation FillingA7 Above water Reclamation FillingA8 SurchargeC1 Medium PR Residential/GIC Foundations
Month 15
Tentative location for access for silt curtain
Legends

Month 21March 2019 to September 2019
A5
A5
ID Activities
A1 Silt CurtainA2 Stone Column & Seawall Construction
A3 Stone Column & Seawall Construction &Geotextile/Sand Blanket & Marine Band Drains
A4 Geotextile/Sand Blanket & Marine Band Drains
A5Geotextile/Sand Blanket & Marine Band Drains &Under water Reclamation Filling
A6 Under water Reclamation FillingA7 Above water Reclamation FillingA8 SurchargeC1 Medium PR Residential/GIC Foundations
Tentative location for access for silt curtain
Legends

Stage 1: Lay geotextile and deposit rock fill (gravel) blanket
Stage 2: Install stone columns by marine based plant
EXISTINGSEABED
GEOTEXTILE ROCK FILL BLANKET
EXISTINGSEABED
GEOTEXTILE ROCK FILL BLANKET
PROPOSED GROUND IMPROVEMENT WORKS
Non-dredged Seawall Construction Sequence

Stage 3: Install pipe pile structures
Stage 4: Fill inside pipe pile structures (tie not included)
EXISTINGSEABED
GEOTEXTILE ROCK FILL BLANKET
PROPOSED GROUND IMPROVEMENT WORKS
PIPE PILE WALL
PIPE PILE WALL
EXISTINGSEABED
GEOTEXTILE ROCK FILL BLANKET
PROPOSED GROUND IMPROVEMENT WORKS
PIPE PILE WALL
PIPE PILE WALL
FILL

Stage 5: Install corrosion protection system (if necessary) and construct capping beam
Stage 6: Construct sloping berm in front of pipe pile structure (as necessarily)
EXISTINGSEABED
GEOTEXTILE ROCK FILL BLANKET
PROPOSED GROUND IMPROVEMENT WORKS
PIPE PILE WALL
PIPE PILE WALL
FILL
EXISTINGSEABED
GEOTEXTILE
PROPOSED GROUND IMPROVEMENT WORKS
PIPE PILE WALL
PIPE PILE WALL
FILL UNDERLAYER
ROCK FILL
UNDERLAYER
ROCK ARMOUR
ROCK ARMOUR
UNDERLAYER
PUBLIC FILL
GEOTEXTILE
ROCK FILL BLANKET
GEOTEXTILE
SAND FILL

Pipe Pile
Fill Marine Deposit
Stone Column
Cope Line
Schematic Layout

Extent of Non‐dredged Seawall
Plan

Sediment Release due to TCE Reclamation and P1 Road Reclamation
Q3 Q4 Q1 Q2 Q3 Q4 Q1 Q2 Q3 Q4 Q1 Q2 Q3 Q4 Q1 Q2 Q3 Q4 Q1 Q2 Q3 Q42017 2017 2018 2018 2018 2018 2019 2019 2019 2019 2020 2020 2020 2020 2021 2021 2021 2021 2022 2022 2022 2022
Tung Chung East Reclamation (m3/ quarter of a year)Public Fill 780000 780000 780000 780000 760000 760000 1040000 1040000 1040000 1040000 1040000 1040000 780000 780000Sand 130000 130000 390000 390000 390000 390000 400000 400000
Road P1 ReclamationPublic Fill 65000 65000 27620 27620Sand 12500 12500 9370 9370 9370 9370
Filling Rate [2] (t/d)Public Fill 24325.76 24325.76 23249.67 23249.67 21878.79 21878.79 29939.39 29939.39 29939.39 29939.39 29939.39 29939.39 22454.55 22454.55Sand 3309.09 3309.09 10245.45 10245.45 10165.78 10165.78 10420.33 10420.33Total 3309.09 3309.09 34571.21 34571.21 33415.45 33415.45 32299.12 32299.12 29939.39 29939.39 29939.39 29939.39 29939.39 29939.39 22454.55 22454.55
Sediment Release Rate (t/d, Unmitigated scenario with seawall reduction only)Public Fill 167.24 167.24 159.84 159.84 150.42 150.42 205.83 205.83 205.83 205.83 205.83 205.83 154.38 154.38Sand 4.55 4.55 14.09 14.09 13.98 13.98 14.33 14.33Total 4.55 4.55 181.33 181.33 173.82 173.82 164.74 164.74 205.83 205.83 205.83 205.83 205.83 205.83 154.38 154.38
Sediment Release Rate (t/d, Mitigated scenario with seawall and slit curtain reduction) [1]
Public Fill 91.98 91.98 87.91 87.91 82.73 82.73 113.21 113.21 113.21 113.21 113.21 113.21 84.91 84.91Sand 2.50 2.50 7.75 7.75 7.69 7.69 7.88 7.88Total 2.50 2.50 99.73 99.73 95.60 95.60 90.61 90.61 113.21 113.21 113.21 113.21 113.21 113.21 84.91 84.91
Density (kg/m3)
Fine Content Loss Rate
Sea Wall Reduction
Rate
Slit Curtain Reduction
Rate
Release rate
(kg/m3)
Release rate
Unmit (kg/m3)
Daily Factor
Public Fill 1900 25% 5% 45% 45% 7.18 13.06 1.52E-05Sand 1680 5% 5% 45% 45% 1.27 2.31 =1/(1000x3x22)
Note:[1] Sediment Release of Public Fill =(Public Fill (m3) in bulk vol of TCE + Public Fill (m3) in bulk vol of P1 Road )* Density (kg/m3) * Fine Content (%) *
Loss Rate (%) * (1-Sea Wall Reduction Rate) (%) * (1-Slit Curtain Reduction Rate) (%) / (Number of Month * Working day per month)e.g,
=(1040000+0)*1900*25%*5%*(1-45%)*(1-45%)/(3*22)=113208.3 kg/d=113.2083 t/d
[2] The estimated filling rate is calculated based on 22 working days per month, however 7 working days per week is assumed in the modelling for conservative assessment.
Sediment Release rate of Public Fill in Q2/2020 (Mitigated with slit curtain)

0
500
1000
1500
2000
2500
3000
3500
4000
4500
5000
0
50
100
150
200
250
300
350
400
450
500
Total sed
imen
t release ra
te (3
RS and
CMP) (t/d)
Total sed
imen
t release ra
te (TCE
and
Roa
d P1
) (t/d)
ComparisonofSedimentReleaseRatesfor3rdRunway,CMPandTungChungReclamation(TCEandRoadP1)
TCE+P1 (Public Fill) TCE+Road P1 (Sand) TCE+Road P1 (Total) 3RS CMP (EP) CMP (Forecast)

10
Water Quality - SS Release Rate in CMPs by EP
- Dredging- Upper limit of EP: 100,000 m3/ week = 14,286 m3/day- Sediment loss rate: 17 kg/m3
- Sediment release rate = 14,286 x 17 = 243 tonne/day
- Backfilling/ Capping- Upper limit of EP: 26,700 m3/day- Dry density of material: 750 kg/m3
- Loss rate to suspension from barge bottom dumping: 3%- Barge capacity: 650 m3
- No of barge per day: 41
- Sediment loss per barge = 650 x 750 x 3% = 14,625kg/ barge- Sediment release rate = 14,625 x 41 = 599 tonne/day
Work schedule for ESC CMPs and SB CMPs from EM&A report (Jun 2015)
EP Limittonne/
day
Dredging100,000 m3/week
243
Backfilling 26,700 m3/day 599
Capping 26,700 m3/day 599
11
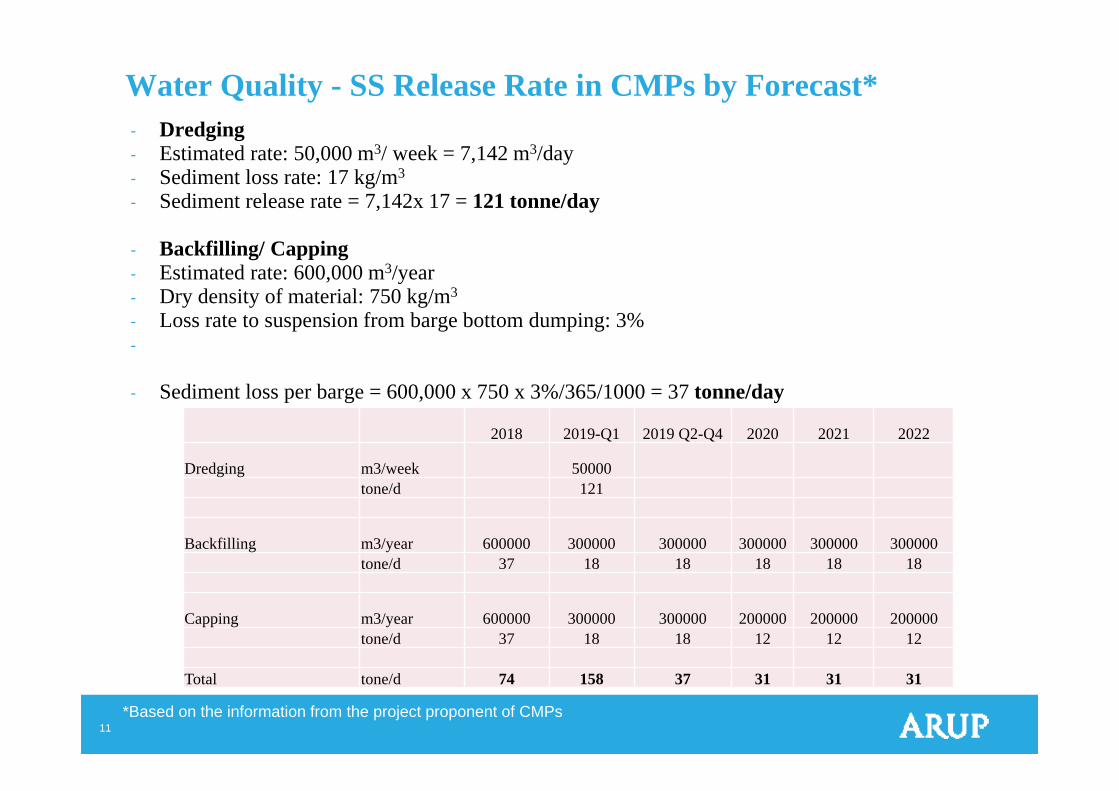
Water Quality - SS Release Rate in CMPs by Forecast*- Dredging- Estimated rate: 50,000 m3/ week = 7,142 m3/day- Sediment loss rate: 17 kg/m3
- Sediment release rate = 7,142x 17 = 121 tonne/day
- Backfilling/ Capping- Estimated rate: 600,000 m3/year- Dry density of material: 750 kg/m3
- Loss rate to suspension from barge bottom dumping: 3%-
- Sediment loss per barge = 600,000 x 750 x 3%/365/1000 = 37 tonne/day
2018 2019-Q1 2019 Q2-Q4 2020 2021 2022
Dredging m3/week 50000tone/d 121
Backfilling m3/year 600000 300000 300000 300000 300000 300000tone/d 37 18 18 18 18 18
Capping m3/year 600000 300000 300000 200000 200000 200000tone/d 37 18 18 12 12 12
Total tone/d 74 158 37 31 31 31
*Based on the information from the project proponent of CMPs