Appendix 3 Energy (Fugitive Emissions) - Defra, UK · Appendix 3 Energy (Fugitive Emissions)...
30
AEAT/R/ENV/0524 Issue 1 AEA Technology A3.1 Appendix 3 Energy (Fugitive Emissions) CONTENTS 1 INTRODUCTION 2 2 COAL MINING 2 3 SOLID FUEL TRANSFORMATION 3 3.1 Coke Production 3 3.2 Solid Smokeless Fuel Production 4 4 OIL AND NATURAL GAS 5 4.1 Offshore Flaring 6 4.2 Offshore Own Gas Use 7 4.3 Well Testing 8 4.4 Other Emissions from Platforms and Terminals 8 4.5 Loading Emissions 9 4.6 Leakage from the Gas Transmission System. 9 4.7 Petrol Distribution 10 4.8 Refineries and Processes 10 5 REFERENCES 11
Transcript of Appendix 3 Energy (Fugitive Emissions) - Defra, UK · Appendix 3 Energy (Fugitive Emissions)...

AEAT/R/ENV/0524 Issue 1
AEA Technology A3.1
Appendix 3Energy (FugitiveEmissions)CONTENTS
1 INTRODUCTION 2
2 COAL MINING 2
3 SOLID FUEL TRANSFORMATION 3
3.1 Coke Production 3
3.2 Solid Smokeless Fuel Production 4
4 OIL AND NATURAL GAS 5
4.1 Offshore Flaring 6
4.2 Offshore Own Gas Use 7
4.3 Well Testing 8
4.4 Other Emissions from Platforms and Terminals 8
4.5 Loading Emissions 9
4.6 Leakage from the Gas Transmission System. 9
4.7 Petrol Distribution 10
4.8 Refineries and Processes 10
5 REFERENCES 11

AEAT/R/ENV/0524 Issue 1
AEA Technology A3.2
1 Introduction
This Appendix outlines the emissions of greenhouse gases arising from the production,extraction of coal, oil and natural gas, their storage, processing and distribution. These emissionsare fugitive emissions and are reported in IPCC Table 1B. Emissions from fuel combustionduring these processes are reported in IPCC Table 1A and are described in Appendix 2. Incertain cases the methodology of some of these fuel combustion emissions are discussed in thisAppendix, because they have links with the methodologies used for fugitive emissions.
2 Coal Mining
The NAEI reports emissions of methane from coal mining in the categories Deep Mined Coal;Coal Storage and Transport; Open Cast Coal. These map onto the IPCC categories 1B1aUnderground Mines-mining, 1B1ai Underground Mines-post-mining and 1B1a Surface Minesrespectively. Emissions are calculated from saleable coal production statistics reported in DTI,(2000). Data on the shallower licensed mines are not published and were supplied to us byBarty (1995) up to 1994. Licensed mines referred to privately owned mines and were generallysmaller and shallower than the nationalised mines. The distinction was sufficiently marked toallow the use of a separate emission factor. Following privatisation, the distinction betweenlicensed mines and deep mines no longer exists. For 1995, data from 1994 were used but insubsequent years the distinction has been abandoned. The emission factors used are shown inTable 1. Table 1 Methane Emission Factors for Coal Mining (kg/t coal)
1990 1991 1992 1993-97 1998 1999 Deep Mined 10.1a 10.3a 11.1a 13.4b 13.4c 13.5c
Coal Storage &Transporta
1.16 1.16 1.16 1.16 1.16 1.16
Licensed Mined 1.36 1.36 1.36 1.36 - - Open Cast d 0.34 0.34 0.34 0.34 0.34 0.34
a Bennet et al (1995) b Value for 1998 assumed c Estimated factor based on RJB (2000) data. d Williams (1993) The licensed and open cast factors are taken from Williams (1993). The deep mined factors for1990 -1992 and the coal storage factor are taken from Bennet et al (1995). This was a study ondeep mines which produced estimates of emissions for the period 1990-93. This was a periodover which mines were being closed, hence the variation in emission factors. The emissionfactors for 1998-99 are based on operator's measurements of the methane extracted by the mineventilation systems. The mines surveyed cover around 90% of deep mined production. Notime dependent data are available for 1993-97, so the 1998 factor was used. Methane extractedis either emitted to atmosphere or utilized for energy production. Methane is not flared for
AEAT/R/ENV/0524 Issue 1
AEA Technology A3.3
safety reasons. The factors reported in Table 1 refer to emissions and exclude the methaneutilised. The coal storage and transport factor is only applied to deep mined coal production. The activity data for the coal mining emissions are reported in the CRF tables attached as a CDROM to this report. It should be noted that the number of active deep mines reported isdefined as the number of mines producing at any one time during the period. (Coal Authority,2000). Hence, this would include large mines as well as small ones or those that only producedfor part of the year. The data supplied in previous inventories, were the number of major sitesoperating. The colliery methane utilization data are taken from DTI (2000). These estimates only include emissions from working mines and exclude closed mines. It waspreviously believed that emissions became negligible once a coal mine closed, particularly if themine flooded (Williams, 1993). However, a recent review sponsored by DETR, suggests thatthese emissions may be significant. (Sage, 2001). A number of estimates have been maderanging from 20 to 300 kt methane in 1999. More research is required to obtain a reliableestimate.
3 Solid Fuel Transformation
This section discusses fugitive emissions from solid fuel transformation processes. Theseemissions are reported in IPCC category 1B1b. The IPCC Revised 1996 Guidelines do notprovide any methodology for such estimates, hence emissions are largely based on defaultemission factors and the need to avoid double counting CO2 emissions. Combustion emissionsfrom these processes are discussed in Appendix 2.
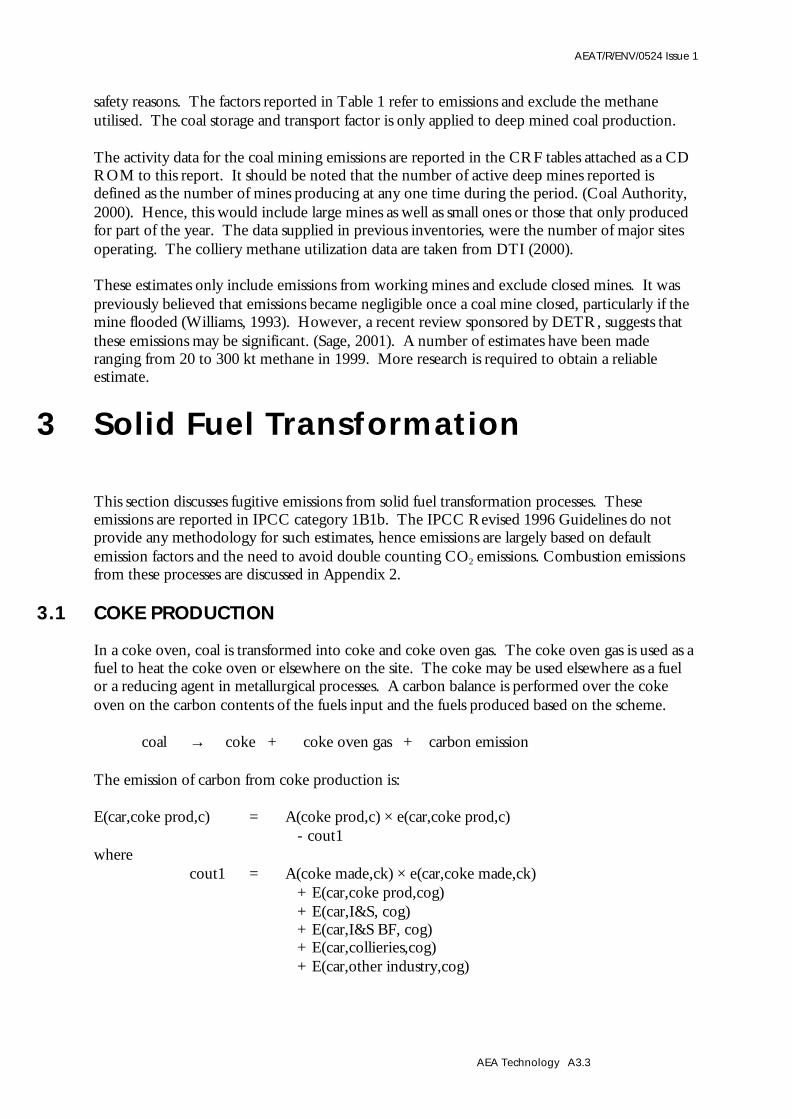
3.1 COKE PRODUCTION
In a coke oven, coal is transformed into coke and coke oven gas. The coke oven gas is used as afuel to heat the coke oven or elsewhere on the site. The coke may be used elsewhere as a fuelor a reducing agent in metallurgical processes. A carbon balance is performed over the cokeoven on the carbon contents of the fuels input and the fuels produced based on the scheme. coal → coke + coke oven gas + carbon emission The emission of carbon from coke production is: E(car,coke prod,c) = A(coke prod,c) × e(car,coke prod,c) - cout1 where cout1 = A(coke made,ck) × e(car,coke made,ck) + E(car,coke prod,cog) + E(car,I&S, cog) + E(car,I&S BF, cog) + E(car,collieries,cog) + E(car,other industry,cog)
AEAT/R/ENV/0524 Issue 1
AEA Technology A3.4
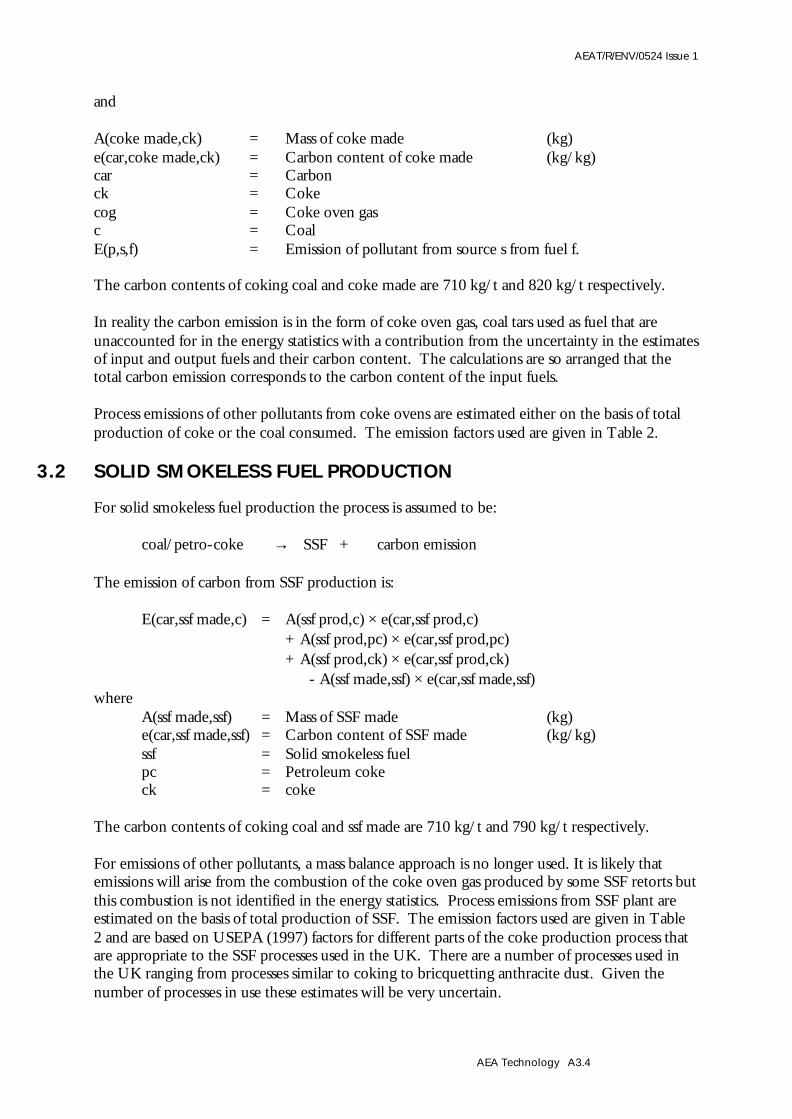
and A(coke made,ck) = Mass of coke made (kg) e(car,coke made,ck) = Carbon content of coke made (kg/kg) car = Carbon ck = Coke cog = Coke oven gas c = Coal E(p,s,f) = Emission of pollutant from source s from fuel f. The carbon contents of coking coal and coke made are 710 kg/t and 820 kg/t respectively. In reality the carbon emission is in the form of coke oven gas, coal tars used as fuel that areunaccounted for in the energy statistics with a contribution from the uncertainty in the estimatesof input and output fuels and their carbon content. The calculations are so arranged that thetotal carbon emission corresponds to the carbon content of the input fuels. Process emissions of other pollutants from coke ovens are estimated either on the basis of totalproduction of coke or the coal consumed. The emission factors used are given in Table 2.
3.2 SOLID SMOKELESS FUEL PRODUCTION
For solid smokeless fuel production the process is assumed to be: coal/petro-coke → SSF + carbon emission The emission of carbon from SSF production is: E(car,ssf made,c) = A(ssf prod,c) × e(car,ssf prod,c) + A(ssf prod,pc) × e(car,ssf prod,pc) + A(ssf prod,ck) × e(car,ssf prod,ck) - A(ssf made,ssf) × e(car,ssf made,ssf) where A(ssf made,ssf) = Mass of SSF made (kg) e(car,ssf made,ssf) = Carbon content of SSF made (kg/kg) ssf = Solid smokeless fuel pc = Petroleum coke ck = coke The carbon contents of coking coal and ssf made are 710 kg/t and 790 kg/t respectively. For emissions of other pollutants, a mass balance approach is no longer used. It is likely thatemissions will arise from the combustion of the coke oven gas produced by some SSF retorts butthis combustion is not identified in the energy statistics. Process emissions from SSF plant areestimated on the basis of total production of SSF. The emission factors used are given in Table2 and are based on USEPA (1997) factors for different parts of the coke production process thatare appropriate to the SSF processes used in the UK. There are a number of processes used inthe UK ranging from processes similar to coking to bricquetting anthracite dust. Given thenumber of processes in use these estimates will be very uncertain.

AEAT/R/ENV/0524 Issue 1
AEA Technology A3.5
Data are available on the production of SSF and the fuels used (DTI, 2000), however it is clearthat in recent years both coke and imported petroleum coke have been used in the productionof smokeless fuels. Data on the total UK imports and exports of petroleum coke are availablebut little information is available on its consumption. In these estimates it is assumed that 100 ktper annum of petroleum coke was used in SSF production since 1992 based on DETR (1998f).The carbon emission from the coke and petroleum coke consumed is included in the processemission. Emissions from the combustion of fuels to heat the smokeless fuel retorts are reported under1A1ci Manufacture of Solid Fuels, however process emissions and the residual carbon emissiondiscussed above are considered to be fugitives and are reported under 1B1b Solid FuelTransformation. Table 2 Emission Factors Used for Coke and Solid Smokeless Fuel Production Units CH4 CO NOx SO2 NMVOC Coke kt/Mt coke
made 0.081a 4.6b - - 0.018a
Coke kt/Mt coalconsumed
- - 0.04b 0.02b -
SSF kt/Mt SSFmade
0.081a - - - 0.018a
SSF kt/Mt coalconsumed
- 0.6b 0.01b 0.44 -
a EIPPCB, (2000) b USEPA (2000)
4 Oil and Natural Gas
The emissions estimates for the offshore industry are based on the UKOOA sponsoredSCOPEC Inventory (SCOPEC, 2000). This is a detailed inventory based on returns from theoperating companies for the years 1995-1999. For years prior to 1995 the estimates are based onthe UKOOA study for 1991 (UKOOA, 1993). This source was used for previous inventoriesbut was retrospectively revised by UKOOA to incorporate new data on flaring and loadingemissions. (Russell, 1997). The emissions reported in these studies pertain to the offshoreplatforms and onshore terminals on the UK Continental Shelf Area and represented byUKOOA. UKOOA have produced guidelines for estimating and reporting emissions. (E&P Forum,(1994), UKOOA (1995)). The operators are required to report flaring and venting volumes andcompositions. Methodologies have been developed to estimate combustion emissions fromturbines, boilers and heaters and fugitive emissions. These can be calculated on a plant item byitem basis. Where detailed data are not provided estimates are made on the basis of oil and gasthroughput. However, the proportion of emissions estimated on throughput has fallen and inthe 1999 inventory, no estimates were made in this way.
AEAT/R/ENV/0524 Issue 1
AEA Technology A3.6
The data reported in the SCOPEC database must be reconciled with the UK Energy Statisticsand integrated into the NAEI without double counting emissions. The data available onlycover 1995-99 and 1991 and must be extrapolated to other years to produce a time series. Thediesel oil consumption by offshore installations is not reported separately in the UK EnergyStatistics but is included under coastal shipping. In order to avoid double counts the UKOOAestimates have been corrected to remove diesel oil emissions. In the NAEI, offshore emissions are estimated in the following categories each with its ownmethodology: • Offshore flaring• Offshore Oil & Gas (well testing)• Offshore Oil & Gas (venting)• Offshore Oil & Gas• Offshore Loading• Onshore loading• Storage• Offshore own gas use (reported under 1A1c Other Energy Industries)• Gas Separation Plant (reported under 1A1c Other Energy Industries)
The mapping of these sources to IPCC categories is described in Appendix 1. Activity data arereported in the CRF Background Table 1B2, however in most cases these data are not used tocalculate the emissions, but is provided for comparison with other inventories.
4.1 OFFSHORE FLARING
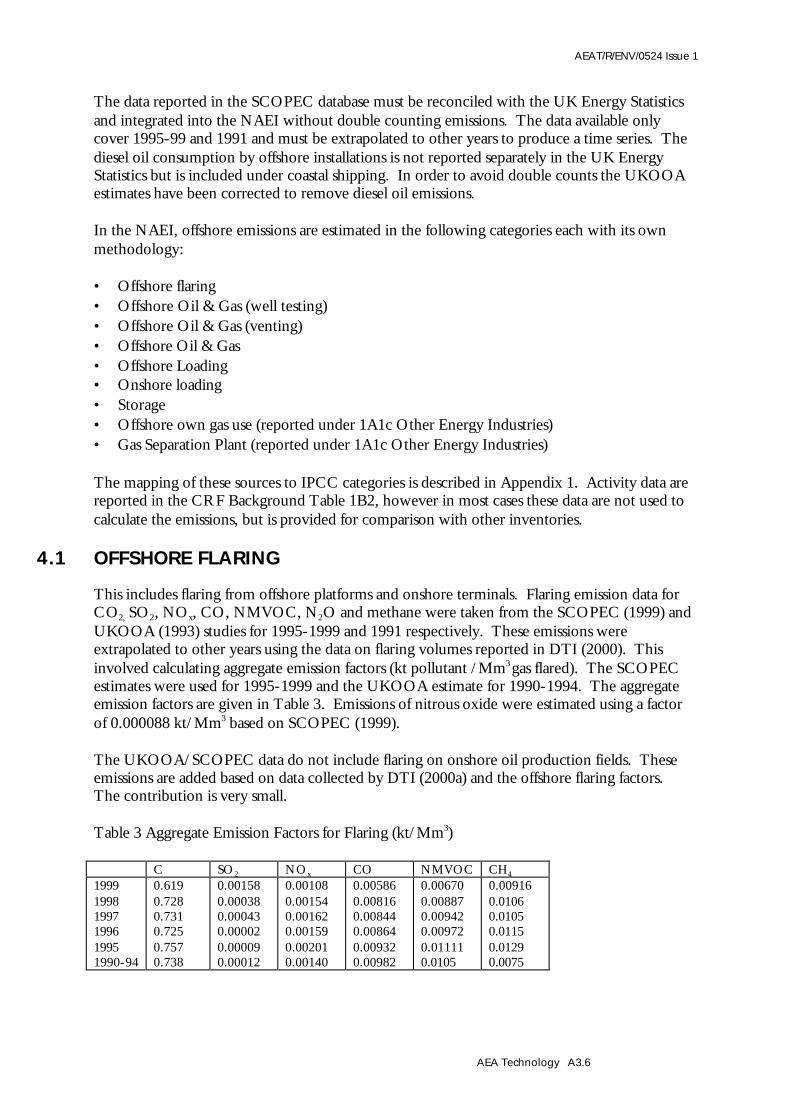
This includes flaring from offshore platforms and onshore terminals. Flaring emission data forCO2, SO2, NOx, CO, NMVOC, N2O and methane were taken from the SCOPEC (1999) andUKOOA (1993) studies for 1995-1999 and 1991 respectively. These emissions wereextrapolated to other years using the data on flaring volumes reported in DTI (2000). Thisinvolved calculating aggregate emission factors (kt pollutant /Mm3 gas flared). The SCOPECestimates were used for 1995-1999 and the UKOOA estimate for 1990-1994. The aggregateemission factors are given in Table 3. Emissions of nitrous oxide were estimated using a factorof 0.000088 kt/Mm3 based on SCOPEC (1999).
The UKOOA/SCOPEC data do not include flaring on onshore oil production fields. Theseemissions are added based on data collected by DTI (2000a) and the offshore flaring factors.The contribution is very small. Table 3 Aggregate Emission Factors for Flaring (kt/Mm3) C SO2 NOx CO NMVOC CH4
1999 1998 1997 1996 1995 1990-94
0.619 0.728 0.731 0.725 0.757 0.738
0.00158 0.00038 0.00043 0.00002 0.00009 0.00012
0.00108 0.00154 0.00162 0.00159 0.00201 0.00140
0.00586 0.00816 0.00844 0.00864 0.00932 0.00982
0.00670 0.00887 0.00942 0.00972 0.01111 0.0105
0.00916 0.0106 0.0105 0.0115 0.0129 0.0075

AEAT/R/ENV/0524 Issue 1
AEA Technology A3.7
Flaring is reported under 1B2ciii Flaring – Combined, since many of the platforms produceboth oil and gas. An estimate of NMVOC emissions from refinery flares is reported in 1B2ciVenting and Flaring: Oil. This is based on estimates supplied by UKPIA (2000).
4.2 OFFSHORE OWN GAS USE
This refers to the use of unrefined natural gas on offshore platforms and onshore terminals as afuel in heaters, boilers, turbines and reciprocating engines. Gas combustion emission data forCO2, SO2, NOx, CO, NMVOC, N2O and methane were taken from the SCOPEC (2000) andUKOOA (1993) studies for 1995-1999 and 1991 respectively. In the case of the UKOOA(1993) data it was necessary to apply a correction to remove the contribution from diesel oilconsumption. This correction was based on the more detailed breakdown of emissions in theSCOPEC study and was necessary to avoid double counting with fuel oil consumption reportedelsewhere in the inventory. These emissions were extrapolated to other years using the data onfuel gas consumption by the offshore industry reported in DTI (2000). The DUKES category‘producers own use’ is mostly if not wholly natural gas used on offshore installations for runningturbines, engines, heaters and boilers. The DUKES category oil and gas extraction refers toethane, propane and butane used in gas separation plants at oil terminals. It is now clear that thefuel gas emissions reported by SCOPEC include methane and natural gas liquids, hence itcorrect to match these emissions with the natural gas, ethane, propane and butane data reportedin DTI (2000). This involved calculating aggregate emission factors (kt pollutant /Mtherm) forfuel gas defined as natural gas, LPG (butane and propane) and OPG (ethane). The SCOPECestimates were used for 1995-1999 and the UKOOA estimate for 1990-1994. The aggregateemission factors are given in Table 4. Table 4 Aggregate Emission Factors for Fuel Gas Use. (kt/Mtherm) C SO2 NOx CO NMVOC CH4
1999 1998 1997 1996 1995 1990-94
1.865 1.887 1.891 1.928 1.940 1.690
0.00175 0.00038 0.00133 0.000049 0.00032 0.00034
0.0177 0.0164 0.0171 0.0178 0.0203 0.0344
0.0073 0.0063 0.0067 0.0065 0.0075 0.0061
0.00028 0.0002 0.00024 0.00023 0.00020 0.0014
0.00326 0.0012 0.00157 0.00135 0.00158 0.00085
Emissions of nitrous oxide were estimated using a factor of 0.000516 kt/Mtherm fuel gas basedon SCOPEC (1999). These emission factors apply to the mixture of methane, ethane, propaneand butane used. In the NAEI database they are applied to the categories:
• Offshore own gas use: natural gas• Gas separation plant: LPG• Gas separation plant: OPG
Emissions are reported under 1A1cii Other Energy Industries. In previous inventories, it was assumed that the propane, butane and ethane consumptionpertained to refineries rather than terminals. This assumption resulted in a double count, whichhas now been removed.

AEAT/R/ENV/0524 Issue 1
AEA Technology A3.8
4.3 WELL TESTING
This activity involves the combustion of crude oil and crude gas that are not included in UKEnergy Statistics. Combustion emission data for CO2, SO2, NOx, CO, NMVOC and methanewere taken from the SCOPEC (2000) and UKOOA (1993) studies for 1995-1998 and 1991respectively. The estimates of the amounts of crude oil and gas burnt are fairly speculative. Acorrection was applied to the 1991 data to remove the contribution from diesel oil consumptionin drilling in order to prevent double counting. Data from 1995-1999 and 1991 wereextrapolated to other years using data on the numbers of wells explored, reported in DTI(2000b). Unfortunately the number of wells tested is only a small proportion of the number ofwells explored and that proportion may vary from year to year. Also the number of wellsexplored varies considerably from year to year. Hence this method of extrapolation can onlygive a reflection of the well testing activity and is used because actual data on well testing are notcollected. The SCOPEC estimate was used for 1995-1999 with the 1995 factor used for allprevious years. The aggregate emission factors are given in Table 5. Well testing is reportedunder 1B2a Oil Production since many of the wells produce oil and gas. Table 5 Aggregate Emission Factors for Well Testing.(kt/well explored) C SO2 NOx CO NMVOC CH4
1999 1998 1997 1996 1995 1990-94
3.61 3.73 2.78 2.34 2.69 2.69
0.00006 0.131 0.104 0.092 0.1 0.1
0.011 0.012 0.009 0.008 0.0087 0.0087
0.0558 0.0619 0.0461 0.0411 0.0445 0.0445
0.0685 0.0656 0.0519 0.0462 0.0759 0.0759
0.0151 0.016 0.0121 0.0108 0.0117 0.0117
4.4 OTHER EMISSIONS FROM PLATFORMS AND TERMINALS
These include emissions of methane and NMVOC from platforms and terminals arising fromcold venting and fugitive emissions and also from storage of crude oil at terminals. Theapproach adopted was determined by the data available. For the years 1995-1999, detailedestimates from the SCOPEC (2000) survey were used. For the years 1990-1992 estimates were extrapolated. This involved extrapolating the UKOOA(1993) estimates of total emissions (i.e. flaring, gas combustion, venting, fugitives and storage)using data on the numbers and type of platform or terminal. This involved calculating aggregateemission factors (kt pollutant/platform). The types of installation considered were oil platforms,gas platforms, oil/gas platforms, oil terminals and gas terminals. The platform data were takenfrom DTI (1997) and Oilfield Publications (1996). The resulting emission estimates includeflaring and gas consumption which have been estimated separately. In order to avoid doublecounting the flaring and gas consumption components estimated in Sections 3.1 and 3.2 weresubtracted. The emissions for the years 1993 and 1994 were then estimated by interpolation. Other emissions from platforms and terminals are reported in the NAEI category offshore oil &gas, and are mapped onto 1B2 a Oil ii Production. It is not possible to split oil and gasproduction emissions since oil and gas are frequently produced on the same platform. From1995 onwards, the offshore oil & gas category contains emissions of fugitives and processes only.Venting and storage are reported in their respective categories.

AEAT/R/ENV/0524 Issue 1
AEA Technology A3.9
Table 6 Aggregate Emission Factors used for Emissions from Platforms and Terminals
Period Units CH4
NMVOC
Gas Platforms Oil Platforms Oil/Gas Platforms
1970-92 1970-92 1970-92
kt/installation kt/installation kt/installation
0.589 0.327 0.763
0.0754 0.393 0.686
Gas Terminals Oil Terminals
1970-92 1970-92
kt/installation kt/installation
3.0 0.076
0.425 0.315
4.5 LOADING EMISSIONS
Emissions from tanker loading and unloading were taken from the SCOPEC (1999) study for1995-99. They are based on the tonnage of oil shipped and site specific emission factors, whichaccount for recently applied abatement measures. A correction is made to add on the emissionsfrom the Seal Sands Refinery, which is only included in the recent SCOPEC Inventories.These data were provided by the operator. (Philips Imperial Petroleum, 2000). Data forprevious years were estimated in a similar manner using oil shipment data taken from DTI(1998, 1998a). These cover the amount of crude oil shipped by tanker from: • production sites to UK users and export• onshore terminals to UK users and export It is assumed that no emission occurs from the amounts of crude oil transported by pipeline.The emission factors are taken from UKOOA (1995) and Russell (1997) and are specific toterminals for onshore loading. Table 7 shows aggregate factors calculated from the amounts ofoil loaded. Table 7 Aggregate Emission Factors used for Emissions Loading and Unloading
Period Units CH4
NMVOC Offshore Loading 1999
1998 1997 1996 1990-95
t/kt oil
0.074 0.043 0.036 0.035 0.036
1.34 1.44 1.98 1.96 2
Onshore Loading 1999 1998 1997 1996 1990
t/kt oil
0.0064 0.013 0.003 0.015 0.013
0.69 0.79 0.78 0.8 0.73
4.6 LEAKAGE FROM THE GAS TRANSMISSION SYSTEM.
The NAEI category Gas Leakage covers emissions of methane and NMVOC from the UK GasTransmission and Distribution System. This is mapped on to the IPCC category 1B2b NaturalGas ii Transmission/Distribution. The estimates are derived from specific leak rates measuredon the various types of gas mains and services together with data on the total lengths and typesof the gas mains and services (British Gas, 1993, Transco, 2000). The emissions for 1997-99 are

AEAT/R/ENV/0524 Issue 1
AEA Technology A3.10
based on the results of a new model (Transco 2000) which reflects recent conditions in the gasindustry more accurately and supercedes the earlier model. The emissions from 1990-96 arebased on the British Gas model which provided historical data for 1991-94 but projectedestimates for 1995-96. The estimates of the new model were used to replace the old modelestimates for 1997-98 and are slightly higher. The composition of natural gas assumed for 1990-96 is 91.6% w/w methane (British Gas, 1999) and that assumed for 1997-99 is 88.18% w/wmethane, Transco (2000). An extra emission of 40 kt methane has been included to account forhigh-pressure mains which were not included in the British Gas and Transco models. (DETR,1999)
4.7 PETROL DISTRIBUTION
The NAEI reports emissions from the following categories: • Petrol Stations (Petrol Delivery)• Petrol Stations (Vehicle Refueling)• Petrol Stations (Storage Tanks)• Petrol Stations (Spillages)• Petrol Terminals (Storage )• Petrol Terminals (Tanker Loading)• Refineries (Road/Rail Loading)
These cover evaporative losses of NMVOCs from the various stages from refinery dispatch tosale. They are mapped onto 1B2a Distribution of Oil Products. The terminal (storage)estimates are based on standard industry calculation procedures reported in CONCAWE(1986). The remaining emissions are based on factors supplied by the Institute of Petroleum(2000) for the loading and storage technologies involved. A correction is applied for thechanges in volatility and density of petrol over the time period. The activity data are the sales ofleaded and unleaded petrol taken from DTI (2000).
4.8 REFINERIES AND PROCESSES
The IPCC category 1B2aiv Refining and Storage reports estimates of NMVOC emissions fromoil refineries. In the NAEI these are split into:
• Refineries (drainage)• Refineries (tankage)• Refineries (Process)• Petroleum Processes All are based on UKPIA (2000) estimates for 1993-99. Prior to this period the 1993 value isused for drainage and tankage. Process emissions are extrapolated based on oil throughput.
The NAEI category Petroleum Processes reports NMVOC emissions from certain petroleumprocesses such as specialist refining, bitumen refining and onshore oil fields. The data are takenfrom the pollution inventory (Environment Agency, 2000). Prior to 1994 the estimates areextrapolated, based on refinery capacity and onshore oil throughput.

AEAT/R/ENV/0524 Issue 1
AEA Technology A3.11
The NAEI also reports emissions from gasification processes. These arise from certain gastreatment processes that occur downstream of the gas terminals and are not included in theSCOPEC Inventory. They are taken from the pollution Inventory (Environment Agency,2000). For the years prior to 1994 They are extrapolated based on gas throughput. Care istaken to avoid double counting with the offshore emissions.
5 References
Barty, R, (1995), Energy Policy and Analysis Unit, DTI, Personal Communication.
Bennet, S, Kershaw, S, Burrell, R, (1995), Control Measures for Methane Emissions from CoalProduction, ETSU N/01/00006/REP
British Gas (1993) Personal Communication from C Rose, Regional Services EngineeringDept, London.
British Gas (1994) Personal Communication from S Pearson, Gas Research Centre,Loughborough, Leics.
Coal Authority, (2000), Production and Manpower Return, Personal Communication.
CONCAWE, (1986), Hydrocarbon Emissions from Gasoline storage and distributionsystems.Report No 85/54.
DETR (1998), C McMullen, Personal Communication
DETR (1999), Global Atmosphere Division, Personal Communication
DTI (1997) The Energy Report 2, Oil and Gas Resources of the United Kingdom, Departmentof Trade and Industry, The Stationary Office.
DTI, (1998), Digest of United Kingdom Energy Statistics 1998, London, The Stationary Office.
DTI (1998a) The Energy Report 2, Oil and Gas Resources of the United Kingdom,Department of Trade and Industry, The Stationary Office.
DTI, (2000), Digest of United Kingdom Energy Statistics 2000, London, The Stationary Office.
DTI, (2000a), Personal Communication from K Williamson, EPA.
E & P Forum, (1994), Methods for Estimating Atmospheric Emissions from E&P Operations,The Oil Industry International Exploration & Production Forum, Report No 2.59/197
EIPPCB, (2000) European Integrated Pollution Prevention and Control Bureau, Best AvailableTechniques reference Document on the Production of Iron and Steel.
Environment Agency, (2000), The Pollution Inventory 1999

AEAT/R/ENV/0524 Issue 1
AEA Technology A3.12
Institution of Petroleum, (2000), Protocol for the Estimation of VOC Emissions fromPetroleum Refineries and Gasoline Marketing Operations,
Oilfield Publications (1996) North Sea Field Development Guide, 6th ed., Oilfield PublicationsLimited, Ledbury, Herts.
Philips Imperial Petroleum, (2000), Personal Communication.
RJB Mining (UK), (2000), Personal communication from M Allen
Russell, P, (1997) Personal Communication, Safety and Environment Dirctorate, BG plc.
Sage, PW, (2001), Methane from Abandoned Coal Mines in the UK, AEA Technology,Report AEAT/ENV/R/0500, Harwell
SCOPEC(2000), Environmental Database for Emissions and Discharges from OffshoreInstallations, Atmospheric Emissions Inventory, 1999. Personal communication fromUKOOA.
Transco, (2000), Personal Communication from A Buxton
UKOOA (1993), Atmospheric Emissions from UK Oil and Gas Exploration and ProductionFacilities in the UK Continental Shelf Area. Prepared for United Kingdom Offshore OperatorsAssociation Limited, March 1993, Ref HN08-007.REP, Brown & Root Environmental,Leatherhead, Surrey
UKOOA, (1995), Guidelines on Atmospheric Emissions Inventory, UK Offshore OperatorsAssociation Limited (Environment Committee)
UKPIA, (2000), United Kingdom Petroleum Industry Association, Personal Communication.
USEPA, (1997), United States Environmental Protection Agency, Compilation of Air PollutantEmission Factors. Vol 1, 5th Edition, AP-42, North Carolina. Updated Website Version (Nov2000)
Williams, A, (1993), Methane Emissions, Watt Committee Report Number 28, The WattCommittee on Energy, London.

AEAT/R/ENV/0524 Issue 1
AEA Technology A4.1
Appendix 4Industrial Processes andSolventsCONTENTS
1 CEMENT PRODUCTION 3
1.1 Process Emissions 3
1.2 Combustion Emissions 3
2 LIME PRODUCTION 4
3 LIMESTONE AND DOLOMITE USE 5
4 SODA ASH USE 5
5 ASPHALT CONSUMPTION 5
6 THE FEEDSTOCK USE OF NATURAL GAS 6
7 NITRIC ACID PRODUCTION 7
8 ADIPIC ACID PRODUCTION 8
9 OTHER CHEMICAL INDUSTRY 9
10 IRON AND STEEL 9
10.1 Carbon Dioxide Emissions 10
10.2 Other Pollutants 11
11 ALUMINIUM PRODUCTION 12
12 OTHER NON-FERROUS METALS 12
13 FOOD AND DRINK 12

AEAT/R/ENV/0524 Issue 1
AEA Technology A4.2
14 HALOCARBONS AND SF6 PRODUCTION 13
14.1 Consumption of Halocarbons and SF6 14
14.2 Potential Emissions of Halocarbons and SF6 14
15 SOLVENT AND OTHER PRODUCT USE 15
16 REFERENCES 15

AEAT/R/ENV/0524 Issue 1
AEA Technology A4.3
1 Cement Production
1.1 PROCESS EMISSIONS
In a cement kiln, calcium carbonate (CaCO3) is broken down to CaO and carbon dioxide. Themethodology used pertains to the IPCC Tier 2 approach (IPCC, 2000). The emission wasestimated from the annual UK production of clinker (DETR, 2000) and the IPCC defaultemission factor of 138.3 t C/ kt clinker produced (IPCC, 1997). So far it has not provedpossible to obtain data on the CaO content of clinker either on a national basis or a site basis so adefault is used. A revision included in the 1999 Inventory is to correct for the loss of cementkiln dust and here the default of 2% is used (IPCC, 2000). Hence the corrected emission factoris 141.1 t C/ kt clinker. The clinker produced is then ground up with gypsum to producecement. Since clinker may be imported or exported the production of cement is not preciselyrelated to the production of clinker. Hence it is preferable to use clinker data to estimate carbondioxide emissions. Clinker consumption data are reported in the CRF Tables attached to thisreport as a CD ROM.
1.2 COMBUSTION EMISSIONS
Section 1.1 describes the emission of CO2 from the degradation of limestone used in cementmanufacture. The NAEI category cement (fuel combustion) covers emissions of CO2, methaneand N2O arising from the combustion of fuels in kilns. Emission factors are shown in Table 1.In DUKES (DTI, 2000), this fuel consumption is included under ‘industry’. Fuel estimateswere derived from Blyth et al (1996) and British Cement Association (1998). The BCA datasupplied an estimate of total kiln fuel in 1998 and the Blyth et al study gave a break down by fueltype used in cement and plaster production for 1993. Using these data and extrapolating toother years by using clinker production data (DETR, 2000), an approximate time series forcement coal, oil, petroleum coke and gas consumption was developed. Having estimated theconsumption of coal, fuel oil and natural gas by the cement sector, the fuel consumption byother industry was adjusted so that the total consumption agreed with DUKES (DTI, 2000).Estimates were also made of emissions from the combustion of scrap tyres and waste oils incement kilns. The scrap tyre data were taken from Collingwood (1997) and DTI (2000a). Theconsumption of waste oils is uncertain. Some estimates for 1994-95 are available (Collingwood,1997) but for subsequent years we used the advice from BCA that the consumption of wastes asfuel was no more than 6%. (British Cement Association, 2000). The non-CO2 factors for scrap tyres are the same as for coal, because this fuel is normally burntmixed with a larger proportion of coal. The carbon content of scrap tyres was estimated fromdata reported in Ogilvie, (1995). For the pollutants NOx, CO, NMVOC and SO2, estimates were based on the site emissions forcement plant reported by the Environment Agency (2000). The aggregate factors werecalculated based on estimated plant capacities supplied by British Cement Association (2000).

AEAT/R/ENV/0524 Issue 1
AEA Technology A4.4
They are expressed in terms of the emission per tonne of clinker produced. And are shown inTable 2. Table 1: Emission Factors for Cement Kilns based on Fuel Consumption CO2
a CH4 N2O Units Coal 659.6b 0.3g 0.1084j kt/Mt fuel Fuel Oil 850c 0.0406h NE kt/Mt fuel Natural Gas 1501d 0.1045h NE g/therm Petro-Coke 800c 0.346h 0.1302j kt/Mt fuel Scrap Tyres 757e 0.0258g NE kt/Mt fuel Waste Oils 859f 0.0406i NE kt/Mt fuel a Emission as carbon b British Coal (1989) c UKPIA (1989) d British Gas (1992) e Based on Ogilvie (1995) f As gas oil (UKPIA,1989) g Brain et al (1994) h EMEP/CORINAIR (1996) i CORINAIR (1992) j Fynes et al (1994) Table 2: Emission Factors for Cement Kilns based on Clinker Production CO NOx NMVOC SO2 Units Cement 2.62 3.43 0.105 2.44 kt/Mt Clinker
2 Lime Production
Lime (CaO) is manufactured from limestone (CaCO3) and dolomite (CaCO3MgCO3) byheating in a limekiln resulting in the evolution of carbon dioxide. The UK does not use theIPCC methodology (IPCC, 2000) which is based on lime production, because limestone anddolomite consumption data are available (BGS, 2001). The use of consumption data is simplerand probably more reliable since it is not necessary to consider the different types of limeproduced. An emission factor of 120 t carbon/kt limestone was used based on thestoichiometry of the chemical reaction assuming pure limestone. For dolomite an emissionfactor of 130 t carbon /kt dolomite would be used; however dolomite calcination data are notgiven explicitly but included in the limestone data. Hence emissions will be under estimated.Dolomite calcination is believed to be a small proportion of the total hence the underestimate isunlikely to be significant. The limestone calcination data used exclude limestone calcined in thechemical industry since the Solvay process uses a large proportion of this in the production ofsodium carbonate. The limestone is calcined to produce carbon dioxide but nearly all this isrecovered and is sequestrated in the sodium carbonate produced. Also the calcination oflimestone in the sugar industry is excluded. This is because, the lime produced is used in sugarrefining and the overall process does not result in a net emission of carbon dioxide. Limestoneconsumption data are reported in the CRF Tables attached to this report as a CD ROM.

AEAT/R/ENV/0524 Issue 1
AEA Technology A4.5
3 Limestone and Dolomite Use
Emissions from the use of limestone and dolomite were estimated from the following sources: • iron and steel manufacture• glass manufacture• liming of soils (see Appendix 6) Usage data are available in BGS (2001) and ISSB (2000) for iron and steel use. The emissionfactors were 120 t carbon/kt limestone or chalk and 130 t carbon /kt dolomite and assume allthe carbon is released to atmosphere. The emissions from iron and steel use and glass arereported under 2A3 Limestone and Dolomite Use and those from soils under 5D CO2 Emissionsand Removals from Soils.
4 Soda Ash Use
Emissions of CO2 from soda ash (sodium carbonate) production are not specifically identified.However, the emissions arise from fuel combustion used in the Solvay process and should beincluded elsewhere under industrial combustion. Some of the uses of sodium carbonateproduced result in the emission of CO2 (e.g. glass manufacture, food and drink,pharmaceuticals) but others do not (e.g. water softening). Only the emission from soda ash usedin glass production is reported in 2A4. This is based on estimates of the consumption of sodaash in the production of soda glass (British Glass, 2000). This is around 15% of the mass of glassproduced. An emission factor of 113 kt C/ Mt soda ash is used. The estimates include bothcontainer and flat glass.
5 Asphalt Consumption
The inventory reports emissions of NMVOCs from asphalt paving and road construction. Theemission estimates are based on consumption data of bitumen emulsions, cut-back bitumen andcut-back fluxes. The emission factors used are 7, 87.5 and 700 kg/t for each componentrespectively. The Bitumen Association provides the activity data. Emissions from asphaltroofing are not reported due to lack of data.

AEAT/R/ENV/0524 Issue 1
AEA Technology A4.6
6 The Feedstock Use of Natural Gas
Natural gas is used as a feedstock for the manufacture of ammonia (for fertilizer), methanol andacetic acid. The largest use is for ammonia manufacture by the steam reforming of natural gas tomake hydrogen. The simplified reactions are: CH4 + H2O ⇔ CO + 3H2
CO + H2O ⇔ CO2 + H2
The hydrogen is then reacted with nitrogen from air to form ammonia N2 + 3H2 ⇔ 2NH3
If there is no use of the by-products CO and CO2 formed then these are emitted to atmosphere.The carbon monoxide is usually oxidised so the CO2 emission can be estimated from the naturalgas usage or the amount of ammonia produced. The emission is 0.97 t CO2 /t NH3 producedbased on the reaction stoichiometry. In the UK some ammonia plants are integrated with methanol and acetic acid manufacture forgreater efficiency. Thus hydrogen formed as a by-product from acetic acid manufacture is usedas the feedstock for ammonia manufacture. Some carbon monoxide and carbon dioxide fromthe reforming process is used to manufacture methanol. This carbon is sequestrated as methanoland is not emitted to atmosphere. Methanol is manufactured from natural gas using a process similar to ammonia CO + 2H2 ⇔ CH3OH so that all the carbon content of the natural gas is sequestrated as methanol. Acetic acid is manufactured from methanol and natural gas and again the carbon content of thenatural gas is sequestrated. Two estimates were made: • The amount of CO2 emitted from ammonia manufacture • The amount of natural gas used in the manufacture of products. This can then be deducted
from the total combustion of gas by industry in order to calculate the combustion emissionsof the non- CO2 pollutants.
The procedure adopted to estimate the emission of CO2 from ammonia manufacture was:
1. Data on the plant capacity, natural gas consumption or CO2 emission from ammonia plant,acetic acid plant and methanol plant were collected from manufacturers. This included an
AEAT/R/ENV/0524 Issue 1
AEA Technology A4.7
approximate breakdown between natural gas used as a feedstock and natural gas used as afuel.
2. The ammonia capacity of the plants using hydrogen by-product from acetic acid manufacture
was excluded. 3. Corrections were made based on manufacturers advice on the ‘recovery ‘ of carbon in
methanol manufacture.
The procedure used to estimate the natural gas use as a feedstock, was to perform a carbonbalance over the three processes:
1. Methanol plant capacity data were used to estimate its natural gas use 2. The natural gas usage of the acetic acid plant was available 3. The natural gas use equivalent to the CO2 emission from ammonia manufacture was
calculated
The total feedstock use of natural gas was estimated as the sum of items 1-3. It is known thatsome of the CO2 produced is recovered and sold for use in the food industry and nuclearindustry. Because all this carbon dioxide is eventually emitted, the estimates are compiledincluding sales. This procedure will be more reliable than trying to identify the end use of thecarbon dioxide particularly as some carbon dioxide used in the food industry arises fromfermentation.
The Inventory includes an estimate of the NOx emission from the ammonia reformer reportedunder ammonia combustion. This arises from the combustion of natural gas to produce thehigh temperatures required by the process. The estimate was based on data provided by themanufacturers.
Terra Nitrogen, Kemira, ICI and BP Chemicals supplied the necessary data.
7 Nitric Acid Production
The manufacture of nitric acid produces emissions of both NOx and nitrous oxide.All plant operators were able to supply data on nitrous oxide emissions and production for 1999.For previous years, emissions were calculated for each plant by extrapolating the 1999 emission(or in some cases 1998 emission) using production or plant capacity data. One plant currentlyhas abatement measures so the uncontrolled default factor was used for the years prior to theretrofit. The default emission factor was 6kt/Mt 100% acid produced. This is an average factorbased the range quoted in IPCC Guidelines (IPCC, 1997) for medium pressure plant. Up to1988, the production data from (CIS, 1991) were used. Since 1994 production estimates basedon returns from manufacturers were used. These are based mainly on plant capacity data whichmay over estimate true production levels. Production from 1989 to 1993 was estimated bylinear interpolation. In the period 1990 to 1993, two other plants were known to operatehowever these have now closed down. Their emissions are estimated based on plant capacity

AEAT/R/ENV/0524 Issue 1
AEA Technology A4.8
and the default emission factor. Some nitric acid capacity is associated with the adipic acid plant.From 1990-1993, its emissions are reported combined with the adipic acid plant emissions.
Table 3 Summary of Nitric Acid Production in UK
1990 1994 1995 1996 1997 1998 1999No of Sites 8 6 6 6 6 6 6Production/capacityMt 100% Nitric Acid
2.41 2.43 2.40 2.44 2.35 2.61 2.44
Aggregate EmissionFactor kt N2O/Mt
5.54 5.71 4.14 4.19 4.12 4.27 3.95
Aggregate EmissionFactor kt NOx/Mt
3.0 1.93 0.808 0.743 0.902 0.790 0.947
Table 3 summarizes production data and gives the aggregate emission factor. The data for 1990exclude the contribution of the nitric acid plant associated with the adipic acid plant. Theproduction data are a mixture of precise production data and plant capacity. The emissions arebased on the data reported by the operators and consequently the emission factors they haveagreed to use with the Environment Agency. These do vary between plant but all are withinthe range reported in IPCC (2000). The variation in the aggregate factor is due to:
• varying production levels of individual plant• installation of an abatement system on a plant in 1996• plant closures
The number of sites is reported, as this is fairly unambiguous. In practice there may be morethan one plant on a site or a plant may be composed of one or more identical units.
In the NAEI, estimates of NOx up to 1988 are estimated from the annual production of nitricacid (CIS, 1991). The NOx emission factor is 3.98 t/kt of 100% acid produced. This is anaggregate factor based on CORINAIR (1989) emission factors for the different types ofprocesses ranging from 3-12 t/kt of 100% acid produced. The aggregate factor was based ondata on UK Manufacturing plant provided by the Nitric Acid Association for the year 1985(Munday, 1990).For 1994 onwards estimates of NOx are based on returns from manufacturers. Emissions from1990 to 1993 were estimated by linear interpolation. Aggregate emission factors are reported inTable 3.
8 Adipic Acid Production
Adipic acid is manufactured in a multi-stage process from cyclohexane via oxidation with nitricacid. Nitrous oxide is produced as a breakdown product from nitric acid. UK productionfigures and emission estimates have been provided by DuPont as the only companymanufacturing adipic acid in the UK (DuPont, 2000). The estimates are based on an emissionfactor of 0.3 kt N2O/Mt adipic acid produced. A small nitric acid plant is associated with theadipic acid plant which also emits nitrous oxide. From 1994 onwards this emission is reported

AEAT/R/ENV/0524 Issue 1
AEA Technology A4.9
as nitric acid but prior to 1994 it is included under adipic acid production. This allocationreflects the availability of data. In 1998 an N2O abatement system was retrofitted to the plant.This has resulted in a 96% reduction in emissions in 1999. Emissions, destruction and activitydata are reported in the CRF tables attached to this report on a CD ROM.
9 Other Chemical Industry
Emissions of methane from the chemical industry are reported under 2B5. The emission is thesum of all emissions of methane from chemical processes reported in the Pollution Inventory(Environment Agency, 2000). The Pollution Industry does not fully identify the processes bytype, hence it is not possible to disaggregate the emission by process. Also, activity data are notavailable for the sources listed in the IPCC Guidelines. Hence the total emission is reported forall years. It is expected that the detail of these estimates will be improved in future.
Emissions of NMVOC, reported for the organic chemical industry are based on the PollutionInventory (Environment Agency, 2000). For the years prior to 1994 for which data areunavailable, they are extrapolated using an index of production for the Chemical Industry(ONS, 2000). Also included is an emission from ship purging. This is an emission arising fromthe cleaning of ships tanks for carrying chemicals, where contamination must be avoided. Theestimate is a single figure for all years taken from Rudd et al (1996).
Emissions of sulphur dioxide from sulphuric acid production are based on detailedmanufacturers’ returns compiled by NSSA (2000). An emission of SO2 from the chemicalprocess to produce pigments is also reported in this category based on Environment Agency(2000).
10 Iron and Steel
The following emissions are reported under 2C1 Iron and Steel Production.
• Iron and Steel Blast Furnaces: CO2 and other process emissions• Flaring of blast furnace gas• Electric Arc Furnaces• Basic Oxygen Furnaces.
Emissions arising from the combustion of blast furnace gas and other fuels used for heating theblast furnace are reported under 1A2a Iron and Steel. Emissions from the process and the flaringof blast furnace gas are reported under 2C1 Iron and Steel Production. Emissions from blastfurnaces currently include a contribution from non-ferrous metal processes. Carbon dioxideemissions from limestone and dolomite use in iron and steel production are reported under 2A3Limestone and Dolomite use and are discussed in Section 3.

AEAT/R/ENV/0524 Issue 1
AEA Technology A4.10
10.1 CARBON DIOXIDE EMISSIONS
The IPCC Good Practice Guidelines Tier 2 methodology considers a two-stage carbon balanceon
1. Iron making2. Steel making
The UK methodology considers the processes as a single operation
coke → blast furnace gas + carbon sequestrated in steel +carbon emission
This approach is equivalent to the IPCC approach because virtually all the iron produced inblast furnaces is used as a feedstock for steel making. Hence it is not necessary to consider thecarbon sequestrated in the iron separately. The UK approach also considers the carbon emittedin the form of blast furnace gas. Blast furnace gas is used as a fuel for heating blast furnaces andfor electricity generation. The emissions from the combustion of blast furnace gas are reportedunder 1A2a Iron and Steel in the energy tables, hence it is necessary to account for this in thecarbon balance to avoid double counting. Hence by estimating the carbon content of the coke consumed and the blast furnace gasproduced, the carbon emission from the iron and steel furnaces can be estimated as: E(car,I&S BF,ck) = A(I&S BF,ck) × e(car,I&S BF,ck) - E(car,coke prod,bfg)
- E(car,I&S,bfg)- E(car,I&S BF,bfg)
- E(car,flaring,bfg) - A(I&S BF,steel made) × e(car,I&S BF, steel made) where A(I&S B F,ck) = Blast furnaces coke consumption (kg) A(I&S BF,steel made) = Crude steel production (kg) e(car,I&S BF, steel made) = Carbon content of steel made (kg/kg) e(car,I&S BF,ck) = Carbon content of coke (kg/kg) bfg = Blast Furnace Gas E(p,s,f) = Emission of pollutant p from souce s from combustion of fuel f The final term in the equation is the carbon sequestrated in the steel produced. It is assumedthat the carbon content of steel is around 1.7 kt C/Mt crude steel (BISPA, 1997). This is a veryapproximate estimate but the carbon sequestrated is very small compared with the other terms.Other carbon contents are 820 kg C/kg for coke and 6.273 kg C/ therm for blast furnace gas.

AEAT/R/ENV/0524 Issue 1
AEA Technology A4.11
10.2 OTHER POLLUTANTS
Emissions from blast furnaces of other pollutants are estimated based on the methodologydescribed in IPCC (1997) for blast furnace charging and pig iron tapping. The emission factorsare expressed in terms of the emission per Mt of steel produced and are given in Table 4. Dataon steel production are reported in ISSB (2000). Table 4 Emission Factors for Blast Furnaces (kt/Mt Steel) Pollutant Blast Furnace Charging Pig Iron Tapping Total NOx - 0.076 0.076 CO 1.33 0.112 1.442 NMVOC 0.1 0.02 0.12 SO2 - 0.03 0.03 Electric arc furnaces are used in the production of stainless and mild steel and also for recyclingscrap. Emissions are based mainly on default emission factors taken from theEMEP/CORINAIR (1999) chapter on electric arc furnaces. The CO2 emission arises from theconsumption of a graphite anode and is based on manufacturer’s data. The emission factors arereported in Table 5. Environment Agency (2000) has reported large emissions of carbon monoxide from iron andsteel processes. Their precise sources are not identified but we were advised that the mainsources were sinter plant and basic oxygen furnaces (BOF). The reported emissions wereallocated to basic oxygen furnaces and sinter plant in proportion to the USEPA (1997) emissionfactors for uncontrolled plant. Sinter plant emissions are reported under 1A2a and emissionfactors are given in Appendix 1. Table 5: Emission Factors for Electric Arc and Basic Oxygen Furnaces CO2
a CH4b N2O
b NOxc SO2
c NMVOCc COc Units EAF 3.6 0.01 0.005 0.58 0.462 0.033 2.57 kt/Mt Steel
BOF IE NE NE NE IE NE 25.5d kt/Mt Steel
a BISPA (1997) b EMEP/CORINAIR(1999) c Emission factor for 1999 based on Environment Agency (2000) d Emission factor estimated for emission reported in Pollution Inventory (Environment
Agency, 2000) for sinter plant and BOF Emissions of NMVOC are estimated from the hot rolling and cold rolling of steel usingemission factors 1 g/tonne product and 25 g/tonne product respectively (EMEP/CORINAIR,1996). Activity data were taken from ISSB (2000). There is insufficient activity or emission factor data to make an estimate for emissions fromferroalloys. Emissions of CO2 will be included in 2C1, since the fuels used as reducing agentsare included in the energy statistics.
AEAT/R/ENV/0524 Issue 1
AEA Technology A4.12
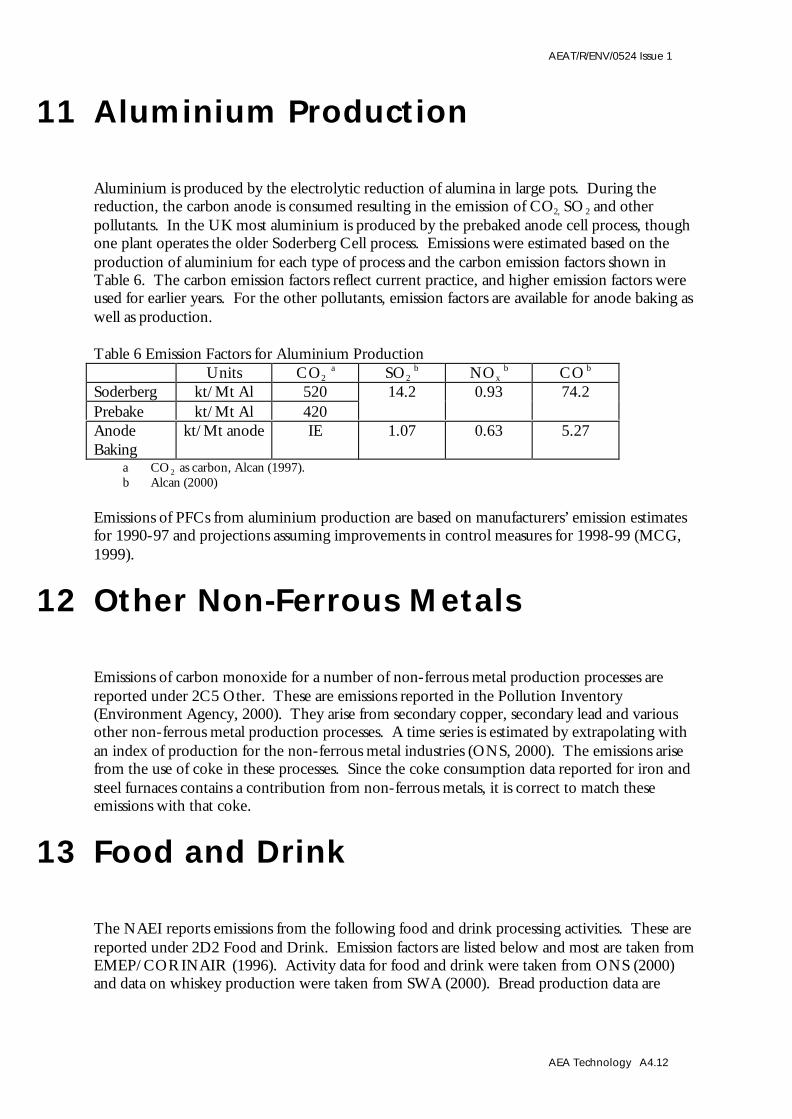
11 Aluminium Production
Aluminium is produced by the electrolytic reduction of alumina in large pots. During thereduction, the carbon anode is consumed resulting in the emission of CO2, SO2 and otherpollutants. In the UK most aluminium is produced by the prebaked anode cell process, thoughone plant operates the older Soderberg Cell process. Emissions were estimated based on theproduction of aluminium for each type of process and the carbon emission factors shown inTable 6. The carbon emission factors reflect current practice, and higher emission factors wereused for earlier years. For the other pollutants, emission factors are available for anode baking aswell as production. Table 6 Emission Factors for Aluminium Production Units CO2
a SO2 b NOx
b CO b
Soderberg kt/Mt Al 520 14.2 0.93 74.2 Prebake kt/Mt Al 420 AnodeBaking
kt/Mt anode IE 1.07 0.63 5.27
a CO2 as carbon, Alcan (1997). b Alcan (2000) Emissions of PFCs from aluminium production are based on manufacturers’ emission estimatesfor 1990-97 and projections assuming improvements in control measures for 1998-99 (MCG,1999).
12 Other Non-Ferrous Metals
Emissions of carbon monoxide for a number of non-ferrous metal production processes arereported under 2C5 Other. These are emissions reported in the Pollution Inventory(Environment Agency, 2000). They arise from secondary copper, secondary lead and variousother non-ferrous metal production processes. A time series is estimated by extrapolating withan index of production for the non-ferrous metal industries (ONS, 2000). The emissions arisefrom the use of coke in these processes. Since the coke consumption data reported for iron andsteel furnaces contains a contribution from non-ferrous metals, it is correct to match theseemissions with that coke.
13 Food and Drink
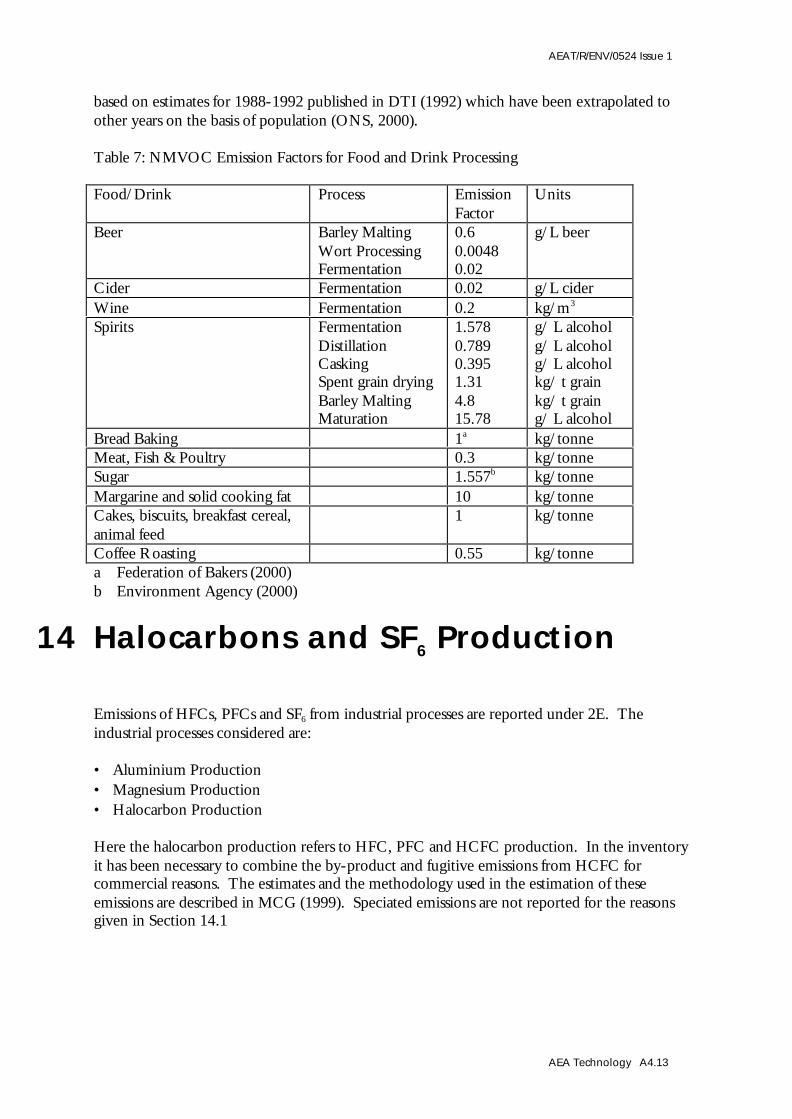
The NAEI reports emissions from the following food and drink processing activities. These arereported under 2D2 Food and Drink. Emission factors are listed below and most are taken fromEMEP/CORINAIR (1996). Activity data for food and drink were taken from ONS (2000)and data on whiskey production were taken from SWA (2000). Bread production data are
AEAT/R/ENV/0524 Issue 1
AEA Technology A4.13
based on estimates for 1988-1992 published in DTI (1992) which have been extrapolated toother years on the basis of population (ONS, 2000). Table 7: NMVOC Emission Factors for Food and Drink Processing Food/Drink Process Emission
Factor Units
Beer Barley Malting Wort Processing Fermentation
0.6 0.0048 0.02
g/L beer
Cider Fermentation 0.02 g/L cider Wine Fermentation 0.2 kg/m3
Spirits Fermentation Distillation Casking Spent grain drying Barley Malting Maturation
1.578 0.789 0.395 1.31 4.8 15.78
g/ L alcohol g/ L alcohol g/ L alcohol kg/ t grain kg/ t grain g/ L alcohol
Bread Baking 1a kg/tonne Meat, Fish & Poultry 0.3 kg/tonne Sugar 1.557b kg/tonne Margarine and solid cooking fat 10 kg/tonne Cakes, biscuits, breakfast cereal,animal feed
1 kg/tonne
Coffee Roasting 0.55 kg/tonne a Federation of Bakers (2000) b Environment Agency (2000)
14 Halocarbons and SF6 Production
Emissions of HFCs, PFCs and SF6 from industrial processes are reported under 2E. Theindustrial processes considered are: • Aluminium Production• Magnesium Production• Halocarbon Production Here the halocarbon production refers to HFC, PFC and HCFC production. In the inventoryit has been necessary to combine the by-product and fugitive emissions from HCFC forcommercial reasons. The estimates and the methodology used in the estimation of theseemissions are described in MCG (1999). Speciated emissions are not reported for the reasonsgiven in Section 14.1

AEAT/R/ENV/0524 Issue 1
AEA Technology A4.14
14.1 CONSUMPTION OF HALOCARBONS AND SF6
Emissions of HFCs, PFCs and SF6 from various uses of these products are reported under 2F.The uses considered are: • Refrigeration (Domestic, Industrial, Retailing)• Air Conditioning (Mobile and Stationary)• Foam Blowing• Firefighting (Static Systems and Portable)• Metered Dose Inhalers• General Aerosols• Electronics• Training Shoes• Electrical Insulation The category electronics refers to a range of specialist uses of PFCs and SF6 in the electronicsindustries. Some of the PFC is used for precision cleaning, however this is not reported assolvent use. No emission is reported under 2F2 Solvent because there is no use of halocarbonsfor dry cleaning. Training shoes refers to the use of SF6 and PFC in the soles of some trainingshoes. When the shoes are disposed off an emission will occur. Electrical insulation is theleakage of SF6 from circuit breakers used in high voltage electrical transmission. The estimatesand the methodology used in their estimation are described in MCG (1999). The approach adopted was to estimate the size of the bank of fluid held in products andequipment in each of the above list of sectors. Certain sectors (e.g. refrigeration, airconditioning, and foams) are broken down into subsectors. The bank of fluid is estimated byconsidering the consumption of fluid in each sector, together with corrections for imports,exports, disposal and emissions. Once the size of the bank in a given year is known, theemission can be estimated by application of a suitable emission factor. Emissions are alsoestimated from the production stage of the equipment and during disposal. The methodologycorresponds to the IPCC Tier 2 'bottom up' approach. Data are available on the speciation ofthe fluids used in these applications; hence estimates were made of the global warming potentialof each fluid category. It is not possible to report emissions by PFC or HFC species as much ofthe data were obtained from private companies on condition they are confidential. However,estimates of the total GWP of emissions in the main IPCC categories are provided.
14.2 POTENTIAL EMISSIONS OF HALOCARBONS AND SF6
Potential emissions are in effect the apparent consumption of a fluid in a particular year. TheIPCC (1997) Tier 1 methodology defines a mass balance on the production, imports, exportsand disposal of a fluid on a national basis. A further refinement is to include the total fluidexported and imported in products e.g. refrigerators and aerosol cans. Potential emissions differfrom actual emissions in that no account is made of the fluid that is stored in products and isemitted over a long period of time. In this work, potential emissions were estimated from the same data used to calculate the actualemissions (MCG, 1999). This was the annual consumption of fluid by each product sector and

AEAT/R/ENV/0524 Issue 1
AEA Technology A4.15
the amounts imported and exported into each product sector. Thus it was possible to estimatethe annual amount of fluid consumed by each product sector and process that contributes toemissions. In the new inventory a revision has been made to the potential estimates. Thisinvolved correcting for the emissions from certain sectors since there is an assumption in thecalculations that fluid leaking from the bank is replaced. Also data on disposals of fluid havenow been included in the estimates. The sum of the emissions from each sector and process isthe total potential emission. It should be noted that this procedure differs from the GuidelinesTier 1 calculations, but the resulting potential emission is consistent with the definition in theIPCC 1996 Guidelines (IPCC, 1997). The reporting of potential emissions is inapplicable tohalocarbon manufacture and aluminium production though they were estimated for SF6 covergas use during the manufacture of magnesium. It is not possible to report potential emissions by PFC or HFC species as much of the data wereobtained from private companies on condition it was confidential. However, estimates of thetotal GWP of potential emissions in the main IPCC categories are reported.
15 Solvent and other Product Use
Appendix 1 shows the NAEI Solvent Use categories that map onto the IPCC category 3Solvent and Other Product Use. The estimates are based on data on solvent use in the sectorssupplied by trade associations and manufacturers. The time series is then estimated on the basisof production statistics of the various products. The methodology is described in Passant et al(1998). An estimate is included of the carbon dioxide equivalent of the solvent consumption. Thisestimate is based on applying speciation data (Rudd, 1995) to the solvent emissions andcalculating their total carbon content. A factor of 0.702 kg C/kg CO2 was estimated based on1996 data and applied to all years. The CO2 estimate is included as a footnote to IPCC Table 3and is not included in the National Total.
16 References
Alcan (1997), Personal Communication from A Walker, Alcan International.
Alcan (2000), Personal Communication from J Clarkson, Alcan International.BGS(2001), United Kingdom Minerals Yearbook 2001, British Geological Survey, NaturalEnvironment Research Council.
BISPA(1997), Personel Comunication, M Funnell, British Iron and Steel Producers Association.
Blyth, WJ, Collingwood, JC, Pratten, NA, (1996), Estimation and Projection of NOx and SOx
Emissions from UK Industrial Sectors, Phase 2. ETSU REF RYTA 18400734/Z/3

AEAT/R/ENV/0524 Issue 1
AEA Technology A4.16
Brain, SA, Carr, CE, Davies, M, Rantell, T, Stokes, BJ. (1994), Emission of Volatile OrganicCompounds (VOCs) from Coal-Fired Appliances, DTI, Coal R&D, Report No COAL R033
BP Chemicals, (2000), Personal Communication
British Coal (1989) Personal Communication.
British Gas (1992) Personal Communication from FE Shephard, Gas Research Centre,Loughborough, Leics.
BGS, (2001), British Geological Survey, UK Minerals Yearbook 2000.
British Glass (2000). Data reported on website
British Cement Association (2000), Personal communication from L Parrott
CIS, (1991), Chem-Facts UK, Chemical Intelligence Services, Reed Telepublishing, Dunstable,Beds, UK.
Collingwood, J, (1997), ETSU, AEA Technology, Personal Communication
CORINAIR (1989), CORINAIR Inventory, Commission of the European Community,Default Emission Factors Handbook, 1st ed, CITEPA, Paris.
CORINAIR (1992) CORINAIR Inventory, Commission of the European Community,Default Emission Factors Handbook, 2nd ed, CITEPA, Paris.
DETR (2000) Department of the Environment. Monthly Statistics of Building Materials andComponents.
DTI, (1992), Business Monitor PAS 4196.
DTI, (2000), Digest of United Kingdom Energy Statistics 2000, London, The Stationary Office.
DTI (2000a), DTI Tyre Working Group, Private Communication from P Hallett
Du Pont, (1999), Personal Communication, Young, AT, DuPont (UK) Ltd, Wilton.
EMEP/CORINAIR, (1996), Atmospheric Emission Inventory Guidebook, 1st Edition, ed. GMcInnes
EMEP/CORINAIR, (1999), Atmospheric Emission Inventory Guidebook, 2nd Edition, ed. SRichardson
Environment Agency (2000). Pollution Inventory, 1999, personal communication
Federation of Bakers, (2000), Personal Communication from J White

AEAT/R/ENV/0524 Issue 1
AEA Technology A4.17
Fynes, G, Sage, PW,(1994), Emissions of Greenhouse Gases from Coal Fired Plant, BritishCoal, Coal Research Establishment, CERCHAR, DMT, Delft University of Technology, TPSTermiska Processer AB, CONTRACT NO JOUF 0047-C(SMA)
ICI, (2000), Personal Communication
IPCC, (1997), IPCC Revised 1996 Guidelines for National Greenhouse Gas Inventories,Volume 3, Greenhouse Gas Inventory Reference Manual, IPCC WGI Technical Support Unit,Hadley Centre, Meteorological Office, Bracknell, UK.
IPCC, (2000), Good Practice Guidance and Uncertainty Management in National GreenhouseGas Inventories, ed. Penman, J et al, IPCC National Greenhouse Gas Inventories Programme,Technical Support Unit, Institute for Global Environmental Strategies, Hayama, Kanagawa,Japan.
ISSB, (2000) Iron and Steel Industry, Annual Statistics for the UK, 1999. ISSB Limited
MCG, (1999), UK Emissions of HFCs, PFCs and SF6 Potential Emission Reduction Options.A study for the Department of the Environment carried out by March Consulting Group.Telegraphic House, Waterfront Quay, Salford Quays, Manchester
Ogilvie, SM, (1995), Opportunities and Barriers to Scrap Tyre Recycling, NationalEnvironmental Technology Centre, AEA/CS R1026/C, ISBN 0 856248647
ONS (2000), Annual Abstract of Statistics 2000, Office for National Statistics, The StationaryOffice.
Passant, NR, Lymberidi, E ,(1998), Emissions of Non Methane Volatile Organic Compoundsfrom Processes and Solvent Use, AEA Technology, Report No AEAT-2837 Issue 1
ISSB (2000), Iron and Steel Industry Annual Statistics for the United Kingdom, 1999
Kemira, (2000), Personal Communication
Munday, PK, (1990) UK Emissions of Air Pollutants 1970-1988, Warren Spring Laboratory,LR 764.
NSSA, (2000), National Sulphuric Acid Association, Private Communication
ONS, (2000), Office for National Statistics, Personal Communication from L Williams
Rudd, HJ, (1995), Emissions of Volatile Organic Compounds from Stationary Sources in theUnited Kingdom: Speciation, AEA Technology, National Environmental Technology Centre,AEA/CS/16419033/REMA-029/ISSUE1.
Rudd, HJ, Mikkelsen, M, (1996), Emissions of Volatile Organic Componds from Ship Purgingin the UK.
SWA, (2000), The Scotch Whiskey Association, Statistical Report

AEAT/R/ENV/0524 Issue 1
AEA Technology A4.18
Terra Nitrogen, (2000), Personal Communication
UKPIA (1989) United Kingdom Petroleum Industry Association. Personal Communication.
USEPA, (1997), United States Environmental Protection Agency, Compilation of Air PollutantEmission Factors. Vol 1, 5th Edition, AP-42, North Carolina