
Appendix 2A Water and Wastewater Servicing Principles and ...
111
Appendix 2A Water and Wastewater Servicing Principles and Policies Paper
Transcript of Appendix 2A Water and Wastewater Servicing Principles and ...

Appendix 2AWater and Wastewater Servicing Principles and Policies
Paper

Prepared by: BluePlan Engineering Consultants Limited 75 International Blvd., Suite 304 Toronto, Ontario M9W 6L9 Phone: 416.703.0667 Fax: 416.703.2501 www.blueplan.ca Project Number: P001-0005 Date: March 31, 2014
Regional Municipality of Peel 2013 Water and Wastewater Master Plan for the Lake-Based Systems Water and Wastewater Policy Paper

Regional Municipality of Peel
Water and Wastewater Policy Paper
March 31, 2014 i
Table of Contents – Water and Wastewater Policy Paper
page
1 INTRODUCTION ............................................................................................................. 1 1.1 STUDY BACKGROUND AND OBJECTIVES .................................................................. 1 1.2 APPROACH ................................................................................................................... 2
2 GENERAL WATER AND WASTEWATER POLICIES .................................................... 3 2.1 POLICY G.01: HARMONIZE POLICIES AND PROCESSES .......................................... 6
2.1.1 Policy Statement ................................................................................................ 6 2.1.2 Best Practices, Criteria and Rationale ................................................................ 6
2.2 POLICY G.02: ESTABLISHING BASELINE POPULATION AND EMPLOYMENT PROJECTIONS .............................................................................................................. 7 2.2.1 Policy Statement ................................................................................................ 7 2.2.2 Best Practices, Criteria and Rationale ................................................................ 7
2.3 POLICY G.03: HARMONIZE PLANNING AND SERVICING POLICIES AND STRATEGIES................................................................................................................. 8 2.3.1 Policy Statement ................................................................................................ 8 2.3.2 Best Practices, Criteria and Rationale ................................................................ 8
2.4 POLICY G.04: EXISTING SERVICING AGREEMENT ................................................... 9 2.4.1 Policy Statement ................................................................................................ 9 2.4.2 Best Practices, Criteria and Rationale ................................................................ 9
2.5 POLICY G.05: PLANNING HORIZON .......................................................................... 10 2.5.1 Policy Statement .............................................................................................. 10 2.5.2 Best Practices, Criteria and Rationale .............................................................. 10
2.6 POLICY G.06: MAXIMIZE USE OF EXISTING INFRASTRUCTURE ............................ 11 2.6.1 Policy Statement .............................................................................................. 11 2.6.2 Best Practices, Criteria and Rationale .............................................................. 11
2.7 POLICY G.07: RESERVE CAPACITY.......................................................................... 12 2.7.1 Policy Statement .............................................................................................. 12 2.7.2 Best Practices, Criteria and Rationale .............................................................. 12
2.8 POLICY G.08: STANDARDS AND BY-LAWS .............................................................. 14 2.8.1 Policy Statement .............................................................................................. 14 2.8.2 Best Practices, Criteria and Rationale .............................................................. 14
2.9 POLICY G.09: SYSTEM EFFICIENCY AND OPTIMIZATION ....................................... 15 2.9.1 Policy Statement .............................................................................................. 15 2.9.2 Best Practices, Criteria and Rationale .............................................................. 15
2.10 POLICY G.010: COMMUNICATION ............................................................................ 16 2.10.1 Policy Statement .............................................................................................. 16 2.10.2 Best Practices, Criteria and Rationale .............................................................. 16
2.11 POLICY G.11: LOCATION OF MUNICIPAL/REGIONAL SERVICES AND FACILITIES 17 2.11.1 Policy Statement .............................................................................................. 17 2.11.2 Best Practices, Criteria and Rationale .............................................................. 17
2.12 POLICY G.12: MONITORING ...................................................................................... 18

Regional Municipality of Peel
Water and Wastewater Policy Paper
March 31, 2014 ii
2.12.1 Policy Statement .............................................................................................. 18 2.12.2 Best Practices, Criteria and Rationale .............................................................. 18
2.13 POLICY G.13: SUSTAINABILITY OF WATER RESOURCES ...................................... 19 2.13.1 Policy Statement .............................................................................................. 19 2.13.2 Best Practices, Criteria and Rationale .............................................................. 19
2.14 POLICY G.14: CLIMATE CHANGE.............................................................................. 20 2.14.1 Policy Statement .............................................................................................. 20
2.15 POLICY G.15: TORONTO-PEEL WASTEWATER AGREEMENT ................................ 21 2.15.1 Policy Statement .............................................................................................. 21 2.15.2 Best Practices, Criteria and Rationale .............................................................. 21
3 WATER POLICIES........................................................................................................ 22 3.1 POLICY W.01: RAW WATER SOURCE PROTECTION ............................................... 25
3.1.1 Policy Statement .............................................................................................. 25 3.1.2 Best Practices, Criteria and Rationale ............................................................. 25
3.2 POLICY W.02: TREATED WATER QUALITY .............................................................. 26 3.2.1 Policy Statement .............................................................................................. 26 3.2.2 Best Practices, Criteria and Rationale .............................................................. 26
3.3 POLICY W.03: SYSTEM OPERATING CONDITIONS ................................................. 28 3.3.1 Policy Statement .............................................................................................. 28 3.3.2 Best Practices, Criteria and Rationale .............................................................. 28
3.4 POLICY W.04: SYSTEM RELIABILITY ........................................................................ 30 3.4.1 Policy Statement .............................................................................................. 30 3.4.2 Best Practices, Criteria and Rationale .............................................................. 30
3.5 POLICY W.05: SYSTEM WATER QUALITY ................................................................ 31 3.5.1 Policy Statement .............................................................................................. 31 3.5.2 Best Practices, Criteria and Rationale .............................................................. 31
3.6 POLICY W.06: FIRE FLOW REQUIREMENTS ............................................................ 32 3.6.1 Policy Statement .............................................................................................. 32 3.6.2 Best Practices, Criteria and Rationale .............................................................. 32
3.7 POLICY W.07: STORAGE REQUIREMENTS .............................................................. 33 3.7.1 Policy Statement .............................................................................................. 33 3.7.2 Best Practices, Criteria and Rationale .............................................................. 33
3.8 POLICY W.08: EMERGENCY CONDITIONS ............................................................... 34 3.8.1 Policy Statement .............................................................................................. 34 3.8.2 Best Practices, Criteria and Rationale .............................................................. 34
3.9 POLICY W.09: WATER CONSERVATION................................................................... 35 3.9.1 Policy Statement .............................................................................................. 35 3.9.2 Best Practices, Criteria and Rationale .............................................................. 35
3.10 POLICY W.10: DESIGN AND COSTING CRITERIA .................................................... 36 3.10.1 Policy Statement .............................................................................................. 36 3.10.2 Best Practices, Criteria and Rationale ............................................................. 36
4 WASTEWATER POLICIES ........................................................................................... 37 4.1 POLICY WW.01: SEWER USE CRITERIA................................................................... 39
4.1.1 Policy Statement .............................................................................................. 39 4.1.2 Best Practices, Criteria and Rationale ............................................................. 39

Regional Municipality of Peel
Water and Wastewater Policy Paper
March 31, 2014 iii
4.2 POLICY WW.02: PUMPING SYSTEMS RELIABILITY ................................................. 40 4.2.1 Policy Statement .............................................................................................. 40 4.2.2 Best Practices, Criteria and Rationale .............................................................. 40
4.3 POLICY WW.03: WASTEWATER TREATMENT REQUIREMENTS ............................. 41 4.3.1 Policy Statement .............................................................................................. 41 4.3.2 Best Practices, Criteria and Rationale .............................................................. 41
4.4 POLICY WW.04: DESIGN AND COSTING CRITERIA ................................................. 43 4.4.1 Policy Statement .............................................................................................. 43 4.4.2 Best Practices, Criteria and Rationale ............................................................. 43
4.5 POLICY WW.05: Canadian Council of Ministers of the Environment (CCME) ............... 44 4.5.1 Policy Statement .............................................................................................. 44 4.5.2 Best Practices, Criteria and Rationale .............................................................. 44
5 POLICY IMPLEMENTATION ........................................................................................ 45
6 SUMMARY .................................................................................................................... 46 List of Tables
Table 1 Summary of general water and wastewater policies .............................................................. 4 Table 2 Summary of water policies .................................................................................................. 23 Table 3 Summary of wastewater policies ......................................................................................... 38

Regional Municipality of Peel
Water and Wastewater Policy Paper
March 31, 2014 1
1 INTRODUCTION
The Region of Peel retained AECOM Canada Limited and BluePlan Consultants Limited to update the Water and Wastewater Master Plan for the Region’s lake-based water supply and wastewater collection systems. Development of water and wastewater policies and guiding principles is integral to provide guidance and direction to the master planning process.
1.1 STUDY BACKGROUND AND OBJECTIVES
The provision of safe and sustainable water and wastewater servicing is important for the public good. Applying reasonable policies is essential to ensure proper planning and design principles are followed in implementing system upgrades as well as operation and maintenance practices. The development of water and wastewater policies is based on existing documentation and related sources, including:
• The consolidated Region of Peel Official Plan;
• Federal and Provincial policies and legislation;
• Design and development standards;
• Municipal By-laws; and
• Existing municipal policies and procedures.
The objectives of the Water and Wastewater Policy Paper include:
• Providing direction for planning and identifying water and wastewater servicing issues that may impact growth options;
• Providing direction for normal operation and maintenance of the water and wastewater systems (the policies do not replace normal operation and maintenance procedures or best practices);
• Providing direction for development and evaluation of servicing alternatives for the Water and Wastewater Master Plan;
• Ensuring appropriate design and costing criteria are utilized for developing and evaluating servicing alternatives for the Water and Wastewater Master Plan;
• Setting policies that are reasonably implemented; and
• Setting policies that are robust and sustainable.
Although best management practices and criteria are updated over time the context, intent and validity of the policies should remain intact.

Regional Municipality of Peel
Water and Wastewater Policy Paper
March 31, 2014 2
1.2 APPROACH
The approach in establishing and implementing the water and wastewater policies is as follows:
1. Develop general policies as well as separate water and wastewater policies. 2. Address issues related to the full cycle of water and wastewater services from the water
source to the customer and from the customer to the treated wastewater discharge. 3. Highlight key criteria and best practices related to each policy. 4. Provide an open forum workshop including various Region of Peel departments to
discuss and develop the policies. 5. Consolidate the general, water and wastewater policies in a Policy Paper. 6. Utilize the criteria and best management practices outlined in the Policy Paper to guide
the development and evaluation of servicing alternatives for the Master Plan. 7. Implement the policies through utilizing the guidelines, criteria and best practices within
the day-to-day decision making for planning and operation of the water and wastewater systems.

Regional Municipality of Peel
Water and Wastewater Policy Paper
March 31, 2014 3
2 GENERAL WATER AND WASTEWATER POLICIES
Policies and guiding principles that impact both water and wastewater are outlined in this section. A summary of the General Water and Wastewater Policies is provided Table 1. This summary is followed by separate sub-sections for each policy that provide additional details.

Regional Municipality of Peel
Water and Wastewater Policy Paper
March 31, 2014 4
Table 1 Summary of general water and wastewater policies
GENERAL POLICIES
Policy Policy Policy Statement Best Practices and Criteria
G.01 General
“The Region of Peel shall harmonize planning and
servicing policies and processes within the Region of
Peel Planning and Public Works Departments.”
• The Region should ensure planning and servicing requirements are coordinated within typical Regional exercises including Official Plan updates and development coordination.
G.02 General
“The Region of Peel shall establish a baseline population
and employment projections to 2031 through
coordination with Regional Planning, local municipal
• The Region should review the timing of growth with consideration to a reasonable implementation schedule for infrastructure required to meet the projected growth.
G.03 General
“The Region of Peel shall harmonize planning and
servicing policies and strategies with provincial and
regional policies and strategies.”
• The Region should comply with the requirements of the Greenbelt Protection Act and the Places to Grow Act. • The Region should review the impact of provincial requirements on the required infrastructure. • The Region should evaluate servicing strategies and requirements of neighbouring municipalities to determine
potential impact to the Region's servicing strategies • Where applicable, the Region should consider harmonizing servicing strategies. • Water and wastewater servicing strategies and needs in neighbouring municipalities could impact the timing of the
Region's implementation program.
G.04 General “The Region of Peel shall meet the servicing
requirements of the York Peel water and wastewater
Agreement.”
• The conditions and approved flows must be met as per agreement.
G.05 General
“The Region of Peel shall ensure that the design of water
and wastewater infrastructure recognizes the potential for
growth beyond the time horizon of the Official Plan.”
• Recognize that the service life of infrastructure may be greater than 60 years. • Evaluate the value of strategic oversizing versus future twinning of services. • Consider:
o potential ultimate site requirements; o potential for phasing implementation and construction; o minimizing disruption to residents and the environment; o potential need for infrastructure oversizing; and o operational impacts of oversizing compared with phased upgrades.
G.06 General
“The Region of Peel shall maximize the use of existing
capacity, prior to the upgrading or expansion of
infrastructure.”
• Planning and design of servicing strategies should utilize capacity of existing infrastructure where available.
G.07 General
“The Region of Peel shall maintain sufficient reserve
capacity in its water and wastewater infrastructure and
facilities to provide operational flexibility and meet
potential changes in servicing conditions.”
• Recognize the timeframe required to implement expansion of the infrastructure and facilities and initiate planning, the EA process, design and construction for expansion with consideration of the in-service date.
• Consider timing the expansions to withstand impacts from: o Extreme conditions (such as power failures); o Equipment shutdowns (planned or unplanned); o Fluctuation in growth rates; o Fluctuating demand criteria; o Decreasing system and equipment performance; and o Potential decreases in capacity to facilitate the expansions.
• Ensure an effective operating capacity is maintained in scheduling future expansions of the infrastructure.

Regional Municipality of Peel
Water and Wastewater Policy Paper
March 31, 2014 5
GENERAL POLICIES
Policy Policy Policy Statement Best Practices and Criteria
G.08 General “The Region of Peel shall adopt Regional development
standards, design standards and by-laws.”
• Ensure consistency with best management practices. • Ensure consistency of processes and equipment within facilities. • Incorporate feedback from Operations and Maintenance staff. • Ensure standards address all systems in the Region of Peel.
G.09 General
“The Region of Peel shall implement best practices and
standards to ensure system efficiency and optimization
through infrastructure planning, design, operation and
maintenance.”
• All aspects of planning, design, operation and maintenance should consider efficiency and optimization. • Where applicable, implementation of energy-efficient components and/or practices and their impact on the full life-
cycle costing should be evaluated. • Maintenance management systems should be developed to ensure that equipment is properly maintained and
operating efficiently.
G.10 General
“The Region of Peel shall ensure open communication
between the public, review agencies, area municipalities
and Regional departments.”
• Standard Operating Procedures and Reporting Protocols must be formed, possibly including: o Points of public contact; o Points of contact with regulatory agencies; and o Points of contact with internal staff and other departments.
G.11 General
“The Region of Peel shall locate all of its services and
facilities on public property or on acceptable municipally-
owned easements.”
• The Region should ensure that any new and existing infrastructure is located within road right-of-ways or on Region- owned property (including designated lots and easements).
• Adequate property size should be maintained to facilitate all day-to-day activities and emergency response. • Adequate property should be acquired to meet future infrastructure requirements. • Where possible, temporary and/or permanent public use alternatives (such as recreational facilities) should be
considered for Regionally-owned easements and lots.
G.12 General
“The Region of Peel shall continue to monitor water and
wastewater system conditions and water production and
wastewater collection flow information.”
• Monitor water production, water consumption, pumping station and reservoir data, billing records and data for residential and non-residential land uses.
• Monitor wastewater flows to the plant, pumping station data, infiltration, and data for residential and non-residential land uses.
• Use the data to gauge changes in trends in water use that might impact capital programs or billings.
G.13 General “The Region of Peel shall conserve and sustain water
resources for present and future generations”
• Prepare sustainability plans for water and wastewater services • Foster innovative water and wastewater technologies, services and practices
G.14 General
“The Region of Peel will consider and plan for the effects
of climate change, and take actions to reduce
greenhouse gas emissions”
• Promote sustainable infrastructure • Address water, natural heritage and land management issues related to climate change through integrated watershed
management • Redesign and retrofit water collection and conveyance infrastructure and systems to reduce vulnerabilities due to
climate change • Building on existing programs, implement additional water quality and water and wastewater conservation strategies
and incentives
G.15 General “The Region of Peel shall meet the servicing
requirements of the Toronto Peel wastewater Agreement” • Meet conditions of the Agreement, once finalized

Regional Municipality of Peel
Water and Wastewater Policy Paper
March 31, 2014 6
2.1 POLICY G.01: HARMONIZE POLICIES AND PROCESSES
2.1.1 Policy Statement
“The Region of Peel shall harmonize planning servicing policies and processes within the Region of Peel's Planning and Public Works Departments.”
2.1.2 Best Practices, Criteria and Rationale
Land-use planning and development of efficient servicing systems are concurrent processes. The policies from each activity should exist in harmony and be incorporated into all planning exercises. The Region of Peel shall comply with the servicing requirements of the Greenbelt Act (Bill 135) and the Places to Grow Act (Bill 136) to restrict urban sprawl and promote development in an orderly fashion.

Regional Municipality of Peel
Water and Wastewater Policy Paper
March 31, 2014 7
2.2 POLICY G.02: ESTABLISHING BASELINE POPULATION AND EMPLOYMENT PROJECTIONS
2.2.1 Policy Statement
“The Region of Peel shall establish baseline population and employment projections to 2031 through coordination with Region of Peel Planning, area municipality planning and Public Works.”
2.2.2 Best Practices, Criteria and Rationale
The timing of growth should be reviewed with consideration to a reasonable implementation schedule for infrastructure. Population: Review historical birthrates, natural increases, survival rates and migration for the population of the Region of Peel. Employment: Review historical Regional employment for each area municipality within the Region of Peel.

Regional Municipality of Peel
Water and Wastewater Policy Paper
March 31, 2014 8
2.3 POLICY G.03: HARMONIZE PLANNING AND SERVICING POLICIES AND STRATEGIES
2.3.1 Policy Statement
“The Region of Peel shall harmonize planning and servicing policies and strategies with Provincial and Regional policies and strategies.”
2.3.2 Best Practices, Criteria and Rationale
The Region should evaluate servicing strategies and requirements of neighbouring municipalities to determine potential impacts to the Region of Peel’s servicing strategies. If feasible, providing water and wastewater servicing to neighbouring municipalities could facilitate efficient use of resources with fewer environmental impacts. Where applicable, the Region should consider harmonizing servicing strategies with the development and review of master plans. Water and wastewater servicing strategies and needs in neighbouring municipalities could impact the timing of the Region of Peel’s implementation program.

Regional Municipality of Peel
Water and Wastewater Policy Paper
March 31, 2014 9
2.4 POLICY G.04: EXISTING SERVICING AGREEMENT
2.4.1 Policy Statement
“The Region of Peel shall meet the servicing requirements of the York-Peel Water and Wastewater Servicing Agreement.”
2.4.2 Best Practices, Criteria and Rationale
An agreement exists between the Region of Peel and York Region governing the supply of water from the Region of Peel to York Region and the acceptance of wastewater flows by the Region of Peel from York Region. The conditions and approved flows must be met as per agreement.

Regional Municipality of Peel
Water and Wastewater Policy Paper
March 31, 2014 10
2.5 POLICY G.05: PLANNING HORIZON
2.5.1 Policy Statement
“The Region of Peel shall ensure that the design of water and wastewater infrastructure recognizes the potential for growth beyond the planning horizon of the Official Plan.”
2.5.2 Best Practices, Criteria and Rationale
Official Plans have a typical planning horizon of 20 years, although amendments or regular updates during the horizon are common. A 20-year horizon for planning population growth and land use is reasonable and promotes orderly growth. However, the life expectancy of most water and wastewater infrastructure is significantly longer and frequently exceeds 60 years. Therefore, to avoid disruption through the urban core every 20 years to upgrade or expand infrastructure, a longer time frame needs to be used. Strategic oversizing is a common result of a longer planning horizon for infrastructure since pipe capacity increases exponentially with diameter while capital costs tend to increase linearly with diameter. The extent of oversizing will vary with local conditions such as the impact of topography or with Regional boundaries and should be addressed on a case-by-case basis. Care must be taken to ensure that short-term operation is not negatively impacted by excessive oversizing. This concern is particularly significant in ensuring that cleansing velocities are maintained in sewers and force mains. It is essential to develop a cost-effective approach to upgrade capacity or expand facilities in the future. Issues such as initial capital outlay, building dimensions, space for new pumps, space for building expansion, space in right-of-ways for future infrastructure need to be considered in the overall evaluation. This process also applies to property requirements, ensuring allowance for growth on the property and ensuring optimum site locations for the initial phases. The impact of strategic oversizing on Development Charges must also be considered such that the capacity for servicing within the Official Plan planning horizon and the capacity for servicing beyond the planning horizon are identified and financed appropriately.

Regional Municipality of Peel
Water and Wastewater Policy Paper
March 31, 2014 11
2.6 POLICY G.06: MAXIMIZE USE OF EXISTING INFRASTRUCTURE
2.6.1 Policy Statement
“The Region of Peel shall maximize the use of existing capacity prior to the upgrading or expansion of infrastructure.”
2.6.2 Best Practices, Criteria and Rationale
The investment in the existing infrastructure coupled with the cost and social and environmental impacts of constructing new facilities should be considered where capacity already exists. In utilizing existing capacity of infrastructure, there needs to be a balance struck in maximizing the use of the existing infrastructure while maintaining reserve capacity and ensuring acceptable operating conditions are sustained. The maximum acceptable criteria should not be exceeded, including pipe velocities, operating pressures, sewer pipe surcharging conditions and firm pumping capacities. The use of existing infrastructure should not compromise the level of service being provided to existing customers. However, should existing infrastructure exist and have available capacity, considering servicing alternatives should evaluate the ability to utilize this capacity versus new infrastructure to determine the most cost-effective and technically viable solution. The availability of calibrated hydraulic water and wastewater models is critical in achieving this policy. It is also recognized that other planning criteria may outweigh the desirability to maximize every facet of the current systems.

Regional Municipality of Peel
Water and Wastewater Policy Paper
March 31, 2014 12
2.7 POLICY G.07: RESERVE CAPACITY
2.7.1 Policy Statement
“The Region of Peel shall maintain sufficient reserve capacity in its water and wastewater infrastructure and facilities to provide operational flexibility and meet potential changes in servicing conditions.”
2.7.2 Best Practices, Criteria and Rationale
Just-in-time infrastructure development offers advantages in managing cash flow for capital programs and in the ability to employ the best available technology. However, care must be taken to ensure that projects are initiated in sufficient time to allow the necessary steps for implementation. These steps include: 1. Consultant Selection Processes The Region has a formalized process for consultant selection that encompasses expression of interest, short-listing of qualified firms, detailed proposals, analysis and council ratification of the recommended firm. 2. MEA Class EA For straightforward projects without significant social or environmental issues the requirements of the EA process typically require about six months to complete. For projects that are controversial or require significant input for agencies such as the MOE or the conservation authorities, a minimum time frame of 12 to 18 months should be budgeted. Controversial projects may take significantly longer. 3. Property Negotiations The EA process allows the Region to initiate property negotiations at any time without this being considered pre-empting due consideration for all alternatives. However, if required, at least 12 months should be allowed for expropriation. 4. Design and Construction The time frame for linear works such as feeder mains or trunk sewers is generally less than for multi-disciplinary works such as pumping or treatment works. A time frame of 18 months is not unreasonable for major feeder mains through urban or sensitive areas or could be considered as a minimum time frame for pumping station or reservoir projects. The Region should allow 30 to 36 months for major works at the treatment plants. The extra time may be utilized for equipment procurement or prequalification of contractors as well as the tendering and award process. 5. Commissioning Considering the anticipated time frame to implement infrastructure upgrades, sufficient scheduling and planning needs to take place to ensure the upgrades are commissioned prior to reaching existing infrastructure capacity.

Regional Municipality of Peel
Water and Wastewater Policy Paper
March 31, 2014 13
During the implementation of any project, the Region can expect that the demand load on the existing facilities will continue to grow. While growth rate over the long term may be averaged, market-driven fluctuations in the growth rate may result in achieving the design projects sooner or later than expected. Coordination between engineering planning and land use planning will help to ensure that facilities are in place as needed. The projections used to estimate the year in which the infrastructure will reach capacity can be subject to actual in-field fluctuations in the base criteria due to conditions such as:
• Weather;
• Per capita consumption/generation;
• Changing growth rates;
• Desired level of service under extreme conditions such as power failures;
• Planned or unplanned equipment shutdowns; and
• Decreasing system and equipment performance.
As such, maintaining reserve capacity to ensure upgrades are not provided just-to-late is good practice.

Regional Municipality of Peel
Water and Wastewater Policy Paper
March 31, 2014 14
2.8 POLICY G.08: STANDARDS AND BY-LAWS
2.8.1 Policy Statement
“The Region of Peel shall adopt Region-wide development standards, design standards, and By-laws.”
2.8.2 Best Practices, Criteria and Rationale
Maintaining a high level of service requires that water and wastewater facilities be constructed to reasonable levels of quality of equipment and materials and be designed with operational requirements in mind. It is important to have reasonable uniformity in the basic layout of facilities and to limit the number of manufacturers of specialty equipment. These objectives help to reduce the inventory of spare parts needed, assist staff in troubleshooting problems, and improve their ability to resolve issues quickly. Region-wide standards and By-laws help to achieve consistency in development and design, optimize operations and maintenance, and consolidate practices from the municipalities. The following principles should be followed to achieve these goals:
• Adopt Region-wide development standards;
• Adopt Region-wide design standards;
• Adopt Region-wide by-laws; and
• Adopt Region-wide acceptable manufacturers lists.

Regional Municipality of Peel
Water and Wastewater Policy Paper
March 31, 2014 15
2.9 POLICY G.09: SYSTEM EFFICIENCY AND OPTIMIZATION
2.9.1 Policy Statement
“The Region of Peel shall implement best practices and standards to ensure system efficiency and optimization through infrastructure planning, design, operation and maintenance.”
2.9.2 Best Practices, Criteria and Rationale
All aspects of planning, design, operation and maintenance should consider efficiency and optimization and not be limited to specific power supplies, materials, design, layout or operational practices. Where applicable, implementation of energy-efficient components and practices and their impacts on the full lifecycle costing should be evaluated. Consideration shall be given to replacing equipment that is no longer energy efficient, particularly where long-term cost savings can be realized. The Region of Peel should minimize losses from the water distribution system through water loss audits, district metering and leak detection programs. Maintenance management systems should be developed such that all equipment is properly maintained. This will reduce down time for individual pieces of equipment, resulting in reduced loads on parallel systems and overall operating efficiency. Feedback and operational experience should be incorporated to guide the optimization of the design and operation of future facilities and also to design retrofits to existing facilities.

Regional Municipality of Peel
Water and Wastewater Policy Paper
March 31, 2014 16
2.10 POLICY G.010: COMMUNICATION
2.10.1 Policy Statement
“The Region of Peel shall maintain operating procedures that support open communications between the Region’s departments, the public and review agencies.”
2.10.2 Best Practices, Criteria and Rationale
Each Region of Peel department may be impacted by the performance of Public Works and by the policies implemented by Public Works. Communication between departments and with the public and regulatory agencies should follow an established protocol that would address:
• Points of public contact;
• Points of contact with regulatory agencies; and
• Points of internal staff contact.

Regional Municipality of Peel
Water and Wastewater Policy Paper
March 31, 2014 17
2.11 POLICY G.11: LOCATION OF MUNICIPAL/REGIONAL SERVICES AND FACILITIES
2.11.1 Policy Statement
“The Region of Peel shall locate all of its services and facilities on public property or on Regional municipally owned easements.”
2.11.2 Best Practices, Criteria and Rationale
Operation and maintenance of Regional facilities and services could be compromised if staff does not have direct access. The Region should ensure that new and existing infrastructure is located within road rights-of-way or on property owned by the Region of Peel, including designated lots and easements. Adequate property should be maintained to facilitate all day-to-day activities and emergency responses, such as to repair a water main break.
Regional Municipality of Peel
Water and Wastewater Policy Paper
March 31, 2014 18
2.12 POLICY G.12: MONITORING
2.12.1 Policy Statement
“The Region of Peel shall continue to monitor water and wastewater system conditions and water production/wastewater collection flow information.”
2.12.2 Best Practices, Criteria and Rationale
The Region of Peel is currently recording system information on a regular basis. It is essential that relevant system data be recorded and maintained in a useable format to support dayto-day planning, analysis, operations and maintenance of the water and wastewater systems. From a planning and design perspective, system data and historical information will provide the basis for establishing and using planning and design criteria for the Master Plan. Key data include:
• Water production records from the water treatment plants;
• Water consumption records from the billing system;
• System pressures and flows from system operations records, hydrant tests and other system data recording projects;
• Pumping station operating records including pump run times, flow rates and station pressures;
• Reservoir operating level records;
• Water quality data at the water treatment plants and throughout the distribution system;
• Wastewater flow records from the wastewater treatment facilities;
• System flows from in-line monitoring and other system data recording projects; and
• Pumping station operating records including pump run times, flow rates and station pressures.
These data need to be correlated from system databases, SCADA information and project records.

Regional Municipality of Peel
Water and Wastewater Policy Paper
March 31, 2014 19
2.13 POLICY G.13: SUSTAINABILITY OF WATER RESOURCES
2.13.1 Policy Statement
“The Region of Peel shall conserve and sustain water resources for present and future generations”
2.13.2 Best Practices, Criteria and Rationale
The Region of Peel will prepare sustainability plans for water and wastewater services and will endeavor to foster innovative water and wastewater technologies, services and practices in order to conserve and sustain water resources for present and future generations.

Regional Municipality of Peel
Water and Wastewater Policy Paper
March 31, 2014 20
2.14 POLICY G.14: CLIMATE CHANGE
2.14.1 Policy Statement
“The Region of Peel will consider and plan for the effects of climate change, and take actions to reduce greenhouse gas emissions” Best Practices, Criteria and Rationale
The Region of Peel will promote sustainable infrastructure in its planning, design, implementation and operation of its water and wastewater services. The Region will endeavor to address water, natural heritage and land management issues related to climate change through integrated watershed management. It is considered good practice to review the feasibility of reducing vulnerabilities due to climate change through redesign and retrofit of water collection and conveyance infrastructure.

Regional Municipality of Peel
Water and Wastewater Policy Paper
March 31, 2014 21
2.15 POLICY G.15: TORONTO-PEEL WASTEWATER AGREEMENT
2.15.1 Policy Statement
“The Region of Peel shall meet the servicing requirements of the Toronto-Peel Wastewater Servicing Agreement.”
2.15.2 Best Practices, Criteria and Rationale
A draft agreement exists between the Region of Peel and the City of Toronto regarding the acceptance of wastewater flows by the Region of Peel from York Region and vice versa. The conditions and approved flows must be met as per agreement, once this document is finalized.

Regional Municipality of Peel
Water and Wastewater Policy Paper
March 31, 2014 22
3 WATER POLICIES
Policies and guiding principles that impact water servicing are outlined in this section. A summary of the Water Policies is provided in Table 2. This summary is followed by separate sub-sections for each policy that provide additional details.

Regional Municipality of Peel
Water and Wastewater Policy Paper
March 31, 2014 23
Table 2 Summary of water policies
WATER POLICIES
Policy Policy Area Policy Statement Best Practices and Criteria
W.01 Raw Water Quality “The Region of Peel shall endeavour to protect its raw
water sources.”
• Discharge a high quality effluent from Peel’s wastewater treatment plants and comply with Toronto and Region RAP, Etobicoke and Mimico Creek Watershed Strategy, Humber River Watershed Plan, Credit River Water Management Strategy, F-5-5 targets, CCME Strategy, and/or new regulations as applicable.
• Interact with the stormwater and water resources policies • Monitor water quality of the lake and, if necessary, evaluate and optimize the water treatment plant intake
location • Continue participation in the International Joint Commission on the Great Lakes and address water quality
issues for Lake • Ontario • Continue coordination with the Source Protection Act.
W.02 Water Treatment
and Distribution
“The Region of Peel shall meet or exceed legislated
water quality criteria.”
• Water quality should meet or exceed all legislated criteria • Water quality objectives should meet or exceed historical performance • Maximize the potential capacity and performance of the facilities and equipment to achieve the best water
quality on an on-going basis • Review the economics, reliability and water quality impacts of implementing new technology • Implement best practices to ensure sustainability of Operations and Maintenance, Maintenance Management
Systems, Training, • Manuals and other monitoring/trending data.
W.03 Water Treatment
and Distribution
“The Region of Peel shall provide potable water at
adequate pressure and flow to its customers.”
• Provide pressures and flows which meet current design criteria and standards • MOE Guidelines identify a typical recommended operating range of 275-700 kPa (40-100 psi) • Evaluate impacts of tightening operating pressure range.
W.04 Water Treatment
and Distribution
“The Region of Peel shall provide reliability and security
throughout the water distribution system.”
Objectives can be achieved through implementing best practices including the following: • Multiple supply points to service areas and pressure districts • Twinning major feeder mains • Looping of water mains • Providing stand-by power • Providing sufficient valves to ensure that critical water mains can be isolated for maintenance or repair • Regular maintenance • Repair and replacement programs • Staff training.
W.05 Water Treatment
and Distribution
“The Region of Peel shall ensure that acceptable water
quality is maintained throughout the distribution
system.”
Objectives can be achieved through implementing best practices including the following: • Looping of water mains • Regular and unidirectional flushing of the water mains • Rechlorination where necessary to maintain residual criteria • Optimizing operational practices for storage facilities and booster pumping stations • Examine use of back flow preventors (industrial vs. other areas) • Replacement of cast iron water mains • Monitoring of facilities for malfunction and for intrusion.

Regional Municipality of Peel
Water and Wastewater Policy Paper
March 31, 2014 24
WATER POLICIES
Policy Policy Area Policy Statement Best Practices and Criteria
W.06 Water Treatment
and Distribution
“The Region shall consider the Ministry of the
Environment Guidelines and the Insurance
Underwriters Guidelines for establishing the acceptable
level of fire protection.”
• Provide pressures and flows that meet current design criteria and standards • Consider establishing separate minimum criteria and standards for both urban and rural servicing • Dialogue with fire department, industry leaders and insurance industry
W.07 Water Treatment
and Distribution
“The Region of Peel shall adopt the Ministry of the
Environment Guidelines as the minimum acceptable
level of water storage.”
• Provide adequate level of storage which meets current design criteria and standards. • Consider establishing separate minimum criteria and standards for both urban and rural servicing. • Consider level of storage required under floating versus pumped conditions.
W.08 Emergency
Conditions
“The Region of Peel shall have an adequate
combination of reservoir capacity, pumping capacity
and stand-by power to meet the desired level of service
under emergency conditions.”
• Determine the level of service to be provided under emergency conditions including the following criteria: • Water demand conditions to be met (i.e., average day vs. maximum day) • Acceptable pressures and flows • Duration to be met.
W.09 Water Conservation “The Region of Peel shall encourage and promote
water conservation.”
• Consider the impact to the design criteria. • Consider the impact to scheduling future infrastructure. • Objectives can be achieved through implementing best practices including the following:
o Restricted lawn watering by-law o Public education o Plumbing code requirements for new construction including low-flow aerators, shower heads and toilets o Use of rain barrels o Encouraging low-maintenance landscaping and native species o Implementing an increasing block water rate structure.
W.10 Design and Costing
Criteria
“The Region of Peel shall utilize reasonable design and
costing criteria for establishing and evaluation servicing
scenarios.”
• Criteria should be based on: o Historical records and projections thereof o MOE guidelines.
• Consider separate criteria for urban and rural areas • Consider differentiating criteria for land uses

Regional Municipality of Peel
Water and Wastewater Policy Paper
March 31, 2014 25
3.1 POLICY W.01: RAW WATER SOURCE PROTECTION
3.1.1 Policy Statement
“The Region of Peel shall endeavour to protect its raw water sources.”
3.1.2 Best Practices, Criteria and Rationale
This policy applies to all Region of Peel communal systems, including both lake-based and groundwater-based systems. 1. Discharge a high-quality effluent from the Region of Peel’s wastewater treatment facilities. The Region has direct legislated responsibility for the collection and disposal of wastewater and in the level of treatment prior to discharge. This distinct policy will ensure that the Region meets its commitments to the existing criteria and to new regulations, as applicable. 2. Monitor water quality of the lake and if necessary, evaluate and optimize the water treatment plant intake location. The lake water quality has changed over the past few decades as stricter controls have been enforced on both storm and wastewater discharge. Agricultural practices have also improved with better nutrient management, driven more by the cost of fertilizers than by legislation. Therefore, the Region does not expect to see a deterioration of the lake water quality. By standard operating practice the raw water quality would be recorded on an ongoing basis and gradual changes, if any, could be trended. However, new point sources such as new wastewater outfalls could impact the intake under specific conditions of wind deviation and currents. There may also be a desire to extend the intake to deeper water to get lower year-round temperatures. 3. Continue participation in the International Joint Commission on the Great Lakes and address water quality issues for Lake Ontario. Lake water quality will be influenced more by the land uses and discharges across the whole of the Great Lakes than by actions taken by the Region of Peel on its own. Therefore, the Region should participate in the policies promoted by the International Joint Commission.

Regional Municipality of Peel
Water and Wastewater Policy Paper
March 31, 2014 26
3.2 POLICY W.02: TREATED WATER QUALITY
3.2.1 Policy Statement
“The Region of Peel shall meet or exceed legislated water quality criteria.”
3.2.2 Best Practices, Criteria and Rationale
1. Water quality should meet all legislated criteria. The rationale to meet legislated criteria is straightforward in that the Province has established the requirements for maximum permissible concentrations for parameters based on mitigating either health-related issues or aesthetic issues. The social and legal consequences of not meeting the requirements can be significant and certainly not be contemplated. 2. Water quality objectives should meet or exceed historical performance. The Region has the opportunity to exceed certain parameters on an on-going basis and has historically achieved this goal. The raw water quality within the Lake Ontario basin already exceeds the requirements for many of the criteria and the level of treatment needed to meet and exceed legislated criteria is already in place. Historical performance was recognized when reviewing the water quality objectives to be enforced within the agreement for contracting out the operations. While the operations may eventually become a Regional responsibility, the treatment objectives should continue as tabled. Seasonal changes do occur in the lake and raw water quality and treatability will be impacted by those changes, including temperature change, storm events, and algae decay. However, throughout the year there will be the ability to achieve a level of optimization of the available equipment to produce the best water quality in the given circumstances. 3. Maximize the potential capacity and performance of the facilities and equipment to achieve the best water quality on an on-going basis. As with all best practices, the concept of reasonableness should apply to balance of cost and effort to achieve an incremental gain. 4. Review the economics, reliability and water quality impacts of implementing new technology. Abundant technologies are available, or likely to become available, to improve water quality. The policy statement is not intended to commit the Region to implement each technological advance as it becomes available. Rather, it is expected that Region staff will monitor technological advances and trends in legislation and monitoring the needs and desires of its customers. At key milestones, such as when implementing expansions or major equipment replacements, it is expected that the implementation process would incorporate a first principles approach to decision making with respect to the opportunity to upgrade the facilities. A set of criteria, with appropriate weighting, would be employed to achieve the optimum balance of economics, ease of operations and maintenance, proven technologies, level of treatment performed, land area requirements, energy consumption, and quantity and quality of water generated.

Regional Municipality of Peel
Water and Wastewater Policy Paper
March 31, 2014 27
5. Implement best practices to ensure sustainability of Operations and Maintenance, Maintenance Management Systems, Training, Manuals and other monitoring and trending data. Maximizing the use and lifespan of the past investment in water, or wastewater, infrastructure is a fundamental economic responsibility of all staff. To ensure that all levels of staff can fulfill their roles, it is appropriate that the tools be in place and that performance is monitored. The tools would include:
• Maintenance management systems;
• Benchmarking;
• Staff training in water treatment technologies, in mechanical and electrical equipment troubleshooting and maintenance, and in health and safety;
• Availability of descriptive manuals; and
• ISO 14001 is also a useful mechanism to ensure repeatability in the level of performance.

Regional Municipality of Peel
Water and Wastewater Policy Paper
March 31, 2014 28
3.3 POLICY W.03: SYSTEM OPERATING CONDITIONS
3.3.1 Policy Statement
“The Region of Peel shall provide potable water at adequate pressure and flow to its customers.”
3.3.2 Best Practices, Criteria and Rationale
1. Provide pressures and flows that meet current design criteria and standards. The fundamental purpose of the distribution system is to convey water to the consumer and deliver it at useful flow rates and pressures. The demands imposed on the system vary with the type of consumer and the waterworks industry recognizes the variation in both volume demand and diurnal needs for the district categories of residential, commercial and industrial demands. Within these broad land uses it is expected that there will be some variation in needs as well as a desire to achieve the highest possible level of fire protection. It is industry accepted practice that reasonable limits be applied to balance economics with the community needs. Hence, design criteria for demand and residual pressures are routinely established such that the distribution system planner may adequately size the system and such that the consumer has an expectation of the level of service available. This is particularly important to the industrial and commercial sector for water consuming industries and for the design of sprinkler systems. The establishment of general design criteria does not suggest that exceptions could not occur in individual cases. 2. MOE Guidelines identify a typical recommended operating pressure range in the distribution system of 275 to 700 kPa (40 to 100 psi). Historically, the MOE has used a pressure range of 275 to 700 kPa (40 to 100 psi) as an acceptable range of useful pressures at the street level that provides adequate residual pressure to deliver the desired flows to low-rise development. High-rise development regularly uses booster pumping systems installed as part of the plumbing of the building to provide adequate pressure for upper floors. The upper range of pressures give adequate factors of safety for the use of pressurized hot water tanks, and a reasonable life span to tap washers. 3. Evaluate impacts of tightening the operating range. As the land rises from the lake the available pressure in the system decreases accordingly. Given the total range of topography in the Region of Peel service area, multiple pressure zones are required. As development across the escarpment is disjointed multiple pressure zones have resulted. These have generally been based on supplying residual pressures between 275 kPa (40 psi) under peak demand conditions and 700 kPa (100 psi) under low demand conditions. Within the zones, where land does not rise gradually or uniformly, local high and low points will occur. Within these areas, it is not uncommon to have pressures outside the desirable range. Residents with lower than acceptable pressures suffer more adverse impacts as the time to fill multiple water consuming devices may be excessive. Within the alternatives to be reviewed within the Master Plan it is proposed to look at the potential to revise the design criteria for the acceptable range of residual pressures. However, the Region expects that existing reservoir elevations and pump systems are in place on the basis of the existing criteria, we

Regional Municipality of Peel
Water and Wastewater Policy Paper
March 31, 2014 29
expect the economic impact to be substantial. Rather, the Region will look at how identified local low pressure areas may be resolved on an individual basis. The economic impact of changing design criteria for new development areas will be tabled.

Regional Municipality of Peel
Water and Wastewater Policy Paper
March 31, 2014 30
3.4 POLICY W.04: SYSTEM RELIABILITY
3.4.1 Policy Statement
“The Region of Peel shall provide reliability, redundancy, and security throughout the water distribution system.”
3.4.2 Best Practices, Criteria and Rationale
Recognizing that all systems are susceptible to some level of failure or breakdown, or need to be taken out of service for regular maintenance, it is reasonable to provide a level of reliability to ensure an acceptable level of service is maintained. While municipalities do not generally guarantee service, the economic impact on business of a failure of the system can be significant. The provision of basic services can be a decisive factor in determining where an industry will locate. A high level of service to all consumers will also be dependent on maintaining continuous flow under all but the most exceptional or circumstances. A number of examples of how security of supply within the distribution system can be maintained or enhanced are as follows:
• Multiple supply points to service areas and pressure zones;
• Twinning major feeder mains;
• Looping of water mains;
• Providing standby power;
• Providing sufficient valves to ensure that critical water mains can be isolated for maintenance or repair;
• Regular maintenance;
• Repair and replacement programs; and
• Staff training.

Regional Municipality of Peel
Water and Wastewater Policy Paper
March 31, 2014 31
3.5 POLICY W.05: SYSTEM WATER QUALITY
3.5.1 Policy Statement
“The Region of Peel shall ensure that acceptable water quality is maintained throughout the distribution system.”
3.5.2 Best Practices, Criteria and Rationale
In addition to maintaining supply at adequate pressures, the issue of potential deterioration of water quality in the distribution system must also be addressed. Water leaving the central treatment facilities must be tested, meet all objectives and include a residual chlorine level for protection against biological contamination in the distribution system. However, the effectiveness of the chlorination will decay over time as a function of several factors. These factors include reaction within old cast iron mains forming relatively stable chlorides, dissipation from the free surface of reservoirs, or absorption on organic matter that may have gained entry to the system. Current regulations require that the Region regularly test for chlorine residual in the system and, rationally, this means searching out the most likely places for low residuals. Objectives can be achieved through implementing best practices including:
• Looping of water mains;
• Regular and unidirectional flushing of the water mains;
• Re-chlorination where necessary to maintain residual criteria;
• Optimizing operational practices for storage facilities and booster pumping stations;
• Use of back flow preventers;
• Replacement of cast iron water mains; and
• Monitoring of facilities for malfunction and for intrusion.
Since Walkerton, there has been attendance in some locations across Ontario to set chlorine levels leaving the treatment plant at 1.5 mg/L or higher. With some waters, including Lake Ontario, this can produce a distinct chlorine taste, which may defeat the objective of large investments in treatment technology. Reservoir and pumping station sites offer ideal locations to monitor residual chlorine levels on an ongoing basis and as locations for installation of facilities to boost residuals levels such that residents across the service area may enjoy a safe and palatable water supply.

Regional Municipality of Peel
Water and Wastewater Policy Paper
March 31, 2014 32
3.6 POLICY W.06: FIRE FLOW REQUIREMENTS
3.6.1 Policy Statement
“The Region of Peel shall consider the Ministry of the Environment Guidelines and the Insurance Underwriters Guidelines for establishing the acceptable level of fire flow.”
3.6.2 Best Practices, Criteria and Rationale
The provision of water for fire protection is a standard feature of municipal water systems and provides the potential to save lives, reduce property damage, and preserve jobs that might otherwise be lost through fire. On an ongoing basis the availability of a piped municipal water system also reduces property insurance premiums. There has been debate over many years around the level of protection needed to give a high level of firefighting capability and the cost of providing it. The MOE and the insurance industry have had differing opinions. MOE have traditionally focused on the community population, as the basis for calculating fire demand while the insurance industry focuses more on the structures at risk. As the MOE Guidelines have tended to focus more on application to all communities across Ontario, where 90 per cent have populations under 15,000, we suggest that the insurance industry approach has more validity in the Region of Peel. However, it would be impractical to micro manage the system to calculate the optimum needs for every building or industry and thus for system design a range of minimum flows and pressures should be adopted for a broad range of service areas including:
• Residential;
• Commercial and institutional; and
• Industrial.
Special cases may also be considered on an individual basis and those discussions may also incorporate cost sharing of system enhancements.
Regional Municipality of Peel
Water and Wastewater Policy Paper
March 31, 2014 33
3.7 POLICY W.07: STORAGE REQUIREMENTS
3.7.1 Policy Statement
“The Region of Peel shall consider the Ministry of the Environment Guidelines for establishing the acceptable level of water storage.”
3.7.2 Best Practices, Criteria and Rationale
In addition to reservoir storage requirements for fire protection, storage is also routinely provided to accommodate the fluctuating demands throughout the day. Water is consumed at different rates throughout the day and peak rates of consumption may be three times the annual average demand. Storage can provide equalization of these peak rates for the system, which are typically over and above firm pumping station capacities. Based on the MOE Guidelines, the storage volume required for each pressure zone is determined as follows: A Equalization storage based on 25 per cent of maximum day demand B Fire flow storage based on fire flow rate and duration in relation to total equivalent population or worst case fire flow need (i.e. major industry) C Emergency storage based on 25 per cent of A + B For each pressure zone, this storage can be provided either through floating storage with elevated tanks or reservoirs at the hydraulic grade line (HGL) of the pressure district or through pumped storage from reservoirs located at pumped supply points to the pressure district. All storage facilities that contribute to each pressure district should be evaluated to ensure the minimum storage requirement is provided. Storage facilities that support pumped supply to closed pressure zones should consider additional storage volume to sustain additional pumping requirements in meeting peak demands. Determination of storage volume should also be coordinated with requirements of the Emergency Conditions Policy. Floating storage capacity can support and maintain a higher level of service under emergency conditions such as power failure.

Regional Municipality of Peel
Water and Wastewater Policy Paper
March 31, 2014 34
3.8 POLICY W.08: EMERGENCY CONDITIONS
3.8.1 Policy Statement
“The Region of Peel shall have an adequate combination of reservoir capacity, pumping capacity, and stand-by power to meet the desired level of service under emergency conditions.”
3.8.2 Best Practices, Criteria and Rationale
It is good engineering and systems operation practice to plan for potential emergency conditions and ensure the impact to the level of service provided to the water users is minimized under these emergencies. All water systems are subject to emergency conditions beyond the operator’s control including:
• Power failures;
• Equipment failures;
• Water main breaks; and
• System isolation to facilitate construction.
Under these emergency conditions, the level of service (i.e., flow and pressure) can be impacted depending on the infrastructure out of service. It is recommended that the Region of Peel establish the minimum level of service to be provided under emergency conditions such as power failure. It is recommended that the system be capable of continued supply of average day demand conditions at reasonable but acceptably lower system pressures. To achieve the emergency level of service, there needs to be a balanced supply of reservoir storage and emergency standby power at key facilities. This balance should be achieved based on level of service in the system, siting requirements to house the facilities (whether additional reservoir cells or diesel generators and related equipment) and cost to provide these upgrades.

Regional Municipality of Peel
Water and Wastewater Policy Paper
March 31, 2014 35
3.9 POLICY W.09: WATER CONSERVATION
3.9.1 Policy Statement
“The Region of Peel shall encourage and promote water conservation.”
3.9.2 Best Practices, Criteria and Rationale
The Great Lakes hold an abundant supply of fresh water and supply will not be a limiting factor in the future for the Region of Peel. However, ongoing costs to build and operate the Regional water and wastewater system are a function of the volumes of water produced. As demand increases, additional capital investment will be needed for treatment plant expansion, pumping stations, reservoirs and distribution piping. Daily operations costs for power, for chemicals and for labour to operate and maintain the system all increase with volume consumed. More than 50 per cent of the production cost of water is in power cost. As power costs are expected to increase it is rational that unnecessary usage should be discouraged. As the Region of Peel plans its infrastructure for the future, design criteria are established for expected or projected water consumption rates for various land uses. On a regular basis the validity of the criteria in use should be compared to actual performance so that the criteria reflect performance. Conservation of water will reduce the capital cost of future works and will increase the population equivalent that can be serviced by existing infrastructure. Some aspects of conservation have been legislated such as the recent revisions to the Ontario Plumbing code that required new construction to use water efficient fixtures. Some successful measures such as requiring homeowners to water lawns on odd or even days according to their address, or mandating no watering on specific days do not limit the volumes used but are measures to reducing the peak demand rates. Additional best practices to be considered might include:
• Use of rain barrels to collect stormwater for lawn watering purposes;
• Encouraging low-maintenance landscaping and the use of native species; and
• Implementing an increasing block water rate structure.

Regional Municipality of Peel
Water and Wastewater Policy Paper
March 31, 2014 36
3.10 POLICY W.10: DESIGN AND COSTING CRITERIA
3.10.1 Policy Statement
“The Region of Peel shall utilize reasonable design and costing criteria for establishing and evaluating servicing scenarios.”
3.10.2 Best Practices, Criteria and Rationale
Design and Costing Criteria play an integral role in the development and evaluation of servicing scenarios. Review of historical records as well as related guidelines from the MOE and fire insurance underwriters should be considered in establishing design and costing criteria. Service levels and infrastructure cost could be different for urban and rural settings, so separate design and costing criteria should reflect this. Similarly, design criteria will also vary by land use category. This level of establishing design and costing criteria will provide a higher level of accuracy for the water projections and servicing requirements being evaluated under the Master Plan.

Regional Municipality of Peel
Water and Wastewater Policy Paper
March 31, 2014 37
4 WASTEWATER POLICIES
Policies and guiding principles which impact wastewater servicing have been outlined in this section. A summary of the Wastewater Policies is provided in Table 3. This summary is followed by separate sub-sections for each policy, which provide additional detail.

Regional Municipality of PeelWater and Wastewater Policy Paper
March 31, 2014 38
Table 3 Summary of wastewater policies
WASTEWATER POLICIES
Policy Policy Area Policy Statement Best Practices and Criteria
WW.01 Sewer Use By-law
“The Region of Peel shall implement a sewer use bylaw that
will set the maximum permissible limits on the criteria for
discharge into municipal sewers.”
• The Region should adopt a monitoring program to detect sources of high strength or hazardous wastes. • Where applicable, the Region should stipulate pre-treatment to acceptable standards for discharge into
municipal sewers based on the By-law. • The Region should implement a surcharge rate on high strength effluent entering the municipal sewers.
WW.02
Wastewater
Collection and
Pumping
“The Region of Peel shall provide adequate reliability and
security in wastewater pumping systems.”
• Force main twinning should be examined to provide adequate velocities during different phases of development and also to provide security in operation.
• The Region should have adequate security in the pumping systems and have standby power. • Adequate retention capacity should be provided in the sewer system.
WW.03 Wastewater
Treatment
“The Region of Peel shall meet or exceed the requirements
of the C of A and the appropriate legislated treatment
criteria."
• The Region should evaluate how the effluent ammonia criteria impact the rated capacity of the plant and ascertain the need for capacity expansion and/or technology upgrades.
• Effluent limits based on 0.2 mg/L ammonia have been used for current expansions. • Implications of implementing the more stringent criteria should be clearly defined.
WW.04 Design and
Costing Criteria
“The Region of Peel shall utilize reasonable design and
costing criteria for establishing and evaluating servicing
scenarios."
• Criteria should be based on: o Historical records and projections o MOE guidelines o Land use
WW.05 Effluent Quality
“The Region of Peel shall meet or exceed the requirements
of the Canada-wide Strategy for the Management of
Municipal Wastewater Effluent”
• Meet the effluent quality standards as laid out in this Strategy

Regional Municipality of Peel Water and Wastewater Policy Paper
March 31, 2014 39
4.1 POLICY WW.01: SEWER USE CRITERIA
4.1.1 Policy Statement
“The Region of Peel shall implement a sewer use bylaw that will set the maximum permissible limits on the criteria for discharge into municipal sewers.”
4.1.2 Best Practices, Criteria and Rationale
Where there is a diverse industrial base there is the potential for the discharge of contaminants or high-strength waste to the sewer system that would cause failure, or overload of the treatment facilities and hence exceed the Certificate of Approval. The waste treatment process is based on maintaining a healthy biology in the tankage. While reasonable design criteria should be used in the design of the system such that the requirements on industry are not onerous, the system needs protection from overload and particularly potential toxic discharges that may kill the biology resulting in an inability to treat even normal loadings for several days after the toxic conditions.

Regional Municipality of Peel Water and Wastewater Policy Paper
March 31, 2014 40
4.2 POLICY WW.02: PUMPING SYSTEMS RELIABILITY
4.2.1 Policy Statement
“The Region of Peel shall provide adequate reliability and security in wastewater pumping system design.”
4.2.2 Best Practices, Criteria and Rationale
All mechanical and electrical systems require maintenance and are prone to failure or unplanned breakdown. Provincial requirements stipulate that this reality be accounted for and allowances made. For sewage pumping stations this is generally accepted as the provision of an adequate number of pumps, installed and connected, such that should the pump with the highest capacity fail, then the remaining pumps have the combined capacity to pump the peak design flow rate. Similarly, the requirements stipulate that allowance should be made to provide an auxiliary power supply to replace the local area grid should it fail. On larger facilities this usually results in the installation of a standby engine and generator set that can automatically take over in event of grid failure. On some smaller installations the Province has given approval to an oversized wet well that may allow storage of incoming flows until a portable pump or generator can be brought to the site. The standby generation most commonly installed on large stations is based on using diesel fuel because of its ability to generate high torque. Similar power output using natural gas results in larger engines. The potential for complete catastrophic failure may also be addressed such as might result through fire or natural disaster striking the system. Recently some MOE jurisdictions have been recommending storage capacity in the conveyance piping to allow for this. Under the worst case condition of complete pump failure, the wastewater will back up in the system until it finds an outlet through an overflow provided for this circumstance, or through the manhole lid, or potentially back into the consumer’s home. By plotting the backwater profile under these conditions, the vulnerable homes may be identified and provided with protection such as a backflow preventor or a pumped discharge.

Regional Municipality of Peel Water and Wastewater Policy Paper
March 31, 2014 41
4.3 POLICY WW.03: WASTEWATER TREATMENT REQUIREMENTS
4.3.1 Policy Statement
“The Region of Peel shall meet or exceed the requirements of the Certificate of Approval and the appropriate legislated treatment criteria.”
4.3.2 Best Practices, Criteria and Rationale
1. Wastewater effluent quality should meet all legislated criteria. The rationale to meet legislated criteria is straightforward in that the Province has established the requirements for maximum permissible concentrations for parameters based on mitigating either health-related issues or aesthetic issues. The social and legal consequences of not meeting the requirements can be significant and certainly not be contemplated. 2. Wastewater quality objectives should meet or exceed historical performance. The Region of Peel has the opportunity to exceed certain parameters on an on-going basis and has historically been doing this. The effluent discharge to Lake Ontario already exceeds the requirements for many of the criteria, and the level of treatment needed to give not only assurance of meeting legislated criteria but consistently exceeding it is already in place. Maximize the potential capacity and performance of the facilities and equipment to achieve the best wastewater effluent quality on an on-going basis. As with all best practices, the concept of reasonableness should apply in that the balance of cost and effort to achieve the incremental gain would govern. Review the economics, reliability and impacts of implementing new technology. This refers to technologies currently available, or potentially to become available, that can increase quality are abundant. It would not be the intent of this policy statement to commit the Region to implement each technological advance as it becomes available. Rather it would be expected that the Region of Peel’s professional staff would monitor the technological advances, trends in legislation, as well as monitoring the needs and desires of its customers. At key milestones, such as when implementing expansions or major equipment replacement, it would be expected that the implementation process would incorporate a first principles approach to decision making with respect to the opportunity to upgrade the facilities. A set of criteria, with appropriate weighting, would be employed to achieve the optimum balance of economics, ease of operations and maintenance, proven technologies, level of treatment performed, land area requirements, energy consumption, and quantity and quality of wastewater effluent discharged. Implement best management practices to ensure sustainability of Operations and Maintenance, Maintenance Management Systems, Training, Manuals and other monitoring and trending data.

Regional Municipality of Peel Water and Wastewater Policy Paper
March 31, 2014 42
Maximizing the use and lifespan of the past investment in water, or wastewater, infrastructure is a fundamental economic responsibility of all staff. To ensure that all levels of staff can fulfill their roles, it is appropriate that the tools be in place and that performance is monitored. The tools would include:
• Maintenance management systems;
• Benchmarking;
• Staff training in wastewater treatment technologies, in mechanical and electrical equipment troubleshooting and maintenance and in health and safety;
• Availability of descriptive manuals; and
• ISO 14001 is also a useful mechanism to ensure repeatability in the level of performance.

Regional Municipality of Peel Water and Wastewater Policy Paper
March 31, 2014 43
4.4 POLICY WW.04: DESIGN AND COSTING CRITERIA
4.4.1 Policy Statement
“The Region of Peel shall utilize reasonable design and costing criteria for establishing and evaluating servicing scenarios.”
4.4.2 Best Practices, Criteria and Rationale
Design and Costing Criteria play an integral role in the development and evaluation of servicing scenarios. Review of historical records as well as related guidelines from the MOE and fire insurance underwriters should be considered when establishing design and costing criteria. Service levels and infrastructure cost could be different for urban and rural settings, so separate design and costing criteria should reflect this. Similarly, design criteria will also vary by land use category. This level of establishing design and costing criteria will provide a higher level of accuracy for the wastewater projections and servicing requirements being evaluated under the Master Plan.

Regional Municipality of Peel Water and Wastewater Policy Paper
March 31, 2014 44
4.5 POLICY WW.05: Canadian Council of Ministers of the Environment (CCME)
4.5.1 Policy Statement
“The Region of Peel shall meet or exceed the requirements of the Canada-wide Strategy for the Management of Municipal Wastewater Effluent.”
4.5.2 Best Practices, Criteria and Rationale
Comply with the various targets and new regulations as applicable regarding effluent quality standards as laid out in this Canada-wide Strategy. The strategy focuses improving protection of human health and environmental protection, and regulatory clarity in the management of wastewater.

Regional Municipality of Peel Water and Wastewater Policy Paper
March 31, 2014 45
5 POLICY IMPLEMENTATION
In order for the recommended policies be implemented, this policy paper must be presented to the Region of Peel Public Works and Planning senior managers, directors and commissioners for consideration, ratification and approval. This policy paper could be forwarded to all Region of Peel departments. The various departments should then ensure that all planning, design, operations and maintenance activities conform to the policies. This policy paper has been structured such that additional policies may be added as required. The policy statements themselves have been worded such that they should remain relevant over time, though these can also be edited as required. It is anticipated that through technological innovations and regulatory changes, some of the criteria or best practices require updating in the future. The policy structure should allow this to be done without necessarily having to edit the actual policy statement.

Regional Municipality of Peel Water and Wastewater Policy Paper
March 31, 2014 46
6 SUMMARY
This policy paper was developed by the Region of Peel with the 2013 Water and Wastewater Master Plan. It prevents policy statements that will provide guidance and direction to the master planning process.

Appendix 2BPlanning Data

2013 Water and Wastewater Master Plan
Peel Region Population by Development Area
Municipality 2011 2016 2021 2026 2031Brampton - - - - -
- - - - - 455,800 462,370 468,190 471,500 478,840
- - - - - 44,430 109,030 162,700 205,690 239,760
- - - - - 9,780 13,990 20,010 25,940 31,080
- - - - - 510,010 585,390 650,900 703,130 749,680
Caledon 4,994 6,366 7,858 16,321 24,764 - - - - -
35,553 36,539 37,530 37,704 37,874 13,515 13,621 14,576 15,900 17,226
6,648 13,103 19,557 19,860 20,157 3,721 4,214 4,713 5,292 5,859
- - - - - 5,630 6,336 7,422 7,738 8,049
70,061 80,179 91,656 102,815 113,929 Mississauga - - - - -
- - - 940 1,875 655,372 662,643 672,024 689,350 706,588
- - - - - 8,129 11,127 11,957 12,367 12,779
- - - - - 74,266 84,377 92,665 100,242 107,795
- - - - - 737,767 758,147 776,646 802,899 829,037
1,317,838 1,423,716 1,519,202 1,608,844 1,692,646
Peel Region Employment by Development Area
Municipality 2011 2016 2021 2026 2031Brampton - - - - -
- - - - - 161,300 184,040 190,990 193,180 195,120
- - - - - 9,130 33,450 62,990 81,400 98,610
- - - - - 11,480 16,020 20,400 22,920 27,080
- - - - - 181,910 233,510 274,380 297,500 320,810
Caledon 5,692 9,767 14,084 17,626 20,225 - - - - -
15,262 16,160 17,058 17,041 17,023 2,784 2,367 2,332 2,209 2,017 4,084 7,501 10,919 10,919 10,919
357 357 357 357 357 - - - - -
1,371 1,410 1,524 1,630 1,700 29,550 37,562 46,274 49,782 52,241
Mississauga - - - - - - - - 310 625
418,499 445,343 463,843 482,560 500,762 - - - - - 421 1,122 1,235 1,265 1,294 - - - - -
35,617 38,949 42,276 44,617 46,942 - - - - -
454,537 485,414 507,354 528,752 549,623 665,997 756,486 828,008 876,034 922,674
Total Mississauga
Total Brampton
Total Caledon
Total MississaugaPEEL REGION TOTAL
PEEL REGION TOTAL
GRFIELD-GreenfieldPERC- Palgrave Estate Residential UGC-Urban Growth CentreUNDBUPA-Undesignated Built-up Area
Total Brampton
Total Caledon
UGC-Urban Growth CentreUNDBUPA-Undesignated Built-up Area
AGRURAREA - Agricultural AreaANNEX - 9th Line CorridorBUPA- Built-up AreaGREENBELT-Greenbelt
AGRURAREA - Agricultural AreaANNEX - 9th Line CorridorBUPA- Built-up AreaGREENBELT-GreenbeltGRFIELD-GreenfieldPERC- Palgrave Estate Residential
BUPA- Built-up AreaGREENBELT-GreenbeltGRFIELD-GreenfieldPERC- Palgrave Estate Residential UGC-Urban Growth CentreUNDBUPA-Undesignated Built-up Area
PERC- Palgrave Estate Residential UGC-Urban Growth CentreUNDBUPA-Undesignated Built-up Area
Development AreaAGRURAREA - Agricultural AreaANNEX - 9th Line Corridor
UNDBUPA-Undesignated Built-up Area
AGRURAREA - Agricultural AreaANNEX - 9th Line CorridorBUPA- Built-up AreaGREENBELT-GreenbeltGRFIELD-Greenfield
ANNEX - 9th Line CorridorBUPA- Built-up AreaGREENBELT-GreenbeltGRFIELD-GreenfieldPERC- Palgrave Estate Residential UGC-Urban Growth Centre
GRFIELD-GreenfieldPERC- Palgrave Estate Residential UGC-Urban Growth CentreUNDBUPA-Undesignated Built-up Area
Development Area
AGRURAREA - Agricultural Area
ANNEX - 9th Line CorridorBUPA- Built-up AreaGREENBELT-Greenbelt
Page 1 of 1

5
3
29
-5
63
2
-3
6
1
0
267
-1
94
76
20
77
53
60
-4
-2
-11
10
-10
276
70
-73
-90
15
4
32
290
4220
73
-6
-9
240
640
9
-34
50
-70
-17
133
68
-36
929
990
80
167
250
-55
22
-25
42
4200
2480
260
47
2010
790
98
-160
660
-57
-44-22
-24
-35
-80
-32
3870
-13
-84
365
1150
-60
-47
1970
52
7
-33
-110
4770
2960
-89
-68
603
2280
-54
410
-50
-53
-78
100
17
2560
-42
-120
721
-71
-40
-86-124
-65
-106
-64
-26
2100
-16
41
-27
-104
-113
303
-130
-20
-46
-38
-31
-58
-140
380
-105
-114
-69
-48
-30
251
270
40
2670
30
510
-18
220
160
-39
-91
-51
-72
320
530
-82
550570
339
-49 -15
-12
-75
-19
1510
33
-43
1250
1380
-100
477
35
1170
271
1570
840
-23
2320
-56
213
820
461
1760
1230
10501010
-52
130
1260
935
81
1300
1180
1620
43
733
960
-29
580
337
-21
-14
590
-8
766
226
116
360
13
678
18
200
117
180
431
549
459
340
31
1100
-61
87
770
2600
386
-28
398
280
274
79
-37
463
49
150
478
638
800
114
9
50
407
QEW
KING
THE
GO
RE
401
MIS
SIS
SA
UG
A
AIR
PO
RT
403
HU
RO
NTA
RIO
WIN
STO
N C
HU
RC
HIL
L
MA
IN
DIX
IE
PIA
410
MAV
IS
427
MAYFIELD
TOR
BR
AM
BOVAIRD
409
KEN
NED
Y
GO
RE
WAY
EGLINTON
DERRY
OLDE BASE LINE
HE
ART
LAK
E
BUSH
POR
TER
FIE
LD
QUEEN
FINC
H
BURNHAMTHORPE
CASTLEMORE
TOM
KE
N
STEELES
CAW
THR
A
SANDALWOOD
DUNDAS
EAS
TGAT
E
LAKESHORE
WILLIAMS
CHARLESTON
SILVE
R D
AR
T
EMBLETON
CH
ING
UA
CO
US
Y
BRITANNIA
QUEENSWAY
ROYAL WINDSOR
OLD MAIN
MC
LAU
GH
LIN
LAKESHORE
407
HU
RO
NTA
RIO
50
PIA
MA
IN
QU
EE
N
403
QEW
QUEEN
MIS
SIS
SA
UG
A
401
QU
EE
N
HE
RIT
AG
E
WIL
LOU
GH
BY
MC
LAU
GH
LIN HEALEY
MIS
SIS
SA
UG
A
CH
ING
UA
CO
US
Y
GO
RE
WAY
109
CLA
RK
WAY
FINNERTY
CR
ED
ITV
IEW
MO
UN
T W
OLF
E
MA
IN
NIN
TH
PATTERSONM
CLA
REN
WIN
STO
N C
HU
RC
HIL
L
LAIR
D
BRAM
ALE
A
BRISTOL
MO
UN
T H
OP
E
CAL
EDO
N K
ING
TO
WN
EAST
HE
ART
LAK
E
THOMAS
ESCARPMENT
CLARENCE
CO
LER
AIN
E
HU
MB
ER
STA
TIO
N
HO
RS
ES
HO
E H
ILL
TOM
KE
N
ARGENTIA
VODDEN
HAROLD
WALKER
WANLESS
CENTRE
WE
ST
HIGHPOINT
TEN
TH
RATHBURN
ORENDA
CATARACT
OLD SCHOOL
THE GRANGE
MILLC
REEK
BEECH GROVE
TRUSCOTT
HOWDEN
MATHESON
MORNING STAR
MA
LTA
NU
NN
VIL
LE
TERRAGAR
CENTRE VIEW
QUEEN
RIC
HVA
LE
ELGIN
OLD DERRY
OG
DE
N
CH
RY
SLE
R
TER
RY
FOX
FIRST GULF
CONSERVATION
PAISLEY
BRIS
DA
LE
CH
ING
UA
CO
US
Y
CAL
EDO
N K
ING
TO
WN
CR
ED
ITVIE
W
BEECH GROVE
FINNERTY
HE
ART
LAK
E
45
190
230
430
74
940
-63
520
2335
-74
21
1242
158
86
700
126
4117
390
59
1301
720
-95
-41
84
95
191575 299
206
139
1069
330
282
482
166
352
326
695552
LegendRegion of Peel Boundary
Population Growth 2011-20162,501 to 5,0001,501 to 2,5001,001 to 1,500501 to 1,0001 to 5000-160 to -1
*Data source is Region of PeelSGU dataset dated 2012.
¹
Master Plan
HALT
ON
YORK
TORO
NTO
Sep 19, 20121:175,000
60216517-1-G
Population Growth - Scenario B2011-2016

93
97
62
129
50
214
38
24
32
37
0
9
34
12
13
121
18
7 32
14
6
-1
85
54
-7
-2
136
225
-10
-13
30
-5
-3
-4
275
15
-6
80
92
66
-9
290
1810
11
72
970
76
-8
100
220
800
-30
2950-60
108
-18
745
55
890
20
400
-100
250
16
10
-70
-23
-92
17
1680
47
420
-89
670
63
-130
260
840
-35
43
-20
1530
-12
-77
130
-94
1700
-16
52
3210
570
-29
73
2840
3200
1650
24802610
-54
-59
303
1330
-39
170
-40
-90
-49
-74
-80
48
1630
160
-51
-43
-14
207
567
-62
19
-50
-72
-57
-61
-105
-58
2560
330
-22
-63
40
70
-24
-110
423
-120
-42
-27
28
-28
-101
140
167
490
-41
178
198
-25
-56
1070
79
8
720
600 520
470
-53
-34
760
200
-55
230
95
-46
480
26
-47
790
-66
510
-19
-37
-69
-65
-31
60
-26
1379
196
35
-15
-17
180
1050
-33
241
990
101
14901470
29
-45
936
90
-32
190
-36
540
337
450
22
-11
27
591
231
-21
14
766
87
115
67
679
820
120
593
1039
550
182
471
1140
102
53
65
86
1101
172
1180
370
386
517
51
112
273
322
380
561
346
920
462
-38
280710
9
50
407
QEW
KING
THE
GO
RE
401
MIS
SIS
SA
UG
A
AIR
PO
RT
403
HU
RO
NTA
RIO
WIN
STO
N C
HU
RC
HIL
L
MA
IN
DIX
IE
PIA
410
MAV
IS
427
MAYFIELD
TOR
BR
AM
BOVAIRD
409
KEN
NED
Y
GO
RE
WAY
EGLINTON
DERRY
OLDE BASE LINE
HE
ART
LAK
E
BUSH
POR
TER
FIE
LD
QUEEN
FINC
H
CASTLEMORE
TOM
KE
N
STEELES
CAW
THR
A
SANDALWOOD
DUNDAS
EAS
TGAT
E
LAKESHORE
WILLIAMS
CHARLESTON
SILVE
R D
AR
T
EMBLETON
CH
ING
UA
CO
US
Y
BRITANNIA
QUEENSWAY
ROYAL WINDSOR
OLD MAIN
MC
LAU
GH
LIN
LAKESHORE
407
HU
RO
NTA
RIO
50
PIA
QU
EE
N
403
QEW
QUEEN
MIS
SIS
SA
UG
A
401
QU
EE
N
HE
RIT
AG
E
WIL
LOU
GH
BY
MC
LAU
GH
LIN
HEALEY
MIS
SIS
SA
UG
A
CH
ING
UA
CO
US
Y
GO
RE
WAY
109
CLA
RK
WAY
FINNERTY
CR
ED
ITV
IEW
MO
UN
T W
OLF
E
MA
IN
NIN
TH
PATTERSONM
CLA
REN
WIN
STO
N C
HU
RC
HIL
L
LAIR
D
BRAM
ALE
A
MO
UN
T H
OP
E
CAL
EDO
N K
ING
TO
WN
EAST
HE
ART
LAK
E
THOMAS
ESCARPMENT
CLARENCE
CO
LER
AIN
E
HU
MB
ER
STA
TIO
N
HO
RS
ES
HO
E H
ILL
ARGENTIA
HAROLD
WALKER
WANLESS
MC
VE
AN
ERIN CENTRE
CE
NTR
E
WE
ST
HIGHPOINT
TEN
TH
ORENDA
CATARACT
OLD SCHOOL
THE GRANGE
MILLC
REEK
BEECH GROVE
TRUSCOTT
HOWDEN
MATHESON
OSPREY
NU
NN
VIL
LE
TERRAGAR
CENTRE VIEW
QUEEN
WILLIAMS
RIC
HVA
LE
ELGIN
OLD DERRY
OG
DE
N
CH
RY
SLE
R
MOFFATT
TER
RY
FOX
FIRST GULF
CONSERVATION
SUN
FOR
EST
CH
ING
UA
CO
US
Y
CAL
EDO
N K
ING
TO
WN
CR
ED
ITVIE
W
BEECH GROVE
FINNERTY
HE
ART
LAK
E
700440
350
340
855
-67
110
-79
41
21
1966
239
210703
638
71
-68
270
125
4123
56
77
114
472
82
-811921
532
1540
310
143
123
391
LegendRegion of Peel Boundary
Population Growth 2016-20212,501 to 5,0001,501 to 2,5001,001 to 1,500501 to 1,0001 to 5000-130 to -1
*Data source is Region of PeelSGU dataset dated 2012.
¹
Master Plan
HALT
ON
YORK
TORO
NTO
Sep 19, 20121:175,000
60216517-2-G
Population Growth - Scenario B2016-2021

51
195
118
64124
358
62
36
41
44
0
47
15
16
238
23
9
7
34
1
5
12
-8
6
2
49
-5
68
27
940
200
10
-2
-3
45
50
59
113
-1
28
17
20
248
-70
40
60
950
46
1060
540
120
460
-20
3270-40
25
790
870
30
505
75
980
90
530
210
760
-60
2118
-50
1330
-15
-30
80
150
135
430
85
130
480
-10
-80
1430
129
6185
-9
115
-55
1860
290
1640
14701540
610
1300
-35
-25
100
680
320
-161
1480
190
470
510
55
270
104
225
105
-90
-11
70
440
350 300
630
410
860
850
450
370
99
-45
-19
810
125
22
83
35
57
285
730
590
65
155
1414
360
160
34
260
315
95
1130
710
720
550
230
380
145
1340
1212
235295
220
119
390
175
910700
9
50
407
QEW
KING
THE
GO
RE
401
MIS
SIS
SA
UG
A
AIR
PO
RT
403
HU
RO
NTA
RIO
WIN
STO
N C
HU
RC
HIL
L
MA
IN
DIX
IE
PIA
410
MAV
IS
427
MAYFIELD
TOR
BR
AM
BOVAIRD
409
KEN
NED
Y
GO
RE
WAY
EGLINTON
DERRY
OLDE BASE LINE
HE
ART
LAK
E
BUSH
POR
TER
FIE
LD
QUEEN
FINC
H
BURNHAMTHORPE
CASTLEMORE
TOM
KE
N
STEELES
CAW
THR
A
ERIN
MILLS
SANDALWOOD
DUNDAS
EASTGATE
LAKESHORE
WILLIAMS
CHARLESTON
OLD CHURCHSILV
ER
DA
RT
EMBLETON
CH
ING
UA
CO
US
Y
BRITANNIA
QUEENSWAY
ROYAL WINDSOR
OLD MAIN
MC
LAU
GH
LIN
LAKESHORE
407
HU
RO
NTA
RIO
50
PIA
QU
EE
N
403
QEW
QUEEN
MIS
SIS
SA
UG
A
401
QU
EE
N
HE
RIT
AG
E
WIL
LOU
GH
BY
MC
LAU
GH
LIN HEALEY
MIS
SIS
SA
UG
A
CH
ING
UA
CO
US
Y
GO
RE
WAY
109
CLA
RK
WAY
FINNERTY
CR
ED
ITV
IEW
MO
UN
T W
OLF
E
MA
IN
NIN
TH
PATTERSONM
CLA
REN
WIN
STO
N C
HU
RC
HIL
L
LAIR
D
BRAM
ALE
A
BRISTOL
MO
UN
T H
OP
E
CAL
EDO
N K
ING
TO
WN
EAST
HE
ART
LAK
E
THOMAS
ESCARPMENT
CLARENCE
ORR
CO
LER
AIN
E
HU
MB
ER
STA
TIO
N
HO
RS
ES
HO
E H
ILL
TOM
KE
N
ARGENTIA
VODDEN
HAROLD
WALKER
WANLESS
ERIN CENTRE
CENTRE
WE
ST
HIGHPOINT
TEN
TH
DA
RC
EL
RATHBURN
ORENDA
OLD SCHOOL
THE GRANGE
MILLC
REEK
FIELD
GATE
BEECH GROVE
SUN
NY M
EA
DO
W
TRUSCOTT
HOWDEN
ALBI
ON
VAU
GH
AN
MATHESON
BLOOR
NU
NN
VIL
LE
TERRAGAR
CENTRE VIEW
QUEEN
WILLIAMS
RIC
HVA
LE
ELGIN
OLD DERRY
OG
DE
N
CH
RY
SLE
R
MOFFATT
TER
RY
FOX
NORTH PARK
FIRST GULF
CONSERVATION
PAISLEY
CH
ING
UA
CO
US
Y
CR
ED
ITVIE
W
BEECH GROVE
FINNERTY
HE
ART
LAK
E
400
170
110
-51
250
375
330
140
1325
355
280
1160
1555
275
309
329
520
1225
310
-1540
570
335
365
LegendRegion of Peel Boundary
Population Growth 2021-20265,001 to 6,1852,501 to 5,0001,501 to 2,5001,001 to 1,500501 to 1,0001 to 5000-1540 to -1
*Data source is Region of PeelSGU dataset dated 2012.
¹
Master Plan
HALT
ON
YORK
TORO
NTO
Sep 19, 20121:175,000
60216517-3-G
Population Growth - Scenario B2021-2026

52
195
119
63124
359
62
37
41
44
0
47
15
16
237
23
8
7
4
25
11
-9
1
3
-8
-1
6
49
-6
67
9
27
935
199
10
-3
-4
43
40
80
740
59
113
-2
20
247
-50
36
46
-7
920
670
380
24
330
-15
2280-30
60
25
610
42
26
506
71
680
93
210
30
900
1880
530
-11
-40
2118
690
2117
50
21
170
133
-53
310
87
139
100
-60
1570
-47
1010
126
1140
6185
114
-56
1300
220
-17
38
90
10401080
430
-13
-33
-22
-28
17
73
214
-32
-12
321
317
-35
-16
-19
-37
19
-34
-162
-29
-20
140
466
350
-10
75
53
-2628
200
-24
-27
-41
103
83
227
104
120
70
240
1360
112
180
440
-14
-39
320
280
600
190
74
360
-42
96
-23
-46
-43
-21
570
22
82
48
35
57
-5
-18
286
560
121
72
65
152
1413
250
150
33
122
319
1160
64
91
94
1130
500
620
554
230
142
1280
1211
234292
160
540
141
88
290
14
116
299
174
780
18
9
50
407
QEW
KING
THE
GO
RE
401
MIS
SIS
SA
UG
A
AIR
PO
RT
403
HU
RO
NTA
RIO
WIN
STO
N C
HU
RC
HIL
L
MA
IN
DIX
IE
PIA
410
MAV
IS
427
MAYFIELD
TOR
BR
AM
BOVAIRD
409
KEN
NED
Y
GO
RE
WAY
EGLINTON
DERRY
OLDE BASE LINE
HE
ART
LAK
E
BUSH
POR
TER
FIE
LD
QUEEN
FINC
H
CASTLEMORE
TOM
KE
N
STEELES
SANDALWOOD
DUNDAS
EAS
TGAT
E
LAKESHORE
WILLIAMS
CHARLESTON
OLD CHURCHSILV
ER
DA
RT
EMBLETON
CH
ING
UA
CO
US
Y
BRITANNIA
QUEENSWAY
ROYAL WINDSOR
OLD MAIN
MC
LAU
GH
LIN
LAKESHORE
407
HU
RO
NTA
RIO
50
PIA
MA
IN
QU
EE
N
403
QEW
QUEEN
MIS
SIS
SA
UG
A
401
QU
EE
N
HE
RIT
AG
E
WIL
LOU
GH
BY
MC
LAU
GH
LIN HEALEY
MIS
SIS
SA
UG
A
CH
ING
UA
CO
US
Y
GO
RE
WAY
109
CLA
RK
WAY
FINNERTY
CR
ED
ITV
IEW
MO
UN
T W
OLF
E
MA
IN
NIN
TH
PATTERSONM
CLA
REN
WIN
STO
N C
HU
RC
HIL
L
LAIR
D
BRAM
ALE
A
BRISTOL
MO
UN
T H
OP
E
CAL
EDO
N K
ING
TO
WN
EAST
HE
ART
LAK
E
THOMAS
ESCARPMENT
CLARENCE
ORR
CO
LER
AIN
E
HU
MB
ER
STA
TIO
N
HO
RS
ES
HO
E H
ILL
TOM
KE
N
ARGENTIA
VODDEN
HAROLD
WALKER
WANLESS
ERIN CENTRE
CENTRE
WE
ST
HIGHPOINT
TEN
TH
GR
EAT
LA
KE
S
DA
RC
EL
RATHBURN
ORENDA
OLD SCHOOL
THE GRANGE
MILLC
REEK
FIELD
GATE
BEECH GROVE
TRUSCOTT
HOWDEN
ALBI
ON
VAU
GH
AN
MATHESON
ATWATER
NU
NN
VIL
LE
CENTRE VIEW
QUEEN
WILLIAMS
RIC
HVA
LE
ELGIN
OLD DERRY
OG
DE
N
CH
RY
SLE
R
MOFFATT
TER
RY
FOX
NORTH PARK
FIRST GULF
CONSERVATION
PAISLEY
CH
ING
UA
CO
US
Y
CR
ED
ITVIE
W
BEECH GROVE
FINNERTY
HE
ART
LAK
E
84
130
-54
376
76
117
-55
61
109
1326
354
222400
289
81
85
1158
1552
283
276
306
326
-72
-31
-591226
260
339
383
-36
369
106
LegendRegion of Peel Boundary
Population Growth 2026-20315,001 to 6,1852,501 to 5,0001,501 to 2,5001,001 to 1,500501 to 1,000v0-162 to -1
*Data source is Region of PeelSGU dataset dated 2012.
¹
Master Plan
HALT
ON
YORK
TORO
NTO
Sep 19, 20121:175,000
60216517-4-G
Population Growth - Scenario B2026-2031

-4
-6
-1
-23
-10
-7
0
-2
-141
-3
47
1
2
-12
4
1337
-5
6
-28
45
84
1077
3
7
8
10
-8
82
394
530
14
30
80
-45
-30
850
-20
-44
158
36
160
5228
-341
57
5
143
40
13
90
635
15
-60
540
-265
480
-9
-277
39
250
520
135
-93
490
110
18
231
17
470
120
100
570
139
350
101521
270
754
64
300
-67
798
482
-191
23
119
1502
-13
121
50
12
43
-337
860
-15
63
37
74
1316
70
72
58
-24
-11
2767
32
-34
56
948
-88
-73
267
146
-29
230
-22
1102
89-80
340
-19
150
60-46
190
93
450
391
27
130
181
-16
34
1150
180
-43
220
188
-189
586
205
-75
280
290
610
54
-78
38
-95
168
-51
49
-18
246
20
2150
460
200
690
-14
1370
170
68
109
410
2748
-47
21
140
11
210
620
547
48
310
320
-120
364
880
2300
903
565
2010
1650
-62
1030 1520
-26
204
429
830
107
1250
69
1260
-50
53
42
24
433
244
167
1280
228
287
138
297
1780
22
471
382
-65
77
97
9
-40
349
-39
330
152
137
322
420
462
16
-21
29
19
-27
463
213
66
240
766
510
126
560
533
59
123
26
192
9
50
407
QEW
KING
THE
GO
RE
401
MIS
SIS
SA
UG
A
AIR
PO
RT
403
HU
RO
NTA
RIO
WIN
STO
N C
HU
RC
HIL
L
MA
IN
DIX
IE
PIA
410
MAV
IS
427
MAYFIELD
TOR
BR
AM
BOVAIRD
409
KEN
NED
Y
GO
RE
WAY
EGLINTON
DERRY
OLDE BASE LINE
HE
ART
LAK
E
BUSH
POR
TER
FIE
LD
QUEEN
FINC
H
BURNHAMTHORPE
CASTLEMORE
TOM
KE
N
CAW
THR
A
ERIN
MILLS
SANDALWOOD
LAKESHORE
WILLIAMS
CHARLESTON
SILVE
R D
AR
T
EMBLETON
CH
ING
UA
CO
US
Y
BRITANNIA
HU
MB
ER
WE
ST
OLD MAIN
MC
LAU
GH
LIN
407
HU
RO
NTA
RIO
50
PIA
MA
IN
LAKESHORE
403
QEW
QU
EE
NM
ISS
ISS
AU
GA
401
QU
EE
N
HE
RIT
AG
E
WIL
LOU
GH
BY
MC
LAU
GH
LIN
HEALEY
MIS
SIS
SA
UG
A
CH
ING
UA
CO
US
Y
GO
RE
WAY
109
CLA
RK
WAY
FINNERTY
CR
ED
ITV
IEW
MO
UN
T W
OLF
E
MA
IN
NIN
TH
PATTERSONM
CLA
REN
WIN
STO
N C
HU
RC
HIL
L
BRAM
ALE
A
BRISTOL
MO
UN
T H
OP
E
CAL
EDO
N K
ING
TO
WN
EAST
HE
ART
LAK
E
THOMAS
ESCARPMENT
CLARENCE
ORR
CO
LER
AIN
E
HU
MB
ER
STA
TIO
N
HO
RS
ES
HO
E H
ILL
TOM
KE
N
ARGENTIA
VODDEN
HAROLD
WALKER
WANLESS
MC
VE
AN
ERIN CENTRE
CENTRE
INDIAN
WE
ST
HIGHPOINT
TEN
TH
GR
EAT
LA
KE
S
DA
RC
EL
RATHBURN
ORENDA
CATARACT
OLD SCHOOL
THE GRANGE
FIE
LDG
ATE
BEECH GROVE
SUN
NY M
EA
DO
W
TRUSCOTT
HOWDEN
MATHESON
MORNING STAR
BLOOR
MA
LTA
AQUITAIN
E
OSPREY
NU
NN
VIL
LE
CENTRE VIEW
QUEEN
RIC
HVA
LE
ELGIN
OLD DERRY
OG
DE
N
RID
GEW
AY
CH
RY
SLE
R
MOFFATT
TER
RY
FOX
FIRST GULF
CONSERVATION
PAISLEY
BRIS
DA
LE
CH
ING
UA
CO
US
Y
CAL
EDO
N K
ING
TO
WN
CR
ED
ITVIE
W
BEECH GROVE
FINNERTY
HE
ART
LAK
E
832
348473
217636
83
430
502
289
359
55
299
194
784
440
592 31
1620
650
75
381
LegendRegion of Peel Boundary
Employment Growth 2011-20162,501 to 2,7671,501 to 2,5001,001 to 1,500501 to 1,0001 to 5000-341 to -1
*Data source is Region of PeelSGU dataset dated 2012.
¹
Master Plan
HALT
ON
YORK
TORO
NTO
Sep 18, 20121:175,000
60216517-5-G
Employment Growth - Scenario B2011-2016

-5
-6
-1
-25
-7
-11
-10
0
42
-3
-4
14
3
5
7
-12
81
410
2
6
457
45
66
7772 84
59
4
-8
82
-9
170
130
10
43
60
210
158
-92
90
16
78
280
-136
-15
83
571
9
98
50
96
-77
-111
15
30
110
-21
180
-106
51
40
70
13
200
-2
100
5950
107
-36
160
113
39
103
7917
340
300
260270
600
80
520
140
734
336
193
1770
11
-76
1502
20
670
920
400
2028
-20
71
24
3465
-14-29
2890
287
1462410
-53
-31
52
490
23
-16
587
134
26
53
-37
1250
168
85
-48
32
246
565
120
19
37
330
660
620
31
109
150
3000
21
22
-19
46
710
12
546
38
890
41
365
188
1490
305
430
58
630
-18
55
44
73
243
-17
1650
-27
626
88
286
29
198
-2668
310
292
420
18
33
63
64
390
36
28
123
262
360
9
50
407
QEW
KING
THE
GO
RE
401
MIS
SIS
SA
UG
A
AIR
PO
RT
403
HU
RO
NTA
RIO
WIN
STO
N C
HU
RC
HIL
L
MA
IN
DIX
IE
PIA
410
MAV
IS
427
MAYFIELD
TOR
BR
AM
BOVAIRD
409
KEN
NED
Y
GO
RE
WAY
EGLINTON
DERRY
OLDE BASE LINE
HE
ART
LAK
E
BUSH
POR
TER
FIE
LD
QUEEN
FINC
H
BURNHAMTHORPE
CASTLEMORE
TOM
KE
N
CAW
THR
A
ERIN
MILLS
SANDALWOOD
EAS
TGATE
LAKESHORE
WILLIAMS
CHARLESTON
SILVE
R D
AR
T
EMBLETON
CH
ING
UA
CO
US
Y
BRITANNIA
OLD MAIN
MC
LAU
GH
LIN
407
50
PIA
QU
EE
N
403
QEW
QUEEN
MIS
SIS
SA
UG
A
401
QU
EE
N
HE
RIT
AG
E
WIL
LOU
GH
BY
MC
LAU
GH
LIN
HEALEY
MIS
SIS
SA
UG
A
CH
ING
UA
CO
US
Y
GO
RE
WAY
109
CLA
RK
WAY
FINNERTY
CR
ED
ITV
IEW
MO
UN
T W
OLF
E
MA
IN
NIN
TH
PATTERSONM
CLA
REN
WIN
STO
N C
HU
RC
HIL
L
LAIRD
BRAM
ALE
A
BRISTOL
MO
UN
T H
OP
E
CAL
EDO
N K
ING
TO
WN
EAST
HE
ART
LAK
E
THOMAS
ESCARPMENT
CLARENCE
ORR
CO
LER
AIN
E
HU
MB
ER
STA
TIO
N
HO
RS
ES
HO
E H
ILL
TOM
KE
N
GLE
N E
RIN
VODDEN
HAROLD
WALKER
WANLESS
MC
VE
AN
ERIN CENTRE
CENTRE
INDIAN
WE
ST
HIGHPOINT
TEN
TH
DA
RC
EL
RATHBURN
ORENDA
CATARACT
OLD SCHOOL
THE GRANGE
MILLC
REEK
BEECH GROVE
TRUSCOTT
HOWDEN
MATHESON
MORNING STAR
BLOOR
OSPREY
NU
NN
VIL
LE
TERRAGAR
CENTRE VIEW
CENTRAL
QUEEN
WILLIAMS
RIC
HVA
LE
ELGIN
OLD DERRY
OG
DE
N
RID
GEW
AY
CH
RY
SLE
R
MOFFATT
TER
RY
FOX
NORTH PARK
CONSERVATION
PAISLEY
SOMBRERO
CH
ING
UA
CO
US
Y
CAL
EDO
N K
ING
TO
WN
CR
ED
ITVIE
W
BEECH GROVE
FINNERTY
HE
ART
LAK
E
147
460
111
1173
27
105
320
595
190
1470
509
504
LegendRegion of Peel Boundary
Employment Growth 2016-20215,001 to 5,9502,501 to 5,0001,501 to 2,5001,001 to 1,500501 to 1,0001 to 5000-136 to -1
*Data source is Region of PeelSGU dataset dated 2012.
¹
Master Plan
HALT
ON
YORK
TORO
NTO
Sep 18, 20121:175,000
60216517-6-G
Employment Growth - Scenario B2016-2021

-5
-7
-2
-25
-11
-8
0
-1
-3
15
2
3
-12
395
1
5
420
30
90
6
41
9
5449
36
310
-6
80
385
50
14
10
27
40
-35
-90
-95
19
18
35
-85
20
-4
-115
350
52
290
39
1670
85
-20
43
226
4644
-65
60
-10
8
140
25
240
160
2110
980
250
726
48
32
-9
220
1070
-110
180
7
-19
130
1250
3465
11
1850
-30
510
1885
4
28
-45
12
1600
24
190
950
-15
591
55
-40
170
45
360
3000
17
104
430
100 565
81
150
13
1500
260
95
1210
473
65
110 630540
9
50
407
QEW
KING
THE
GO
RE
401
MIS
SIS
SA
UG
A
AIR
PO
RT
403
HU
RO
NTA
RIO
WIN
STO
N C
HU
RC
HIL
L
MA
IN
DIX
IE
PIA
410
MAV
IS
427
MAYFIELD
TOR
BR
AM
BOVAIRD
409
KEN
NED
Y
GO
RE
WAY
EGLINTON
DERRY
OLDE BASE LINE
HE
ART
LAK
E
BUSH
POR
TER
FIE
LD
QUEEN
FINC
H
BURNHAMTHORPE
CASTLEMORE
TOM
KE
N
STEELES
CAW
THR
A
ERIN
MILLS
SANDALWOOD
DUNDAS
EASTGATE
LAKESHORE
WILLIAMS
CHARLESTON
OLD CHURCHSILV
ER
DA
RT
EMBLETON
CH
ING
UA
CO
US
Y
BRITANNIA
QUEENSWAY
ROYAL WINDSOR
OLD MAIN
MC
LAU
GH
LIN
LAKESHORE
407
HU
RO
NTA
RIO
50
PIA
QU
EE
N
403
QEW
QUEEN
MIS
SIS
SA
UG
A
401
QU
EE
N
HE
RIT
AG
E
WIL
LOU
GH
BY
MC
LAU
GH
LIN HEALEY
MIS
SIS
SA
UG
A
CH
ING
UA
CO
US
Y
GO
RE
WAY
109
CLA
RK
WAY
FINNERTY
CR
ED
ITV
IEW
MO
UN
T W
OLF
E
MA
IN
NIN
TH
PATTERSONM
CLA
REN
WIN
STO
N C
HU
RC
HIL
L
LAIR
D
BRAM
ALE
A
BRISTOL
MO
UN
T H
OP
E
CAL
EDO
N K
ING
TO
WN
EAST
HE
ART
LAK
E
THOMAS
ESCARPMENT
CLARENCE
ORR
CO
LER
AIN
E
HU
MB
ER
STA
TIO
N
HO
RS
ES
HO
E H
ILL
TOM
KE
N
GLE
N E
RIN
ARGENTIA
VODDEN
HAROLD
WALKER
WANLESS
MC
VE
AN
ERIN CENTRE
CENTRE
INDIAN
WE
ST
HIGHPOINT
TEN
TH
GR
EAT
LA
KE
S
DA
RC
EL
RATHBURN
ORENDA
CATARACT
OLD SCHOOL
THE GRANGE
MILLC
REEK
FIE
LDG
ATE
BEECH GROVE
SUN
NY M
EA
DO
W
TRUSCOTT
HOWDEN
ALBI
ON
VAU
GH
AN
MATHESON
MORNING STAR
BLOOR
MA
LTA
NU
NN
VIL
LE
BATTLEFORD
TERRAGAR
CENTRE VIEW
CENTRAL
QUEEN
WILLIAMS
RIC
HVA
LE
ELGIN
OLD DERRY
OG
DE
N
CH
RY
SLE
R
MOFFATT
TER
RY
FOX
NORTH PARK
FIRST GULF
CONSERVATION
PAISLEY
CH
ING
UA
CO
US
Y
CAL
EDO
N K
ING
TO
WN
CR
ED
ITVIE
W
BEECH GROVE
FINNERTY
HE
ART
LAK
E
585
645
285
1120
105
1160
69
280
120
595
315
230
300
LegendRegion of Peel Boundary
Employment Growth 2021-20262,501 to 3,4651,501 to 2,5001,001 to 1,500501 to 1,0001 to 5000-115 to -1
*Data source is Region of PeelSGU dataset dated 2012.
¹
Master Plan
HALT
ON
YORK
TORO
NTO
Sep 18, 20121:175,000
60216517-7-G
Employment Growth - Scenario B2021-2026
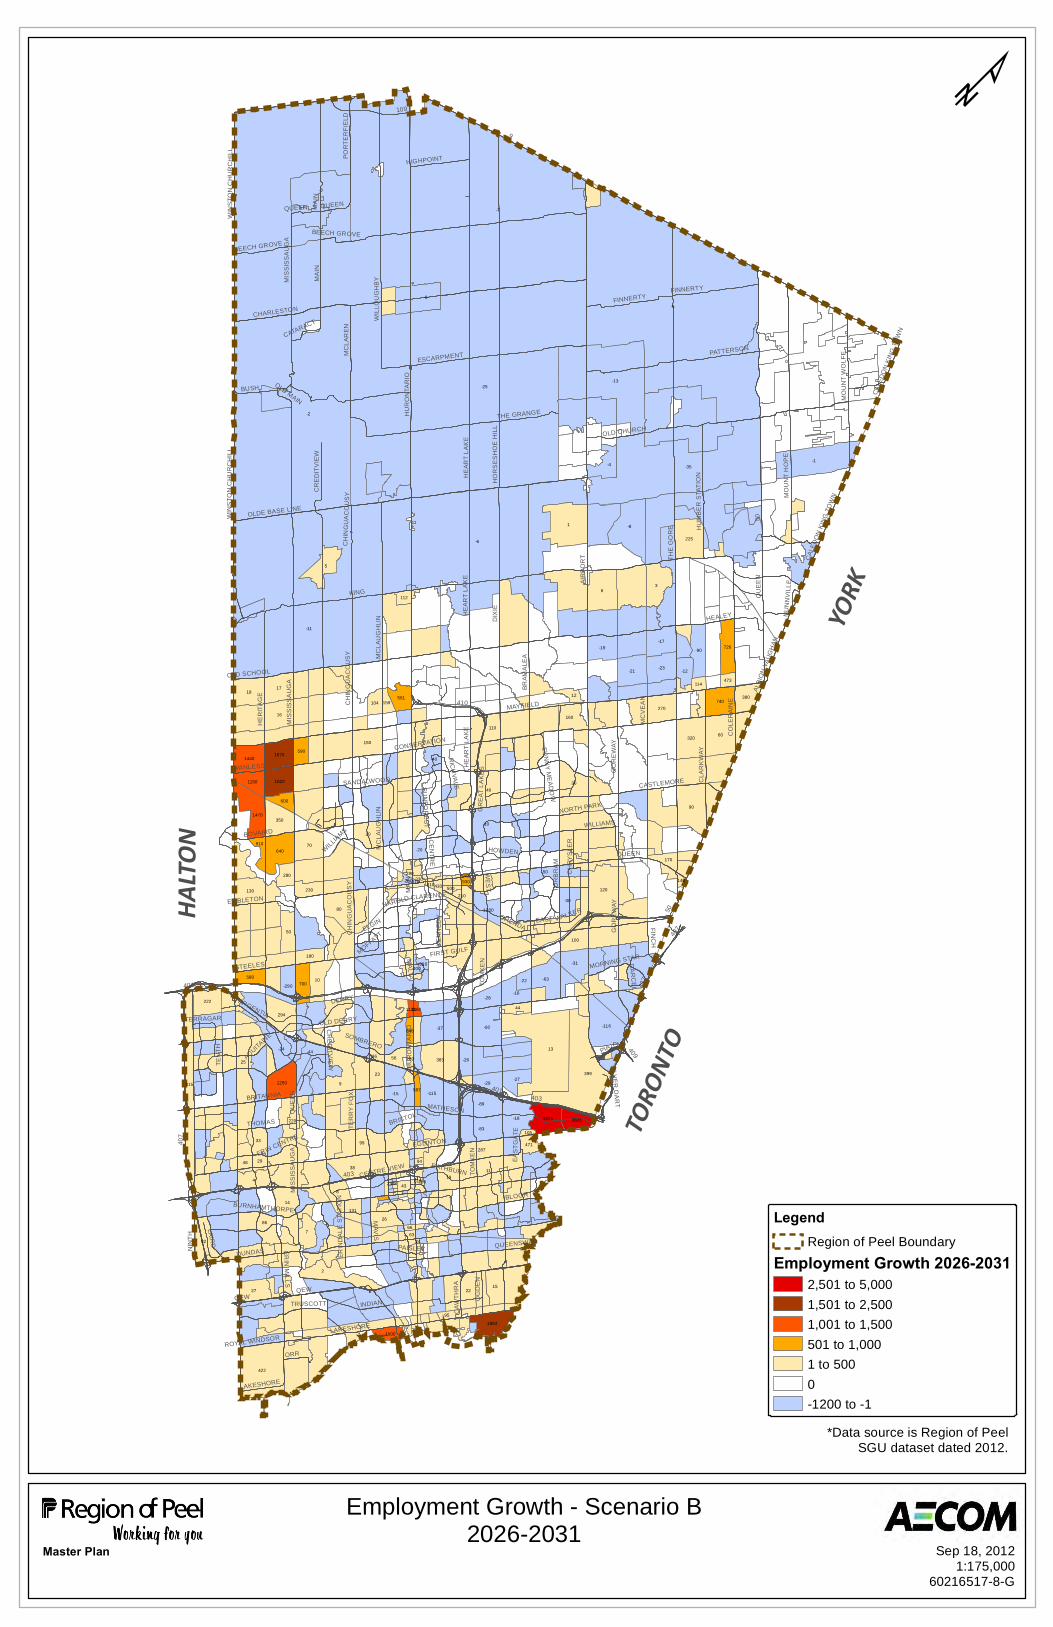
-5
-7
-2
-25
-11
-6
0
-35
-3
13
1
-13
-1
6
399
2
-8
9
3
5
422
90
60
315
4
-9
7
80
383
120
40
8
-37
-89
-92
70
18
38
-83
30
-4
-116
320
17
16
82
-18
225
-10
11
20
-63
14
10
-21
640
2715
-23
-17
294
50
-90
-31
19
350
26
22
130
-19
150
740
287
726
1470
270
-24
222
33
-115
-16
160
1250
3474
1440
-29
-28
380
1884
23
-30
-44
-27
1670
1820
700-290
100
591
-40
-26
99
-50
-12
56
110
1150
-1200
210
580
230
44
590
-15
180
2621
86
280
131
12
104
600
471
-22
-20
170
48
25
910
29
1500
95
159
36
112
43
473114
220
63
500
140
94
930
9
50
407
QEW
KING
THE
GO
RE
401
MIS
SIS
SA
UG
A
AIR
PO
RT
403
HU
RO
NTA
RIO
WIN
STO
N C
HU
RC
HIL
L
MA
IN
DIX
IE
PIA
410
MAV
IS
427
MAYFIELD
TOR
BR
AM
BOVAIRD
409
KEN
NED
Y
GO
RE
WAY
EGLINTON
DERRY
OLDE BASE LINE
HE
ART
LAK
E
BUSH
POR
TER
FIE
LD
QUEEN
FINC
H
BURNHAMTHORPE
CASTLEMORE
TOM
KE
N
STEELES
CAW
THR
A
ERIN
MILLS
SANDALWOOD
DUNDAS
EAS
TGAT
E
LAKESHORE
WILLIAMS
CHARLESTON
OLD CHURCHSILV
ER
DA
RT
EMBLETON
CH
ING
UA
CO
US
Y
BRITANNIA
QUEENSWAY
ROYAL WINDSOR
OLD MAIN
MC
LAU
GH
LIN
LAKESHORE
407
HU
RO
NTA
RIO
50
PIA
MA
IN
QU
EE
N
403
QEW
QUEEN
MIS
SIS
SA
UG
A
401
QU
EE
N
HE
RIT
AG
E
WIL
LOU
GH
BY
MC
LAU
GH
LIN HEALEY
MIS
SIS
SA
UG
A
CH
ING
UA
CO
US
Y
GO
RE
WAY
109
CLA
RK
WAY
FINNERTY
CR
ED
ITV
IEW
MO
UN
T W
OLF
E
MA
IN
NIN
TH
PATTERSONM
CLA
REN
WIN
STO
N C
HU
RC
HIL
L
LAIR
D
BRAM
ALE
A
BRISTOL
MO
UN
T H
OP
E
CAL
EDO
N K
ING
TO
WN
EAST
HE
ART
LAK
E
THOMAS
ESCARPMENT
CLARENCE
ORR
CO
LER
AIN
E
HU
MB
ER
STA
TIO
N
HO
RS
ES
HO
E H
ILL
TOM
KE
N
ARGENTIA
HAROLD
WALKER
WANLESS
MC
VE
AN
ERIN CENTRE
CE
NTR
E
INDIAN
WE
ST
HIGHPOINT
TEN
TH
GR
EAT
LA
KE
S
DA
RC
EL
RATHBURN
ORENDA
CATARACT
OLD SCHOOL
THE GRANGE
BEECH GROVE
SUN
NY M
EA
DO
W
TRUSCOTT
HOWDEN
ALBI
ON
VAU
GH
AN
MATHESON
MORNING STAR
BLOOR
MA
LTA
AQUITAIN
E
NU
NN
VIL
LE
TERRAGAR
CENTRE VIEW
QUEEN
ERIN
DA
LE S
TATI
ON
WILLIAMS
RIC
HVA
LE
ELGIN
OLD DERRY
OG
DE
N
CH
RY
SLE
R
MOFFATT
TER
RY
FOX
NORTH PARK
FIRST GULF
CONSERVATION
PAISLEY
SUN
FOR
EST
SOMBRERO
CH
ING
UA
CO
US
Y
CAL
EDO
N K
ING
TO
WN
CR
ED
ITVIE
W
BEECH GROVE
FINNERTY
HE
ART
LAK
E
587
648
289
-390
66
430
-400
-260
1120
105
1160
290330
310
316
24
236
540-110
237297
LegendRegion of Peel Boundary
Employment Growth 2026-20312,501 to 5,0001,501 to 2,5001,001 to 1,500501 to 1,0001 to 5000-1200 to -1
*Data source is Region of PeelSGU dataset dated 2012.
¹
Master Plan
HALT
ON
YORK
TORO
NTO
Sep 18, 20121:175,000
60216517-8-G
Employment Growth - Scenario B2026-2031

Appendix 2CBaseline Natural Heritage Studies Report

Prepared by: AECOM 300 – 300 Town Centre Boulevard 905 477 8400 tel Markham, ON, Canada L3R 5Z6 905 477 1456 fax www.aecom.com Project Number: Date: November 2012
Regional Municipality of Peel
Baseline Natural Heritage Studies Report

AECOM Regional Municipality of Halton Baseline Environmental Studies Report: Natural Features and Hydrology
Baseline Environmental Report - Peel Master Plan
Statement of Qualifications and Limitations The attached Report (the “Report”) has been prepared by AECOM Canada Ltd. (“Consultant”) for the benefit of the client (“Client”) in accordance with the agreement between Consultant and Client, including the scope of work detailed therein (the “Agreement”). The information, data, recommendations and conclusions contained in the Report (collectively, the “Information”):
• is subject to the scope, schedule, and other constraints and limitations in the Agreement and the qualifications contained in the Report (the “Limitations”)
• represents Consultant’s professional judgement in light of the Limitations and industry standards for the preparation of similar reports
• may be based on information provided to Consultant which has not been independently verified • has not been updated since the date of issuance of the Report and its accuracy is limited to the time
period and circumstances in which it was collected, processed, made or issued • must be read as a whole and sections thereof should not be read out of such context • was prepared for the specific purposes described in the Report and the Agreement • in the case of subsurface, environmental or geotechnical conditions, may be based on limited testing and
on the assumption that such conditions are uniform and not variable either geographically or over time Consultant shall be entitled to rely upon the accuracy and completeness of information that was provided to it and has no obligation to update such information. Consultant accepts no responsibility for any events or circumstances that may have occurred since the date on which the Report was prepared and, in the case of subsurface, environmental or geotechnical conditions, is not responsible for any variability in such conditions, geographically or over time. Consultant agrees that the Report represents its professional judgement as described above and that the Information has been prepared for the specific purpose and use described in the Report and the Agreement, but Consultant makes no other representations, or any guarantees or warranties whatsoever, whether express or implied, with respect to the Report, the Information or any part thereof. The Report is to be treated as confidential and may not be used or relied upon by third parties, except:
• as agreed in writing by Consultant and Client • as required by law • for use by governmental reviewing agencies
Consultant accepts no responsibility, and denies any liability whatsoever, to parties other than Client who may obtain access to the Report or the Information for any injury, loss or damage suffered by such parties arising from their use of, reliance upon, or decisions or actions based on the Report or any of the Information (“improper use of the Report”), except to the extent those parties have obtained the prior written consent of Consultant to use and rely upon the Report and the Information. Any damages arising from improper use of the Report or parts thereof shall be borne by the party making such use. This Statement of Qualifications and Limitations is attached to and forms part of the Report and any use of the Report is subject to the terms hereof.

Baseline Environmental Report - Peel Master Plan

AECOM Regional Municipality of Peel Baseline Natural Heritage Report
Baseline Environmental Report - Peel Master Plan
Distribution List
# of Hard Copies PDF Required Association / Company Name
Regional Municipality of Peel
AECOM
AECOM Signatures Report Prepared By: Jennifer Paterson, B.A., M.Sc.
Biogeographer, Environment
Report Reviewed By:

AECOM Regional Municipality of Peel Baseline Natural Heritage Report
Baseline Environmental Report - Peel Master Plan
Table of Contents Statement of Qualifications and Limitations Distribution List
page
Regional Municipality of Peel ................................................................................................................. 1
Baseline Natural Heritage Studies Report ............................................................................................. 1
Statement of Qualifications and Limitations ......................................................................................... 2
AECOM Signatures .................................................................................................................................. 2
Table of Contents .................................................................................................................................... 3
Statement of Qualifications and Limitations ......................................................................................... 3
List of Figures .......................................................................................................................................... 4
List of Tables ........................................................................................................................................... 4
1. Introduction .................................................................................................................................. 1
2. Scope of Study ............................................................................................................................. 1
3. Methodology................................................................................................................................. 2 3.1 Secondary Source Information Collection and Review ..................................................................... 2
3.1.1 Significant Species ............................................................................................................. 2 3.2 Report Organization ........................................................................................................................ 2
4. Policy Overview ........................................................................................................................... 3 4.1 Federal Context .............................................................................................................................. 3
4.1.1 Federal Fisheries Act ......................................................................................................... 3 4.1.2 Species at Risk Act ............................................................................................................ 3
4.2 Provincial Context ........................................................................................................................... 4 4.2.1 Planning Act (1996) ............................................................................................................ 4 4.2.2 Provincial Policy Statement (2005) ..................................................................................... 5 4.2.3 The Greenbelt Act (2005) ................................................................................................... 5 4.2.4 Growth Plan for the Greater Golden Horseshoe (2006) ....................................................... 8 4.2.5 Endangered Species Act, 2007 .......................................................................................... 9 4.2.6 Niagara Escarpment Plan ................................................................................................. 10
4.3 Oak Ridges Moraine Conservation Plan ........................................................................................ 11 4.4 Conservation Authority Regulations .............................................................................................. 11 4.5 Region of Peel .............................................................................................................................. 13
5. Overview of Existing Conditions .............................................................................................. 13 5.1 Physiography ................................................................................................................................ 13
5.1.1 Iroquois Plain ................................................................................................................... 13 5.1.2 South Slope Region ......................................................................................................... 14 5.1.3 Peel Plain Region ............................................................................................................. 14 5.1.4 Niagara Escarpment ......................................................................................................... 14 5.1.5 Oak Ridges Moraine ......................................................................................................... 14 5.1.6 Guelph Drumlin Field ........................................................................................................ 15
AECOM Regional Municipality of Peel Baseline Natural Heritage Report
Baseline Environmental Report - Peel Master Plan
5.2 Ecological Features ...................................................................................................................... 15 5.2.1 Aquatic Environment ........................................................................................................ 15
5.2.1.1 Credit River Watershed ................................................................................... 15 5.2.1.2 Humber River Watershed ................................................................................ 16 5.2.1.3 Etobicoke Creek and Mimico Creek Watersheds ............................................. 16 5.2.1.4 Lake Ontario Watersheds ............................................................................... 17
5.2.2 Terrestrial Environment .................................................................................................... 17
6. Environmental Features of the Primary Study Area ................................................................ 19 6.1 Niagara Escarpment ..................................................................................................................... 20 6.2 Oak Ridges Moraine ..................................................................................................................... 20 6.3 Greenbelt...................................................................................................................................... 20 6.4 Peel Greenlands System .............................................................................................................. 20 6.5 Areas of Natural and Scientific Interest.......................................................................................... 20 6.6 Wetlands ...................................................................................................................................... 23 6.7 Environmentally Sensitive Areas (ESA) ......................................................................................... 26 6.8 Conservation Areas ...................................................................................................................... 26 6.9 Fish and Fish Habitat .................................................................................................................... 27
6.9.1 Terrestrial Habitat ............................................................................................................. 31 6.9.2 Rare Species ................................................................................................................... 31
7. Summary .................................................................................................................................... 32
8. References ................................................................................................................................. 32
9. Appendix A – Rare Species Occurrences ................................................................................ 35 List of Figures
Figure 1 Master Plan Study Area and Primary Study Area examined for the baseline natural heritage report .................................................................................................................................................... 1
Figure 4 Quaternary watersheds and conservation authority jurisdictions in the Master Plan Study AreaError! Bookmark not defined. List of Tables

AECOM Regional Municipality of Peel Baseline Natural Heritage Report
Baseline Environmental Report - Peel Master Plan 1
1. Introduction AECOM has been retained by the Regional Municipality of Peel for the development of the 2012 Water and Wastewater Plan for Lake-Based Systems (the 2012 Master Plan). The purpose of the 2012 Master Plan is to evaluate the ability of existing and planned water and wastewater infrastructure in the Region of Peel to efficiently and effectively service the Region’s existing and anticipated growth, and to evaluate and develop recommended servicing strategies. The initial phase of this study culminated in the preparation of this Existing Environmental Conditions Report, which identifies and describes key features and functions of the natural environment. Through the identification and description of these features and functions, potential constraints and/or opportunities are highlighted. This report will be used to support the high level review and evaluation of alternative servicing alignments, environmental crossings and infrastructure siting. The Master Plan Study Area, delineated in Figure 1, is Region-wide. This study area covers approximately 1,240 km2, encompassing the area municipalities of the City of Mississauga, the City of Brampton and the Town of Caledon. A description of the applicable environmental policy framework and an overview of existing features and conditions in the Master Plan Study Area was completed and mapped. Given the Study’s consideration of only Lake-Based Systems, the Primary Study Area includes the southern and central sections of Peel Region, extending as far north as Castlederg Sideroad/Boston Mills Road. For the Primary Study Area, more detailed mapping, feature description and inventory of existing environmental conditions have been provided. 2. Scope of Study This study encompasses a review of the natural heritage features and functions of the Master Plan Study Area and Primary Study Area. This initial phase of the study is critical to the understanding of key natural heritage processes and linkages. The study is intended to provide the regulatory background, document existing conditions, identify development-related constraints, provide the policy framework, based on secondary source information review and provide input into the evaluation of alternatives. This background review report will form part of the complete Master Plan document and will be used as a basis for further servicing analyses going forward as part of the Master Plan.

AECOM Regional Municipality of Peel Baseline Natural Heritage Report
Baseline Environmental Report - Peel Master Plan 2
3. Methodology 3.1 Secondary Source Information Collection and Review
Secondary source information was compiled and analyzed to develop a general understanding of the aquatic ecosystems, drainage patterns, vegetation and wildlife. Secondary source information was reviewed from the following sources:
• Ministry of Natural Resources Natural Heritage Information Centre (NHIC) – Rare species and natural area records
• MNR Wetland Evaluations • Environmentally Sensitive Areas (ESA) • Areas of Natural and Scientific Interest (ANSI) reports • Digital orthoimagery • Ministry of Natural Resources (MNR) Natural Resource Values Systems (NRVIS) mapping • MNR fisheries information • Conservation Ontario 2012 Aquatic Species at Risk • Watershed and subwatershed studies • The Physiography of Southern Ontario
3.1.1 Significant Species
Rare species information for the Primary Study Area was compiled from observations reported to the Natural Heritage Information Centre (NHIC) and the Peel Data Centre. A summary of these species observations and their rarity designations is provided in Appendix A. The NHIC database was used as a source for rare species information because it is a database that uniformly covers the Primary Study Area. However, some of the NHIC records of rare species are dated and, for this reason, more recent information will be incorporated into the study as it becomes available.
3.2 Report Organization
This report has been organized to describe the results, collected following the methodology included above, at two levels. Section 4 and Section 5 describe the policy framework and an overview of existing conditions, respectively, at a general level for the Region of Peel (Master Plan Study Area). Section 6 describes the results at a more detailed level for the Primary Study Area (Figure 1).

AECOM Regional Municipality of Peel Baseline Natural Heritage Report
Baseline Environmental Report - Peel Master Plan 3
4. Policy Overview 4.1 Federal Context
4.1.1 Federal Fisheries Act
The key national legislation for the protection of fish habitat is the Fisheries Act. The primary goal of this Act is to protect fish habitat from 1) biological 2) physical 3) or chemical alterations that are harmful or destructive. Fisheries and Oceans Canada (DFO) is responsible for the enforcement and management of fisheries resources according to the Fisheries Act. DFO works in conjunction with a variety of other agencies (Environment Canada, Ontario Ministry of Natural Resources (OMNR), Ontario Ministry of the Environment and Conservation Authorities) for administration of various portions of the Fisheries Act. The two significant components of this legislation in relation to watercourse crossings are briefly discussed below:
Section 35(1):
No person shall carry on any work or undertaking that result in the harmful alteration, disruption or destruction of fish habitat.
The guiding principle for Section 35(1) is "no net loss" of productive capacity of fish habitat in relation to project proposals. The DFO is ultimately responsible for the review and analysis process to identify the mitigation measures required to minimize or eliminate the adverse effects of projects on habitat or the compensation measures that apply in order to achieve no net loss in the productive capacity of fish habitat.
Section 36(3):
No person shall deposit or permit the deposit of a deleterious substance of any type in water frequented by fish or in any place under any conditions where the deleterious substance or any other deleterious substance that results from the deposit of the deleterious substance may enter such water.
4.1.2 Species at Risk Act
The federal Species at Risk Act (SARA) was created to prevent wildlife species from becoming extinct. The federal Act protects species at risk and their critical habitats. SARA also contains provisions to help manage species of special concern to prevent them from becoming endangered or extinct. The Act became law in June 2003. It includes prohibitions against killing, harming, harassing, capturing or taking species at risk, and makes it illegal to destroy their critical habitats and can impose restrictions on development and construction projects. The Ontario Endangered Species Act (2007) covers public and private lands while the main limitation of SARA is that its legislative coverage extends only to federal lands. In Ontario, the SARA will take precedence for habitat protection and stewardship efforts for migratory birds and some aquatic species designated ‘at risk’. The Ontario ESA (2007) takes precedence for most other species at risk. Species are designated ‘at risk’ by the Committee on the Status of Endangered Wildlife in Canada (COSEWIC), an independent body of experts that assesses wildlife according to a broad range of scientific data. The committee meets annually to review status reports on species suspected of being at risk and provides assessments to government and the public. The federal Cabinet then decides whether those species should get legal protection under the Act. These decisions are made after consultations with affected stakeholders and other groups.

AECOM Regional Municipality of Peel Baseline Natural Heritage Report
Baseline Environmental Report - Peel Master Plan 4
Once a species is added to the list and protected officially under SARA, a recovery strategy must be developed. For endangered species, this strategy must be developed within a year of the listing; for threatened or extirpated (extinct in Canada) species, it must be developed within two years. Recovery strategies and action plans for species listed as endangered or threatened will be developed in consultation with stakeholders. These recovery strategies and action plans will detail the specific steps that need to be taken to protect identified species. Action plans summarize the projects and activities required to meet recovery strategy objectives and goals. They include information on habitat, details of protection measures, and evaluation of socio-economic costs and benefits. Action plans are the second element of the Act’s two-part recovery planning process, and are used to implement projects and activities to improve species status. Management plans differ from recovery strategies and action plans. Management plans set goals and objectives for maintaining sustainable population levels of one or more species that are particularly sensitive to environmental factors, but which are not yet considered in danger of becoming extinct. Whenever possible, management plans are prepared for multiple species on an ecosystem or landscape level. SARA provides for a number of exceptions in a variety of circumstances. For example, activities that are undertaken in accordance with conservation measures for wildlife species under a land claims agreement are exempt from the application of SARA prohibitions. Activities related to public safety, health or national security may also be exempted. SARA also allows for permits to be issued or agreements to be entered into under certain conditions, to authorize certain activities that would otherwise contravene the Act. Watersheds within the Master Plan Study Area contain watercourse segments that have been identified as having known distributions of fish designated as Extirpated, Endangered and/or Threatened that are not currently on Schedule 1 of the federal Species at Risk Act (SARA). Species in this category include Lake Sturgeon and Redside Dace. Although the SARA prohibitions do not currently apply to these species, they could in the near future.
4.2 Provincial Context
At the provincial level, the following policies apply:
4.2.1 Planning Act (1996)
The Planning Act is the Act which co-ordinates planning in the Province of Ontario. The Planning Act sets out the ground rules for land use planning throughout the province and describes how land uses may be controlled and who may control them. In terms of Natural Heritage policy specifically, the Planning Act is important for two reasons. First, it requires that municipal planning authorities “shall have regard to matters of provincial interest.” Among the primary “matters of provincial interest” the first one identified in the Act is “the protection of ecological systems, including natural areas, features and functions”. In addition, the Planning Act provides for the issuance of Provincial Policy Statements and mandates that municipal planning authorities’ decisions “shall be consistent with” said statements. Further, the Act requires municipal planning authorities’ decisions to conform to the Provincial plans effective at the time decisions are made.

AECOM Regional Municipality of Peel Baseline Natural Heritage Report
Baseline Environmental Report - Peel Master Plan 5
4.2.2 Provincial Policy Statement (2005)
The Provincial Policy Statement (PPS) has a strong focus on the long-term prosperity and environmental health of Ontario. It states that natural features and areas shall be protected for the long-term (2.1.1). The PPS defines Natural Features and Areas as:
“features and areas, including significant wetlands, significant coastal wetlands, fish habitat, significant woodlands south and east of the Canadian Shield, significant valley lands south and east of the Canadian Shield, significant habitat of endangered species and threatened species, significant wildlife habitat, and significant areas of natural and scientific interest, which are important for their environmental and social values as a legacy of the natural landscapes of an area”.
The PPS also defines Natural Heritage System as:
“A system made up of natural heritage features and areas, linked by natural corridors which are necessary to maintain biological and geological diversity, natural functions, viable populations of indigenous species and ecosystems. These systems can include lands that have been restored and areas with the potential to be restored to a natural state“
And states that,
“the diversity and connectivity of natural features in an area, and the long-term ecological function and biodiversity of natural heritage systems, should be maintained, restored or, where possible, improved, recognizing linkages between and among natural heritage features and areas, surface water features and groundwater features” (2.1.2).
The PPS provides direction on the protection of the Natural Heritage System by not permitting development and site alteration in a number of circumstances:
• significant habitat of endangered species and threatened species; • significant wetlands in Ecoregions 5E, 6E and 7E; • significant coastal wetlands; • significant wetlands in the Canadian Shield north of Ecoregions 5E, 6E and 7E; • significant woodlands south and east of the Canadian Shield ; • significant valleylands south and east of the Canadian Shield; • significant wildlife habitat; • significant areas of natural and scientific interest; • fish habitat except in accordance with provincial and federal requirements; and • adjacent lands to the natural heritage features and areas unless the ecological function of the adjacent
lands has been evaluated and it has been demonstrated that there will be no negative impacts on the natural features or on their ecological functions.
4.2.3 The Greenbelt Act (2005)
Ontario’s Greenbelt is 1.8 million acres of permanently protected green space, farmland, communities, forests, wetlands, and watersheds. The Greenbelt Plan contains policies for providing permanent agricultural and

AECOM Regional Municipality of Peel Baseline Natural Heritage Report
Baseline Environmental Report - Peel Master Plan 6
environmental protection as well as providing for a wide range of recreation, tourism and cultural opportunities in the area. The Greenbelt Plan encompasses lands within the Niagara Escarpment Plan (NEP) and the Oak Ridges Moraine Conservation Plan (ORMCP), while building upon the foundation of ecological protections provided by these two Plans. The Protected Countryside is comprised of an Agricultural System and a Natural System, together with a number of settlement areas, and is intended to improve linkages among these areas and surrounding systems. The Natural System identifies lands that support both natural heritage and hydrologic features and functions. The Natural System policies protect areas of natural heritage, hydrologic and/or landform features, which are often functionally inter-related and which collectively support biodiversity and overall ecological integrity. This Natural System is made up of a Natural Heritage System and a Water Resource System that often coincides given ecological linkages between terrestrial and water based functions. The Natural Heritage System includes areas of the Protected Countryside with the highest concentration of the most sensitive and/or significant natural features and functions. The Water Resource System is made up of both ground and surface water features and their associated functions, which provide the water resources necessary to sustain healthy aquatic and terrestrial ecosystems and human water consumption. The Greenbelt Plan recognizes that the Natural System extends beyond the boundaries of the Greenbelt and encourages connections between the Greenbelt’s Natural System and broader scale natural heritage systems of southern Ontario. Criteria have been identified to permit potential municipal requests to grow the Greenbelt. Section 4.2 of the Greenbelt Plan provides the policies that apply to lands falling within the Protected Countryside with respect to infrastructure.
4.2.1 General Infrastructure Policies
1. All existing, expanded or new infrastructure subject to and approved under the Canadian Environmental Assessment Act, the Environmental Assessment Act, the Planning Act, the Aggregate Resources Act, the Telecommunications Act or by the National or Ontario Energy Boards, or which receives a similar environmental approval, is permitted within the Protected Countryside, subject to the policies of this section and provided it meets one of the following two objectives:
a. It supports agriculture, recreation and tourism, rural settlement areas, resource use or the rural economic activity that exists and is permitted within the Greenbelt; or
b. It serves the significant growth and economic development expected in southern Ontario beyond the Greenbelt by providing for the appropriate infrastructure connections among urban growth centres and between these centres and Ontario’s borders.
2. The location and construction of infrastructure and expansions, extensions, operations and maintenance of infrastructure in the Protected Countryside, are subject to the following:
a. Planning, design and construction practices shall minimize, wherever possible, the amount of the Greenbelt, and particularly the Natural Heritage System, traversed and/or occupied by such infrastructure;
b. Planning, design and construction practices shall minimize, wherever possible, the negative impacts and disturbance of the existing landscape, including, but not limited to, impacts caused by light intrusion, noise and road salt;
c. Where practicable, existing capacity and coordination with different infrastructure services is optimized so that the rural and existing character of the Protected

AECOM Regional Municipality of Peel Baseline Natural Heritage Report
Baseline Environmental Report - Peel Master Plan 7
Countryside and the overall urban structure for southern Ontario established by Greenbelt and any provincial growth management initiatives are supported and reinforced;
d. New or expanding infrastructure shall avoid key natural heritage features or key hydrologic features unless need has been demonstrated and it has been established that there is no reasonable alternative; and
e. Where infrastructure does cross the Natural Heritage System or intrude into or result in the loss of a key natural heritage feature or key hydrologic feature, including related landform features, planning, design and construction practices shall minimize negative impacts and disturbance on the features or their related functions, and where reasonable, maintain or improve connectivity.
Section 3.2.3 of the Greenbelt Plan provides the policies that apply throughout the Protected Countryside with respect to the Water Resource System.
3.2.3 Water Resource System Policies
1. All planning authorities shall provide for a comprehensive, integrated and long-term approach for the protection, improvement or restoration of the quality and quantity of water. Such an approach will consider all hydrologic features and functions and include a systems approach to the inter-relationships between and/or among recharge/discharge areas, aquifers, head- waters and surface waters (e.g. lakes as well as rivers and streams, including intermittent streams).
2. Watersheds are the most meaningful scale for hydrological planning, and municipalities together with conservation authorities should ensure that watershed plans are completed and used to guide planning and development decisions within the Protected Countryside.
3. Cross-jurisdictional and cross-watershed impacts need to be considered in the development of watershed plans. The development of watershed plans and watershed management approaches in the Protected Countryside should be integrated with watershed planning and management in the NEP and the ORMCP areas and beyond the Greenbelt.
4. Municipalities shall, in accordance with provincial direction related to the protection of source water, protect vulnerable surface and ground water areas, such as wellhead protection areas, from development that may adversely affect the quality and quantity of ground and surface waters.
Section 4.2.2 of the Greenbelt Plan provides policies that apply to sewage and water infrastructure proposals, in addition to the general infrastructure policy listed above.
4.2.2 Sewage and Water Infrastructure Policies
1. Proposals for infrastructure within or crossing the Protected Countryside shall demonstrate that:
a. Sewage and water servicing can be provided in a manner that does not negatively impact ecological features and functions, quality and quantity of ground and surface water, including stream baseflow, and is sufficient to accommodate the proposed use(s);

AECOM Regional Municipality of Peel Baseline Natural Heritage Report
Baseline Environmental Report - Peel Master Plan 8
b. Applicable recommendations, standards or targets within watershed plans and water budgets are reflected; and
c. Any sewage and water servicing installation is planned, designed and constructed to minimize surface and groundwater disruption.
2. Where settlements do not currently have Great Lake or Lake Simcoe based water and sewage services, extensions to or expansions of existing Great Lake or Lake Simcoe based services to such settlements is not permitted, unless such servicing is required to address failed individual on-site sewage or water services or to ensure the protection of public health where it has been determined by a medical officer of health (or health authority) that there is a public health concern associated with existing services within the settlement. The capacity of the services provided in the these circumstances will be restricted to that required to service the affected existing settlement plus the capacity for potential development within the approved settlement boundary as it existed on the date this Plan came into effect.
3. Where settlements currently have, or have approvals for, Great Lake based water and/or sewer services as of the date this Plan came into effect, such services may be extended and expanded to service growth within an approved settlement boundary as it existed on the date this Plan came into effect. Where only Great Lake water exists or has been approved, corresponding municipal sewage service shall be required in order for any expansion of the current settlement boundary where such expansion would be permitted by this Plan.
4. Where settlement area expansions are contemplated by a municipality, the environmental assessment in support of expanded sewage and water services must be completed or approved prior to amending the boundaries of the settlement within the municipal official plan. The expansion must not extend into the Natural Heritage System or the specialty crop area.
5. The extension of municipal or private communal sewage or water services outside of a settlement boundary shall only be permitted in the case of health issues or to service existing uses and the expansion thereof adjacent to the settlement. Notwithstanding the above, where municipal water services exist outside of settlements areas, existing uses within the service area boundary as defined by the environmental assessment may be connected to such a service.
6. New or expanded partial servicing, where site conditions are suitable for the long-term provision of such services, is only permitted in the following circumstances:
a. Where such servicing is necessary to address failed individual on-site sewage or water services serving existing development; or
b. To allow for infilling and intensification within settlement areas served by partial services as of the date this Plan came into effect.
7. In the siting of new municipal and other wells, consideration shall be given to the location of vulnerable areas.
4.2.4 Growth Plan for the Greater Golden Horseshoe (2006)
The Growth Plan for the Greater Golden Horseshoe (GGH) has been prepared under the authority of the Places to Grow Act, 2005. This Plan works within the existing planning framework to provide growth management policy direction for the GGH. The Plan recognizes that urban sprawl contributes to the degradation of our natural environment, air quality and water resources, as well as the consumption of agricultural lands and other natural resources. The Plan supports the role of municipal policy in providing leadership and innovation in developing a culture of conservation.

AECOM Regional Municipality of Peel Baseline Natural Heritage Report
Baseline Environmental Report - Peel Master Plan 9
The Plan intends to conduct sub-area assessments and, in consultation with municipalities and other stakeholders, will identify natural systems for the GGH, and where appropriate develop additional policies for their protection. The Plan also encourages planning authorities to identify natural heritage features and areas that complement, link, or enhance natural systems. Municipalities are encouraged to develop a system of publicly accessible parkland, open space and trails embedded in a natural heritage system as well as establish an urban open space system within built-up areas, which may include rooftop gardens, communal courtyards, and public parks.
4.2.5 Endangered Species Act, 2007
Ontario’s original Endangered Species Act was written in 1971. The new Endangered Species Act, 2007 received Royal Assent on May 17, 2007. With some minor exceptions, the Act came into force on June 30, 2008. The purposes of this Act are:
1. To identify species at risk based on the best available scientific information, including information obtained from community knowledge and aboriginal traditional knowledge.
2. To protect species that are at risk and their habitats, and to promote the recovery of species that are at risk.
3. To promote stewardship activities to assist in the protection and recovery of species that are at risk. The new legislation is the first in Canada to combine mandatory habitat protection with a science-based approach to listing species for protection. Species thought to be at risk are assessed by The Committee on the Status of Species at Risk in Ontario (COSSARO). COSSARO is an independent body that reviews species based on the best available science, including community knowledge, and Aboriginal Traditional Knowledge. Once species are classified "at risk", they are added to the Species at Risk in Ontario (SARO) list in one of four categories. Endangered, threatened and extirpated species on this list automatically receive legal protection under the ESA 2007. Providing legal protection to threatened species is a change from the original Act which only applied to endangered species. The new Act provides protection for species and their habitats. When a species is classified as endangered or threatened the habitat of that species is protected under a general definition. The Lieutenant Governor in Council may make regulations prescribing as area as habitat of a species that is listed as extirpated, endangered or threatened on the SARO list. A habitat regulation can prescribe an area as the habitat of a species through the description of boundaries or features of an area, or by describing that area in any other manner. Habitat will be regulated with the goal of protecting habitat that promotes the survival and recovery of endangered and threatened species. Species-specific habitat prescribed and protected under Regulation 242-08, that is considered likely to occur within the Primary Study Area, will be assessed through detailed field investigations during subsequent phases of this study. The Government of Ontario has passed regulations defining the habitat of twelve species that include American Badger, Barn Owl, Eastern Flowering Dogwood, Eastern prairie fringed-orchid, Engelmann’s quillwort, Few-flowered club-rush, Jefferson salamander, Ogden’s Pondweed, Peregrine falcon, Redside Dace, Western silvery aster and Wood turtle.

AECOM Regional Municipality of Peel Baseline Natural Heritage Report
Baseline Environmental Report - Peel Master Plan 10
The ESA 2007 calls for the creation of recovery strategies for endangered and threatened species, and management plans for special concern species. These documents provide advice to the government on steps to take to protect and recover species at risk to healthy population levels. Timelines and reporting requirements have been outline in the Act to improve implementation. For example:
• Recovery strategies must be created within 1 year for newly listed endangered species. • The government must also let the public know which actions will be taken for species recovery.
The ESA 2007 is also responsive to Ontario’s Environmental Bill of Rights. Proposed policies and regulations will be posted on the Environmental Registry for public review and comment. The ESA 2007 contains tools that provide opportunities for the government to enter into agreements, make regulations and issue permits for a range of activities otherwise prohibited under the act. These tools enable activities that would not otherwise be permitted, as long as the intent is stewardship, protection, or rehabilitation of the species. These tools may also allow for social and economic issues to be addressed. 4.2.6 Niagara Escarpment Plan
The Niagara Escarpment includes a variety of topographic features and land uses extending 725 km from Queenston on the Niagara River to the islands off Tobermory on the Bruce Peninsula. Designated a UNESCO World Biosphere Reserve in 1990, the Niagara Escarpment is an internationally recognized landform and is the cornerstone of Ontario’s Greenbelt. The Niagara Escarpment is a protected area under the Province of Ontario’s Niagara Escarpment Planning and Development Act and the Niagara Escarpment Plan (NEP) Canada’s first large-scale environmental land use plan. The Niagara Escarpment Plan outlines land use designations, development criteria and related permitted uses, including farming, forestry and mineral resource extraction. It also provides the framework for a string of more than 130 existing and proposed parks and open spaces linked by the Bruce Trail, Canada’s oldest and longest continuous footpath. The objectives of the Plan are:
1. To protect unique ecologic and historical areas; 2. To maintain and enhance the quality and character of natural streams and water supplies; 3. To provide adequate opportunities for outdoor recreation; 4. To maintain and enhance the open landscape character of the Niagara Escarpment in so far as possible, by
such means as compatible farming or forestry and by preserving the natural scenery; 5. To ensure that all new development is compatible with the purpose of the Plan; 6. To provide for adequate public access to the Niagara Escarpment; and 7. To support municipalities with the Niagara Escarpment Plan Area in their exercise of the planning functions
conferred upon them by the Planning Act. The area of the Niagara Escarpment Plan has been allocated among the following seven land use designations:
• Escarpment Natural Area • Escarpment Protection Area

AECOM Regional Municipality of Peel Baseline Natural Heritage Report
Baseline Environmental Report - Peel Master Plan 11
• Escarpment Rural Area • Minor Urban Centre • Urban Area • Escarpment Recreation Area • Mineral Resource Extraction Area
4.3 Oak Ridges Moraine Conservation Plan
The Oak Ridges Moraine is one of Ontario’s most significant landforms. This irregular 160-kilometre ridge stretches from the Niagara Escarpment in the west to the Trent River in the east. Located north of and parallel to Lake Ontario, the Moraine divides the watersheds draining south into western Lake Ontario from those draining north into Georgian Bay, Lake Simcoe and the Trent River system. Through the Oak Ridges Moraine Conservation Act, 2001 and the accompanying Oak Ridges Moraine Conservation Plan (ORMCP) published in 2002, the Province has established direction for protecting the Oak Ridges Moraine. The Oak Ridges Moraine Conservation Plan is an ecologically based plan established by the Ontario government to provide land use and resource management direction for the 190,000 hectares of land and water within the Moraine. The ORMCP divides the Moraine into four land use designations: Natural Core Area, Natural Linkage Area, Countryside Areas and Settlement Areas which are described under the ORMCP as follows:
• Natural Core Areas protect those lands with the greatest concentrations of key natural heritage features which are critical to maintaining the integrity of the Moraine as a whole. Only existing uses and very restricted new resource management, agricultural, low intensity recreational, home businesses, transportation and utility uses are allowed in these areas;
• Natural Linkage Areas protect critical natural and open space linkages between the Natural Core Areas and along rivers and streams. The only uses that are allowed are those allowed in Natural Core Areas, plus some aggregate resource operations.
• Countryside Areas provide an agricultural and rural transition and buffer between the Natural Core Areas
and Natural Linkage Areas and the urbanized Settlement Areas. Prime agricultural areas as well as natural features are protected. Most of the uses typically allowed in agricultural and other rural areas are allowed here.
• Settlement Areas reflect a range of existing communities planned by municipalities to reflect community
needs and values. Urban uses and development as set out in municipal official plans are allowed (ORMCP, 2002).
4.4 Conservation Authority Regulations
Conservation Authorities are local agencies that protect and manage water and other natural resources at the watershed level. These agencies have a number of responsibilities and functions in the land use planning and development process. Peel Region contains portions of five watersheds, under the jurisdiction of Credit Valley Conservation (CVC), Toronto Region Conservation (TRCA), Conservation Halton (CH), Nottawasaga Valley Conservation (NVCA) and Lake Simcoe Region Conservation Authority (LSRCA). Watershed boundaries are shown in Figure 1. For this

AECOM Regional Municipality of Peel Baseline Natural Heritage Report
Baseline Environmental Report - Peel Master Plan 12
study, CVC and TRCA will be the Conservation Authorities predominately involved, given that their respective watersheds cover most of Peel Region. Credit Valley Conservation (CVC) and Toronto Region Conservation (TRCA) act as commenting agencies on development applications under the Planning Act based on regulations approved by their Board of Directors. These Conservation Authorities have agreements with partnering municipalities to provide technical clearance and technical advisory services regarding matters associated with natural heritage protection, hazardous land management and water resources (e.g. stormwater management). In addition, the Conservation Authorities have the delegated responsibility from the Ministries of Natural Resources and Municipal Affairs and Housing to implement Section 3.1 of the Provincial Policy Statement (PPS, 2005), consistent with the Provincial One-Window planning initiative. To this end, Conservation Authorities are required to review and provide comments on policy documents (e.g. Official Plans) and applications. Conservation Authorities also administer Regulation 160/06 and Regulation 162/06 under Section 28 of the Conservation Authorities Act. In general these regulations prohibit altering a watercourse, wetland or shoreline and prohibit development in areas adjacent to river and stream valleys, hazardous lands and wetlands, without the prior written approval from the Conservation Authority (i.e. issuance of a permit).
Finally, Credit Valley Conservation has a Level II agreement with Fisheries and Oceans Canada (DFO) to review projects under Section 35(1) of the Fisheries Act. CVC’s responsibilities under this agreement are:
1. Determination of the presence of fish habitat. 2. Working with the proponent to mitigate impacts to fish habitat as a result of the proposal. 3. Issuing a letter of advice for projects that will likely not constitute a Harmful Alteration, Disruption or
Destruction of fisheries habitat (known as a HADD for short). 4. If necessary, referring the proposal to Fisheries and Oceans Canada for authorization under the Fisheries
Act, if the impacts cannot be mitigated.
Toronto Region Conservation has a Level III agreement with Fisheries and Oceans Canada (DFO). Therefore, in addition to the above responsibilities, TRCA has the ability to provide advice on mitigation procedures and prepare fish habitat compensation plans for projects that will likely constitute a HADD. Proposals requiring authorization for a HADD must be referred to Fisheries and Oceans Canada for final approval.
AECOM Regional Municipality of Peel Baseline Natural Heritage Report
Baseline Environmental Report - Peel Master Plan 13
4.5 Region of Peel
The Region of Peel Official Plan Office Consolidation (Region of Peel 2005) presents the Greenlands System in Schedule A of the Official Plan. The Greenlands System consists of core areas, natural areas and corridors. The Greenlands System is intended to support and express the Region of Peel’s vision for protection of the natural environment (Region of Peel 2001). Section 2.3.2.1 of the Official Plan defines the Greenlands System as including:
a) Core areas which are shown generally on Schedule A, and which are protected in this Plan and in the area municipal official plans;
b) Natural Area and Corridors which will be interpreted, protected and shown, as appropriate, in the area municipal official plans; and
c) Potential Natural Areas and Corridors, which will be interpreted, protected and shown as appropriate, in the area municipal plans. Potential Natural Areas and corridors will be analyzed to determine their functional role in supporting and enhancing the integrity of the Greenlands System in Peel.
The Region’s Greenlands System includes both evaluated and unevaluated wetlands. Provincially Significant Wetlands are considered to be Core Areas, while unevaluated wetlands are defined as Potential Natural Areas and Corridors. Refinement to the Region’s Greenlands System occurs through further study at the municipal level and incorporated by amendment into the area municipal official plan. The Peel-Caledon Significant Woodlands and Significant Wildlife Habitat Study was finalized in June, 2009. This is a technical study that recommends criteria and thresholds for identifying significant woodlands and significant wildlife habitat to inform the development of policies that will be considered through the Region’s Official Plan Review. 5. Overview of Existing Conditions The following sections provide a description of general physiography and terrestrial and fisheries biology features in the regional Master Plan Study Area.
5.1 Physiography
The Master Plan Study Area falls within six physiographic regions: the Iroquois Plain, the South Slope, the Peel Plain, the Niagara Escarpment, the Oak Ridges Moraine, and the Guelph Drumlin Field (Chapman and Putnam, 1984).
5.1.1 Iroquois Plain
During the last glacial period, the area surrounding Lake Ontario was inundated by meltwater to an elevation of about 110 to 150 m by a body of water known as Lake Iroquois (Sharp et al., 1999). The Lake Iroquois shoreline is marked by distinct shore-cliffs cut into the Halton Till, boulder pavements and gravel beaches that formed along the shore of Glacial Lake Iroquois. Fine sand was deposited in nearshore areas which grade to silts and clays in the more calm offshore areas closer to present day Lake Ontario. The slightly sloping Iroquois Plain Region extends
AECOM Regional Municipality of Peel Baseline Natural Heritage Report
Baseline Environmental Report - Peel Master Plan 14
around the western part of Lake Ontario, from the Niagara River to the Trent River in the east, and can reach thicknesses of up to 20 metres (Sharp et al. 1999).
5.1.2 South Slope Region
The South Slope is the southern slope of the Oak Ridge Moraine, which is blanketed in glacial till soils. It rises to the line of contact with the moraine at 240 to 300 metres above sea level (masl). Compared to the surrounding territory, it rises 90 to 120 metres in an average width of 9.5 to 11 kilometers. Both the Oak Ridge Moraine and the adjacent south slope extend laterally from the Niagara Escarpment to the Trent River. The South Slope covers approximately 2,434 square kilometres. Included in the South Slope region is the Trafalgar Moraine that stretches across the north part of Oakville extending eastward into Peel Region. This land form is an end moraine composed of silt and clay rich Halton Till sediment.
5.1.3 Peel Plain Region
The Peel Plain is a level-to-undulating tract of clay soils extending 776 square kilometers across the central portions of Regional Municipalities of York, Peel and Halton. General elevation ranges from approximately 150 to 230 masl with a gradual and fairly uniform slope toward Lake Ontario. The Credit, Humber, Don and Rouge Rivers have cut deep valleys across this plain, as have other streams such as Bronte, Oakville and Etobicoke Creeks. Each of these creeks has incised the underlying bedrock at depth, particularly in their lower reaches. The overburden material is comprised of the Halton clayey silt till containing large amounts of shale and limestone pebbles. In much of the Peel Plain, this situation has been modified by the presence of a veener of laminated silt and clay. The clay is of heavy texture and more calcareous than the underlying glacial till. Similar to the South Slope in this area, the plain overlies the Queenston Formation red shales. As a consequence, the clay to the southwest of the Credit River is reddish in colour and lower in lime than the clay in the eastern end of the plain. There are exceptions to be noted to the general heavy texture of the soil. This is visible in various places where the stream valleys are bordered by trains of sandy alluvium (Chapman and Putnam, 1984).
5.1.4 Niagara Escarpment
The Niagara Escarpment is Ontario’s most distinct landform and was designated a UNESCO World Biosphere Reserve in 1990. The Niagara Escarpment trends approximately north to south through the Master Plan Study Area and stretches from the Niagara River to the northern end of the Bruce Peninsula. This region is identified by vertical cliffs of dolostones of the Amabel Formation and the Cataract Group, with red shales of the Queenstone Formation found along the slopes. This ridge of dolostone bedrock can reach several hundred metres high in some places and is dominated by an irregular dolostone bedrock surface a few kilometers in width.
5.1.5 Oak Ridges Moraine
To the east of the Niagara Escarpment, the Oak Ridges Moraine physiographic region is present within the Master Plan Study Area. This distinct physiographic landform extends as a ridge of hilly terrain for 160 km from the Niagara Escarpment in the west to the headwaters of the Trent River in the east. The Oak Ridges Moraine was created as glaciers receded and deposited layers of sand and gravel that are separated by clay and till soils. The vast underground layers of sand and gravel collect and store rain water, which eventually resurfaces as cold, clean water that feeds the majority of the river systems in the Greater Toronto Area.

AECOM Regional Municipality of Peel Baseline Natural Heritage Report
Baseline Environmental Report - Peel Master Plan 15
5.1.6 Guelph Drumlin Field
The Guelph Drumlin Field occurs through the northwest portion of the Master Plan Study Area. These drumlins are generally comprised of sandy, silt Port Stanley Till, but are also known to have an older clayey or silt till core (Karrow, 1968). The long-axis of these drumlins varies from west to northwest. Deposits of peat, muck and marl, are often present in the low-lying areas between the drumlins.
5.2 Ecological Features
5.2.1 Aquatic Environment
Major watersheds within the Master Plan Study Area include the Credit River, Humber River, Mimico Creek, Etobicoke Creek and numerous local Lake Ontario watersheds. Small portions of the Holland River (LRSCA), Nottawasaga River (NVCA), Sixteen Mile Creek (HRCA) and Joshua Creek (HRCA) Watersheds encroach slightly within the Study Area. An overview of each of the major watersheds is provided below.
5.2.1.1 Credit River Watershed
The Credit River watershed occurs through the western portion of the Region and is under the jurisdiction of Credit Valley Conservation (CVC). This watershed covers 87,1572 ha, of which approximately 52,271 ha are within Peel Region (Figure 1). The Credit River originates north of the Town of Orangeville and outlets to Lake Ontario at Port Credit, totalling approximately 100 km in length. Major urban centres within the watershed include Orangeville, Georgetown, Brampton and Mississauga, occupying a total of 20% of the watershed. The remainder of the watershed is predominately agricultural. The most significant landscape features in the Credit River watershed are the Niagara Escarpment, the Oak Ridges Moraine and the Lake Ontario Shoreline. There are three general zones with the Credit River watershed, often referred to as the upper watershed (above the Niagara Escarpment), middle watershed (the Niagara Escarpment area between Inglewood and Norval) and the lower watershed (below the Niagara Escarpment). There has been very little development in the upper watershed, where the main river and tributaries remain in a relatively natural condition (CVC and MNR, 2002). In the middle watershed the Credit River flows through a steep-walled narrow valley. Small spring-fed and seasonal creeks, many of which develop in wetland complexes on the Escarpment plateau, drain over the Escarpment and into the main branch of the Credit River. The lower watershed, which extends between south of Norval to Lake Ontario, is largely urbanized and, as a result, many of the tributaries in this area have been anthropogenically altered and are characterized generally by poor water quality (CVC and MNR, 2002). Nearly 50 species of fish have been collected throughout the Credit River watershed, of which the most common species is Blacknose Dace. Brook trout, a highly sensitive species, is present in the upper watershed. Based on an Index of Biotic Integrity (IBI), the overall fish community health is generally good to excellent in the upper watershed, good to fair in the middle watershed, and fair to poor in the lower watershed (CVC 2005).

AECOM Regional Municipality of Peel Baseline Natural Heritage Report
Baseline Environmental Report - Peel Master Plan 16
5.2.1.2 Humber River Watershed
The Humber River Watershed occurs through the eastern section of Peel, and is under the jurisdiction of Toronto Region Conservation (TRCA). This watershed covers 91,056 ha, of which approximately 38,818 ha is within the Master Plan Study Area (Figure 1). The main Humber River Watershed is predominately agricultural with significant natural areas. Urban settlements within the watershed include Bolton, Caledon East, Palgrave, the Village of Kleinberg and Woodbridge. The headwaters of the main Humber River Watershed originate in the Niagara Escarpment and Oak Ridges Moraine. The river continues down through the South Slope to the Peel Plain (physiographic regions described in Section 5.1). The upper reaches through the Escarpment and Moraine are characterized by high recharge and high base flow rates, and low surface runoff, as a result of the permeable soils and hummocky terrain. In the lower reaches of the watershed, the clay soils associated with the Peel Plain result in much lower recharge rates (TRCA, 2008a). Water quality is quite variable between the upper and lower reaches of the watershed. The inputs of clean groundwater from the Oak Ridges Moraine result in reasonably good water quality in the upper reaches of the watershed. Poor water quality levels are seen through the lower reaches, as a result of low groundwater discharge rates, less permeable clay soils and increased rates of urbanization (TRCA, 2008a). A total of 75 fish species have been documented in the Humber River Watershed, 64 of which are native (TRCA, 2008b). The coldwater upper reaches of the watershed contain self-sustaining populations of brook trout, brown trout and rainbow trout. Through the middle reaches of the watershed, the provincially endangered redside dace is abundant (TRCA, 2008b). A host of species, described as habitat generalists are found commonly throughout the watershed, including creek chub, common shiner, blacknose dace, fathead minnow and longnose dace, white sucker and brook stickleback (TRCA, 2008b). The calculated IBI scores for the Humber Watershed indicate that the overall stream quality rating is fair, based on 2004 sampling results (TRCA, 2008b).
5.2.1.3 Etobicoke Creek and Mimico Creek Watersheds
The Etobicoke Creek and Mimico Creek Watersheds are generally referenced and managed together as a result of their close physical proximity and their many shared characteristics (TRCA, 2010). These two watersheds occur in the south-central (Etobicoke Creek) and southeastern (Mimico Creek) sections of Peel Region and are under the jurisdiction of Toronto Region Conservation. The combined area of these watersheds is 28,900 ha. Etobicoke Creek and Mimicro Creek drain 21,200 ha and 7,700 ha respectively. Both watersheds originate in the South Slope of the Oak Ridges Moraine and drain into Lake Ontario. Currently the majority of these watersheds in the Cities of Toronto, Mississauga and Brampton are urbanized, with rural lands occurring in the Town of Caledon. The Etobicoke and Mimico Creeks Watersheds both predominately support cool-warm water generalist species tolerant of a range of habitat conditions (TRCA, 2010). Mimico Creek Watershed lacks the headwater diversity and relatively greater abundance of fish supported by the Etobicoke Creek Watershed (TRCA, 2010) Based on an Index of Biotic Integrity (IBI), the overall fish community health ranges from “good” (Etobicoke West Brach), to “fair” (Etobicoke Creek Headwaters), to “poor” (Spring Creek, Tributary 3, Etobicoke Main Branch and Lower Etobicoke).

AECOM Regional Municipality of Peel Baseline Natural Heritage Report
Baseline Environmental Report - Peel Master Plan 17
5.2.1.4 Lake Ontario Watersheds
Fourteen watersheds, under the jurisdiction of Credit Valley Conservation, are classified in this report together as Lake Ontario Watersheds, on account of their smaller size and direct drainage to Lake Ontario. These watersheds are listed in Table 1 below with their total watershed areas and the areas within the Region of Peel.
Table 1. Peel Region Lake Ontario Watersheds
Watershed Name Total Watershed Area (ha) Area in Peel (ha)
Applewood Creek 433.78 433.10 Avonhead Creek 381.17 380.07 Birchwood Creek 349.00 349.00 Cawthra Creek 539.57 539.57 Clearview Creek 358.92 127.46 Cooksville Creek 2,958.96 2,958.96 Direct Lake Drainage 214.17 214.17 Lakeside Creek 165.60 165.60 Lornewood Creek 317.24 317.24 Moore Creek 29.72 29.72 Serson Creek 356.47 356.47 Sheridan Creek 1,012.82 726.22 Tecumseh Creek 321.21 321.21 Turtle Creek 291.17 291.17
Data from Peel Data Centre
5.2.2 Terrestrial Environment
Urban development is concentrated in the southern portion of the Region of Peel, which includes the urban centres of Mississauga and Brampton (Figure 1). The Town of Caledon, in the northern portion of the Region is predominately rural and contains the majority of remaining natural cover in the Region. It is the northern section of Peel (Town of Caledon) that contains sections of the geologically and ecologically significant Niagara Escarpment and Oak Ridges Moraine. The Niagara Escarpment, which is recognized provincially and internationally as a significant landform, bisects the Master Plan Study Area (Figure 1). The Niagara Escarpment is an ecologically important geological landform, as it supports over 1500 species of vascular plants (including 40% of Ontario’s rare flora), 325 bird species, 55 mammals species and 34 species of reptiles and amphibians (Niagara Escarpment Commission, 2009). The portion of the Region of Peel that falls within the Niagara Escarpment contains a high concentration of provincially and regionally significant Areas of Natural and Scientific Interest (ANSI), wetland and Environmentally Significant Areas (ESAs) (Figure 1). The following six of the Niagara Escarpment Plan land use designations are represented within Peel Region:

AECOM Regional Municipality of Peel Baseline Natural Heritage Report
Baseline Environmental Report - Peel Master Plan 18
• Escarpment Rural; • Escarpment Protection; • Escarpment Natural Area; • Public Land (in Parks and Open Space System); • Minor Urban Centre (Mono Mills); • Mineral Resource Extraction Area.
The Oak Ridges Moraine (ORM) is an environmentally sensitive, geological landform that crosses the northern portion of Peel Region. The ORM provides a continuous corridor of a diversity of habitats including old-growth forests, wetlands and kettle lakes. Habitat is provided on the ORM, for threatened and sensitive plant and animal species not found elsewhere in the Greater Toronto Area. The Humber River Watershed, through the northeast portion of Peel Region, contains about 32% natural cover, in the form of forests, wetlands, meadows, beaches and bluffs. Forest cover is 19%, cultural meadow is 11% and less than 2% is wetland and coastal communities (TRCA, 2008a). The headwater areas on the Niagara Escarpment and Oak Ridges Moraine contain the greatest concentration of large forest blocks in the Humber River Watershed. Through the middle and lower sections of the watershed, natural areas become highly fragmented and support less diverse communities (TRCA, 2008a). The Credit River Watershed, which occurs through the eastern portion of Peel, contains approximately 26% natural cover. Wetlands within the watershed are found predominately in the upper and middle portions of the watershed. A significant forested area is associated with the Niagara Escarpment. A high number of golf courses and driving ranges are scattered throughout the watershed, with increasing pressure to develop golf course on large tracks of land (CVC and MNR, 2002). Very little natural cover remains in the Etobicoke Creek and Mimico Creek Watersheds, with 13.4% and 10.1% natural cover, respectively (TRCA, 2010). Natural cover through these watersheds occurs predominately within river valleys or stream corridors. Valley corridors provide some north/south habitat connectivity, however, east-west connectivity through these watersheds is limited (TRCA, 2010). Two distinctive forest regions are represented in the Region of Peel: the Huron-Ontario forest section of the Great Lakes St. Lawrence Forest Region and the Niagara forest section of the Deciduous (also known as Carolinian) Forest Region (Rowe 1972; Farrar 1995). The Great Lakes- St. Lawrence Forest Region, in what Hills’ called Site 6E - the Lakes Simcoe-Rideau Site Region, occupies the northern portion of Southern Ontario. This forest region is characterized by mixed forests of White Pine and Red Pine, Eastern Hemlock, Sugar Maple, Red Maple, Yellow Birch, Red Oak, Basswood and White Elm. Other wide-ranging species include Eastern White Cedar, Largetooth Aspen, Beech, White Oak, Butternut and White Ash (Hills 1959; Rowe 1972). The Deciduous Forest Region, in what Hills’ called Site 7E - the Lakes Erie-Ontario Site Region, occupies the southern-most portion of Southern Ontario. This Forest Region is dominated by deciduous tree species such as Sugar Maple, White Elm, Beech, Black Cherry, White Ash, Red Oak, White Oak, Red Ash and Butternut, Black Walnut and hickory. This forest occurs on shallower, gravelly and less fertile soils and is less affected by lake effect climates than the Carolinian Region. The Carolinian Zone is a component of the Deciduous Forest Region, occupying the south eastern portion of the Forest Region from Grand Bend on Lake Huron and Toronto on Lake Ontario. The Carolinian Zone is characterized by a warmer and moister lake effect climate, occurring on fertile soils. Dominant species include oaks and hickories with associates including black walnut, sycamore and sassafras.

AECOM Regional Municipality of Peel Baseline Natural Heritage Report
Baseline Environmental Report - Peel Master Plan 19
Peel Region contains a variety of habitat types including active and abandoned agricultural fields and pasture, early successional habitats, plantations, mature woodlots, deep valleys and areas of wetland. The portion of the Region falling within the Niagara Escarpment contains escarpment plain, mesic broadleaf and mixed talus forests, and provides habitat for a variety of species that require large forest tracts to maintain viable populations, as well as wetlands, marshes, east facing escarpment rims, cliffs, slopes, wet cliffs and waterfalls. As a result, a diverse assemblage of bird species occurs within Region of Peel. Wetland areas (both evaluated and unevaluated) and ponds within the Region provide habitat for a range of reptiles and amphibians. 6. Environmental Features of the Primary Study Area This section of the report provides detailed mapping, environmental feature description and inventory for the Primary Study Area including designated natural areas, natural heritage features and functions, including aquatic habitat, fisheries, terrestrial habitat and rare species records. The Primary Study Area extends roughly from the Lake Ontario shoreline along its southern limit to Castlederg Sideroad to the north, and from Highway 407/Winston Churchill Blvd to Albion Vaughan Road/Caledon King Town Line to the west and east, respectively (Figure 1).

AECOM Regional Municipality of Peel Baseline Natural Heritage Report
Baseline Environmental Report - Peel Master Plan 20
6.1 Niagara Escarpment
The Niagara Escarpment Plan Area extends into the northwestern corner of the Primary Study Area, in the area bordered by Boston Mills Road, King Street, Winston Churchill Blvd and Chinguacousy Road (Figure 1). Approximately 1,383 ha of lands within the Niagara Escarpment Plan Area occur with the Primary Study Area. This portion includes six of the Niagara Escarpment land use designations:
• Escarpment Natural Area • Escarpment Protection Area • Escarpment Rural Area • Minor Urban Centre • Escarpment Recreation Area • Mineral Resource Extraction Area
6.2 Oak Ridges Moraine
Approximately 1,292 ha of the Oak Ridges Moraine occur within the Primary Study Area, extending through the Study Area’s north limit (Figure 1). The Oak Ridges Moraine Land Use designations that occur within this area are Natural Linkage Area and Countryside Area.
6.3 Greenbelt
Approximately 10,999 ha of lands designated as Greenbelt- Protected Countryside occur within the Primary Study Area. The Greenbelt occurs predominately through the northwestern portion of the Primary Study Area, with extensions along major watercourses to the Town of Caledon – City of Mississauga divide (Figure 1). Greenbelt areas within the Primary Study Area include areas designated as part of the Natural Heritage System. The Natural Heritage System includes areas of the Protected Countryside with the highest concentration of the most sensitive and/or significant natural features and functions.
6.4 Peel Greenlands System
The Peel Greenlands System Core Areas, within the boundaries of the Primary Study Area are mapped on Figure 2. Within the Primary Study Area, Core Areas have been identified primarily along the riparian areas associated with river systems and their tributaries, with some isolated, upland areas identified throughout. The largest Core Areas identified include a portion along the Humber River, an area on the Niagara Escarpment near Terra Cotta, an area along the Credit River and the area associated with Heart Lake and Claireville Conservation Areas.
6.5 Areas of Natural and Scientific Interest
Earth Science and Life Science Areas of Natural and Scientific Interest that occur within the Primary Study Area are identified and described in Table 2 and Table 3, respectively and are mapped on Figure 2.
Table 2. Earth Science ANSIs
ANSI Name Significance Level Description Brampton Buried Esker (Earth Science Site)
The Brampton Esker was deposited by ice moving out of the Lake Ontario basin. This ice retreated and readvanced depositing the Halton Till and burying the esker. Organic remains indicate that
AECOM Regional Municipality of Peel Baseline Natural Heritage Report
Baseline Environmental Report - Peel Master Plan 21
ANSI Name Significance Level Description the esker eroded older sediments (Mid-Wisconsinan) during its formation (NHIC Natural Areas Record).
Credit River Georgian Bay Formation
Regional NHIC Natural Area Record has not been updated to reflect designation of this feature a regionally significant ANSI. Information to be updated, as it comes available from MNR.
Gooseville Moraine (Earth Science Site)
Provincial The Gooseville Moraine is a Port Huron Stadial feature (Late Wisconsinan) deposited by the Ontario ice lobe. The surface expression of the moraine rare exceeds 5 ft. (1.5 m). It is best developed at its northernmost point (NHIC Natural Areas Record).
Rattray Marsh (International Biological Program Site)
This area is characterized as a small wetland developed in a backshore bay of Lake Ontario, with surrounding gently rolling, sand lands; diverse wetland of aquatics, marshes thickets and deciduous swamp forests, and upland deciduous forests (10 communities); southern biota, with provincially and regionally significant flora; general moderate to severe general disturbances from adjacent development (NHIC Natural Areas Record).
Table 3. Life Science ANSIs
ANSI Name Significance Level Description Caledon Mountain Slope Forest
Provincial This 386.5 ha ANSI occurs along the Niagara Escapment and includes representation of bedrock plain forests, wetland depressions, talus slopes and cliffs (CVC, 2008)
Campbell’s Cross Bog Provincial Campbell’s Cross Bog ANSI, located near Heart Lake Road and King Street, includes the provincially significant Campbell’s Cross Bog Wetland.
Cawthra Woods Provincial Cawthra Woods is a 20 h semi-mature sugar maple-beech woodlot with some younger portions with sugar maple-black cherry. Adjacent to south side of Q.E.W. in Mississauga; Southern edge abutts secondary school. Well-used trails and an old estate are located within this forest (NHIC Natural Areas Record).
Credit River at Erindale Regional Steep, wooded river valley and floodplain stretching 6 km in length, south of Streetsville. River floodplain Manitoba maple-willow-black maple, valley slope sugar maple-hemlock-beech and sugar maple-red oak-black cherry and tableland white oak-white pine. Tableland on east side is residential development while west side contains Erindale College, orchards and proposed development. Newly constructed bridge over northern portion of site. Provincially rare sycamore and black walnut and other rare plant sp. Exposed steep shale bedrock in northern portion (NHIC Natural Areas Record).
Credit River Coastal Marshes
Regional In the City of Mississauga, remnant sections of cattail-sedge-rush marsh and aquatic vegetation once common along lower reaches of Credit River occur 1 km upstream from the mouth for a 2 km stretch. The marshes (30 ha) grade into willow floodplain and sugar maple-beech-red oak slope; the tablelands contain residential development. The marshes are relatively undisturbed due to their inaccessibility and isolated nature. Important breeding area for marsh birds (NHIC Natural Areas Record).
Heart Lake Forest and Bog Regional Lying 2 km northeast of Snelgrove, just north of Heart Lake, this 40 ha site includes deciduous uplands and several wetland

AECOM Regional Municipality of Peel Baseline Natural Heritage Report
Baseline Environmental Report - Peel Master Plan 22
ANSI Name Significance Level Description depressions containing swamp, marsh and bog vegetation, along with a kettle pond. The terrain is rolling and hummocky, part of a small esker running from Heart Lake to Nortonville. The kettle bog supports significant species such as Woodwardia virginica, Pogonia ophioglossoides, Arceuthobium pusillum. Close to built-up area of Brampton (NHIC Natural Areas Record).
Lorne Park Prairie Regional Remnant, tall grass prairie in Mississauga along CNR right-of-way and adjacent field. Contains characteristic western tall grass species and sandy shoreline species associated with Great Lakes such as Andropogon gerardii, A. scoparius and Sorghastrum nutans. Carolinian species also present - sassafras, black oak. Dirt bike trails. Much of this area is slated for development in near future (NHIC Natural Areas Record).
Meadowvale Station Woods Regional Upland/ lowland forest (25 h) bissected by Highway 401, just south of the village of Meadowvale. Surrounded by agricultural fields. The lowland forest, drained by Fletcher's Creek contains black maple-sugar maple-white ash while the uplands are dominated by sugar maple-beech with black cherry-ironwood (NHIC Natural Areas Record).
Rattray Marsh Provincial Located at the mouth of Sheridan Creek in the City of Mississauga, Rattray Marsh is a small lakefront marsh surrounded by residential development. It is separated from Lake Ontario by a cobble-shingle beach bar vegetated with balsam/poplar/cottonwood/willow. Marsh zonation is from beach bar, open water, cattail marsh, meadow carr, green ash swamp, floodplain to hemlock/birch and beech/birch/hemlock/maple/oak forest and surrounding old fields. The marsh is fed by Sheridan Creek including numerous storm sewers, springs and waves from Lake Ontario (NHIC Natural Areas Record).
Roy Ivor’s Woodlot Provincial Located in Erin Mills, Mississauga, Roy Ivor's upland ravine site is dissected by Sawmill Creek and Glen Erin Brook. The area abuts residential development on its south, east and north sides and is dissected by a proposed road. To the west are abandoned farmlands, proposed for development. Several trails occur throughout the area and tree poaching and vandalism is prevalent. The southern section consists of a series of steep ridges dominated by semi-mature to mature white pine/hemlock/white birch while the northern section contains gently rolling sugar maple/beech/hemlock, hemlock and sugar maple/red oak/hemlock/white pine/ash uplands (NHIC Natural Areas Record).
Terra Cotta Forest Provincial The Terra Cotta Forest (also known as the Terra Cotta Conservation Area and the Field Centre at Terra Cotta) sustains the largest natural area on the clay and shale slopes of the Queenston Formation in the northern part of the Halton Section, as well as a diversity of broadleaf forests, mixed forests and wetlands on the escarpment plain (NHIC Natural Areas Record).
Creditview Wetland (Life Science Site)
The shoreline community is a diverse mosaic of wetland and dry land species, varying in part with soil moisture conditions and the duration of inundation through the growing season. The shoreline is primarily edge habitat without a homogeneous community along its entire length. A mosaic of small or large patches of different

AECOM Regional Municipality of Peel Baseline Natural Heritage Report
Baseline Environmental Report - Peel Master Plan 23
ANSI Name Significance Level Description species, in groups or as single individuals, have colonized the edge of the wetland basin, in response to unpredictably varying environmental conditions (NHIC Natural Areas Record).
Joshua Creek Valley (Life Science Site)
Joshua Creek Valley has a relatively high diversity of biological communities, in spite of its small acreage. This site was originally designated as an Environmentally Sensitive Area in 1978 based on five criteria: representative earth science features (local sand dunes), high quality plant or animal assemblages, uncommon plant communities, high species richness and diversity of vegetation communities and rare plants. Residential development removed the sand dune landform and associated vegetation present in the north portion of this site in 1978. Flood events are common and have undercut the creek banks in places as well as depositing debris along the floodplain. Armourstone and gabion baskets have been used in places to control some of the erosion problems (NHIC Natural Areas Record).
6.6 Wetlands
Provincially and locally significant wetlands that occur within the Primary Study Area are identified and described in Table 4 and Table 5 below and are mapped on Figure 2.
Table 4. Provincially Significant Wetlands
Wetland Name Significance Description Bolton Wetland Complex Provincial The provincially significant Bolton Wetland Complex is
situated in the community of Bolton (Town of Caledon) just north of King Street, between Humber Station Road and Duffy's Lane. The four wetlands in the Bolton Wetland Complex occur on a small side tributary stream flowing into the Humber River. The wetlands are connected by a riparian corridor and regenerating meadows. The wetlands are within 750 metres of the nearest neighbouring wetland (NHIC Natural Areas Record).
Caledon Mountain Wetland Complex
Provincial A Provincially significant wetland complex, made up of seven individual wetlands, composed of two wetland types (95% swamp, 5% marsh) (NHIC Natural Areas Record).
Campbell’s Cross Bog Provincial NHIC Natural Area Record has not been updated to reflect designation of this feature as provincially significant. Information to be updated, as it comes available from MNR.
Campbell’s Cross Wetland Complex
Provincial This complex is made up of 26 individual wetlands, composed of three wetland types (2.7% bog, 78.9% swamp, 18.4% marsh) (NHIC Natural Area Record).
Castlederg Wetland Complex Provincial This complex is made up of 33 individual wetlands, on the Oak Ridges Moraine, composed of two wetland types (67.0% swamp, 33.0% marsh) (NHIC Natural Areas Record).
Cawthra Woods Wetland Complex Provincial NHIC Natural Area Record has not been updated to reflect designation of this feature as a provincially significant wetland. Information to be updated, as it comes available

AECOM Regional Municipality of Peel Baseline Natural Heritage Report
Baseline Environmental Report - Peel Master Plan 24
Wetland Name Significance Description from MNR.
Churchville Wetland Complex Provincial This provincially significant wetland complex straddles the Town of Halton Hills, the City of Brampton and the City of Mississauga. The wetland complex is situated along the Credit River valley and along seven small tributary streams next to and draining into the valley. This complex consists of 79 wetlands covering a total of 82.7 ha. The wetlands in this complex are noted for their wetland diversity (90 vegetation communities) and species richness (373 plant species and 175 bird species) are a large number of seepage-fed wetlands that help provide base flow to the Credit River.
Credit River Marshes – Wetland Provincial A Provincially significant, Coastal wetland complex, made up of two individual wetlands, composed of only one wetland type (100% marsh) (NHIC Natural Areas Record).
Creditview Wetlands Provincial A Provincially significant wetland complex, made up of three individual wetlands, composed of three wetland types (9% bog, 74% swamp, 17% marsh) (NHIC Natural Areas Record).
Heart Lake Wetland Complex Provincial The provincially significant Heart Lake Wetland Complex is found in the northern portion of the City of Brampton and the southern portion of the Town of Caledon (OMNR - Aurora District, 2000). The Ministry has identified the Heart Lake Conservation Area portion of this wetland complex as a regional life science and an earth science Area of Natural and Scientific Interest (ANSI). The life science ANSI is known as the Heart Lake Forest and Bog and the earth science ANSI as the Brampton Buried Esker. The Heart Lake Wetland Complex has 35 wetlands covering a total of 87 hectares. The complex is noteworthy for its two kettle bogs, its two kettle lakes and its adjacent upland woodlands (NHIC Natural Area Record).
Levi Creek Wetland Complex Provincial This provincially significant wetland complex straddles the Town of Halton Hills and the City of Brampton. The wetland complex is situated along three tributaries of Levi Creek, a subwatershed of the Credit River. This complex consists of 54 wetlands covering a total of 50.8 ha. The wetlands in this complex are noted for their wetland diversity (85 vegetation communities) and species richness (410 plant species) and their number of seepage-fed wetlands that provide some base flow to Levi Creek.
North Oakville – Milton East Wetland Complex
Provincial NHIC Natural Area Record has not been updated to reflect designation of this feature as provincially significant. Information to be updated, as it comes available from MNR.
Rattray Marsh Provincial A Provincially significant, Coastal wetland complex, made up of two individual wetlands, composed of two wetland types (18% swamp, 82% marsh) (NHIC Natural Areas Record).
Table 5. Locally Significant Wetlands
Wetland Name Significance Description

AECOM Regional Municipality of Peel Baseline Natural Heritage Report
Baseline Environmental Report - Peel Master Plan 25
Wetland Name Significance Description Cheltenham Wetland Complex Other A Non-Provincially significant wetland complex, made up of
18 individual wetlands, composed of two wetland types (97.4% swamp, 2.6% marsh) (NHIC Natural Areas Record).
Claude Swamp Other A Non-Provincially Significant wetland on the Oak Ridges Moraine composed of two wetland types (90.3% swamp, 9.7% marsh). Nesting of colonial waterbirds- active feeding area for Great Blue Heron. Good winter cover for wildlife (NHIC Natural Areas Record).
Credit River at Heritage Road Other NHIC Natural Area Record has not been updated to reflect designation of this feature as a locally significant wetland. Information to be updated, as it comes available from MNR.
Fudger’s Marsh Other NHIC Natural Area Record has not been updated to reflect designation of this feature as a locally significant wetland. Information to be updated, as it comes available from MNR
Mimico Headwater’s Wetland Complex
Other NHIC Natural Area Record has not been updated to reflect designation of this feature as a locally significant wetland. Information to be updated, as it comes available from MNR
Mississauga Wetland Other A Non-Provincially significant wetland, composed of only one wetland type (100% swamp) (NHIC Natural Areas Record).
Mono Road Wetland Complex Other A Non-Provincially significant wetland complex, made up of 15 individual wetlands, on the Oak Ridges Moraine, composed of two wetland types (93% swamp, 7% marsh) (NHIC Natural Areas Record).
Norval Wetland Other NHIC Natural Area Record has not been updated to reflect designation of this feature as a locally significant wetland. Information to be updated, as it comes available from MNR
Sandhill Wetland Complex Other A Non-Provincially significant wetland complex, made up of two individual wetlands, composed of only one wetland type (100% swamp) (NHIC Natural Areas Record).
Sanford’s Ponds Other A Non-Provincially significant, single contiguous wetland, composed of one wetland type (100% marsh) (NHIC Natural Areas Record).
Springbrook Wetland Complex Other NHIC Natural Area Record has not been updated to reflect designation of this feature as a locally significant wetland. Information to be updated, as it comes available from MNR.
Winston Churchill Blvd. Wetland Complex
Other A Non-Provincially significant wetland complex, made up of three individual wetlands, composed of two wetland types (96% swamp, 4% marsh) (NHIC Natural Areas Record).

AECOM Regional Municipality of Peel Baseline Natural Heritage Report
Baseline Environmental Report - Peel Master Plan 26
6.7 Environmentally Sensitive or Significant Areas (ESA)
The Provincial Policy Statement (PPS) does not include a definition for ESAs. The definition, provided in the Region of Peel Official Plan is as follows:
“Environmentally Sensitive or Significant Areas: places where ecosystem functions or features warrant special protection. These may include but are not limited to rare or unique plant or animal populations or habitats, plant or animal communities, or concentrations of ecological functions. Environmentally Sensitive or Significant Areas are identified by the conservation authorities according to their established criteria.”
Environmentally Sensitive or Significant Areas (ESA) within Peel, are identified and designated by Toronto and Region Conservation (TRCA) and Credit Valley Conservation (CVC). Although ESAs are not explicitly recognized in the PPS, most ESA would be considered significant under the PPS as they contain significant wildlife habitat, significant woodlands or wetlands and/or Species at Risk. Within the Primary Study Area, 25 ESAs have been designated (Figure 2).
6.8 Conservation Areas
Seven Conservation Areas occur within the Primary Study Area. These areas are listed in Table 6 below and mapped on Figure 2.
Table 6. Conservation Areas within Primary Study Area
Area Name Description Management Organization Claireville Conservation Area
The Claireville Conservation Area, straddles the boundaries of Peel Region and Toronto. This area contains the Claireville Dam and Reservoir (TRCA Website, 2012).
TRCA
Heart Lake Conservation Area
Heart Lake Conservation Area, located in the Etobicoke Creek Watershed in Brampton, takes its name from the spring-fed kettle lake that is roughly shaped like a heart (TRCA Website, 2012).
TRCA
Indian Line Conservation Area
Indian Line Conservation Area, located south of Claireville Conservation Area, offers campground facilities (TRCA Website, 2012).
TRCA
Meadowvale Conservation Area
Located on either side of the Credit River, on Old Derry Road in Mississauga, this Conservation Area supports unique natural, cultural and recreational resources. Most of this property is owned by the City of Mississauga. The Head Office of the Credit Valley Conservation Authority is located on this property (CVC Website, 2012).
CVC
Rattray Marsh Conservation Area
Composed of two individual wetlands, .9 and 8.9 ha in size. It is a small lake front marsh surrounded by residential development. Separated from Lake Ontario by a cobble shingle beach bar vegetated with balsam-poplar-cottonwood-willow. Lake Ontario.
CVC

AECOM Regional Municipality of Peel Baseline Natural Heritage Report
Baseline Environmental Report - Peel Master Plan 27
Area Name Description Management Organization Upstream urbanization has led to sedimentation and pollution in the marsh and an associated decrease in plant diversity and available marsh bird and waterfowl breeding habitat. City of Mississauga constructed a sewer pumping station in one of the productive backwaters of the marsh and a maintenance road which has been landscaped with exotics (NHIC Natural Areas Record).
6.9 Fish and Fish Habitat
Credit River The majority of the Primary Study Area falls within the Lower Watershed, as characterized by the Credit River Fisheries Management Plan (CRFMP), with smaller portions of the Middle and Upper Watersheds represented. MNR Thermal Classifications are mapped on Figure 3. As mapped by MNR, Credit River Watershed watercourses through the Primary Study Area are predominately cold water through the upper reaches, associated with the Niagara Escarpment. Through the middle and lower watershed, watercourses support a mix of cool and warmwater habitats. The variety of habitats provided through the Credit River Watershed support the needs a many fish species. The Credit River Watershed currently supports 79 species of (CVC, 2012). Brown Trout, which require cold/cool habitats, thrive in the middle and upper watershed, predominately in the main Credit River (CVC and MNR, 2012). Rainbow Trout and Chinook Salmon are found at the mouth of the Credit at Lake Ontario. Small lakes are found throughout the watershed, providing the preferred habitat for Smallmouth and Largemouth Bass, for example (CVC, 2012). Fish collection records indicate that redside dace occur through much of the watershed (see Section 6.9.2). The CRFMP defines and delineates Fish Management Zones for the watershed to be used planners and biologists to guide fisheries management decisions, including the review of development proposals and species mix issues, and by non-government agencies when determining rehabilitation projects (CVC and MNR, 2002). Five fish community types are being managed for within the Primary Study Area. These community types are: Coldwater Community; Mixed Cool/Cold Community; Mixed Warm/Cool Community; Small Warmwater Community; and Large Warmwater Community (CVC and MNR, 2002). Table 7, from the CRMFP, lists and describes the Fish Community Management Zones in the Credit River Watershed.
Table 7. CRFMP Fish Community Management Zones
Management Zone Characteristics
Coldwater • Brook trout are the indicator species; • Sculpin although often associated with brook trout are not found
above the Niagara Escarpment and more common in Cool / Coldwater;
• Species diversity can be naturally very low in pristine cold headwaters;

AECOM Regional Municipality of Peel Baseline Natural Heritage Report
Baseline Environmental Report - Peel Master Plan 28
• Brown and rainbow trout may be present but are more dominant in Cool / Coldwater;
• Includes all tributaries above the Escarpment (Monora, Mill, Shaws, lower reaches of Caledon Creek, West Credit, East or Little Credit, Black and portions of Silver Creek). Only those small tributaries that have their headwaters above the Escarpment, such as Rogers Creek have brook trout. The main River from Orangeville to Inglewood is also Coldwater habitat;
• Only Huttonville Creek has potential brook trout habitat that is now utilized by migratory rainbow trout.
Mixed Cool/Cold • Provides coldwater refuge areas and relatively less trout production than Coldwater streams. Brook trout are rare and do not reproduce in these Areas;
• Brown and rainbow trout have adapted to these reaches and are the primary indicator species along with mottled sculpin and American brook lamprey;
• Other common species include rainbow and fantail darter, northern hog sucker and stonecat;
• Overall species diversity is higher than Coldwater streams; • The main river from Inglewood to Huttonville is classified as
Cold/Coolwater. Mixed Warm/Cool • Seasonal use by brook trout in headwater areas draining to
Coldwater habitats including some tributaries of the West Credit, Silver and Black Creeks;
• Utilized by migratory trout and salmon in lower reaches of watershed including Levis, Mullet and Fletchers Creeks. Reproduction is suspected but the relatively cooler waters to the main river can provide important refuge habitat for these young migratory species;
• Cool / Warmwater habitat extends to the upper reaches of Levis and Mullet Creeks. Cooler temperatures and better baseflows (associated with silt/sand/gravel lenses or wetland storage) than Small Warmwater streams should exist, but existing fish communities may not reflect this due to extensive land use impacts;
• Normally species associated with groundwater discharge headwater wetland areas such as central mudminnow and northern redbelly dace are common. However, these species are absent below the Niagara Escarpment in the Credit watershed;
• The redside dace should also be best associated with Cool \ Warmwater habitats but has also been reported in other stream types;
• Both Cool \ Warmwater and Small Warmwater streams have intermittent headwaters that certain species will utilize on a seasonal basis.
Small Warmwater • The most dominant species found include creek chub and blacknose dace. These species are also found in other stream types and best utilize intermittent reaches along with brook stickleback. Other species tolerant of warm temperatures and lower dissolved oxygen include bluntnose and fathead minnows. White sucker is also often common;
• A greater diversity of minnows, some habitat specialists and water quality sensitive species may also be present, especially where access to larger Mixed or Warmwater streams are available;
• Most typical of clay till plains with few silt/sand/gravel components

AECOM Regional Municipality of Peel Baseline Natural Heritage Report
Baseline Environmental Report - Peel Master Plan 29
such as Fletchers and upper Mullet Creeks and other smaller streams. Caledon Creek is classified as Small Warmwater due to some till material but more so because watertables are often below streambed elevations, particularly along the main branch which can dry-up and then resurfaces as a Coldwater stream.
Large Warmwater • A large order river or lake, often with wetland habitats and a diversity of common species and habitat specialists and including top predatory fish such as bass and pike;
• The best indicator species for the lower Credit is the smallmouth bass, its distribution is limited upstream by the Streetsville Dam. Its introduction above and upstream to the Norval Dam is recommended;
• A number of species are only found in the lower Credit and may be associated with access from Lake Ontario including river chub, emerald, spottail, rosyface and spotfin shiners. Many additional lake species not normally associated with the river will utilize the most lower reaches.
• Sunfish, perch and bullhead catfish seem to be more common in pond habitats;
• Includes a migratory corridor for salmonids.
Humber Five main subwatersheds are found within the boundaries of the Humber Watershed. The majority of the Primary Study Area falls within the West Humber River Subwatershed. According to MNR Thermal Classifications, watercourses in the Humber River, within the limits of the Primary Study Area are predominately warmwater (Figure 3). Coldwater habitat is provided in headwater reaches, associated with the Oak Ridges Moraine and through the West Branch of the Humber River. Historically, 64 native fish species have been documented in the Humber River Watershed. The results of more recent (2004) surveys indicate the presence of 39 native fish species in the Watershed (TRCA, 2008). At the subwatershed level, historically 39 species have been recorded in the West Humber Subwatershed and more recently (2004), 16 species (TRCA, 2008). The stream flow regime in the West Humber Subwatershed is dominated by surface run-off, creating cool to warm aquatic habitats. The subwatershed is characterized by fine-textured soils that create turbid in-stream conditions. As a result of these conditions, the fish community supported presently is comprised of tolerant species such as white sucker, common shiner, blacknose dace, longnose dace, fathead minnow, creek chub, brook stickleback, pumpkinseed and rock bass (TRCA, 2008). Rainbow darts, a more sensitive species, is distributed widely through the subwatershed. Redside dace, which historically was more widely distributed through the subwatershed, presently remain in a few tributaries that receive drainage from the West Branch and Main Branch (see Section 6.9.2) (TRCA, 2008). Aquatic habitat potential was determined for the Humber River Watershed, in the form of seven habitat categories, which are: small riverine coldwater, small riverine warmwater, intermediate riverine coldwater, intermediate riverine warmwater, large riverine, estuarine and lacustrine (TRCA and MNR, 2005). Within the Master Plan Primary Study Area (West Humber Subwatershed), the predominant habitat category is small riverine warmwater, with some representation of small riverine coldwater and Intermediate riverine warmwater habitats (TRCA and MNR, 2005).

AECOM Regional Municipality of Peel Baseline Natural Heritage Report
Baseline Environmental Report - Peel Master Plan 30
Table 8 summarizes information from the Humber River Fisheries Management Plan (HRFMP) for each of these three habitat categories in the West Humber Subwatershed.
Table 8. HRFMP Aquatic Habitat Categories
Habitat Category Characteristics
Small Riverine Warmwater • Watercourses have a drainage area less than 10 km2; • Found in clay soils with associated low infiltration rates and low
groundwater discharge to streams; • During the summer, most of these tributaries become standing pools
or dry up; • Habitat category is found in all subwatersheds; • Historically, 36 fish species documented; 2 species in 2001.
Intermediate Riverine Warmwater
• The majority of these watercourses drain an area between 10 km2 and 300 km2;
• Category contains watercourses draining from the Peel Plain with low infiltration and baseflow;
• Habitat category is found in the Upper Main, East and West Humber River subwatersheds;
• Historically, 37 fish species documented; 20 species in 2001, including redside dace and rainbow darter.
Small Riverine Coldwater • Watercourses in this category have drainage areas less than 13.5 km2;
• Most of these watercourses originate on the Niagara Escarpment and Oak Ridges Moraine where course soils result in high rates of infiltration and groundwater discharge to streams;
• Majority of these streams will have permanent flow, but some may be intermittent;
• Habitat category is found in the Centreville Creek sub-basin and the tributary of the West Humber River flowing through Campbell’s Cross.
• Historically, 35 fish species documented; 20 species in 2001; • Five sensitive species found in this category: American brook
lamprey, brown and brook trout, redside dace and mottled sculpin.
Etobicoke Creek and Mimico Creek Watersheds The Etobicoke Creek Watershed consists of four main branches: Main Etobicoke Creek, Little Etobicoke Creek, Etobicoke Creek West Branch and Spring Creek, all of which occur within the Master Plan Primary Study Area. The Mimico Creek Watershed consists of a main channel, fed by an upper east and upper west branch, which are all represented in the Primary Study Area. MNR Thermal Classifications are mapped on Figure 3. As mapped by MNR, watercourses of Etobicoke Creek and Mimico Creek Watersheds, through the Primary Study Area provide warmwater habitat. The dominant fish community in the Etobicoke Watershed is composed of cool-warm water, tolerant, habitat generalist species (TRCA, 2010). Fish abundance and diversity is limited in the watershed generally, however some habitat specialist and coldwater species persist in the headwaters. The highest recorded biodiversity occurs at the mouth of the mouth of the river, where lake-based species were recorded, including migratory rainbow trout and

AECOM Regional Municipality of Peel Baseline Natural Heritage Report
Baseline Environmental Report - Peel Master Plan 31
chinook salmon (TRCA, 2010). Other species collected in the lower watershed include white sucker, common shiner. Species recorded further upstream include: central stoneroller, blacknose dace, bluntnose minnow, creek chub, fathead minnow, Johnny darter, longnose dace, mottled sculpin (TRCA, 2010). Upper reaches of the watershed support similar communities, with the addition of the following sensitive species: northern hog sucker and northern redbelly dace (TRCA, 2010). The Mimico Creek Watershed also supports predominately cool-warm water, habitat generalist species, though with less fish abundance and species diversity than Etobicoke Creek. Rainbow trout, brown trout, migratory white sucker and common shiner have been recorded in the lower half of the Mimico Creek Watershed. Reaches further upstream contain blacknose dace, bluntnose minnow, creek chub, fathead minnow, Johnny darter, largemouth bass, longnose dace, pumpkinseed, rock bass, and common shiner. Invasive species in the system include goldfish, round goby and common carp (TRCA, 2010). Brook stickleback inhabits ponded and temporary waters in the upper watershed (TRCA, 2010). Lake Ontario Watersheds Fourteen smaller watersheds, under the jurisdiction of Credit Valley Conservation, occur within the Primary Study Area. These watersheds are classified in this report together as Lake Ontario Watersheds, on account of their smaller size and direct drainage to Lake Ontario. MNR Thermal Classifications are mapped on Figure 3. As mapped by MNR, these watersheds provide predominately warmwater habitat.
6.9.1 Terrestrial Habitat
The portion of the Primary Study Area that occurs on the Niagara Escarpment (Figure 2) contains the greatest concentration of large forested blocks and wetland habitat. The area south of the Escarpment and Oak Ridges Moraine contains high quality valleylands. A large habitat block is associated with the Humber River, between Castlederg Sideroad and King Street in Caledon. Large linear areas of connected upland and wetland habitat occur along the Credit River through the Primary Study Area. Natural habitat cover in the southern portion of the Study Area is predominately contained within river valleys or along stream corridors. There is a large portion of cultural meadow habitat through southern Peel; however these areas are typically small and fragmented. Requirements for more detailed studies related to terrestrial habitat will be determined during subsequent phases of the study, in consultation with Credit Valley Conservation and Toronto and Region Conservation.
6.9.2 Rare Species
Using the Natural Heritage Information Centre (NHIC) and information from Peel’s Data Centre, 34 Provincial Species at Risk were identified as occurring (or historically occurring) within the vicinity of the Primary Study Area, including fish, plants, birds, reptiles and turtles, amphibians, insects and plant species (Appendix A). Of these 34 species, 15 are designated as Endangered, 11 as Threatened and 8 as Special Concern (Species at Risk in Ontario Status). Species ranked provincially as S1 (Critically Imperilled) – S3 (Vulnerable) were also compiled for the Primary Study Area, using the NHIC (Appendix A). There are records of 41 S1-S3 species as occurring (or historically occurring) in the vicinity of the Primary Study Area (Appendix A). According to the Conservation Ontario 2012 Aquatic Species at Risk mapping for Credit Valley Conservation and Toronto and Region Conservation, within the Primary Study Area, watercourse segments have been identified as

AECOM Regional Municipality of Peel Baseline Natural Heritage Report
Baseline Environmental Report - Peel Master Plan 32
having known distributions of fish designated as Endangered or Threatened that are not currently on Schedule 1 of the federal Species at Risk Act (SARA), but are anticipated to be added to Schedule 1. These segments occur in the Humber River Watershed (under the jurisdiction of TRCA), extending roughly from King Street to Claireville and in the Credit River Watershed (under the jurisdiction of CVC), from south of Mayfield Road to just south of Highway 407. No known Significant Wildlife Habitat has been identified within the Primary Study Area. Requirements for more detailed studies related to wildlife habitat will be determined during subsequent phases of the study, in consultation with CVC, TRCA and MNR. Species local status lists will be reviewed during subsequent project phases. 7. Summary The Region of Peel Master Plan will need to address policy and legislation at the federal, provincial and local levels. Because of the existing knowledge base and access to policy information, development can be accommodated with full reference to guiding principles and practices. In this regard, critical guiding policy will be:
• Species at Risk Act and Endangered Species Act • Federal Fisheries Act • Greenbelt Act • Provincial Policy Statement • Region of Peel’s Greenlands System
The Primary Study is predominately urbanized through its southern portion, with urbanizing areas though the middle and predominately agricultural lands with villages and hamlets near its northern limit. Presence of significant natural features is generally restricted to the Niagara Escarpment, valleylands, creek corridors and associated wetlands. Existing natural heritage conditions within the Primary Study Area range in size, habitat quality, diversity and sensitivity to disturbance. The valleys of the West Humber River and the Credit River are dominant corridors within the Primary Study Area. Development within these highly important corridors and in other important natural heritage features identified in this report will require a greater effort to resolve potential environmental impacts than areas where existing natural heritage conditions are more fragmented and anthropogenically influenced. 8. References Chapman, L.J., and Putnam D.F. 1984:
The Physiography of Southern Ontario, Third Addition, Ontario Geological Survey Special Volume 2, 270 pp. Conservation Ontario, 2012:
2012 Aquatic Species at Risk. Website: http://www.conservation-ontario.on.ca/projects/DFO.html. Accessed on May 18, 2012
Credit Valley Conservation, 2005:
Watershed Report Card: A Detailed Summary of the Ecosystem Health of the Credit River Watershed. Credit Valley Conservation, 2008:
Terra Cotta – Silver Creek Complex Management Plan.

AECOM Regional Municipality of Peel Baseline Natural Heritage Report
Baseline Environmental Report - Peel Master Plan 33
Credit Valley Conservation, 2012 Credit Valley Conservation Website: http://www.creditvalleyca.ca/. Accessed on May 24, 2012 Credit Valley Conservation and Ontario Ministry of Natural Resources, 2002: Credit River Fisheries Management Plan Department of Fisheries and Oceans Canada (DFO), 2012:
Fisheries and Oceans Canada Website: http://www.dfo-mpo.gc.ca/index-eng.htm. Accessed on May 28, 2012
Ecologistics Limited, 1979: Credit River Watershed Environmentally Significant Areas. Prepared for the Credit Valley Conservation Authority, June 1979
Farrar, John Laird, 1995: Trees in Canada. Fithenry and Whiteside. 502pp
Hills, G.A. 1959:
A ready reference to the description of the land of Ontario and its productivity. Ontario Department of Lands and Forests. Division of Research, Maple, Ontario.
Karrow, P.F., 1968:
Pleistocene geology of the Guelph area; Ontario Dept. Mines GR 61. Ministry of Municipal Affairs and Housing, 2005: Greenbelt Plan, February 28, 2005 Natural Heritage Information Centre (NHIC), Ontario Ministry of Natural Resources, 2012: Website: http://nhic.mnr.gov.on.ca/nhic_.cfm Accessed on May 17, 2012 Niagara Escarpment Commission, 2009:
The Niagara Escarpment Plan - Office Consolidation, June 2009
Niagara Escarpment Commission, 2012: Niagara Escarpment Commission – Flora & Fauna Website: http://www.escarpment.org/about/ecology/flora/index_pf.php. Accessed May 18, 2012
Peel Data Centre, 2012: Regional of Peel Website: http://www.peelregion.ca/planning/pdc/data/. Accessed May 28, 2012 Rowe, J.S., 1972:
Forest Regions of Canada. Fisheries and Environment Canada, Canadian Forest Service, Headquaters, Ottawa. 172pp.
Toronto Region Conservation, 2008a: Humber River Watershed Plan – Pathways to a Healthy Humber, June 2008

AECOM Regional Municipality of Peel Baseline Natural Heritage Report
Baseline Environmental Report - Peel Master Plan 34
Toronto Region Conservation, 2008b: Humber River State of the Watershed Report – Aquatic System Toronto Region Conservation, 2010: Etobicoke and Mimico Creeks Watersheds Technical Update Report Toronto and Region Conservation, 2012: Toronto and Region Conservation Website: http://trca.on.ca/ . Accessed on May 27, 2012

AECOM Regional Municipality of Peel Baseline Natural Heritage Report
Baseline Environmental Report - Peel Master Plan 35
9. Appendix A – Rare Species Occurrences

AECOM Regional Municipality of Peel Baseline Natural Heritage Report
Baseline Environmental Report - Peel Master Plan 36

Appendix A: Rare Species
Table A1: Species at Risk
Taxonomic Group Scientific Name English Name G-rank1
S-rank2
Committee on the Status of Endangered Wildlife in Canada (COSEWIC) Status3
Species At Risk in Ontario (SARO) Status4
Birds Ixobrychus exilis Least Bittern G5 S4B THR THR Birds Falco peregrinus Peregrine Falcon G4 S3B SC THR Birds Colinus virginianus Northern Bobwhite G5 S1 END END Birds Lanius ludovicianus Loggerhead Shrike G4 S2B END END Birds Dendroica cerulea Cerulean Warbler G4 S3B END SC Birds Seiurus motacilla Louisiana Waterthrush G5 S3B SC SC Birds Ammodramus henslowii Henslow's Sparrow G4 SHB END END Birds Caprimulgus vociferus Whip-poor-will G5 S4B THR THR Birds Chaetura pelagica Chimney Swift G5 S4B THR THR Birds Dolichonyx oryzivorus Bobolink G5 S4B THR THR Birds Empidonax virescens Acadian Flycatcher G5 S2 END END Reptiles and Turtles Emydoidea blandingii Blanding's Turtle G4 S3 THR THR Reptiles and Turtles Graptemys geographica Northern Map Turtle G5 S3 SC SC Reptiles and Turtles Sternotherus odoratus Eastern Musk Turtle G5 S3 THR THR Reptiles and Turtles Lampropeltis triangulum Milksnake G5 S3 SC SC Reptiles and Turtles Thamnophis sauritus Eastern Ribbonsnake G5 S3 SC SC

Taxonomic Group Scientific Name English Name G-rank1
S-rank2
Committee on the Status of Endangered Wildlife in Canada (COSEWIC) Status3
Species At Risk in Ontario (SARO) Status4
Reptiles and Turtles Crotalus horridus Timber Rattlesnake G4 SX EXP EXP Amphibians Ambystoma jeffersonianum Jefferson Salamander G4 S2 END THR
Fish Acipenser fulvescens pop. 3
Lake Sturgeon (Great Lakes - Upper St. Lawrence River population)
G3G4TNR S2 THR THR
Fish Clinostomus elongatus Redside Dace G3G4 S2 END END Fish Ichthyomyzon fossor Northern Brook Lamprey G4 S3 SC SC Fish Coregonus reighardi Shortnose Cisco GH SH END END Fish Ammocrypta pellucida Eastern Sand Darter G3G4 S2 THR END Fish Anguilla rostrata American Eel G4 S1? SC END Fish Gomphus quadricolor Rapids Clubtail G3 S1 END END Dragonflies and Damselflies Gomphus quadricolor Rapids Clubtail G3G4 S1 END END
Plant Asplenium scolopendrium var. americanum Hart's-tongue Fern G4T3 S3 SC SC
Plant Eurybia divaricata White Wood Aster G5 S2 THR THR Plant Juglans cinerea Butternut G4 S3? END END Plant Carex lupuliformis False Hop Sedge G4 S1 END END Plant Castanea dentate American Chestnut G4 S2 END END Plant Cornus florida Eastern Flowering Dogwood G5 S2? END END Plant Gymnocladus dioicus Kentucky Coffee-tree G5 S2 THR THR Plant Panax quinquefolius American Ginseng G3 S2 END END Plant Potamogeton hillii Hill's Pondweed G3 S2 SC SC

Table A2: Species of Conservation Concern
Taxonomic Group Scientific Name English Name G-rank S-rank
Committee on the Status of Endangered Wildlife in Canada (COSEWIC) Status
Species At Risk in Ontario (SARO) Status
Mammals Myotis leibii Small-footed Bat G3 S2S3 Mammals Myotis septentrionalis Northern Long-eared Bat G4 S3 Mammals Pipistrellus subflavus Eastern Pipistrelle G5 S3? Birds Nycticorax nycticorax Black-crowned Night-heron G5 S3B,S3N
Amphibians Ambystoma hybrid pop. 1
Jefferson X Blue-spotted Salamander, Jefferson genome dominates GNA S2
Fish Coregonus hoyi Bloater G4 S4 NAR NAR Fish Moxostoma valenciennesi Greater Redhorse G4 S3 Slugs and Snails Appalachina sayana Spike-lip Crater G5 S3 NAR NAR Slugs and Snails Triodopsis tridentata Northern Threetooth G5 S3S4 Dragonflies and Damselflies Lestes eurinus Amber-winged Spreadwing G4 S3 Dragonflies and Damselflies Enallagma anna River Bluet G5 S2 Dragonflies and Damselflies Arigomphus furcifer Lilypad Clubtail G5 S3 Dragonflies and Damselflies Arigomphus villosipes Unicorn Clubtail G5 S2S3 Dragonflies and Damselflies Somatochlora tenebrosa Clamp-tipped Emerald G5 S2S3 Ferns and Fern Allies Botrychium rugulosum Rugulose Grapefern G3 S2 Moncotyledons Carex careyana Carey's Sedge G4G5 S2

Taxonomic Group Scientific Name English Name G-rank S-rank
Committee on the Status of Endangered Wildlife in Canada (COSEWIC) Status
Species At Risk in Ontario (SARO) Status
Moncotyledons Carex conoidea Field Sedge G5 S3 Moncotyledons Carex torta Twisted Sedge G5 SX Dicotyledons Crataegus dissona Northern Hawthorn G4G5 S3
Moncotyledons Dichanthelium ovale ssp. praecocius White-haired Panic Grass G5T5? S3
Moncotyledons Digitaria cognata Fall Crab Grass G5 S1 Dicotyledons Erigenia bulbosa Harbinger-of-spring G5 S3? Dicotyledons Eurybia schreberi Schreber's Wood Aster G4 S2S3 Dicotyledons Gentianella quinquefolia Stiff Gentian G5 S2 Dicotyledons Gleditsia triacanthos Honey-locust G5 S2 Moncotyledons Hypoxis hirsuta Yellow Stargrass G5 S3 Dicotyledons Linum virginianum Woodland Flax G4G5 S2 Dicotyledons Lithospermum latifolium American Gromwell G4 S3 Dicotyledons Lupinus perennis Sundial Lupine G5 S3 Dicotyledons Mertensia virginica Virginia Lungwort G5 S3 Dicotyledons Monarda didyma Scarlet Beebalm G5 S3 Moncotyledons Muhlenbergia sylvatica Woodland Muhly G5 S2 Dicotyledons Oenothera clelandii Cleland's Evening-primrose G3G5 S1 Dicotyledons Oenothera gaura Biennial Gaura G5 S3 Dicotyledons Porteranthus trifoliatus Bowman's-root G4G5 SX Dicotyledons Pterospora andromedea Woodland Pinedrops G5 S2 Moncotyledons Scleria triglomerata Tall Nutrush G5 S1
Moncotyledons Spiranthes lacera var. gracilis Southern Slender Ladies'-tresses G5T4T5 S1

Taxonomic Group Scientific Name English Name G-rank S-rank
Committee on the Status of Endangered Wildlife in Canada (COSEWIC) Status
Species At Risk in Ontario (SARO) Status
Moncotyledons Trichophorum clintonii Clinton's Clubrush G4 S2S3 Mosses, Liverworts and Hornworts Gyroweisia tenuis A Moss G3G5 S1 Mosses, Liverworts and Hornworts Helodium paludosum A Moss G3G5 S1?
1 G-rank G Global ranks are assigned by a consensus of the network of Conservation Data Centres (CDCs), scientific experts, and The Nature Conservancy to designate a rarity rank based on the
range-wide status of a species, subspecies or variety. Definitions are as follows:
G1 Extremely rare; usually 5 or fewer occurrences in the overall range or very few remaining individuals; or because of some factor(s) making it especially vulnerable to extinction.
G2 Very rare; usually between 5 and 20 occurrences in the overall range or with many individuals in fewer occurrences; or because of some factor(s) making it vulnerable to extinction.
G3 Rare to uncommon; usually between 20 and 100 occurrences; may have fewer occurrences, but with a large number of individuals in some populations; may be susceptible to large-scale disturbances.
G4 Common; usually more than 100 occurrences; usually not susceptible to immediate threats.
G5 Very common; demonstrably secure under present conditions.
2 S-rank: The Natural Heritage provincial ranking system (provincial S-rank) is used by the MNR Natural Heritage Information Centre (NHIC) to set protection priorities for rare species and natural communities.
Definitions are as follows: S1 ... Extremely rare in Ontario; usually 5 or fewer occurrences in the province or very few remaining individuals; often especially vulnerable to extirpation. S2 ... Very rare in Ontario; usually between 5 and 20 occurrences in the province or with many individuals in fewer occurrences; often susceptible to extirpation. S3 ... Rare to uncommon in Ontario; usually between 20 and 100 occurrences in the province; may have fewer occurrences, but with a large number of individuals in some
populations; may be susceptible to large-scale disturbances. Most species with an S3 rank are assigned to the watch list, unless they have a relatively high global rank. S4 ... Common and apparently secure in Ontario; usually with more than 100 occurrences in the province. S5 ... Very common and demonstrably secure in Ontario. SE ... Exotic; not believed to be a native component of Ontario’s flora.

SH ... Possibly Extirpated (Historical)— Species or community occurred historically in the nation or state/province, and there is some possibility that it may be rediscovered. Its presence may not have been verified in the past 20-40 years.
3COSEWIC Status COSEWIC (Committee on the Status of Endangered Wildlife in Canada) assigns a federal status ranking for all species that it assesses. EXT ........ Extinct.A species that no longer exists
EXP........ Extirpated. A species that no longer exists in the wild in Canada, but occurring elsewhere in the world
END ....... Endangered. A species facing imminent extirpation or extinction throughout its range.
THR ....... Threatened. A species likely to become endangered if nothing is done to reverse the factors leading to its extirpation or extinction
SC .......... Special Concern. A species of special concern because of characteristics that make it particularly sensitive to human activities or natural events, but does not include an extirpated, endangered or threatened species.
IND ........ Indeterminate. A species for which there is insufficient information to support a status designation.
NAR ....... Not at Risk.A species that has been evaluated and found to be not at risk.
*............ Indicates a species found on Schedule 1 of the federal Species At Risk Act.
4 MNR Status: Based on consultation with COSSARO (Committee on the Status of Species at Risk in Ontario). COSSARO is the Ministry of Natural Resources (MNR) committee that evaluates the conservation status of species occurring in Ontario.
Definitions are as follows: EXT Extinct. A Species that no longer exist anywhere. EXP Extirpated. Any native species no longer existing in the wild in Ontario, but existing elsewhere in the wild. END R Endangered (Regulated). A species facing imminent extinction or extirpation in Ontario which has been regulated under Ontario’s Endangered Species
Act END Endangered (not regulated). A species facing imminent extinction or extirpation in Ontario which is a candidate for regulation under the Ontario
Endangered Species Act THR Threatened. Any native species that, on the basis of the best available scientific evidence, is at risk of becoming endangered throughout all or a
significant portion of its Ontario range if the limiting factors are not reversed. SC Special Concern [formerly Vulnerable].A species with characteristics that make it sensitive to human activities or natural events. NAR Not at Risk [formerly Not In Any Category]. A species that has been evaluated and found not to be at risk. DD .... Data Deficient [formerly Indeterminate]. Any native species for which there is insufficient scientific information on which to base a status
recommendation

TRELAW
NY
MC
MU
RC
HY
INDIAN
PAISLEY
GLIDDEN
TEN
TH
MCDOWELL
THOMAS
MISSISSAUGA VALLEY
MA
LTA
BRAID
WO
OD
LAKE
CLARENCE
DEARBOURNE
BA
RTL
EY
BU
LL
RAY LAWSON
JOR
DAN
MO
UN
TAIN
ASH
SUN
NY
MEA
DO
W
OLD DERRY
CH
UR
CH
ILL
ME
AD
OW
S
BR
ISD
ALE
AVONDALE
FLOWERTOWN
MORNING STAR
SU
NFO
RE
ST
UN
NAM
ED
DR
INKW
ATER
EDEN
BRO
OK H
ILL
LIS
GAR
HAROLD
RO
YAL
OR
CH
AR
D
HOWDEN
BRISTOL
CE
NTR
E
MINEOLA
NIN
TH
OS
PREY
RIC
HVA
LE
LORNE PARK
PONYTRAIL
FAIRHILL
DARCEL
CH
RY
SLE
R
ELGIN
CLARK
ELLWOOD
BLOOR
CREDITVIEW
CO
NES
TOG
A
NO
RT
H P
AR
K
FIEL
DGAT
E
RATHBURN
TRUSCOTT
FALC
ON
ER
MC
VE
AN
VODDEN
CR
ED
ITV
IEW
MOFFATT
WA
LKE
R
ATWATER
MA
CKAY
MILLC
REEK
GLE
NVA
LE
RO
SE
HU
RS
T
CONSERVATIONFE
RN
FOR
ES
T
TER
RA
GA
R
OG
DE
NG
RE
AT L
AK
ES
FIRST GULF
RU
THER
FOR
D
LAIR
D
QUEENSGATE
ERIN CENTRE
ORR
ORENDA
BALMO
RAL
CENTRE VIEW
CENTRAL PARK
SU
MM
ER
LEA
GLEN
ERIN
CENTRAL
MO
UN
T W
OLF
E
TER
RY
FO
X
ALBI
ON
VAU
GH
AN
CAL
EDO
N K
ING
TO
WN
MEADOWVALE
CHAROLAIS
PERTO
SA
HU
MB
ER
STA
TIO
N
ER
IND
ALE
STA
TIO
N
COLUMBIA
HA
NS
EN
HE
RIT
AG
E
RID
GE
WAY
CITY CENTRE
VAN
KIR
K
COUNTRYSIDE
ARGENTIA
COURTNEYPARK
THE COLLEGEWAY
MATHESON
BATTLEFORD
GO
RE
WAY
MO
UN
T H
OP
E
AQUITAINE
CO
LER
AIN
E
WE
ST
CR
ED
ITV
IEW
BR
AM
ALE
A
MC
LAU
GH
LIN
HE
AR
T LA
KE
EAST
HEALEY
OLD SCHOOL
THE GRANGE
OLD SCHOOL
WANLESS
CH
ING
UA
CO
US
Y
MCLAREN
HO
RS
ES
HO
E H
ILL
CLA
RK
WAY
HE
RIT
AG
E
FIN
CH
HU
RO
NTA
RIO
CAW
THR
A
WIN
STO
N C
HU
RC
HIL
L
KING
QU
EE
N
QU
EE
N
AIR
PO
RT
MAV
IS
OLDE BASE LINE
MC
LAU
GH
LIN
409
50
LAKESHORE
EGLINTON
HU
RO
NTA
RIO
DIX
IE
THE
GO
RE
MA
IN
410
KE
NN
ED
Y
MISSISSAUGA
HU
MB
ER
WE
ST
TOMKEN
KING
CASTLEMORE
SO
UTH
DO
WN
EA
STG
ATE
TOR
BR
AM
FORKS OF THE CREDIT
QUEENSWAY
BUSH
50
KE
NN
ED
Y
DERRY
AIR
PO
RT
MIS
SIS
SA
UG
A
BR
AM
ALE
A
EGLINTON
DUNDAS
BRITANNIA
EMBLETON
STEELES
MC
LAU
GH
LIN
QUEEN
BOVAIRD
BURNHAMTHORPE
MIS
SIS
SA
UG
A
OLD CHURCH
CH
ING
UA
CO
US
Y
WIN
STO
N C
HU
RC
HIL
L
WILLIAMS
DERRY
403
WIN
STO
N C
HU
RC
HIL
L
407
427
ROYAL WINDSOR
ERIN MILLS
407
PIA
410
STEELES
SANDALWOOD
403
HU
RO
NTA
RIO
DIX
IE
THE
GO
RE
MAYFIELD
SIL
VE
R D
AR
T
401
401
407
QEW
MAYFIELD
59276
91044
91057
91460
91114
91445
91073
91067
91064
91084
91653
90747
84807
21646
35347
35144
35302
21645
59347
21676
41847
35455
35301
35665
21643
60145
66917
12313
35591
3456
2550
60090
59259
59379
7663
3396
59375
12558
792
13219
13360
33127
7642
33131
7659
7883
33136
33100
33102
7771
7589
7484
35559
15880 7810
33236
7789
33240
18495
13074
41507
66370
32401
32401
40772
41365
3634
7491
7491
7491
7682
7782
7797
77987798
7798
7797
7532
7532
33240
33240
33102
33102
12441
Jul 20, 20121:45,000
60216517-127-G
Master Plan
¹
LegendArea of Natural and Scientific Interest (ANSI)
Provincially Significant
Regionally Significant
Wetland
Locally Significant
Provincially Significant
Greenland System
Core Area
Non- Core Area
Environmental Features
Conservation Area
Environmentally Significant Area (ESA)
Municipal Boundary
Region of Peel Boundary
Primary Study Area
NHIC Rare Species Squares
*The Region of Peel and ConservationAuthorities (CVC, HRCA, TRCA) are theoriginal source for related data presentedon this figure.
0 2 41 Km
Figure 2:Primary Study Area
Rare Species
HALT
ON
YORK
TORO
NTO
11056