
APPENDIX 1shodhganga.inflibnet.ac.in/bitstream/10603/9902/14/14... · 2015-12-04 · The top...
17
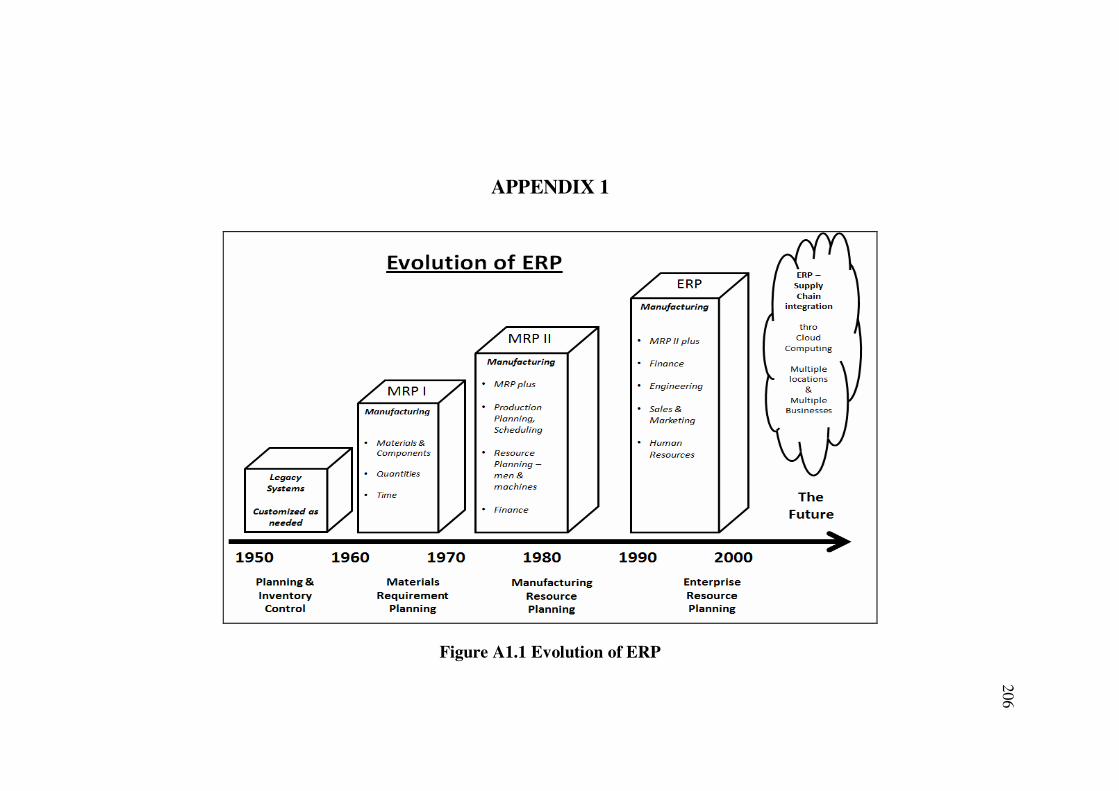
206 APPENDIX 1 Figure A1.1 Evolution of ERP
Transcript of APPENDIX 1shodhganga.inflibnet.ac.in/bitstream/10603/9902/14/14... · 2015-12-04 · The top...
206
APPENDIX 1
Figure A1.1 Evolution of ERP

207
APPENDIX 2
Figure A2.1 ERP Schema (Using SAP R/3 as exemplar)
(Source: www.sap.com)

208
APPENDIX 3
Figure A3.1 Research Methodologies in IS Literature (Source: Lee and Sarker 2008)

209
APPENDIX 4
QUESTIONNAIRE
ERP satisfaction study (Part 1) Date of response: __________
Organisation name _________________________________ Division ___________________
Organisation size Revenue _______________(Rs.Crores) Staff strength _____________
Respondent name _________________________________ Designation ________________
1. Could you indicate the ERP package implemented in your organisation
SAP ORACLE JD Edwards
RAMCO Others Pl. specify ______________________________
2. Which of the following modules were implemented 3.What is the implementation stage of ERP project
Financials Under Implementation
If under implementation Initial(<3mths)Mid stage Roll out
Sales & Marketing indicate stage
Inventory & Materials Just completed
Manufacturing / Shop floor Completed about a year back
HR
ERP running for ____ no. of years
Business Intelligence
4. Please indicate approx. size/cost* of the ERP project. 5. Was there a cost overrun
(Cost: License cost+hardware+implementation cost)
Less than 50 Lakhs No, project was completed at budgeted cost
50 Lakhs - 1 Crore About 10 - 15% cost overrun
1 Crore - 3 Crores About 15 - 50% cost overrun
3 Crores - 5 Crores Very high cost overrun
5 Crores - 10 Crores
10 Crores plus
6. What was the planned project completion time 7. Was the project completed on time
6 months Completed on time
8 -10 months Exceeded time by 10 - 15%
> 12 months Major delays in project implementation
8. Overall saltisfaction levels with ERP
Please indicate your overall satisfaction level with your ERP on the scale below
7 6 5 4 3 2 1SATISFIED DISSATISFIED
Please indicate____ months
Please indicate____ months

210
The ERP implementation process(Part 2) Please indicate the degree to which
you agree with the statement
S.No
Please look at the statements given below. With reference to the ERP
implementation in your organisation, please indicate your level of agreement
for each of the statements below Fu
llya
gre
e
Pa
rtia
llya
gre
e
Ne
utr
al
Dis
ag
ree
Fu
llyd
isa
gre
e
1The top management was actively involved and supported the ERP project
from the start to the finish5 4 3 2 1
2There was a project champion/s who led the project throughout by providing
guidance / building concesus /solving issues,etc5 4 3 2 1
3 A steering committee was formed which met at least every month monitored
progress, and initiated corrective action in case of any slippages.
5 4 3 2 1
4
The implementation consultants were competent, had subject matter experts
( functional experts) for different modules and did a good job during
implementation and post implementation.
5 4 3 2 1
5
A dedicated full time team was formed for the ERP project. The team
consited of experienced users for key modules. The team consisted of
senior experienced people representing all the core functions
5 4 3 2 1
6 The team was given the necessary training on the ERP. 5 4 3 2 1
7The ERP vendor was very cooperative in solving problems / fixing buys /
giving support during the implementation5 4 3 2 1
8The implementation partner has tools / templates that were simple and easy
to use. These were used throughout the project5 4 3 2 1
9The users were given ,good hands- on training . They were shown pilot
screens of the key processes and made to use the screen and get familiar.5 4 3 2 1
10User's feedback was taken and changes made to the screen formats and
reports to facilitate use of ERP5 4 3 2 1
11The implementation consultants were always realistic about what can be
expected from the ERP. They did not try to "oversell" the benefits of ERP.5 4 3 2 1
12The ERP package was selected carefully after studying various packages
keeping in mind the company's specific business needs.5 4 3 2 1
13
The scope and deliverables of the ERP project were discussed thoroughly
and agreed upon. There was not much change (increase in scope) during
the course of implementation.
5 4 3 2 1
14
Enough contingency was built when cost, time and efforts were being
budgeted for the project. No undue pressure was put on the implementation
team to speed up implementation or cut costs.5 4 3 2 1
15 The customisation needed to implement the ERP was quite less - less than
15% efforts (mandays) for customisation.5 4 3 2 1
16
The legacy data in the company was reasonably accurate. Efforts were
made to ensure that all incorrect legacy data was either cleansed or not
taken into the new ERP system.
5 4 3 2 1
17
Business processes were simplified through necessary changes prior to /
consequent to the ERP implementation. Necessary changes in
organisational structure was made to accommodate new business work
flows.
5 4 3 2 1
18
Good efforts were put by the top management / implementation team to
handle the change management process with sensitivity - this includes inter
departmental problems, change in authority, resistance from certain groups,
etc
5 4 3 2 1
19There was good cooperation between departments in implementing the
ERP.5 4 3 2 1
20
Regular reports were sent to all concerned communicating the progress of
the ERP project. Key users were informed of their responsibilities and role
in the implementation regularly.
5 4 3 2 1
21During the implementation period, the ERP project was one of the biggest
projects being undertaken by the company. There were no other major
initiatives diverting attention of the people in the organisation.
5 4 3 2 1

211
Measuring the perceived success of the ERP project (Part 3)Code Factors Dimensions Please indicate the degree to which
you agree with the statement
(Please circle the proper response)
Fu
llya
gre
e
Pa
rtia
llya
gre
e
Ne
utr
al
Dis
ag
ree
Fu
llyd
isa
gre
e
N/A
SQ System Quality SQ1The data base is robust, very rarely crashes or
gets corrupted5 4 3 2 1
N/A
SQ2
In case of crash / corruption database recovery
is easy, quick and reliable5 4 3 2 1
N/A
SQ3
Database administration / systems
administration is simple5 4 3 2 1
N/A
SQ4
Customisation is easy. The report writer is
excellent and easy to use5 4 3 2 1
N/A
SQ5
System response to users is fast. Use of band
width / memory is very efficient5 4 3 2 1
N/A
SQ6It is easy to integrate the system with other
applications / legacy systems5 4 3 2 1
N/A
IQ
Information
Quality IQ1Information available from ERP is extremely
accurate.5 4 3 2 1
N/A
IQ2
The ERP is fully online and information is
available as and when needed5 4 3 2 1
N/A
IQ3
The reports generated are excellent - very good
look and feel and easy to read5 4 3 2 1
N/A
IQ4
It is easy to use system - screen navigation is
simple5 4 3 2 1
N/A
IQ5The ERP generates high quality, relevant MIS
for business decisions5 4 3 2 1
N/A
II
Individual
impact II1The system is flexible and easy to use and has
made my work much easier5 4 3 2 1
N/A
II2
After implementation of ERP, I feel that my
control on my job is much better5 4 3 2 1
N/A
II3My learning has gone up due to ERP 5 4 3 2 1 N/A
II4
I feel I have personally benefited a lot due to the
ERP implementation5 4 3 2 1
N/A
OI
Organisational
impact OI1
The ERP was implemented well within the
costs budgeted 5 4 3 2 1N/A
OI2
The ERP was implemented well within the time
budgeted (There was no time overrun) 5 4 3 2 1N/A
OI3
The ERP has enabled people / departments to
work much more efficiently with better
coordination5 4 3 2 1
N/A
OI4
The information from ERP has improved the
quality of decision making in the company 5 4 3 2 1N/A
OI5
Because of ERP we have been able to improve
speed and accuracy of response to customers,
suppliers and other stakeholders5 4 3 2 1
N/A
OI6
Because of ERP there has been an overall cost
reduction ( staff reduction, higher output, lower
wastages, lower inventories, etc )5 4 3 2 1
N/A
OOverall Impact
O17
Overall I feel the ERP implemention in my
organisation has been succesful and beneficial
to both me and the organisation5 4 3 2 1
N/A

212
APPENDIX 5
ERP Implementation Methodologies
AIM Structure Framework (Source www.oracle.com)
AIM is a framework of related elements. It involves phases,
processes, tasks and dependencies:
A task is a unit of work, which results in a single deliverable.
That deliverable may take many different forms like reports,
schedules, code, or test results for example.
A process is a closely related group of dependent tasks, which
meets a major objective. A process is usually based on a
common discipline.
A phase is a chronological grouping of tasks. It enables a
flexible way to organize tasks, schedule major deliverables, and
deliver projects.
Processes and phases are explained in more detail below.
Processes
A process in AIM represents a related set of objectives, resource
skill requirements, inputs, and deliverable outputs. A task can belong to only
one process. Project team members are usually assigned to a process
according to their specialization and background. A brief description of the
AIM processes is given below:

213
1. Business Requirements Definition: Business Requirements
Definition defines the business needs that must be met by the
implementation project. You document business processes by
identifying business events and describing the steps that
respond to these events.
2. Business Requirements Mapping: Business Requirements
Mapping compares the business requirements to standard
application software functionality and identifies gaps that
must be addressed to fully meet business needs. As gaps
between requirements and functionality emerge, they are
resolved by documenting workarounds, alternative solutions,
application extensions, or by changing the underlying
business process.
3. Application and Technical Architecture: During the
Application and Technical Architecture you design an
information systems architecture that reflects your business
vision. Using the business and information systems
requirements, this process facilitates development of a plan
for deploying and configuring the hardware required for a
successful implementation.
4. Module Design and Build: Module Design and Build
produces custom software solutions to gaps in functionality
identified during Business Requirements Mapping. Custom
software solutions include program modules that must be
designed, built, and tested before they can be incorporated
into the system.
5. Data Conversion : Data Conversion defines the tasks and
deliverables required to convert legacy data to the Oracle

214
Applications tables. The first step of this process explicitly
defines the business objects that are required for conversion
and the legacy source systems that store these objects. The
converted data may be needed for system testing, training, and
acceptance testing as well as for production.
6. Documentation: Documentation begins with materials
created early in the project. Using detailed documents from
the project, the writing staff develops user and technical
material that are tailored to the implementation.
7. Business System Testing: Business System Testing focuses
on linking test requirements back to business requirements
and securing project resources needed for testing. It supports
utilizing common test information including data profiles to
promote testing co-ordination and to minimize duplication of
test preparation and execution effort.
8. Performance Testing: Performance Testing enables you to
define, build, and execute a performance test. Use the results
to make decisions on whether the performance is acceptable
for the business and to help propose tactical or strategic
changes to address the performance quality shortfall.
Performance Testing is closely related to Application and
Technical Architecture; they are interdependent.
9. User Training: Training prepares both users and
administrators to assume on the tasks of running the new
application system. It includes development of materials and
methods as well as administration. Instructors and courseware
developers orient their material toward roles and jobs, and not
toward application modules.

215
10. Production Migration : Production Migration moves the
company, system, and people to the new enterprise system.
Following production cutover, it monitors and refines the
production system and plans for the future. The Production
Migration process encompasses transition to production
readiness, production cutover, and post-production support
Figure A5.1 AIM Framework (Source: www.Oracle.com )

216
APPENDIX 6
Table A6.1 AHP detailed workings
RECIPROCAL MATRIX

217
Table A6.1 (Continued)

218
Table A6.1 (Continued)
219
APPENDIX 7
ERP SELECTION PROBLEM USING ANP –
AN ILLUSTRATION
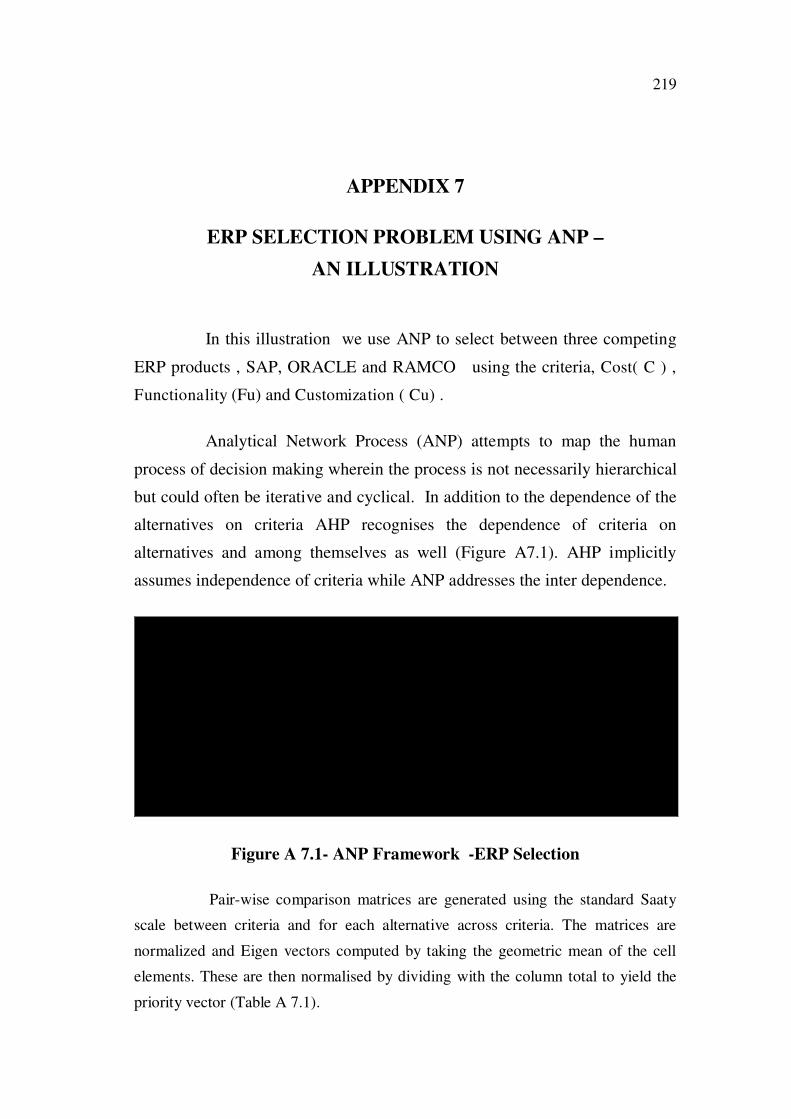
In this illustration we use ANP to select between three competing
ERP products , SAP, ORACLE and RAMCO using the criteria, Cost( C ) ,
Functionality (Fu) and Customization ( Cu) .
Analytical Network Process (ANP) attempts to map the human
process of decision making wherein the process is not necessarily hierarchical
but could often be iterative and cyclical. In addition to the dependence of the
alternatives on criteria AHP recognises the dependence of criteria on
alternatives and among themselves as well (Figure A7.1). AHP implicitly
assumes independence of criteria while ANP addresses the inter dependence.
Goal = Choose
apropriate ERP
package
CriteriaCost( C)
Customizat ion (
C u)
Functionalit y
(FU)
Alternatives SAP Ramco Oracle
Figure A 7.1- ANP Framework -ERP Selection
Pair-wise comparison matrices are generated using the standard Saaty
scale between criteria and for each alternative across criteria. The matrices are
normalized and Eigen vectors computed by taking the geometric mean of the cell
elements. These are then normalised by dividing with the column total to yield the
priority vector (Table A 7.1).

220
Table A 7.1 Pair-wise Comparison Matrices
Criteria: CostPWC of criteria
w.r.t alternatives
Cost SAP ORACLE RAMCOEigen
Vector
Priority
MatrixSAP Cost Fu Cu
Eigen
Vector
Priority
Matrix
SAP 1 1 0.13 0.5 0.1 Cost 1 0.14 0.13 0.26 0.06
ORACLE 1 1 0.13 0.5 0.1 Fu 7 1 6 3.48 0.74
RAMCO 8 8 1 4 0.8 Cu 5 0.17 1 0.94 0.2
Total 10 10 1.25 5 Total 13 1.31 7.13 4.68
Criteria:
Customisation -CU
PWC of criteria
w.r.t alternatives
CU SAP ORACLE RAMCOEigen
Vector
Priority
MatrixORACLE Cost Fu Cu
Eigen
Vector
Priority
Matrix
SAP 1 1 0.14 0.52 0.1 Cost 1 0.2 0.13 0.29 0.06
ORACLE 6 1 0.17 1 0.2 Fu 5 1 0.17 0.94 0.21
RAMCO 7 6 1 3.48 0.7 Cu 6 6 1 3.3 0.73
Total 14 8 1.31 5 Total 12 7.2 1.29 4.54
Criteria:
Functionality -FU
PWC of criteria
w.r.t alternatives
FU SAP ORACLE RAMCOEigen
Vector
Priority
MatrixRAMCO Cost Fu Cu
Eigen
Vector
Priority
Matrix
SAP 1 5 8 3.42 0.71 Cost 1 7 8 3.83 0.78
ORACLE 0.2 1 7 1.12 0.23 Fu 0.14 1 0.33 0.36 0.07
RAMCO 0.13 0.14 1 0.26 0.05 Cu 0.13 3 1 0.72 0.15
Total 1.33 6.14 16 4.8 Total 1.27 11 9.33 4.91

221
The next step in the ANP process is to combine the pair-wise comparison
matrices into a single matrix called the Supermatrix. This matrix contains the
priority vectors for comparing the alternatives against criteria on the top right hand
quadrant and the comparison of the criteria against alternatives in the bottom left
hand quadrant.
Table A 7.2 Supermatrix-S
Cost Fu Cu SAP ORACLE RAMCO
Cost 0.0000 0.0000 0.0000 0.0600 0.0600 0.7800
Fu 0.0000 0.0000 0.0000 0.7400 0.2100 0.0700
Cu 0.0000 0.0000 0.0000 0.2000 0.7300 0.1500
SAP 0.1000 0.1000 0.7100 0.0000 0.0000 0.0000
ORACLE 0.1000 0.2000 0.2300 0.0000 0.0000 0.0000
RAMCO 0.8000 0.7000 0.0600 0.0000 0.0000 0.0000
The Saaty method is to carry out iterations by squaring this matrix
several times to yield a final matrix with identical row items in each block. For
example after the first squaring the S’ is obtained (Table A 7.3). In this research this
was carried out using EXCEL. A matrix multiplication macro was written using the
= MMULT(Range), function in EXCEL. The Supermatrix was multiplied by itself
several times to obtain the limit matrix.
Table A 7.3 Supermatrix S’
Cost Fu Cu SAP ORACLE RAMCO
Cost 0.6360 0.5640 0.1032 0.0000 0.0000 0.0000
Fu 0.1510 0.1650 0.5779 0.0000 0.0000 0.0000
Cu 0.2130 0.2710 0.3189 0.0000 0.0000 0.0000
SAP 0.0000 0.0000 0.0000 0.2220 0.5453 0.1915
ORACLE 0.0000 0.0000 0.0000 0.2000 0.2159 0.1265
RAMCO 0.0000 0.0000 0.0000 0.5780 0.2388 0.6820
222
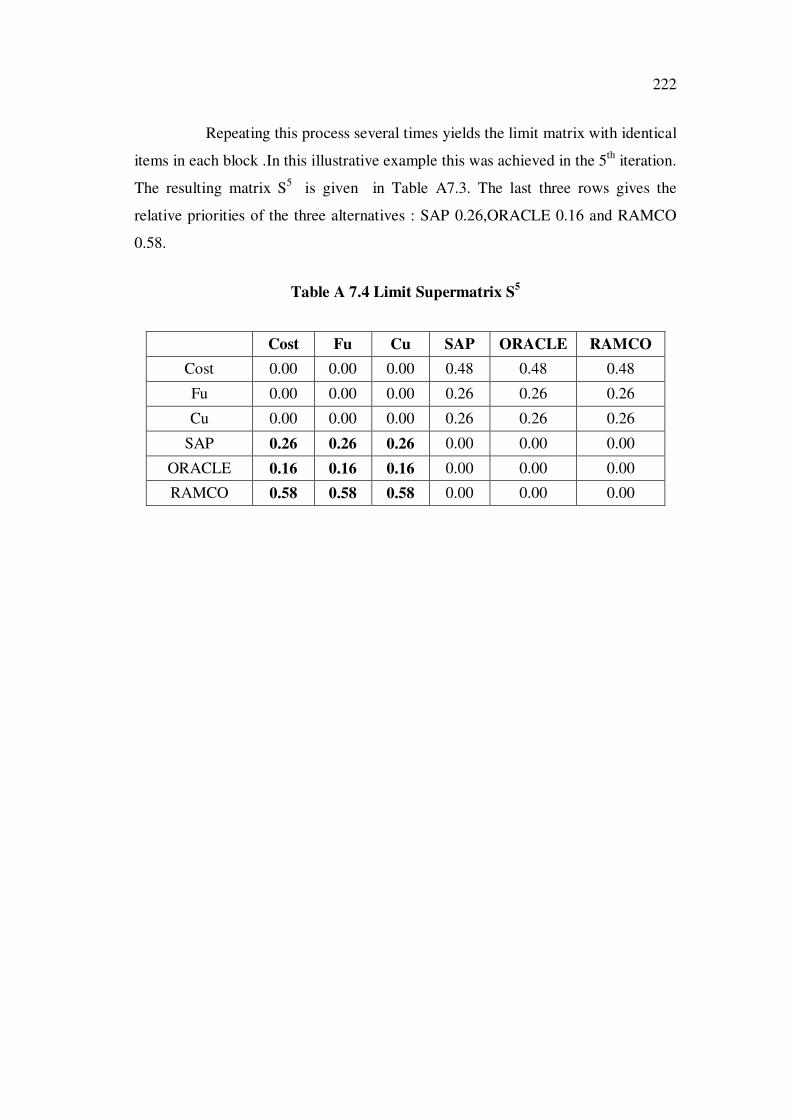
Repeating this process several times yields the limit matrix with identical
items in each block .In this illustrative example this was achieved in the 5th
iteration.
The resulting matrix S5
is given in Table A7.3. The last three rows gives the
relative priorities of the three alternatives : SAP 0.26,ORACLE 0.16 and RAMCO
0.58.
Table A 7.4 Limit Supermatrix S5
Cost Fu Cu SAP ORACLE RAMCO
Cost 0.00 0.00 0.00 0.48 0.48 0.48
Fu 0.00 0.00 0.00 0.26 0.26 0.26
Cu 0.00 0.00 0.00 0.26 0.26 0.26
SAP 0.26 0.26 0.26 0.00 0.00 0.00
ORACLE 0.16 0.16 0.16 0.00 0.00 0.00
RAMCO 0.58 0.58 0.58 0.00 0.00 0.00


![BIBLIOGRAPHY – CHAPTER 1shodhganga.inflibnet.ac.in/bitstream/10603/18801/15/16_references.pdf · BIBLIOGRAPHY – CHAPTER 1 [1] E.N. Gregory, ... microstructure and wear behaviour](https://static.fdocuments.us/doc/165x107/5b7917b07f8b9a31308cfd69/bibliography-chapter-bibliography-chapter-1-1-en-gregory-microstructure.jpg)