Appendix 2 - Annual Financial Report, 2016
42
Appendix 2 - Annual Financial Report, 2016 Appendix 2-1 Financial Report for the Fiscal Year Ended December 31, 2016 Prepared by the Finance Division, Corporate Services Department of the CorporaƟon of the City of Brampton, Province of Ontario
Transcript of Appendix 2 - Annual Financial Report, 2016

Appendix 2 - Annual Financial Report, 2016
Appendix 2-1
Financial Report for the Fiscal Year Ended December 31, 2016
Prepared by the Finance Division, Corporate Services Department of the Corpora on of the City of Brampton, Province of Ontario

2016 Financial Report The Corporation of the City of Brampton
2
Financial Report Table of Contents
Introduction 3 City of Brampton Corporate Organizational Chart 4 Message from City Treasurer 9 Financial Highlights 11 GFOA Award Financial 12 Consolidated Financial Statements 13 Responsibility for Financial Reporting 14 Auditors’ Report 15 Consolidated Statement of Financial Position 16 Consolidated Statement of Operations and Accumulated Surplus 17 Consolidated Statement of Change in Net Financial Assets 18 Consolidated Statement of Cash Flows 19 Notes to Consolidated Financial Statements 29 Consolidated Schedule of Segment Disclosure Trust Funds 31 Auditors’ Report 32 Statement of Financial Position 33 Statement of Financial Activities and Changes in Fund Balances 34 Notes to Financial Statements Statistical Information 36 Five Year Review Summary 42 Ten Largest Corporate Property Taxpayers in Brampton
The Corporation of the City of Brampton Financial Report 2016
3
City of Brampton Corporate Organizational Chart
Mayor and City Council Mayor Linda Jeffrey
Chief Administrative Officer Harry Schlange• City Clerk • Human Resources • Internal Audit • Service Innovation and Corporate Performance • Strategic Communications • Strategic Development
Corporate Services Commissioner Joseph Pittari • By-law Enforcement • Finance • IT • Legal • Purchasing
Community Services Commissioner Al Meneses • Animal Services • Building Design and Construction • Facilities, Operations and Maintencance • Realty Services • Recreation • Service Brampton
Public Works and Engineering Commissioner Joe Pitushka • Capital Works • Development Engineering • Parks • Road Maintenance, Operations and Fleet • Transportation Special Projects
Planning and Development Services Commissioner Heather MacDonald - Interim • Building • Development Services • Policy Planning • Transportation Planning • Urban Design
Economic Development and Culture Director Bob Darling • Cultural Services • Economic Development • Festivals and Special Events •OfficeoftheCentralArea
Fire and Emergency Services Chief Michael Clark
Brampton Transit General Manager Sue Connor

2016 Financial Report The Corporation of the City of Brampton
4
Consolidated Financial Statements
Management is responsible for the preparation of the City’s consolidatedfinancialstatements.Theseconsolidatedfinancialstatementshavebeenpreparedinaccordancewiththe reporting standards established for municipalities by the Public Sector Accounting Board (PSAB), and included within theCPACanadaAccountingHandbook.WeareconfidentthatcontrolsareinplaceintheCity’saccountingandfinancialreporting systems that ensure accuracy of the consolidated financialstatementsbeingpresented.
The2016consolidatedfinancialstatementshavebeenaudited by KPMG LLP, Chartered Professional Accountants (KPMG) in accordance with Canadian Generally Accepted AuditingStandardsandtheirunqualifiedreportisincludedwiththeconsolidatedfinancialstatements.Theroleofthestatutory auditor is to present an independent opinion on the fairpresentationoftheCity’sfinancialpositionandoperatingresultsascontainedintheFinancialReport,andconfirmthatthestatementsarefreefrommaterialmisstatements.Theauditors are also responsible for advising management and City Council of any control or operational issues that may be identifiedduringtheiraudit.
The auditors have expressed the opinion that the City’s consolidatedfinancialstatementspresentfairly,inallmaterialrespects,thefinancialpositionoftheCorporationoftheCityof Brampton as at December 31, 2016, and comply with PSAB municipalfinancialreportingrequirements.
Similartotheprivatesector,theseconsolidatedfinancialstatements are prepared using the full accrual basis of accounting: revenues are recorded when they are earned andexpensesarerecordeduponreceiptofgoodsorservices.Tangible capital asset reporting – including the City’s investments, consumption (amortization) and contributions by developers – enables all levels of government to track municipalinfrastructureacrossthecountry.
Overview of Economic Climate and Financial Strategies
Brampton continues to prosper, led by sustained economic growth.TheProvinceofOntariohasrecognizedourpotentialas one of the youngest, fastest growing and most diverse citiesinthecountry.OurnewEconomicDevelopmentandCultureofficeisbuildingonahistoryofclientserviceandisnowpositioningBramptonasasignificantcompetitorto otherCanadianandglobalcities.
I am pleased to present the City of Brampton’s consolidated financialstatementsforthe2016fiscalyear.
2016wasayearofsignificantchangeattheCity.We embarked on a new vision for a Future-Ready Brampton and will continue to build on our new foundation to provide the bestservicestoourresidentsandbusinessesmovingforward.
As one of Canada’s fastest-growing cities, Brampton continues to face the challenge of balancing growth with expectations.Weremaincommittedtomanaginggrowthwhileremainingfiscallyresponsible.
Ourcontinuedstrongfinancialmanagement,recentchangesto the organization and a forward-thinking view to the future havecollectivelystrengthenedBrampton’sfinancialpositionnowandintothefuture.
Inadditiontokeyfinancialresults,thisreportprovidesanoverviewofthelocaleconomicclimate,financialpolicies and performance related to the delivery of the City’s programsandservices.
Message from the City Treasurer

The Corporation of the City of Brampton Financial Report 2016
5
Some key economic indicators in Brampton:
• Population increased to 593,638 in 2016 from 580,600 in 2015, and is expected to increase to 900,000 by theyear2041.• Number of households increased to 168,120 in 2016 from 164,680 in 2015, and is projected to be more than200,000by2031.• TheRegionofPeelunemploymentrateincreasedto7.1 percentin2016(6.8percentin2015),reflectingglobal economicpressures.However,itstillremainslowerthan the10-yearaveragefortheregion.• Newbusinessesincreasedby4.8percentfrom2015,and those businesses provided 2,400 additional jobs within thecommunity.• Brampton placed 7th in the country for total construction valuein2016,generating$2billionininvestment.
Brampton City Council is committed to transparency in governmentandengagementwithitscommunity.Councilstrives to balance the expectations of residents for programs and services with the need to insulate taxpayers where possible,toensureongoingvalueformoney.
In addition to responding to the infrastructure needs of a growing community, the City is also committed to maintaining its existing infrastructure base in a state of good repair.In2016,CityCouncilapprovedthe‘CorporateAssetManagement Plan’ which provides a framework for a strategic planformanagingourassetsinaneffectiveandefficientmannerwhilecomplyingwithapplicableregulations.TheCitycontinuestopursuefederalandprovincialfinancialsupportfor infrastructure projects to reduce the property tax burden to the residents, while the Mayor and City Council advocate onbehalfofBrampton.
Financial Management Policies
The City of Brampton has established a number of financialmanagementpoliciesthatprovideaframework fortheCorporation’soverallfiscalplanningandfinancial management.Thisincludesproactivefinancialplanning andfinancialreportingprocesses.
The City of Brampton is in compliance with the reporting guidelines required by the Ministry of Municipal Affairs andHousing.
TheCity’srigorousfinancialreportingonbothoperatingandcapital results exceeds the requirements of both the federal andprovincialgovernments.StaffregularlyprovidefinancialreportstoCityCouncilinvariousforms,includingfinancialstatusreports.Thesereportsarepreparedandsubmittedto City Council, four times per year for operating and two times per year for capital, and clearly compare budgets with results and provide comments on variances from budget and forecasts.Thesecomprehensive,easy-to-readreportsenableCity Council and the public to understand how their tax dollars are spent and how the City has performed againstbudget.
Through its risk management program, the City proactively protectstheCorporation’sassetsagainstfinanciallossesandensurespreservationofpublicservicecapacities.Inaddition,theCitypurchasesinsurancetoensurefinancialprotectionisavailableshouldalargelossoccur.TheCityhascontinuedwith the implementation of an Enterprise Risk Management program.Thisinitiativewillincorporateaconsistent approach to risk into the culture and strategic planning processesoftheCity.
The Government Finance Officers Association of the United States and Canada (the “GFOA”) Award for Financial Reporting
In2016,forthefifteenthconsecutiveyear,theGFOAformallyrecognizedBramptonforitsexcellenceinfinancialreportingwith the “Canadian Award for Financial Reporting” for the City’s2015AnnualReport.
The GFOA established the Canadian Award for Excellence in Financial Reporting Program to encourage Canadian local governments to go beyond the minimum requirement of generally accepted accounting principles to communicate the municipalgovernment’sfinancesinacomprehensivemanner,based on a set of consistent reporting requirements estab-lishedforalllocalgovernment.
The City of Brampton's achievements demonstrated the high standardsinfinancialreportingsupportedbyevidenceoftransparencyandfulldisclosure.
Message from the City Treasurer

2016 Financial Report The Corporation of the City of Brampton
6
Other Financial Industry Achievements and Recognition
In 2016, the City continued to make improvements in our overallfinancialmanagementprocessresultinginincreasedtransparency,accountabilityandfiscalresponsibility.Thesuccess of these initiatives has been recognized by several externalagencies.
Standard & Poor’s
Since 2006, Brampton has enjoyed a Standard & Poor’s ‘AAA’creditrating.ThestrengtheningoftheCity’sfinancial policiesanditssolidfinancialpositionisreinforcedbythemaintenance of its AAA stable rating and stable outlook in 2016.ThismakestheCityoneofonlysixmunicipalitiesinCanadatohavethisrating.
Theratingreflects“theCity'sverystrongeconomyand budgetary performance, very low debt burden, and exceptional liquidity” as well as “the "very predictable andwell-balancedlocalgovernmentframework”.
C.D. Howe Institute
In 2016, the City of Brampton has received the highest rank of A- as accorded by CD Howe Institute to any municipality inCanadaforfinancialreporting.Itisoneofonlyfive municipalitiesinthecountrytohavereceivedthisrecognition.
The GFOA Distinguished Budget Presentation Award
The City’s Approved Business Plan and Budget 2016-2018 hasreceived‘TheDistinguishedBudgetPresentationAward’from the GFOA which is the only national awards program in governmentalbudgeting.ThisisthefirstyeartheCityappliedforandreceivedtheawardanditrepresentsasignificantachievement due to the stringent requirements for effective budgetpresentation.
Budget Process
TheCity’sbudgetispreparedbysettingprioritiesthatreflectstrategic objectives and service standards, while balancing theneedforprudentfinancialmanagement.Prioritysettingtakes place at all levels of the organization by departmental staff, senior management, executive leadership and, ultimately,CityCouncil.Throughouttheprocess,public input is taken into account, as expressed through public participation in regular and special open meetings and numerousonlinetools.
Separate Capital and Operating budgets are prepared in parallel, but are closely linked in recognition of the impact thateachhasontheother.
Commencing in 2015, the City adopted full accrual basis (PSAB) budgeting which strengthens the City’s commitment totransparencyinfinancialreporting.ThefullaccrualPSABbased budget methodology does not change how the tax levy is calculated, or how funding decisions are made by City Council.The2016FinancialStatementsreflectsfullaccrualbudgetfiguresforcomparisonpurpose.
Also commencing in 2015, the capital budget methodology changed from full project budgeting to capital contract budgeting.Thismethodologyonlyallowsbudgetingforcontracts (purchase orders) with vendors that are anticipatedtobeissuedinthebudgetyear.Thisaligns annual funding requirements with the City’s capacity to delivercapitalprojects.
Budget submissions are consolidated and supported by the analysisofbudgetdriversandjustificationofallproposednewinitiatives.Seniormanagementandexecutiveleadershipteams then determine a recommended set of objectives andprioritiesforallocationofavailableresources.Theseproposed budgets and priorities are considered by Council in open public meetings, amendments are made as appropriate andbudgetapprovalisgranted.
The capacity to fund, deliver and manage the large quantity of new capital infrastructure needed to accommodate growth continued to be a major consideration in the 2016 budget process.The2016budgetreflectedabalancebetween prioritiesofthecommunityandafiscallyresponsible approachtorunningtheCity.
Key budget objectives included in the 2016 budget were:
• Delivering a shared vision and direction for Brampton’s next phase of growth • Continuing and expanding community engagement• Seeking out national and foreign investment opportunities• Maintaining and developing corporate infrastructure• Ensuring continued value for money in the provision of all City services• Insulating taxpayers to the extent possible
Message from the City Treasurer

The Corporation of the City of Brampton Financial Report 2016
7
Audit Committee
The Audit Committee is a Committee of Council comprising fiveCityCouncilmembersappointedbyCouncil.Itprovidesa forum for communication among Council, the external auditor,theinternalauditorandmanagement.TheAuditCommittee facilitates an impartial, objective and indepen-dent review of management practices through internal and externalauditfunctions.
Financial Results
The City of Brampton’s accumulated surplus at the end of 2016was$4.0billion(2015:$4.0billion),ofwhich$3.6billionreflectsinvestmentsintangiblecapitalassets.ThisincreasereflectstheCity’scontinuingcommitmenttoinvestincapitalinfrastructure to support current City services and future growth.
Revenues
Revenuestotalled$780millionin2016.Thesourceswere:
• $425 million from property taxes• $167millionfromuserfees,fines,interestincomeandother• $12 million from federal and provincial government grants• $146 million from development levies and other restricted capitalcontributions(i.e.developmentchargesand government transfer payments for restricted purposes being applied to applicable capital works)• $30 million of developer contributed tangible capital assets
Total revenues reported in 2016 were $51 million lower than 2015.Majorfactorscontributingtothisdecreaseinclude:
• a $46 million decrease in developer contributed tangible capital assets due to lower number of subdivision agreements being executed by the developers • a $37 million decrease in development levies earned and other capital contributions due to the lower development charges receipts
These decreases were partially offset by a $28 million increase in property taxation as a result of assessment growth andbudgetaryincreases.Themajorityofthegrowthisrealized from new construction, particularly residential, and
newplansofsubdivision.Alsocontributingtotheincreaseisthe increased supplementary assessment received from the MunicipalPropertyAssessmentCorporation.
Expenses
The operating expenses totalled $734 million, including:
• General government - $112 million• Protection to persons and property - $101 million• Transportation services - $292 million• Environmental and health services - $18 million• Social and family services - $4 million• Recreation and cultural services - $179 million• Planning and development services - $28 million
Total operating expenses of $734 million (2015: $652 million) increasedby$82million.$6millionreflectsanincreaseinamortization expense, representing the value of tangible capitalassetsthatwasconsumedduringtheyear.Theamortization expense increased due to the impact of the $216 million in new tangible capital assets that were added during 2016.Thisincreaseintangiblecapitalassetsismainlyduetothe infrastructure assets assumed from developers through subdivision agreements, construction of the Williams Parkway Administrative Building Phase 2, Gore Meadows Phase 2, Sandalwood Works Yard expansion, purchase of transit buses androadconstructionactivities.
Amortization expense does not require an outlay of cash and is not directly included in the determination of the annual propertytaxlevy.
The remaining $76 million in increased expenses include:
• One-time payment of $40 million to the Peel Memorial Centre for Integrated Health and Wellness• $4 million increase in post-employment and other liabilities• Operating and maintenance of the City’s growing infrastructure investment as well as robust Transit service• One time costs associated with City transformation costs
Message from the City Treasurer
2016 Financial Report The Corporation of the City of Brampton
8
Reserve Funds
The City of Brampton has established a number of reserves and reserve funds to fund long-term liabilities, smooth tax rateincreases,expensefluctuationimpactsandfundcapitalprojects.
As at December 31, 2016, the City of Brampton’s reserves and reserve fund balances totalled $324 million, compared to $289millionin2015.Thesefundsarereportedasacompo-nent of the accumulated surplus (see Note 9 of the consolidat-edfinancialstatements).
Included in the Consolidated Statement of Financial Position are deferred revenues from gas taxes, provincial and federal transfer payments, development charges and other contribu-tionsfromdevelopersforfuturegrowth-relatedcapitalworks.These deferred revenues totalled $323 million as at Decem-ber 31, 2016 as compared to $317 million in 2015, an increase of$6million.
Transfers from reserves and reserve funds are required on an annual basis to fund portions of the City’s operating costs andcapitalexpenditureprogram.Inaddition,someofthesetransfers are directed towards insurance claims, replacement of assets, sick leave programs and Workers’ Safety Insurance payments.
Staff continues to review reserve balances on an ongoing basis to ensure the City is well-positioned to meet its long-termfinancialcommitmentsandtakeadvantageoffinancialopportunitiesthatmayarise.
Final Comments
We have made great strides in our commitment to account-ability,transparency,credibilityandclarityinfinancialreport-ing.Wecontinuetoexplorelong-termstrategiestohelpwithprioritizationanddecision-making.
As a rapidly growing city, Brampton’s ongoing challenge is to balance service delivery, infrastructure building and maintenance,whileremainingfiscallyresponsible.Weareinvesting in our infrastructure priorities to help address the needsofourcommunity–nowandintothefuture.Ouraimistomanagethatfutureinvestmentwithprudentfinancialpolicy, while continuing to provide the best possible service toourresidentsandbusinesses.
Brampton is a strong, inclusive city, with smart, passionate people.Itisoneofthemostdiversecitiesinthecountry.We’re building change in Brampton and we are committed to working as a team to position Brampton as an emergent globalcityofthefuture.
Dave Sutton, City Treasurer
June 13, 2017
Message from the City Treasurer
The Corporation of the City of Brampton Financial Report 2016
9
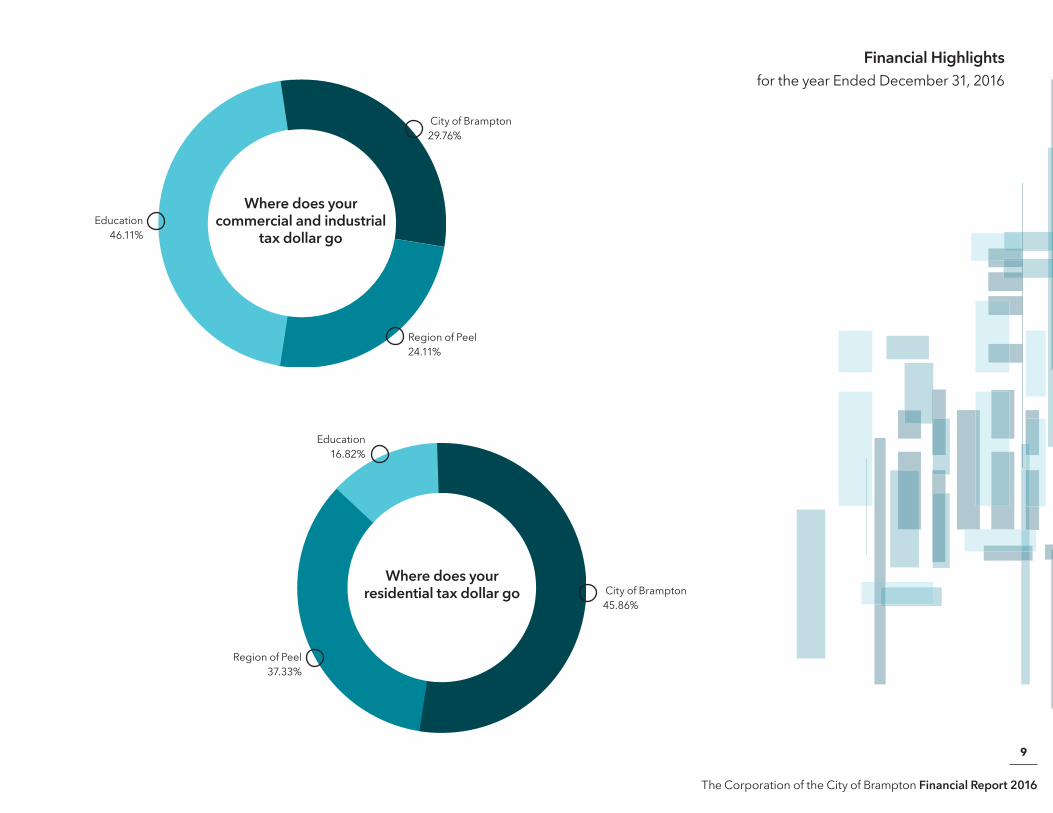
Where does your residential tax dollar go
Education 16.82%
Region of Peel 37.33%
City of Brampton 45.86%
Where does your commercial and industrial
tax dollar go
City of Brampton 29.76%
Region of Peel 24.11%
Education 46.11%
Financial Highlights for the year Ended December 31, 2016
2016 Financial Report The Corporation of the City of Brampton
10
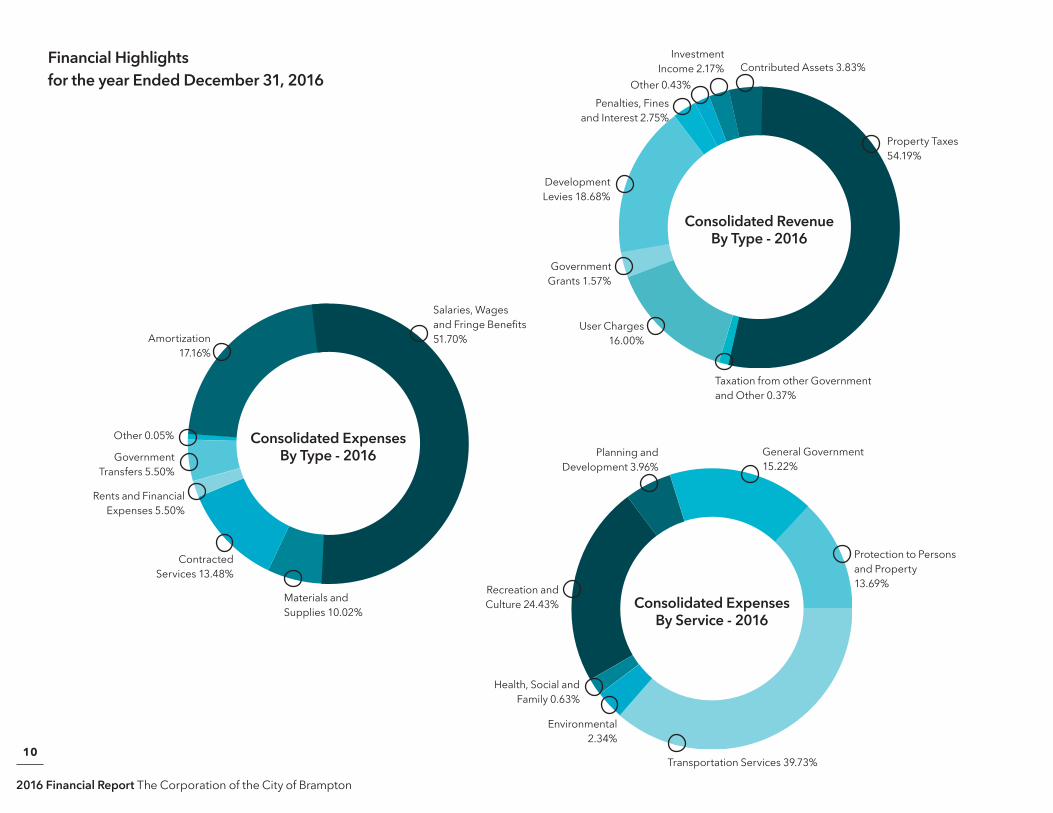
Consolidated Expenses By Type - 2016
Other0.05%
Salaries, Wages andFringeBenefits 51.70%
Government Transfers5.50%
Rents and Financial Expenses5.50%
Contracted Services13.48%
Materials and Supplies10.02%
Amortization 17.16%
Consolidated Expenses By Service - 2016
Planning and Development3.96%
Protection to Persons and Property 13.69%Recreation and
Culture24.43%
Health, Social and Family0.63%
Environmental 2.34%
TransportationServices39.73%
General Government 15.22%
Consolidated Revenue By Type - 2016
Property Taxes 54.19%
Development Levies18.68%
Government Grants1.57%
User Charges 16.00%
Taxation from other Government andOther0.37%
Investment Income2.17% ContributedAssets3.83%
Other0.43%Penalties, Fines
andInterest2.75%
Financial Highlightsfor the year Ended December 31, 2016

The Corporation of the City of Brampton Financial Report 2016
11
GFOA Award
2016 Financial Report The Corporation of the City of Brampton
12
Consolidated Financial StatementsThe Corporation of the City of Brampton for the Fiscal Year Ended December 31, 2016

The Corporation of the City of Brampton Financial Report 2016
13
Management’s Report
The integrity, relevance and comparability of data in the accompanying consolidatedfinancialstatementsaretheresponsibilityofmanagement.
Theconsolidatedfinancialstatementsarepreparedbymanagement,in accordance with generally accepted accounting principles established by the Public Sector Accounting Board (PSAB) of the Canadian Institute of CharteredAccountants.Theynecessarilyincludesomeamountsthatare basedonthebestestimatesandjudgmentsofmanagement.Financialdata elsewhereinthereportisconsistentwiththatinthefinancialstatements.
To assist in its responsibility, management maintains accounting, budget and other controls to provide reasonable assurance that transactions are appropriately authorized, that assets are properly accounted for and safeguarded,andthatfinancialrecordsarereliableforpreparationof financialstatements.
CityCouncilfulfilsitsresponsibilityforfinancialreportingthroughTheCity CouncilanditsAuditCommittee.TheCityCouncilconsistsoftheMayorand tenCouncillors.TheAuditCommitteeconsistsoffiveCouncillors.
KPMGLLP, Chartered Accountants, have been appointed by City Council toexpressanopiniononTheCity’sconsolidatedfinancialstatements. Theirreportfollows.
Harry Schlange David Sutton ChiefAdministrativeOfficer Treasurer
Brampton, Canada May 24, 2017
Responsibility for Financial Reporting

2016 Financial Report The Corporation of the City of Brampton
14
Auditors’ Report

The Corporation of the City of Brampton Financial Report 2016
15Theaccompanyingnotesareanintegralpartoftheseconsolidatedfinancialstatements.
2016 2015
FINANCIAL ASSETS
Cash and short-term investments (Note 3) $ 425,801 $ 513,235
Taxes receivable 41,257 44,289
User charges receivable 3,725 3,419
Accounts receivable 29,101 35,430
Long-term investments (Note 3) 538,644 456,143
Other assets (Note 4) 8,361 8,344
Total financial assets 1,046,889 1,060,860
FINANCIAL LIABILITIES
Accounts payable and accrued liabilities 148,448 127,453
Capital lease obligation (Note 5) 90,165 91,619
Deferred revenue - general (Note 6 (a)) 3,744 3,339
Deferred revenue - obligatory reserve funds (Note 6 (b)) 323,282 316,710
Employeebenefitsandotherliabilities(Note7) 72,837 68,363
Total financial liabilities 638,476 607,484
Net Financial Assets 408,413 453,376
NON-FINANCIAL ASSETS
Tangible capital assets (Note 15) 3,598,234 3,508,415
Inventory and prepaids 6,071 5,395
Total non-financial assets 3,604,305 3,513,810
Guarantee (Note 4)
Contingencies (Note 13)
Commitments (Note 16)
Accumulated surplus (Note 9) $ 4,012,718 $ 3,967,186
Consolidated Statement of Financial Positionas at December 31, 2016
(All dollar amounts in $000)

2016 Financial Report The Corporation of the City of Brampton
16
2016Budget (notes 1 (n) and 17)
2016 2015
REVENUES
Property taxation (Note 10) $ 419,905 $ 422,459 $ 393,608
Taxation from other governments 2,794 2,903 2,874
User charges 124,031 124,722 114,620
Government grants 1,939 12,252 13,468
Development levies earned 167,810 145,597 182,628
and other restricted capital contributions
Investment income 6,717 7,641 9,955
Interest earned on reserves 9,602 9,286 9,728
Penalties,finesandinterest 21,544 21,474 21,688
Developer contributed tangible capital assets (Note 15 (b)) 78,913 29,856 76,271
Other 4,354 3,363 5,792
Total revenues 837,609 779,553 830,632
EXPENSES
General government 108,947 111,689 60,798
Protection to persons and property 102,885 100,510 100,656
Transportation services 291,839 291,662 272,824
Environmental services 16,642 17,141 20,181
Health services (cemeteries) 707 759 840
Social and family services 3,783 3,879 2,832
Recreation and cultural services 174,956 179,336 166,159
Planning and development services 35,157 29,045 27,423
Total expenses 734,916 734,021 651,713
Annual Surplus $ 102,693 $ 45,532 $ 178,919
Accumulated surplus, beginning of year 3,967,186 3,788,267
Accumulated surplus, end of year (Note 9) $ 4,012,718 $ 3,967,186
Theaccompanyingnotesareanintegralpartoftheseconsolidatedfinancialstatements.
Consolidated Statement of Operations and Accumulated Surplusfor the year ended December 31, 2016 (All dollar amounts in $000)

The Corporation of the City of Brampton Financial Report 2016
17
2016 Budget (notes 1 (n) and 17) 2016 2015
ANNUAL SURPLUS $ 102,693 $ 45,532 $ 178,919
Acquisition of tangible capital assets - (216,140) (248,028)
Amortization of tangible capital assets 124,670 125,971 119,939
Net book value of disposed tangible capital assets - 350 261
Acquisition of inventory and prepaids - (8,438) (7,060)
Use of inventory and prepaids - 7,762 7,232
CHANGE IN NET FINANCIAL ASSETS 227,363 (44,963) 51,263
NET FINANCIAL ASSETS, BEGINNING OF YEAR 453,376 453,376 402,113
NET FINANCIAL ASSETS, END OF YEAR $ 680,739 $ 408,413 $ 453,376
Theaccompanyingnotesareanintegralpartoftheseconsolidatedfinancialstatements.
Consolidated Statement of Change in Net Financial Assets
for the year ended December 31, 2016 (All dollar amounts in $000)

2016 Financial Report The Corporation of the City of Brampton
18
2016 2015
OPERATING ACTIVITIES
Cash provided by (used in):
Annual surplus $ 45,532 $ 178,919
Change in non-cash assets and liabilities:
Taxes receivable 3,032 8,681
User charges receivable (306) (602)
Accounts receivable and other assets 6,312 12,877
Accounts payable and accrued liabilities 20,995 2,368
Deferred revenue - general 405 64
Deferred revenue - obligatory reserve fund 6,572 10,260
Employeebenefitsandotherliabilities 4,474 4,081
Inventory and prepaids (676) 172
40,808 37,901
Items not involving cash:
Amortization of tangible capital assets 125,971 119,939
Loss on disposal of tangible capital assets 350 261
Developer contributed tangible capital assets (29,856) (76,271)
NET CHANGE IN CASH FROM OPERATIONS 182,805 260,749
FINANCING ACTIVITIES
Repayment of capital lease obligation (1,454) (1,348)
CAPITAL ACTIVITIES
Acquisition of tangible capital assets (186,284) (171,757)
INVESTING ACTIVITIES
Decrease in long-term investments (82,501) (52,028)
(270,239) (225,133)
INCREASE IN CASH AND SHORT-TERM INVESTMENTS (87,434) 35,616
Cash and short-term investments, beginning of year 513,235 477,619
CASH AND SHORT-TERM INVESTMENTS, END OF YEAR $ 425,801 $ 513,235
Theaccompanyingnotesareanintegralpartoftheseconsolidatedfinancialstatements.
Consolidated Statement of Cash Flowsfor the year ended December 31, 2016 (All dollar amounts in $000)

The Corporation of the City of Brampton Financial Report 2016
19
The Corporation of the City of Brampton (the “City”) is a municipalityintheProvinceofOntario,Canada.Itconductsits operations guided by the provisions of provincial statutes such as the Municipal Act, 2001, Municipal Affairs Act, DevelopmentChargesActandrelatedlegislation.
1. Significant accounting policies:
TheconsolidatedfinancialstatementsoftheCityare prepared by management in accordance with generally accepted accounting principles for local governments as recommended by the Public Sector Accounting Board (“PSAB”) of the Chartered Professional Accountants of Canada(“CPACanada”).Significantaspectsoftheaccountingpolicies adopted by the City are as follows:
a) Reporting entity: Theconsolidatedfinancialstatementsreflecttheassets, liabilities, revenues, expenses and accumulated surplus of thereportingentity.Thereportingentityiscomprisingall organizations, committees and local boards accountable for theadministrationoftheirfinancialaffairsandresourcesto theCityandwhichareownedorcontrolledbytheCity. Theseconsolidatedfinancialstatementsinclude:
• Brampton Public Library Board • Downtown Brampton Business Improvement Area
Interdepartmental and inter-organizational transactions and balancesbetweentheseorganizationsareeliminated.
b) Non-consolidated entities: The following Regional Municipality and local boards are not consolidated and should be contacted directly if examination oftheirannualauditedfinancialstatementsisdesired:
• The Regional Municipality of Peel • The Peel District School Board • The DufferinPeel Catholic District School Board • Conseil Scolaire de District du Centre-Sud Ouest • Conseil Scolaire de District Catholique Centre-Sud
Trust funds and their related operations administered by theCityarenotincludedintheseconsolidatedfinancial statements but are reported separately on the Trust Funds FinancialStatements.
c) Accounting for Region and School Board transactions: The taxation, other revenues, expenses, assets and liabilities with respect to the operations of The Regional Municipality of Peel (“Region of Peel”) and the school boards are not
reflectedintheaccumulatedsurplusoftheseconsolidatedfinancialstatements.
d) Basis of accounting: TheCityfollowstheaccrualmethodofaccounting.Undertheaccrual method of accounting, revenues are recognized in the period in which the transactions or events that gave rise totherevenuesoccurred.Expensesarethecostofgoodsorservices acquired in the period whether or not payment has beenmadeorinvoicesreceived.
e) Investments: Cash and short-term investments include short-term highly liquidinvestmentswithtermstomaturityof90daysorless.Investments consist of bonds and debentures and are recordedatamortizedcost.Discountsandpremiumsarisingon the purchase of these investments are amortized over the termoftheinvestments.Whentherehasbeenalossofvaluethat is other than a temporary decline in value, the respective investmentiswrittendowntorecognizetheloss.
f) Non-financial assets: Non-financialassetsincludetangiblecapitalassets,inventoryandprepaids.Theyarenotavailabletodischargeexisting liabilitiesandareheldforuseintheprovisionofservices.
g) Tangible capital assets: Tangible capital assets are recorded at cost which includes amounts that are directly attributable to acquisition, construction,developmentorbettermentoftheasset. The cost, less residual value, of the tangible capital assets, are amortized on a straight line basis over their estimated useful lives as follows:
Asset Useful Life - Years Land Unlimited Buildings and building improvements 10 - 40 (asset under capital lease) Furniture, computer and 2 - 20 officeequipment Infrastructure 10 - 40 Land improvements 10 - 30 Vehicles and machinery 7 - 15
Annual amortization is charged in the year of acquisition and intheyearofdisposal.Assetsunderconstructionarenot amortizeduntiltheassetisavailableforproductiveuse.
Notes to Consolidated Financial Statements
Year ended December 31, 2016 (All dollar amounts are in 000s)

2016 Financial Report The Corporation of the City of Brampton
20
(i) Contributions of tangible capital assets Tangible capital assets received as contributions are recorded at their fair value at the date of receipt and also are recorded asrevenue.
(ii) Works of art and cultural and historic assets Works of art and cultural and historic assets are not recorded asassetsintheseconsolidatedfinancialstatements.
(iii) Interest capitalization The City does not capitalize interest costs associated with the acquisitionorconstructionofatangiblecapitalasset.
(iv) Leased tangible capital assets Leaseswhichtransfersubstantiallyallofthebenefitsandrisks incidental to ownership of property are accounted for as leasedtangiblecapitalassets.Allotherleasesareaccountedfor as operating leases and the related payments are charged toexpensesasincurred.
(v) Tangible capital assets disclosed at nominal values Where an estimate of fair value could not be made, the tangible capital asset was recognized at a nominal value.Landistheonlycategorywherenominalvalues wereassigned.
h) Government grants: Government grants are recognized in the consolidated financialstatementsasrevenuesintheperiodinwhicheventsgiving rise to the transfer occur, providing the transfers are authorized, any eligibility criteria have been met, and reasonableestimatesoftheamountscanbemade.
i) Deferred revenue - general: Deferred revenue represent user charges and fees which have been collected but for which the related services have yet to beperformed.Theseamountswillberecognizedasrevenuesinthefiscalperiodtheservicesareperformed.
j) Deferred revenue – obligatory reserve funds: The City receives gas taxes and transfer payments from other levels of government and development charges under the authorityofProvincialLegislationandCityBy-Laws.Thesefunds by their nature are restricted in their use and until applied to applicable capital works are recorded as deferred revenue.Amountsappliedtoqualifyingcapitalprojectsarerecordedasrevenueinthefiscalperiodtheyareexpended.
k) Taxation and related revenues: Taxation revenues are recorded at the time tax billings are issued.Additionalpropertytaxrevenuecanbeadded
throughout the year, related to new properties that become occupied, or that become subject to property tax, after the returnoftheannualassessmentrollusedforbillingpurposes.The City may receive supplementary assessment rolls over the course of the year from Municipal Property Assessment Corporation (“MPAC”), identifying new or omitted assess-ments.Propertytaxesforthesesupplementaryand/or omitted amounts are then billed according to the approvedtaxrateforthepropertyclass.
l) Investment income: Investment income earned on available surplus funds is reportedasrevenueintheperiodearned.Investmentincomeearned on development charges and parkland obligatory reserve funds is added to the fund balance and forms part ofrespectivedeferredrevenuebalances.
m) Pensions and employee benefits: The City accounts for its participation in the Ontario Municipal Employee Retirement Fund (“OMERS”), a multi-employerpublicsectorpensionfund,asadefinedcontributionplan.Vacationentitlementsareaccruedforasentitlementsareearned.Sickleavebenefitsareaccruedwhere they are vested and subject to payout when an employeeleavestheCity’semployment.
Otherpost-employmentbenefitsandcompensatedabsencesareaccruedinaccordancewiththeprojectedbenefitmethodprorated on service and management’s best estimate of salaryescalationandretirementagesofemployees.Actuarial valuations, where necessary for accounting purposes, are performedtriennially.Thediscountrateusedtodeterminetheaccruedbenefitobligationwasdeterminedbyreference to market interest rates at the measurement date on high- qualitydebtinstrumentswithcashflowsthatmatchthe timingandamountofexpectedbenefitpayments.
Unamortized actuarial gains or losses are amortized on a straight-line basis over the expected average remaining servicelifeoftherelatedemployeegroups.Unamortizedactuarialgains/lossesforevent-triggeredliabilities,suchas those determined as claims related to Workplace Safety Insurance Board Act (“WSIB”) are amortized over the average expectedperiodduringwhichthebenefitswillbepaid.
Costs related to prior period employee services arising out of plan amendments are recognized in the period in which the planisamended.
Notes to Consolidated Financial StatementsYear ended December 31, 2016 (All dollar amounts are in 000s)
The Corporation of the City of Brampton Financial Report 2016
21
n) Budget figures: The City budgets for the following items on the consolidated statement of operations: interest earned on reserves, developer contributed tangible capital assets and amortizationexpense.BramptonCityCouncilcompletesseparate budget reviews for its operating and capital projectbudgetseachyear.Bothbudgetsarereflectedin theconsolidatedstatementofoperations.
The operating budget is based on projected operating expensestobeincurredduringthecurrentyear.Budgets established for capital projects are set on a project-oriented basis, the costs of which may be carried out over one or morefiscalyears.
o) Use of estimates: Thepreparationoftheseconsolidatedfinancialstatementsrequiresmanagementtomakeestimatesandassumptions.This affects the reported amounts of assets and liabilities and disclosure of contingent assets and liabilities at the date of the consolidatedfinancialstatementsandthereportedamounts ofrevenuesandexpensesduringtheyear.Significantestimates and assumptions include allowance for doubtful accounts for certain accounts receivable, carrying value of tangible capital assets, provisions accrued liabilities and obligationsrelatedtoemployeefuturebenefits.Actual resultscoulddifferfromtheseestimates.
2. Future Accounting Pronouncements:
These standards and amendments were not effective for the year ended December 31, 2016, and have therefore not been appliedinpreparingtheseconsolidatedfinancialstatements.Management is currently assessing the impact of the following accounting standards updates on the future consolidated financialstatements.
(i)PS3210,Assets,providesadefinitionofassetsandfurtherexpandsthatdefinitionasitrelatestocontrol.Thestandardalso includes some disclosure requirements related to economic resources that are not recorded as assets to provide the user with better information about the types of resources availabletothepublicsectorentity.ThisstandardiseffectiveforfiscalperiodsbeginningonorafterApril1,2017(theCity’s December31,2018year-end).
(ii)PS3320,ContingentAssets,definescontingentassetsand outlines two basic characteristics of contingent assets: (a) an existing condition or situation that is unresolved at the financialstatementdate,(b)anexpectedfutureeventthatwillresolvetheuncertaintyastowhetheranassetexists.The
standardalsohasspecificdisclosurerequirementsfor contingentassetswhentheoccurrenceoftheconfirmingeventislikely.Thisstandardiseffectiveforfiscalperiodsbeginning on or after April 1, 2017 (the City’s December31,2018year-end).
(iii)PS3380,ContractualRights,definescontractualrightstofutureassetsandrevenue.Thestandardrequiresthatapublicsector entity’s contractual rights to certain types of revenue for a considerable period into the future or revenues that are abnormalinrelationtothefinancialpositionorusualbusinessoperations should be disclosed in notes or schedules to the financialstatementsandshouldincludedescriptionsabouttheirnatureandextentandtiming.ThisstandardiseffectiveforfiscalperiodsbeginningonorafterApril1,2017(the City’sDecember31,2018year-end).
(iv) PS 2200, Related Party Disclosures, establishes related partydisclosurerequirementsanddefinesrelatedparties. Thisstandardalsospecifiestheinformationrequiredto be disclosed including the type of transactions, amounts classifiedbyfinancialstatementcategory,thebasisof measurement, and the amounts of any outstanding items, anycontractualobligationsandanycontingentliabilities.Thestandard also requires disclosure of related party transactions thathaveoccurredwherenoamountshavebeenrecognized.ThisstandardiseffectiveforfiscalperiodsbeginningonorafterApril1,2017(theCity’sDecember31,2018year-end).
(v) PS 3430, Restructuring Transactions, requires that assets and liabilities in restructuring transactions to be measured at theircarryingamount.Italsoprescribesfinancialstatementpresentationanddisclosurerequirements.ThisstandardiseffectiveforfiscalperiodsbeginningonorafterApril1,2018(theCity’sDecember31,2019year-end).
(vi) PS 3420, Inter-Entity Transactions, relates to the measurement of related party transactions and includes a decisiontreetosupportthestandard.Transactionsare recordedatcarryingamountsotherthancertainexceptions.Thisstandardiseffectiveforfiscalperiodsbeginningonor afterApril1,2017(theCity’sDecember31,2018year-end).
(vii) PS 1201, Financial Statement Presentation, was issued in June,2011.Thisstandardrequiresentitiestopresentanewstatement of remeasurement gains and losses separate from the consolidated statement of operations and accumulated surplus.Thisnewstatementincludesunrealizedgainsand lossesarisingfromremeasurementoffinancialinstruments and items denominated in foreign currencies and any other
Notes to Consolidated Financial Statements
Year ended December 31, 2016 (All dollar amounts are in 000s)

2016 Financial Report The Corporation of the City of Brampton
22
comprehensive income that arises when a government includes the results of government business enterprises andpartnerships.Thissectioniseffectiveforfiscalyearsbeginning on or after April 1, 2019 and applies when PS 3450, Financial Instruments, and PS 2601, Foreign Currency Translation,areadopted.
(viii) PS 3450, Financial Instruments, establishes the standards onaccountingforandreportingalltypesoffinancial instrumentsincludingderivatives.Theeffectivedateofthis standard has recently been deferred and is now effective for fiscalperiodsbeginningonorafterApril1,2019(theCity’sDecember31,2020year-end).
(ix) PS 2601, Foreign Currency Translation, establishes the standards on accounting for and reporting transactions that aredenominatedinaforeigncurrency.Theeffectivedateofthis standard has been deferred and is now effective for fiscalperiodsbeginningonorafterApril1,2019(theCity’s December31,2020year-end).Earlieradoptionispermitted.A public sector entity adopting this standard must also adopt thenewfinancialinstrumentsstandard.
3. Cash and Investments:
Cash and short-term investments of $425,801 (2015 - $513,235) includes short-term investments of $33,102 (2015 - $2,000) with a market value $33,295 (2015 - $2,022) at the endoftheyear.
Long-term investments of $538,644 (2015 - $456,143) have a market value of $540,873 (2015 - $462,057), at the end of theyear.
4. Other Assets:
Included under other assets in the consolidated statement offinancialpositionis$7,984(2015-$7,984)consistingofaconstruction loan of $6,000 advanced by the City towards theconstructionof thePoweradeCentrewithaduedateofAugust31,2034andafurther$1,984representingadvances undertheLoanandPrioritiesAgreementestablishedin1998.
The City of Brampton is also the guarantor for the Powerade Centre Term Loan (previously a mortgage) held by the RoyalBankofCanada(RBC)expiringonMarch21,2017. Subsequent to year-end, the Term Loan, which has an amortization period ending in August 2034, was renegotiated witha5-yeartermendingonMarch21,2022. TheTermLoanhas an outstanding balance of $8,594 on December 31, 2016 (2015-$8,911).
5. Capital Lease Obligation:
In 2014, the City entered into a capital lease arrangement (the “agreement”) on a building in downtown Brampton as part of theSouthwestQuadrantRenewalPlan.
The agreement requires equal monthly lease payments over a periodof25yearsuntil2039.Attheexpiryoftheagreement,the legal title of the building will be transferred to the City
Annual lease payments under the agreement are as follows:
2017 $ 8,354 2018 8,354 2019 8,354 2020 8,354 2021 8,354 2022 and Thereafter 146,885
Total minimum lease payments $ 188,655
Less amount representing 98,490 implicitinterestat7.59%
Capital lease obligation $ 90,165
In 2016, the interest expense of $6,900 (2015 - $7,005) is reportedintheconsolidatedstatementofoperations.
6. (a) Deferred revenue – general:
Deferred revenue – general comprised program registration fees for parks and recreation programs, Transit advertising revenues applicable for the following year and unspent Provincialfundingforcapitalprojects.AsatDecember31,2016 the deferred revenue – general amounted to $3,744 (2015-$3,339).
(b) Deferred revenue – obligatory reserve funds: Under PSAB accounting principles, obligatory reserve funds aretobereportedasdeferredrevenue.ThisrequirementisinplaceasFederal/ProvinciallegislationandotherCityby-lawsand agreements may restrict how these funds may be used and under certain circumstances these funds may possibly berefunded.
As at December 31, 2016, obligatory reserve funds amounted to$323,282(2015-$316,710).Thisbalanceincludesunspentdevelopment charges, unspent gas tax receipts as well as unspentfundingforspecificinfrastructureprojectsreceivedfromfederalandprovincialgovernments.Alsoincludedinthisbalanceareunamortizeddowntownincentivecharges.
Notes to Consolidated Financial StatementsYear ended December 31, 2016 (All dollar amounts are in 000s)

The Corporation of the City of Brampton Financial Report 2016
23
TheDowntownIncentiveProgramwasinitiatedin2000withtheintentofpromotingnewdevelopmentinthedowntowncore.Aspartofthisprogram,developmentchargesarewaivedandamortizedbytheCityovera25yearperiod.AsofDecember31,2016,unamortizeddowntownincentivechargeswere$11,050(2015-$11,690).
Details of these deferred revenues are as follows:
Opening Amount Amount Other Closing received recognized as revenue
Developers $ 127,214 100,737 88,942 - $ 139,009 Federal gas tax 47,224 29,149 44,401 - 31,972 Provincial gas tax 2,885 10,467 10,099 - 3,253 Other 139,387 11,176 2,155 640 149,048
Total $ 316,710 151,529 145,597 640 $ 323,282
7. Employee benefits and other liabilities:
TheCityprovidescertainemployeebenefits,whichwillrequirefundinginfutureperiods.Underthesick-leavebenefitplan, unused sick leave can accumulate and employees may become entitled to cash payment when they leave the City’s employment.WithrespecttoresponsibilitiesunderprovisionsoftheWSIB,theCityhaselectedtobetreatedasaSchedule2employerandremitspaymentstotheWSIBasrequiredtofunddisabilitypayments.Anactuarialestimateoffutureliabilitieshasbeencompletedandformsthebasisfortheestimatedliabilityreportedintheseconsolidatedfinancialstatements.
Employeebenefitsandotherliabilitiesincludedintheconsolidatedfinancialstatementsaresummarizedbelow:
2016 2015
WSIB $ 10,114 $ 9,713 Vestedsickleavebenefits 17,145 16,293 Vacation pay 11,801 11,375 Non-pensionpostemploymentbenefits 20,721 19,102 Self insurance liability 4,826 4,630 Legal liability 8,230 7,250
Total $ 72,837 $ 68,363
AsatDecember31,2016,theCityhasallocatedreservesandreservefundsof$28,216(2015-$26,225)tofundtheseobligations. ThemostrecentfullactuarialvaluationwasperformedasatDecember31,2013.
The following table sets out the actuarial results for each of the plans as at December 31:
Item Non-Pension Vested WSIB 2016 2015 Post Employment Sick Leave Total Total Benefits Benefits
AccruedBenefitobligation(“ABO”), $22,307 $20,126 $8,929 $51,362 $49,457 beginning of year Add:Currentbenefitcosts 1,147 1,635 1,208 3,990 3,769 Add: Interest Cost 1,060 940 402 2,402 2,318 Less:CurrentBenefitPayments 1,141 2,323 1,214 4,678 4,182 ABO, end of the year $ 23,373 $ 20,378 $ 9,325 $ 53,076 $ 51,362 Unamortizedactuarialgain/(loss) (2,652) (3,233) 789 (5,096) (6,254) LiabilityforBenefits,endoftheyear $ 20,721 $ 17,145 $ 10,114 $ 47,980 $ 45,108
Notes to Consolidated Financial Statements
Year ended December 31, 2016 (All dollar amounts are in 000s)
2016 Financial Report The Corporation of the City of Brampton
24
The actuarial valuations of the plans were based upon a numberofassumptionsaboutfutureevents,whichreflectmanagement’sbestestimates.Thefollowingrepresentsthemoresignificantassumptionsmade:
Non-Pension Sick Leave WSIB
Expectedinflationrate 2.00% 2.00% 2.00% Expectedlevelof 3.00% 3.00% n/a salary increases Interestdiscountrate 4.75% 4.75% 4.50% Dentalpremiumrateincrease 4.00% n/a n/a Healthcarepremium 5.07% n/a 6.00% rates increase Expected average remaining 15 years 14 years 12 years service life
8. Pension agreements:
The City makes contributions to OMERS, which is a multi- employer plan, on behalf of all permanent, fulltime members ofitsstaff.Theplanisadefinedbenefitplan,whichspecifiestheamountoftheretirementbenefittobereceivedbytheemployees,basedonthelengthofserviceandratesofpay.TheCityaccountsforitsparticipationinOMERS,asadefinedcontributionplan.
The amount contributed to OMERS for 2016 was $25,332 (2015 - $24,408) for current service and is included as an expenseontheconsolidatedstatementofoperations. Employeecontributionstotaled$25,332(2015-$24,408).
The City is current with all payments to OMERS, therefore, thereisneitherasurplusnordeficitwiththepensionplan contributions.However,theOMERSpensionplanhada deficitatDecember31,2016of$5.7billionbasedon actuarialvaluationofplanassets.
9. Accumulated Surplus:
Accumulated surplus consists of individual fund surplus, including funds committed for capital projects, and reserves and reserve funds as follows:
2016 2015
Tangible capital assets $ 3,598,234 $ 3,508,415 Surplus funds from committed 90,140 169,834 capital projects and other
3,688,374 3,678,249 Reserves 76,323 67,676 Reserve Funds 248,021 221,261
Total $ 4,012,718 $ 3,967,186
10. Tax Revenues:
Property tax billings are prepared by the City based on the assessmentrollasdeliveredbyMPAC.MPACisanindependent body established by the Ontario Government’s Municipal PropertyAssessmentCorporationAct,1997.Aprovincewidere-assessment based on a January 1, 2008 market value was undertaken by MPAC for use in taxation years 2009 through 2012.Duringthisfouryearperiodanyassessmentincreasescompared to the previous 2005 assessment were phased-in equally.TheCityappliestheappropriatetaxratetothe assessmentintheproductionofthepropertytaxbills. However, the property tax revenue and tax receivables of the City are subject to measurement uncertainty as a number of appeals submitted by ratepayers for adjustments to assess-menthaveyettobeheardbytheAssessmentReviewBoard.An allowance has been recorded to provide for possible negativeadjustments.Anybillingadjustmentsmadenecessary by the determination of such changes will be recognized in thefiscalyeartheyaredeterminedandtheeffectsharedwithregionalgovernmentandschoolboardsasappropriate.
The Province enacted legislation together with regulations, the Fairness for Property Taxpayers Act, 1998 (Bill 79) in December 1998, which was replaced in 2000 by Bill 140, “ContinuedProtectionforPropertyTaxpayersAct”.Thesepieces of legislation limited assessment-related increases in property tax bills to 5 per cent annually for commercial, industrial and multi-residential classes of property until the affected properties were taxed at a level equivalent to taxes basedontheiractualcurrentassessedvalue.
Properties with decreases are liable to a “clawback” of someofthedecreasetofinancethe“capping”ofpropertieswithincreases.
Effective for the 2005 tax year, Bill 83 “Budget Measures Act” raises the upper limit of assessment-related increases in property tax bills from the 5 per cent maximum in Bill 79 and Bill 140 to 10 per cent annually for commercial, industrial andmulti-residentialpropertyclasses.
Further legislation was passed in 2009 creating additional optionsinthecappedpropertyclasses.Theseprovisionsallowed municipalities to remove any properties that in the prior taxation year reached CVA-level taxes from the capping program.Also,propertiesthatcrossoverfrombeingcappedproperties in the prior year to clawback properties in the current year or from being clawback properties in the prior year to capped properties in the current year are removed fromthecappingprogram.
Notes to Consolidated Financial StatementsYear ended December 31, 2016 (All dollar amounts are in 000s)
The Corporation of the City of Brampton Financial Report 2016
25
12. Trust funds:
Trust funds administered by the City amounted to $29,179 (2015-$29,748)arepresentedintheseparatefinancial statementsoftrustfundsbalancesandoperations.Assuch balancesareheldintrustbytheCityforthebenefitofothers,they are not presented as part of the City’s consolidated financialpositionoroperations.
The City administers the following trust funds:
• Cemeteries Care and Maintenance Trust • Developers’ Performance Deposits Trust • Developer Front End Financing Trust • Brampton Marketing Board, Greater Toronto Area and Greater Toronto Marketing Alliance • Brampton Sports Hall of Fame
13. Public liability insurance:
The City is self-insured for all lines of coverage including public liability, errors and omissions and Brampton Transit claims up to$500.Thisisforanynumberofclaimsarisingoutofasingleoccurrence.Outsidecoverageisinplaceforclaimsinexcessoftheselimits.
The City has created a reserve fund for self-insurance which as at December 31, 2016 had a $12,980 balance (2015 - $10,727) andisreportedontheconsolidatedstatementoffinancialposition.Claimssettledduringtheyearamountingto$3,757(2015 - $2,864) have been provided for from the reserve fund, and are accordingly reported as expenses on the consolidated statementofoperations.
In the normal course of its operations, the City is subject to variouslitigationandclaims.Wheremanagementhasas-
sessed the likelihood of the success of the claim as more likely than not and where a reasonable estimate as to the exposure can be made, an accrual has been recorded in these consolidatedfinancialstatements.Insomeinstances,theultimate outcome of these claims cannot be determined at thistime.However,theCity’smanagementbelievesthattheultimate disposition of these matters will not have a material adverseeffectonitsconsolidatedfinancialposition.
14. Provincial Offences Administration:
The Provincial Offences Act (“POA”) is a procedural law for administering and prosecuting provincial offences, including thosecommittedundertheHighwayTrafficAct,CompulsoryAutomobile Insurance Act, Trespass to Property Act, Liquor LicenceAct,MunicipalBy-lawsandminorfederaloffences. The administration of POA was downloaded to the City from theOntarioMinistryofAttorneyGeneralinJune1999.
The revenues of the combined operations of the Court House and City Hall and revenues collected on behalf of the City at other POA court sites in the Province of Ontario consist offinesleviedunderPartsIandIIIforPOAchargesandamountedto$7,890fortheyearendedDecember31,2016.(2015-$8,218).
The operating costs for the administration of the POA for the year ended December 31, 2016 amounted to $6,055 (2015 - $5,557), resulting in a net contribution of $1,835 (2015-$2,661)exclusiveofcapitalassetadditions.
The City constructed the POA Court-Hearing Facility, a permanent facility to accommodate the POA court operation (including courtrooms and accessory uses, an administrationofficeandrelatedrequirements,on-siteoffice
Notes to Consolidated Financial Statements
Year ended December 31, 2016 (All dollar amounts are in 000s)
11. Expenses by object:
The following is a summary of the expenses reported on the consolidated statement of operations by object:
2016 Budget 2016 2015
Salaries,wagesandfringebenefits $373,640 $379,483 $345,602 Materials and supplies 74,174 73,531 69,802 Contracted services 105,585 98,931 98,350 Rentsandfinancialexpenses 16,487 15,370 16,832 Government transfers 40,360 40,385 927 Amortization 124,670 125,971 119,939 Other - 350 261
Total expenses $ 734,916 $ 734,021 $ 651,713

2016 Financial Report The Corporation of the City of Brampton
26
space for prosecutors, a police bureau and accessory uses) and hearing rooms, which can be used for Ontario Municipal Board andAssessmentReviewBoardhearingsonaregularbasis.ThePOACourt-HearingFacilitybecameoperationalinAugust2004.Thetotalcostofdesignandconstructionincludingacquisitionoflandamountedto$10.7million.FundingforthePOACourt-HearingFacilityhasbeenprovidedfromtax-basedreserves.
15. Tangible capital assets:
TheCityhasidentifiedsixmajorassetcategories:Buildingsandbuildingimprovements;Furniture,Computerandoffice equipment;Infrastructure;Land;Landimprovements;VehiclesandmachineryandLeasedbuilding.
December 31, December 31, Cost 2015 Additions Disposals Transfers 2016
Land $ 1,628,129 $ 2,646 $ - $ - $ 1,630,775 Asset under capital lease 93,500 - - - 93,500 Buildings and building improvements 625,084 32,375 - - 657,459 Furniture,computerandofficeequipment 104,997 13,184 (30,436) - 87,745 Infrastructure 1,889,885 71,888 - 1,961,773 Land improvements 80,032 8,550 (122) - 88,460 Vehicles and machinery 294,713 28,107 (8,741) - 314,079 Assets under construction 105,894 184,192 - (124,802) 165,284
Total $ 4,822,234 $ 340,942 $ (39,299) $ (124,802) $ 4,999,075
Accumulated December 31, Amortization December 31, amortization 2015 Disposals expense 2016
Land $ - $ - $ - $ - Asset under capital lease 5,298 - 3,740 9,038 Buildings and building improvements 228,945 - 25,277 254,222 Furniture,computerandofficeequipment 63,306 (30,259) 13,910 46,957 Infrastructure 829,015 - 56,460 885,475 Land improvements 32,049 (40) 4,172 36,181 Vehicles and machinery 155,206 (8,650) 22,412 168,968
Total $ 1,313,819 $ (38,949) $ 125,971 $ 1,400,841
Notes to Consolidated Financial StatementsYear ended December 31, 2016 (All dollar amounts are in 000s)
The Corporation of the City of Brampton Financial Report 2016
27
Net book value December 31, 2015 December 31, 2016
Land $ 1,628,129 $ 1,630,775 Asset under capital lease 88,202 84,462 Buildings and building improvements 396,139 403,237 Furniture, computer and officeequipment 41,691 40,789 Infrastructure 1,060,870 1,076,300 Land improvements 47,983 52,279 Vehicles and machinery 139,507 145,111 Assets under construction 105,894 165,284
Total $ 3,508,415 $ 3,598,234
a) Assets under construction Assets under construction having a value of $165,284 (2015 -$105,894)havenotbeenamortized.Amortizationoftheseassetswillcommencewhentheassetsareputintoservice.
b) Contributed tangible capital assets Contributed capital assets have been recognized at fair marketvalueatthedateofcontribution.Contributedcapitalassets are comprised of infrastructure assets acquired throughsubdivisionassumptions.Thevalueofcontributedassetsreceivedduringtheyearis$29,856(2015-$76,271).
16. Commitments: The City leases facilities and equipment under operating leasesexpiringbeyond2022.Inaddition,2018amount includes $20,000 grant for the local share for construction of new Peel Memorial Centre for Integrated Health and Wellness.Theminimumamountspayableunderthese arrangements are as follows:
2017 $ 2,274 2018 21,674 2019 1,441 2020 1,058 2021 979 2022 and thereafter 17,763
$ 45,189
Excluded from these amounts is the capital lease obligation outlinedinNote5.
17. Budget Data:
Budgetdatapresentedintheseconsolidatedfinancial statements are based upon the 2015 operating and capital budgets as approved by Council and adopted by the City at theDecember9,2015meeting.Adjustmentstobudgeted
values were required to provide comparative budget values basedonthecomponentsoffullaccrualbasisofaccounting.The chart below reconciles the approved operating budget withthebudgetfigurespresentedintheseconsolidated financialstatements.
Revenue:
Approved operating budget $ 647,054
Less: Contributions from reserve funds 67,624 Add: Other 488 Add: Development levies earned 167,810 and other restricted capital contributions Add: Project budget for grants and subsidies 1,366 Add: Interest earned on reserves 9,602 Add: Developer contributed assets 78,913
Total reported on Consolidated Financial Statements $ 837,609
Expenses:
Approved operating budget $ 647,054
Less: Contributions to reserve funds 74,475 Add: Other 4,533 Add: Operating projects budget 33,134 Add: Amortization 124,670
Total reported on Consolidated Financial Statements $ 734,916
18. Segmented Information
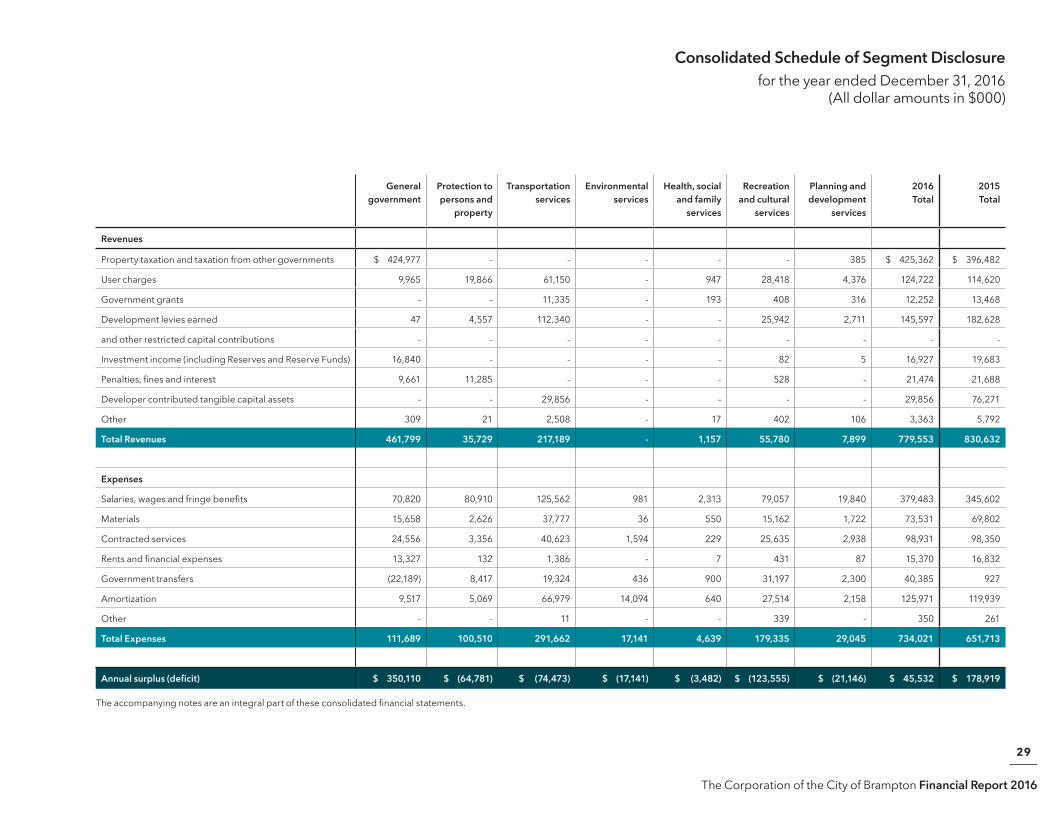
The City is a multifaceted municipal government that delivers a wide range of services that enhance quality of life to its citizens.ForadditionalinformationseetheConsolidatedScheduleofSegmentDisclosure.
City services are provided by various divisions whose activities are organized in the following segments for management reporting purposes:
General government General Government is comprised of Mayor and Councilor’s aswellasCorporateManagementandSupportsections.
The departments within Corporate Management and Support sections are responsible for adopting bylaws and administrativepolicies;riskmanagement;providingeffectivefinancialreporting,planningandcontrols;developingandmaintainingflexiblecomputernetworksandresourcesto deliver information and telecommunications to City employees andthecitizensofBrampton;acquiring,managingand disposingCityassets;levyingandcollectingtaxes.
Notes to Consolidated Financial Statements
Year ended December 31, 2016 (All dollar amounts are in 000s)
2016 Financial Report The Corporation of the City of Brampton
28
Protection to persons and property Protection Services delivers Fire Emergency Services, By-lawandEnforcementandPOAadministration.The mandateoftheFiredepartmentistoprovidefireprotectionand emergency response but also superior level of Fire PreventionandPublicEducation.By-lawandEnforcementassist in maintaining Brampton as a safe, healthy and attractive City by responding to public concerns, patrolling CitypropertyandenforcingtheCity’sby-laws.
POA’s mandate encompass the administration and prosecution of provincial offences, including those committedundertheHighwayTrafficAct,CompulsoryAutomobile Insurance Act, Trespass to Property Act, Liquor LicenceAct,MunicipalBy-lawsandminorfederaloffences.
Transportation services The Works department manages various infrastructure projects as part of a 10-year capital program to expand and improve the City’s road network and transportation infrastructure.Inaddition,majorfunctionsalsoinclude maintenance of road system (road resurfacing and snow clearing) and all associated infrastructure such as sidewalks,bridgesandcurbs.
BramptonTransitisresponsibleforprovidingefficientandeffectivelocalpublictransportationservice.
Environmental services Environmental Services are delivered by staff in the Works department.Primaryresponsibilityofthissectioniscatchbasinandstormsewermaintenance.Inaddition,the department performs watercourse maintenance in order to ensurepublicsafetyandenvironmentalcontrolsareinplace.Watercourse maintenance activities include controlling erosion, the removal of garbage and debris and responding to spills and illegal dumping to ensure water quality and propercleanup.
Health, social and family services Health, Social and Family services comprised cemetery operationsandassistancetoagedpersons.Assistance to aged persons includes senior’s education tax rebate, senior snow clearing subsidy as well as maintenance of seniorscentre.
Recreation and cultural services The Community Services department is responsible for the deliveryofParks,RecreationandCulturalservices.TheParksOperations division maintains all parks, boulevards, sports fields,trees,horticulturaldisplays,pathwaysandopenspace.
This division provides the residents of Brampton with safe, attractive, outdoor facilities delivered through a highly skilled andversatileworkforce.
The Recreation and Culture division is responsible for the delivery of all culture and recreation programs offered by the City and the day-to-day operation of all theatres and recreationbuildings.ThisdivisionprovidestheCity’sfront- line contact with the citizens of Brampton in Culture, Recreation Facilities and Programs providing many activities thatenhancetherichnessandqualityoflifeforresidents.
This section also contributes towards the information needs of the City’s citizens through the provision of library services bytheBramptonPublicLibraryBoard.
Planning and development services The Planning and Development Department responsibilities encompass planning, design and development approvals, management of building permit processes, long-range Bramptonofficialplanandgrowthmanagement.This department is also responsible for providing advice to CityCouncil,thepublic,andthedevelopment/building industry with respect to a broad range of land use planning, development applications, urban design, public buildings andopenspace/facilitydevelopmentissues,developmentengineering,andtransportationplanning.
Notes to Consolidated Financial StatementsYear ended December 31, 2016 (All dollar amounts are in 000s)
The Corporation of the City of Brampton Financial Report 2016
29
General government
Protection to persons and
property
Transportation services
Environmental services
Health, social and family
services
Recreation and cultural
services
Planning and development
services
2016 Total
2015 Total
Revenues
Property taxation and taxation from other governments $ 424,977 - - - - - 385 $ 425,362 $ 396,482
User charges 9,965 19,866 61,150 - 947 28,418 4,376 124,722 114,620
Government grants - - 11,335 - 193 408 316 12,252 13,468
Development levies earned 47 4,557 112,340 - - 25,942 2,711 145,597 182,628
and other restricted capital contributions - - - - - - - - -
Investment income (including Reserves and Reserve Funds) 16,840 - - - - 82 5 16,927 19,683
Penalties,finesandinterest 9,661 11,285 - - - 528 - 21,474 21,688
Developer contributed tangible capital assets - - 29,856 - - - - 29,856 76,271
Other 309 21 2,508 - 17 402 106 3,363 5,792
Total Revenues 461,799 35,729 217,189 - 1,157 55,780 7,899 779,553 830,632
Expenses
Salaries,wagesandfringebenefits 70,820 80,910 125,562 981 2,313 79,057 19,840 379,483 345,602
Materials 15,658 2,626 37,777 36 550 15,162 1,722 73,531 69,802
Contracted services 24,556 3,356 40,623 1,594 229 25,635 2,938 98,931 98,350
Rentsandfinancialexpenses 13,327 132 1,386 - 7 431 87 15,370 16,832
Government transfers (22,189) 8,417 19,324 436 900 31,197 2,300 40,385 927
Amortization 9,517 5,069 66,979 14,094 640 27,514 2,158 125,971 119,939
Other - - 11 - - 339 - 350 261
Total Expenses 111,689 100,510 291,662 17,141 4,639 179,335 29,045 734,021 651,713
Annual surplus (deficit) $ 350,110 $ (64,781) $ (74,473) $ (17,141) $ (3,482) $ (123,555) $ (21,146) $ 45,532 $ 178,919
Theaccompanyingnotesareanintegralpartoftheseconsolidatedfinancialstatements.
Consolidated Schedule of Segment Disclosurefor the year ended December 31, 2016
(All dollar amounts in $000)

2016 Financial Report The Corporation of the City of Brampton
30
Trust FundsFinancial Statements of the Corporation of the City of Brampton Year Ended December 31, 2016

The Corporation of the City of Brampton Financial Report 2016
31
Auditors’ Report

2016 Financial Report The Corporation of the City of Brampton
32
Cemeteries Care and Maintenance
Trust Funds
Developers' Performance
Deposits Trust
Developer Front End Financing Trust Fund
Brampton Sports Hall of Fame
Brampton Marketing Board, Greater Toronto Area and Greater Toronto
Marketing Alliance Trust Funds
2016 Total
2015 Total
Financial Assets and Liabilities
ASSETS
Cash 693,794 27,770,134 309,528 93,698 52,476 28,919,630 29,495,362
Accounts receivable 852 3,089 276 83 47 4,347 4,089
Subtotal 694,646 27,773,223 309,804 93,781 52,523 28,923,977 29,499,451
Investments, at cost (market - $250,561 2015 - $260,623):
Municipal Bonds 257,544 - - - - 257,544 257,544
Subtotal 257,544 - - - - 257,544 257,544
Total Financial Assets 952,190 27,773,223 309,804 93,781 52,523 29,181,521 29,756,995
LIABILITIES
Accounts payable - 2,196 - - - 2,196 2,196
Due to the City of Brampton 227 - - - - 227 6,823
Total Liabilities 227 2,196 - - - 2,423 9,019
Net financial resources 951,963 27,771,027 309,804 93,781 52,523 29,179,098 29,747,976
Fund balances 951,963 27,771,027 309,804 93,781 52,523 29,179,098 29,747,976
Seeaccompanyingnotestofinancialstatements.
Statement of Financial PositionTrust Funds - December 31, 2016, withcomparativefiguresfor2015

The Corporation of the City of Brampton Financial Report 2016
33
Cemeteries Care and Maintenance
Trust Funds
Developers' Performance
Deposits Trust
Developer Front End Financing Trust Fund
Brampton Sports Hall of Fame
Brampton Marketing Board, Greater Toronto Area and Greater Toronto
Marketing Alliance Trust Funds
2016 Total
2015 Total
Revenue
Monuments and markers deposits 2,400 - - - - 2,400 1,500
Perpetual care deposits 8,691 - - - - 8,691 6,869
Other deposits - Trusts - 68,000 - - - 68,000 127,226
Performance deposits received - 6,654,352 - - - 6,654,352 3,163,267
Subtotal 11,091 6,722,352 - - - 6,733,443 3,163,267
Interest Income 19,544 108,811 3,193 1,010 561 133,119 46,286
Total Revenues 30,635 6,831,163 3,193 1,010 561 6,866,562 3,345,148
Expenditures
Transfers to City Revenue Fund:
Maintenance Contribution 16,522 - - - - 16,522 15,961
ProfessionalServices/Audit - - - 3,837 - 3,837 5,785
OfficeExpenses - - - 1,591 - 1,591 -
ComputerSoftware/Maint - - - 1,995 - 1,995 -
Interest Transfer - 108,812 - - - 108,812 22,349
Administration Charges 3,022 - - - - 3,022 3,511
Subtotal 19,544 108,812 - 7,423 - 135,779 47,606
Return of performance deposits - 7,294,762 - - - 7,294,762 3,007,118
Payments on behalf of developers - 4,900 - - - 4,900 72,942
Total Expenditures 19,544 7,408,474 - 7,423 - 7,435,441 3,127,666
Excess of revenues over expenditures 11,091 (577,311) 3,193 (6,413) 561 (568,879) 217,482
Fund balances, beginning of year 940,872 28,348,338 306,611 100,194 51,962 29,747,977 29,530,494
Fund balances, end of year 951,963 27,771,027 309,804 93,781 52,523 29,179,098 29,747,976
Seeaccompanyingnotestofinancialstatements.
Statement of Financial Activities and Changes in Fund Balances
Trust Funds - December 31, 2016, withcomparativefiguresfor2015

2016 Financial Report The Corporation of the City of Brampton
34
The financial statements of The Corporation of the City of Brampton are prepared by management in accordance with generally accepted accounting principles for local governments as recommended by the Public Sector Accounting Board (“PSAB”) of the Chartered Professional Accountants of Canada (“CPA Canada”). Significant aspects of the accounting policies adopted by the City are as follows:
1. Significant accounting policies:
Revenue recognition: (a) Receipts, other than interest and letters of credit receipts, arereportedonreceipt.Interestincomeandlettersofcreditreceiptsarerecordedontheaccrualbasisofaccounting.
(b) Returns of performance deposits are reported in the periods in which they are paid either directly by the Trust Funds or through The Corporation of the City of Brampton (the“City”)funds.Allotherexpensesarereportedontheaccrualbasisofaccounting.
The accrual basis of accounting recognizes expenses as they are incurred and measurable as a result of receipt of goods orservicesandthecreationofalegalobligationtopay.
(c) Investments, including any term deposits not available on demand, are reported at the lower of amortized cost andmarketvalue.
2. Cemeteries Care and Maintenance Trust Funds:
The City maintains several cemeteries, including the following which have Care and Maintenance Trust Funds which the City administers: Brampton, Page, Hilltop Gore, Shiloh, Alloa, Grahamsville,Zion,Mt.Olivet,St.John–Castlemore,St.John–Snelgrove,St.Mary–TullamoreandEventide.Interestincome attributable to each of the individual Trust Funds that is received during any particular year is transferred to the City Revenue Fund in that year to partially offset the maintenance cost for each cemetery to which the individual Trust Funds relate.Theoperationsandinvestmentsofthefundare undertaken by the City in accordance with the regulation ofthe“CemeteriesAct(Revised).”
3. Developers’ Performance Deposits Trust:
The Developers’ Performance Deposits Trust was established for the following purposes:
(a) To hold performance deposits made by individual parties totheCityasassurancethatspecificobligationsagreedupon
arefulfilled.Oncefulfilled,thedepositheldisreturnedtotherespectiveparty.
(b) When a party develops a property in the City, generally a letter of credit is obtained from the party’s bank, which provides a guarantee to the City that the contract will be completedasspecified.Otherwise,theCityisabletodrawupon the letter of credit and to deposit the funds in the Trust tobelaterusedtopayathirdpartytocompletethecontract.
4. Developer Front End Financing Trust Fund:
The Front End Financing Trust Fund was established in 1993 to receive contributions from developers for studies and constructionofserviceswhichnotonlybenefittheirparticulardevelopment,butwillalsoultimatelybenefitotherfuture development.TheFrontEndDevelopersprovidetheinitialfinancinginlieuoftheCityfortherequiredstudiesandcapitalworks and enter into agreements with the City to recover the costsassociatedwithotherbenefitinglandownersonabesteffortbasis.
5. Brampton Sports Hall of Fame:
TheBramptonSportsHallofFame(the“BSHF”)isanon-profitorganization that was founded to recognize and honour the history of sport in the City of Brampton and in particular those persons who have made outstanding contributions and achievements in the development of sport within the community.TheBSHFwillcollect,preserve,research,exhibitand promote all those objects, images and histories which are determinedtobesignificanttothedevelopmentofsportin theCityofBrampton.
6. Brampton Marketing Board, Greater Toronto Area and Greater Toronto Marketing Alliance:
The Brampton Marketing Board (the “BMB”), the Greater Toronto Area (the “GTA”) and the Greater Toronto Marketing Alliance (the “GTMA”) Trust Funds were established to hold contributions made from the development and business community.TheTrustFundswereformedaspartnershipsbetweentheBMB,theGTAandtheGTMA.Theirmandateisto attain corporate and municipal sponsorship of marketing initiativesfortheCity,theGTAandtheGTMA.
Notes to the Financial StatementsTrust Funds - Year ended December 31, 2016
The Corporation of the City of Brampton Financial Report 2016
35
Statistical InformationYear Ended December 31, 2016

2016 Financial Report The Corporation of the City of Brampton
36
2016 2015 2014 2013 2012
Population 593,638 580,600 571,700 557,800 540,145
Households 168,120 164,680 160,710 156,403 152,837
Areas in hectares 27,138 27,138 27,138 27,138 27,138
Full-time employees 2,933 2,872 2,872 2,819 2,658
Housing Starts 4,044 5,449 4,366 2,714 5,372
Building Permit Values 1,961,406 2,731,791 2,260,649 1,210,568 2,458,744
TAXABLE ASSESSMENT UPON WHICH TAX RATES WERE SET
Residential and farm $ 63,219,818 $ 61,363,309 $ 59,324,796 $ 57,602,952 $ 45,778,991
Commercial and industrial 13,639,517 13,498,302 13,035,512 12,870,830 11,442,405
Total $ 76,859,335 $ 74,861,611 $ 72,360,308 $ 70,473,782 $ 57,221,396
Total per capita 129,472 128,938 126,570 126,342 105,937
TAX RATES/MILL RATES (URBAN AREA)
Residential
City purposes 0.504409% 0.499812% 0.492340% 0.499550% 0.481609%
Region purposes 0.410616% 0.420315% 0.430992% 0.444781% 0.459138%
School board purposes 0.188000% 0.195000% 0.203000% 0.212000% 0.221000%
Total 1.103025% 1.115127% 1.126332% 1.156331% 1.161747%
Commercial
City purposes 0.654269% 0.648306% 0.638614% 0.647966% 0.624695%
Region purposes 0.532610% 0.545191% 0.559040% 0.576926% 0.595548%
School board purposes 1.057399% 1.069252% 1.107083% 1.147477% 1.177386%
Total 2.244278% 2.262749% 2.304737% 2.372369% 2.397629%
Five Year Review Summary(Notsubjecttoaudit;alldollaramountsareinthousandsexceptpercapitafigures.Seeaccompanyingnotesandschedulestofinancialstatements.)

The Corporation of the City of Brampton Financial Report 2016
37
2016 2015 2014 2013 2012
Industrial
City purposes 0.741481% 0.734724% 0.723740% 0.734338% 0.707965%
Region purposes 0.603606% 0.617863% 0.633558% 0.653828% 0.674933%
School board purposes 1.292875% 1.325843% 1.361148% 1.399256% 1.421817%
Total 2.637962% 2.678430% 2.718446% 2.787422% 2.804715%
TAXES RECEIVABLE, END OF THE YEAR
Amount $ 46,567 $ 50,150 $ 57,768 $ 53,493 $ 51,818
Per capita $78 $86 $101 $96 $96
Percentage of years' levy 4.46% 5.05% 6.18% 5.97% 6.12%
NET LONG-TERM LIABILITIES, END OF YEAR
Amount $90,165 $91,619 $92,967 - -
Per Capita $152 $158 $163 - -
CHARGES FOR NET LONG-TERM LIABILITIES
Amount $6,900 $7,005 $2,948 - -
Per capita $12 $12 $5 - -
DEBT REPAYMENT LIMIT $ 132,609 $ 124,718 $ 101,068 $ 111,795 $ 102,527
(as determined by the Province of Ontario)
Five Year Review Summary(Notsubjecttoaudit;alldollaramountsareinthousands
exceptpercapitafigures.Seeaccompanyingnotes andschedulestofinancialstatements.)
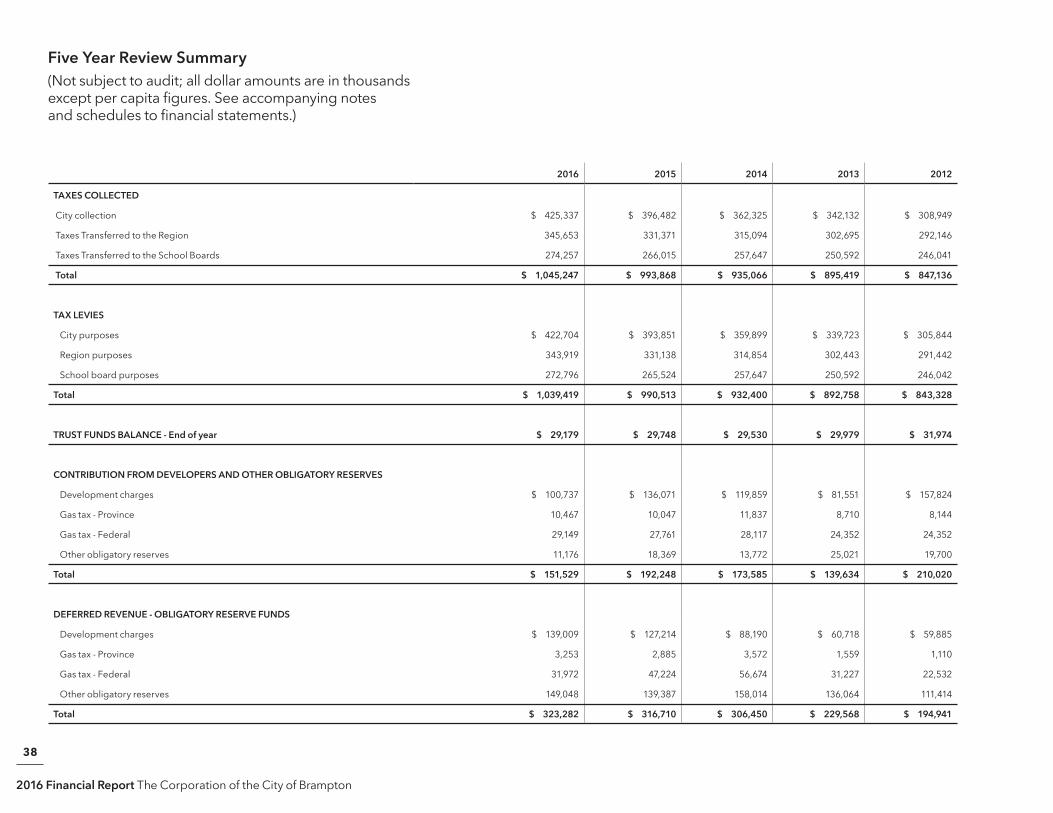
2016 Financial Report The Corporation of the City of Brampton
38
2016 2015 2014 2013 2012
TAXES COLLECTED
City collection $ 425,337 $ 396,482 $ 362,325 $ 342,132 $ 308,949
Taxes Transferred to the Region 345,653 331,371 315,094 302,695 292,146
Taxes Transferred to the School Boards 274,257 266,015 257,647 250,592 246,041
Total $ 1,045,247 $ 993,868 $ 935,066 $ 895,419 $ 847,136
TAX LEVIES
City purposes $ 422,704 $ 393,851 $ 359,899 $ 339,723 $ 305,844
Region purposes 343,919 331,138 314,854 302,443 291,442
School board purposes 272,796 265,524 257,647 250,592 246,042
Total $ 1,039,419 $ 990,513 $ 932,400 $ 892,758 $ 843,328
TRUST FUNDS BALANCE - End of year $ 29,179 $ 29,748 $ 29,530 $ 29,979 $ 31,974
CONTRIBUTION FROM DEVELOPERS AND OTHER OBLIGATORY RESERVES
Development charges $ 100,737 $ 136,071 $ 119,859 $ 81,551 $ 157,824
Gas tax - Province 10,467 10,047 11,837 8,710 8,144
Gas tax - Federal 29,149 27,761 28,117 24,352 24,352
Other obligatory reserves 11,176 18,369 13,772 25,021 19,700
Total $ 151,529 $ 192,248 $ 173,585 $ 139,634 $ 210,020
DEFERRED REVENUE - OBLIGATORY RESERVE FUNDS
Development charges $ 139,009 $ 127,214 $ 88,190 $ 60,718 $ 59,885
Gas tax - Province 3,253 2,885 3,572 1,559 1,110
Gas tax - Federal 31,972 47,224 56,674 31,227 22,532
Other obligatory reserves 149,048 139,387 158,014 136,064 111,414
Total $ 323,282 $ 316,710 $ 306,450 $ 229,568 $ 194,941
Five Year Review Summary(Notsubjecttoaudit;alldollaramountsareinthousands exceptpercapitafigures.Seeaccompanyingnotes andschedulestofinancialstatements.)

The Corporation of the City of Brampton Financial Report 2016
39
2016 2015 2014 2013 2012
CONSOLIDATED REVENUES BY SOURCE
Property taxation $ 422,459 $ 393,608 $ 359,644 $ 339,523 $ 305,644
Taxation from other governments 2,903 2,874 2,681 2,611 3,305
User charges 124,722 114,620 111,357 101,023 107,411
Government grants 12,252 13,468 26,509 7,130 24,315
Development levies earned 145,597 182,628 97,344 102,824 173,685
and other restricted capital contributions
Investment income 7,641 9,955 9,655 8,287 7,296
Penalties,finesandinterest 21,474 21,688 21,259 20,750 19,551
Interest earned on reserves 9,286 9,728 8,021 7,480 8,373
Developer contributed tangible capital assets 29,856 76,271 115,410 59,995 80,861
Other 3,363 5,792 6,712 4,405 2,553
Total $ 779,553 $ 830,632 $ 758,592 $ 654,028 $ 732,994
CONSOLIDATED EXPENSES BY FUNCTION
General government $102,172 $51,649 $52,003 $38,266 $40,511
Protection to persons and property 95,441 95,449 109,341 91,578 85,234
Transportation services 224,672 210,897 197,567 183,695 172,319
Environment services 3,047 6,792 3,288 2,173 2,500
Health services (cemeteries) 630 708 571 685 635
Social and family services 3,369 2,298 2,399 2,325 2,257
Recreation and cultural services 151,482 138,651 126,500 128,166 120,261
Planning and development 26,887 25,069 23,372 23,486 21,383
Amortization expense 125,971 119,939 118,399 105,189 101,373
Other 350 261 193 533 3,703
Total $ 734,021 $ 651,713 $ 633,633 $ 576,096 $ 550,176
Five Year Review Summary(Notsubjecttoaudit;alldollaramountsareinthousands
exceptpercapitafigures.Seeaccompanyingnotes andschedulestofinancialstatements.)

2016 Financial Report The Corporation of the City of Brampton
40
2016 2015 2014 2013 2012
CONSOLIDATED EXPENSES BY OBJECT
Salaries,wagesandemployeebenefits $ 379,483 $ 345,602 $ 334,507 $ 313,854 $ 295,364
Long term debt payments 6,900 7,005 2,948
Goods and services 221,317 178,906 177,586 156,520 149,736
Amortization 125,971 119,939 118,399 105,189 101,373
Other 350 261 193 533 3,703
Total $ 734,021 $ 651,713 $ 633,633 $ 576,096 $ 550,176
ACCUMULATED SURPLUS, BEGINNING OF YEAR $3,967,186 $3,788,267 $3,663,308 $3,585,376 $3,402,558
ANNUAL SURPLUS 45,532 178,919 124,959 77,932 182,818
ACCUMULATED SURPLUS, END OF YEAR $ 4,012,718 $ 3,967,186 $ 3,788,267 $ 3,663,308 $ 3,585,376
TOTAL FINANCIAL ASSETS $1,046,889 $1,060,860 $994,172 $916,510 $829,980
TOTAL FINANCIAL LIABILITIES 638,476 607,484 592,059 416,271 349,672
NET FINANCIAL ASSETS $ 408,413 $ 453,376 $ 402,113 $ 500,239 $ 480,308
TANGIBLE CAPITAL ASSET NET BOOK VALUE
Land $ 1,630,775 $ 1,628,129 $ 1,608,632 $ 1,603,576 $ 1,595,418
Asset under capital lease 84,462 88,202 91,942 - -
Buildings and building improvements 403,237 396,139 395,169 384,284 369,384
Furniture,computerandofficeequipment 40,789 41,691 44,955 47,313 49,098
Infrastructure 1,076,300 1,060,870 986,006 868,442 812,788
Land improvements 52,279 47,983 48,039 49,162 44,833
Vehicles and machinery 145,111 139,507 132,904 125,689 134,772
Assets under construction 165,281 105,894 72,940 80,145 94,646
Total $ 3,598,234 $ 3,508,415 $ 3,380,587 $ 3,158,611 $ 3,100,939
Five Year Review Summary(Notsubjecttoaudit;alldollaramountsareinthousands exceptpercapitafigures.Seeaccompanyingnotes andschedulestofinancialstatements.)

The Corporation of the City of Brampton Financial Report 2016
41
2016 2015 2014 2013 2012
TANGIBLE CAPITAL ASSET COST
Assets - beginning of year $ 4,822,234 $ 4,655,337 $ 4,319,366 $ 4,162,546 $ 3,939,483
Additions 340,942 392,028 484,232 284,015 390,786
Disposals and transfers (164,101) (225,131) (148,261) (127,195) (167,723)
Assets - end of year $ 4,999,075 $ 4,822,234 $ 4,655,337 $ 4,319,366 $ 4,162,546
TANGIBLE CAPITAL ASSET AMORTIZATION
Accumulated amortization - beginning of year $ 1,313,819 $ 1,274,750 $ 1,160,755 $ 1,061,607 $ 971,018
Current year expense 125,971 119,939 118,399 105,189 101,371
Accumulated amortization on disposals (38,949) (80,870) (4,404) (6,041) (10,782)
Accumulated amortization - end of year $ 1,400,841 $ 1,313,819 $ 1,274,750 $ 1,160,755 $ 1,061,607
TANGIBLE CAPITAL ASSET NET BOOK VALUE $ 3,598,234 $ 3,508,415 $ 3,380,587 $ 3,158,611 $ 3,100,939
Five Year Review Summary(Notsubjecttoaudit;alldollaramountsareinthousands
exceptpercapitafigures.Seeaccompanyingnotes andschedulestofinancialstatements.)
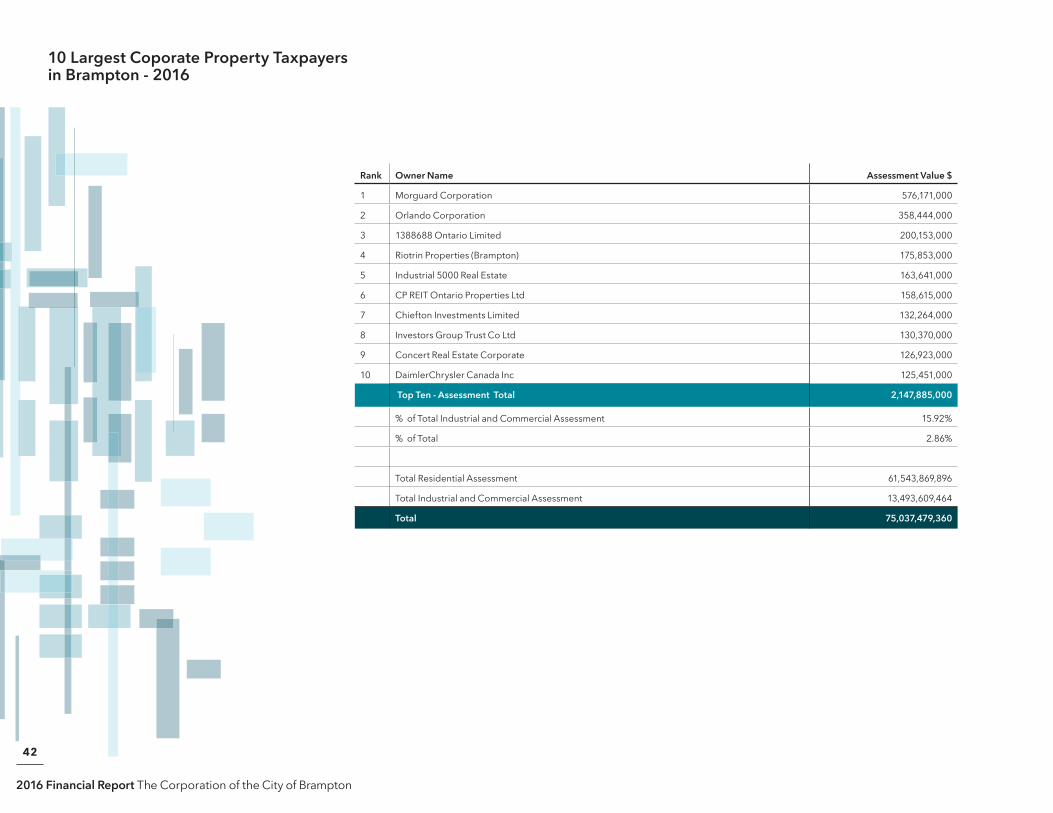
2016 Financial Report The Corporation of the City of Brampton
42
Rank Owner Name Assessment Value $
1 Morguard Corporation 576,171,000
2 Orlando Corporation 358,444,000
3 1388688 Ontario Limited 200,153,000
4 Riotrin Properties (Brampton) 175,853,000
5 Industrial 5000 Real Estate 163,641,000
6 CP REIT Ontario Properties Ltd 158,615,000
7 Chiefton Investments Limited 132,264,000
8 Investors Group Trust Co Ltd 130,370,000
9 Concert Real Estate Corporate 126,923,000
10 DaimlerChrysler Canada Inc 125,451,000
Top Ten - Assessment Total 2,147,885,000
%ofTotalIndustrialandCommercialAssessment 15.92%
%ofTotal 2.86%
Total Residential Assessment 61,543,869,896
Total Industrial and Commercial Assessment 13,493,609,464
Total 75,037,479,360
10 Largest Coporate Property Taxpayers in Brampton - 2016