Rush Springs Aquifer and Enid Isolated Terrace Aquifer Study ...
APPENDIX 1
EVANGELINE AQUIFER SUMMARY
BASELINE MONITORING PROJECT, EPA FY’98
(July 1997 Through June 1998)
PART IV
OF
TRIENNIAL SUMMARY REPORT
FOR THE
WATER QUALITY MANAGEMENT DIVISION
OF
LOUISIANA DEPARTMENT OF ENVIRONMENTAL QUALITY
PARTIAL FUNDING PROVIDED THROUGH CWA 106 GRANT

EVANGELINE AQUIFER SUMMARY
TABLE OF CONTENTS
BACKGROUND........................................................................................................................................................................... 1 PROJECT FIELD AND ANALYTICAL PARAMETERS ...................................................................................................... 2 DISCUSSION OF WATER QUALITY DATA ......................................................................................................................... 2 SUMMARY AND RECOMMENDATIONS ............................................................................................................................. 3 Table IV-1 List of Project Wells Sampled ............................................................................................................................. 4 Table IV-2 Summary of Water Quality Data ........................................................................................................................ 5 Table IV-3 Summary of Inorganic Data ................................................................................................................................ 6 Table IV-4 List of VOC Analytical Parameters .................................................................................................................... 7 Table IV-5 List of Semi-volatile Analytical Parameters ....................................................................................................... 9 Table IV-6 List of Pesticide and PCB Analytical Parameters............................................................................................ 12 Figure IV-1 Location Plat, Evangeline Aquifer ................................................................................................................ 13 Figure IV-2 Map of pH Data .............................................................................................................................................. 14 Figure IV-3 Map of TDS Data............................................................................................................................................ 15 Figure IV-4 Map of Chloride Data .................................................................................................................................... 16 Figure IV-5 Map of Iron Data ............................................................................................................................................ 17
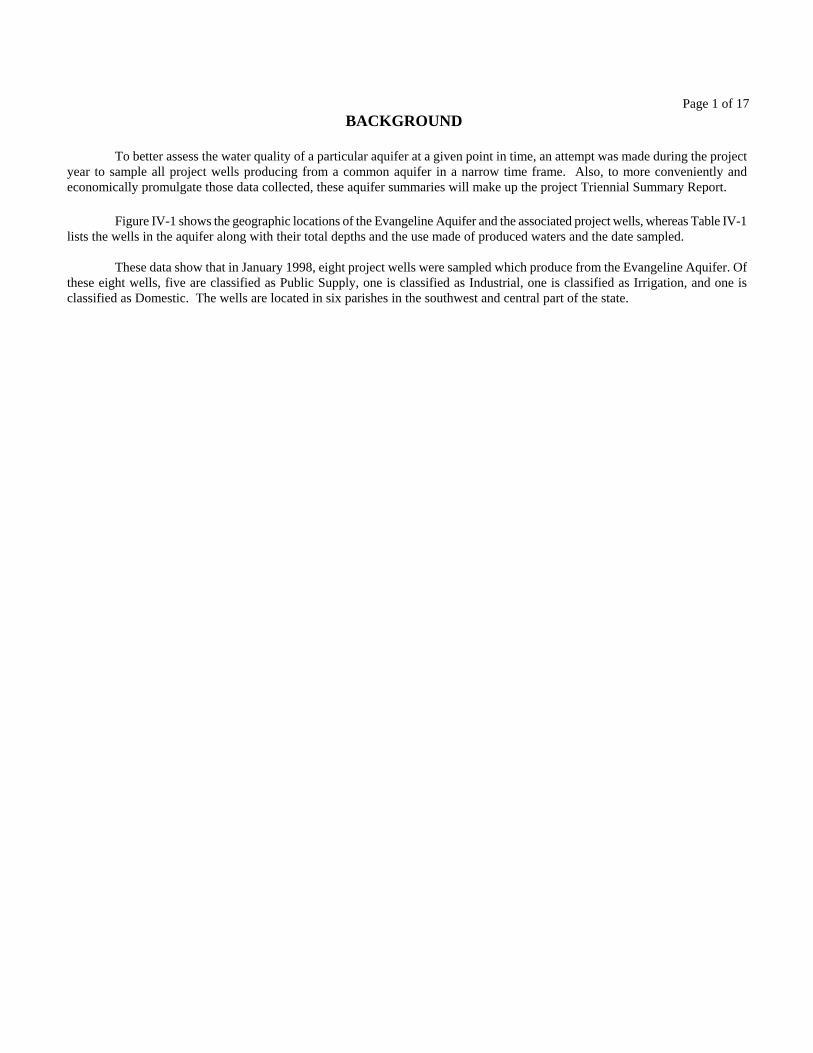
Page 1 of 17 BACKGROUND
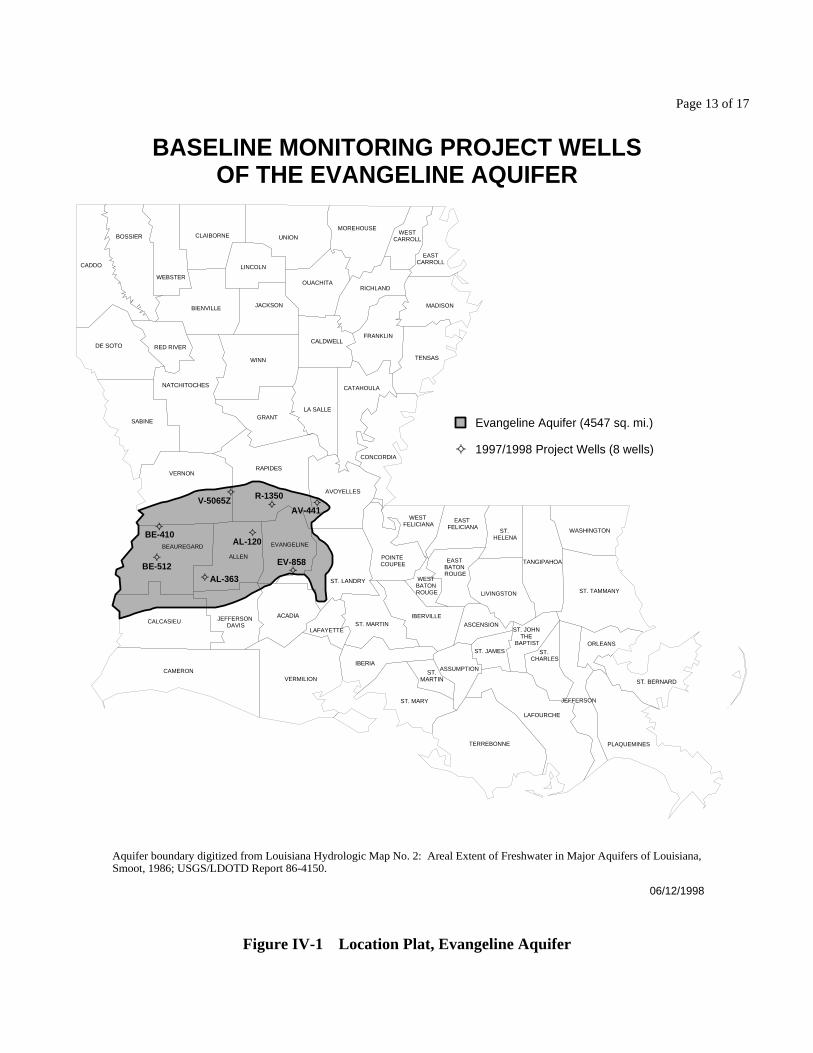
To better assess the water quality of a particular aquifer at a given point in time, an attempt was made during the project year to sample all project wells producing from a common aquifer in a narrow time frame. Also, to more conveniently and economically promulgate those data collected, these aquifer summaries will make up the project Triennial Summary Report. Figure IV-1 shows the geographic locations of the Evangeline Aquifer and the associated project wells, whereas Table IV-1 lists the wells in the aquifer along with their total depths and the use made of produced waters and the date sampled. These data show that in January 1998, eight project wells were sampled which produce from the Evangeline Aquifer. Of these eight wells, five are classified as Public Supply, one is classified as Industrial, one is classified as Irrigation, and one is classified as Domestic. The wells are located in six parishes in the southwest and central part of the state.
Page 2 of 17 PROJECT FIELD AND ANALYTICAL PARAMETERS
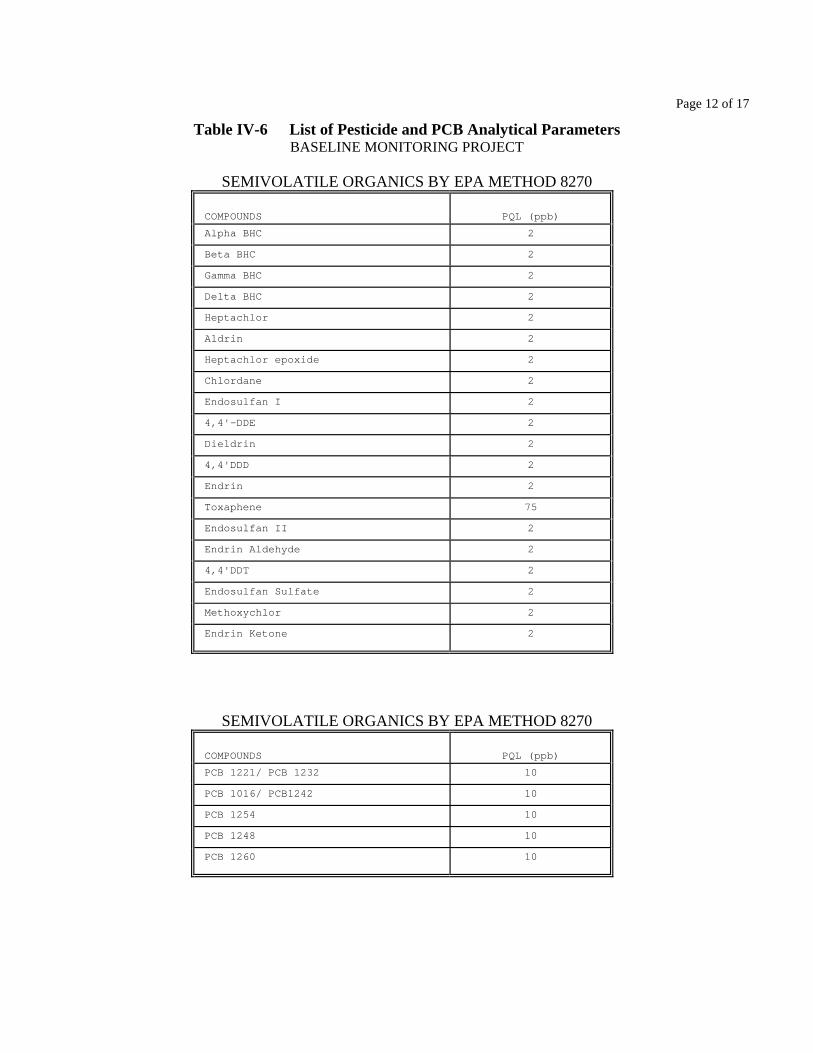
The field parameters that are checked at each sampling site and the list of water quality parameters that are analyzed in the laboratory are shown in Table IV-2. Those project inorganic (total metals) parameters analyzed in the laboratory are listed in Table IV-3. These tables also show the field and analytical results determined for each analyte. In addition to the analytical parameters mentioned above, a list of project analytical parameters include three other categories of compounds: Volatiles, Semi-volatiles, and Pesticides/PCB’s. Due to the large number of analytes of these three categories, tables were not prepared for each well. However, in order for the reader to be aware of the total list of analytes, Tables IV-4, IV-5, and IV-6 were included in this summary. The tables list the project analytes along with their Practical Quantitation Limits (PQLs) used during processing.
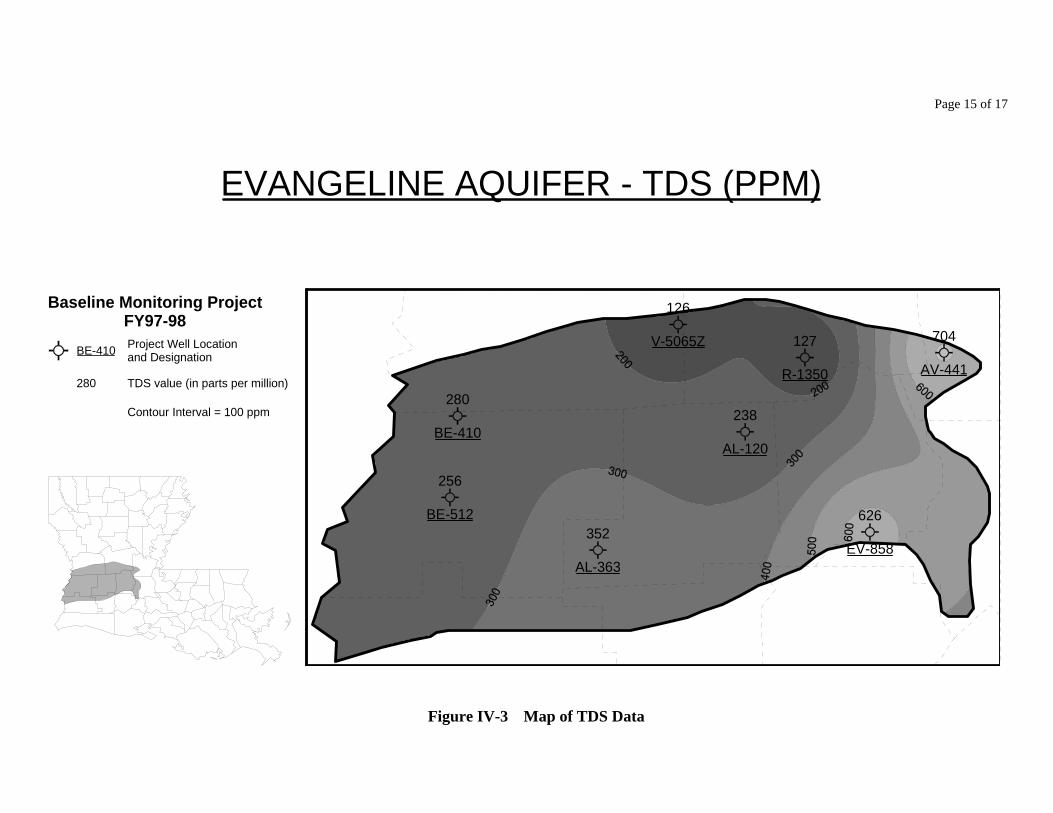
DISCUSSION OF WATER QUALITY DATA FEDERAL PRIMARY DRINKING WATER STANDARDS: Laboratory data show that one project water well of the Evangeline Aquifer which is used as a public supply well exceeded the Federal Maximum Contaminant Level for Beryllium. Avoyelles parish well number AV-441 reported 52.1 ppb of Beryllium (MCL for Beryllium = 4 ppb). Typical sources of Beryllium contamination in drinking water are the electrical, aerospace, and defense industries. Plans are being made to re-sample this well to make a final determination as to the occurrence of this compound. Laboratory data also show that seven project wells exceeded the Federal Maximum Contaminant Level for Antimony (MCL for Antimony = 6 ppb). However, the concentration for Antimony found in the Field Blank was 13.6 ppb, which was well above every concentration for Antimony that was found in the wells. Therefore, the Antimony concentrations that were found in the project wells are considered false positives due to field or lab contamination and are not considered a result of contamination of the waters of the Evangeline Aquifer. Those project wells reporting Turbidity levels of >1 NTU, do not exceed the MCL of 1.0, as this primary standard applies to surface water systems only. FEDERAL SECONDARY DRINKING WATER STANDARDS: Secondary standards are defined as non-enforceable taste, odor or appearance guidelines. Field and laboratory data contained in Tables IV-2 and IV-3 show that three of the wells sampled in the Evangeline Aquifer exceeded the Secondary Maximum Contaminant Levels (SMCL) for two separate analytes in this category. TDS (SMCL=500 ppm) Wells AV-441 and EV-858 exceeded this secondary standard with the following reported concentrations: AV-441, 704 ppm; EV-858, 626 ppm. IRON (SMCL=300 ppb) R-1350 exceeded this secondary standard with a reported concentration of 318 ppb. SELECTED WATER QUALITY MAPS For the reader’s convenience, maps showing the contoured values for pH, TDS, Chloride, and Iron are included in this summary report in Figures IV-2 through IV-5.
Page 3 of 17 SUMMARY AND RECOMMENDATIONS
In summary, the analytical data show the ground water from this aquifer to be of good quality. The concentration of Beryllium at well number AV-441 has yet to be confirmed, however, plans are being made to re-sample this well to make a final determination as to the occurrence of this compound. Data received from this re-sampling will be appended to this summary report. It is recommended that the eight project wells assigned to the Evangeline Aquifer be re-sampled as planned, in approximately three years. In addition, several wells should be added to those currently sampled to increase the well density for this aquifer.

Page 4 of 17 Table IV-1 List of Project Wells Sampled
EVANGELINE AQUIFER PROJECT WELLS
PROJECT NUMBER
PARISH
PARISH
WELL NO.
DATE
SAMPLED
WELL OWNER
DEPTH
(feet)
WELL USE
AQUIFER
8601
ALLEN
AL-120
01/12/1998 CITY OF OAKDALE
910 PUBLIC SUPPLY
EVANGELINE
9504
ALLEN
AL-363
01/12/1998 WEST ALLEN PARISH WATER DIST.
1715 PUBLIC SUPPLY
EVANGELINE
9327
AVOYELLES
AV-441
01/12/1998 TOWN OF EVERGREEN
319 PUBLIC SUPPLY
EVANGELINE
9119
BEAUREGARD
BE-410
01/13/1998 BOISE CASCADE
474 INDUSTRIAL
EVANGELINE
9505
BEAUREGARD
BE-512
01/12/1998 SINGER WATER DISTRICT
918 PUBLIC SUPPLY
EVANGELINE
9503
EVANGELINE
EV-858
01/12/1998 SAVOY SWORDS WATER SYSTEM
472 PUBLIC SUPPLY
EVANGELINE
9313
RAPIDES
R-1350
01/12/1998 COUNTRY PINES NURSERY
180 IRRIGATION
EVANGELINE
9506
VERNON
V-5065Z
01/12/1998 MR. LARRY AFEMAN
170 DOMESTIC
EVANGELINE

Page 5 of 17 Table IV-2 Summary of Water Quality Data
EVANGELINE AQUIFER WATER QUALITY PARAMETERS
FIELD PARAMETERS
WELL
NUMBER
TEMP
oC
pH SU
COND.
mmhos/cm
SAL. ppt
TSS ppm
TDS ppm
ALK. ppm
HARD.
ppm
TURB. NTU
COND.
umhos/cm
COLOR
PCU
Cl
ppm
SO4ppm
NITRITE- NITRATE (as N) ppm
TOT. P
ppm
TKN ppm
TOC ppm
NH3
(as N) ppm AL-120 22.51 7.44
0.307 0.15 <4.0 238.0 153.0 <5.0 <1.0
319.0 <5.0 6.60 5.80 0.030 0.13 <0.02 <2.00
<0.10
AL-120* 22.51 7.44
0.307 0.15 <4.0 214.0 154.0 <5.0 <1.0
322.0 <5.0 6.60 5.50 0.030 0.14 <0.02 <2.00
<0.10
AL-363 27.60 8.50
0.475 0.23 <4.0 352.0 259.0 <5.0 <1.0
501.0 20.0 3.70 2.10 0.020 0.24 0.14 2.40
0.10
AV-441 20.50 7.42
1.075 0.53 <4.0 704.0 433.0 15.0 1.1
1128.0 5.0 105.00 <0.04 0.020 0.16 0.38 3.10
0.40
BE-410 26.88 7.20
0.319 0.15 <4.0 280.0 161.0 17.2 <1.0
334.0 <5.0 6.30 6.80 0.090 0.11 0.11 <2.00
0.20
BE-512 24.39 8.16
0.320 0.15 <4.0 256.0 163.0 <5.0 <1.0
333.0 <5.0 5.70 5.80 0.020 0.11 0.11 <2.00
0.12
EV-858 21.73 7.23
0.921 0.45 <4.0 626.0 361.0 42.4 <1.0
991.0 20.0 100.00 6.10 <0.020 0.25 0.69 2.00
0.40
R-1350 19.96 5.29
0.700 0.03 <4.0 127.0 24.0 <5.0 1.2
79.9 <5.0 4.20 6.20 0.020 0.09 <0.02 <2.00
<0.10
V-5065Z 19.76 5.08
0.071 0.03 <4.0 126.0 27.3 12.7 <1.0
76.5 <5.0 5.20 1.30 0.050 0.10 <0.02 5.70
<0.10
* Denotes duplicate sample.

Page 6 of 17
Table IV-3 Summary of Inorganic Data
EVANGELINE AQUIFER
INORGANIC (TOTAL METALS) PARAMETERS
WELL NUMBER
ARSENIC
ppb
SILVER
ppb
BARIUM
ppb
BERYLLIUM
ppb
CADMIUM
ppb
CHROMIUM
ppb
COPPER
ppb
IRON ppb
MERCURY
ppb
NICKEL
ppb
ANTIMONY
ppb
SELENIUM
ppb
LEAD
ppb
THALLIUM
ppb
ZINC ppb
AL-120
<5.0 <2.0 <10.0
<1.0
<2.0
<5.0
54.0 47.5
<0.05
<5.0
6.6**
<5.0 <10.0
<5.0 23.2
AL-120*
<5.0 <2.0 <10.0
<1.0
<2.0
<5.0
33.4 <20.0
<0.05
<5.0
5.0
<5.0 <10.0
<5.0 43.1
AL-363
<5.0 <2.0 <10.0
<1.0
<2.0
<5.0
33.1 25.9
<0.05
<5.0
9.1**
<5.0 <10.0
<5.0 121.0
AV-441
<5.0 <5.0 <2.0
52.1
<1.0
<5.0
136.0 248.8
<0.05
<5.0
6.6**
<5.0 <10.0
<5.0 36.7
BE-410
<5.0 <2.0 39.6
<1.0
<2.0
<5.0
46.3 34.0
<0.05
<5.0
5.2
<5.0 40.0
<5.0 533.0
BE-512
<5.0 <2.0 12.3
<1.0
<2.0
5.1
33.0 15.5
<0.05
<5.0
11.5**
<5.0 <10.0
<5.0 30.6
EV-858
<5.0 <2.0 232.6
<1.0
<2.0
<5.0
28.3 218.0
<0.05
<5.0
14.7**
<5.0 <10.0
<5.0 33.8
V-5065Z
<5.0 <2.0 60.2
<1.0
<2.0
<5.0
36.8 23.1
<0.05
<5.0
7.3**
<5.0 <10.0
<5.0 116.0
* Denotes duplicate sample. ** See discussion of Antimony concentrations under Federal Primary Drinking Water Standards.

Page 7 of 17
Table IV-4 List of VOC Analytical Parameters BASELINE MONITORING PROJECT
VOLATILE ORGANICS BY EPA METHOD 8260
COMPOUNDS
PQL (ppb) ICHLOROFLUOROMETHANED 5 HLOROMETHANE C
5
INYL CHLORIDE V
5
ROMOMETHANE B
5
HLOROETHANE C
5
RICHLOROFLUOROMETHANE T
5
,1-DICHLOROETHENE 1
5
ETHYLENE CHLORIDE M
5
RANS-1,2-DICHLOROETHENE T
5
,1-DICHLOROETHANE 1
5
,2 DICHLOROPROPANE 2
5
IS-1,2 DICHLOROETHENE C
5
ROMOCHLOROMETHANE B
5
HLOROFORM C
5
,1,1-TRICHLOROETHANE 1
5
,1 DICHLOROPROPENE 1
5
ARBON TETRACHLORIDE C
5
ENZENE B
5
,2-DICHLOROETHANE 1
5
RICHLOROETHENE T
5
,2-DICHLOROPROPANE 1
5
ROMODICHLOROMETHANE B
5
IBROMOMETHANE D
5
IS-1,3-DICHLOROPROPENE C
5
OLUENE T
5
RANS-1,3-DICHLOROPROPENE T
5
,1,2-TRICHLOROETHANE 1
5
,3--DICHLOROPROPANE 1
5
ETRACHLOROETHENE T
5
,2-DIBROMOETHANE 1
5
IBROMOCHLOROMETHANE D
5
HLOROBENZENE C
5
THYLBENZENE E
5
,1,1,2-TETRACHLOROETHANE 1
5
&M XYLENE P
10
-XYLENE O
5
TYRENE S
5
ROMOFORM B
5
ISOPROPYLBENZENE
5

Page 8 of 17
Table IV-4 (Cont=d)
Volatile Organic (VOC) Parameters
COMPOUNDS
PQL (ppb) 1,1,2,2-TETRACHLOROMETHANE 5 ,2,3,-TRICHLOROPROPANE1 5 ROMOBENZENE B
5
-PROPYLBENZENE n
5
-CHLOROTOLUENE 2
5
-CHLOROTOLUENE 4
5
,3,5-TRIMETHYLBENZENE 1
5
ERT-BUTYLBENZENE T
5
,2,4-TRIMETHYLBENZENE 1
5
EC-BUTYLBENZENE S
5
-ISOPRPYLTOLUENE P
5
,3-DICHLOROBENZENE 1
5
,4-DICHLOROBENZENE 1
5
-BUTYLBENZENE n
5
,2-DIBROMO-3-CHLOROPROPANE 1
5
APHTHALENE N
5
,2,4-TRICHLOROBENZENE 1
5
EXACHLOROBUTADIENE H
5
,2-DICHLOROBENZENE 1
5
1,2,3-TRICHLOROBENZENE
5
PQL = Practical Quantitation Limit ppb = parts per billion

Page 9 of 17
Table IV-5 List of Semi-volatile Analytical Parameters BASELINE MONITORING PROJECT
SEMIVOLATILE ORGANICS BY EPA METHOD 8270
COMPOUNDS
PQL (ppb) -Nitrosodimethylamine N
10
2-Picoline
10 Methyl methanasulfonate
10
Ethyl methanesulfonate
20
Phenol
10
Aniline
10
Bis(2-chloroethyl)ether
10
2-Chlorophenol
10
1,3-Dichlorobenzene
10
1,4-Dichlorobenzene
10
Benzyl alcohol
20
1,2-Dichlorobenzene
10
2-Methylphenol
10
Bis(2-chloroisopropyl)ether
10
4-Methylphenol
10
N-Nitroso-di-n-propylamine
10
Hexachloroethane
10
Acetophenone
10
Nitrobenzene
10
N-Nitrosopiperidine
20
Isophorone
10
2,4-Dimethylphenol
10
2-Nitrophenol
10
Benzoic acid
50
Bis(2-chloroethoxy)methane
10
2,4-Dichlorophenol
10
a,a-Dimethylphenethylamine
10
1,2,4-trichlorobenzene
10
Benzidine
50
Pyrene
10
p-Dimethylaminoazobenzene
10
Butylbenzylphthalate
10
Bis(2-ethylhexyl)phthalate
10
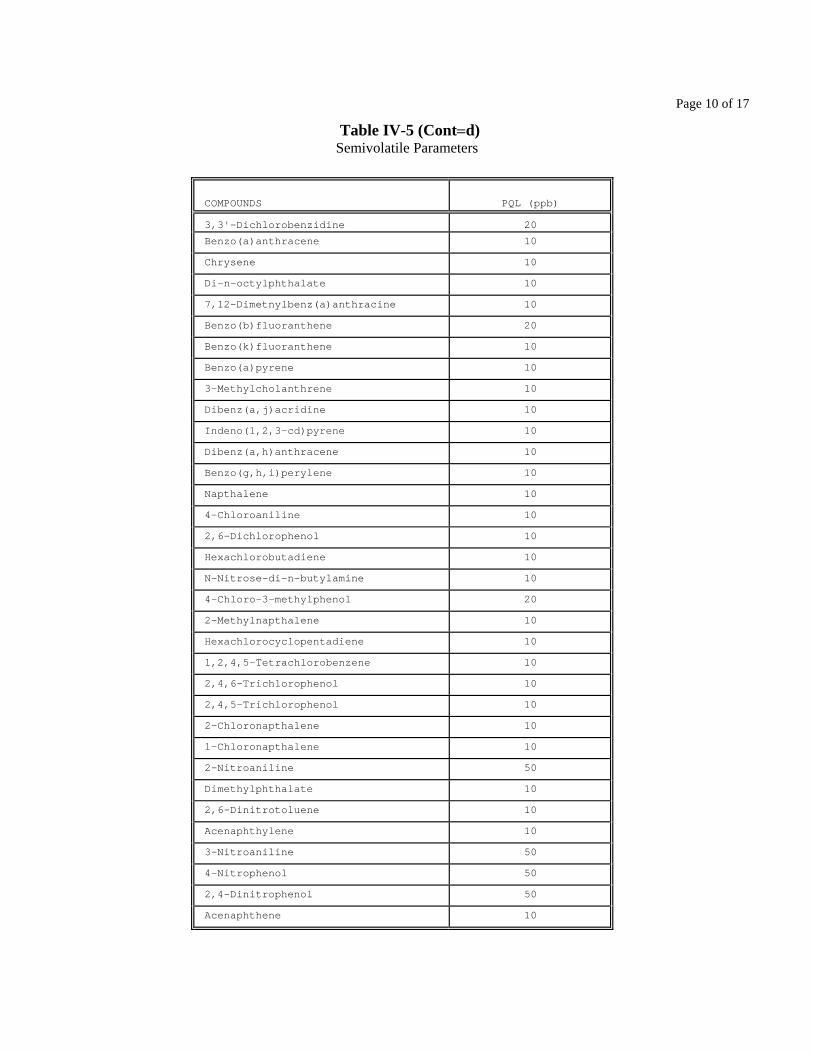
Page 10 of 17
Table IV-5 (Cont=d) Semivolatile Parameters
COMPOUNDS
PQL (ppb) ,3'-Dichlorobenzidine 3
20
Benzo(a)anthracene
10 Chrysene
10
Di-n-octylphthalate
10
7,12-Dimetnylbenz(a)anthracine
10
Benzo(b)fluoranthene
20
Benzo(k)fluoranthene
10
Benzo(a)pyrene
10
3-Methylcholanthrene
10
Dibenz(a,j)acridine
10
Indeno(1,2,3-cd)pyrene
10
Dibenz(a,h)anthracene
10
Benzo(g,h,i)perylene
10
Napthalene
10
4-Chloroaniline
10
2,6-Dichlorophenol
10
Hexachlorobutadiene
10
N-Nitrose-di-n-butylamine
10
4-Chloro-3-methylphenol
20
2-Methylnapthalene
10
Hexachlorocyclopentadiene
10
1,2,4,5-Tetrachlorobenzene
10
2,4,6-Trichlorophenol
10
2,4,5-Trichlorophenol
10
2-Chloronapthalene
10
1-Chloronapthalene
10
2-Nitroaniline
50
Dimethylphthalate
10
2,6-Dinitrotoluene
10
Acenaphthylene
10
3-Nitroaniline
50
4-Nitrophenol
50
2,4-Dinitrophenol
50
Acenaphthene
10
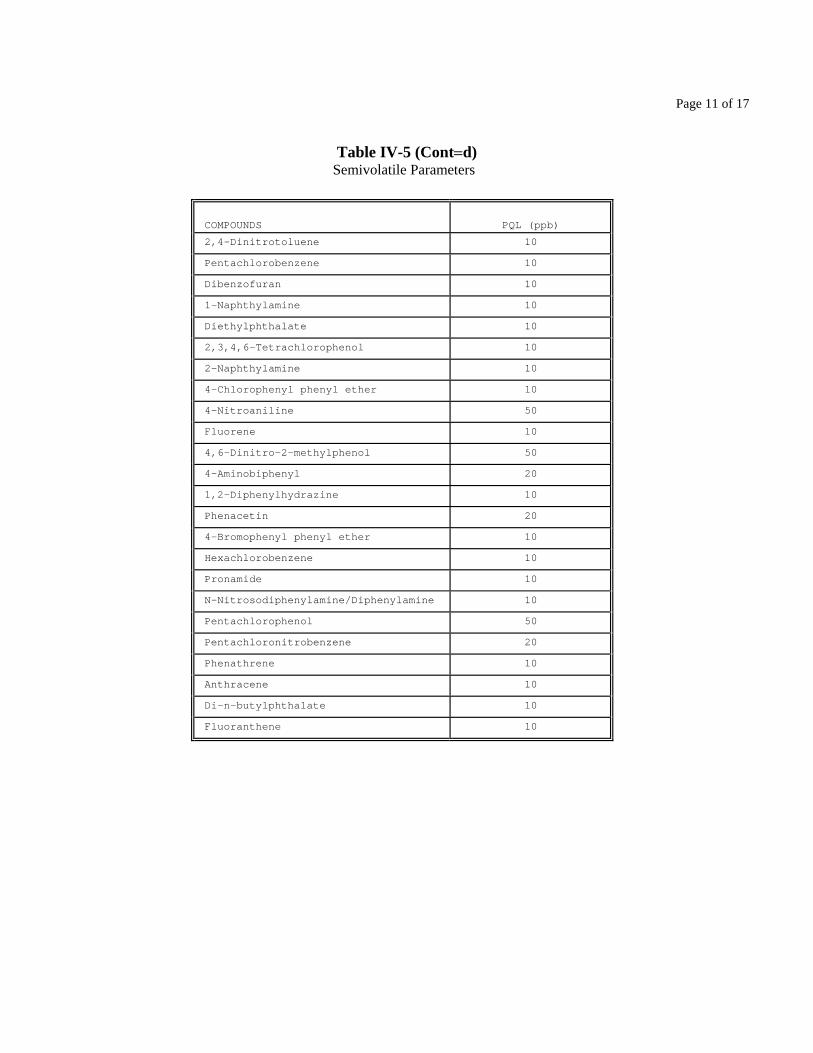
Page 11 of 17
Table IV-5 (Cont=d)
Semivolatile Parameters
COMPOUNDS
PQL (ppb) 2,4-Dinitrotoluene
10
Pentachlorobenzene
10
Dibenzofuran
10
1-Naphthylamine
10
Diethylphthalate
10
2,3,4,6-Tetrachlorophenol
10
2-Naphthylamine
10
4-Chlorophenyl phenyl ether
10
4-Nitroaniline
50
Fluorene
10
4,6-Dinitro-2-methylphenol
50
4-Aminobiphenyl
20
1,2-Diphenylhydrazine
10
Phenacetin
20
4-Bromophenyl phenyl ether
10
Hexachlorobenzene
10
Pronamide
10
N-Nitrosodiphenylamine/Diphenylamine
10
Pentachlorophenol
50
Pentachloronitrobenzene
20
Phenathrene
10
Anthracene
10
Di-n-butylphthalate
10
Fluoranthene
10
Page 12 of 17
Table IV-6 List of Pesticide and PCB Analytical Parameters BASELINE MONITORING PROJECT
SEMIVOLATILE ORGANICS BY EPA METHOD 8270
COMPOUNDS
PQL (ppb) Alpha BHC
2
Beta BHC
2
Gamma BHC
2
Delta BHC
2
Heptachlor
2
Aldrin
2
Heptachlor epoxide
2
Chlordane
2
Endosulfan I
2
4,4'-DDE
2
Dieldrin
2
4,4'DDD
2
Endrin
2
Toxaphene
75
Endosulfan II
2
Endrin Aldehyde
2
4,4'DDT
2
Endosulfan Sulfate
2
Methoxychlor
2
Endrin Ketone
2
SEMIVOLATILE ORGANICS BY EPA METHOD 8270 COMPOUNDS
PQL (ppb) PCB 1221/ PCB 1232
10
PCB 1016/ PCB1242
10
PCB 1254
10
PCB 1248
10
PCB 1260
10
Page 13 of 17
ACADIA
ALLEN
ASCENSION
ASSUMPTION
AVOYELLES
BEAUREGARD
BIENVILLE
Figure IV-1 Location Plat, Evangeline Aquifer
BOSSIER
CADDO
CALCASIEU
CALDWELL
CAMERON
CATAHOULA
CONCORDIA
DE SOTO
CLAIBORNE
EAST BATON ROUGE
EAST FELICIANA
EVANGELINE
FRANKLIN
GRANT
IBERIA
EASTCARROLL
IBERVILLE
JACKSON
JEFFERSON
JEFFERSON DAVIS
LAFAYETTE
LAFOURCHE
LA SALLE
LINCOLN
LIVINGSTON
MADISON
MOREHOUSE
NATCHITOCHES
ORLEANS
OUACHITA
PLAQUEMINES
POINTE COUPEE
RAPIDES
RED RIVER
RICHLAND
SABINE
ST. BERNARD
ST. CHARLES
ST. HELENA
ST. JAMES
ST. JOHN THE
BAPTIST
ST. LANDRY
ST. MARTIN
ST. MARY
ST. TAMMANY
TANGIPAHOA
TENSAS
TERREBONNE
UNION
VERMILION
VERNON
WASHINGTON
WEBSTER
WEST BATON ROUGE
WESTCARROLL
WEST FELICIANA
WINN
BASELINE MONITORING PROJECT WELLSOF THE EVANGELINE AQUIFER
Aquifer boundary digitized from Louisiana Hydrologic Map No. 2: Areal Extent of Freshwater in Major Aquifers of Louisiana, Smoot, 1986; USGS/LDOTD Report 86-4150.
06/12/1998
ST.MARTIN
Evangeline Aquifer (4547 sq. mi.)
1997/1998 Project Wells (8 wells)
AV-441R-1350
AL-120
V-5065Z
BE-410
BE-512AL-363
EV-858

Page 14 of 17
AV-441R-1350
AL-120
V-5065Z
BE-410
BE-512
AL-363EV-858
7.425.29
7.44
5.08
7.20
8.16
8.507.23
EVANGELINE AQUIFER - pH (SU)
Baseline Monitoring ProjectFY97-98
BE-410 Project Well Locationand Designation
7.20 pH value (in Standard Units)
Contour Interval = 0.25 SU
Figure IV-2 Map of pH Data
Page 15 of 17
AV-441R-1350
AL-120
V-5065Z
BE-410
BE-512
AL-363EV-858
704127
238
126
280
256
352626
EVANGELINE AQUIFER - TDS (PPM)
Baseline Monitoring ProjectFY97-98
BE-410 Project Well Locationand Designation
280 TDS value (in parts per million)
Contour Interval = 100 ppm
Figure IV-3 Map of TDS Data

Page 16 of 17
AV-441R-1350
AL-120
V-5065Z
BE-410
BE-512
AL-363EV-858
1054
7
5
6
6
4100
EVANGELINE AQUIFER - CHLORIDE (PPM)
Baseline Monitoring ProjectFY97-98
BE-410 Project Well Locationand Designation
6 Chloride value(in parts per million)
Contour Interval = 20 ppm
Figure IV-4 Map of Chloride Data

Page 17 of 17
AV-441R-1350
AL-120
V-5065Z
BE-410
BE-512
AL-363EV-858
249318
475
23
34
16
26218
EVANGELINE AQUIFER -IRON (PPB)
Baseline Monitoring ProjectFY97-98
BE-410 Project Well Locationand Designation
34 Iron value(in parts per billion)
Contour Interval = 100 ppm
Figure IV-5 Map of Iron Data