APPENDIX 1 · ESSAR BULK TERMINAL LIMITED Marine Environmental Evaluation for Development of LNG...
130
APPENDIX 1
Transcript of APPENDIX 1 · ESSAR BULK TERMINAL LIMITED Marine Environmental Evaluation for Development of LNG...

APPENDIX 1

ESSAR BULK TERMINAL
LIMITED
Marine Environmental Evaluation for Development of LNG Terminal at Hajira, Gujarat
OCTOBER 2018
CSIR-Central Salt and Marine Chemicals Research Institute
Gijubhai Badheka Marg, Bhavnagar – 364002
Kadam Environmental Consultants w w w . ka d a m en v i r o . c o m
E n v i r o n m e n t f o r D e v e l o p m e n t

ESSAR BULK TERMINAL LTD.
MARINE ENVIRONMENTAL EVALUATION FOR
PROPOSED LNG TERMINAL AT HAJIRA, GUJARAT QUALITY CONTROL
CSIR-CENTRAL SALT AND MARINE CHEMICALS RESEARCH INSTITUTE
KADAM ENVIRONMENTAL CONSULTANTS | OCTOBER 2018 3
TABLE OF CONTENTS
1 INTRODUCTION AND BACKGROUND .............................................................................................. 12
1.1 Purpose of the report ........................................................................................................................ 12
1.2 Identification of project proponent and project .................................................................................... 12
1.2.1 About project proponent .............................................................................................................. 12
1.2.2 About the project ........................................................................................................................ 12
1.3 Brief description of the project ........................................................................................................... 13
1.3.1 Nature of project ......................................................................................................................... 13
1.3.2 Products & its capacity ................................................................................................................. 13
1.3.3 Location...................................................................................................................................... 13
1.4 Scope of the Study ............................................................................................................................ 13
2 PROJECT DESCRIPTION ................................................................................................................. 15
2.1 Type of project ................................................................................................................................. 15
2.2 Need for the project .......................................................................................................................... 15
2.3 Location (maps showing general location, specific location, project boundary & project site layout) ......... 16
2.3.1 General location of the site........................................................................................................... 16
2.3.2 Specific location of site & project boundary ................................................................................... 16
2.3.3 Approach and connectivity to facility ............................................................................................. 19
2.4 Size or magnitude of operation ........................................................................................................... 19
2.4.1 Land distribution at site ............................................................................................................... 19
2.4.2 Magnitude of site......................................................................................................................... 24
2.5 Proposed schedule for approval and implementation ............................................................................ 24
2.6 Brief description of the project ........................................................................................................... 24
2.6.1 Development of FSU and land based LNG terminal ......................................................................... 24
2.6.2 Details of project ......................................................................................................................... 25
2.6.3 LNG storage facilities ................................................................................................................... 25
2.7 Associated utilities facilities ................................................................................................................ 29
2.7.1 Power requirement ...................................................................................................................... 29
2.7.2 Emissions details ......................................................................................................................... 29
2.7.3 Details of water and wastewater ................................................................................................... 29
2.7.4 Details of proposed sewage treatment plant at terminal area .......................................................... 34
2.7.5 Fuel gas ...................................................................................................................................... 35
2.7.6 Nitrogen ..................................................................................................................................... 35

ESSAR BULK TERMINAL LTD.
MARINE ENVIRONMENTAL EVALUATION FOR
PROPOSED LNG TERMINAL AT HAJIRA, GUJARAT QUALITY CONTROL
CSIR-CENTRAL SALT AND MARINE CHEMICALS RESEARCH INSTITUTE
KADAM ENVIRONMENTAL CONSULTANTS | OCTOBER 2018 4
2.7.7 Instrument air & plant air ............................................................................................................. 36
2.7.8 Diesel oil ..................................................................................................................................... 36
2.7.9 Flare system ............................................................................................................................... 36
2.7.10 Solid and hazardous waste identification, quantification, collection, transportation and disposal ........ 37
2.7.11 Other effluents ............................................................................................................................ 38
2.7.12 Export possibility ......................................................................................................................... 39
2.7.13 Employment generation (direct and indirect) ................................................................................. 39
2.8 Cost of the project............................................................................................................................. 39
3 DESCRIPTION OF THE ENVIRONMENT ........................................................................................... 40
3.1 Introduction ...................................................................................................................................... 40
3.2 Baseline environmental quality ........................................................................................................... 40
3.2.1 Primary data collection ................................................................................................................. 40
3.2.2 Description of Gulf of Khambhat and EBTL Hajira channel .............................................................. 43
3.2.3 Marine environment ..................................................................................................................... 44
3.2.4 Water ......................................................................................................................................... 50
3.2.5 Sediments ................................................................................................................................... 65
3.2.6 Marine ecology ............................................................................................................................ 72
4 ANTICIPATED ENVIRONMENTAL IMPACTS & MITIGATION MEASURES......................................... 83
4.1 Introduction ...................................................................................................................................... 83
4.2 Impact assessment methodology ........................................................................................................ 83
4.2.1 Key definitions ............................................................................................................................ 83
4.2.2 Identification of impacts ............................................................................................................... 83
4.3 Identification of impacting activities for the proposed project................................................................ 84
4.3.1 Water environment ...................................................................................................................... 85
4.3.2 Sediment environment ................................................................................................................. 86
4.3.3 Air Environment .......................................................................................................................... 86
4.3.4 Flora & fauna .............................................................................................................................. 86
5 Environmental Monitoring Program ............................................................................................... 88
5.1 Introduction ...................................................................................................................................... 88
5.2 Objective of monitoring ..................................................................................................................... 88
5.3 Environmental monitoring programme ................................................................................................ 89
5.4 Regulatory Framework ....................................................................................................................... 91
6 Additional Studies .......................................................................................................................... 92
6.1 Numerical modelling study ................................................................................................................. 92
ESSAR BULK TERMINAL LTD.
MARINE ENVIRONMENTAL EVALUATION FOR
PROPOSED LNG TERMINAL AT HAJIRA, GUJARAT QUALITY CONTROL
CSIR-CENTRAL SALT AND MARINE CHEMICALS RESEARCH INSTITUTE
KADAM ENVIRONMENTAL CONSULTANTS | OCTOBER 2018 5
6.1.1 Model setup ................................................................................................................................ 92
6.1.2 Hydrodynamic Model ................................................................................................................... 95
6.1.3 Inferences and conclusion from hydrodynamics simulation ............................................................. 99
6.2 Shoreline changes ........................................................................................................................... 110
7 Environmental Management Plan (EMP) ...................................................................................... 116
7.1 Purpose .......................................................................................................................................... 116
7.2 Water environment .......................................................................................................................... 117
7.4 Sediment Environment ..................................................................................................................... 118
7.5 Biological Environment ..................................................................................................................... 118
8 Summary and conclusion ............................................................................................................. 121
8.1 Introduction & background .............................................................................................................. 121
8.2 Project description ........................................................................................................................... 121
8.3 Description of the environment ........................................................................................................ 121
8.3.1 Bathymetry ............................................................................................................................... 121
8.3.2 Wind ........................................................................................................................................ 121
8.3.3 Tide ......................................................................................................................................... 121
8.3.4 Current ..................................................................................................................................... 122
8.3.5 Water, Sediment and Flora Fauna ............................................................................................... 122
8.4 Environmental impact identification, prediction and mitigation measures ............................................. 123
8.4.1 Water environment .................................................................................................................... 123
8.4.2 Sediment environment ............................................................................................................... 124
8.4.3 Air Environment ........................................................................................................................ 124
8.4.4 Flora & fauna ............................................................................................................................ 124
8.5 Additional studies ............................................................................................................................ 125
8.5.1 Hydrodynamic modelling ............................................................................................................ 125
8.5.2 Oil spill ..................................................................................................................................... 125
8.5.3 Shoreline change ....................................................................................................................... 125
8.6 Environmental management plan ..................................................................................................... 126
9 Disclosure of Consultants ............................................................................................................. 127
9.1 Team members of Central Salt & Marine Environment Research Institute (CSMCRI) & Kadam
Environmental Consultants (KEC) ............................................................................................................... 127

ESSAR BULK TERMINAL LTD.
MARINE ENVIRONMENTAL EVALUATION FOR
PROPOSED LNG TERMINAL AT HAJIRA, GUJARAT PROJECT DESCRIPTION
CSIR-CENTRAL SALT AND MARINE CHEMICALS RESEARCH INSTITUTE
KADAM ENVIRONMENTAL CONSULTANTS | OCTOBER 2018 6
LIST OF ATTACHMENT
Attachment 1: Oil Spill Disaster Contingency Plan ........................................................................................... 129
Attachment 2: Ship Tranquillity Study ............................................................................................................ 130

ESSAR BULK TERMINAL LTD.
MARINE ENVIRONMENTAL EVALUATION FOR
PROPOSED LNG TERMINAL AT HAJIRA, GUJARAT PROJECT DESCRIPTION
CSIR-CENTRAL SALT AND MARINE CHEMICALS RESEARCH INSTITUTE
KADAM ENVIRONMENTAL CONSULTANTS | OCTOBER 2018 7
LIST OF TABLES
Table 2-1: Area statement of site ..................................................................................................................... 19
Table 2-2: Project implementation schedule ..................................................................................................... 24
Table 2-3: Land based storage tank details ...................................................................................................... 26
Table 2-4: Floating storage unit details ............................................................................................................ 26
Table 2-5: Type of LNGCs and their dimensions ................................................................................................ 26
Table 2-6: Unloading arm details ..................................................................................................................... 26
Table 2-7: Pipeline details ............................................................................................................................... 27
Table 2-8: Road gantry details ......................................................................................................................... 27
Table 2-9: Chemical Properties ........................................................................................................................ 28
Table 2-10: BOG parameters at RU skid battery limit ......................................................................................... 29
Table 2-11: Temperature and pressure conditions of service and fire water ........................................................ 29
Table 2-12: Temperature and pressure conditions of potable water .................................................................... 30
Table 2-13: Temperature and pressure conditions of fresh water at terminal battery limit .................................... 30
Table 2-14: Quality of freshwater .................................................................................................................... 30
Table 2-15: Water consumption and wastewater generation details ................................................................... 31
Table 2-16: Design inlet & outlet characteristics of STP ..................................................................................... 34
Table 2-17: List of STP units with capacity & adequacy ..................................................................................... 34
Table 2-18: Temperature & pressure of nitrogen .............................................................................................. 36
Table 2-19: Details of instrument air & plant air ................................................................................................ 36
Table 2-20: Temperature & pressure of diesel oil .............................................................................................. 36
Table 2-21: Hazardous waste generation .......................................................................................................... 37
Table 2-22: Other solid wastes ........................................................................................................................ 38
Table 3-1: Tidal condition................................................................................................................................ 48
Table 3-2: Analysis method for marine water .................................................................................................... 51
Table 3-3: High Tide (Surface Water) during winter 2018 .................................................................................. 51
Table 3-4: High tide (bottom water) during winter 2018 .................................................................................... 52
Table 3-5: Low tide (surface water) during winter 2018 .................................................................................... 53
Table 3-6: Low tide (Bottom Water) during winter 2018 .................................................................................... 53
Table 3-7: Sediment analysis ........................................................................................................................... 65
Table 3-8: Sediment heavy metals analysis (all analysis was done with 1 g dry wt. of sediment) .......................... 66
Table 3-9: Observed benthic fauna in marine sediments .................................................................................... 74
Table 3-10: Pigments in High Tide (Surface Water) during winter 2018 .............................................................. 75

ESSAR BULK TERMINAL LTD.
MARINE ENVIRONMENTAL EVALUATION FOR
PROPOSED LNG TERMINAL AT HAJIRA, GUJARAT PROJECT DESCRIPTION
CSIR-CENTRAL SALT AND MARINE CHEMICALS RESEARCH INSTITUTE
KADAM ENVIRONMENTAL CONSULTANTS | OCTOBER 2018 8
Table 3-11: Pigments in High Tide (Bottom Water) during winter 2018 ............................................................... 76
Table 3-12: Pigments in Low Tide (Surface Water) during winter 2018 ............................................................... 76
Table 3-13: Pigments in Low Tide (Bottom Water) during winter 2018 ............................................................... 76
Table 3-14: Both phytoplankton and zooplankton collected from different sampling stations ................................ 76
Table 3-15: Microbiology of seawater (high tide) during winter 2018 .................................................................. 77
Table 3-16: Microbiology of seawater (low tide) during winter 2018 ................................................................... 78
Table 3-17: Microbiology of sediments (High Tide) during winter 2018 ............................................................... 78
Table 3-18: Microbiology of sediments (Low Tide) during winter 2018 ................................................................ 78
Table 3-19: Marine fish production for the year 2016-17 ................................................................................... 79
Table 3-20: Marine fish production for the year 2016-17 ................................................................................... 79
Table 4-1: Environmental impact and mitigation measures ................................................................................ 84
Table 5-1: Marine environmental monitoring programme ................................................................................... 89
Table 6-1: Tidal constituents at ADCP observation ............................................................................................ 92
Table 6-2: Current analysis for ADCP location ................................................................................................... 93
Table 7-1: Environmental management plan for water environment ................................................................. 117
Table 7-2: Environmental management plan for soil environment .................................................................... 118
Table 7-3: Environment management plan for biological environment .............................................................. 118
Table 8-1: Tide condition .............................................................................................................................. 121
ESSAR BULK TERMINAL LTD.
MARINE ENVIRONMENTAL EVALUATION FOR
PROPOSED LNG TERMINAL AT HAJIRA, GUJARAT PROJECT DESCRIPTION
CSIR-CENTRAL SALT AND MARINE CHEMICALS RESEARCH INSTITUTE
KADAM ENVIRONMENTAL CONSULTANTS | OCTOBER 2018 9
LIST OF FIGURES
Figure 2-1: General location map of the project site .......................................................................................... 17
Figure 2-2: Specific site location on satellite image ............................................................................................ 18
Figure 2-3: Existing port layout map ................................................................................................................ 20
Figure 2-4: Site layout map ............................................................................................................................. 21
Figure 2-5: Storm Water Network .................................................................................................................... 22
Figure 2-6: Unloading and regasification facilities process flow ........................................................................... 25
Figure 2-7: Water balance diagram .................................................................................................................. 33
Figure 2-8: Process block diagram of proposed STP .......................................................................................... 35
Figure 3-1: Sampling location map – marine environment.................................................................................. 42
Figure 3-2: Tapi estuary and Mindola creek ...................................................................................................... 43
Figure 3-3: NHO Chart number 2108 ................................................................................................................ 45
Figure 3-4: Bathymetry Chart of EBTL, Hajira channel ....................................................................................... 46
Figure 3-5: Offshore wind rose ........................................................................................................................ 47
Figure 3-6: Tide level ...................................................................................................................................... 48
Figure 3-7: Current measurement at different levels of water column ................................................................. 49
Figure 3-8: Current magnitudes in m/sec ......................................................................................................... 49
Figure 3-9: Seawater temperature measured at different stations ...................................................................... 55
Figure 3-10: Seawater pH measured at different stations .................................................................................. 55
Figure 3-11: TSS level at different stations ....................................................................................................... 56
Figure 3-12: Salinity level measured at different stations ................................................................................... 56
Figure 3-13: DO level measure at different stations ........................................................................................... 57
Figure 3-14: BOD level measured at different stations ....................................................................................... 58
Figure 3-15: PHc level measured at different stations ........................................................................................ 58
Figure 3-16: Phenol level measured at different stations .................................................................................... 59
Figure 3-17: Phosphate level measured at different stations .............................................................................. 60
Figure 3-18: Nitrate level measured at different stations .................................................................................... 60
Figure 3-19: Nitrite level measured at different stations ..................................................................................... 61
Figure 3-20: Ammonia level measured at different stations ................................................................................ 61
Figure 3-21: Cr concentration in water sample measured at different stations ..................................................... 62
Figure 3-22: Fe concentration in water sample measured at different stations ..................................................... 62
Figure 3-23: Ni concentration in water sample measured at different stations ..................................................... 63
Figure 3-24: Cu concentration in water sample measured at different stations .................................................... 63
ESSAR BULK TERMINAL LTD.
MARINE ENVIRONMENTAL EVALUATION FOR
PROPOSED LNG TERMINAL AT HAJIRA, GUJARAT PROJECT DESCRIPTION
CSIR-CENTRAL SALT AND MARINE CHEMICALS RESEARCH INSTITUTE
KADAM ENVIRONMENTAL CONSULTANTS | OCTOBER 2018 10
Figure 3-25: Zn concentration in water sample measured at different stations .................................................... 64
Figure 3-26: Cd concentration in water sample measured at different stations .................................................... 64
Figure 3-27: Pb concentration in water sample measured at different stations .................................................... 65
Figure 3-28: Cu concentration in sediment sample measured at different stations ............................................... 67
Figure 3-29: Ni concentration in sediment sample measured at different stations ................................................ 67
Figure 3-30: Al concentration in sediment sample measured at different stations ................................................ 67
Figure 3-31: Cr concentration in sediment sample measured at different stations ................................................ 68
Figure 3-32: Mn concentration in sediment sample measured at different stations ............................................... 68
Figure 3-33: Zn concentration in sediment sample measured at different stations ............................................... 69
Figure 3-34: Co concentration in sediment sample measured at different stations ............................................... 69
Figure 3-35: Pb concentration in sediment sample measured at different stations ............................................... 70
Figure 3-36: Cd concentration in sediment sample measured at different stations ............................................... 70
Figure 3-37: Fe concentration in sediment sample measured at different stations ................................................ 71
Figure 3-38: Sand quality of different stations .................................................................................................. 71
Figure 3-39: Silt content in different stations .................................................................................................... 72
Figure 3-40: Clay content in different stations ................................................................................................... 72
Figure 3-41: Bivalve and gastropod shell collected from benthic samples ............................................................ 74
Figure 6-1: M2 Tidal ellipse ............................................................................................................................. 93
Figure 6-2: Comparison of observed and reconstructed current velocity .............................................................. 94
Figure 6-3 : Numerical model grid .................................................................................................................... 96
Figure 6-4: Bathymetry of the area (NHO CHARTS + Port Channel).................................................................... 96
Figure 6-5: Simulated water level .................................................................................................................... 97
Figure 6-6: Validation of Current speed ............................................................................................................ 97
Figure 6-7: Spatial view of spring current in the channel ................................................................................... 98
Figure 6-8: Spatial view of neap current in the channel ..................................................................................... 99
Figure 6-9: Fuel oil concentration at the beginning of the spill started during ebb tide ....................................... 101
Figure 6-10: Fuel oil concentration after one hour of the spill started during ebb tide ........................................ 102
Figure 6-11: Fuel oil concentration after 5 hours of the spill started during ebb tide .......................................... 103
Figure 6-12: Fuel oil concentration after 10 hours of the spill started during ebb tide ......................................... 104
Figure 6-13: Fuel oil concentration after 24 hours of the spill started during ebb tide ......................................... 105
Figure 6-14: Fuel oil concentration at the beginning of the spill started during flood tide.................................... 106
Figure 6-15: Fuel oil concentration after one hour of the spill which started during flood tide ............................. 107
Figure 6-16: Fuel oil concentration after 5 hour of the spill which started during flood tide................................. 108
Figure 6-17: Fuel oil concentration after 10 hour of the spill which started during flood tide ............................... 109
ESSAR BULK TERMINAL LTD.
MARINE ENVIRONMENTAL EVALUATION FOR
PROPOSED LNG TERMINAL AT HAJIRA, GUJARAT PROJECT DESCRIPTION
CSIR-CENTRAL SALT AND MARINE CHEMICALS RESEARCH INSTITUTE
KADAM ENVIRONMENTAL CONSULTANTS | OCTOBER 2018 11
Figure 6-18: fuel oil concentration after 24 hour of the spill which started during flood tide ............................... 110
Figure 6-19: 2013 zero-contour line superimposed on NHO chart number 2108 ................................................ 112
Figure 6-20: 2015 zero-contour line superimposed on Google earth Image ....................................................... 113
Figure 6-21: 2016 zero-contour line superimposed on Google earth Image ....................................................... 114
Figure 6-22: Comparison of zero-contour lines corresponding to 2013 (blue), 2015 (green), 2016 (red) .............. 115
Figure 8-1: Tide level .................................................................................................................................... 122

ESSAR BULK TERMINAL LTD.
MARINE ENVIRONMENTAL EVALUATION FOR
PROPOSED LNG TERMINAL AT HAJIRA, GUJARAT DESCRIPTION OF ENVIRONMENT
CSIR-CENTRAL SALT AND MARINE CHEMICALS RESEARCH INSTITUTE
KADAM ENVIRONMENTAL CONSULTANTS | OCTOBER 2018 12
1 INTRODUCTION AND BACKGROUND
1.1 Purpose of the report
The proposed project is covered under project/ activity, 7(e) i.e. Ports, Harbours, Jetties, Marine Terminals,
Breakwaters and Dredging; also under Category A as per the schedule to the EIA Notification, 14th September 2006,
as amended till date. Hence, the project requires prior Environmental Clearance (EC) from the Ministry of
Environment, forest and Climate Change (MoEF&CC).
As per the Coastal Regulation Zone (CRZ) map prepared by National Institute of Ocean Technology (NIOT), the
project site is partly falling in CRZ II, hence CRZ clearance is also required for the project as per the CRZ
Notification 2011 amended till date.
Hence the purpose of this Environmental Impact Assessment (EIA) report is to comply with the Terms of
References (ToR) issued by MoEF&CC attached as Annexure 1 and importantly, to identify environmental impacts
in a timely manner and seek EC cum CRZ clearance for the proposed project, following the due process of law laid
down in the EIA notification 2006 (amended till date) and CRZ Notification 2011 (amended till date).
1.2 Identification of project proponent and project
1.2.1 About project proponent
Essar Bulk Terminal Limited (EBTL) is operating a captive Deep Draft Terminal at Hajira under Magdalla port of
Gujarat Maritime Board (GMB). Presently EBTL is operating 1450 meters of deep draft berth with a 7 km long
navigation channel with a turning circle of 600 m for handling bulk and break bulk cargo. Construction of additional
200 m berth length is under progress.
The EC for these developments was granted by the MoEF&CC in September 2007. Subsequently, in December 2007
the MoEF&CC gave EC for reclamation of 350 ha of the intertidal area to accommodate back-up facilities for the
Port by utilizing dredged material generated in dredging the navigational channel, turning circle, berth pockets etc.
Thereafter in May 2014 EBTL received environment clearance for expansion of port facility by 4800 m berth.
Accordingly, EBTL has commissioned 550 m berth in May 2010, whereas construction of 1100 m was started in
January 2016 and out of which 900 m is completed in October 2018 and rest 200 m will be completed by March
2019.
Environment and CRZ clearance was received on 6th May 2014 for expansion of EBTL port facility envisages
development of 4800 m berth length with back up storage yard. Breakup of 4800 m berth length is as follows:
Container and Break Bulk Berth (1100 m), General Cargo (700 m ), Liquid Cargo (500 m ) for handling of petroleum
products and chemicals, Bulk Berth (700 m), Offshore support vessel berth (500 m), Dry Dock and ship repair jetty
(700 m ) and Trestle berth of 600 m. Along with that, EBTL has also received the permissions for extending the
navigational channel from 6.2 to 17.6 km and deepening from 8 m to 16 m with broadening to 300-350 m and
reclamation of 334 hectares of land.
1.2.2 About the project
EBTL is planning to handle Liquefied Natural Gas (LNG) within 800 m berth starting from 100 m south of
operational 1150 m berth, LNG berth length will be ~400 m. Land required for the proposed project is ~17
hectares. GMB has already provided in principle allotment of 140 ha of Land to EBTL attached in Annexure 2.
Natural gas is a naturally occurring hydrocarbon gas mixture consisting primarily of methane.
ESSAR BULK TERMINAL LTD.
MARINE ENVIRONMENTAL EVALUATION FOR
PROPOSED LNG TERMINAL AT HAJIRA, GUJARAT DESCRIPTION OF ENVIRONMENT
CSIR-CENTRAL SALT AND MARINE CHEMICALS RESEARCH INSTITUTE
KADAM ENVIRONMENTAL CONSULTANTS | OCTOBER 2018 13
EBTL’s proposed LNG terminal will have a combination of floating and land based storage. Terminal will have
Regasification Unit (RU) to vaporize LNG into gas. LNG will be imported through LNG carrier and transferred to
Floating Storage Unit (FSU) through well-established ship to ship transfer mechanism using flexible hoses. Transfer
of LNG from FSU to the storage on land or RU will take place using fixed marine loading arms. LNG will be
regasified at RU using water or air. RU will be connected to gas grid through high pressure gas pipeline. In addition
to RU, road gantry facilities will be developed for transport of LNG in road tankers to end customers.
Essar Steel is presently operating a 10 MMTPA steel plant at Hajira. Out of this total capacity, 6.8 MMTPA of iron
making capacity is gas based which uses natural gas for reduction of iron ore to iron. Apart from Steel Plant, Essar
also has a 1015 MW gas based power plant at Hajira which requires gas. Total gas requirement of Essar for its steel
plant and power plant is 11 MMSCMD.
1.3 Brief description of the project
1.3.1 Nature of project
The proposed project will consist of storage tanks on land and floating storage unit of LNG within the existing Essar
Port boundary.
1.3.2 Products & its capacity
EBTL has envisaged to develop a 6 MMTPA LNG import terminal. LNG will be stored in a LNG carrier which will be
moored at jetty, this LNG carrier moored to jetty is referred as FSU. Apart from FSU there will be land based
storage as well. RU will be connected to the FSU/land based storage facilities through cryogenic pipeline and
unloading arms. FSU storage will be up to 266,000 cubic meter while land based storage facilities of 60,000 cubic
meter comprising of double walled atmospheric tank (~54,000 cbm capacity) and double walled pressurized bullets
(6 bullets of ~1,000 cbm each). Details for the same are provided in Chapter 2.
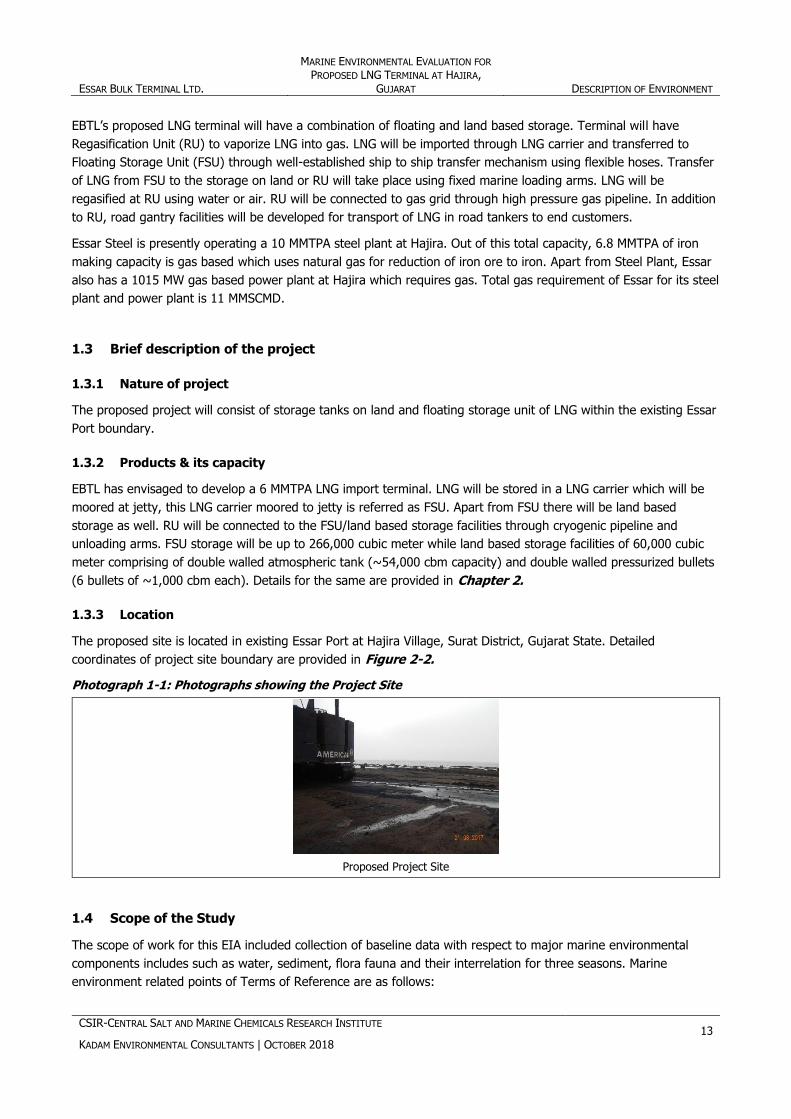
1.3.3 Location
The proposed site is located in existing Essar Port at Hajira Village, Surat District, Gujarat State. Detailed
coordinates of project site boundary are provided in Figure 2-2.
Photograph 1-1: Photographs showing the Project Site
Proposed Project Site
1.4 Scope of the Study
The scope of work for this EIA included collection of baseline data with respect to major marine environmental
components includes such as water, sediment, flora fauna and their interrelation for three seasons. Marine
environment related points of Terms of Reference are as follows:

ESSAR BULK TERMINAL LTD.
MARINE ENVIRONMENTAL EVALUATION FOR
PROPOSED LNG TERMINAL AT HAJIRA, GUJARAT DESCRIPTION OF ENVIRONMENT
CSIR-CENTRAL SALT AND MARINE CHEMICALS RESEARCH INSTITUTE
KADAM ENVIRONMENTAL CONSULTANTS | OCTOBER 2018 14
Submit the status of shore line change at the project site.
Submit the details of fishing activity and likely impacts on the fishing activity due to the project. Specific study
on effects of construction activity and pile driving on marine life.
Details of oil spill contingency plan.
Details of bathymetry study.
Details of ship tranquility study.
A detailed analysis of the physico-chemical and biotic components in the highly turbid waters round the project
site (as exhibited in the Google map shown during the presentation), compare it with the physico- chemical
and biotic components in the adjacent clearer (blue) waters both in terms of baseline and impact assessment
and draw up a management plan.
Apart from the terrestrial and fresh water biodiversity surveys, a detailed marine, estuarine and creek impact
assessment report and management plan, as applicable, shall be drawn up through the NIOS or any other
institute of repute on marine ecology and biodiversity. The report, to cover activities at the port and also the
activities related to the proposed storage, shall study the intertidal biotopes, corals and coral communities, sea
grasses and seaweeds, sub tidal habitats, fishes and other marine flora and fauna including, turtles, birds and
marine animals inclusive of mammals. Data collection and impact assessment shall be as per standard survey
methods. Special mention shall be made of the difference in temperatures in the sea water through discharge
of used sea water.

ESSAR BULK TERMINAL LTD.
MARINE ENVIRONMENTAL EVALUATION FOR
PROPOSED LNG TERMINAL AT HAJIRA, GUJARAT DESCRIPTION OF ENVIRONMENT
CSIR-CENTRAL SALT AND MARINE CHEMICALS RESEARCH INSTITUTE
KADAM ENVIRONMENTAL CONSULTANTS | OCTOBER 2018 15
2 PROJECT DESCRIPTION
This chapter provides a condensed description of those aspects of the project likely to cause environmental effects.
Details are described in following sections with regards to type, need, location, size or magnitude of project
operations, technology and other related activities.
2.1 Type of project
The proposed project is of development of LNG Terminal at Tapi Estuary at Hajira, Gujarat as given in Section 1.1
& 1.2 of Chapter 1.
2.2 Need for the project
Natural gas is a naturally occurring hydrocarbon gas mixture consisting primarily of methane. It is one of the
cleanest, safest, and most useful forms of energy in our day-to-day lives. It is an important source of energy for
power generation, industrial fuel requirements, feed for the fertilizer and also used as process material for various
industries like steel plant and petroleum refineries.
Natural gas has only a 6% share in total energy basket of India which is approximately one fourth of the world
average. India is keen to raise the share of natural gas in the primary energy basket to 15 % by 2030.
Approximately 50 percent of natural gas requirement is imported in the form of LNG. Considering the low
penetration of natural gas in the energy basket of India and dependence on LNG for availability of required natural
gas, India is a very prospective market for growth of LNG infrastructure, regasification and distribution market.
Natural gas/LNG compared to Diesel as a fuel have following environmental benefits:
Greenhouse gas emission for LNG is approx. 15% lower
NOx emission is 80% lower
Particulate emission is 75% lower
LNG spills does not require cleaning up of land as it evaporates and being lighter than air does not settles in
the lower atmosphere.
Due to lack of availability of gas, gas based power plants in India are currently either idle or operating at very low
capacity. Terminal will provide the necessary gas requirement for operation of these power plants subject to
financial viability with LNG.
Further, Essar Steel has a 6.8 MTPA gas based steel plant at Hajira which is operating at low utilization due to lack
of availability of gas. The terminal will provide requisite gas requirement for operation of the steel plant.
Hajira-Bijapur-Jagdishpur (HBJ) gas pipeline which originates from Gujarat transports gas to the nearby industrial
hinterland as well as various parts of India. HBJ pipeline has made south Gujarat a highly attractive location for
LNG import terminals as well and that is the reason why India’s first two LNG import terminals were developed in
the region at Hajira and Dahej.
Considering the attractiveness of the location, huge untapped gas demand of nearby industries and recent fall in
LNG prices, there is a strong case for development of a new LNG import terminal at Hajira.
The proposed LNG import terminal will be able to deliver an environment friendly fuel to the end consumer and
provide natural gas to sectors such as steel, fertilizer, power, refinery and city gas distribution thereby benefiting
the economy as a whole.

ESSAR BULK TERMINAL LTD.
MARINE ENVIRONMENTAL EVALUATION FOR
PROPOSED LNG TERMINAL AT HAJIRA, GUJARAT DESCRIPTION OF ENVIRONMENT
CSIR-CENTRAL SALT AND MARINE CHEMICALS RESEARCH INSTITUTE
KADAM ENVIRONMENTAL CONSULTANTS | OCTOBER 2018 16
2.3 Location (maps showing general location, specific location, project boundary & project site
layout)
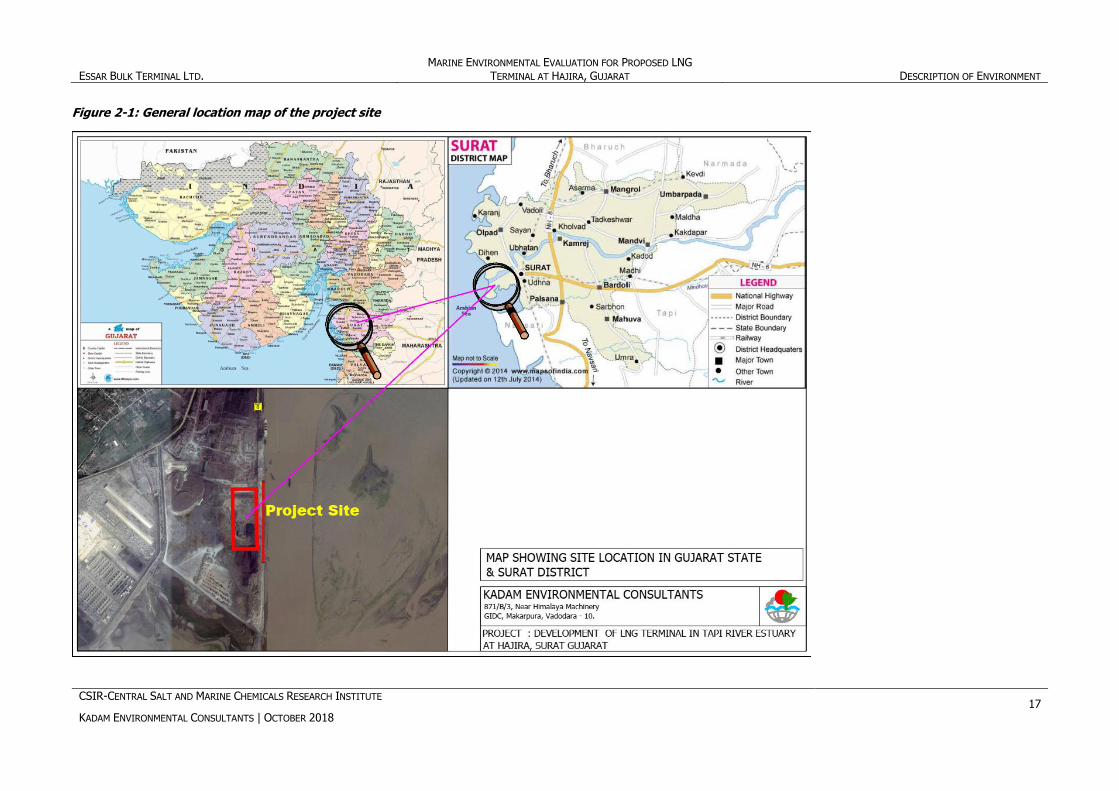
2.3.1 General location of the site
The site is at Hajira. Hajira is situated 230 km north of Mumbai, 30 km from Surat city, access is via National
Highways 6 and 8 and Surat domestic airport. Figure 2-1 shows general location map of the project site.
2.3.2 Specific location of site & project boundary
The proposed LNG terminal and associated facilities will be developed on reclaimed land of existing Essar Port
boundary. Proposed project site boundary on satellite image is provided in Figure 2-2 shows specific location of
site.
ESSAR BULK TERMINAL LTD. MARINE ENVIRONMENTAL EVALUATION FOR PROPOSED LNG
TERMINAL AT HAJIRA, GUJARAT DESCRIPTION OF ENVIRONMENT
CSIR-CENTRAL SALT AND MARINE CHEMICALS RESEARCH INSTITUTE
KADAM ENVIRONMENTAL CONSULTANTS | OCTOBER 2018 17
Figure 2-1: General location map of the project site

ESSAR BULK TERMINAL LTD. MARINE ENVIRONMENTAL EVALUATION FOR PROPOSED LNG
TERMINAL AT HAJIRA, GUJARAT DESCRIPTION OF ENVIRONMENT
CSIR-CENTRAL SALT AND MARINE CHEMICALS RESEARCH INSTITUTE
KADAM ENVIRONMENTAL CONSULTANTS | OCTOBER 2018 18
Figure 2-2: Specific site location on satellite image
ESSAR BULK TERMINAL LTD.
MARINE ENVIRONMENTAL EVALUATION FOR
PROPOSED LNG TERMINAL AT HAJIRA, GUJARAT DESCRIPTION OF ENVIRONMENT
CSIR-CENTRAL SALT AND MARINE CHEMICALS RESEARCH INSTITUTE
KADAM ENVIRONMENTAL CONSULTANTS | OCTOBER 2018 19
2.3.3 Approach and connectivity to facility
Hajira is situated 230 km north of Mumbai, 30 km from Surat city, access is via National Highways 6 and 8 and
Surat domestic airport.
By road
Four/Six-lane project of NH-6 is underway and widening of the road with flyover on KRIBHCO and ONGC railway line
at Hajira is under construction.
By rail
Surat railway station is just ~40 Km away from Hajira and located on the important broad gauge route that runs
between Delhi and Mumbai. This route has double tracks, completely electrified and the tracks are designed to
handle faster trains thus ensuring that transportation of cargo are both faster and more efficient as compared with
other rail routes.
By air
Hajira is ~30 km from Surat city and can be accessed via Surat domestic airport.
2.4 Size or magnitude of operation
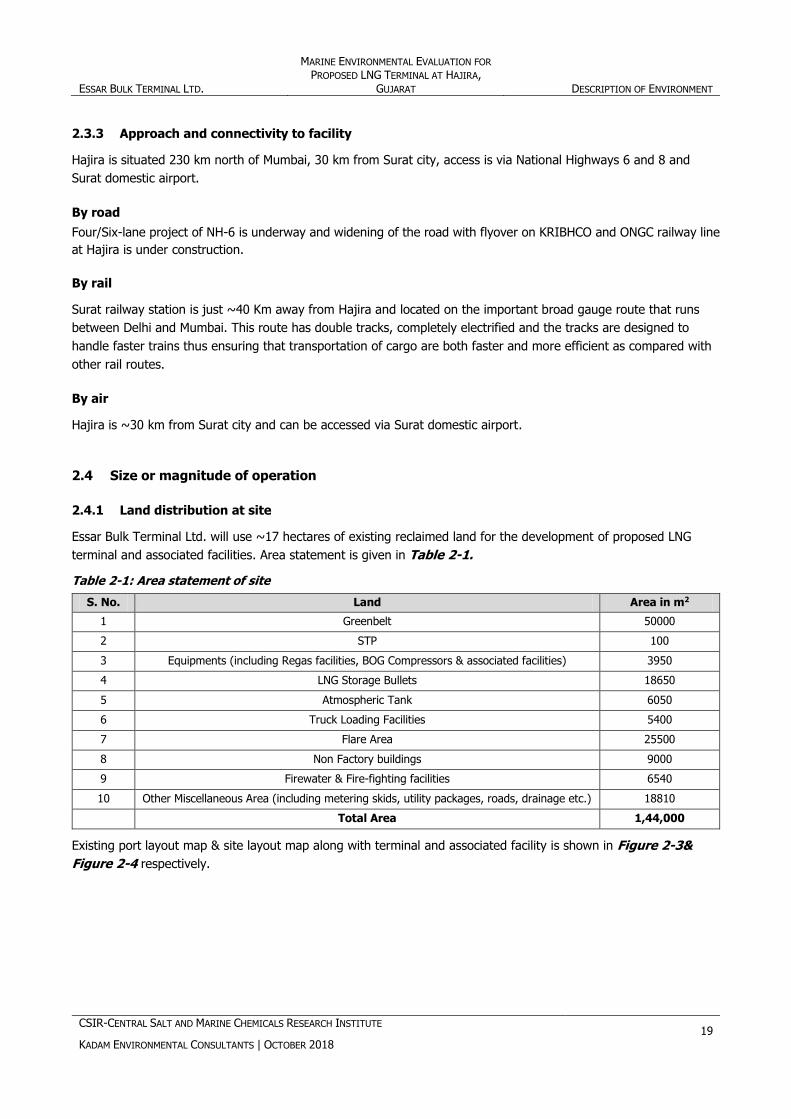
2.4.1 Land distribution at site
Essar Bulk Terminal Ltd. will use ~17 hectares of existing reclaimed land for the development of proposed LNG
terminal and associated facilities. Area statement is given in Table 2-1.
Table 2-1: Area statement of site
S. No. Land Area in m2
1 Greenbelt 50000
2 STP 100
3 Equipments (including Regas facilities, BOG Compressors & associated facilities) 3950
4 LNG Storage Bullets 18650
5 Atmospheric Tank 6050
6 Truck Loading Facilities 5400
7 Flare Area 25500
8 Non Factory buildings 9000
9 Firewater & Fire-fighting facilities 6540
10 Other Miscellaneous Area (including metering skids, utility packages, roads, drainage etc.) 18810
Total Area 1,44,000
Existing port layout map & site layout map along with terminal and associated facility is shown in Figure 2-3&
Figure 2-4 respectively.

ESSAR BULK TERMINAL LTD.
MARINE ENVIRONMENTAL EVALUATION FOR
PROPOSED LNG TERMINAL AT HAJIRA, GUJARAT DESCRIPTION OF ENVIRONMENT
CSIR-CENTRAL SALT AND MARINE CHEMICALS RESEARCH INSTITUTE
KADAM ENVIRONMENTAL CONSULTANTS | OCTOBER 2018 20
Figure 2-3: Existing port layout map
ESSAR BULK TERMINAL LTD. MARINE ENVIRONMENTAL EVALUATION FOR PROPOSED LNG TERMINAL AT HAJIRA, GUJARAT DESCRIPTION OF ENVIRONMENT
CSIR-CENTRAL SALT AND MARINE CHEMICALS RESEARCH INSTITUTE
KADAM ENVIRONMENTAL CONSULTANTS | OCTOBER 2018 21
Figure 2-4: Site layout map

ESSAR BULK TERMINAL LTD. MARINE ENVIRONMENTAL EVALUATION FOR PROPOSED LNG TERMINAL AT HAJIRA, GUJARAT DESCRIPTION OF ENVIRONMENT
CSIR-CENTRAL SALT AND MARINE CHEMICALS RESEARCH INSTITUTE
KADAM ENVIRONMENTAL CONSULTANTS | OCTOBER 2018 22
Figure 2-5: Storm Water Network
ESSAR BULK TERMINAL LTD.
MARINE ENVIRONMENTAL EVALUATION
FOR PROPOSED LNG TERMINAL AT
HAJIRA, GUJARAT DESCRIPTION OF ENVIRONMENT
CSIR-CENTRAL SALT AND MARINE CHEMICALS RESEARCH INSTITUTE
KADAM ENVIRONMENTAL CONSULTANTS | OCTOBER 2018 23
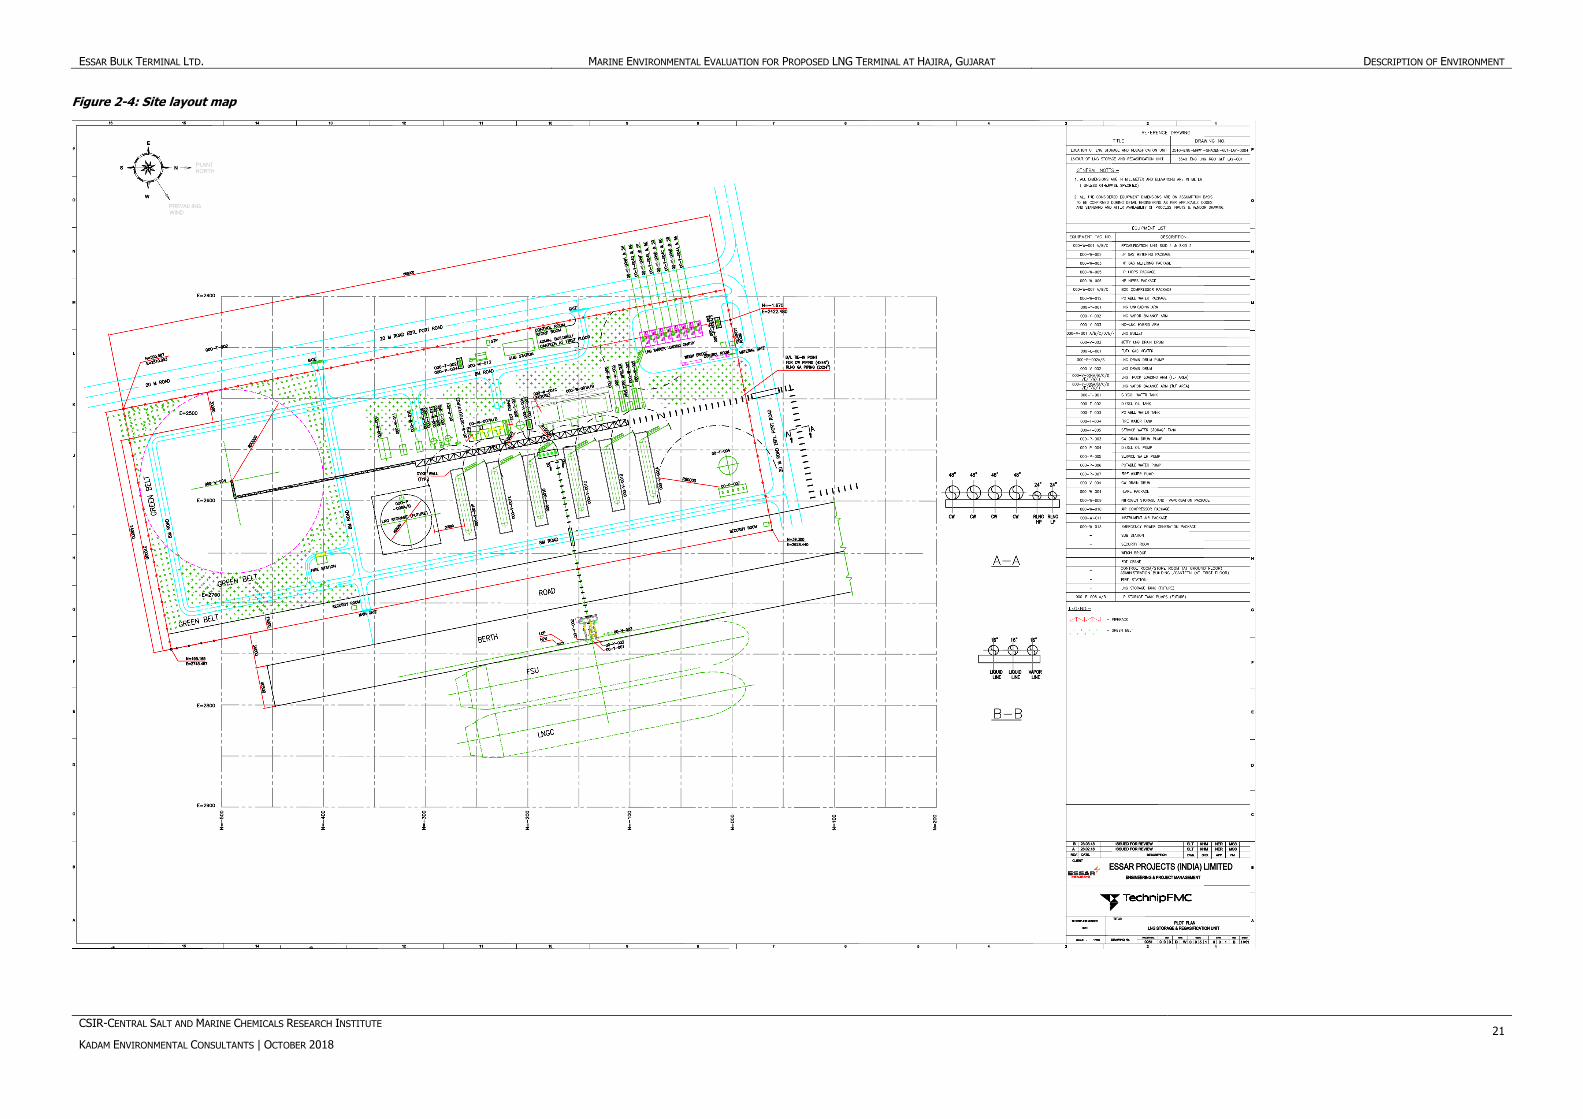
Map 2-1: Contour Map

ESSAR BULK TERMINAL LTD.
MARINE ENVIRONMENTAL EVALUATION FOR
PROPOSED LNG TERMINAL AT HAJIRA, GUJARAT DESCRIPTION OF ENVIRONMENT
CSIR-CENTRAL SALT AND MARINE CHEMICALS RESEARCH INSTITUTE
KADAM ENVIRONMENTAL CONSULTANTS | OCTOBER 2018 24
2.4.2 Magnitude of site
Size of the project is defined in Section 2.1 of this chapter
2.5 Proposed schedule for approval and implementation
Table 2-2: Project implementation schedule
2.6 Brief description of the project
2.6.1 Development of FSU and land based LNG terminal
EBTL has envisaged to develop a 6 MMTPA LNG import terminal. LNG will be stored in a LNG carrier which will be
moored at jetty, this LNG carrier moored to jetty is referred as FSU. Apart from FSU there will be land based
storage as well. RU will be connected to the FSU/land based storage facilities through cryogenic pipeline and
unloading arms. RU will be connected togas grid, Essar steel and Essar power via pipeline. Part of waterfront will be
utilized for mooring of FSU and will be available to EBTL for the dedicated use for handling LNG.The LNG will be
imported to Hajira via LNG carriers.
EBTL has developed a 7 km long navigational channel for movement of ships and currently 14 m draft vessels are
being berthed at EBTL using tide. Draft of largest LNG carriers is 12m-12.5m hence draft at the navigational
channel is sufficient for berthing of LNG carriers. LNG will be unloaded from LNG carrier to FSU through flexible
hoses which is a standard practice for ship to ship transfer. The LNG will then be transferred from FSU to land
based storage/RU via fixed loading arms and cryogenic pipelines.
FSU storage will be up to 266,000 cubic meter while land based storage facilities will be of 60,000 cubic meter
comprising of double walled atmospheric tank and double walled pressurized bullets. LNG will either flow directly
from FSU to RU or first flow to land based storage facilities and from land based storage facilities to RU.
RU of 750 MMSCFD capacity will be installed on the land and fresh water from the power plant of Essar Power
Hajira Limited which will be ~ 7 km away from proposed LNG terminal, will be used to vaporize the LNG and cooled
water will be returned back to power plant. Through this process there will neither be any consumption of water
nor any discharge of water into any water bodies during the regasification process. In addition to fresh water,
ambient air may also be used for vaporization of LNG.
Once the LNG is regasified, it will be transported to Essar Steel and Essar Power as well as other party customers
connected to the grid. Pipeline connectivity to the gas grid is already in place till the Essar Steel unit.
In addition to RU, road gantry facilities will be developed for transport of LNG in road tankers to end customers.
ESSAR BULK TERMINAL LTD.
MARINE ENVIRONMENTAL EVALUATION FOR
PROPOSED LNG TERMINAL AT HAJIRA, GUJARAT DESCRIPTION OF ENVIRONMENT
CSIR-CENTRAL SALT AND MARINE CHEMICALS RESEARCH INSTITUTE
KADAM ENVIRONMENTAL CONSULTANTS | OCTOBER 2018 25
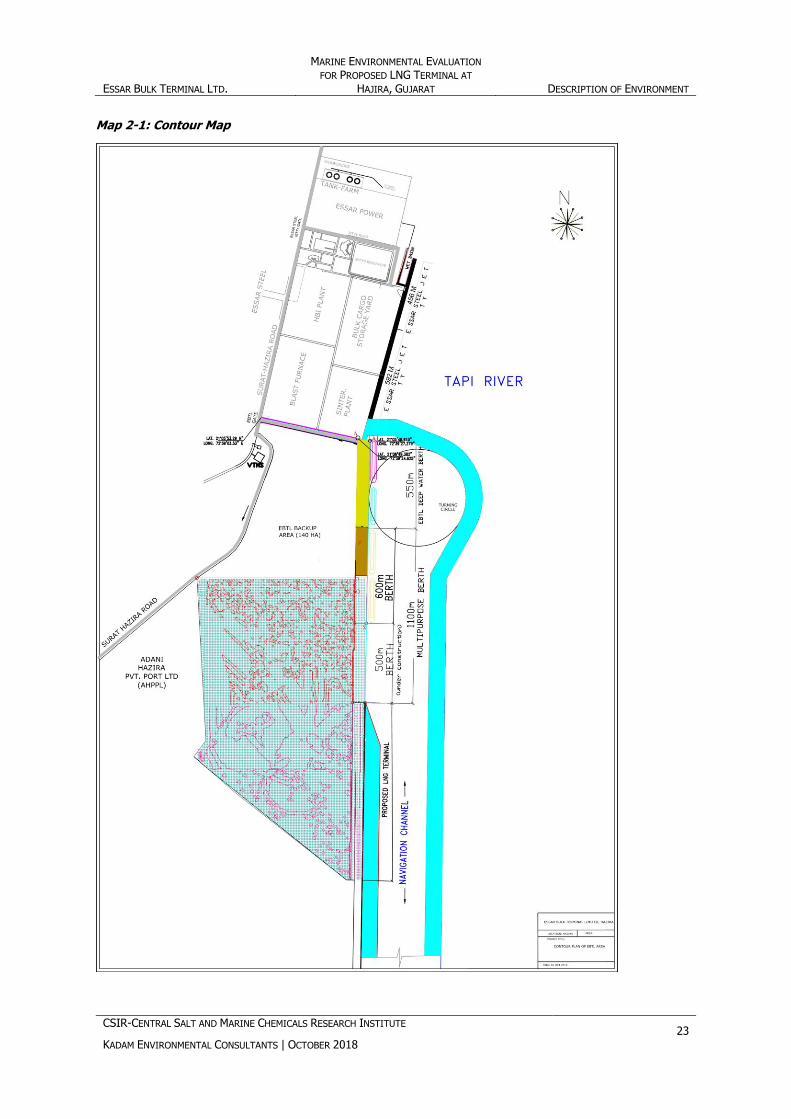
2.6.2 Details of project
LNG terminal description
The LNG Terminal shall also be provided with Skid mounted BOG Compressor Package, Marine Loading Arms, RLNG
metering Skid (for HP & LP Headers), Truck loading Bays, Flare system and I&C system for the entire Terminal.
Figure 2-6: Unloading and regasification facilities process flow
Key facilities/equipment for the proposed LNG terminal is given in Section 2.6 of Chapter 2.
Truck traffic data
• Time to load truck = ~40 minutes
• Time to position truck (between earlier truck leaving & new truck entering the bay) = ~20 minutes
• Total time to load one truck = ~60 minutes
• Therefore, in 1 day = 24 trucks can be loaded per bay
• Size of each truck = 17.5 MT
• Truck loading capacity per annum = (17.5 MT per truck) X (24 trucks per bay per day) X 8 bays X (330 days
per yr) X 70 % efficiency = ~0.78 MTPA
• Trucks loaded per day = (24 trucks per bay per day) X 8 bays X 70 % efficiency =~135 trucks per day = ~5.6
trucks per hour
Based on above calculations and presence of 8 bays, there are sufficient utilities for truck loading and no
congestion of trucks/traffic is envisaged to meet the desired capacity.
2.6.3 LNG storage facilities
The FSU will be another LNGC vessel which will be leased and will have capacity up to 266,000 cubic meters. The
storage tanks on the FSU may be walled or membrane type tanks where LNG will be stored at approximately – 161
– 165 oC. The FSU will be moored to the Jetty. Additionally, land based storage facilities of 60,000 cubic meters
comprising of double walled atmospheric tank (~54,000 cbm) and double walled pressurized bullets (~6,000 cbm)
may be developed. Land based storage tank details are given in Table 2-3. Floating storage unit detail are given in
Table 2-4 . Chemical properties of LNG is given in Table 2-9.
ESSAR BULK TERMINAL LTD.
MARINE ENVIRONMENTAL EVALUATION FOR
PROPOSED LNG TERMINAL AT HAJIRA, GUJARAT DESCRIPTION OF ENVIRONMENT
CSIR-CENTRAL SALT AND MARINE CHEMICALS RESEARCH INSTITUTE
KADAM ENVIRONMENTAL CONSULTANTS | OCTOBER 2018 26
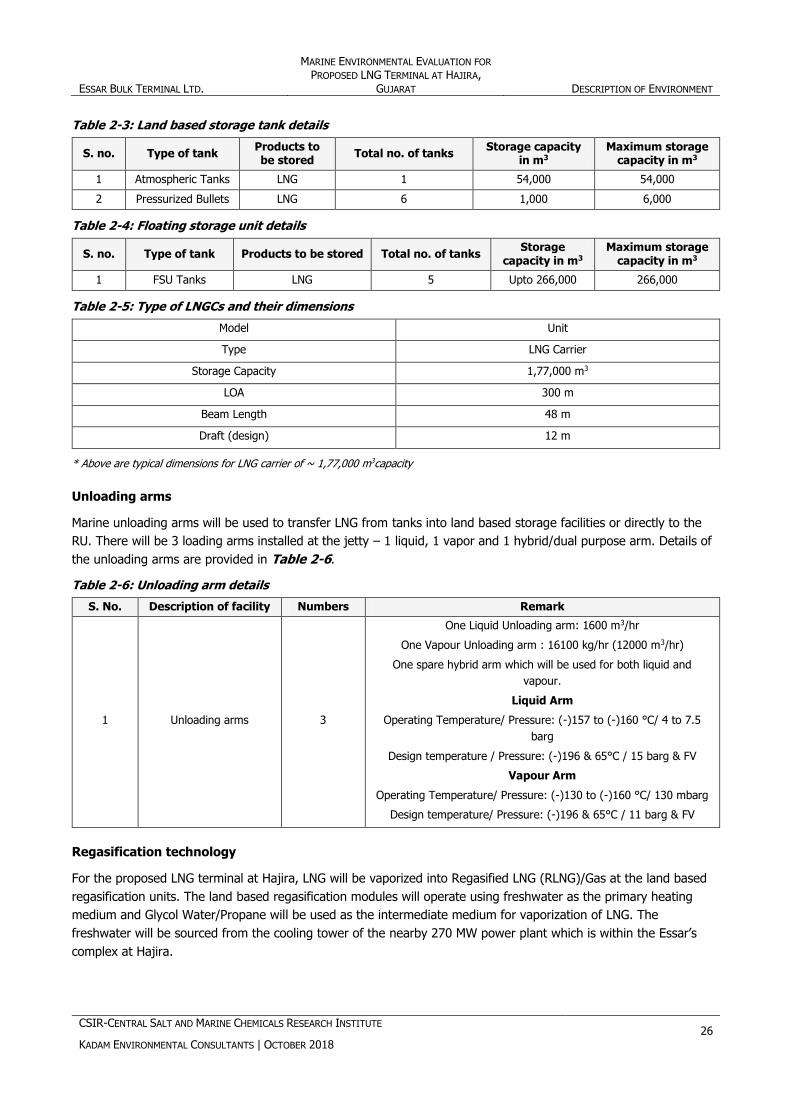
Table 2-3: Land based storage tank details
S. no. Type of tank Products to be stored
Total no. of tanks Storage capacity
in m3 Maximum storage
capacity in m3
1 Atmospheric Tanks LNG 1 54,000 54,000
2 Pressurized Bullets LNG 6 1,000 6,000
Table 2-4: Floating storage unit details
S. no. Type of tank Products to be stored Total no. of tanks Storage
capacity in m3 Maximum storage
capacity in m3
1 FSU Tanks LNG 5 Upto 266,000 266,000
Table 2-5: Type of LNGCs and their dimensions
Model Unit
Type LNG Carrier
Storage Capacity 1,77,000 m3
LOA 300 m
Beam Length 48 m
Draft (design) 12 m
* Above are typical dimensions for LNG carrier of ~ 1,77,000 m3capacity
Unloading arms
Marine unloading arms will be used to transfer LNG from tanks into land based storage facilities or directly to the
RU. There will be 3 loading arms installed at the jetty – 1 liquid, 1 vapor and 1 hybrid/dual purpose arm. Details of
the unloading arms are provided in Table 2-6.
Table 2-6: Unloading arm details
S. No. Description of facility Numbers Remark
1 Unloading arms 3
One Liquid Unloading arm: 1600 m3/hr
One Vapour Unloading arm : 16100 kg/hr (12000 m3/hr)
One spare hybrid arm which will be used for both liquid and
vapour.
Liquid Arm
Operating Temperature/ Pressure: (-)157 to (-)160 °C/ 4 to 7.5
barg
Design temperature / Pressure: (-)196 & 65°C / 15 barg & FV
Vapour Arm
Operating Temperature/ Pressure: (-)130 to (-)160 °C/ 130 mbarg
Design temperature/ Pressure: (-)196 & 65°C / 11 barg & FV
Regasification technology
For the proposed LNG terminal at Hajira, LNG will be vaporized into Regasified LNG (RLNG)/Gas at the land based
regasification units. The land based regasification modules will operate using freshwater as the primary heating
medium and Glycol Water/Propane will be used as the intermediate medium for vaporization of LNG. The
freshwater will be sourced from the cooling tower of the nearby 270 MW power plant which is within the Essar’s
complex at Hajira.

ESSAR BULK TERMINAL LTD.
MARINE ENVIRONMENTAL EVALUATION FOR
PROPOSED LNG TERMINAL AT HAJIRA, GUJARAT DESCRIPTION OF ENVIRONMENT
CSIR-CENTRAL SALT AND MARINE CHEMICALS RESEARCH INSTITUTE
KADAM ENVIRONMENTAL CONSULTANTS | OCTOBER 2018 27
Terminal capacity
Terminal capacity is governed by the capacity of the regasification units. Terminal will be developed with 750
MMSCFD of regasification capacity:
3 skids of 250 MMSCFD each
Each skid comprises of 2 trains of 125 MMSCFD each for regasification of both rich and lean LNG.
Each RU train will be complete with high pressure pumps, LNG vaporizers and intermediate fluid circulation.
Systems and pumps and heat exchangers.
Each RU train will be designed to operate between 40% to 100% of the design capacity for the given range of
battery limit pressures.
Pipeline details
Pipeline details are given in Table 2-7.
Table 2-7: Pipeline details
S. No. Route of pipeline Numbers Remark
1 Freshwater pipeline from Essar Power Hajira Limited (EPHL)
to terminal and return back to power plant 4 4 X 48” pipelines
2 Gas Pipelines to Essar Steel/Essar Power/Gas grid of GSPL,
GAIL, RGTIL 2 2 X 24” pipelines
3 LNG/BOG lines from Jetty to Land Based Storage facilities 3 2 X 16” (Liquid lines)
1 X 16” (vapour line)
Road gantry details
Road gantry facilities will be developed to deliver LNG via road to end consumers. Key details are as follows:
Table 2-8: Road gantry details
S. No. Description of facility Remark
1 Truck loading facilities
8 Nos. of loading stations of design capacity: 70 m3 per hour each
Operating Temperature/ Pressure: (-)157 to (-) 160°C /1.5 to 2 bar g
Design Temperature/ Pressure: (-)196°C & 65°C /15 barg & FV

ESSAR BULK TERMINAL LTD. MARINE ENVIRONMENTAL EVALUATION FOR PROPOSED LNG TERMINAL AT HAJIRA, GUJARAT DESCRIPTION OF ENVIRONMENT
CSIR-CENTRAL SALT AND MARINE CHEMICALS RESEARCH INSTITUTE
KADAM ENVIRONMENTAL CONSULTANTS | OCTOBER 2018 28
Table 2-9: Chemical Properties
S. No Raw Materials/
Products
Composition
(mol %) CAS Number State Colour Odour
Mol. Wt. (g/mole)
Flash Point
(oC)
Melting Point
(oC)
Boiling Point (oC)
IDLH (ppm)
Stability Hazard
Specific Gravity
at 68 0F (g/cc)
LEL % UEL
%
1 LNG (Lean)
CH4 = 97.7
C2H6= 1.8
C3H8 = 0.2
C4H10 + = 0.2
N2= 0.1
74−82−8 Liquid Colourless
Odourless 16.4 -188 NA
-163 to -
65.74
( TBP)
NA Normally
stable
Flammability -4
Health-1
Instability-0
0.427 4.3 17
2 LNG (Rich)
CH4 = 81.6
C2H6= 13.4
C3H8 = 3.7
C4H10 = 0.7
N2= 0.7
74−82−8 Liquid Colourless Odourless 19.3 -188 NA
-175.6 to -
23.56
( TBP)
NA Normally
stable
Flammability -4
Health-1
Instability-0
0.485 3.7 16.4

ESSAR BULK TERMINAL LTD. DEVELOPMENT OF LNG TERMINAL AT
HAJIRA, DISTRICT SURAT, GUJARAT PROJECT DESCRIPTION
CSIR-CENTRAL SALT AND MARINE CHEMICALS RESEARCH INSTITUTE
KADAM ENVIRONMENTAL CONSULTANTS | OCTOBER 2018 29
2.7 Associated utilities facilities
Utilities include power, instrument & plant air, nitrogen, diesel oil, service water & firewater, potable water,
freshwater for operating the proposed LNG terminal at Hajira.
2.7.1 Power requirement
For normal use, power will be sourced from Essar Power plant at Hajira and the power will be available at the
terminal at battery limit. For emergency power, emergency diesel generator shall be considered.
Power requirement for the entire terminal (Regasification Units & associated pumps, BOG compressors, LP Pumps
and miscellaneous equipment such as valves, motors etc.) is estimated to be ~ 15.7 MW.
2.7.2 Emissions details
Boil off gas
Boil off gas (BOG) which is primarily generated in the FSU and land based storage facilities will be sent via BOG Compressors to the Regasification units where the BOG will be recondensed into LNG.
Table 2-10: BOG parameters at RU skid battery limit
BOG Operating / Design
pressure at RGU Skids B/L 5 barg to 6.5 barg / 10 barg
BOG Operating / Design
temperature at RGU Skids B/L (-) 2 to 67°C / (-) 46 to 120°C
BOG Composition Lean LNG Rich LNG
Methane 0.9845 0.8739
Ethane 0 0.0003
Propane 0 0
Nitrogen 0.0155 0.1258
i-butane 0 0
n-butane 0 0
2.7.3 Details of water and wastewater
Service water and fire water
The service water shall be provided from service water storage tank, located at LNG terminal. The service water
storage tank shall be loaded from water tanker. Water tankers shall also be used to fill fire water tanks. The service
water tank shall be provided with service water pumps feeding service water to various water.
Table 2-11: Temperature and pressure conditions of service and fire water
Service water Unit Value
Pressure
kg/cm2g
-
Normal 2.5
Design 10
Temperature
°C
-
Normal 32
Design 65
Fire water system shall consist of electric motor driven fire water jockey pumps, diesel engine driven main fire
water pumps, fire water tanks, fire water hydrants, and water sprinklers etc.

ESSAR BULK TERMINAL LTD. DEVELOPMENT OF LNG TERMINAL AT
HAJIRA, DISTRICT SURAT, GUJARAT PROJECT DESCRIPTION
CSIR-CENTRAL SALT AND MARINE CHEMICALS RESEARCH INSTITUTE
KADAM ENVIRONMENTAL CONSULTANTS | OCTOBER 2018 30
Potable water
Potable water shall be the water sourced from service water tank and treated with RO. Potable water shall be
supplied through potable water pumps to eyewash showers in the plant and also to the buildings.
Table 2-12: Temperature and pressure conditions of potable water
Potable water Unit Value
Pressure
kg/cm2g
-
Normal 2.5
Design 10
Temperature
°C
-
Normal 32
Design 65
The potable water consumption shall be based on 100 persons’ water consumption per day.
Freshwater
Table 2-13: Temperature and pressure conditions of fresh water at terminal battery limit
Fresh water Unit Supply Return
Pressure
barg
Normal 4 (min) , 5 (Normal) 2.5 (min), 3.5 (Normal)
Design 12
Temperature
°C
Normal 30 (min), 45 (Max) 15 (min)
Design 65
Table 2-14: Quality of freshwater
Cooling water (Circulating water) parameters
Sr. No. Parameter UOM Result
1 pH 9.30 - 9.60
2 Conductivity µS/cm 3500 – 4000
3 Total Hardness Ppm 30 - 40
4 Chloride Ppm 550 - 650
5 Turbidity NTU < 10
6 Chlorine Di-Oxide Ppm 0.2 - 0.3
Alternatively, seawater can be used for vaporization of LNG.
Water consumption and wastewater generation details
Source of water supply
The required water for the proposed project will be met from ESSAR Port.
Water consumption and wastewater generation for proposed unit
In the proposed LNG Terminal water will be mainly used in following areas:
Domestic Usage
Fire Fighting
Regasification process
Washing and

ESSAR BULK TERMINAL LTD. DEVELOPMENT OF LNG TERMINAL AT
HAJIRA, DISTRICT SURAT, GUJARAT PROJECT DESCRIPTION
CSIR-CENTRAL SALT AND MARINE CHEMICALS RESEARCH INSTITUTE
KADAM ENVIRONMENTAL CONSULTANTS | OCTOBER 2018 31
Other process
The breakup of water consumption and wastewater generation from the proposed unit is described in Table 2-15
and balance diagram is presented in Figure 2-7.
Table 2-15: Water consumption and wastewater generation details
Sr. No.
Area of Water Consumption
Basis for Water Calculations
Water Requirement
(KLD)
Wastewater Generation
(KLD) Treatment & Disposal Facility
1 Domestic (On-
board FSU)
No of
Workers/Employee
- 30 Nos. Water
demand - 135
LPCD
4 3
FSU will have an STP onboard which will
treat the Sewage and discharge will be
used in green belt of LNG Terminal.
Adequate storage capacity will be
proposed to storage treated sewage in
case of water is not use for gardening
due to heavy rain.
2
Washing and
Cleaning (On-
board FSU)
Randomly 20 20
Bilge water sent outside to authorized
Vendor for treatment and disposal facility.
M/s Jabrawala is authorised for treatment
and disposal of waste water.
3 Steam Turbine
(Boiler Capacity)
Make up Water
required for boiler 15 0.5
Blow down water to collection tank of
Terminal STP
4 Domestic (LNG
Terminal Area)
Consider
Evaporation loss
and mock drills
etc.
10 9
Treated in STP to be provided in LNG
Terminal Area and treated sewage will be
used for gardening / green belt
development.
Adequate storage capacity will be
proposed to storage treated sewage in
case of water is not use for gardening
due to heavy rain.
5 Fire fighting
Consider
Evaporation loss
and mock drills
etc.
5 0 Make up in Fire Water Reservoir
6
Process Water
(Re-Gasification
of LNG)
8000 m3/hr 192000 192000
Quantity of 8000 cu.m per hr of
freshwater required for there-gasification
process which will be sourced from the
cooling towers of the neighbouring power
plants. The same will be used for cooling
and further sent back to the respective
power plant areas
8
Total Water
Consumption and
wastewater
Generation
- 192054 192032.5 -
9
Recycled Water
from
Regasification
process
- 192000 192000 -
10 Fresh water
Requirements - 54 32.5 -
ESSAR BULK TERMINAL LTD. DEVELOPMENT OF LNG TERMINAL AT
HAJIRA, DISTRICT SURAT, GUJARAT PROJECT DESCRIPTION
CSIR-CENTRAL SALT AND MARINE CHEMICALS RESEARCH INSTITUTE
KADAM ENVIRONMENTAL CONSULTANTS | OCTOBER 2018 32
Sr. No.
Area of Water Consumption
Basis for Water Calculations
Water Requirement
(KLD)
Wastewater Generation
(KLD) Treatment & Disposal Facility
/Wastewater
Generation

ESSAR BULK TERMINAL LTD. DEVELOPMENT OF LNG TERMINAL AT HAJIRA, DISTRICT SURAT,
GUJARAT PROJECT DESCRIPTION
CSIR-CENTRAL SALT AND MARINE CHEMICALS RESEARCH INSTITUTE
KADAM ENVIRONMENTAL CONSULTANTS | OCTOBER 2018 33
Figure 2-7: Water balance diagram

ESSAR BULK TERMINAL LTD.
MARINE ENVIRONMENTAL EVALUATION FOR
PROPOSED LNG TERMINAL AT HAJIRA, GUJARAT DESCRIPTION OF ENVIRONMENT
CSIR-CENTRAL SALT AND MARINE CHEMICALS RESEARCH INSTITUTE
KADAM ENVIRONMENTAL CONSULTANTS | OCTOBER 2018 34
Wastewater disposal
Wastewater mainly generated from domestic use from port area and from FSU unit.
The sewage generation from FSU unit will be treated in onboard STP plant and treated water will be used for
greenbelt development for LNG terminal. Conventional STP will be proposed at FSU unit.
The sewage generation from the terminal area will be treated in separate proposed STP at terminal area and
treated water will be used for gardening.
Treated water from FSU and terminal will be collected in retention tank and then it will be used for gardening.
Wastewater from regasification process is further send to ESSAR power plant.
2.7.4 Details of proposed sewage treatment plant at terminal area
Design basis inlet & outlet characteristics for proposed STP
STP will be proposed for 10 KLD capacity. The design Inlet & outlet characteristics of proposed STP is presented in
Table 2-16:
Table 2-16: Design inlet & outlet characteristics of STP
Sr. No. Name of plant Unit Design Inlet Characteristics for
STP Design Outlet Characteristics of
STP
1 Effluent quantity m3/day 10 10
2 pH mg/l 6.5 - 8.5 6.5 - 9.0
3 COD mg/l 600 <50
4 BOD mg/l 300 <10
5 TDS mg/l 800 <2100
6 SS mg/l 100 <20
List of STP units with capacity
The capacity of STP units with adequacy is prescribed in Table 2-17:
Table 2-17: List of STP units with capacity & adequacy
S. No. Unit Name No. of Unit Capacity (m3) Design Flow
(m3)
Retention Time (hr)
1 Sewage Collection Sump 1 3.05 10 7.3
2 MBR Tank (Aeration Tank) 1 4.78 10 11.5
3 Final Collection Tank 1 20.0 10 48
4 Sludge Drying Beds 1 1 m2 10 -
5 Chlorine Dosing Tank 1 100 lit -
Process description of STP
Collection sump – 1 no.
The sewage from septic tank system from plant will be collected in one collection tank via gravity from where it is
pumped further to the aeration tank with MBR system. A screen chamber will be provided upfront to the collection
tank.
ESSAR BULK TERMINAL LTD.
MARINE ENVIRONMENTAL EVALUATION FOR
PROPOSED LNG TERMINAL AT HAJIRA, GUJARAT DESCRIPTION OF ENVIRONMENT
CSIR-CENTRAL SALT AND MARINE CHEMICALS RESEARCH INSTITUTE
KADAM ENVIRONMENTAL CONSULTANTS | OCTOBER 2018 35
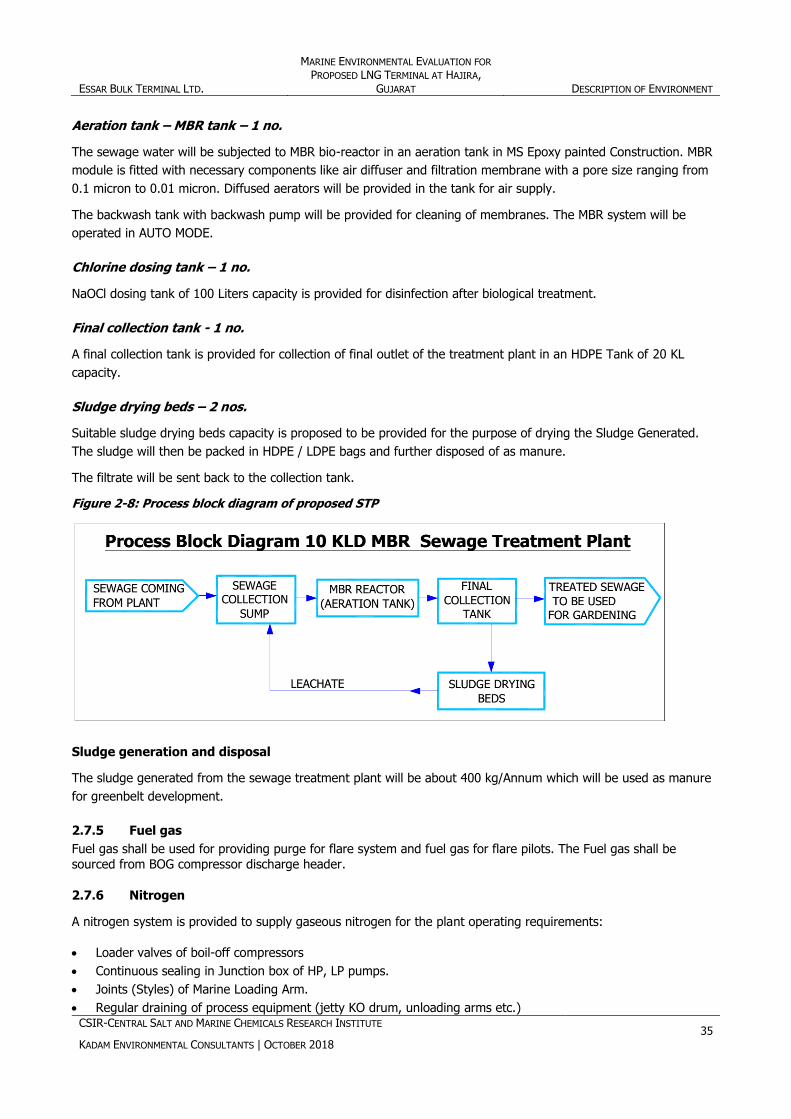
Aeration tank – MBR tank – 1 no.
The sewage water will be subjected to MBR bio-reactor in an aeration tank in MS Epoxy painted Construction. MBR
module is fitted with necessary components like air diffuser and filtration membrane with a pore size ranging from
0.1 micron to 0.01 micron. Diffused aerators will be provided in the tank for air supply.
The backwash tank with backwash pump will be provided for cleaning of membranes. The MBR system will be
operated in AUTO MODE.
Chlorine dosing tank – 1 no.
NaOCl dosing tank of 100 Liters capacity is provided for disinfection after biological treatment.
Final collection tank - 1 no.
A final collection tank is provided for collection of final outlet of the treatment plant in an HDPE Tank of 20 KL
capacity.
Sludge drying beds – 2 nos.
Suitable sludge drying beds capacity is proposed to be provided for the purpose of drying the Sludge Generated.
The sludge will then be packed in HDPE / LDPE bags and further disposed of as manure.
The filtrate will be sent back to the collection tank.
Figure 2-8: Process block diagram of proposed STP
Sludge generation and disposal
The sludge generated from the sewage treatment plant will be about 400 kg/Annum which will be used as manure
for greenbelt development.
2.7.5 Fuel gas
Fuel gas shall be used for providing purge for flare system and fuel gas for flare pilots. The Fuel gas shall be
sourced from BOG compressor discharge header.
2.7.6 Nitrogen
A nitrogen system is provided to supply gaseous nitrogen for the plant operating requirements:
Loader valves of boil-off compressors
Continuous sealing in Junction box of HP, LP pumps.
Joints (Styles) of Marine Loading Arm.
Regular draining of process equipment (jetty KO drum, unloading arms etc.)

ESSAR BULK TERMINAL LTD.
MARINE ENVIRONMENTAL EVALUATION FOR
PROPOSED LNG TERMINAL AT HAJIRA, GUJARAT DESCRIPTION OF ENVIRONMENT
CSIR-CENTRAL SALT AND MARINE CHEMICALS RESEARCH INSTITUTE
KADAM ENVIRONMENTAL CONSULTANTS | OCTOBER 2018 36
Continuous or intermittent purging (flare sweeping, arms swivel joints)
Plant maintenance (draining, dry-out and inerting of process lines and equipment)
Nitrogen generation system shall be considered with a 50 m3 Nitrogen storage bullet. Nitrogen shall be of 99.99 %
vol purity.
Table 2-18: Temperature & pressure of nitrogen
Nitrogen Unit Value
Pressure
Barg
Normal 6
Design 15
Temperature
°C
Normal >5
Design 65
2.7.7 Instrument air & plant air
Instrument air system is intended to supply instrument air to the Terminal as required for instruments, control
valves, on-off valves, compressor package and ignition air for flare pilots.
Table 2-19: Details of instrument air & plant air
Type Unit Plant air Instrument air
Dew point °C NA (-) 40 °C @ Atm.
Pressure
Barg
- -
Minimum 3 4
Normal 4 5
Maximum 5 6
Design 12 12
Temperature
°C
- -
Minimum - -
Normal 45 45
Maximum - -
Design 60 60
2.7.8 Diesel oil
A diesel storage tank shall be provided with pumps for supply of diesel to EMGD, Fire water Pump engines etc.
Table 2-20: Temperature & pressure of diesel oil
Diesel Oil Unit Value
Pressure
kg/cm2g
Normal 2.5
Design 10
Temperature
°C
Normal 32
Design 65
2.7.9 Flare system
The flare header conditions shall be as follows:
ESSAR BULK TERMINAL LTD.
MARINE ENVIRONMENTAL EVALUATION FOR
PROPOSED LNG TERMINAL AT HAJIRA, GUJARAT DESCRIPTION OF ENVIRONMENT
CSIR-CENTRAL SALT AND MARINE CHEMICALS RESEARCH INSTITUTE
KADAM ENVIRONMENTAL CONSULTANTS | OCTOBER 2018 37
Normal operating pressure : 0.1 barg
Maximum operating pressure: 1.7 barg
Following systems shall be connected to flare header:
Blow-down from LNG vaporizers
Relief from LNG Re-condenser
Relief from BOG compressors
Blow-down from LNG Tanks vapour system
Blow-down from Natural gas send out header
Blow down from LNG Storage facilities
Height of the flare stock shall be selected to meet the following criteria of CPCB, GSPCB, OISD and API 521. Also it
shall be decided based on the radiation contours.
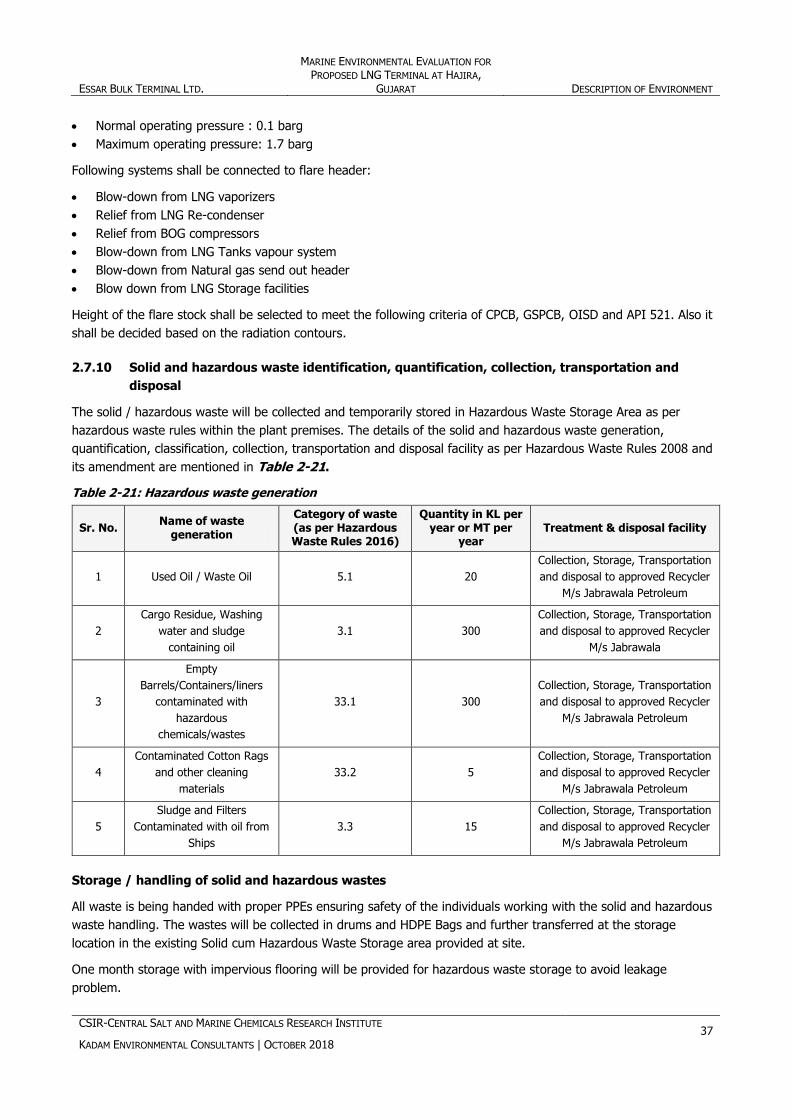
2.7.10 Solid and hazardous waste identification, quantification, collection, transportation and
disposal
The solid / hazardous waste will be collected and temporarily stored in Hazardous Waste Storage Area as per
hazardous waste rules within the plant premises. The details of the solid and hazardous waste generation,
quantification, classification, collection, transportation and disposal facility as per Hazardous Waste Rules 2008 and
its amendment are mentioned in Table 2-21.
Table 2-21: Hazardous waste generation
Sr. No. Name of waste
generation
Category of waste (as per Hazardous Waste Rules 2016)
Quantity in KL per year or MT per
year Treatment & disposal facility
1 Used Oil / Waste Oil 5.1 20
Collection, Storage, Transportation
and disposal to approved Recycler
M/s Jabrawala Petroleum
2
Cargo Residue, Washing
water and sludge
containing oil
3.1 300
Collection, Storage, Transportation
and disposal to approved Recycler
M/s Jabrawala
3
Empty
Barrels/Containers/liners
contaminated with
hazardous
chemicals/wastes
33.1 300
Collection, Storage, Transportation
and disposal to approved Recycler
M/s Jabrawala Petroleum
4
Contaminated Cotton Rags
and other cleaning
materials
33.2 5
Collection, Storage, Transportation
and disposal to approved Recycler
M/s Jabrawala Petroleum
5
Sludge and Filters
Contaminated with oil from
Ships
3.3 15
Collection, Storage, Transportation
and disposal to approved Recycler
M/s Jabrawala Petroleum
Storage / handling of solid and hazardous wastes
All waste is being handed with proper PPEs ensuring safety of the individuals working with the solid and hazardous
waste handling. The wastes will be collected in drums and HDPE Bags and further transferred at the storage
location in the existing Solid cum Hazardous Waste Storage area provided at site.
One month storage with impervious flooring will be provided for hazardous waste storage to avoid leakage
problem.

ESSAR BULK TERMINAL LTD.
MARINE ENVIRONMENTAL EVALUATION FOR
PROPOSED LNG TERMINAL AT HAJIRA, GUJARAT DESCRIPTION OF ENVIRONMENT
CSIR-CENTRAL SALT AND MARINE CHEMICALS RESEARCH INSTITUTE
KADAM ENVIRONMENTAL CONSULTANTS | OCTOBER 2018 38
Other solids wastes
Other solid waste generated from the proposed LNG terminal is given in Table 2-22.
Table 2-22: Other solid wastes
Sr. No. Name of waste
generation
Category of waste (as per
Hazardous Waste Rules
2016)
Existing quantity in TPA as per
consent conditions
Additional quantity in KL per year or MT
per year
Treatment & disposal facility
1 Municipal Solid Waste - - 36
Disposal to nearby
Common Solid
Waste Disposal
facility as per
present scenario
2 Bio-Medical Waste
There will be no OHC provided in the site premises. Only
ambulance and first aid facility is available. The facility of
common Hospital of ESSAR in the area which is present in the
Essar Colony is availed when required
3 E-Waste
E waste accounts for around 5% of total Municipal Solid
Waste. Inventory of E Waste is presently not practiced.
However in the proposed LNG terminal inventory of E waste
and E waste collection centres will be established in each of
the office premises. They will be further sold to authorized E
waste recyclers on periodic intervals
4 Other non-Hazardous waste
Other non-Hazardous waste like packaging waste, card
boards, metal scrap etc. will be sold to authorized recyclers
as per MSTC approval
2.7.11 Other effluents
Gaseous effluents
Following gaseous effluents are expected to be generated from the proposed LNG terminal:
Exhaust from diesel engines mainly consists of CO, CO2, and NOx,
CO2, CO and NOx from Elevated flare stack
LNG drain
LNG drains shall be routed to underground closed drain system. The intent of the closed drain system is to provide
a safe and environmentally acceptable method of collecting and disposing of hydrocarbons handled on the facility
prior to equipment or system maintenance after depressurization.
In order to minimize the losses of hydrocarbon to the atmosphere, liquid drained from equipment and piping will be
recovered in a drain drum. In the event of FSU disconnected operation, LNG transfer line needs to be drained in the
LNG drain drum. The LNG drain drum shall be provided with one pump installed and one pump warehouse spare.
Other contaminating drains
Normally no drains are expected in the LNG terminal. During maintenance drainage of non-volatile product (Diesel,
lube oil) or chemicals will be done through observation pit or portable container. These drains to be collected in
local Pits from where these shall be removed using portable pump in barrels for further disposal.

ESSAR BULK TERMINAL LTD.
MARINE ENVIRONMENTAL EVALUATION FOR
PROPOSED LNG TERMINAL AT HAJIRA, GUJARAT DESCRIPTION OF ENVIRONMENT
CSIR-CENTRAL SALT AND MARINE CHEMICALS RESEARCH INSTITUTE
KADAM ENVIRONMENTAL CONSULTANTS | OCTOBER 2018 39
2.7.12 Export possibility
Coastal movement of LNG can be explored after commissioning of this terminal.
2.7.13 Employment generation (direct and indirect)
The Proposed LNG Terminal development will generate direct employment for approximately 100 people. There will
be indirect employment generation of around 300 people from the Project.
This project is critical for the survival of Essar Steel which will directly employ an additional 1000 people and
indirectly employ an additional 5,000 people and similarly for Essar Power which will directly employ additional 300
people and indirectly employ additional 1000 people.
2.8 Cost of the project
Total estimated cost is ~ Rs. 2,000 crores.

ESSAR BULK TERMINAL LTD.
MARINE ENVIRONMENTAL EVALUATION FOR
PROPOSED LNG TERMINAL AT HAJIRA, GUJARAT DESCRIPTION OF ENVIRONMENT
CSIR-CENTRAL SALT AND MARINE CHEMICALS RESEARCH INSTITUTE
KADAM ENVIRONMENTAL CONSULTANTS | OCTOBER 2018 40
3 DESCRIPTION OF THE ENVIRONMENT
3.1 Introduction
The baseline status of environmental quality in the vicinity of project site serves as the basis for establishment of
prevailing environment status and identification, prediction and evaluation of impacts. This chapter describes
existing environmental baseline data of the study area pertaining to the proposed project activity.
3.2 Baseline environmental quality
The baseline environmental quality was assessed through field studies within the impact zone for various
components of the marine environment viz. bathymetry, physical processes (tide, current and waves), water
quality, sediment quality and flora-fauna with specific reference to environmental aspects, which may have a
bearing on the impacts of the proposed project. The baseline environmental quality was assessed in one season i.e.
Winter (February), 2018.
As per the requirement of ToR, the baseline studies for the above mentioned study period have been incorporated
in this chapter.
Water quality, sediment quality and marine biological diversity impact assessment report and management plan is
jointly prepared by CSIR-Central Salt & Marine Chemical Research Institute, Bhavnagar and Kadam Environmental
Consultants, Vadodara.
Marine Bathymetry, physical processes i.e. tides, currents & waves, water quality, sediment quality
and numerical modelling done by Kadam Environmental Consultants, Vadodara
The environmental baseline of the study area with respect to these parameters is discussed in subsequent sections.
3.2.1 Primary data collection
The following was studied with respect to the environmental baseline:
Physical processes
Tides
Currents
Water quality
Sediment quality
Flora and fauna
Phytoplankton
Zooplankton
Benthos
Fishery
Mangroves
Authenticity of primary data
Following laboratories were utilized for primary data collection w.r.t. marine flora-fauna which includes subtidal
ecology i.e. phytoplankton, zooplankton, benthos, fishery and also intertidal ecology, marine water quality, marine
sediment quality, bathymetry, tides, currents and waves.

ESSAR BULK TERMINAL LTD.
MARINE ENVIRONMENTAL EVALUATION FOR
PROPOSED LNG TERMINAL AT HAJIRA, GUJARAT DESCRIPTION OF ENVIRONMENT
CSIR-CENTRAL SALT AND MARINE CHEMICALS RESEARCH INSTITUTE
KADAM ENVIRONMENTAL CONSULTANTS | OCTOBER 2018 41
CSIR-Central Salt & Marine Chemical Research Institute (CSMCRI) at Bhavnagar, a constituent laboratory of
CSIR.
Kadam’s laboratory at Vadodara which is accredited by NABL.
Geostar Surveys India Private Limited at Mumbai
These laboratories follows an auditable quality plan including sampling, analysis, reporting and calibration and
participates in inter-laboratory quality control practices.
Marine sampling was carried out in winter 2018. Sampling location map for samples collected during high and low
tide from the eight (01-08) offshore stations shown in Error! Reference source not found. in Tapi channel off
Hajira coast for monitoring the water quality, sediment quality, phytoplankton, zooplankton and benthos. Sampling
location for Tide & current measurement is also shown in Figure 3-1.

ESSAR BULK TERMINAL LTD. MARINE ENVIRONMENTAL EVALUATION FOR PROPOSED LNG TERMINAL AT HAJIRA, GUJARAT DESCRIPTION OF ENVIRONMENT
CSIR-CENTRAL SALT AND MARINE CHEMICALS RESEARCH INSTITUTE
KADAM ENVIRONMENTAL CONSULTANTS | OCTOBER 2018 42
Figure 3-1: Sampling location map – marine environment

ESSAR BULK TERMINAL LTD.
MARINE ENVIRONMENTAL EVALUATION FOR
PROPOSED LNG TERMINAL AT HAJIRA, GUJARAT DESCRIPTION OF ENVIRONMENT
CSIR-CENTRAL SALT AND MARINE CHEMICALS RESEARCH INSTITUTE
KADAM ENVIRONMENTAL CONSULTANTS | OCTOBER 2018 43
3.2.2 Description of Gulf of Khambhat and EBTL Hajira channel
Gulf of Khambat, a large bay connected to Arabian Sea is known for its tidal range. Rapid industrialisation has led
to extensive development of the coastal areas and the maritime infrastructure. This area has major ports at
Pipavav, Bhavnagar, Dahej and Hajira in addition to Tapti oil fields (Niko and ONGC). Essar port is also located in
the Gulf of Khambat, near the city of Surat. The navigation command of control is under Magdalla port trust for the
area. The tidal range and current around the Hajira zone are vital parameters in the ship manoeuvring and harbour
planning. Since the location is in the macro tidal zone, the hydrodynamics and thus related processes are
predominantly tidal in nature.
This area has two large islands with small channels through them. Both the islands are not inhabited. The eastern
channel is shallow and is in the vicinity of the Dumas. The Shell port is on the western flank of Hajira. The Mindola
creek is a river mouth with a short river draining into it. The water is brackish most of the time.
Figure 3-2: Tapi estuary and Mindola creek
Port channel specification
Depth : 11m CD
Width : 300 m
Bank width : 72m each side
Navigation channel layout
The natural river channels were deepened for the operating deeper vessels. The turning circle is located at the
northern end of the artificial channel. Bathymetry chart for EBTL Hajira channel is given in Figure 3-4. Channel is
aligned north south in the berthing areas and the approach is about 15° to the north.
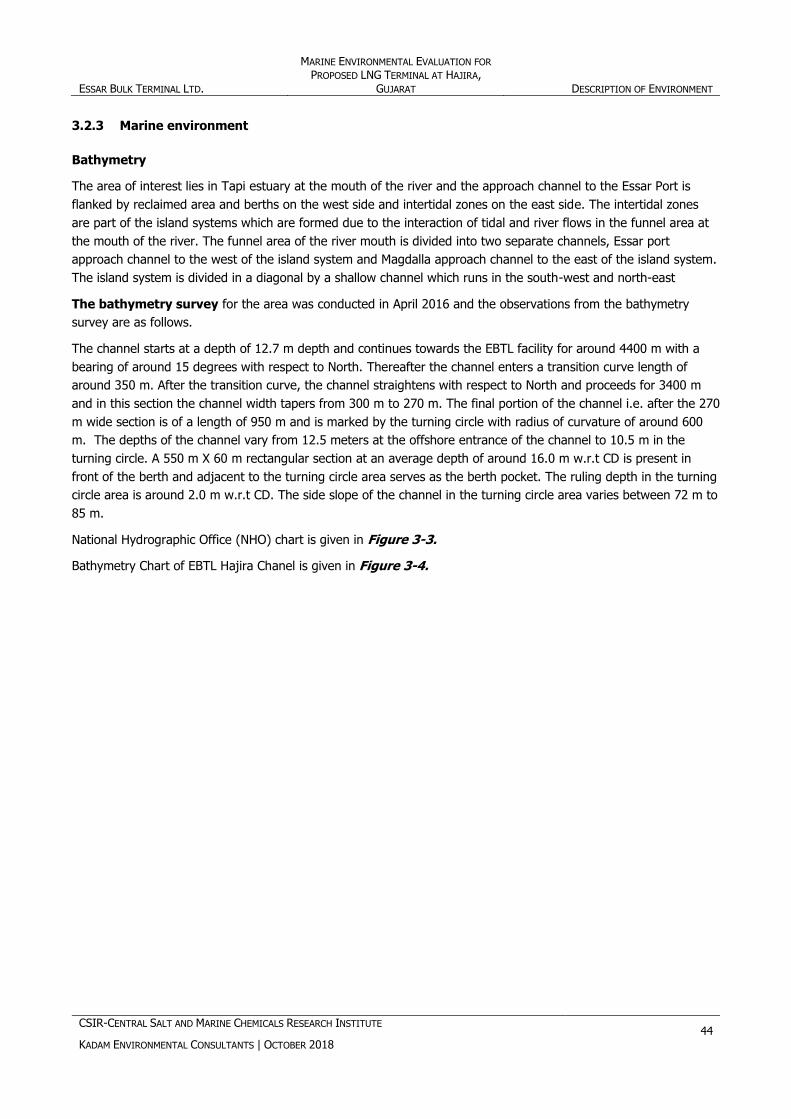
ESSAR BULK TERMINAL LTD.
MARINE ENVIRONMENTAL EVALUATION FOR
PROPOSED LNG TERMINAL AT HAJIRA, GUJARAT DESCRIPTION OF ENVIRONMENT
CSIR-CENTRAL SALT AND MARINE CHEMICALS RESEARCH INSTITUTE
KADAM ENVIRONMENTAL CONSULTANTS | OCTOBER 2018 44
3.2.3 Marine environment
Bathymetry
The area of interest lies in Tapi estuary at the mouth of the river and the approach channel to the Essar Port is
flanked by reclaimed area and berths on the west side and intertidal zones on the east side. The intertidal zones
are part of the island systems which are formed due to the interaction of tidal and river flows in the funnel area at
the mouth of the river. The funnel area of the river mouth is divided into two separate channels, Essar port
approach channel to the west of the island system and Magdalla approach channel to the east of the island system.
The island system is divided in a diagonal by a shallow channel which runs in the south-west and north-east
The bathymetry survey for the area was conducted in April 2016 and the observations from the bathymetry
survey are as follows.
The channel starts at a depth of 12.7 m depth and continues towards the EBTL facility for around 4400 m with a
bearing of around 15 degrees with respect to North. Thereafter the channel enters a transition curve length of
around 350 m. After the transition curve, the channel straightens with respect to North and proceeds for 3400 m
and in this section the channel width tapers from 300 m to 270 m. The final portion of the channel i.e. after the 270
m wide section is of a length of 950 m and is marked by the turning circle with radius of curvature of around 600
m. The depths of the channel vary from 12.5 meters at the offshore entrance of the channel to 10.5 m in the
turning circle. A 550 m X 60 m rectangular section at an average depth of around 16.0 m w.r.t CD is present in
front of the berth and adjacent to the turning circle area serves as the berth pocket. The ruling depth in the turning
circle area is around 2.0 m w.r.t CD. The side slope of the channel in the turning circle area varies between 72 m to
85 m.
National Hydrographic Office (NHO) chart is given in Figure 3-3.
Bathymetry Chart of EBTL Hajira Chanel is given in Figure 3-4.

ESSAR BULK TERMINAL LTD. MARINE ENVIRONMENTAL EVALUATION FOR PROPOSED LNG
TERMINAL AT HAJIRA, GUJARAT DESCRIPTION OF ENVIRONMENT
CSIR-CENTRAL SALT AND MARINE CHEMICALS RESEARCH INSTITUTE
KADAM ENVIRONMENTAL CONSULTANTS | OCTOBER 2018 45
Figure 3-3: NHO Chart number 2108

ESSAR BULK TERMINAL LTD. MARINE ENVIRONMENTAL EVALUATION FOR PROPOSED LNG
TERMINAL AT HAJIRA, GUJARAT DESCRIPTION OF ENVIRONMENT
CSIR-CENTRAL SALT AND MARINE CHEMICALS RESEARCH INSTITUTE
KADAM ENVIRONMENTAL CONSULTANTS | OCTOBER 2018 46
Figure 3-4: Bathymetry Chart of EBTL, Hajira channel
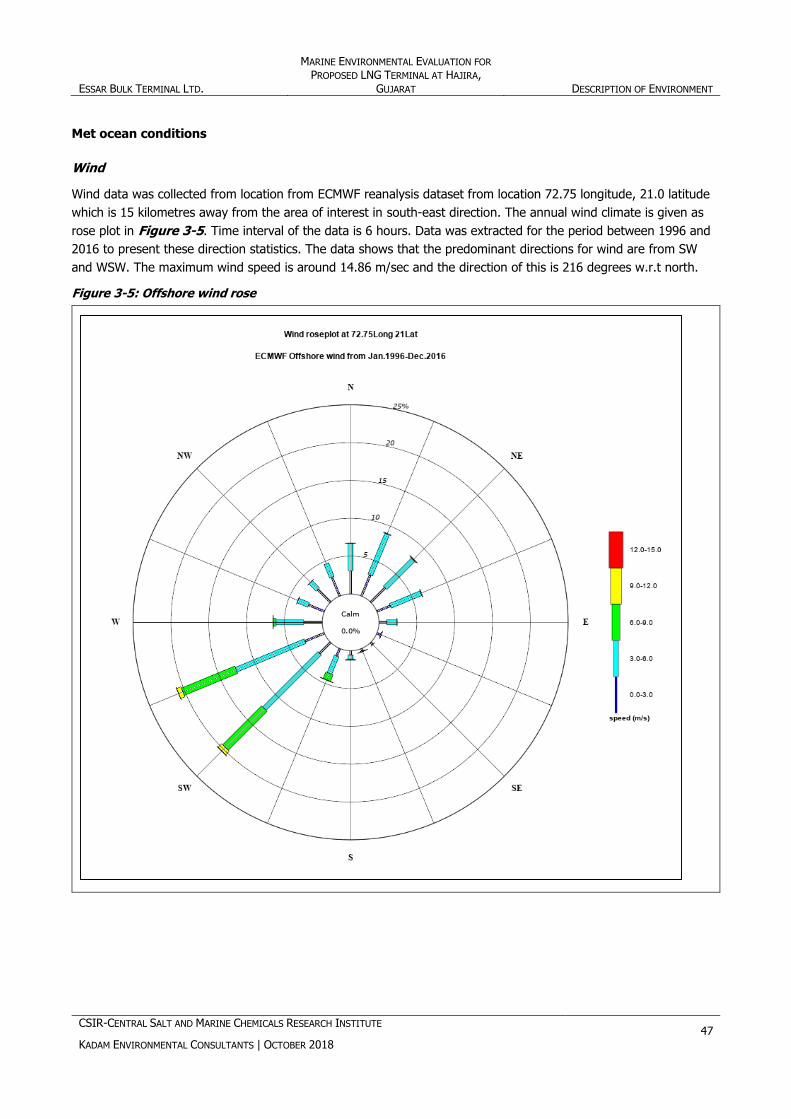
ESSAR BULK TERMINAL LTD.
MARINE ENVIRONMENTAL EVALUATION FOR
PROPOSED LNG TERMINAL AT HAJIRA, GUJARAT DESCRIPTION OF ENVIRONMENT
CSIR-CENTRAL SALT AND MARINE CHEMICALS RESEARCH INSTITUTE
KADAM ENVIRONMENTAL CONSULTANTS | OCTOBER 2018 47
Met ocean conditions
Wind
Wind data was collected from location from ECMWF reanalysis dataset from location 72.75 longitude, 21.0 latitude
which is 15 kilometres away from the area of interest in south-east direction. The annual wind climate is given as
rose plot in Figure 3-5. Time interval of the data is 6 hours. Data was extracted for the period between 1996 and
2016 to present these direction statistics. The data shows that the predominant directions for wind are from SW
and WSW. The maximum wind speed is around 14.86 m/sec and the direction of this is 216 degrees w.r.t north.
Figure 3-5: Offshore wind rose

ESSAR BULK TERMINAL LTD.
MARINE ENVIRONMENTAL EVALUATION FOR
PROPOSED LNG TERMINAL AT HAJIRA, GUJARAT DESCRIPTION OF ENVIRONMENT
CSIR-CENTRAL SALT AND MARINE CHEMICALS RESEARCH INSTITUTE
KADAM ENVIRONMENTAL CONSULTANTS | OCTOBER 2018 48
Tide
Tidal conditions at Hajira based on naval hydrographic chart number 2108 are given in Table 3-1.
Table 3-1: Tidal condition
Tidal condition Height in m w.r.t CD
MHWS 7.4
MHWN 6.0
MLWN 3.1
MLWS 1.7
MSL 4.2
Measured water elevation time series was collected in the channel in Feb 2018. The depth of observation is about
4.5 m below datum and the measurements are carried out using an Acoustic Doppler current profiler. The
instrument would ideally collect the speed and direction of the flow through the entire water column. An additional
water level sensor is available in the said instrument, which has recorded the tide of the site. The values are given
in Figure 3-6.
Figure 3-6: Tide level
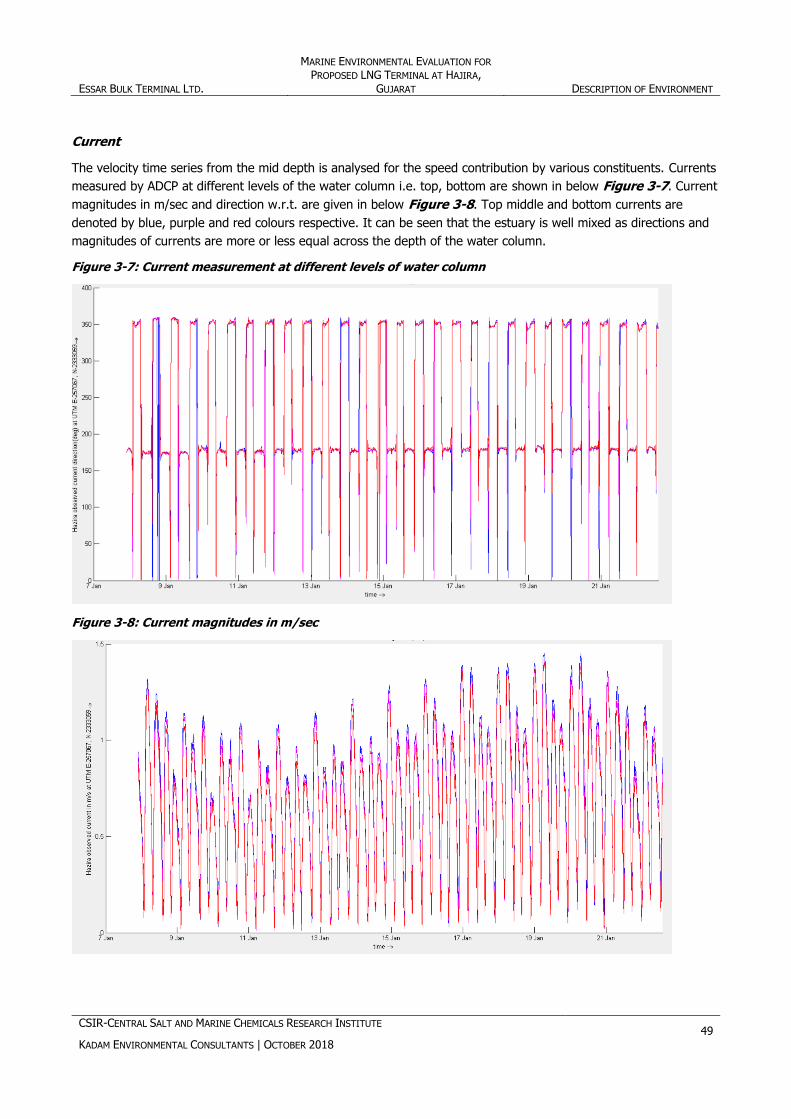
ESSAR BULK TERMINAL LTD.
MARINE ENVIRONMENTAL EVALUATION FOR
PROPOSED LNG TERMINAL AT HAJIRA, GUJARAT DESCRIPTION OF ENVIRONMENT
CSIR-CENTRAL SALT AND MARINE CHEMICALS RESEARCH INSTITUTE
KADAM ENVIRONMENTAL CONSULTANTS | OCTOBER 2018 49
Current
The velocity time series from the mid depth is analysed for the speed contribution by various constituents. Currents
measured by ADCP at different levels of the water column i.e. top, bottom are shown in below Figure 3-7. Current
magnitudes in m/sec and direction w.r.t. are given in below Figure 3-8. Top middle and bottom currents are
denoted by blue, purple and red colours respective. It can be seen that the estuary is well mixed as directions and
magnitudes of currents are more or less equal across the depth of the water column.
Figure 3-7: Current measurement at different levels of water column
Figure 3-8: Current magnitudes in m/sec

ESSAR BULK TERMINAL LTD.
MARINE ENVIRONMENTAL EVALUATION FOR
PROPOSED LNG TERMINAL AT HAJIRA, GUJARAT DESCRIPTION OF ENVIRONMENT
CSIR-CENTRAL SALT AND MARINE CHEMICALS RESEARCH INSTITUTE
KADAM ENVIRONMENTAL CONSULTANTS | OCTOBER 2018 50
3.2.4 Water
Physico – chemical characteristics of marine water
Materials and methods
The field studies were carried out at three areas listed below and sampling locations which are marked on the image
in Figure 2-1.
Tapi estuary
Marine area just outside the mouth of the Tapi, and
Two dredged disposal sites
Subtidal sampling for water quality, sediment quality and flora and fauna was done at stations 1 to 8 spread over the
estuarine stretch of about 25 km between Surat and the estuary mouth. The marine zone adjacent to the estuary
mouth was sampled at stations 9 to 12 with station 10 at the mouth of the Mindola estuary and the dredge spoil sites
were sampled at stations DS1 and DS2. The geographical coordinates of the subtidal sampling locations are given in
Figure 3-1.
Sampling procedure
Surface water for general analyses was collected using a polythene bucket while an adequately weighted Niskin
sampler with a closing mechanism at a desired depth was used for obtaining subsurface water samples. Sampling at
the surface and bottom (1 m above the bed) was done when the station depth exceeded 3 m. For shallow regions
only surface samples were collected.
Methods of chemical analysis
The water samples were collected and were preserved in cool condition and were carried to the laboratory
immediately at Bhavnagar. For some of the sensitive nutrient parameters analysis was done onsite. For DO and BOD
water samples were fixed during sampling. The analytical methods of estimations were as follows:
Temperature: Temperature was recorded using a mercury thermometer with an accuracy of 0.1oC.
pH: The pH was measured on a microprocessor-based pH analyzer. The instrument was calibrated with
standard buffers just before use.
Total Suspended Solids (TSS): A known volume of water was filtered through a pre-weighted 0.45 μm Millipore
membrane filter paper, dried and weighed again.
Salinity: A suitable volume of the sample was titrated against silver nitrate with potassium chromate as an
indicator. The salinity was calculated using standard tables.
DO and BOD: DO was determined by Winkler method. For the determination of BOD, direct un-seeded method
was employed. The sample was filled in a BOD bottle in the field and was incubated in the laboratory for 3 days
after which DO was again determined.
Phosphate-Phosphorus (PO43-P): Acidified molybdate reagent was added to the sample to yield a
phosphomolybdate complex, which was then reduced with ascorbic acid to a highly coloured blue compound,
which was measured at 882 nm.
Nitrite-Nitrogen (NO2--N): Nitrite in the sample was allowed to react with sulphanilamide in acid solution. The
resulting diazo compound was reacted with N-(1-napthyl) - ethylenediamine dihydrochloride to form a highly
coloured azo dye. The light absorbance was measured at 543 nm.
Nitrate-Nitrogen (NO3-N): Nitrate was determined as nitrite as above after its reduction by passing the sample
through a column packed with amalgamated cadmium.
Ammonium-Nitrogen (NH4+-N): Ammonia and ammonium compounds (NH3 + NH4 +) in water were reacted
with phenol in presence of hypochlorite to obtain blue colour of indophenol. The absorbance was measured at
630 nm.
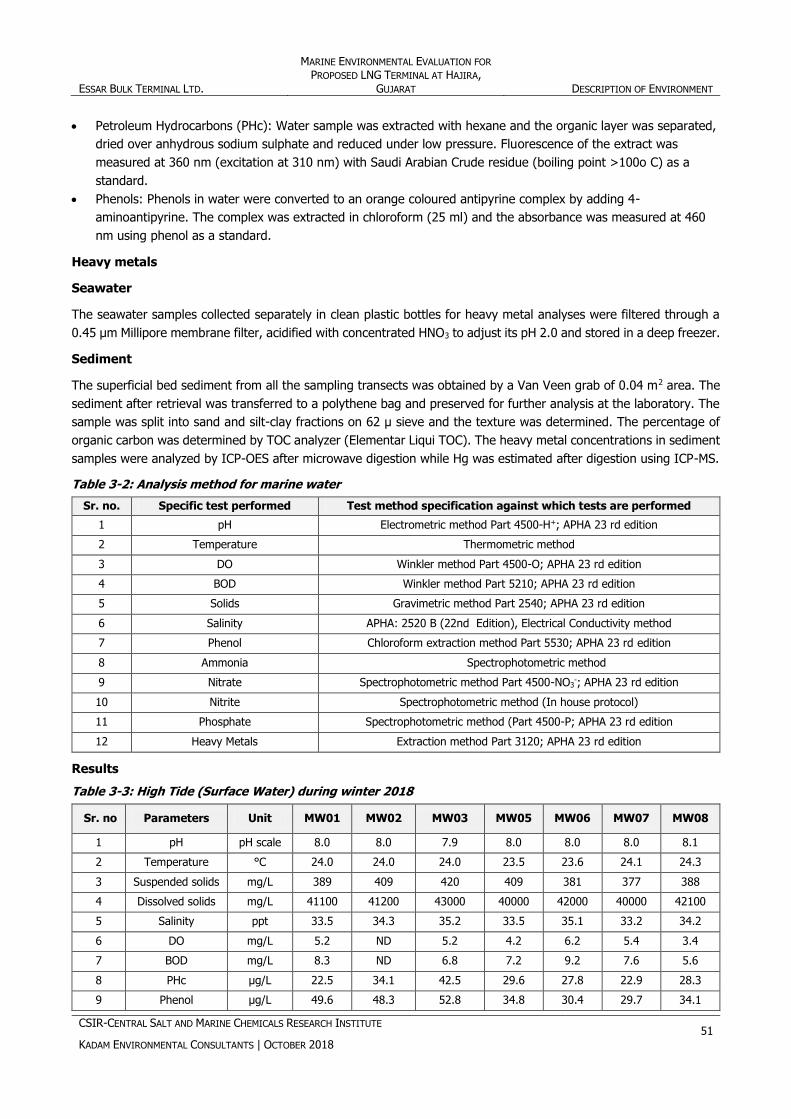
ESSAR BULK TERMINAL LTD.
MARINE ENVIRONMENTAL EVALUATION FOR
PROPOSED LNG TERMINAL AT HAJIRA, GUJARAT DESCRIPTION OF ENVIRONMENT
CSIR-CENTRAL SALT AND MARINE CHEMICALS RESEARCH INSTITUTE
KADAM ENVIRONMENTAL CONSULTANTS | OCTOBER 2018 51
Petroleum Hydrocarbons (PHc): Water sample was extracted with hexane and the organic layer was separated,
dried over anhydrous sodium sulphate and reduced under low pressure. Fluorescence of the extract was
measured at 360 nm (excitation at 310 nm) with Saudi Arabian Crude residue (boiling point >100o C) as a
standard.
Phenols: Phenols in water were converted to an orange coloured antipyrine complex by adding 4-
aminoantipyrine. The complex was extracted in chloroform (25 ml) and the absorbance was measured at 460
nm using phenol as a standard.
Heavy metals
Seawater
The seawater samples collected separately in clean plastic bottles for heavy metal analyses were filtered through a
0.45 μm Millipore membrane filter, acidified with concentrated HNO3 to adjust its pH 2.0 and stored in a deep freezer.
Sediment
The superficial bed sediment from all the sampling transects was obtained by a Van Veen grab of 0.04 m2 area. The
sediment after retrieval was transferred to a polythene bag and preserved for further analysis at the laboratory. The
sample was split into sand and silt-clay fractions on 62 µ sieve and the texture was determined. The percentage of
organic carbon was determined by TOC analyzer (Elementar Liqui TOC). The heavy metal concentrations in sediment
samples were analyzed by ICP-OES after microwave digestion while Hg was estimated after digestion using ICP-MS.
Table 3-2: Analysis method for marine water
Sr. no. Specific test performed Test method specification against which tests are performed
1 pH Electrometric method Part 4500-H+; APHA 23 rd edition
2 Temperature Thermometric method
3 DO Winkler method Part 4500-O; APHA 23 rd edition
4 BOD Winkler method Part 5210; APHA 23 rd edition
5 Solids Gravimetric method Part 2540; APHA 23 rd edition
6 Salinity APHA: 2520 B (22nd Edition), Electrical Conductivity method
7 Phenol Chloroform extraction method Part 5530; APHA 23 rd edition
8 Ammonia Spectrophotometric method
9 Nitrate Spectrophotometric method Part 4500-NO3-; APHA 23 rd edition
10 Nitrite Spectrophotometric method (In house protocol)
11 Phosphate Spectrophotometric method (Part 4500-P; APHA 23 rd edition
12 Heavy Metals Extraction method Part 3120; APHA 23 rd edition
Results
Table 3-3: High Tide (Surface Water) during winter 2018
Sr. no Parameters Unit MW01 MW02 MW03 MW05 MW06 MW07 MW08
1 pH pH scale 8.0 8.0 7.9 8.0 8.0 8.0 8.1
2 Temperature °C 24.0 24.0 24.0 23.5 23.6 24.1 24.3
3 Suspended solids mg/L 389 409 420 409 381 377 388
4 Dissolved solids mg/L 41100 41200 43000 40000 42000 40000 42100
5 Salinity ppt 33.5 34.3 35.2 33.5 35.1 33.2 34.2
6 DO mg/L 5.2 ND 5.2 4.2 6.2 5.4 3.4
7 BOD mg/L 8.3 ND 6.8 7.2 9.2 7.6 5.6
8 PHc µg/L 22.5 34.1 42.5 29.6 27.8 22.9 28.3
9 Phenol µg/L 49.6 48.3 52.8 34.8 30.4 29.7 34.1

ESSAR BULK TERMINAL LTD.
MARINE ENVIRONMENTAL EVALUATION FOR
PROPOSED LNG TERMINAL AT HAJIRA, GUJARAT DESCRIPTION OF ENVIRONMENT
CSIR-CENTRAL SALT AND MARINE CHEMICALS RESEARCH INSTITUTE
KADAM ENVIRONMENTAL CONSULTANTS | OCTOBER 2018 52
Sr. no Parameters Unit MW01 MW02 MW03 MW05 MW06 MW07 MW08
10 Phosphate mg/L 0.003 0.055 0.032 0.145 0.15 0.148 0.189
11 Nitrite mg/L 0.051 0.056 0.053 0.054 0.053 0.054 0.049
12 Nitrate mg/L 1.71 1.42 3.7 1.6 1.28 1.6 1.16
13 Ammonia µM 2.5 0.833 3.333 1.67 6.67 6.67 9.17
14 Heavy Metals
a Cr µg/L 0.124 0.127 0.134 0.13 0.131 0.125 0.121
b Fe µg/L 10.21 15.46 ND 9.91 10.81 10.13 10.58
c Ni µg/L 0.945 1.289 0.957 1.251 1.008 1.068 1.025
d Cu µg/L 0.845 0.864 0.945 0.85 1.021 0.975 0.9561
e Zn µg/L 10.24 11.29 10.45 12.05 12.36 10.03 10.04
f Cd µg/L 0.0258 0.32 0.21 0.369 0.211 0.241 0.357
g Pb µg/L 0.356 0.378 0.354 0.345 0.356 0.236 0.309
Note: ND - Not Detected
MW 04 Samples were not collected due to the unfavourable conditions
Table 3-4: High tide (bottom water) during winter 2018
Sr. no Parameters Unit MW01 MW02 MW03 MW05 MW06 MW07 MW08
1 pH pH scale 8.0 8.0 8.0 8.0 8.0 8.1 8.0
2 Temperature °C 25.0 24.0 24.0 23.4 23.7 24.6 24.1
3 Suspended
solids mg/L 410 415 422 398 386 393 376
4 Dissolved solids mg/L 41000 45100 45700 43100 45100 43000 41010
5 Salinity ppt 34.6 35.3 35.6 33.6 35.2 34.7 35.2
6 DO mg/L 5.6 6.0 ND 5.6 2.4 4.4 6.0
7 BOD mg/L 6.8 6.8 ND 8.4 ND 5.6 8.4
8 PHc µg/L 29.4 41.2 39.9 24.5 29.7 24.9 28.4
9 Phenol µg/L 48.7 49.8 57.4 32.4 28.9 32.4 38.1
10 Phosphate mg/L 0.021 0.067 0.047 0.136 0.142 0.241 0.27
11 Nitrite mg/L 0.05 0.051 0.051 0.046 0.054 0.054 0.052
12 Nitrate mg/L 2.05 2.21 1.31 2.05 1.31 1.83 1.73
13 Ammonia µM 4.167 2.50 0.833 12.5 10.00 2.50 10.00
14 Heavy Metals
a Cr µg/L 0.122 0.123 0.128 0.127 0.129 0.138 0.123
b Fe µg/L 10.42 12.37 13.25 9.54 9.34 9.76 9.91
c Ni µg/L 0.968 1.278 ND 0.994 0.998 1.061 1.047
d Cu µg/L 0.841 ND 0.872 0.812 1.008 0.942 0.912
e Zn µg/L 10.23 10.24 10.12 10.09 9.56 ND 11.24
f Cd µg/L 0.214 0.568 0.241 0.341 0.305 0.365 0.249
g Pb µg/L 0.375 0.322 0.394 0.306 0.207 0.228 0.301
Note: ND - Not Detected
MW 04 Samples were not collected due to the unfavourable conditions

ESSAR BULK TERMINAL LTD.
MARINE ENVIRONMENTAL EVALUATION FOR
PROPOSED LNG TERMINAL AT HAJIRA, GUJARAT DESCRIPTION OF ENVIRONMENT
CSIR-CENTRAL SALT AND MARINE CHEMICALS RESEARCH INSTITUTE
KADAM ENVIRONMENTAL CONSULTANTS | OCTOBER 2018 53
Table 3-5: Low tide (surface water) during winter 2018
Sr. no Parameters Unit MW02 MW03 MW04 MW05 MW06 MW07 MW08
1 pH pH scale 7.8 7.8 7.8 7.8 7.8 8.0 8.0
2 Temperature °C 25.5 26.0 26.0 25.0 25.0 25.0 23.9
3 Suspended
solids mg/L 384 416 419 392 378 372 367
4 Dissolved solids mg/L 43200 43400 44200 46100 43700 48300 46700
5 Salinity ppt 33.6 34.5 34.6 35.4 34.3 35.6 35.1
6 DO mg/L 5.4 5.2 4.4 6.4 5.3 7.2 4.0
7 BOD mg/L 0.4 7.2 4.4 8.0 5.6 8.8 0
8 PHc µg/L 37.5 36.7 39.6 29.3 22.5 21.7 25.9
9 Phenol µg/L 47.6 52.3 41.2 39.7 31.2 36.4 37.2
10 Phosphate mg/L 0.061 0.042 0.131 0.135 0.156 0.245 0.278
11 Nitrite mg/L 0.052 ND 0.054 0.051 0.004 0.051 0.059
12 Nitrate mg/L 1.82 ND 1.9 2.21 1.32 1.65 1.57
13 Ammonia µM 6.667 5.833 1.667 2.50 2.50 9.17 2.50
14 Heavy Metals
a Cr µg/L 0.101 0.11 0.126 0.132 0.124 ND 0.126
b Fe µg/L 11.24 11.41 11.76 10.57 9.76 11.25 9.22
c Ni µg/L 0.956 1.869 1.251 1.278 1.002 1.003 0.928
d Cu µg/L ND 0.834 0.823 1.004 0.835 0.975 0.927
e Zn µg/L 10.22 1.01 11.15 11.05 10.22 10.86 11.23
f Cd µg/L 0.253 0.234 0.345 0.356 0.345 0.256 0.341
g Pb µg/L 0.389 0.386 0.658 0.322 0.254 0.209 0.331
Note: ND - Not Detected
MW 01 Samples were not collected due to the unfavourable conditions
Table 3-6: Low tide (Bottom Water) during winter 2018
Sr. no Parameters Unit MW02 MW03 MW04 MW05 MW06 MW07 MW08
1 pH pH scale 7.9 7.7 7.7 7.9 7.8 8.0 8.1
2 Temperature °C 26.0 25.8 26.0 25.0 25.6 25.0 24.3
3 Suspended Solids mg/L 394 414 421 398 380 369 370
4 Dissolved Solids mg/L 43000 42100 44000 46700 42100 42200 45700
5 Salinity ppt 35.5 35.7 35.6 35.7 34.5 34.6 35.3
6 DO mg/L 4.0 3.2 6.8 7.0 6.8 6.4 5.0
7 BOD mg/L ND 5.5 8.4 8.3 8.0 7.8 8.0
8 PHc µg/L 38.1 31.8 37.6 25.7 23.6 22.5 27.6
9 Phenol µg/L 46.9 55.4 39.8 38.4 32.9 31.9 34.1
10 Phosphate mg/L 0.069 0.044 0.125 0.178 0.158 0.169 0.102
11 Nitrite mg/L ND ND 0.054 0.052 0.003 0.052 0.053
12 Nitrate mg/L ND ND 2.72 2.25 1.39 1.57 1.63
13 Ammonia µM 10.0 1.667 7.50 6.67 1.67 2.50 12.50
14 Heavy Metals
a Cr µg/L ND 0.121 0.12 0.131 0.134 ND 0.122
b Fe µg/L 13.45 12.92 9.63 10.82 10.62 11.77 10.74
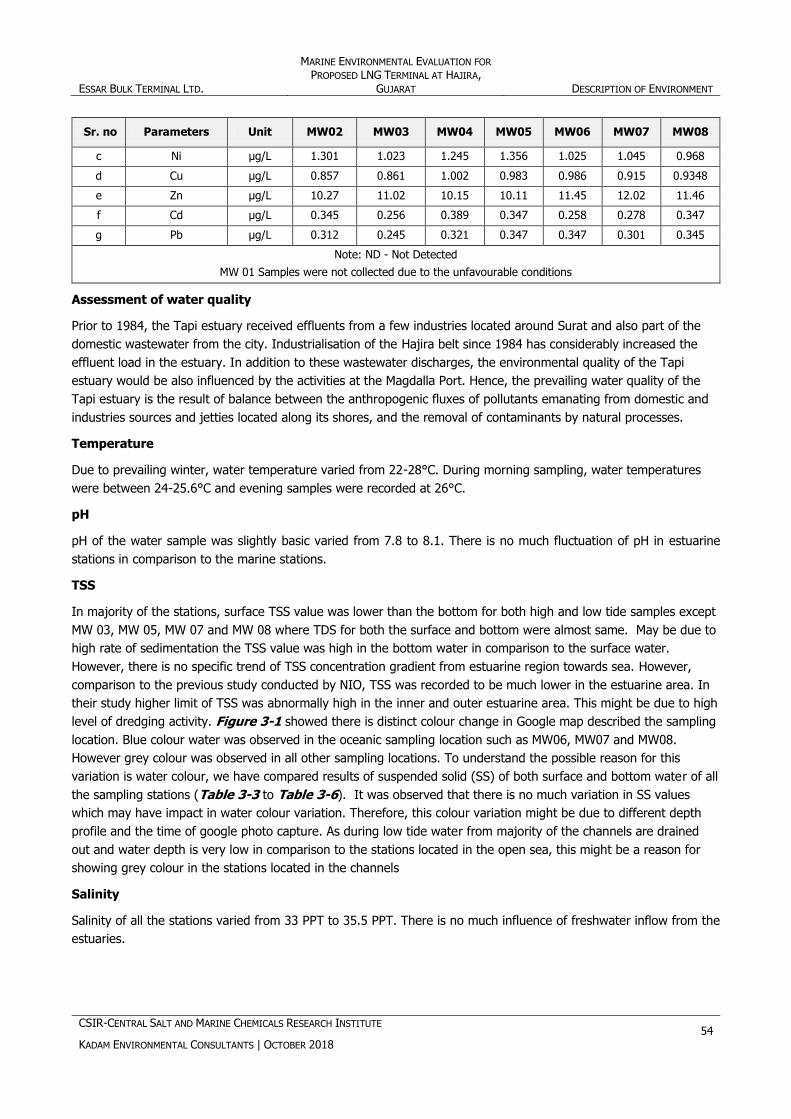
ESSAR BULK TERMINAL LTD.
MARINE ENVIRONMENTAL EVALUATION FOR
PROPOSED LNG TERMINAL AT HAJIRA, GUJARAT DESCRIPTION OF ENVIRONMENT
CSIR-CENTRAL SALT AND MARINE CHEMICALS RESEARCH INSTITUTE
KADAM ENVIRONMENTAL CONSULTANTS | OCTOBER 2018 54
Sr. no Parameters Unit MW02 MW03 MW04 MW05 MW06 MW07 MW08
c Ni µg/L 1.301 1.023 1.245 1.356 1.025 1.045 0.968
d Cu µg/L 0.857 0.861 1.002 0.983 0.986 0.915 0.9348
e Zn µg/L 10.27 11.02 10.15 10.11 11.45 12.02 11.46
f Cd µg/L 0.345 0.256 0.389 0.347 0.258 0.278 0.347
g Pb µg/L 0.312 0.245 0.321 0.347 0.347 0.301 0.345
Note: ND - Not Detected
MW 01 Samples were not collected due to the unfavourable conditions
Assessment of water quality
Prior to 1984, the Tapi estuary received effluents from a few industries located around Surat and also part of the
domestic wastewater from the city. Industrialisation of the Hajira belt since 1984 has considerably increased the
effluent load in the estuary. In addition to these wastewater discharges, the environmental quality of the Tapi
estuary would be also influenced by the activities at the Magdalla Port. Hence, the prevailing water quality of the
Tapi estuary is the result of balance between the anthropogenic fluxes of pollutants emanating from domestic and
industries sources and jetties located along its shores, and the removal of contaminants by natural processes.
Temperature
Due to prevailing winter, water temperature varied from 22-28°C. During morning sampling, water temperatures
were between 24-25.6°C and evening samples were recorded at 26°C.
pH
pH of the water sample was slightly basic varied from 7.8 to 8.1. There is no much fluctuation of pH in estuarine
stations in comparison to the marine stations.
TSS
In majority of the stations, surface TSS value was lower than the bottom for both high and low tide samples except
MW 03, MW 05, MW 07 and MW 08 where TDS for both the surface and bottom were almost same. May be due to
high rate of sedimentation the TSS value was high in the bottom water in comparison to the surface water.
However, there is no specific trend of TSS concentration gradient from estuarine region towards sea. However,
comparison to the previous study conducted by NIO, TSS was recorded to be much lower in the estuarine area. In
their study higher limit of TSS was abnormally high in the inner and outer estuarine area. This might be due to high
level of dredging activity. Figure 3-1 showed there is distinct colour change in Google map described the sampling
location. Blue colour water was observed in the oceanic sampling location such as MW06, MW07 and MW08.
However grey colour was observed in all other sampling locations. To understand the possible reason for this
variation is water colour, we have compared results of suspended solid (SS) of both surface and bottom water of all
the sampling stations (Table 3-3 to Table 3-6). It was observed that there is no much variation in SS values
which may have impact in water colour variation. Therefore, this colour variation might be due to different depth
profile and the time of google photo capture. As during low tide water from majority of the channels are drained
out and water depth is very low in comparison to the stations located in the open sea, this might be a reason for
showing grey colour in the stations located in the channels
Salinity
Salinity of all the stations varied from 33 PPT to 35.5 PPT. There is no much influence of freshwater inflow from the
estuaries.
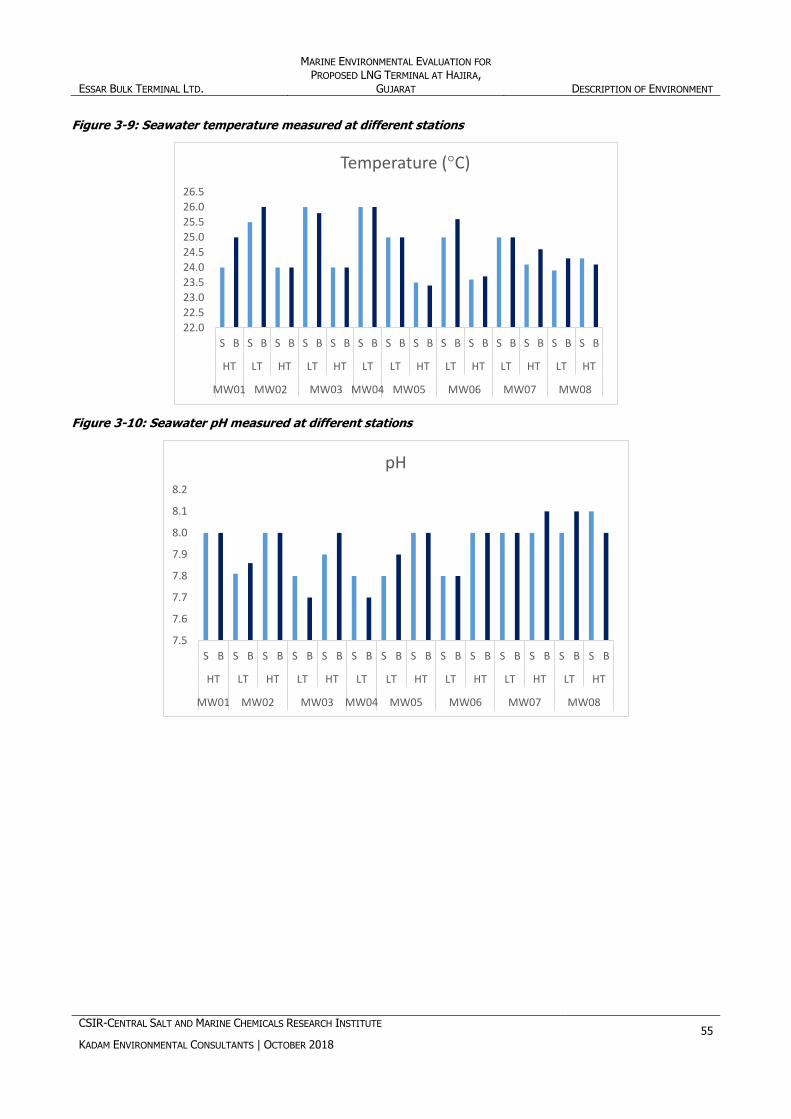
ESSAR BULK TERMINAL LTD.
MARINE ENVIRONMENTAL EVALUATION FOR
PROPOSED LNG TERMINAL AT HAJIRA, GUJARAT DESCRIPTION OF ENVIRONMENT
CSIR-CENTRAL SALT AND MARINE CHEMICALS RESEARCH INSTITUTE
KADAM ENVIRONMENTAL CONSULTANTS | OCTOBER 2018 55
Figure 3-9: Seawater temperature measured at different stations
Figure 3-10: Seawater pH measured at different stations
22.0
22.5
23.0
23.5
24.0
24.5
25.0
25.5
26.0
26.5
S B S B S B S B S B S B S B S B S B S B S B S B S B S B
HT LT HT LT HT LT LT HT LT HT LT HT LT HT
MW01 MW02 MW03 MW04 MW05 MW06 MW07 MW08
Temperature (°C)
7.5
7.6
7.7
7.8
7.9
8.0
8.1
8.2
S B S B S B S B S B S B S B S B S B S B S B S B S B S B
HT LT HT LT HT LT LT HT LT HT LT HT LT HT
MW01 MW02 MW03 MW04 MW05 MW06 MW07 MW08
pH
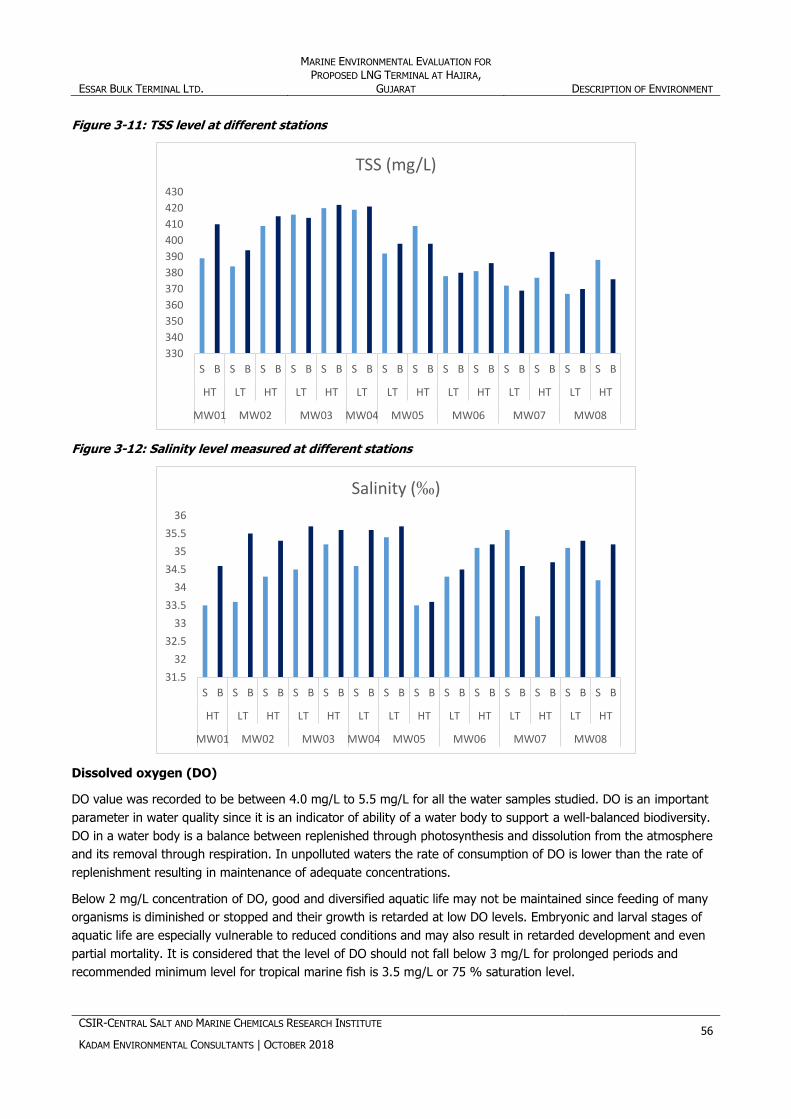
ESSAR BULK TERMINAL LTD.
MARINE ENVIRONMENTAL EVALUATION FOR
PROPOSED LNG TERMINAL AT HAJIRA, GUJARAT DESCRIPTION OF ENVIRONMENT
CSIR-CENTRAL SALT AND MARINE CHEMICALS RESEARCH INSTITUTE
KADAM ENVIRONMENTAL CONSULTANTS | OCTOBER 2018 56
Figure 3-11: TSS level at different stations
Figure 3-12: Salinity level measured at different stations
Dissolved oxygen (DO)
DO value was recorded to be between 4.0 mg/L to 5.5 mg/L for all the water samples studied. DO is an important
parameter in water quality since it is an indicator of ability of a water body to support a well-balanced biodiversity.
DO in a water body is a balance between replenished through photosynthesis and dissolution from the atmosphere
and its removal through respiration. In unpolluted waters the rate of consumption of DO is lower than the rate of
replenishment resulting in maintenance of adequate concentrations.
Below 2 mg/L concentration of DO, good and diversified aquatic life may not be maintained since feeding of many
organisms is diminished or stopped and their growth is retarded at low DO levels. Embryonic and larval stages of
aquatic life are especially vulnerable to reduced conditions and may also result in retarded development and even
partial mortality. It is considered that the level of DO should not fall below 3 mg/L for prolonged periods and
recommended minimum level for tropical marine fish is 3.5 mg/L or 75 % saturation level.
330
340
350
360
370
380
390
400
410
420
430
S B S B S B S B S B S B S B S B S B S B S B S B S B S B
HT LT HT LT HT LT LT HT LT HT LT HT LT HT
MW01 MW02 MW03 MW04 MW05 MW06 MW07 MW08
TSS (mg/L)
31.5
32
32.5
33
33.5
34
34.5
35
35.5
36
S B S B S B S B S B S B S B S B S B S B S B S B S B S B
HT LT HT LT HT LT LT HT LT HT LT HT LT HT
MW01 MW02 MW03 MW04 MW05 MW06 MW07 MW08
Salinity (‰)
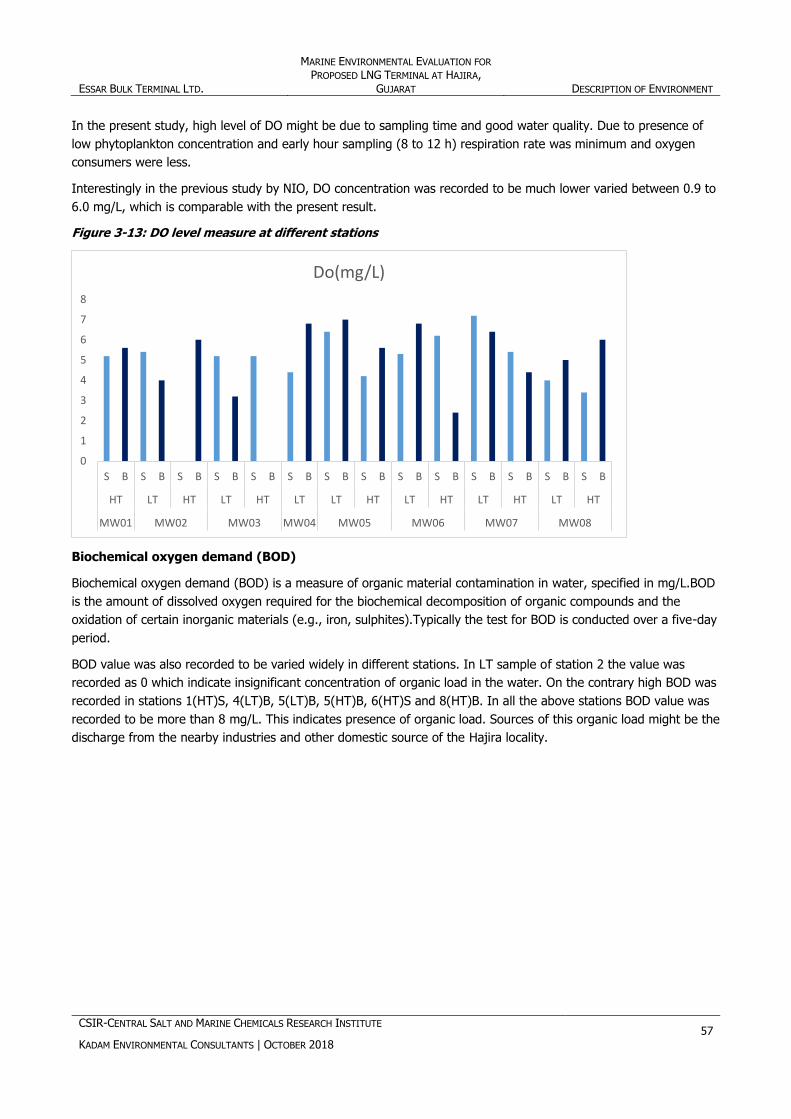
ESSAR BULK TERMINAL LTD.
MARINE ENVIRONMENTAL EVALUATION FOR
PROPOSED LNG TERMINAL AT HAJIRA, GUJARAT DESCRIPTION OF ENVIRONMENT
CSIR-CENTRAL SALT AND MARINE CHEMICALS RESEARCH INSTITUTE
KADAM ENVIRONMENTAL CONSULTANTS | OCTOBER 2018 57
In the present study, high level of DO might be due to sampling time and good water quality. Due to presence of
low phytoplankton concentration and early hour sampling (8 to 12 h) respiration rate was minimum and oxygen
consumers were less.
Interestingly in the previous study by NIO, DO concentration was recorded to be much lower varied between 0.9 to
6.0 mg/L, which is comparable with the present result.
Figure 3-13: DO level measure at different stations
Biochemical oxygen demand (BOD)
Biochemical oxygen demand (BOD) is a measure of organic material contamination in water, specified in mg/L.BOD
is the amount of dissolved oxygen required for the biochemical decomposition of organic compounds and the
oxidation of certain inorganic materials (e.g., iron, sulphites).Typically the test for BOD is conducted over a five-day
period.
BOD value was also recorded to be varied widely in different stations. In LT sample of station 2 the value was
recorded as 0 which indicate insignificant concentration of organic load in the water. On the contrary high BOD was
recorded in stations 1(HT)S, 4(LT)B, 5(LT)B, 5(HT)B, 6(HT)S and 8(HT)B. In all the above stations BOD value was
recorded to be more than 8 mg/L. This indicates presence of organic load. Sources of this organic load might be the
discharge from the nearby industries and other domestic source of the Hajira locality.
0
1
2
3
4
5
6
7
8
S B S B S B S B S B S B S B S B S B S B S B S B S B S B
HT LT HT LT HT LT LT HT LT HT LT HT LT HT
MW01 MW02 MW03 MW04 MW05 MW06 MW07 MW08
Do(mg/L)

ESSAR BULK TERMINAL LTD.
MARINE ENVIRONMENTAL EVALUATION FOR
PROPOSED LNG TERMINAL AT HAJIRA, GUJARAT DESCRIPTION OF ENVIRONMENT
CSIR-CENTRAL SALT AND MARINE CHEMICALS RESEARCH INSTITUTE
KADAM ENVIRONMENTAL CONSULTANTS | OCTOBER 2018 58
Figure 3-14: BOD level measured at different stations
PHc
Naturally occurring hydrocarbons in aquatic environment are in trace amounts of simple forms produced by
microbes. PHc derived from crude oil and its products are added to marine environment by anthropogenic activities
namely production of crude oil and its products, their transport, ship traffic, etc. Prominent land-based sources are
domestic and industrial effluents, atmospheric fallout of fuel combustion products, condensed vapours etc. PHc can
cause severe damage to the aquatic life when there are sudden discharges in large quantities during accidents such
as tanker collision, pipeline rupture, fire etc. In the present study, PHc concentration in all the sampling stations
was low in comparison to the standard for coastal and marine water. PHc levels ranged between 22.5-42.5 µg/L
during high tide surface water, whereas their levels were 24.5-41.2 g/L in bottom marine water. Selected samples
of MW02, MW03 and MW04 recorded comparatively high concentration of PHc. This might be due to regular ship
movement in the estuary. However in the mouth and offshore PHc concentration was comparatively low. However
the present value is higher than the study carried out by NIO during 2012.
Figure 3-15: PHc level measured at different stations
0
1
2
3
4
5
6
7
8
9
10
S B S B S B S B S B S B S B S B S B S B S B S B S B S B
HT LT HT LT HT LT LT HT LT HT LT HT LT HT
MW01 MW02 MW03 MW04 MW05 MW06 MW07 MW08
BOD (mg/L)
0
10
20
30
40
50
S B S B S B S B S B S B S B S B S B S B S B S B S B S B
HT LT HT LT HT LT LT HT LT HT LT HT LT HT
MW01 MW02 MW03 MW04 MW05 MW06 MW07 MW08
PHc (µg/L)

ESSAR BULK TERMINAL LTD.
MARINE ENVIRONMENTAL EVALUATION FOR
PROPOSED LNG TERMINAL AT HAJIRA, GUJARAT DESCRIPTION OF ENVIRONMENT
CSIR-CENTRAL SALT AND MARINE CHEMICALS RESEARCH INSTITUTE
KADAM ENVIRONMENTAL CONSULTANTS | OCTOBER 2018 59
Phenol
Phenols in natural waters generally originate through anthropogenic discharges. They are used extensively in
fungicides, antimicrobials, wood preservatives, pharmaceuticals, dyes, pesticides, resins etc. and hence they
become important constituent of domestic and organic industrial effluents. Phenols have broad spectrum toxicity
depending upon the substitution.
In the present study station MW03 recorded maximum concentration of phenolic compounds (52.8 µg/L). The
detected range of phenols were 29.7-52.8 and 28.9-49.8 µg/L for the surface and bottom marine waters collected
during the high tide waters. Station MW01 and MW02 also recorded higher concentration of phenolic compounds in
the water samples in comparison to the offshore stations. This trend has similarity with the distribution of PHc.
In the NIO study monsoon samples recorded maximum concentration of phenolic compounds in comparison to the
pre and post monsoon samples. Present sampling was carried out during March (pre monsoon). However
Figure 3-16: Phenol level measured at different stations
Phosphate
Among several inorganic constituents, phosphorus and nitrogen compounds have a major role to play in primary
productivity. However, their high concentrations can lead to excessive growth of algae which in extreme conditions
result in eutrophication. Dissolved phosphorus invariably occurs as phosphate (PO43--P) in water and its important
sources in coastal environment are domestic sewage, detergents, effluents from agro-based and fertilizer.
Phosphate concentration varied from 0.003 to 2.78 mg/L. In the offshore stations phosphate concentration was
comparatively higher than the estuarine samples.
0.0
10.0
20.0
30.0
40.0
50.0
60.0
70.0
S B S B S B S B S B S B S B S B S B S B S B S B S B S B
HT LT HT LT HT LT LT HT LT HT LT HT LT HT
MW01 MW02 MW03 MW04 MW05 MW06 MW07 MW08
Phenol (µg/L)
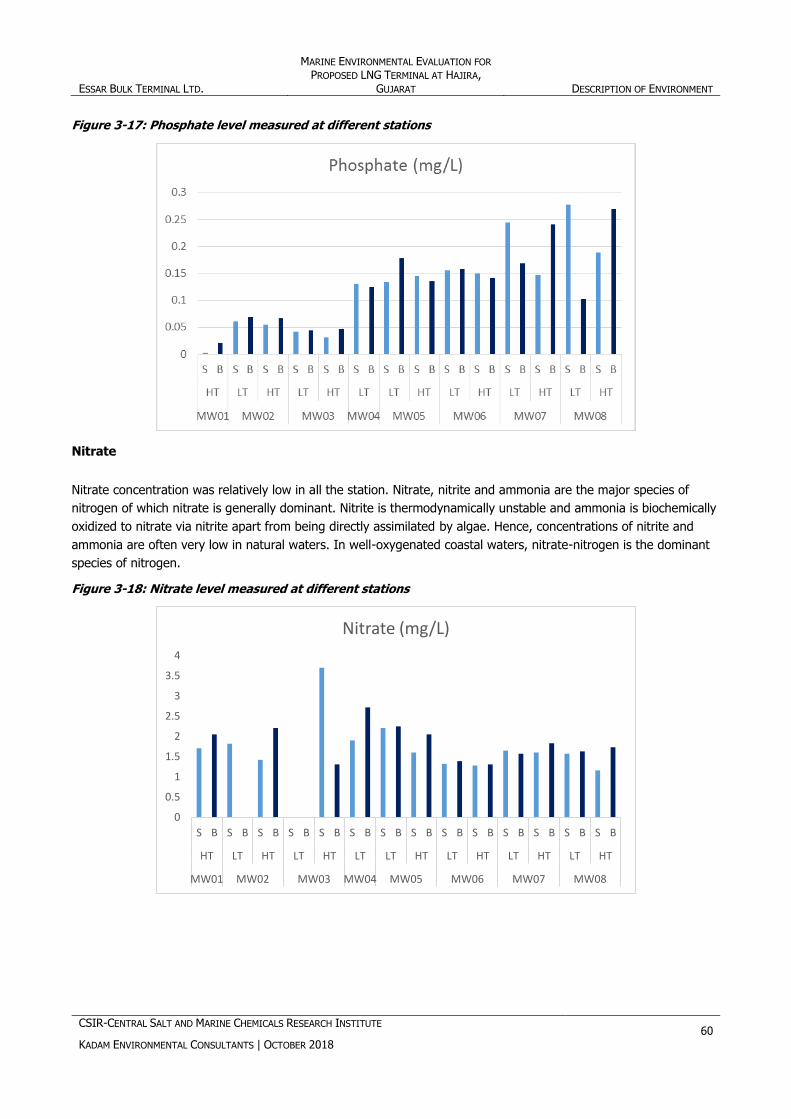
ESSAR BULK TERMINAL LTD.
MARINE ENVIRONMENTAL EVALUATION FOR
PROPOSED LNG TERMINAL AT HAJIRA, GUJARAT DESCRIPTION OF ENVIRONMENT
CSIR-CENTRAL SALT AND MARINE CHEMICALS RESEARCH INSTITUTE
KADAM ENVIRONMENTAL CONSULTANTS | OCTOBER 2018 60
Figure 3-17: Phosphate level measured at different stations
Nitrate
Nitrate concentration was relatively low in all the station. Nitrate, nitrite and ammonia are the major species of
nitrogen of which nitrate is generally dominant. Nitrite is thermodynamically unstable and ammonia is biochemically
oxidized to nitrate via nitrite apart from being directly assimilated by algae. Hence, concentrations of nitrite and
ammonia are often very low in natural waters. In well-oxygenated coastal waters, nitrate-nitrogen is the dominant
species of nitrogen.
Figure 3-18: Nitrate level measured at different stations
0
0.5
1
1.5
2
2.5
3
3.5
4
S B S B S B S B S B S B S B S B S B S B S B S B S B S B
HT LT HT LT HT LT LT HT LT HT LT HT LT HT
MW01 MW02 MW03 MW04 MW05 MW06 MW07 MW08
Nitrate (mg/L)
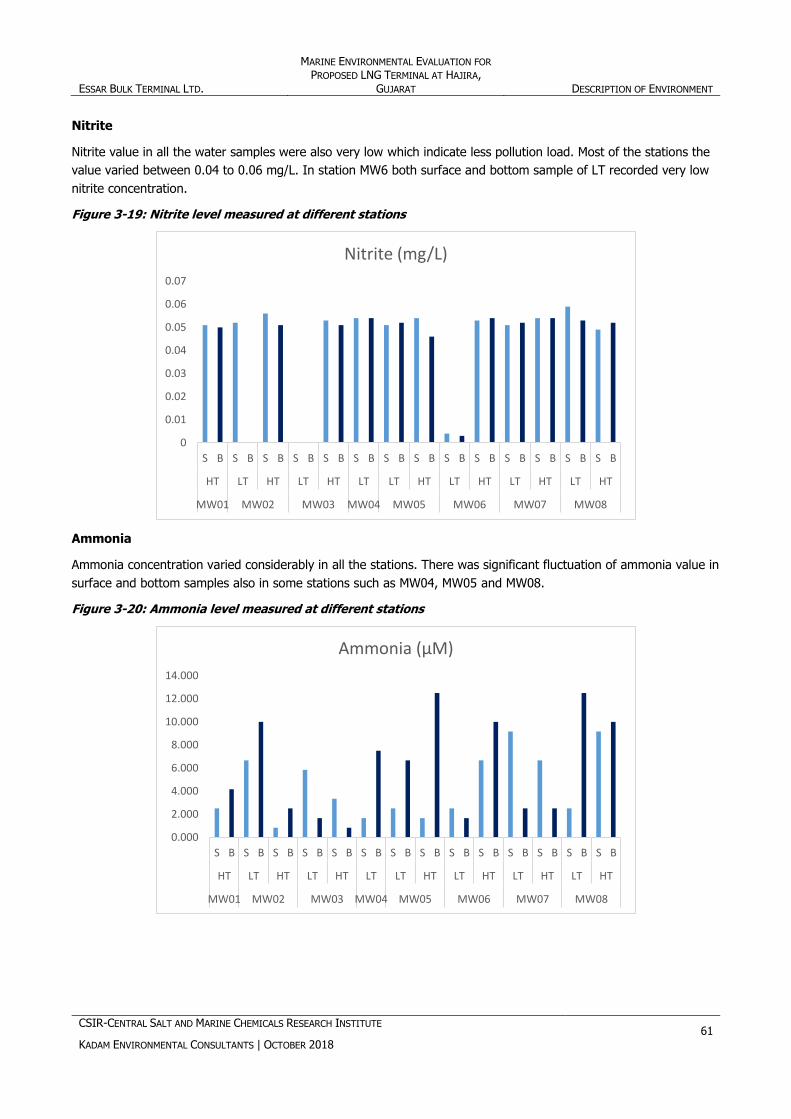
ESSAR BULK TERMINAL LTD.
MARINE ENVIRONMENTAL EVALUATION FOR
PROPOSED LNG TERMINAL AT HAJIRA, GUJARAT DESCRIPTION OF ENVIRONMENT
CSIR-CENTRAL SALT AND MARINE CHEMICALS RESEARCH INSTITUTE
KADAM ENVIRONMENTAL CONSULTANTS | OCTOBER 2018 61
Nitrite
Nitrite value in all the water samples were also very low which indicate less pollution load. Most of the stations the
value varied between 0.04 to 0.06 mg/L. In station MW6 both surface and bottom sample of LT recorded very low
nitrite concentration.
Figure 3-19: Nitrite level measured at different stations
Ammonia
Ammonia concentration varied considerably in all the stations. There was significant fluctuation of ammonia value in
surface and bottom samples also in some stations such as MW04, MW05 and MW08.
Figure 3-20: Ammonia level measured at different stations
0
0.01
0.02
0.03
0.04
0.05
0.06
0.07
S B S B S B S B S B S B S B S B S B S B S B S B S B S B
HT LT HT LT HT LT LT HT LT HT LT HT LT HT
MW01 MW02 MW03 MW04 MW05 MW06 MW07 MW08
Nitrite (mg/L)
0.000
2.000
4.000
6.000
8.000
10.000
12.000
14.000
S B S B S B S B S B S B S B S B S B S B S B S B S B S B
HT LT HT LT HT LT LT HT LT HT LT HT LT HT
MW01 MW02 MW03 MW04 MW05 MW06 MW07 MW08
Ammonia (µM)
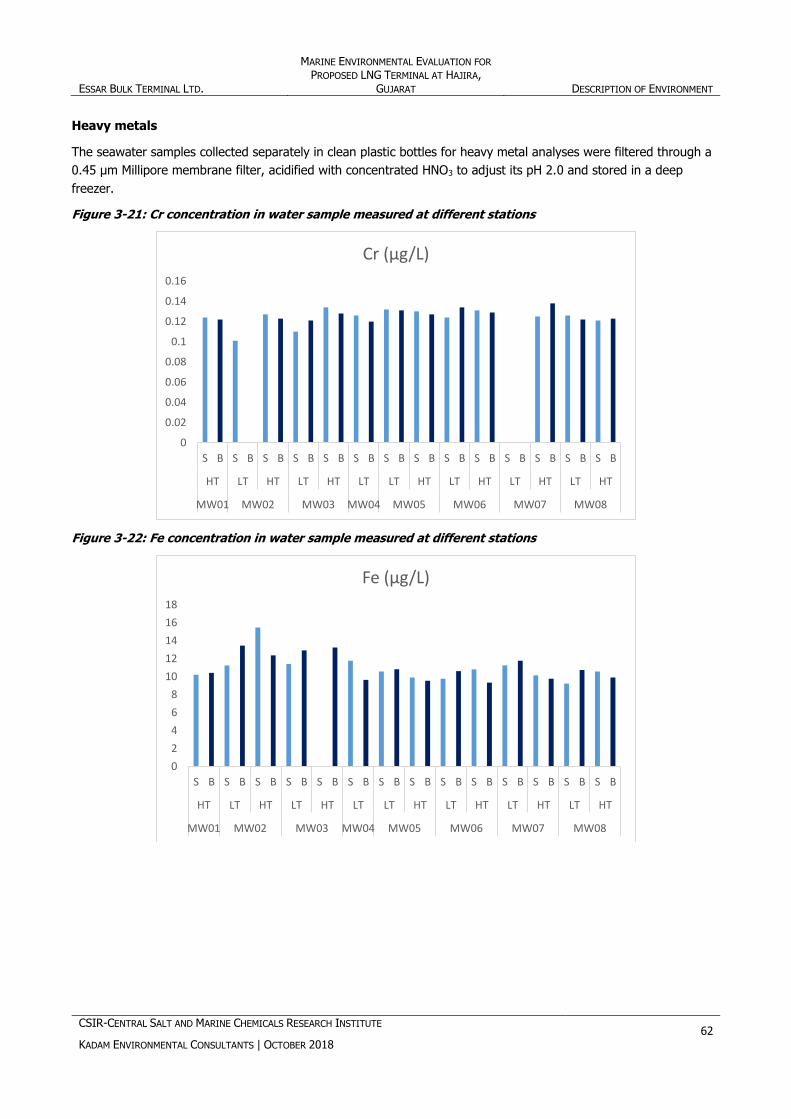
ESSAR BULK TERMINAL LTD.
MARINE ENVIRONMENTAL EVALUATION FOR
PROPOSED LNG TERMINAL AT HAJIRA, GUJARAT DESCRIPTION OF ENVIRONMENT
CSIR-CENTRAL SALT AND MARINE CHEMICALS RESEARCH INSTITUTE
KADAM ENVIRONMENTAL CONSULTANTS | OCTOBER 2018 62
Heavy metals
The seawater samples collected separately in clean plastic bottles for heavy metal analyses were filtered through a
0.45 μm Millipore membrane filter, acidified with concentrated HNO3 to adjust its pH 2.0 and stored in a deep
freezer.
Figure 3-21: Cr concentration in water sample measured at different stations
Figure 3-22: Fe concentration in water sample measured at different stations
0
0.02
0.04
0.06
0.08
0.1
0.12
0.14
0.16
S B S B S B S B S B S B S B S B S B S B S B S B S B S B
HT LT HT LT HT LT LT HT LT HT LT HT LT HT
MW01 MW02 MW03 MW04 MW05 MW06 MW07 MW08
Cr (µg/L)
0
2
4
6
8
10
12
14
16
18
S B S B S B S B S B S B S B S B S B S B S B S B S B S B
HT LT HT LT HT LT LT HT LT HT LT HT LT HT
MW01 MW02 MW03 MW04 MW05 MW06 MW07 MW08
Fe (µg/L)

ESSAR BULK TERMINAL LTD.
MARINE ENVIRONMENTAL EVALUATION FOR
PROPOSED LNG TERMINAL AT HAJIRA, GUJARAT DESCRIPTION OF ENVIRONMENT
CSIR-CENTRAL SALT AND MARINE CHEMICALS RESEARCH INSTITUTE
KADAM ENVIRONMENTAL CONSULTANTS | OCTOBER 2018 63
Figure 3-23: Ni concentration in water sample measured at different stations
Figure 3-24: Cu concentration in water sample measured at different stations
0
0.2
0.4
0.6
0.8
1
1.2
1.4
1.6
1.8
2
S B S B S B S B S B S B S B S B S B S B S B S B S B S B
HT LT HT LT HT LT LT HT LT HT LT HT LT HT
MW01 MW02 MW03 MW04 MW05 MW06 MW07 MW08
Ni (µg/L)
0
0.2
0.4
0.6
0.8
1
1.2
S B S B S B S B S B S B S B S B S B S B S B S B S B S B
HT LT HT LT HT LT LT HT LT HT LT HT LT HT
MW01 MW02 MW03 MW04 MW05 MW06 MW07 MW08
Cu (µg/L)
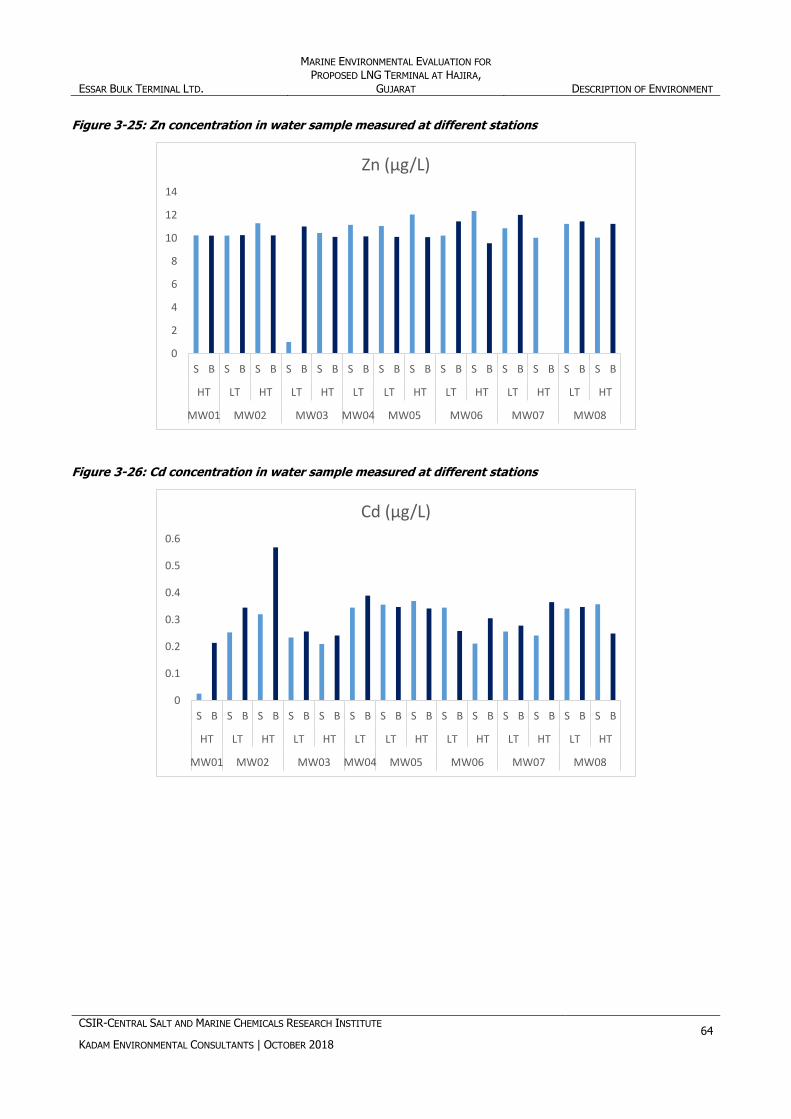
ESSAR BULK TERMINAL LTD.
MARINE ENVIRONMENTAL EVALUATION FOR
PROPOSED LNG TERMINAL AT HAJIRA, GUJARAT DESCRIPTION OF ENVIRONMENT
CSIR-CENTRAL SALT AND MARINE CHEMICALS RESEARCH INSTITUTE
KADAM ENVIRONMENTAL CONSULTANTS | OCTOBER 2018 64
Figure 3-25: Zn concentration in water sample measured at different stations
Figure 3-26: Cd concentration in water sample measured at different stations
0
2
4
6
8
10
12
14
S B S B S B S B S B S B S B S B S B S B S B S B S B S B
HT LT HT LT HT LT LT HT LT HT LT HT LT HT
MW01 MW02 MW03 MW04 MW05 MW06 MW07 MW08
Zn (µg/L)
0
0.1
0.2
0.3
0.4
0.5
0.6
S B S B S B S B S B S B S B S B S B S B S B S B S B S B
HT LT HT LT HT LT LT HT LT HT LT HT LT HT
MW01 MW02 MW03 MW04 MW05 MW06 MW07 MW08
Cd (µg/L)
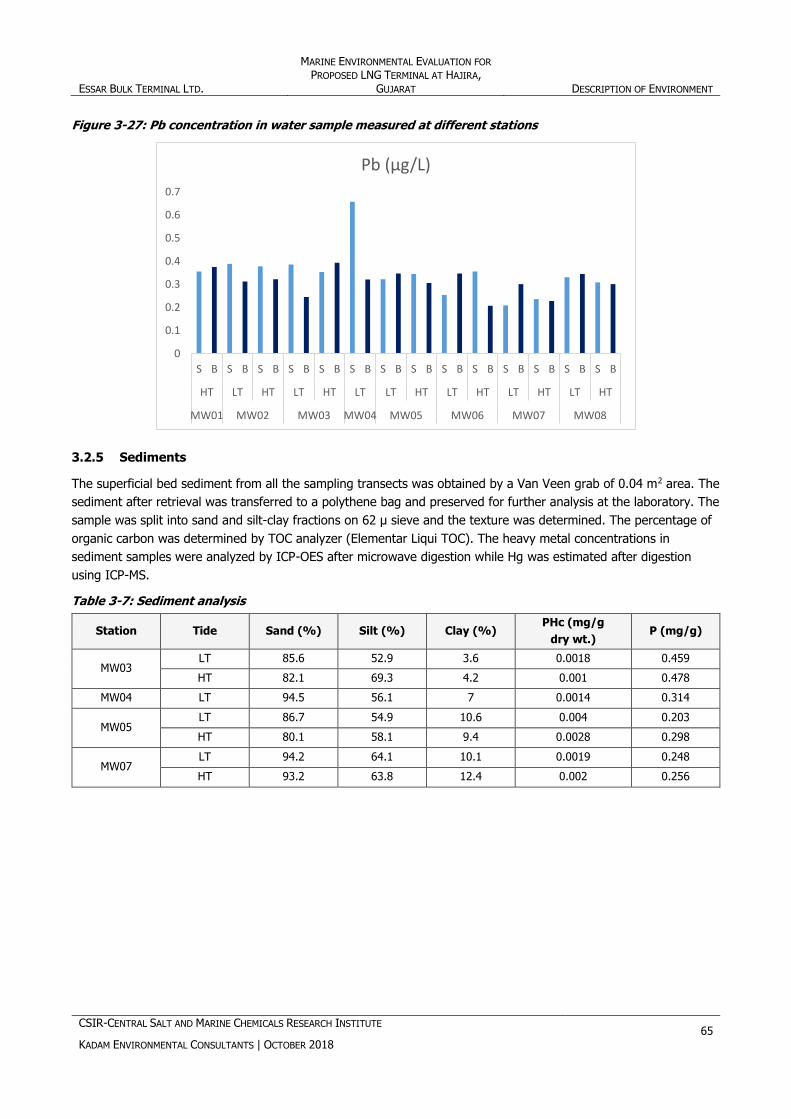
ESSAR BULK TERMINAL LTD.
MARINE ENVIRONMENTAL EVALUATION FOR
PROPOSED LNG TERMINAL AT HAJIRA, GUJARAT DESCRIPTION OF ENVIRONMENT
CSIR-CENTRAL SALT AND MARINE CHEMICALS RESEARCH INSTITUTE
KADAM ENVIRONMENTAL CONSULTANTS | OCTOBER 2018 65
Figure 3-27: Pb concentration in water sample measured at different stations
3.2.5 Sediments
The superficial bed sediment from all the sampling transects was obtained by a Van Veen grab of 0.04 m2 area. The
sediment after retrieval was transferred to a polythene bag and preserved for further analysis at the laboratory. The
sample was split into sand and silt-clay fractions on 62 µ sieve and the texture was determined. The percentage of
organic carbon was determined by TOC analyzer (Elementar Liqui TOC). The heavy metal concentrations in
sediment samples were analyzed by ICP-OES after microwave digestion while Hg was estimated after digestion
using ICP-MS.
Table 3-7: Sediment analysis
Station Tide Sand (%) Silt (%) Clay (%) PHc (mg/g
dry wt.) P (mg/g)
MW03 LT 85.6 52.9 3.6 0.0018 0.459
HT 82.1 69.3 4.2 0.001 0.478
MW04 LT 94.5 56.1 7 0.0014 0.314
MW05 LT 86.7 54.9 10.6 0.004 0.203
HT 80.1 58.1 9.4 0.0028 0.298
MW07 LT 94.2 64.1 10.1 0.0019 0.248
HT 93.2 63.8 12.4 0.002 0.256
0
0.1
0.2
0.3
0.4
0.5
0.6
0.7
S B S B S B S B S B S B S B S B S B S B S B S B S B S B
HT LT HT LT HT LT LT HT LT HT LT HT LT HT
MW01 MW02 MW03 MW04 MW05 MW06 MW07 MW08
Pb (µg/L)

ESSAR BULK TERMINAL LTD. MARINE ENVIRONMENTAL EVALUATION FOR PROPOSED LNG
TERMINAL AT HAJIRA, GUJARAT DESCRIPTION OF ENVIRONMENT
CSIR-CENTRAL SALT AND MARINE CHEMICALS RESEARCH INSTITUTE
KADAM ENVIRONMENTAL CONSULTANTS | OCTOBER 2018 66
Table 3-8: Sediment heavy metals analysis (all analysis was done with 1 g dry wt. of sediment)
Sr. No Station Tide Cu (mg/g) Ni (mg/g) Al (mg/g) Cr (mg/g) Mn (mg/g) Zn (mg/g) Co (mg/g) Pb (mg/g) Cd (µg/g) Fe (mg/g)
1 MW03
LT 0.102 0.062 2.654 0.251 1.221 0.122 0.057 0.0201 0.21 5.562
2 HT 0.122 0.073 2.724 0.229 1.234 0.127 0.052 0.0209 0.27 4.125
3 MW04 LT 0.146 0.098 2.512 0.132 1.227 0.118 0.048 0.0134 0.31 5.396
4
MW05
LT 0.136 0.085 1.256 0.127 1.093 0.098 0.039 0.0064 0.19 4.002
5 HT 0.141 0.089 1.389 0.122 1.097 0.094 0.038 0.0062 0.21 4.012
6
MW07
LT 0.145 0.088 1.394 0.151 1.121 0.087 0.034 0.0078 0.09 3.048
7 HT 0.148 0.105 1.258 0.142 1.128 0.081 0.031 0.0074 0.014 3.095

ESSAR BULK TERMINAL LTD.
MARINE ENVIRONMENTAL EVALUATION FOR
PROPOSED LNG TERMINAL AT HAJIRA, GUJARAT DESCRIPTION OF ENVIRONMENT
CSIR-CENTRAL SALT AND MARINE CHEMICALS RESEARCH INSTITUTE
KADAM ENVIRONMENTAL CONSULTANTS | OCTOBER 2018 67
Figure 3-28: Cu concentration in sediment sample measured at different stations
Figure 3-29: Ni concentration in sediment sample measured at different stations
Figure 3-30: Al concentration in sediment sample measured at different stations
0
0.05
0.1
0.15
0.2
LT HT LT LT HT LT HT
MW03 MW04 MW05 MW07
Cu (mg/g)
0
0.02
0.04
0.06
0.08
0.1
0.12
LT HT LT LT HT LT HT
MW03 MW04 MW05 MW07
Ni (mg/g)
0
0.5
1
1.5
2
2.5
3
LT HT LT LT HT LT HT
MW03 MW04 MW05 MW07
Al (mg/g)
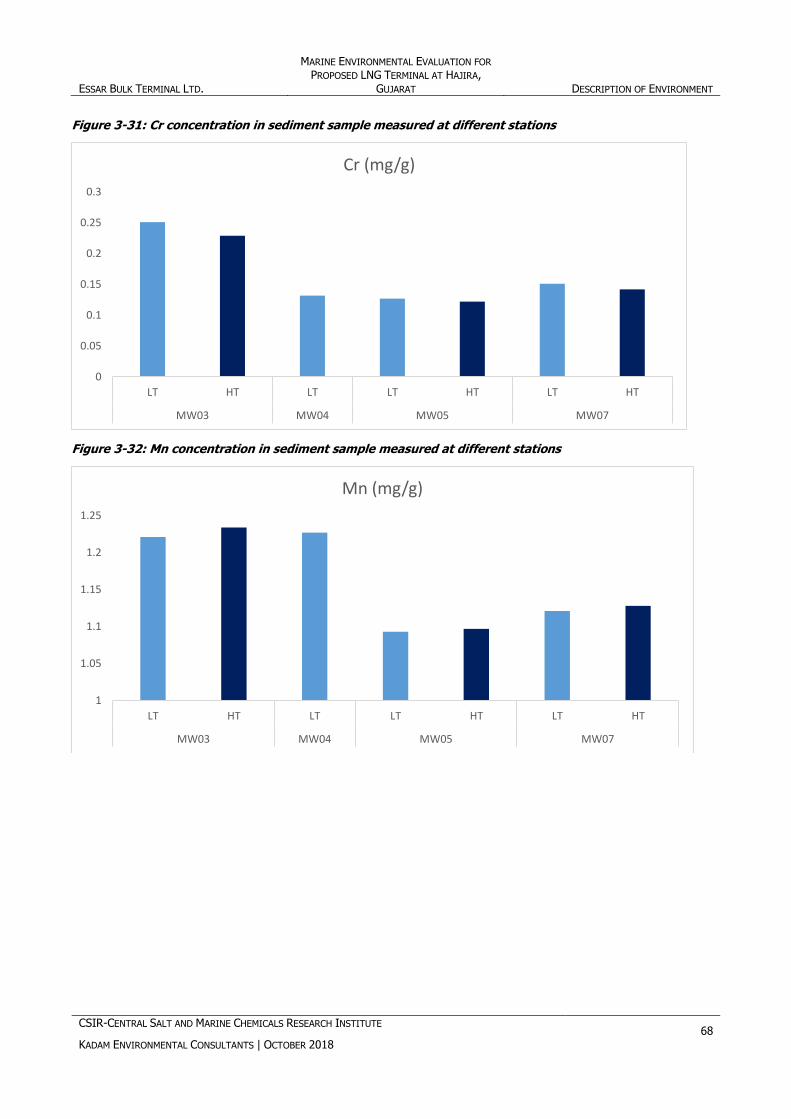
ESSAR BULK TERMINAL LTD.
MARINE ENVIRONMENTAL EVALUATION FOR
PROPOSED LNG TERMINAL AT HAJIRA, GUJARAT DESCRIPTION OF ENVIRONMENT
CSIR-CENTRAL SALT AND MARINE CHEMICALS RESEARCH INSTITUTE
KADAM ENVIRONMENTAL CONSULTANTS | OCTOBER 2018 68
Figure 3-31: Cr concentration in sediment sample measured at different stations
Figure 3-32: Mn concentration in sediment sample measured at different stations
0
0.05
0.1
0.15
0.2
0.25
0.3
LT HT LT LT HT LT HT
MW03 MW04 MW05 MW07
Cr (mg/g)
1
1.05
1.1
1.15
1.2
1.25
LT HT LT LT HT LT HT
MW03 MW04 MW05 MW07
Mn (mg/g)
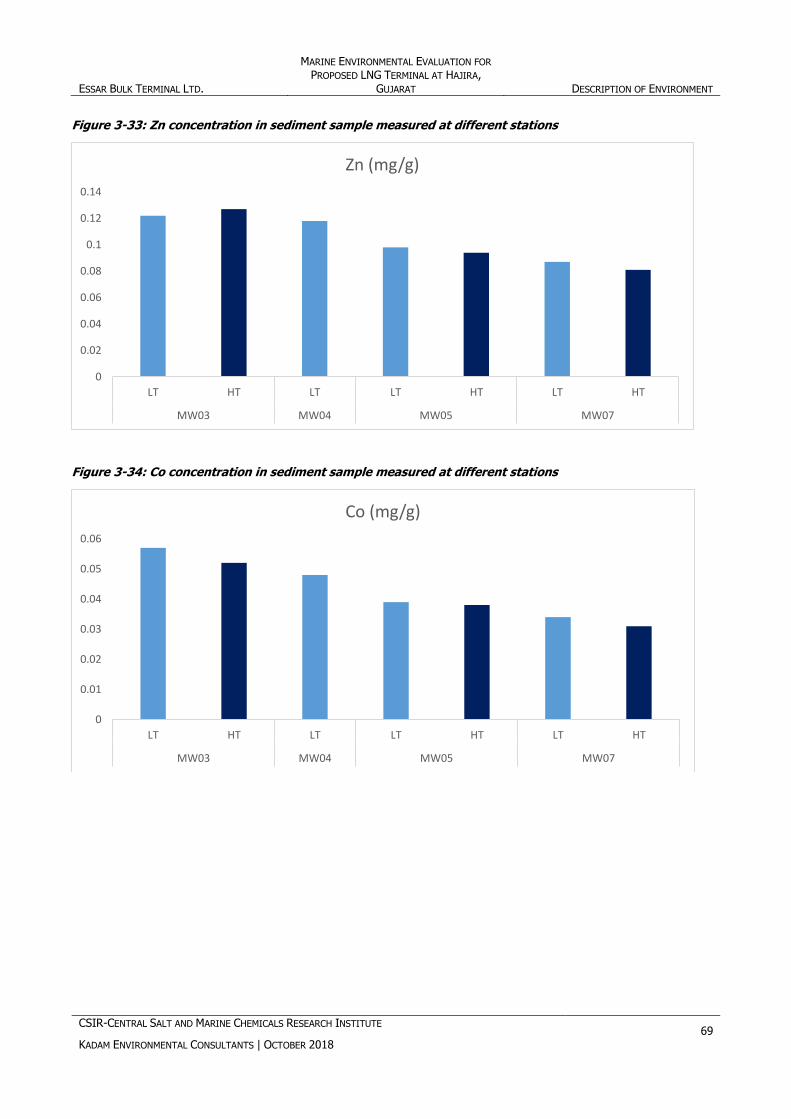
ESSAR BULK TERMINAL LTD.
MARINE ENVIRONMENTAL EVALUATION FOR
PROPOSED LNG TERMINAL AT HAJIRA, GUJARAT DESCRIPTION OF ENVIRONMENT
CSIR-CENTRAL SALT AND MARINE CHEMICALS RESEARCH INSTITUTE
KADAM ENVIRONMENTAL CONSULTANTS | OCTOBER 2018 69
Figure 3-33: Zn concentration in sediment sample measured at different stations
Figure 3-34: Co concentration in sediment sample measured at different stations
0
0.02
0.04
0.06
0.08
0.1
0.12
0.14
LT HT LT LT HT LT HT
MW03 MW04 MW05 MW07
Zn (mg/g)
0
0.01
0.02
0.03
0.04
0.05
0.06
LT HT LT LT HT LT HT
MW03 MW04 MW05 MW07
Co (mg/g)
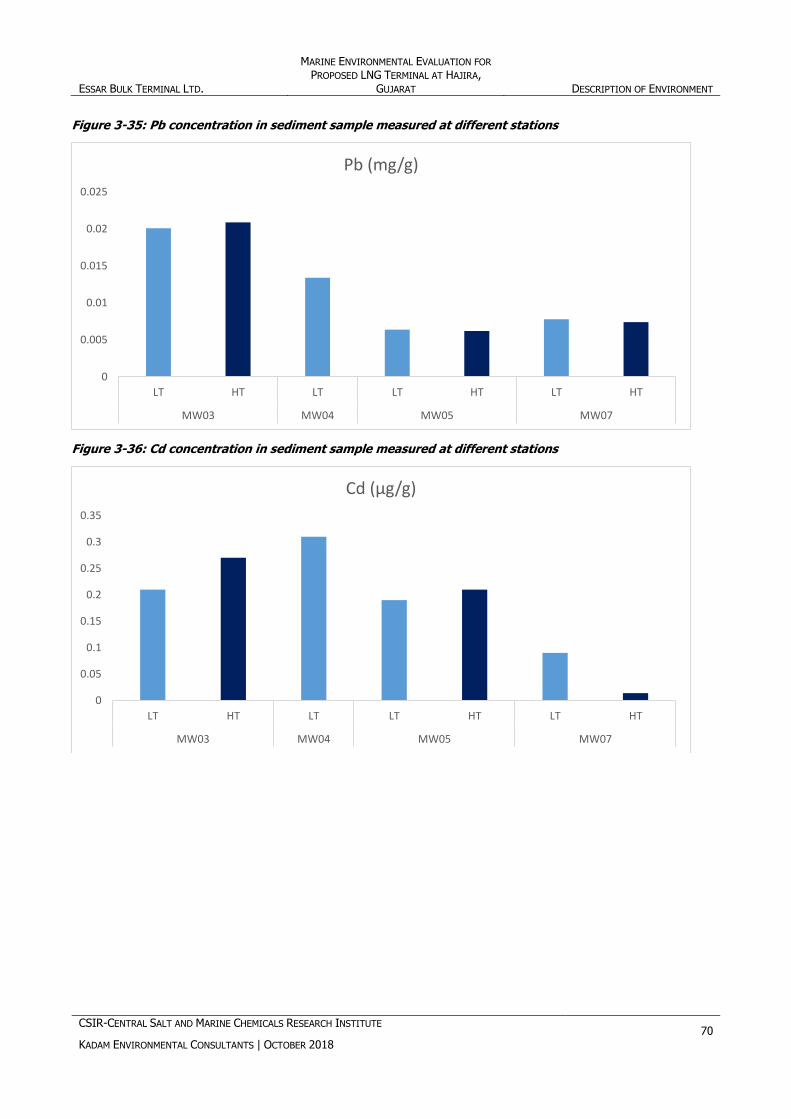
ESSAR BULK TERMINAL LTD.
MARINE ENVIRONMENTAL EVALUATION FOR
PROPOSED LNG TERMINAL AT HAJIRA, GUJARAT DESCRIPTION OF ENVIRONMENT
CSIR-CENTRAL SALT AND MARINE CHEMICALS RESEARCH INSTITUTE
KADAM ENVIRONMENTAL CONSULTANTS | OCTOBER 2018 70
Figure 3-35: Pb concentration in sediment sample measured at different stations
Figure 3-36: Cd concentration in sediment sample measured at different stations
0
0.005
0.01
0.015
0.02
0.025
LT HT LT LT HT LT HT
MW03 MW04 MW05 MW07
Pb (mg/g)
0
0.05
0.1
0.15
0.2
0.25
0.3
0.35
LT HT LT LT HT LT HT
MW03 MW04 MW05 MW07
Cd (µg/g)

ESSAR BULK TERMINAL LTD.
MARINE ENVIRONMENTAL EVALUATION FOR
PROPOSED LNG TERMINAL AT HAJIRA, GUJARAT DESCRIPTION OF ENVIRONMENT
CSIR-CENTRAL SALT AND MARINE CHEMICALS RESEARCH INSTITUTE
KADAM ENVIRONMENTAL CONSULTANTS | OCTOBER 2018 71
Figure 3-37: Fe concentration in sediment sample measured at different stations
Soil quality
For soil quality study distribution of sand, silt and clay were analysed for total four stations that is MW 03, MW04,
MW05 and MW07. Sand concentration varied from 80 to 93%. Around 50 to 70% silt were recorded in all the stations.
Clay concentrations were comparatively less which varied from 3 to 13%. Due to continuous dredging continuous change in the soil composition was recorded.
Figure 3-38: Sand quality of different stations
0
1
2
3
4
5
6
LT HT LT LT HT LT HT
MW03 MW04 MW05 MW07
Fe (mg/g)
70
75
80
85
90
95
100
LT HT LT LT HT LT HT
MW03 MW04 MW05 MW07
Sand (%)

ESSAR BULK TERMINAL LTD.
MARINE ENVIRONMENTAL EVALUATION FOR
PROPOSED LNG TERMINAL AT HAJIRA, GUJARAT DESCRIPTION OF ENVIRONMENT
CSIR-CENTRAL SALT AND MARINE CHEMICALS RESEARCH INSTITUTE
KADAM ENVIRONMENTAL CONSULTANTS | OCTOBER 2018 72
Figure 3-39: Silt content in different stations
Figure 3-40: Clay content in different stations
3.2.6 Marine ecology
The baseline environmental quality was assessed through field studies within the impact zone for marine biology
with specific reference to environmental aspects, which may have a bearing on the impacts of the proposed project.
The baseline environmental quality was assessed by CSIR-CSMCRI, Bhavnagar.
Sub tidal ecology
Flora and fauna
Sampling procedure
Polyethylene bucket and Differential Water Sampler (DDWS) respectively were used for sampling surface and
bottom waters for the estimation of phytoplankton pigments and population.
0
10
20
30
40
50
60
70
80
LT HT LT LT HT LT HT
MW03 MW04 MW05 MW07
Silt (%)
0
2
4
6
8
10
12
14
LT HT LT LT HT LT HT
MW03 MW04 MW05 MW07
Clay (%)

ESSAR BULK TERMINAL LTD.
MARINE ENVIRONMENTAL EVALUATION FOR
PROPOSED LNG TERMINAL AT HAJIRA, GUJARAT DESCRIPTION OF ENVIRONMENT
CSIR-CENTRAL SALT AND MARINE CHEMICALS RESEARCH INSTITUTE
KADAM ENVIRONMENTAL CONSULTANTS | OCTOBER 2018 73
Sample for phytoplankton cell count was fixed in Lugol’s iodine and a few drops of 3% buffered formaldehyde. For
station 1 only hightide sampling was performed. Due to some technical problem and hard bottom low tide sampling
was not done.
Zooplankton samples were collected by oblique haul using a Heron Tranter net with an attached calibrated flow
meter. All collections were of 5 minutes duration. Samples were preserved in 5% buffered formaldehyde. Sediment
samples for subtidal macrobenthos were collected using a van-Veen grab of 0.04 m2 area. Intertidal collections
between the High Tide Line (HTL) and the Low Tide Line (LTL) were done using quadrats of 0.04 m2 area. The
sediment was sieved through a 0.5 mm mesh sieve and animals retained were preserved in 5% buffered
formaldehyde Rose Bengal.
Pigments
The pigments were analyzed from known volume of water which was filtered through 0.45 µm filter paper. The
filter paper was extracted with 90% acetone. For estimation of chlorophyll and pheaophytin, the acetone extract
was spectrophotometrically analyzed between 630 and 750nm before and after dilute acid treatment. The pigment
concentration was calculated using following formula.
Cholorophyll a (Ca) = 11.85(Absorbance664 − 1.54(Absorbance647)) − 0.08(Absorbance630)
Chlorophyll a (mg L) =Ca × Volume of acetone extract
Volum eof sample⁄
where 664b and 665a are the absorbance values of the acetone extract before and after acidification, respectively.
Phytoplankton
The phytoplankton samples were collected from the surface of the water column during low and high tides at all
stations by using clean plastic bucket. Hundred liters of seawater sample was concentrated to 250 mL by filtering
through plankton net (20 µm pore size). The concentrated samples were immediately preserved by adding 5 mL of
40% formalin and 2 mL of Lugol's iodine at the site itself. In the laboratory the samples were concentrated by using
centrifuge and made up to the final volume of 25 mL. Finally concentrated samples were preserved in 4% formalin
prepared in seawater. These samples were subjected to qualitative and quantitative analysis of phytoplankton. For
the quantitative estimation, Sedgewick Rafter counting cell was used and for qualitative identification microscopic
examination was followed. The standard monographs and other published literature were used for identification
(Husted, 1930; Peragallo, 1965).
Zooplanktons
The zooplankton in the samples were determined by filtering 100 liters of seawater through 300 µm pore size
plankton net and the collected zooplankton samples were kept in 250 mL of seawater having 4% formalin. The
samples were stored in wide mouth plastic bottles under dark conditions. The number of zooplankton in the
samples were counted by using counting a chamber supplied by Hydro-Bios (Catalog No.435010) and identified
microscopically.
Benthic fauna
The sediment for benthic fauna were collected from the sea floor using Van-Veen grab having an area of 0.0663
m2. The collected sediments were made to slurry with seawater and sieved through 40-pore size (ASTM, 430 µm
mesh size) sieve. The retained organisms on the sieve were preserved with 4% formalin in seawater for further
studies. The benthic fauna were sorted to group level under microscope. After counting the individuals, fresh
weight of each group was determined. The results were calculated and expressed as number or weight of benthos
per m2 area of the sea floor.
Benthos diversity was comparatively low in all the stations. Continuous ship movement and dredging activity may
result the disturbance in the benthic communities. Both gastropod and bivalve shells were collected from the

ESSAR BULK TERMINAL LTD.
MARINE ENVIRONMENTAL EVALUATION FOR
PROPOSED LNG TERMINAL AT HAJIRA, GUJARAT DESCRIPTION OF ENVIRONMENT
CSIR-CENTRAL SALT AND MARINE CHEMICALS RESEARCH INSTITUTE
KADAM ENVIRONMENTAL CONSULTANTS | OCTOBER 2018 74
benthic samples. Due to dredging mechanical damage was observed. Therefore, many broken shells were found.
Maximum numbers of benthic samples were collected from station number 7 which is an offshore station. Minimum
numbers were found in the station 4, LT sample, and station 5 HT sample. However, the data do not represent
proper benthic community. Generic diversity and numerical diversity were also low. Numerical diversity was
recorded to be maximum in LT sample of station 7 (offshore station). Due to low generic and numerical diversity
SWDI was not calculated for any of the station.
Table 3-9: Observed benthic fauna in marine sediments
Station Tide Generic diversity Numerical diversity
(No./m2) Observation
1 HT 2 15.56 Bivalve, Gastropoda
LT NF NF NF
2 HT 3 23.53 Clam, Gastropoda
LT NF NF NF
3 HT NF NF NF
LT NF NF NF
4 HT NF NF NF
LT NF NF NF
5 HT 3 28.38 Clam, broken Gastropoda
LT 2 35.72 Clam, Gastropoda
6 HT NF NF NF
LT NF NF NF
7 HT NF NF NF
LT 3 57.8 Bivalve, Gastropoda
8 HT NF NF NF
LT NF NF NF
NF: Not Found
Figure 3-41: Bivalve and gastropod shell collected from benthic samples

ESSAR BULK TERMINAL LTD.
MARINE ENVIRONMENTAL EVALUATION FOR
PROPOSED LNG TERMINAL AT HAJIRA, GUJARAT DESCRIPTION OF ENVIRONMENT
CSIR-CENTRAL SALT AND MARINE CHEMICALS RESEARCH INSTITUTE
KADAM ENVIRONMENTAL CONSULTANTS | OCTOBER 2018 75
Chlorophyll estimation
In most of the samples chlorophyll content was negligible. Interestingly bottom sample of Station 2 recorded
consistent amount of Chlorophyll A. It was recorded that the detection limit of chlorophyll A is 0.7 ng/m3 and
chlorophyll B is 0.4 ng/m3. In the present study in majority of the samples the chlorophyll concentration is below
detection limit. However, in the high tide surface water sample 6.42 ng/m3 of chlorophyll A was detected in MW6.
Among, HT bottom water samples, 21.78 and 5.76 ng/m3 of chlorophyll A was detected in station MW01 and MW06
respectively. In remaining samples no Chlorophyll A was detected. Chlorophyll B and C were not detected in any of
the samples.
In the surface water of low tide sample, chlorophyll A was detected in station MW03 and MW04 with a
concentration of 0.99 and 1.45 ng/m3 respectively. Chlorophyll level was below detectable limit in the bottom water
of low tide sample.
Table 3-10: Pigments in High Tide (Surface Water) during winter 2018
Sr. no Parameters Unit MW01 MW02 MW03 MW05 MW06 MW07 MW08
1 Chl A mg/m3 ND ND ND ND 6.42 ND ND
2 Chl B mg/m3 ND ND ND ND 4.06 ND ND
3 Chl C mg/m3 ND ND ND ND 9.78 0.04 ND
ND: Not detected
MW 04 Samples were not collected due to unfavourable conditions

ESSAR BULK TERMINAL LTD.
MARINE ENVIRONMENTAL EVALUATION FOR
PROPOSED LNG TERMINAL AT HAJIRA, GUJARAT DESCRIPTION OF ENVIRONMENT
CSIR-CENTRAL SALT AND MARINE CHEMICALS RESEARCH INSTITUTE
KADAM ENVIRONMENTAL CONSULTANTS | OCTOBER 2018 76
Table 3-11: Pigments in High Tide (Bottom Water) during winter 2018
Sr. no. Parameters Unit MW01 MW02 MW03 MW05 MW06 MW07 MW08
1 Chl A mg/m3 ND 21.78 ND ND 5.76 ND ND
2 Chl B mg/m3 3.1 30.58 2.96 3.76 3.42 ND ND
3 Chl C mg/m3 ND 13.01 ND ND ND ND ND
ND: Not detected
#MW 04 Samples were not collected due to unfavourable conditions
Table 3-12: Pigments in Low Tide (Surface Water) during winter 2018
Sr. no. Parameters Unit MW02 MW03 MW04 MW05 MW06 MW07 MW08
1 Chl A mg/m3 ND 0.99 1.45 ND ND ND ND
2 Chl B mg/m3 ND 6.12 ND ND ND ND ND
3 Chl C mg/m3 ND ND 2.32 ND ND ND ND
ND: Not detected
MW 01 Samples were not collected due to unfavourable conditions
Table 3-13: Pigments in Low Tide (Bottom Water) during winter 2018
Sr. no Parameters Unit MW02 MW03 MW04 MW05 MW06 MW07 MW08
1 Chl. A mg/m3 ND ND ND ND ND ND ND
2 Chl. B mg/m3 ND ND ND ND ND ND ND
3 Chl. C mg/m3 4.39 ND ND 5.29 ND ND ND
ND: Not detected
MW 01 Samples were not collected due to unfavourable conditions
Phytoplankton
Phytoplankton load and diversity were low in all the station. Majority of the samples were dominated by
Coscinodiscus sp.
Zooplankton
Zooplankton load and diversity were also low in all the stations studied. This may be due to more anthropogenic
activities and ship movement the zooplankton diversity and abundance is less. There is no clear picture about the
abundance of zooplankton change from different sampling sites starting from estuary mouth to open sea. Diversity
was recorded to be less in all the sites. Nauplius was recorded from station MW03. Due to poor diversity and counts
for both phytoplankton and zooplankton the final result was presented in one table (Table 3-14) and no SWDI
value was calculated.
Table 3-14: Both phytoplankton and zooplankton collected from different sampling stations
Station Code High/Low tide
Generic diversity of
Phytoplankton
Generic diversity of zooplankton
Sample code Observation
MW01 High tide ND ND 16 ND
Low tide - - - -
MW02 High tide ND ND 18 ND
Low tide 1 - 23 Coscinodiscus
MW03 High tide 1 - 14 Coscinodiscus
Low tide 1 1 22 Coscinodiscus , Nauplius
MW04 High tide 1 - 15 Coscinodiscus
Low tide ND ND 12 ND

ESSAR BULK TERMINAL LTD.
MARINE ENVIRONMENTAL EVALUATION FOR
PROPOSED LNG TERMINAL AT HAJIRA, GUJARAT DESCRIPTION OF ENVIRONMENT
CSIR-CENTRAL SALT AND MARINE CHEMICALS RESEARCH INSTITUTE
KADAM ENVIRONMENTAL CONSULTANTS | OCTOBER 2018 77
Station Code High/Low tide
Generic diversity of
Phytoplankton
Generic diversity of zooplankton
Sample code Observation
MW05 High tide ND ND 17 ND
Low tide 1 - 7 Coscinodiscus
MW06 High tide ND ND 19 ND
Low tide - 1 1 Diatom
MW07 High tide 1 - 13 Coscinodiscus
Low tide 1 1 4 Coscinodiscus , Nauplius
MW08 High tide ND ND 9 ND
Low tide 1 - 11 Coscinodiscus
Microbiology
HPC was recorded to be high for majority of water samples than sediments. For station 6, 7 and 8 HPC was almost
similar for both water and sediment samples. However for station 1, 2 and 3 water recorded higher counts of HPC
than sediments. For water samples there was no much variation in HPC on both high and low tide sample except
station 4, where HT sample recorded low counts for all types of bacteria.
Enteropathogenic bacterial counts (EMB) were also high for water samples in majority of the stations than
sediments. Water samples from station 4(HT) and 6(LT) did not recorded any enteropathogenic bacteria. The
sediments samples were recorded 10 to 90 CFU/ml of EMB counts. Consistent presence of EMB indicate disposal of
domestic sewage and other anthropogenic activities in the area of sampling.
Both HT and LT samples of water recorded higher numbers of Vibrio counts than sediment samples. Both yellow
and green colonies were counted. Presence of relatively high counts of Vibrio may be due to anthropogenic
activities in the surrounding area.
Pseudomonas type bacteria were also recorded in both water and sediments samples. Interestingly in the estuary
side sampling stations all the EMB, Vibrio, Pseudomonas and Aeromonas counts were recorded to be high. In the
offshore sampling stations the counts gradually lesser down. These indicate that the estuarine side has more
microbial pollution.
Table 3-15: Microbiology of seawater (high tide) during winter 2018
Sr. no
Count MW01 MW02 MW03 MW04 MW05 MW06 MW07 MW08
1 Total bacterial
count (ZMA) 3.08 × 10³ 2.90 × 10³ 2.82 × 10³ 1 × 101 2.72 × 10³ 2.30 × 10³ 1.32 × 10³ 2.18 × 10³
2
Entero-
bacterial
count (EMB)
0 1.4 × 10² 1.5 × 10² 0 1.7 × 10² 1.5 × 10² 2 × 101 1 × 101
3 Vibrio count
(TCBS) 1 × 101 5.6 × 10² 1.32 × 10³ 0 2.8 × 10² 1.4 × 10² 0 1 × 101
4
Pseudomonas
isolation agar
base
1.0 × 10² 2.14 × 10³ 1.90 × 10³ 0 1.19 × 10³ 9.8 × 10² 2.0 × 10² 5.4 × 10²
5
Aeromonas
isolation
medium base
0 2 × 101 1.4 × 10² 0 1 × 101 0 0 0
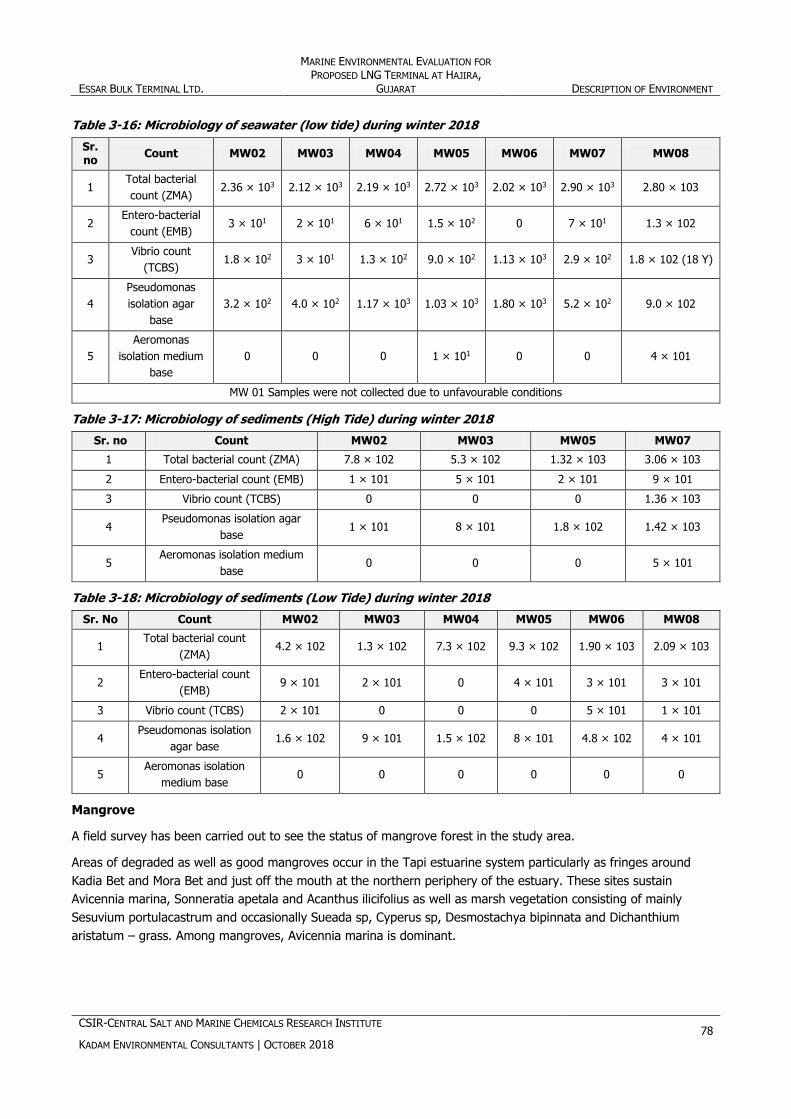
ESSAR BULK TERMINAL LTD.
MARINE ENVIRONMENTAL EVALUATION FOR
PROPOSED LNG TERMINAL AT HAJIRA, GUJARAT DESCRIPTION OF ENVIRONMENT
CSIR-CENTRAL SALT AND MARINE CHEMICALS RESEARCH INSTITUTE
KADAM ENVIRONMENTAL CONSULTANTS | OCTOBER 2018 78
Table 3-16: Microbiology of seawater (low tide) during winter 2018
Sr. no
Count MW02 MW03 MW04 MW05 MW06 MW07 MW08
1 Total bacterial
count (ZMA) 2.36 × 10³ 2.12 × 10³ 2.19 × 10³ 2.72 × 10³ 2.02 × 10³ 2.90 × 10³ 2.80 × 10³
2 Entero-bacterial
count (EMB) 3 × 101 2 × 101 6 × 101 1.5 × 10² 0 7 × 101 1.3 × 10²
3 Vibrio count
(TCBS) 1.8 × 10² 3 × 101 1.3 × 10² 9.0 × 10² 1.13 × 10³ 2.9 × 10² 1.8 × 10² (18 Y)
4
Pseudomonas
isolation agar
base
3.2 × 10² 4.0 × 10² 1.17 × 10³ 1.03 × 10³ 1.80 × 10³ 5.2 × 10² 9.0 × 10²
5
Aeromonas
isolation medium
base
0 0 0 1 × 101 0 0 4 × 101
MW 01 Samples were not collected due to unfavourable conditions
Table 3-17: Microbiology of sediments (High Tide) during winter 2018
Sr. no Count MW02 MW03 MW05 MW07
1 Total bacterial count (ZMA) 7.8 × 10² 5.3 × 10² 1.32 × 10³ 3.06 × 10³
2 Entero-bacterial count (EMB) 1 × 101 5 × 101 2 × 101 9 × 101
3 Vibrio count (TCBS) 0 0 0 1.36 × 10³
4 Pseudomonas isolation agar
base 1 × 101 8 × 101 1.8 × 10² 1.42 × 10³
5 Aeromonas isolation medium
base 0 0 0 5 × 101
Table 3-18: Microbiology of sediments (Low Tide) during winter 2018
Sr. No Count MW02 MW03 MW04 MW05 MW06 MW08
1 Total bacterial count
(ZMA) 4.2 × 10² 1.3 × 10² 7.3 × 10² 9.3 × 10² 1.90 × 10³ 2.09 × 10³
2 Entero-bacterial count
(EMB) 9 × 101 2 × 101 0 4 × 101 3 × 101 3 × 101
3 Vibrio count (TCBS) 2 × 101 0 0 0 5 × 101 1 × 101
4 Pseudomonas isolation
agar base 1.6 × 10² 9 × 101 1.5 × 10² 8 × 101 4.8 × 10² 4 × 101
5 Aeromonas isolation
medium base 0 0 0 0 0 0
Mangrove
A field survey has been carried out to see the status of mangrove forest in the study area.
Areas of degraded as well as good mangroves occur in the Tapi estuarine system particularly as fringes around
Kadia Bet and Mora Bet and just off the mouth at the northern periphery of the estuary. These sites sustain
Avicennia marina, Sonneratia apetala and Acanthus ilicifolius as well as marsh vegetation consisting of mainly
Sesuvium portulacastrum and occasionally Sueada sp, Cyperus sp, Desmostachya bipinnata and Dichanthium
aristatum – grass. Among mangroves, Avicennia marina is dominant.
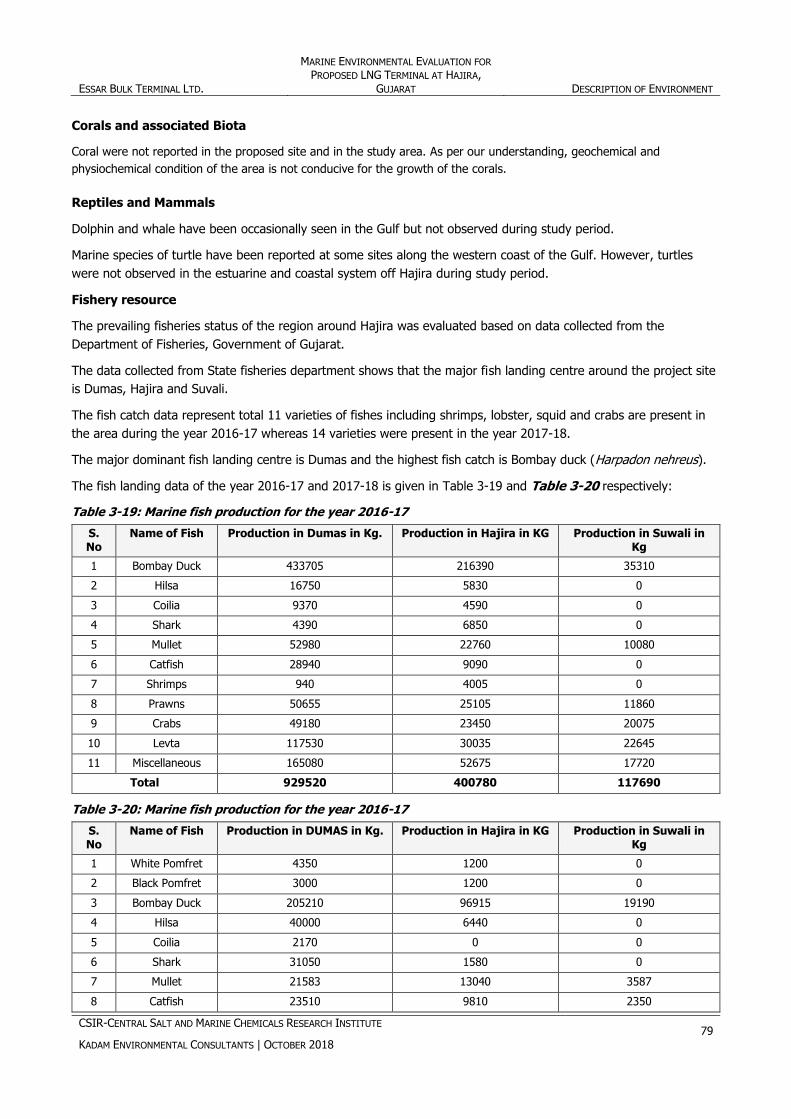
ESSAR BULK TERMINAL LTD.
MARINE ENVIRONMENTAL EVALUATION FOR
PROPOSED LNG TERMINAL AT HAJIRA, GUJARAT DESCRIPTION OF ENVIRONMENT
CSIR-CENTRAL SALT AND MARINE CHEMICALS RESEARCH INSTITUTE
KADAM ENVIRONMENTAL CONSULTANTS | OCTOBER 2018 79
Corals and associated Biota
Coral were not reported in the proposed site and in the study area. As per our understanding, geochemical and
physiochemical condition of the area is not conducive for the growth of the corals.
Reptiles and Mammals
Dolphin and whale have been occasionally seen in the Gulf but not observed during study period.
Marine species of turtle have been reported at some sites along the western coast of the Gulf. However, turtles
were not observed in the estuarine and coastal system off Hajira during study period.
Fishery resource
The prevailing fisheries status of the region around Hajira was evaluated based on data collected from the
Department of Fisheries, Government of Gujarat.
The data collected from State fisheries department shows that the major fish landing centre around the project site
is Dumas, Hajira and Suvali.
The fish catch data represent total 11 varieties of fishes including shrimps, lobster, squid and crabs are present in
the area during the year 2016-17 whereas 14 varieties were present in the year 2017-18.
The major dominant fish landing centre is Dumas and the highest fish catch is Bombay duck (Harpadon nehreus).
The fish landing data of the year 2016-17 and 2017-18 is given in Table 3-19 and Table 3-20 respectively:
Table 3-19: Marine fish production for the year 2016-17
S. No
Name of Fish Production in Dumas in Kg. Production in Hajira in KG Production in Suwali in Kg
1 Bombay Duck 433705 216390 35310
2 Hilsa 16750 5830 0
3 Coilia 9370 4590 0
4 Shark 4390 6850 0
5 Mullet 52980 22760 10080
6 Catfish 28940 9090 0
7 Shrimps 940 4005 0
8 Prawns 50655 25105 11860
9 Crabs 49180 23450 20075
10 Levta 117530 30035 22645
11 Miscellaneous 165080 52675 17720
Total 929520 400780 117690
Table 3-20: Marine fish production for the year 2016-17
S. No
Name of Fish Production in DUMAS in Kg. Production in Hajira in KG Production in Suwali in Kg
1 White Pomfret 4350 1200 0
2 Black Pomfret 3000 1200 0
3 Bombay Duck 205210 96915 19190
4 Hilsa 40000 6440 0
5 Coilia 2170 0 0
6 Shark 31050 1580 0
7 Mullet 21583 13040 3587
8 Catfish 23510 9810 2350
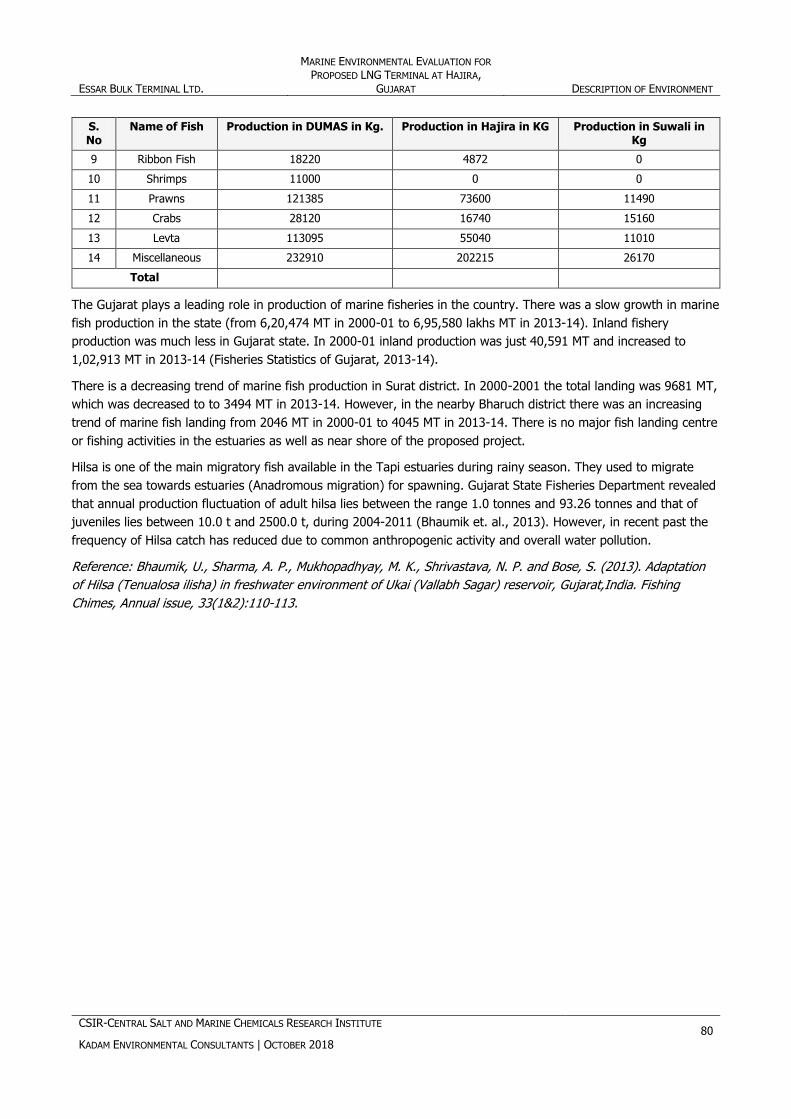
ESSAR BULK TERMINAL LTD.
MARINE ENVIRONMENTAL EVALUATION FOR
PROPOSED LNG TERMINAL AT HAJIRA, GUJARAT DESCRIPTION OF ENVIRONMENT
CSIR-CENTRAL SALT AND MARINE CHEMICALS RESEARCH INSTITUTE
KADAM ENVIRONMENTAL CONSULTANTS | OCTOBER 2018 80
S. No
Name of Fish Production in DUMAS in Kg. Production in Hajira in KG Production in Suwali in Kg
9 Ribbon Fish 18220 4872 0
10 Shrimps 11000 0 0
11 Prawns 121385 73600 11490
12 Crabs 28120 16740 15160
13 Levta 113095 55040 11010
14 Miscellaneous 232910 202215 26170
Total
The Gujarat plays a leading role in production of marine fisheries in the country. There was a slow growth in marine
fish production in the state (from 6,20,474 MT in 2000-01 to 6,95,580 lakhs MT in 2013-14). Inland fishery
production was much less in Gujarat state. In 2000-01 inland production was just 40,591 MT and increased to
1,02,913 MT in 2013-14 (Fisheries Statistics of Gujarat, 2013-14).
There is a decreasing trend of marine fish production in Surat district. In 2000-2001 the total landing was 9681 MT,
which was decreased to to 3494 MT in 2013-14. However, in the nearby Bharuch district there was an increasing
trend of marine fish landing from 2046 MT in 2000-01 to 4045 MT in 2013-14. There is no major fish landing centre
or fishing activities in the estuaries as well as near shore of the proposed project.
Hilsa is one of the main migratory fish available in the Tapi estuaries during rainy season. They used to migrate
from the sea towards estuaries (Anadromous migration) for spawning. Gujarat State Fisheries Department revealed
that annual production fluctuation of adult hilsa lies between the range 1.0 tonnes and 93.26 tonnes and that of
juveniles lies between 10.0 t and 2500.0 t, during 2004-2011 (Bhaumik et. al., 2013). However, in recent past the
frequency of Hilsa catch has reduced due to common anthropogenic activity and overall water pollution.
Reference: Bhaumik, U., Sharma, A. P., Mukhopadhyay, M. K., Shrivastava, N. P. and Bose, S. (2013). Adaptation
of Hilsa (Tenualosa ilisha) in freshwater environment of Ukai (Vallabh Sagar) reservoir, Gujarat,India. Fishing
Chimes, Annual issue, 33(1&2):110-113.
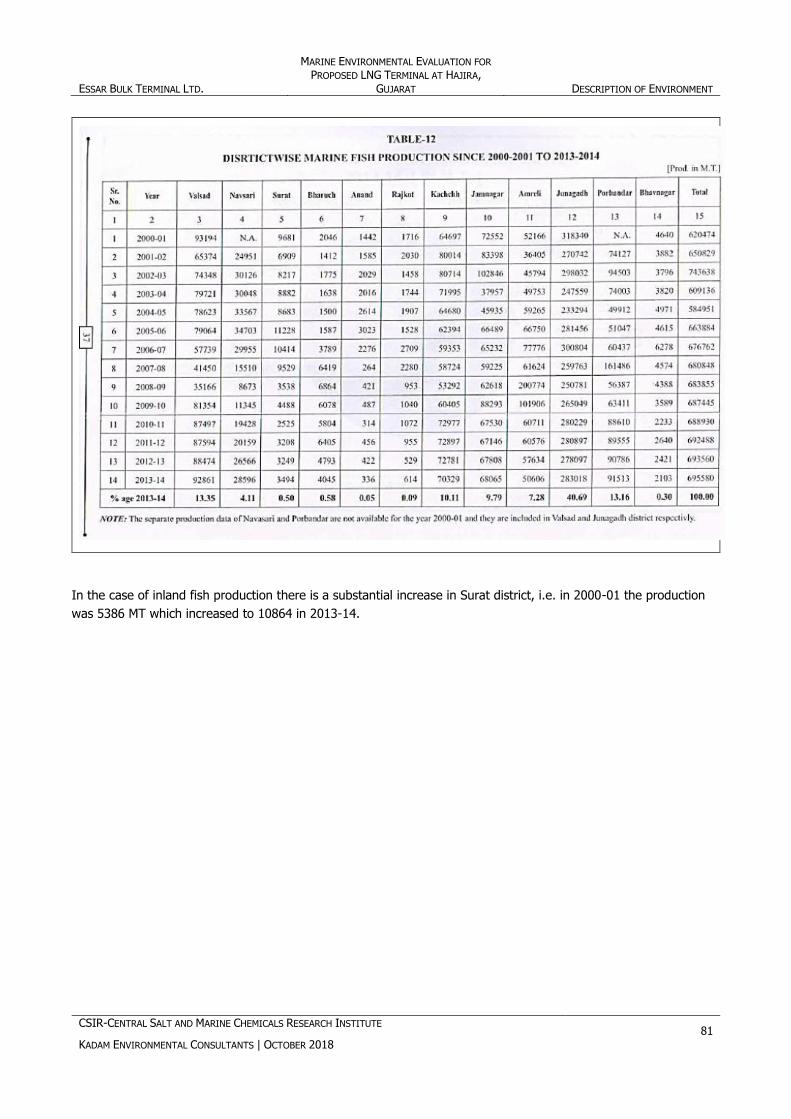
ESSAR BULK TERMINAL LTD.
MARINE ENVIRONMENTAL EVALUATION FOR
PROPOSED LNG TERMINAL AT HAJIRA, GUJARAT DESCRIPTION OF ENVIRONMENT
CSIR-CENTRAL SALT AND MARINE CHEMICALS RESEARCH INSTITUTE
KADAM ENVIRONMENTAL CONSULTANTS | OCTOBER 2018 81
In the case of inland fish production there is a substantial increase in Surat district, i.e. in 2000-01 the production
was 5386 MT which increased to 10864 in 2013-14.

ESSAR BULK TERMINAL LTD.
MARINE ENVIRONMENTAL EVALUATION FOR
PROPOSED LNG TERMINAL AT HAJIRA, GUJARAT DESCRIPTION OF ENVIRONMENT
CSIR-CENTRAL SALT AND MARINE CHEMICALS RESEARCH INSTITUTE
KADAM ENVIRONMENTAL CONSULTANTS | OCTOBER 2018 82
Source: Fisheries Statistics of Gujarat, Commissioner of Fisheries, Government of Gujarat, Gandhinagar, 2013-14

ESSAR BULK TERMINAL LTD.
MARINE ENVIRONMENTAL EVALUATION FOR
PROPOSED LNG TERMINAL AT HAJIRA, GUJARAT DESCRIPTION OF ENVIRONMENT
CSIR-CENTRAL SALT AND MARINE CHEMICALS RESEARCH INSTITUTE
KADAM ENVIRONMENTAL CONSULTANTS | OCTOBER 2018 83
4 ANTICIPATED ENVIRONMENTAL IMPACTS & MITIGATION
MEASURES
4.1 Introduction
In this chapter, we:
Identify project activities that could beneficially or adversely impact the environment
Predict and assess the environmental impacts of such activities
Examine each environmental aspect-impact relationship in detail and identify its degree of significance
Identify possible mitigation measures for these project activities and select the most appropriate mitigation
measure, based on the reduction in significance achieved and practicality in implementation.
4.2 Impact assessment methodology
4.2.1 Key definitions
Environmental aspects
These are elements of an organization’s activities or products or services that can interact with the environment.
Environmental aspects could include activities that occur during normal and emergency operations.
Environmental aspects selected for further study should large enough for meaningful examination and small enough
to be easily understood.
Environmental impacts
Environmental impacts are defined as any change to the environment, whether adverse or beneficial, wholly or
partially resulting from an organization’s environmental aspects.
Environmental components
The marine environment includes such as water, sediment, flora fauna and their interrelation.
The environmental components (or parts of the receiving environment on which impacts are being assessed)
include: air, water, sediment, and ecology & bio diversity.
After the identification of impacting activities, impacts require to be assessed based on subjective / objective criteria
to assess the impacting activities. This is done in the following steps.
4.2.2 Identification of impacts
This entails employing a simple checklist method requiring:
Listing of environmental aspects (i.e. activities or parts thereof that can cause environmental impacts)
Identifying applicable components of the environment on which the environmental aspects can cause an
environmental impact
Making notes of the reason / possible inter-relationships that lead to environmental impact creation
Listing the environmental components likely to receive impacts, along with the key impacting activities on each
component

ESSAR BULK TERMINAL LTD.
MARINE ENVIRONMENTAL EVALUATION FOR
PROPOSED LNG TERMINAL AT HAJIRA, GUJARAT DESCRIPTION OF ENVIRONMENT
CSIR-CENTRAL SALT AND MARINE CHEMICALS RESEARCH INSTITUTE
KADAM ENVIRONMENTAL CONSULTANTS | OCTOBER 2018 84
4.3 Identification of impacting activities for the proposed project
It is important to note that marine impacts of this project are limited to the following sub-paragraphs only.
Pre-operation Phase
Procuring and permanently berthing an LNG carrier (FSU) at the specified berth as shown in Figure 2-2.
Construction Phase
It is pertinent to note that there will be absolutely no construction activities beyond the existing waterfront. This is
so because the location for the proposed project is within an existing, operational port. Due to this fact and
considering relevant project requirements such as navigational channel requirements, availability of draft, mooring
& berthing requirements etc. do not require any intervention in the marine environment and are limited to onshore
construction activities which are covered in terrestrial EIA report.
Operation Phase
The operation phase will entail commissioning the FSU so that it can receive LNG parcel from other LNG carriers
and transfer LNG to RU.
Accordingly, identified environmental impacts have been listed in Table 4-1.
Table 4-1: Environmental impact and mitigation measures
No. Project activities Aspect Impacts Mitigation measures
Pre-operation Phase
1.1
Preparation of FSU at
appropriate dry dock/
purchase location
Application of anti-
fouling agents
containing biocides or
metallic compounds
such as tributyltin
(TBT)
Application of anti-
fouling agents can
impact marine fauna
and possibility enter
food chain
To eliminate/minimise use of such
agents since the ship is going to be
stationary and fuel consumption
during movement need not be
optimised since ship will not move
Operation Phase
1.2
Permanent berthing of
floating storage unit
(FSU)
Consumption of fuel
and operation of
engines during idling
and cargo loading
unloading
Air emission in the form
of PM, NOx, SO2, HC &
CO
Fuel conforming to MARPOL Annex VI
with sulphur content <0.5%.
Optimal maintenance of engines so
as to ensure appropriate air fuel
mixture and minimal emissions.
Implement monitoring program to
monitor effects of air emissions on
ecological communities
Generation of grey and
black water
Grey water and black
water which can
contain high levels of
BODs, bacteria and
other constituents
potentially harmful to
marine organisms.
Adverse impact on
marine water quality
Wastewater will be collected &
treated in on board STP. Treated
wastewater will be sent onshore for
storage in holding tank and then
reused for greenbelt within terminal.
Generation of non-
hazardous solid waste
similar to household
waste
Garbage thrown
overboard or managed
improperly can have
adverse impact on
Solid waste will be managed in
conformance with the requirements
laid out in the Solid Waste
ESSAR BULK TERMINAL LTD.
MARINE ENVIRONMENTAL EVALUATION FOR
PROPOSED LNG TERMINAL AT HAJIRA, GUJARAT DESCRIPTION OF ENVIRONMENT
CSIR-CENTRAL SALT AND MARINE CHEMICALS RESEARCH INSTITUTE
KADAM ENVIRONMENTAL CONSULTANTS | OCTOBER 2018 85
No. Project activities Aspect Impacts Mitigation measures
marine water, ecology
and general health and
hygiene of nearby
communities through
spread of vector borne
diseases
Management Rules 2016 and Marpol
annex V
Generation of
hazardous waste such
as equipment
maintenance fluids,
used oil, bilge sludge,
toxic paints and
batteries
Improperly managed
hazardous waste can
result in adverse impact
on marine water,
ecology and nearby
community
Collection, Segregation, Storage,
Transportation and disposal to
approved Recycler M/s Jabrawala
Petroleum
Oil spill during fuelling
Adverse impact on
marine water, sediment
quality and marine
ecology
Oil spill disaster contingency plan is
attached as Attachment 1
Oil spill control equipment such as
booms/ barriers will be provided for
containment; and skimmers will be
provided for recovery
4.3.1 Water environment
Impact on water due to wastewater generation, solid & hazardous waste generation and oil spill
during fuelling
This may lead to adverse impact on marine water quality.
Impact on water due to accidental spillage
As such it is noted that the Port is equipped with an adequate VTMS system, thereby eliminating chances of
accidents and incidents involving ship to ship collision and consequent discharge of materials into the marine
environment. However, in the remotest of cases, during towing and berthing of the ships or owing to natural
calamity or piloting errors, there can be a rare possibility of mishaps like ship collision or ship hitting against the
wharf or ship getting grounded. During such events the ship may get damaged or in the worst case, capsize and
lead to oil spill inside the port basin or in the vicinity.
Mitigation measures for impacts on water
Wastewater will be collected & treated in on board STP. Treated wastewater will be sent onshore for storage in
holding tank and then reused for greenbelt within terminal.
Solid waste will be managed in conformance with the requirements laid out in the Solid Waste Management
Rules 2016.and Marpol annex V
Implement monitoring program to monitor water quality
Oil spill control equipment such as booms/ barriers will be provided for containment; and skimmers will be
provided for recovery
As the accidental spill will be in harboured waters, response time for shutting down the fuelling, containment
and recovery will be quicker
As a precautionary measures oil spill model was also run to know the severity and impacted zone of spills due
to the proposed project

ESSAR BULK TERMINAL LTD.
MARINE ENVIRONMENTAL EVALUATION FOR
PROPOSED LNG TERMINAL AT HAJIRA, GUJARAT DESCRIPTION OF ENVIRONMENT
CSIR-CENTRAL SALT AND MARINE CHEMICALS RESEARCH INSTITUTE
KADAM ENVIRONMENTAL CONSULTANTS | OCTOBER 2018 86
Since this is an existing port, Oil Spill Disaster Contingency Plan (attached as Attachment 1) is already
available to handle oil spill. Oil Contingency Team headed by a trained expert has been established at port.
Coordination has been established with the Indian Coast Guard.
4.3.2 Sediment environment
Impact on sediment due to accidental spillage of fuel oil
It is noted that in extremely rare events, small quantities of oil (as mentioned in the OSDCP) can leak into the
environment and therefore enter the marine waters. Such an event has never occurred in the past, however, good
practice entails understanding the possible impacts on the environment, in case it does.
Contamination of sediments with oil may modify chemical, physical and biological processes.
The persistent toxic constituents of oil, such as heavy metals, can become stored in the sediments, and taken up
into the food chain.
Mitigation measures
Proper contingency plan; readily available oil handling equipment like booms, skimmer and chemicals for
dispersion; establish coordination with Indian Coast Guard. Oil spill contingency plan has been attached as
Attachment 1.
4.3.3 Air Environment
Impact due to Consumption of fuel and operation of engines during idling and cargo loading
unloading
Air emission in the form of PM, NOx, SO2, HC & CO
Mitigation measures
Fuel conforming to MARPOL Annex VI with sulphur content <0.5%.
Optimal maintenance of engines so as to ensure appropriate air fuel mixture and minimal emissions.
Implement monitoring program to monitor effects of air emissions on ecological communities
4.3.4 Flora & fauna
Impact due to application of antifouling agents on FSU, generation of solid & hazardous waste
Application of anti-fouling agents can impact marine fauna and possibility enter food chain.
Garbage thrown overboard or managed improperly can have adverse impact on marine ecology.
Improperly managed hazardous waste can result in adverse impact on marine ecology.
Disturbance to fishes due to movement of ships and accidental spillage only. Fishes from affected zone may get
temporarily tainted. Considering that the mouth estuarine zone of Tapi and associated coastal area is not
commercial fishing zone, impact would be minor and temporary.
Spill residue will contaminate sub tidal and intertidal benthic habitat.
Marine turtles and mammals are highly sensitive to oil spill and swim away from the spill site but there is no
impact on the same as marine turtles and mammals are not recorded at site
Mitigation measures
Eliminate/minimize use of such agents since the ship is going to be stationary and fuel consumption during
movement need not be optimized since ship will not move.

ESSAR BULK TERMINAL LTD.
MARINE ENVIRONMENTAL EVALUATION FOR
PROPOSED LNG TERMINAL AT HAJIRA, GUJARAT DESCRIPTION OF ENVIRONMENT
CSIR-CENTRAL SALT AND MARINE CHEMICALS RESEARCH INSTITUTE
KADAM ENVIRONMENTAL CONSULTANTS | OCTOBER 2018 87
Solid waste will be managed in conformance with the requirements laid out in the Solid Waste Management
Rules 2016.and Marpol annex V.
Collection, Segregation, Storage, Transportation and disposal to approved Recycler M/s Jabrawala Petroleum.
Oil spill control equipment such as booms/ barriers will be provided for containment; and skimmers will be
provided for recovery.
Since this is an existing port, Oil Spill Disaster Contingency Plan (attached as Attachment 1) is already
available to handle oil spill. Oil Contingency Team headed by a trained expert has been established at port.
Coordination has been established with Indian Coast Guard.
Implement marine environmental monitoring programme.

ESSAR BULK TERMINAL LTD.
MARINE ENVIRONMENTAL EVALUATION FOR
PROPOSED LNG TERMINAL AT HAJIRA, GUJARAT ENVIRONMENTAL MONITORING PROGRAM
CSIR-CENTRAL SALT AND MARINE CHEMICALS RESEARCH INSTITUTE
KADAM ENVIRONMENTAL CONSULTANTS | OCTOBER 2018 88
5 ENVIRONMENTAL MONITORING PROGRAM
5.1 Introduction
Realizing the sensitivity of the immediate marine ecosystem and the importance to track ecological changes to
maintain the environmental health in their port area, M/s EBTL will organize a holistic study to monitor the marine
ecological conditions of the port which will enable them to track environmental changes if occurring in the region
due to their activities. Appropriate remedial measures can then be taken if the status of the environment is known.
In this background marine environmental monitoring at the proposed project site and in the vicinity of site will be
carried out.
5.2 Objective of monitoring
The present study aims to monitor marine environment in the vicinity of EBTL LNG terminal.
Marine Water Quality of surrounding Essar port environment on monthly basis on surface and bottom water.
Sediment Quality of surrounding Essar port environment on monthly basis on surface and bottom water.
Qualitative and quantitative data of primary productivity and Chlorophyll “a”.
Qualitative and quantitative data of zooplankton.
Qualitative and quantitative data of benthic fauna including sub tidal and intertidal.

ESSAR BULK TERMINAL LTD. MARINE ENVIRONMENTAL EVALUATION FOR PROPOSED LNG
TERMINAL AT HAJIRA, GUJARAT ENVIRONMENTAL MONITORING PROGRAM
CSIR-CENTRAL SALT AND MARINE CHEMICALS RESEARCH INSTITUTE
KADAM ENVIRONMENTAL CONSULTANTS | OCTOBER 2018 89
5.3 Environmental monitoring programme
Table 5-1: Marine environmental monitoring programme
S. No. Parameters Measurement methodology
Frequency Location Data analysis Reporting schedule
Fixed cost, INR
Recurring budget in INR
A Water
1
Water samples
analysis (pH,
Temperature,
Biochemical Oxygen
Demand (BOD),
Dissolved Oxygen
(DO), Ammonia,
Nitrites, Nitrates,
Total Nitrogen,
Salinity, Turbidity,
Total Suspended
Solids (TSS),
Petroleum,
Hydrocarbons,
Phenols, Potassium,
Chlorides, Calcium,
Zinc, Iron, Copper,
Cadmium, Arsenic,
Mercury.)
APHA : 23rd Edition Once in a season
except monsoon
At Site and
surrounding area
Comparison with
specified limits and
previous baseline
data of the area if
available
Compliance report of
EC to MOEF&CC on 6
monthly
Compliance report of
Consent to SPCB as
per requirement
- 15,00,000 per
annum
Sediment

ESSAR BULK TERMINAL LTD. MARINE ENVIRONMENTAL EVALUATION FOR PROPOSED LNG
TERMINAL AT HAJIRA, GUJARAT ENVIRONMENTAL MONITORING PROGRAM
CSIR-CENTRAL SALT AND MARINE CHEMICALS RESEARCH INSTITUTE
KADAM ENVIRONMENTAL CONSULTANTS | OCTOBER 2018 90
S. No. Parameters Measurement methodology
Frequency Location Data analysis Reporting schedule
Fixed cost, INR
Recurring budget in INR
2
Marine subtidal and
intertidal Sediment
samples (Texture,
Total phosphorous,
Total organic carbon,
Phenolic compounds,
Cadmium, Chromium,
Lead and Mercury)
APHA : 23rd Edition Once in a season
except monsoon
At Site and
surrounding area
Comparison with
specified limits and
previous baseline
data of the area if
available
Compliance report of
EC to MOEF&CC on 6
monthly
Compliance report to
SPCB as per
requirement
- 5,00,000 per
annum
Biological Parameters
3
To determine the
composition and
distribution of major
groups of fauna
includes
Phytoplankton,
Zooplankton and
Benthos. (diversity,
density and biomass
estimation)
APHA : 23rd Edition Once in a season
except monsoon
At Site and
surrounding area
Comparison with
specified limits
and previous
baseline data of
the area if
available
Compliance report of
EC to MOEF&CC on 6
monthly
Compliance report to
SPCB as per
requirement
10,00,000 per
annum
4 Fisheries Survey - Twice in a year At Site and
surrounding area
Comparison with
specified limits
and previous
baseline data of
the area if
available
Compliance report of
EC to MOEF&CC on 6
monthly
- 5,00,000 per
annum

ESSAR BULK TERMINAL LTD.
MARINE ENVIRONMENTAL EVALUATION FOR
PROPOSED LNG TERMINAL AT HAJIRA, GUJARAT ENVIRONMENTAL MONITORING PROGRAM
CSIR-CENTRAL SALT AND MARINE CHEMICALS RESEARCH INSTITUTE
KADAM ENVIRONMENTAL CONSULTANTS | OCTOBER 2018 91
5.4 Regulatory Framework
The results of monitoring can be reported to the relevant authority annually or as required which could include:
Ministry of Environment and Forests, New Delhi
State Department of Environment
State Department of Fisheries
State Pollution Control Board
Monitoring program will be continued during the construction and operational phases of the project. It will be
repeated at periodic intervals after the commencement of the project and when the project is fully operational. The
monitoring will be organized with qualified and experienced environmental team. Standard procedure will be
followed in sample collection and analysis.

ESSAR BULK TERMINAL LTD.
MARINE ENVIRONMENTAL EVALUATION FOR
PROPOSED LNG TERMINAL AT HAJIRA, GUJARAT ADDITIONAL STUDIES
CSIR-CENTRAL SALT AND MARINE CHEMICALS RESEARCH INSTITUTE
KADAM ENVIRONMENTAL CONSULTANTS | OCTOBER 2018 92
6 ADDITIONAL STUDIES
6.1 Numerical modelling study
6.1.1 Model setup
Tide
Measured water elevation time series is obtained from the observed data at a location within the channel. The
depth of observation is about 4m below datum and the measurements are carried out using an Acoustic Doppler
Current Profiler (ADCP). The instrument would ideally collect the speed and direction of the flow through the entire
water column. An additional water level sensor is available in the said instrument, which has recorded the tide of
the site. The observed water levels at the ADCP location are analysed to separate the periodic and residual parts.
The tidal constituents for semi-diurnal tides of site are reported in the Table 6-1. It can be observed that M2 has
the highest amplitude and Mean sea level is 4.05m above the measurement reference level (Chart Datum as per
report). This analysis, provide a fair idea on the energy distribution.
Table 6-1: Tidal constituents at ADCP observation
Constituent Amplitude (m) Phase (degrees)
Z0 4.05 MSL
M2 1.98 294
S2 0.742 330
K1 0.62 8.8
O1 0.287 356
M4 0.16 108
MSF 0.149 98.9
MS4 0.115 152
M6 0.0488 234
2MS6 0.0415 295
SK3 0.0375 216
M3 0.0334 8.65
2MK5 0.0205 321
S4 0.0199 171
M8 0.0143 20.9
2SK5 0.0122 318
3MK7 0.00599 105
2SM6 0.00305 74
Current
The velocity time series from the mid depth is analysed for the speed contribution by various constituents. A
persistent current of 22 cm/s was observed flowing towards North West. The M2 constituent is approximately 15
degrees out of phase from the progressive wave.

ESSAR BULK TERMINAL LTD.
MARINE ENVIRONMENTAL EVALUATION FOR
PROPOSED LNG TERMINAL AT HAJIRA, GUJARAT ADDITIONAL STUDIES
CSIR-CENTRAL SALT AND MARINE CHEMICALS RESEARCH INSTITUTE
KADAM ENVIRONMENTAL CONSULTANTS | OCTOBER 2018 93
Table 6-2: Current analysis for ADCP location
Constituent Major (m/s)
Minor (m/s)
Direction
(degrees)
Phase
(degrees)
M2 0.498 0.0101 27 219.
S2 0.149 -0.0112 29.1 227.
M4 0.114 -0.0106 86.5 67.8
K1 0.0667 -0.00151 29.5 282.
MS4 0.0583 -0.0261 93.5 82.4
M3 0.0493 0.0293 160 354.
MSF 0.0548 0.0137 17.5 214.
O1 0.0527 -0.00481 51.5 281.
M6 0.0349 0.0262 59.9 238.
2MS6 0.0324 0.0127 59.1 312.
2MK5 0.0342 0.0021 65.7 317.
S4 0.0309 0.00441 93.1 22.7
SK3 0.0298 0.0061 154 108.
2SM6 0.0176 0.0111 125 281.
3MK7 0.0196 -0.00506 122 129.
M8 0.0142 0.00455 36.1 50.3
2SK5 0.0101 -0.00561 22.8 277.
Figure 6-1: M2 Tidal ellipse
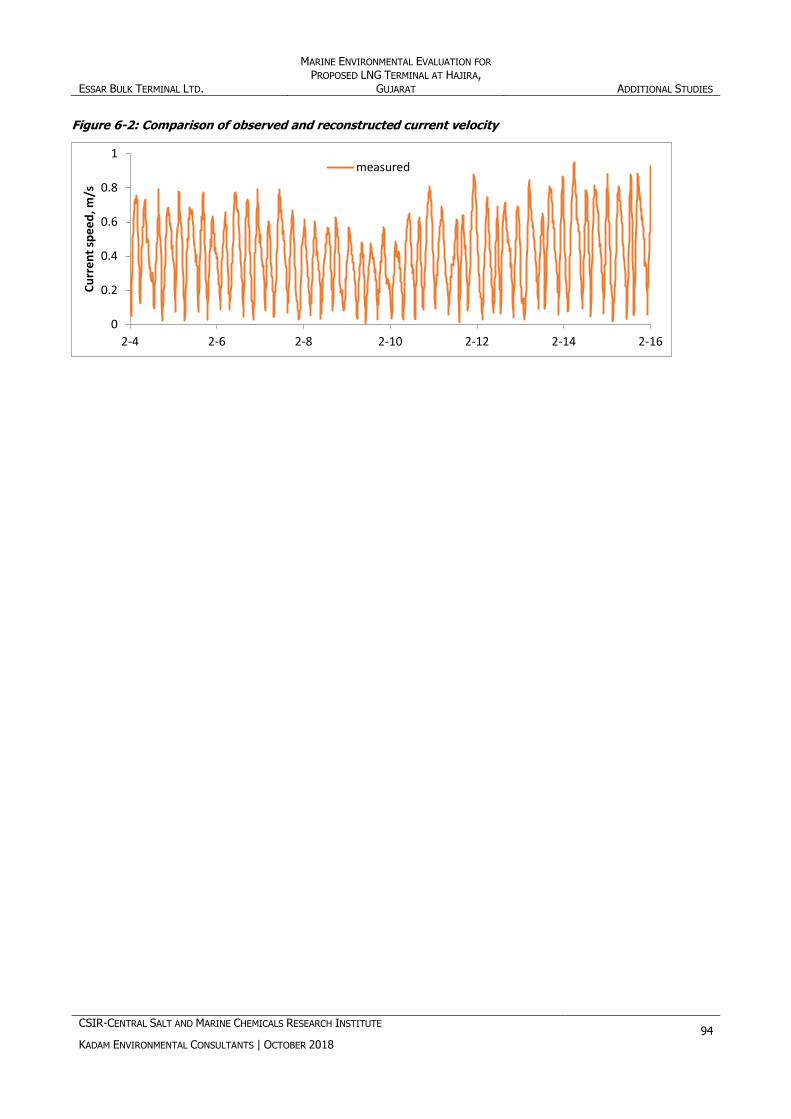
ESSAR BULK TERMINAL LTD.
MARINE ENVIRONMENTAL EVALUATION FOR
PROPOSED LNG TERMINAL AT HAJIRA, GUJARAT ADDITIONAL STUDIES
CSIR-CENTRAL SALT AND MARINE CHEMICALS RESEARCH INSTITUTE
KADAM ENVIRONMENTAL CONSULTANTS | OCTOBER 2018 94
Figure 6-2: Comparison of observed and reconstructed current velocity
0
0.2
0.4
0.6
0.8
1
2-4 2-6 2-8 2-10 2-12 2-14 2-16
Cu
rre
nt
spe
ed
, m/s
measured
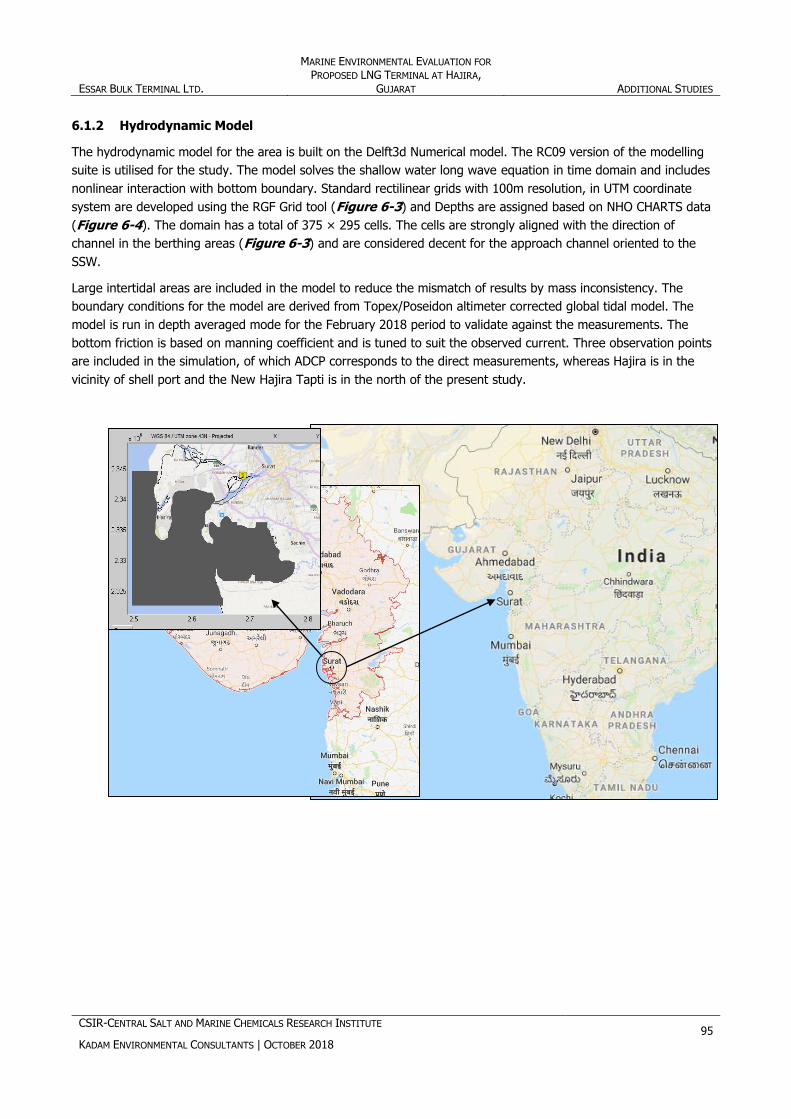
ESSAR BULK TERMINAL LTD.
MARINE ENVIRONMENTAL EVALUATION FOR
PROPOSED LNG TERMINAL AT HAJIRA, GUJARAT ADDITIONAL STUDIES
CSIR-CENTRAL SALT AND MARINE CHEMICALS RESEARCH INSTITUTE
KADAM ENVIRONMENTAL CONSULTANTS | OCTOBER 2018 95
6.1.2 Hydrodynamic Model
The hydrodynamic model for the area is built on the Delft3d Numerical model. The RC09 version of the modelling
suite is utilised for the study. The model solves the shallow water long wave equation in time domain and includes
nonlinear interaction with bottom boundary. Standard rectilinear grids with 100m resolution, in UTM coordinate
system are developed using the RGF Grid tool (Figure 6-3) and Depths are assigned based on NHO CHARTS data
(Figure 6-4). The domain has a total of 375 × 295 cells. The cells are strongly aligned with the direction of
channel in the berthing areas (Figure 6-3) and are considered decent for the approach channel oriented to the
SSW.
Large intertidal areas are included in the model to reduce the mismatch of results by mass inconsistency. The
boundary conditions for the model are derived from Topex/Poseidon altimeter corrected global tidal model. The
model is run in depth averaged mode for the February 2018 period to validate against the measurements. The
bottom friction is based on manning coefficient and is tuned to suit the observed current. Three observation points
are included in the simulation, of which ADCP corresponds to the direct measurements, whereas Hajira is in the
vicinity of shell port and the New Hajira Tapti is in the north of the present study.
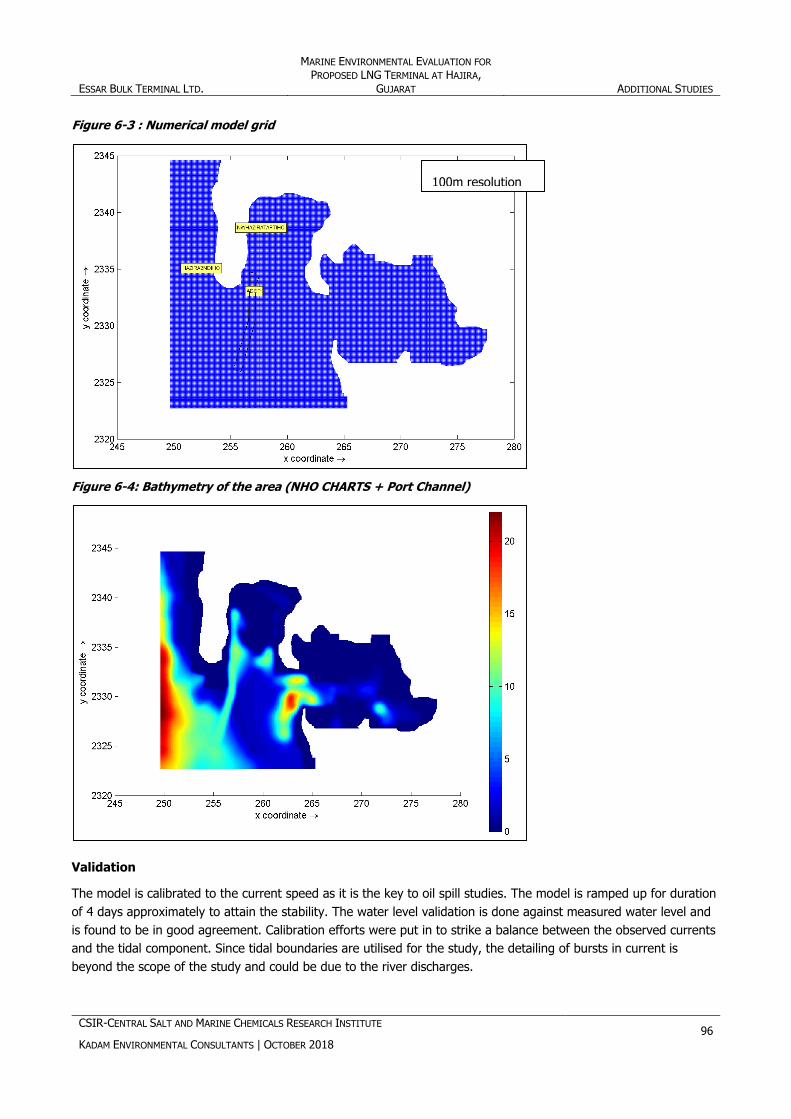
ESSAR BULK TERMINAL LTD.
MARINE ENVIRONMENTAL EVALUATION FOR
PROPOSED LNG TERMINAL AT HAJIRA, GUJARAT ADDITIONAL STUDIES
CSIR-CENTRAL SALT AND MARINE CHEMICALS RESEARCH INSTITUTE
KADAM ENVIRONMENTAL CONSULTANTS | OCTOBER 2018 96
Figure 6-3 : Numerical model grid
Figure 6-4: Bathymetry of the area (NHO CHARTS + Port Channel)
Validation
The model is calibrated to the current speed as it is the key to oil spill studies. The model is ramped up for duration
of 4 days approximately to attain the stability. The water level validation is done against measured water level and
is found to be in good agreement. Calibration efforts were put in to strike a balance between the observed currents
and the tidal component. Since tidal boundaries are utilised for the study, the detailing of bursts in current is
beyond the scope of the study and could be due to the river discharges.
100m resolution
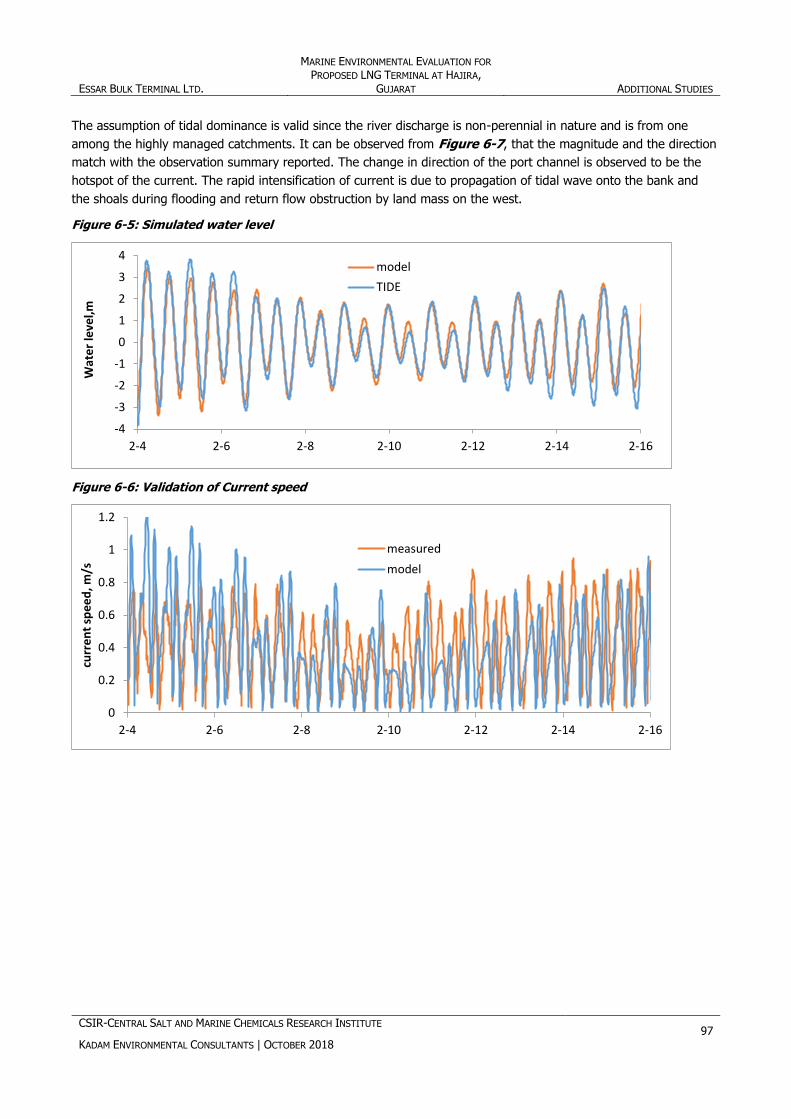
ESSAR BULK TERMINAL LTD.
MARINE ENVIRONMENTAL EVALUATION FOR
PROPOSED LNG TERMINAL AT HAJIRA, GUJARAT ADDITIONAL STUDIES
CSIR-CENTRAL SALT AND MARINE CHEMICALS RESEARCH INSTITUTE
KADAM ENVIRONMENTAL CONSULTANTS | OCTOBER 2018 97
The assumption of tidal dominance is valid since the river discharge is non-perennial in nature and is from one
among the highly managed catchments. It can be observed from Figure 6-7, that the magnitude and the direction
match with the observation summary reported. The change in direction of the port channel is observed to be the
hotspot of the current. The rapid intensification of current is due to propagation of tidal wave onto the bank and
the shoals during flooding and return flow obstruction by land mass on the west.
Figure 6-5: Simulated water level
Figure 6-6: Validation of Current speed
-4
-3
-2
-1
0
1
2
3
4
2-4 2-6 2-8 2-10 2-12 2-14 2-16
Wat
er
leve
l,m
model
TIDE
0
0.2
0.4
0.6
0.8
1
1.2
2-4 2-6 2-8 2-10 2-12 2-14 2-16
curr
en
t sp
ee
d, m
/s
measured
model

ESSAR BULK TERMINAL LTD.
MARINE ENVIRONMENTAL EVALUATION FOR
PROPOSED LNG TERMINAL AT HAJIRA, GUJARAT ADDITIONAL STUDIES
CSIR-CENTRAL SALT AND MARINE CHEMICALS RESEARCH INSTITUTE
KADAM ENVIRONMENTAL CONSULTANTS | OCTOBER 2018 98
Tidal hydraulics
Spring conditions
Figure 6-7: Spatial view of spring current in the channel
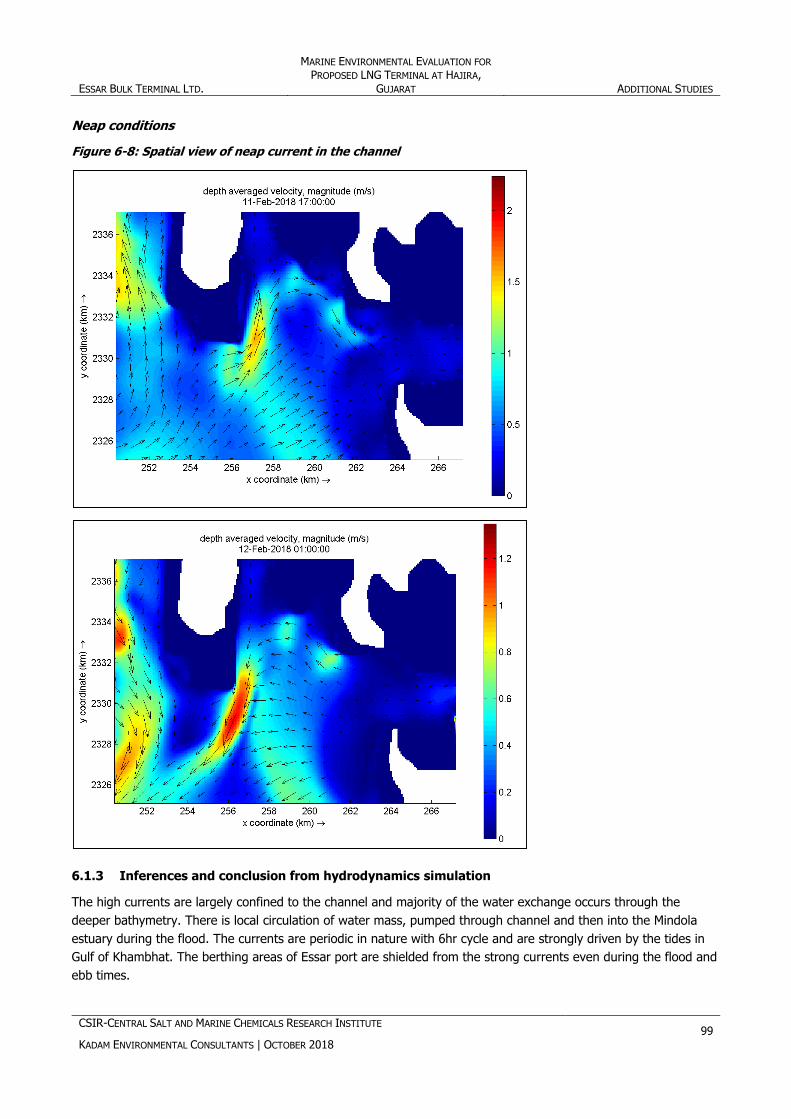
ESSAR BULK TERMINAL LTD.
MARINE ENVIRONMENTAL EVALUATION FOR
PROPOSED LNG TERMINAL AT HAJIRA, GUJARAT ADDITIONAL STUDIES
CSIR-CENTRAL SALT AND MARINE CHEMICALS RESEARCH INSTITUTE
KADAM ENVIRONMENTAL CONSULTANTS | OCTOBER 2018 99
Neap conditions
Figure 6-8: Spatial view of neap current in the channel
6.1.3 Inferences and conclusion from hydrodynamics simulation
The high currents are largely confined to the channel and majority of the water exchange occurs through the
deeper bathymetry. There is local circulation of water mass, pumped through channel and then into the Mindola
estuary during the flood. The currents are periodic in nature with 6hr cycle and are strongly driven by the tides in
Gulf of Khambhat. The berthing areas of Essar port are shielded from the strong currents even during the flood and
ebb times.

ESSAR BULK TERMINAL LTD.
MARINE ENVIRONMENTAL EVALUATION FOR
PROPOSED LNG TERMINAL AT HAJIRA, GUJARAT ADDITIONAL STUDIES
CSIR-CENTRAL SALT AND MARINE CHEMICALS RESEARCH INSTITUTE
KADAM ENVIRONMENTAL CONSULTANTS | OCTOBER 2018 100
Oil spill study
Capsizing of the LNG ship scenario was considered for the oil spill study. For this study the LNG ship is assumed to
contain 1000 kilo litres of fuel oil and during capsizing of the ship, it is assumed that the oil spills of the ship within
one hour. This modelling exercise attempts to study the extent of the dispersion of the above quantum of the fuel
oil spilled into the sea.
Delft3D particle module is used to study the extent of the spread of the plume and resulting variation in the
concentrations in the estuary. This particle tracking module simulates the movement and spread of the fuel oil
plume under the influence of hydrodynamics simulated for the estuary.
The properties of the fuel oil are taken as follows:
Density of fuel oil – 928 kg/m3
Kinematic viscosity – 16.16 cSt
Emulsification and evaporation of the fuel oil are not considered in the simulation so that the results are on the
conservative side
Stickiness probability i.e. the probability of the fuel oil remaining struck to the bed soil once it touches soil, is kept
at 0.5. This implies that for 50 percent of time the fuel oil struck to the soil is again back into suspension.
The simulations were done for both flood and ebb tide to understand the extents of the spread of the oil plume for
both the conditions. The results from the simulation are given in figures below.
Spill during ebb tide
The results show that the amount at the end of the spill event i.e. one hour the concentrations of fuel oil rise to
around 0.0088 kg/m2 at the point of spill and the plume extends up to 1170 m with a width of around 104 meters.
At the end of 5 hours, the plume travels to a distance of 5 km south of the headland into the open sea under the
influence of ebb current with maximum concentrations reduced to 0.0009 kg/m2. The plume attains a long ribbon
like shape which is of length 5050 m and 220 m wide.
At the end of 10 hours, the slick disperses and under the influence of flood current gets back into the estuary
spreading both sides of the head lands with intermittent spikes in concentration and maximum concentrations
within the slick is reduced to 0.00018 kg/m2.
At the end of 24 hours, the slick is disintegrated and spreads all the approach channel and the outer face of the
headland and the maximum concentrations reduces to 0.00006 kg/m3 at intermittent points.
Spill during flood tide
The results show that the amount at the end of the spill event i.e. one hour the concentrations of fuel oil rise to
around 0.007 kg/m2 at the point of spill and the plume extends up to 1190 m in the north direction with a width of
around 120 meters.
At the end of 5 hours, the plume travels upstream into the river and enters the channels which are to the north and
south of the northern island under the influence of flood current with maximum concentrations reduced to 0.0014
kg/m2.
At the end of 10 hours, the plume has a south ward mobility under the influence of ebb current with intermittent
maximum concentrations of 0.0007 kg/m2 at the junction of the channels which are to the north and south of the
northern island.
At the end of 24 hours, the plume is further disintegrated and maximum concentrations of around 0.45 mg/l are
observed at the stretch of the river above the northern island.
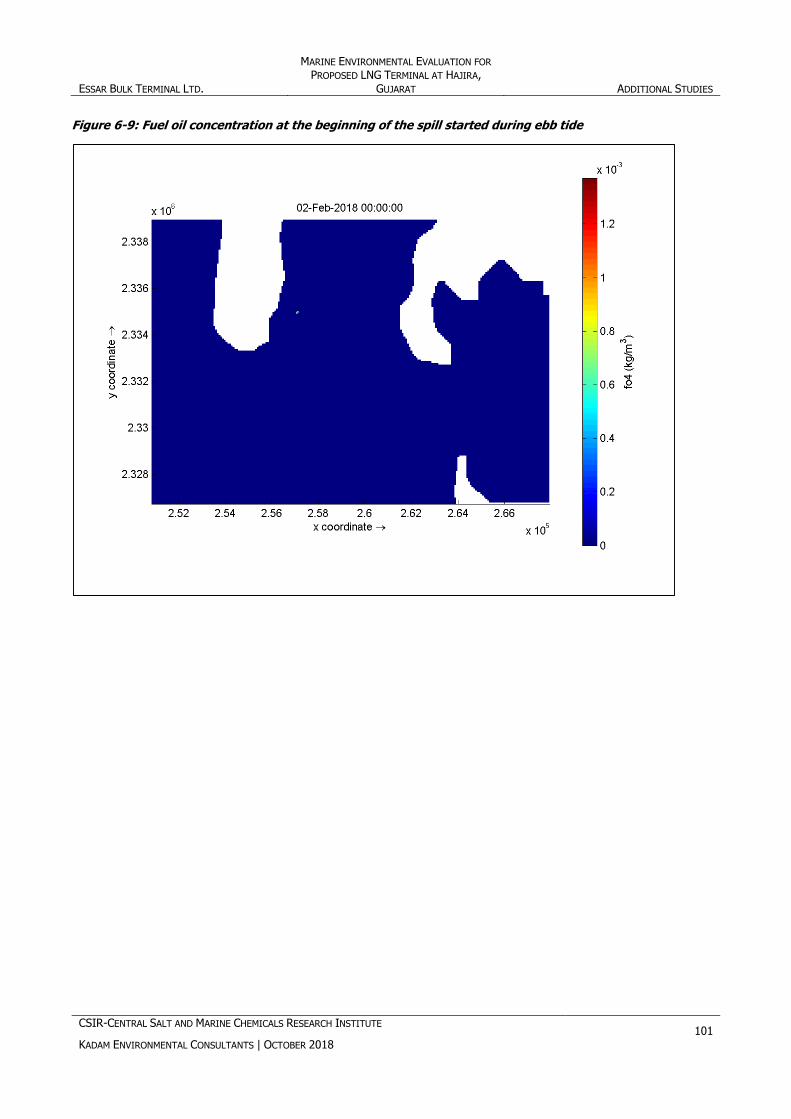
ESSAR BULK TERMINAL LTD.
MARINE ENVIRONMENTAL EVALUATION FOR
PROPOSED LNG TERMINAL AT HAJIRA, GUJARAT ADDITIONAL STUDIES
CSIR-CENTRAL SALT AND MARINE CHEMICALS RESEARCH INSTITUTE
KADAM ENVIRONMENTAL CONSULTANTS | OCTOBER 2018 101
Figure 6-9: Fuel oil concentration at the beginning of the spill started during ebb tide

ESSAR BULK TERMINAL LTD.
MARINE ENVIRONMENTAL EVALUATION FOR
PROPOSED LNG TERMINAL AT HAJIRA, GUJARAT ADDITIONAL STUDIES
CSIR-CENTRAL SALT AND MARINE CHEMICALS RESEARCH INSTITUTE
KADAM ENVIRONMENTAL CONSULTANTS | OCTOBER 2018 102
Figure 6-10: Fuel oil concentration after one hour of the spill started during ebb tide

ESSAR BULK TERMINAL LTD.
MARINE ENVIRONMENTAL EVALUATION FOR
PROPOSED LNG TERMINAL AT HAJIRA, GUJARAT ADDITIONAL STUDIES
CSIR-CENTRAL SALT AND MARINE CHEMICALS RESEARCH INSTITUTE
KADAM ENVIRONMENTAL CONSULTANTS | OCTOBER 2018 103
Figure 6-11: Fuel oil concentration after 5 hours of the spill started during ebb tide

ESSAR BULK TERMINAL LTD.
MARINE ENVIRONMENTAL EVALUATION FOR
PROPOSED LNG TERMINAL AT HAJIRA, GUJARAT ADDITIONAL STUDIES
CSIR-CENTRAL SALT AND MARINE CHEMICALS RESEARCH INSTITUTE
KADAM ENVIRONMENTAL CONSULTANTS | OCTOBER 2018 104
Figure 6-12: Fuel oil concentration after 10 hours of the spill started during ebb tide

ESSAR BULK TERMINAL LTD.
MARINE ENVIRONMENTAL EVALUATION FOR
PROPOSED LNG TERMINAL AT HAJIRA, GUJARAT ADDITIONAL STUDIES
CSIR-CENTRAL SALT AND MARINE CHEMICALS RESEARCH INSTITUTE
KADAM ENVIRONMENTAL CONSULTANTS | OCTOBER 2018 105
Figure 6-13: Fuel oil concentration after 24 hours of the spill started during ebb tide

ESSAR BULK TERMINAL LTD.
MARINE ENVIRONMENTAL EVALUATION FOR
PROPOSED LNG TERMINAL AT HAJIRA, GUJARAT ADDITIONAL STUDIES
CSIR-CENTRAL SALT AND MARINE CHEMICALS RESEARCH INSTITUTE
KADAM ENVIRONMENTAL CONSULTANTS | OCTOBER 2018 106
Figure 6-14: Fuel oil concentration at the beginning of the spill started during flood tide
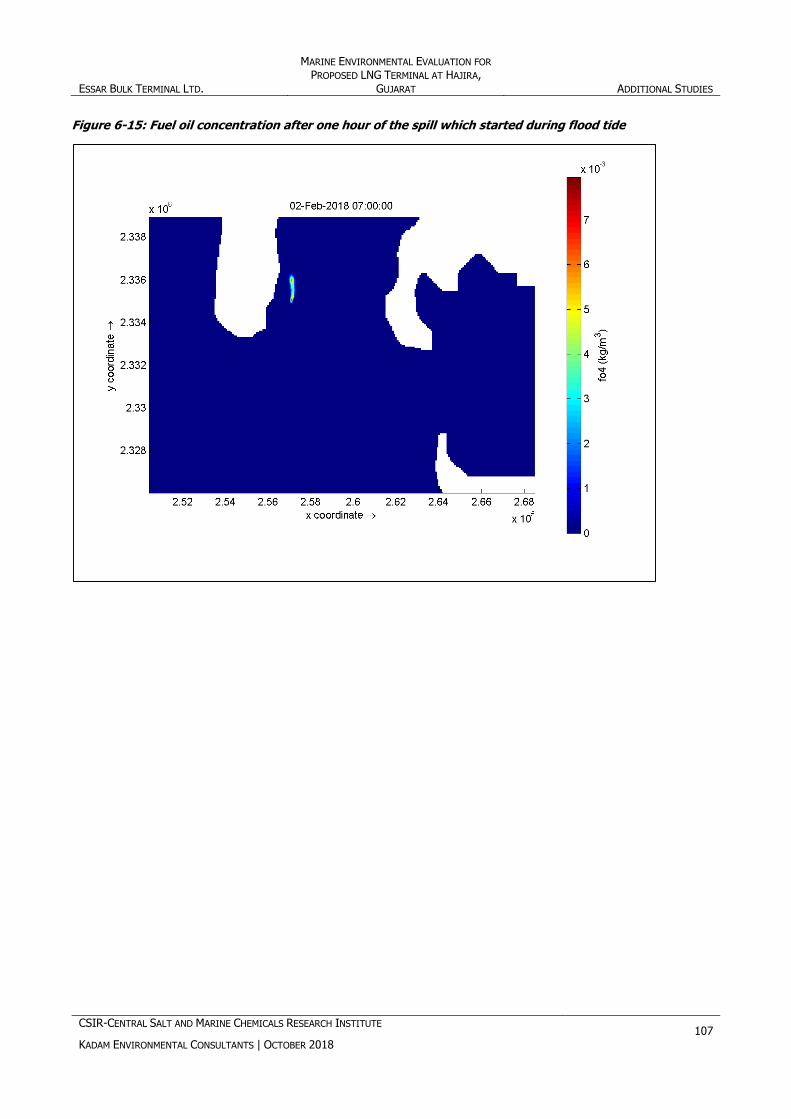
ESSAR BULK TERMINAL LTD.
MARINE ENVIRONMENTAL EVALUATION FOR
PROPOSED LNG TERMINAL AT HAJIRA, GUJARAT ADDITIONAL STUDIES
CSIR-CENTRAL SALT AND MARINE CHEMICALS RESEARCH INSTITUTE
KADAM ENVIRONMENTAL CONSULTANTS | OCTOBER 2018 107
Figure 6-15: Fuel oil concentration after one hour of the spill which started during flood tide

ESSAR BULK TERMINAL LTD.
MARINE ENVIRONMENTAL EVALUATION FOR
PROPOSED LNG TERMINAL AT HAJIRA, GUJARAT ADDITIONAL STUDIES
CSIR-CENTRAL SALT AND MARINE CHEMICALS RESEARCH INSTITUTE
KADAM ENVIRONMENTAL CONSULTANTS | OCTOBER 2018 108
Figure 6-16: Fuel oil concentration after 5 hour of the spill which started during flood tide

ESSAR BULK TERMINAL LTD.
MARINE ENVIRONMENTAL EVALUATION FOR
PROPOSED LNG TERMINAL AT HAJIRA, GUJARAT ADDITIONAL STUDIES
CSIR-CENTRAL SALT AND MARINE CHEMICALS RESEARCH INSTITUTE
KADAM ENVIRONMENTAL CONSULTANTS | OCTOBER 2018 109
Figure 6-17: Fuel oil concentration after 10 hour of the spill which started during flood tide

ESSAR BULK TERMINAL LTD.
MARINE ENVIRONMENTAL EVALUATION FOR
PROPOSED LNG TERMINAL AT HAJIRA, GUJARAT ADDITIONAL STUDIES
CSIR-CENTRAL SALT AND MARINE CHEMICALS RESEARCH INSTITUTE
KADAM ENVIRONMENTAL CONSULTANTS | OCTOBER 2018 110
Figure 6-18: fuel oil concentration after 24 hour of the spill which started during flood tide
Inferences and conclusion from oil spill simulation
The study shows that if the spill occurs during the ebb tide, the maximum concentration of oil due to the spill, at
the end of 24 hours is in the order of around 0.00006 kg/m2 and the concentrations are spread in an intermittent
manner in and around the Essar port and do not extend beyond the northern island.
The study shows that if the spill occurs during the flood tide, the maximum concentration of oil due to the spill, at
the end of 24 hours is in the order of around 0.00045 kg/m2 and the concentrations are spread mostly around the
right-angle bend in the river path next to the northern island.
The resultant concentrations due to the spill is more if start of the spill is during flood tide and the resulting
concentrations shows that the estuary is marked by good flushing characteristics.
The results show the efforts launched in the first hour after the spill are going to be most effective in containing the
spread of the spill and removal of the oil slick from the sea surface.
6.2 Shoreline changes
EBTL project has received EC for reclamation of 350 ha and dredging of Navigational channel, turning circle and
berth pockets etc. In 2014 EBTL has received EC for clearance for expansion of port facility by 4800m berth. The
2014 clearance was given for 4800 m berth facility with the breakup as follows. Bulk berth – 700m, General cargo
berth-700m, Liquid cargo berth – 500m, containers- 1100m, dry dock, offshore support ship repairs -1800m. In
2014 EC was granted for additional dredging proposed reclamation of 334 hectares of land.

ESSAR BULK TERMINAL LTD.
MARINE ENVIRONMENTAL EVALUATION FOR
PROPOSED LNG TERMINAL AT HAJIRA, GUJARAT ADDITIONAL STUDIES
CSIR-CENTRAL SALT AND MARINE CHEMICALS RESEARCH INSTITUTE
KADAM ENVIRONMENTAL CONSULTANTS | OCTOBER 2018 111
EBTL presently envisages to use a part of this 4800 m berthing space for development of LNG facility. Since this is
not the commodity originally envisaged in 2014, EBTL has applied to MOEF for EC for this facility in September
2017. Study on shore line changes is part of the TOR issued subsequent to the application.
Channel dredged in the area would have caused some increase in the tidal prism in the creek where EBTL is
located. This would most likely have caused some changes in the shoreline opposite to EBTL port in the initial
years. The challenge is whether these changes are still continuing or has attained an equilibrium state resulting in
stable shoreline. The best way to understand this issue is to track changes in the zero-contour line over the past
few years. To identify the changes, a comparison is made between the zero-meter contour in 2013 and the same in
subsequent years. For the year 2013 zero contour was extracted from NHO chart and is compared with the zero-
contour extracted from Google Earth and details of the same is shown in Figure 6-19 to Figure 6-22. From the
figures, it can be seen that the zero-contour remains same over the period 2013-2016 which implies that there is
no likely change in the shoreline and has reached an equilibrium state.
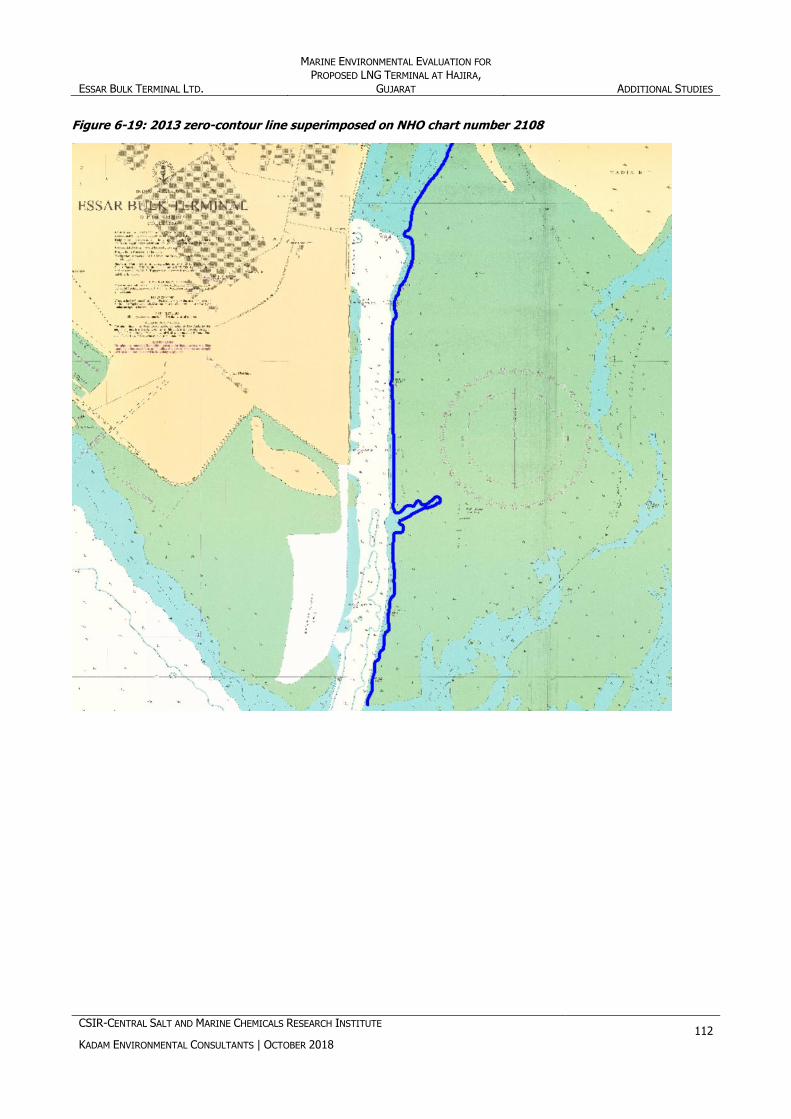
ESSAR BULK TERMINAL LTD.
MARINE ENVIRONMENTAL EVALUATION FOR
PROPOSED LNG TERMINAL AT HAJIRA, GUJARAT ADDITIONAL STUDIES
CSIR-CENTRAL SALT AND MARINE CHEMICALS RESEARCH INSTITUTE
KADAM ENVIRONMENTAL CONSULTANTS | OCTOBER 2018 112
Figure 6-19: 2013 zero-contour line superimposed on NHO chart number 2108
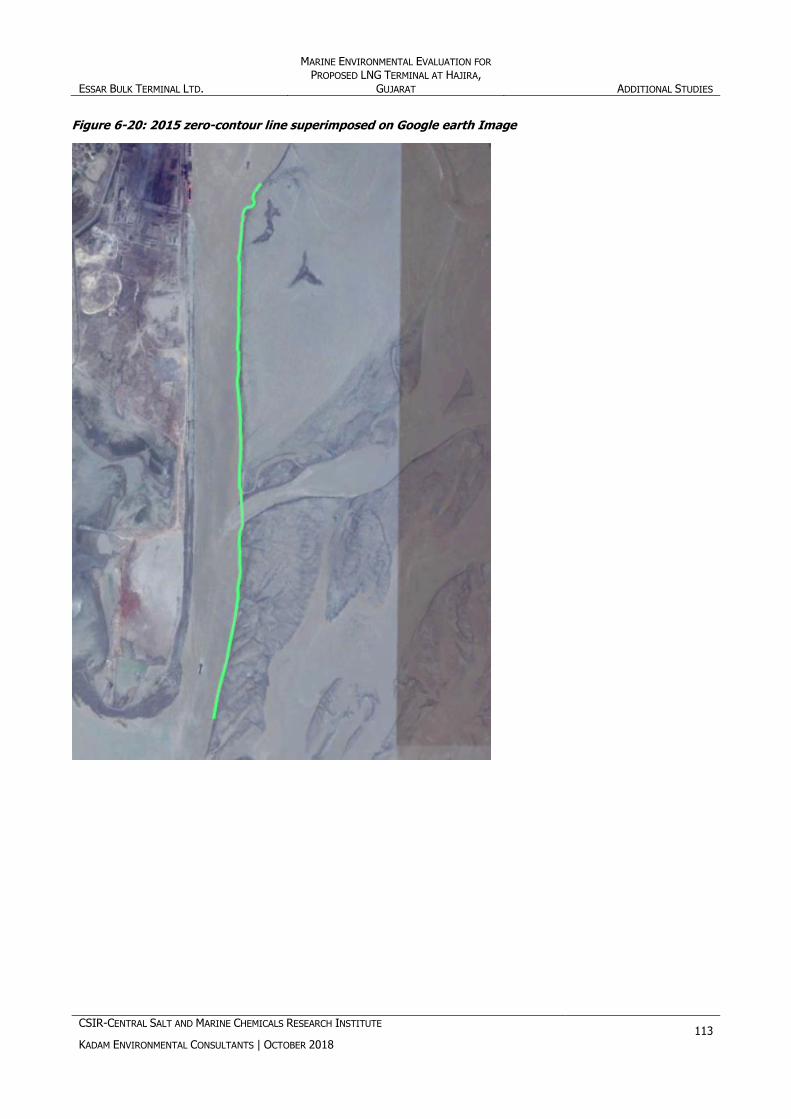
ESSAR BULK TERMINAL LTD.
MARINE ENVIRONMENTAL EVALUATION FOR
PROPOSED LNG TERMINAL AT HAJIRA, GUJARAT ADDITIONAL STUDIES
CSIR-CENTRAL SALT AND MARINE CHEMICALS RESEARCH INSTITUTE
KADAM ENVIRONMENTAL CONSULTANTS | OCTOBER 2018 113
Figure 6-20: 2015 zero-contour line superimposed on Google earth Image

ESSAR BULK TERMINAL LTD.
MARINE ENVIRONMENTAL EVALUATION FOR
PROPOSED LNG TERMINAL AT HAJIRA, GUJARAT ADDITIONAL STUDIES
CSIR-CENTRAL SALT AND MARINE CHEMICALS RESEARCH INSTITUTE
KADAM ENVIRONMENTAL CONSULTANTS | OCTOBER 2018 114
Figure 6-21: 2016 zero-contour line superimposed on Google earth Image

ESSAR BULK TERMINAL LTD.
MARINE ENVIRONMENTAL EVALUATION FOR
PROPOSED LNG TERMINAL AT HAJIRA, GUJARAT ADDITIONAL STUDIES
CSIR-CENTRAL SALT AND MARINE CHEMICALS RESEARCH INSTITUTE
KADAM ENVIRONMENTAL CONSULTANTS | OCTOBER 2018 115
Figure 6-22: Comparison of zero-contour lines corresponding to 2013 (blue), 2015 (green), 2016 (red)
ESSAR BULK TERMINAL LTD.
MARINE ENVIRONMENTAL EVALUATION FOR
PROPOSED LNG TERMINAL AT HAJIRA, GUJARAT ENVIRONMENTAL MANAGEMENT PLAN (EMP)
CSIR-CENTRAL SALT AND MARINE CHEMICALS RESEARCH INSTITUTE
KADAM ENVIRONMENTAL CONSULTANTS | OCTOBER 2018 116
7 ENVIRONMENTAL MANAGEMENT PLAN (EMP)
7.1 Purpose
The environmental management plan to mitigate the impacts on the marine environment due to proposed project
has been covered in this report. The Environment Management Plan (EMP) is prepared with a view to facilitate
effective environmental management of the project, in general and implementation of the mitigation measures in
particular. The EMP provides a delivery mechanism to address potential adverse impacts and to introduce standards
of good practice to be adopted for all project works. For each stage of the programme, the EMP lists all the
requirements to ensure effective mitigation of every potential marine impact identified in the EIA. For each impact
or operation, which could otherwise give rise to impact, the following information is presented:
Role of M/s EBTL and its contractors;
A comprehensive listing of the mitigation measures (actions) that M/s EBTL shall implement;
The parameters that shall be monitored to ensure effective implementation of the action;
The timing for implementation of the action to ensure that the objectives of mitigation are fully met.
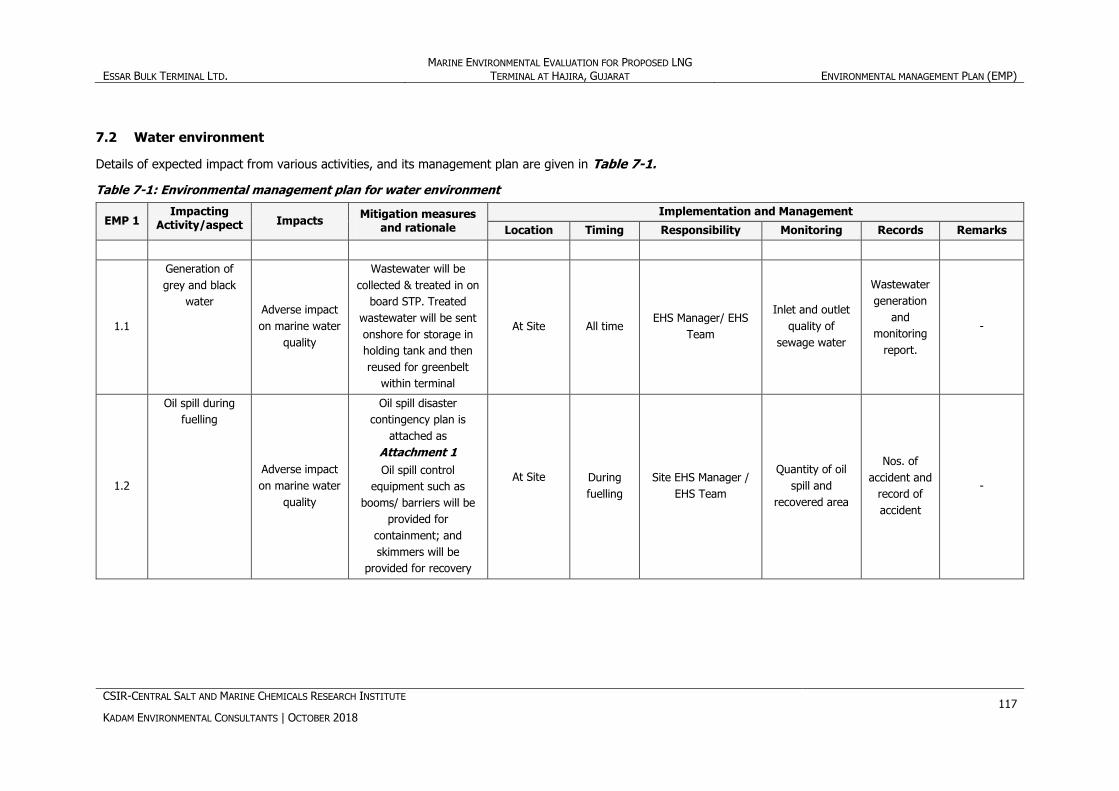
ESSAR BULK TERMINAL LTD. MARINE ENVIRONMENTAL EVALUATION FOR PROPOSED LNG
TERMINAL AT HAJIRA, GUJARAT ENVIRONMENTAL MANAGEMENT PLAN (EMP)
CSIR-CENTRAL SALT AND MARINE CHEMICALS RESEARCH INSTITUTE
KADAM ENVIRONMENTAL CONSULTANTS | OCTOBER 2018 117
7.2 Water environment
Details of expected impact from various activities, and its management plan are given in Table 7-1.
Table 7-1: Environmental management plan for water environment
EMP 1 Impacting
Activity/aspect Impacts Mitigation measures
and rationale
Implementation and Management
Location Timing Responsibility Monitoring Records Remarks
1.1
Generation of
grey and black
water Adverse impact
on marine water
quality
Wastewater will be
collected & treated in on
board STP. Treated
wastewater will be sent
onshore for storage in
holding tank and then
reused for greenbelt
within terminal
At Site All time EHS Manager/ EHS
Team
Inlet and outlet
quality of
sewage water
Wastewater
generation
and
monitoring
report.
-
1.2
Oil spill during
fuelling
Adverse impact
on marine water
quality
Oil spill disaster
contingency plan is
attached as
Attachment 1
Oil spill control
equipment such as
booms/ barriers will be
provided for
containment; and
skimmers will be
provided for recovery
At Site
During
fuelling
Site EHS Manager /
EHS Team
Quantity of oil
spill and
recovered area
Nos. of
accident and
record of
accident
-

ESSAR BULK TERMINAL LTD. MARINE ENVIRONMENTAL EVALUATION FOR PROPOSED LNG
TERMINAL AT HAJIRA, GUJARAT ENVIRONMENTAL MANAGEMENT PLAN (EMP)
CSIR-CENTRAL SALT AND MARINE CHEMICALS RESEARCH INSTITUTE
KADAM ENVIRONMENTAL CONSULTANTS | OCTOBER 2018 118
7.4 Sediment Environment
The environmental management plan is as given below in Table 7-2.
Table 7-2: Environmental management plan for soil environment
EMP 2
Impacting activities
Impacts Mitigation measures and
rationale
Implementation and Management
Location Timing Responsibility Monitoring Records Remarks
2.1 Accidental oil
Spillage
Contaminants
like oil can be
trapped in
the
sediments
due to
accidental
spillage
Oil spill
contingency plan
already available
to handle
accidental spill.
At Site
All time during
transportation of
materials
Site EHS Manager /
EHS Team
Quantity of oil
spill and
recovered area
Nos. of
accident and
record of
accident
-
7.5 Biological Environment
The environmental management plan is as given below in Table 7-3.
Table 7-3: Environment management plan for biological environment
EMP 3 Impacting activities
Impacts Mitigation measures and rationale
Implementation and management Remarks
Location Timing Responsibility Monitoring Records
1.1
Preparation of
FSU at
appropriate dry
dock/ purchase
location
Application of
anti-fouling
agents can
impact marine
fauna and
possibility enter
food chain
To eliminate/minimise
use of such agents since
the ship is going to be
stationary and fuel
consumption during
movement need not be
optimised since ship will
not move
At dry dock During FSU
preparation Site Supervisor EHS Manager Photographs -

ESSAR BULK TERMINAL LTD. MARINE ENVIRONMENTAL EVALUATION FOR PROPOSED LNG
TERMINAL AT HAJIRA, GUJARAT ENVIRONMENTAL MANAGEMENT PLAN (EMP)
CSIR-CENTRAL SALT AND MARINE CHEMICALS RESEARCH INSTITUTE
KADAM ENVIRONMENTAL CONSULTANTS | OCTOBER 2018 119
EMP 3 Impacting activities
Impacts Mitigation measures and rationale
Implementation and management Remarks
Location Timing Responsibility Monitoring Records
3.1
Oil spill during
fuelling Adverse impact
on marine
ecology
Oil spill disaster
contingency plan is
already available and
attached as
Attachment 1
At Site
During
fuelling
Site EHS Manager /
EHS Team
Quantity of oil
spill and
recovered area
Nos. of
accident and
record of
accident
-
3.2
Generation of
hazardous waste
such as
equipment
maintenance
fluids, used oil,
bilge sludge,
toxic paints and
batteries
Improperly
managed
hazardous
waste can result
in adverse
impact on
marine ecology
and nearby
community
Collection, Segregation,
Storage, Transportation
and disposal to
approved Recycler M/s
Jabrawala Petroleum
At Site All time EHS Manager/ EHS
Team
Periodic
monitoring
Waste
generation
and disposal
quantity
-
3.3
Generation of
grey and black
water
Grey water and
black water
which can
contain high
levels of BODs,
bacteria and
other
constituents
potentially
harmful to
marine
organisms
Wastewater will be
collected & treated in on
board STP. Treated
wastewater will be sent
onshore for storage in
holding tank and then
reused for greenbelt
within terminal.
At Site All time EHS Manager/ EHS
Team
Inlet and outlet
quality of
sewage water
Wastewater
generation
and
monitoring
report.
-

ESSAR BULK TERMINAL LTD. MARINE ENVIRONMENTAL EVALUATION FOR PROPOSED LNG
TERMINAL AT HAJIRA, GUJARAT ENVIRONMENTAL MANAGEMENT PLAN (EMP)
CSIR-CENTRAL SALT AND MARINE CHEMICALS RESEARCH INSTITUTE
KADAM ENVIRONMENTAL CONSULTANTS | OCTOBER 2018 120
EMP 3 Impacting activities
Impacts Mitigation measures and rationale
Implementation and management Remarks
Location Timing Responsibility Monitoring Records
3.4
Generation of
non-hazardous
solid waste
similar to
household waste
Garbage thrown
overboard or
managed
improperly can
have adverse
impact on
marine ecology
and general
health and
hygiene of
nearby
communities
through spread
of vector bourn
diseases
Solid waste will be
managed in
conformance with the
requirements laid out in
the Solid Waste
Management Rules
2016.and Marpol annex
V
At Site All time EHS Manager/ EHS
Team -
Records to
be
maintained
regarding
waste
generation
and disposal
quantity
-
ESSAR BULK TERMINAL LTD.
MARINE ENVIRONMENTAL EVALUATION FOR
PROPOSED LNG TERMINAL AT HAJIRA, GUJARAT SUMMARY & CONCLUSION
CSIR-CENTRAL SALT AND MARINE CHEMICALS RESEARCH INSTITUTE
KADAM ENVIRONMENTAL CONSULTANTS | OCTOBER 2018 121
8 SUMMARY AND CONCLUSION
8.1 Introduction & background
Please refer chapter 11, section 11.1 to 11.2 of Terrestrial EIA report.
8.2 Project description
Please refer chapter 11, section 11.3 of Terrestrial EIA report.
8.3 Description of the environment
8.3.1 Bathymetry
The area of interest lies in Tapi estuary at the mouth of the river and the approach channel to the Essar Port is
flanked by reclaimed area and berths on the west side and intertidal zones on the east side. The intertidal zones
are part of the island systems which are formed due to the interaction of tidal and river flows in the funnel area at
the mouth of the river. The funnel area of the river mouth is divided into two separate channels, Essar port
approach channel to the west of the island system and Magdalla approach channel to the east of the island system.
The island system is divided in a diagonal by a shallow channel which runs in the south-west and north-east. The
Essar channel is marked with depths of 10-11 meters with respect to CD and the northern portion of the Essar
channel in the estuary are marked by shallow depths which do not exceed 2.7 meters with respect to CD.
8.3.2 Wind
The data shows that the predominant directions for wind are from SW and WSW. The maximum wind speed is
around 14.86 m/sec and the direction of this is 216 degrees w.r.t north.
8.3.3 Tide
Tidal conditions at Hajira based on naval hydrographic chart number 2108 are in Table 8-1.
Table 8-1: Tide condition
Tidal condition Height in m w.r.t CD
MHWS 7.4
MHWN 6.0
MLWN 3.1
MLWS 1.7
MSL 4.2
Measured water elevation time series was collected in the channel in Feb 2018. The depth of observation is about
4.5m below datum and the measurements are carried out using an Acoustic Doppler current profiler. The
instrument would ideally collect the speed and direction of the flow through the entire water column. An additional
water level sensor is available in the said instrument, which has recorded the tide of the site. The values are given
in the Figure 8-1.
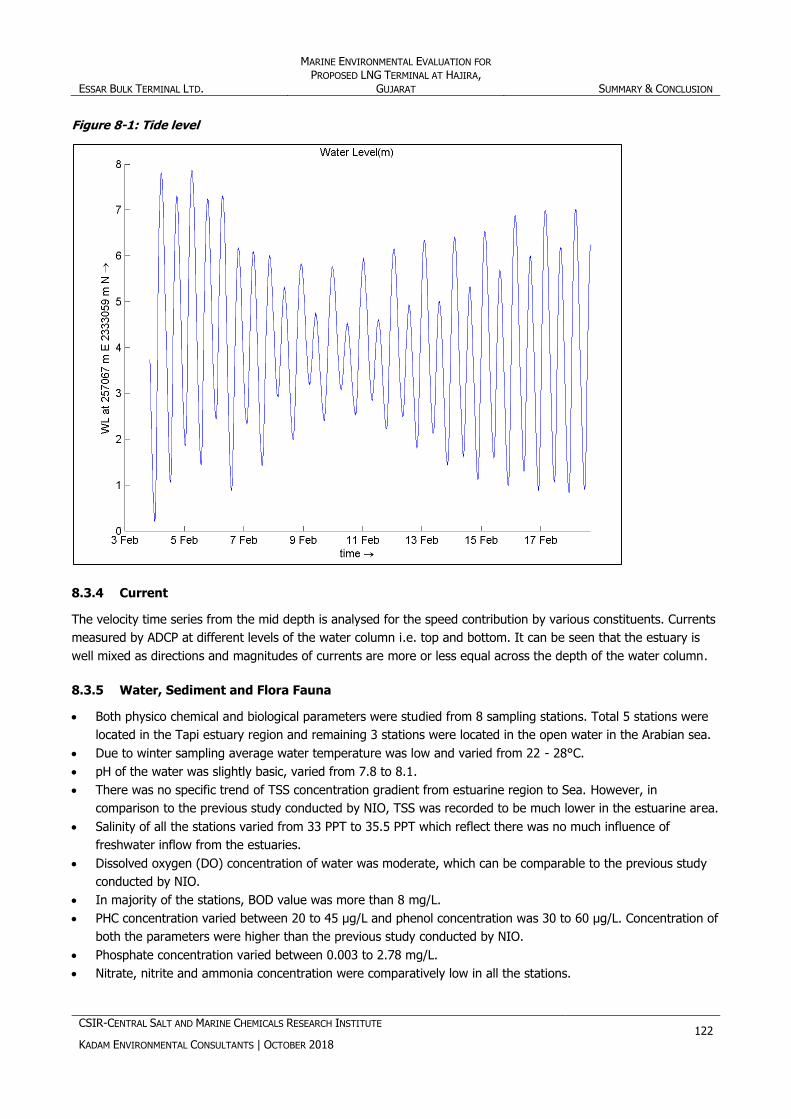
ESSAR BULK TERMINAL LTD.
MARINE ENVIRONMENTAL EVALUATION FOR
PROPOSED LNG TERMINAL AT HAJIRA, GUJARAT SUMMARY & CONCLUSION
CSIR-CENTRAL SALT AND MARINE CHEMICALS RESEARCH INSTITUTE
KADAM ENVIRONMENTAL CONSULTANTS | OCTOBER 2018 122
Figure 8-1: Tide level
8.3.4 Current
The velocity time series from the mid depth is analysed for the speed contribution by various constituents. Currents
measured by ADCP at different levels of the water column i.e. top and bottom. It can be seen that the estuary is
well mixed as directions and magnitudes of currents are more or less equal across the depth of the water column.
8.3.5 Water, Sediment and Flora Fauna
Both physico chemical and biological parameters were studied from 8 sampling stations. Total 5 stations were
located in the Tapi estuary region and remaining 3 stations were located in the open water in the Arabian sea.
Due to winter sampling average water temperature was low and varied from 22 - 28°C.
pH of the water was slightly basic, varied from 7.8 to 8.1.
There was no specific trend of TSS concentration gradient from estuarine region to Sea. However, in
comparison to the previous study conducted by NIO, TSS was recorded to be much lower in the estuarine area.
Salinity of all the stations varied from 33 PPT to 35.5 PPT which reflect there was no much influence of
freshwater inflow from the estuaries.
Dissolved oxygen (DO) concentration of water was moderate, which can be comparable to the previous study
conducted by NIO.
In majority of the stations, BOD value was more than 8 mg/L.
PHC concentration varied between 20 to 45 µg/L and phenol concentration was 30 to 60 µg/L. Concentration of
both the parameters were higher than the previous study conducted by NIO.
Phosphate concentration varied between 0.003 to 2.78 mg/L.
Nitrate, nitrite and ammonia concentration were comparatively low in all the stations.
ESSAR BULK TERMINAL LTD.
MARINE ENVIRONMENTAL EVALUATION FOR
PROPOSED LNG TERMINAL AT HAJIRA, GUJARAT SUMMARY & CONCLUSION
CSIR-CENTRAL SALT AND MARINE CHEMICALS RESEARCH INSTITUTE
KADAM ENVIRONMENTAL CONSULTANTS | OCTOBER 2018 123
Among heavy metals, Cr, Fe, Ni, Cu, Zn, Cd and Pb were studied from all the water samples. Concentration of
all the metals varied between 0.1- 0.14 µg/L (Cr), 10-16 µg/L (Fe), 1-2 µg/L (Ni), 0.8-1.0 µg/L(Cu), 0.5 - 12
µg/L (Zn), 0.2-0.6 µg/L (Cd) and 0.2-0.7 µg/L (Pb) respectively.
Total 4 number of sediment samples were analyzed. In all the samples sand percentage was much higher than
silt and clay.
Phytoplankton and zoo plankton diversity and abundance were very low in all the sampling stations.
Benthos diversity was also comparatively low in all the stations may be due to continuous dredging activity.
Total bacterial counts of HT water samples varied between 1× 101 to 3.08 × 10² CFU/ml. Enterobacterial
counts and Vibrio counts, Pseudomonas and Aeromonas counts were also low in HT water which indicate less
anthropogenic influence. Bacterial load was comparatively high in LT water samples.
In the case of sea sediment samples, Total bacterial counts were comparable between HT and LT samples.
Vibrio and Aeromonas were absent in majority of the stations.
Among the mangrove species Avicennia marina, Sonneratia apetala and Acanthus ilicifolius were commonly
observed. Marsh vegetation consisted of Sesuvium portulacastrum and occasionally Sueada sp, Cyperus sp,
Desmostachya bipinnata and Dichanthium aristatum – grass.
There was no report of seaweed, coral species in the study area.
Marine species of turtle have been reported at some sites along the western coast of Gulf. However, turtles
were not sighted during study period.
Dolphin and whale have been occasionally seen in the Gulf but were not sighted during study period.
There is no major fish landing center in the area
8.4 Environmental impact identification, prediction and mitigation measures
8.4.1 Water environment
Impact on water due to wastewater generation, solid & hazardous waste generation and oil spill
during fuelling
This may lead to adverse impact on marine water quality.
Impact on water due to accidental spillage
As such it is noted that the Port is equipped with an adequate VTMS system, thereby eliminating chances of
accidents and incidents involving ship to ship collision and consequent discharge of materials into the marine
environment. However, in the remotest of cases, during towing and berthing of the ships or owing to natural
calamity or piloting errors, there can be a rare possibility of mishaps like ship collision or ship hitting against the
wharf or ship getting grounded. During such events the ship may get damaged or in the worst case, capsize and
lead to oil spill inside the port basin or in the vicinity.
Mitigation measures for impacts on water
Wastewater will be collected & treated in on board STP. Treated wastewater will be sent onshore for storage in
holding tank and then reused for greenbelt within terminal.
Solid waste will be managed in conformance with the requirements laid out in the Solid Waste Management
Rules 2016.and Marpol annex V
Implement monitoring program to monitor water quality
Oil spill control equipment such as booms/ barriers will be provided for containment; and skimmers will be
provided for recovery
As the accidental spill will be in harboured waters, response time for shutting down the fuelling, containment
and recovery will be quicker
ESSAR BULK TERMINAL LTD.
MARINE ENVIRONMENTAL EVALUATION FOR
PROPOSED LNG TERMINAL AT HAJIRA, GUJARAT SUMMARY & CONCLUSION
CSIR-CENTRAL SALT AND MARINE CHEMICALS RESEARCH INSTITUTE
KADAM ENVIRONMENTAL CONSULTANTS | OCTOBER 2018 124
As a precautionary measures oil spill model was also run to know the severity and impacted zone of spills due
to the proposed project
Since this is an existing port, Oil Spill Disaster Contingency Plan is already available to handle oil spill. Oil
Contingency Team headed by a trained expert has been established at port. Coordination has been established
with the Indian Coast Guard.
8.4.2 Sediment environment
Impact on sediment due to accidental spillage of fuel oil
It is noted that in extremely rare events, small quantities of oil (as mentioned in the OSDCP) can leak into the
environment and therefore enter the marine waters. Such an event has never occurred in the past, however, good
practice entails understanding the possible impacts on the environment, in case it does.
Contamination of sediments with oil may modify chemical, physical and biological processes.
The persistent toxic constituents of oil, such as heavy metals, can become stored in the sediments, and taken up
into the food chain.
Mitigation measures
Since this is an existing port, Oil Spill Disaster Contingency Plan is already available to handle oil spill. Oil
Contingency Team headed by a trained expert has been established at port. Coordination has been established with
the Indian Coast Guard. Readily available oil handling equipment like booms, skimmer and chemicals for dispersion.
8.4.3 Air Environment
Impact due to Consumption of fuel and operation of engines during idling and cargo loading
unloading
Air emission in the form of PM, NOx, SO2, HC & CO
Mitigation measures
Fuel conforming to MARPOL Annex VI with sulphur content <0.5%.
Optimal maintenance of engines so as to ensure appropriate air fuel mixture and minimal emissions.
Implement monitoring program to monitor effects of air emissions on ecological communities
8.4.4 Flora & fauna
Impact due to application of antifouling agents on FSU, generation of solid & hazardous waste
Application of anti-fouling agents can impact marine fauna and possibility enter food chain
Garbage thrown overboard or managed improperly can have adverse impact on marine ecology
Improperly managed hazardous waste can result in adverse impact on marine ecology
Disturbance to fishes due to movement of ships and accidental spillage only.
Spill residue will contaminate sub tidal and intertidal benthic habitat.
Disturbance to fishes due to movement of ships and accidental spillage only. Fishes from affected zone may get
temporarily tainted. Considering that the mouth estuarine zone of Tapi and associated coastal area is not
commercial fishing zone, impact would be minor and temporary.
Spill residue will contaminate sub tidal and intertidal benthic habitat.
Marine turtles and mammals are highly sensitive to oil spill and swim away from the spill site but there is no
impact on the same as marine turtles and mammals are not recorded at site

ESSAR BULK TERMINAL LTD.
MARINE ENVIRONMENTAL EVALUATION FOR
PROPOSED LNG TERMINAL AT HAJIRA, GUJARAT SUMMARY & CONCLUSION
CSIR-CENTRAL SALT AND MARINE CHEMICALS RESEARCH INSTITUTE
KADAM ENVIRONMENTAL CONSULTANTS | OCTOBER 2018 125
Mitigation measures
Eliminate/minimise use of such agents since the ship is going to be stationary and fuel consumption during
movement need not be optimised since ship will not move.
Solid waste will be managed in conformance with the requirements laid out in the Solid Waste Management
Rules 2016.and Marpol annex V
Collection, Segregation, Storage, Transportation and disposal to approved Recycler M/s Jabrawala Petroleum
Oil spill control equipment such as booms/ barriers will be provided for containment; and skimmers will be
provided for recovery
Oil Contingency Team headed by a trained expert has been established at port. Coordination has been
established with the Indian Coast Guard.
Implement marine environmental monitoring programme
8.5 Additional studies
8.5.1 Hydrodynamic modelling
The high currents are largely confined to the channel and majority of the water exchange occurs through the
deeper bathymetry. There is local circulation of water mass, pumped through channel and then into the Mindola
estuary during the flood. The currents are periodic in nature with 6hr cycle and are strongly driven by the tides in
Gulf of Khambhat. The berthing areas of Essar port are shielded from the strong currents even during the flood and
ebb times.
8.5.2 Oil spill
The study shows that if the spill occurs during the ebb tide, the maximum concentration of oil due to the spill, at
the end of 24 hours is in the order of around 0.00006 kg/m2 and the concentrations are spread in an intermittent
manner in and around the Essar port and do not extend beyond the northern island.
The study shows that if the spill occurs during the flood tide, the maximum concentration of oil due to the spill, at
the end of 24 hours is in the order of around 0.00045 kg/m2 and the concentrations are spread mostly around the
right-angle bend in the river path next to the northern island.
The resultant concentrations due to the spill is more if start of the spill is during flood tide and the resulting
concentrations shows that the estuary is marked by good flushing characteristics.
The results show the efforts launched in the first hour after the spill are going to be most effective in containing the
spread of the spill and removal of the oil slick from the sea surface.
8.5.3 Shoreline change
Channel dredged in the area would have caused some increase in the tidal prism in the creek where EBTL is
located. This would most likely have caused some changes in the shoreline opposite to EBTL port in the initial
years. The challenge is whether these changes are still continuing or has attained an equilibrium state resulting in
stable shoreline. The best way to understand this issue is to track changes in the zero-contour line over the past
few years. To identify the changes, a comparison is made between the zero-meter contour in 2013 and the same in
subsequent years. For the year 2013 zero contour was extracted from NHO chart and is compared with the zero-
contour extracted from Google Earth. From this, it can be seen that the zero-contour remains same over the period
2013-2016 which implies that there is no likely change in the shoreline and has reached an equilibrium state.

ESSAR BULK TERMINAL LTD.
MARINE ENVIRONMENTAL EVALUATION FOR
PROPOSED LNG TERMINAL AT HAJIRA, GUJARAT SUMMARY & CONCLUSION
CSIR-CENTRAL SALT AND MARINE CHEMICALS RESEARCH INSTITUTE
KADAM ENVIRONMENTAL CONSULTANTS | OCTOBER 2018 126
8.6 Environmental management plan
The EMP provides a delivery mechanism to address potential adverse impacts and to introduce standards of good
practice to be adopted for all project works. For each stage of the programme, the EMP lists all the requirements to
ensure effective mitigation of every potential marine impact identified in the EIA. For each impact or operation,
which could otherwise give rise to impact, the following information is presented:
Role of M/s EBTL and its contractors;
A comprehensive listing of the mitigation measures (actions) that M/s EBTL shall implement;
The parameters that shall be monitored to ensure effective implementation of the action;
The timing for implementation of the action to ensure that the objectives of mitigation are fully met.
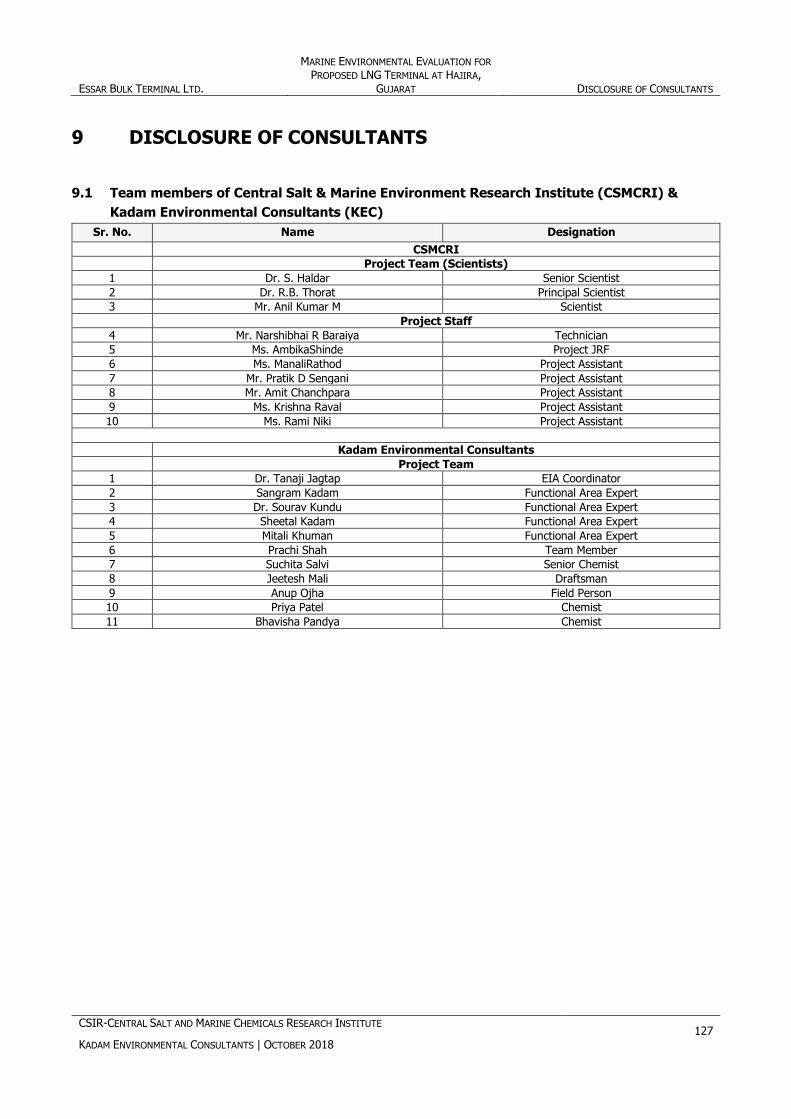
ESSAR BULK TERMINAL LTD.
MARINE ENVIRONMENTAL EVALUATION FOR
PROPOSED LNG TERMINAL AT HAJIRA, GUJARAT DISCLOSURE OF CONSULTANTS
CSIR-CENTRAL SALT AND MARINE CHEMICALS RESEARCH INSTITUTE
KADAM ENVIRONMENTAL CONSULTANTS | OCTOBER 2018 127
9 DISCLOSURE OF CONSULTANTS
9.1 Team members of Central Salt & Marine Environment Research Institute (CSMCRI) &
Kadam Environmental Consultants (KEC)
Sr. No. Name Designation
CSMCRI
Project Team (Scientists)
1 Dr. S. Haldar Senior Scientist
2 Dr. R.B. Thorat Principal Scientist
3 Mr. Anil Kumar M Scientist
Project Staff
4 Mr. Narshibhai R Baraiya Technician
5 Ms. AmbikaShinde Project JRF
6 Ms. ManaliRathod Project Assistant
7 Mr. Pratik D Sengani Project Assistant
8 Mr. Amit Chanchpara Project Assistant
9 Ms. Krishna Raval Project Assistant
10 Ms. Rami Niki Project Assistant
Kadam Environmental Consultants
Project Team
1 Dr. Tanaji Jagtap EIA Coordinator
2 Sangram Kadam Functional Area Expert
3 Dr. Sourav Kundu Functional Area Expert
4 Sheetal Kadam Functional Area Expert
5 Mitali Khuman Functional Area Expert
6 Prachi Shah Team Member
7 Suchita Salvi Senior Chemist
8 Jeetesh Mali Draftsman
9 Anup Ojha Field Person
10 Priya Patel Chemist
11 Bhavisha Pandya Chemist

ESSAR BULK TERMINAL LTD.
MARINE ENVIRONMENTAL EVALUATION FOR
PROPOSED LNG TERMINAL AT HAJIRA, GUJARAT ATTACHMENT
CSIR-CENTRAL SALT AND MARINE CHEMICALS RESEARCH INSTITUTE
KADAM ENVIRONMENTAL CONSULTANTS | OCTOBER 2018 128
ATTACHMENT
ESSAR BULK TERMINAL LTD.
MARINE ENVIRONMENTAL EVALUATION FOR
PROPOSED LNG TERMINAL AT HAJIRA, GUJARAT ATTACHMENT
CSIR-CENTRAL SALT AND MARINE CHEMICALS RESEARCH INSTITUTE
KADAM ENVIRONMENTAL CONSULTANTS | OCTOBER 2018 129
Attachment 1: Oil Spill Disaster Contingency Plan

ESSAR BULK TERMINAL LTD.
MARINE ENVIRONMENTAL EVALUATION FOR
PROPOSED LNG TERMINAL AT HAJIRA, GUJARAT ATTACHMENT
CSIR-CENTRAL SALT AND MARINE CHEMICALS RESEARCH INSTITUTE
KADAM ENVIRONMENTAL CONSULTANTS | OCTOBER 2018 130
Attachment 2: Ship Tranquillity Study (Wave Transformation Studies)