Appendices © 2008 Pearson Addison-Wesley. All rights reserved.
62
Appendice s © 2008 Pearson Addison-Wesley. All rights reserved
-
Upload
verity-wheeler -
Category
Documents
-
view
226 -
download
0
Transcript of Appendices © 2008 Pearson Addison-Wesley. All rights reserved.

Appendices
© 2008 Pearson Addison-Wesley.All rights reserved

Copyright © 2008 Pearson Addison-Wesley. All rights reserved. Appendices-2
Appendices
Appendix AEquations and Inequalities
Appendix BGraphs of Equations
Appendix CFunctions
Appendix DGraphing Techniques

Copyright © 2008 Pearson Addison-Wesley. All rights reserved. Appendices-3
Equations and InequalitiesAEquations ▪ Solving Linear Equations ▪ Solving Quadratic Equations ▪ Inequalities ▪ Solving Linear Inequalities ▪ Interval Notation ▪ Three-Part Inequalities

Copyright © 2008 Pearson Addison-Wesley. All rights reserved. Appendices-4
A Example 1 Solving a Linear Equation (page 423)
Solve .
Solution set: {6}
Distributive property
Combine terms.
Add 4 to both sides.Add 12x to both sides.Combine terms.Divide both sides by 4.
Copyright © 2008 Pearson Addison-Wesley. All rights reserved. Appendices-5
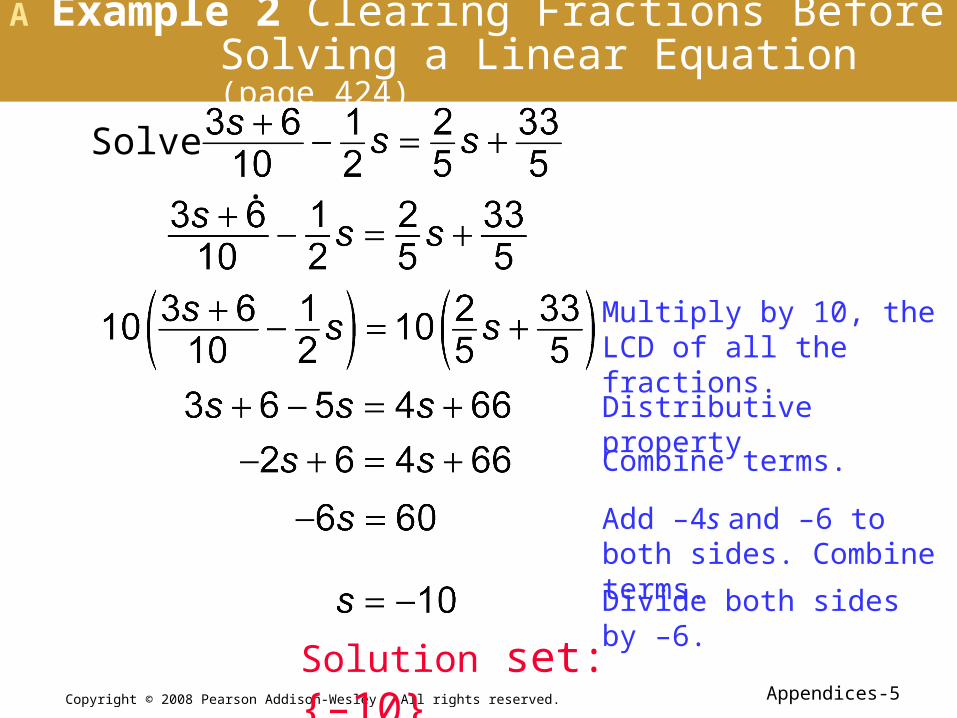
Solve .
A Example 2 Clearing Fractions Before Solving a Linear Equation (page 424)
Solution set: {–10}
Multiply by 10, the LCD of all the fractions.
Distributive property
Combine terms.
Add –4s and –6 to both sides. Combine terms.
Divide both sides by –6.

Copyright © 2008 Pearson Addison-Wesley. All rights reserved. Appendices-6
Decide whether the equation is an identity, a conditional equation, or a contradiction. Give the solution set.
A Example 3(a) Identifying Types of Equations (page 425)
This is a conditional equation.Solution set: {11}
Add –4x and 9 to both sides. Combine terms.
Divide both sides by 2.
Copyright © 2008 Pearson Addison-Wesley. All rights reserved. Appendices-7
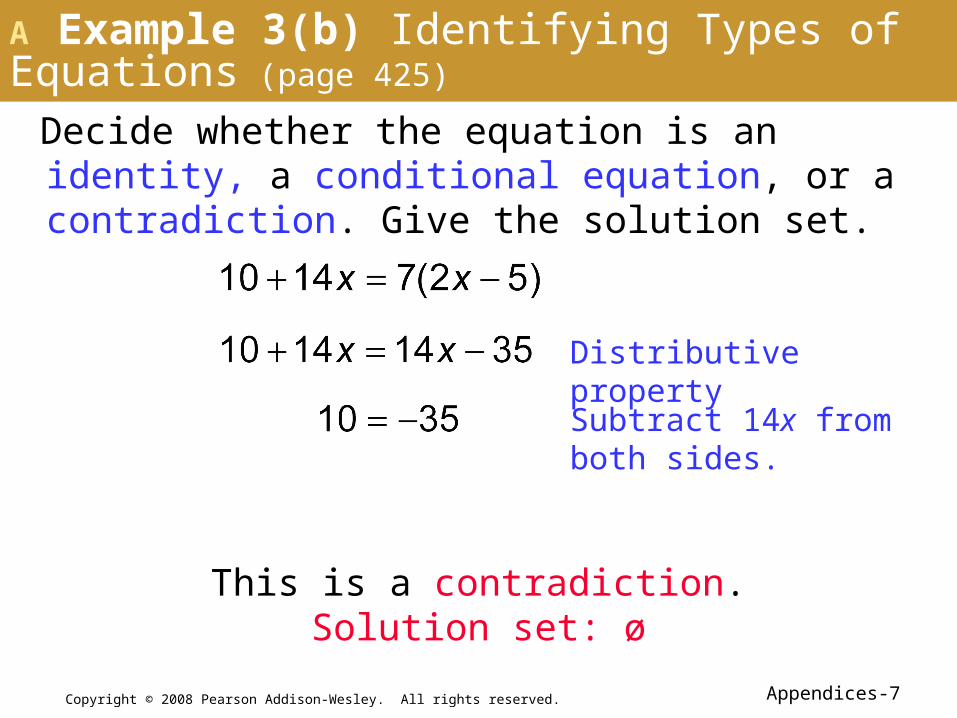
Decide whether the equation is an identity, a conditional equation, or a contradiction. Give the solution set.
This is a contradiction.Solution set: ø
Distributive property
Subtract 14x from both sides.
A Example 3(b) Identifying Types of Equations (page 425)
Copyright © 2008 Pearson Addison-Wesley. All rights reserved. Appendices-8
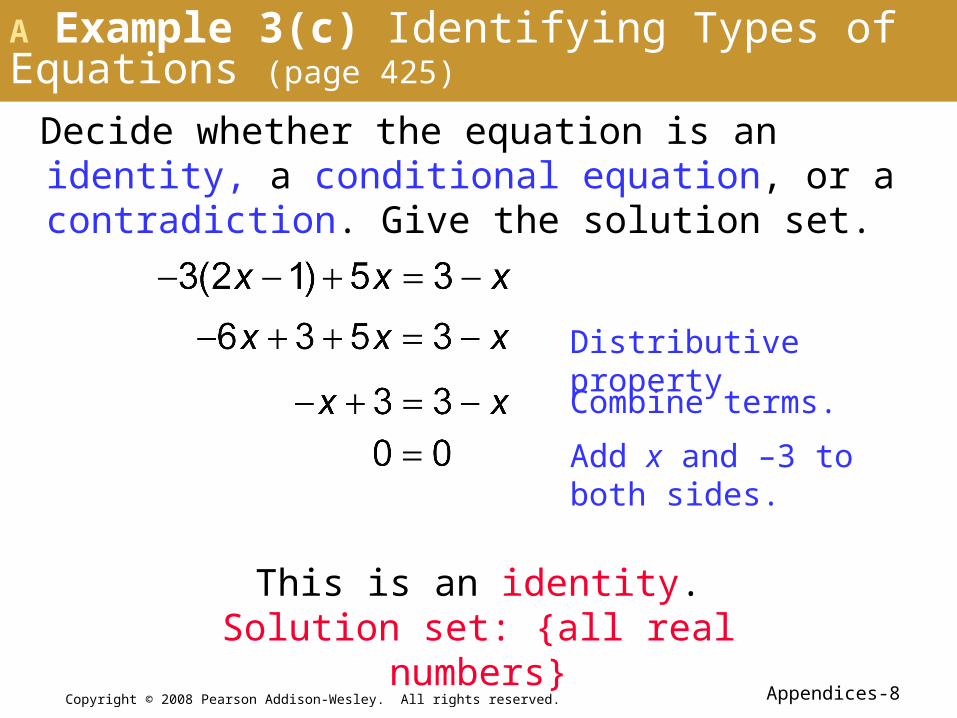
Decide whether the equation is an identity, a conditional equation, or a contradiction. Give the solution set.
A Example 3(c) Identifying Types of Equations (page 425)
This is an identity.Solution set: {all real numbers}
Distributive property
Combine terms.
Add x and –3 to both sides.

Copyright © 2008 Pearson Addison-Wesley. All rights reserved. Appendices-9
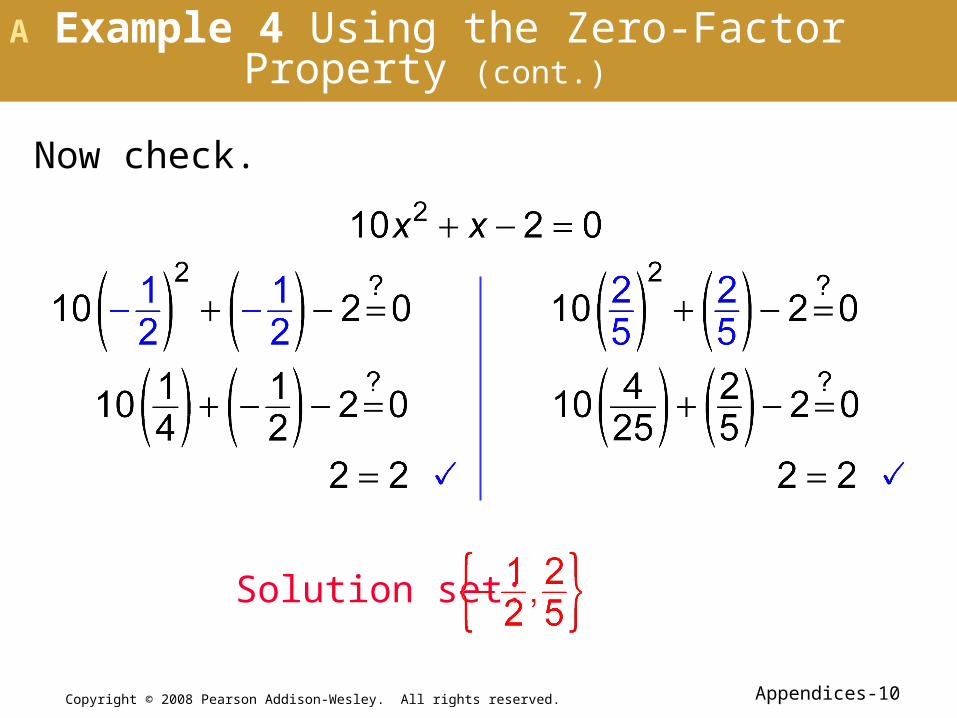
A Example 4 Using the Zero-Factor Property (page 426)
Solve .
Factor.
Set each factor equal to 0 and then solve for x.
or
or
or
Copyright © 2008 Pearson Addison-Wesley. All rights reserved. Appendices-10
A Example 4 Using the Zero-Factor Property (cont.)
Now check.
Solution set:

Copyright © 2008 Pearson Addison-Wesley. All rights reserved. Appendices-11
A Example 5 Using the Square Root Property (page 426)
Solve each quadratic equation.
Generalized square root property
(a)
(b)

Copyright © 2008 Pearson Addison-Wesley. All rights reserved. Appendices-12
A Example 6 Using the Quadratic Formula (Real Solutions) (page 115)
Solve .
a = 1, b = 6, c = –3
Write the equation in standard form.
Quadratic formula

Copyright © 2008 Pearson Addison-Wesley. All rights reserved. Appendices-13
A Example 6 Using the Quadratic Formula (Real Solutions) (cont.)
Solution set:
Copyright © 2008 Pearson Addison-Wesley. All rights reserved. Appendices-14
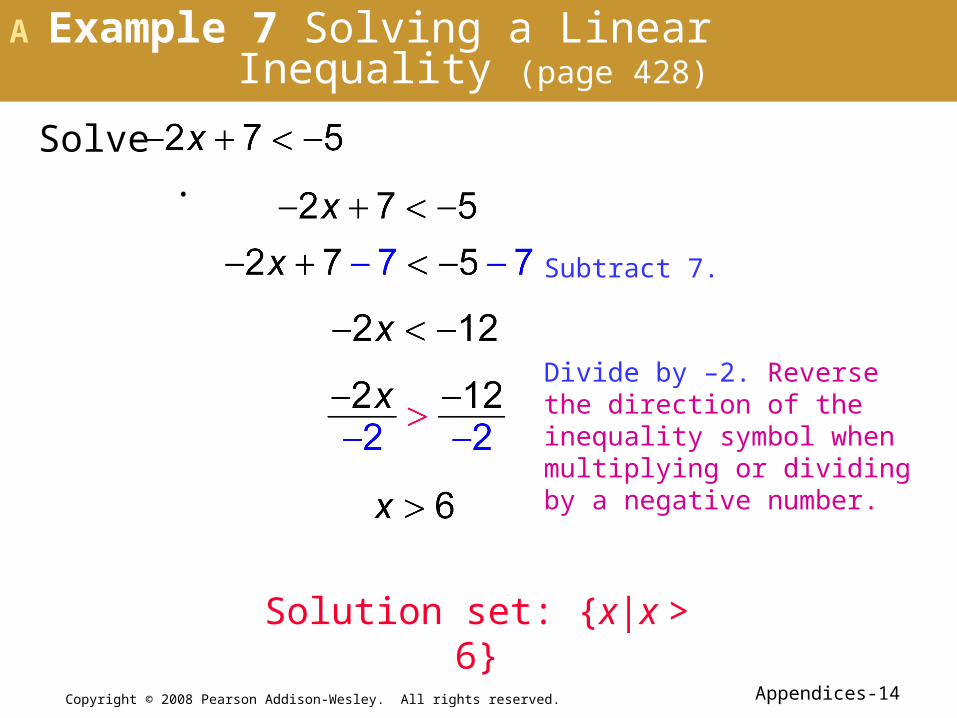
Subtract 7.
Divide by –2. Reverse the direction of the inequality symbol when multiplying or dividing by a negative number.
Solution set: {x|x > 6}
A Example 7 Solving a Linear Inequality (page 428)
Solve .

Copyright © 2008 Pearson Addison-Wesley. All rights reserved. Appendices-15
A Example 8 Solving a Three-Part Inequality (page 429)
Solve .
Add 8.
Divide by 6.
Solution set:

Copyright © 2008 Pearson Addison-Wesley. All rights reserved. Appendices-16
Graphs of EquationsBThe Rectangular Coordinate System ▪ The Pythagorean Theorem and the Distance Formula ▪ The Midpoint Formula ▪ Graphing Equations ▪ Circles

Copyright © 2008 Pearson Addison-Wesley. All rights reserved. Appendices-17
B Example 1 Using the Distance Formula (page 433)
Find the distance between P(3, –5) and Q(–2, 8).
The distance between P(3, –5) and Q(–2, 8) is

Copyright © 2008 Pearson Addison-Wesley. All rights reserved. Appendices-18
Find the coordinates of the midpoint M of the segment with endpoints (–7, –5) and (–2, 13).
B Example 2 Using the Midpoint Formula (page 434)
Midpoint formula:
The coordinates of the midpoint M of the segment
with endpoints (–7, –5) and (–2, 13) are

Copyright © 2008 Pearson Addison-Wesley. All rights reserved. Appendices-19
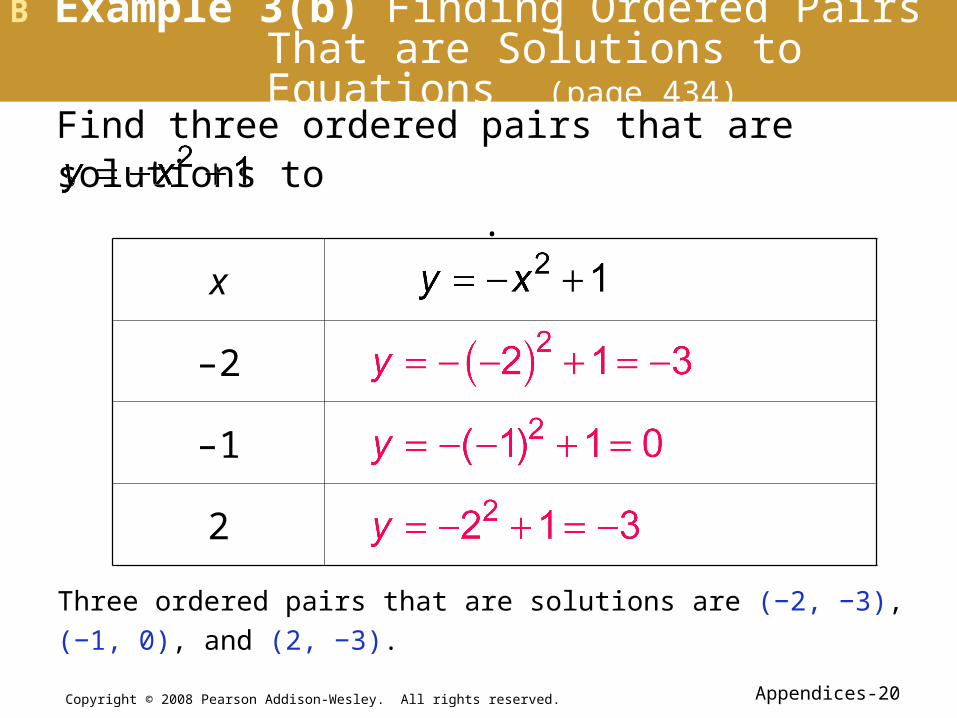
B Example 3(a) Finding Ordered Pairs That are Solutions to Equations (page 434)
x
–1
1
3
Three ordered pairs that are solutions are (−1, 7),
(1, 3), and (3, −1).
Find three ordered pairs that are solutions to y = –2x + 5.
Copyright © 2008 Pearson Addison-Wesley. All rights reserved. Appendices-20
Find three ordered pairs that are solutions to .
B Example 3(b) Finding Ordered Pairs That are Solutions to Equations (page 434)
x
–2
–1
2
Three ordered pairs that are solutions are (−2, −3),
(−1, 0), and (2, −3).

Copyright © 2008 Pearson Addison-Wesley. All rights reserved. Appendices-21
B Example 4(a) Graphing Equations (page 435)
Step 1: Find the x-intercept and the y-intercept.
Intercepts: and
Graph the equation y = –2x + 5. (See Classroom Example 3a.)
Copyright © 2008 Pearson Addison-Wesley. All rights reserved. Appendices-22
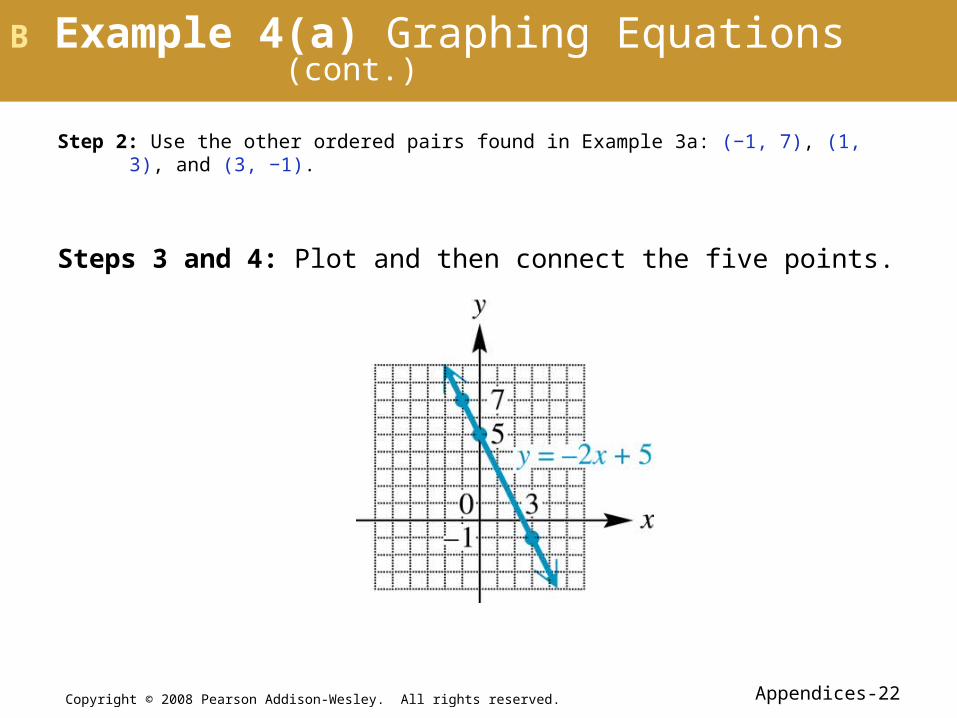
B Example 4(a) Graphing Equations (cont.)
Step 2: Use the other ordered pairs found in Example 3a: (−1, 7), (1, 3), and (3, −1).
Steps 3 and 4: Plot and then connect the five points.

Copyright © 2008 Pearson Addison-Wesley. All rights reserved. Appendices-23
Graph the equation . (See Classroom Example 3b.)
B Example 4(b) Graphing Equations (page 435)
Step 1: Find the x-intercept and the y-intercept.
Intercepts: (–1, 0), (1, 0) and (0, 1)

Copyright © 2008 Pearson Addison-Wesley. All rights reserved. Appendices-24
B Example 8(c) Graphing Equations (cont.)
Step 2: Use the other ordered pairs found in Example 3b: (−2, −3) and (2, −3).
Steps 3 and 4: Plot and then connect the five points.

Copyright © 2008 Pearson Addison-Wesley. All rights reserved. Appendices-25
Find the center-radius form of the equation of each circle described.
B Example 5 Find the Center-Radius Form (page 437)
(a) Center at (1, –2), radius 3
(b) Center at (0, 0), radius 2
(h, k) = (1, –2), r = 3
(h, k) = (0, 0), r = 2

Copyright © 2008 Pearson Addison-Wesley. All rights reserved. Appendices-26
B Example 6(a) Graphing Circles (page 437)
Graph
Write the equation as
(h, k) = (1, –2), r = 3
Copyright © 2008 Pearson Addison-Wesley. All rights reserved. Appendices-27
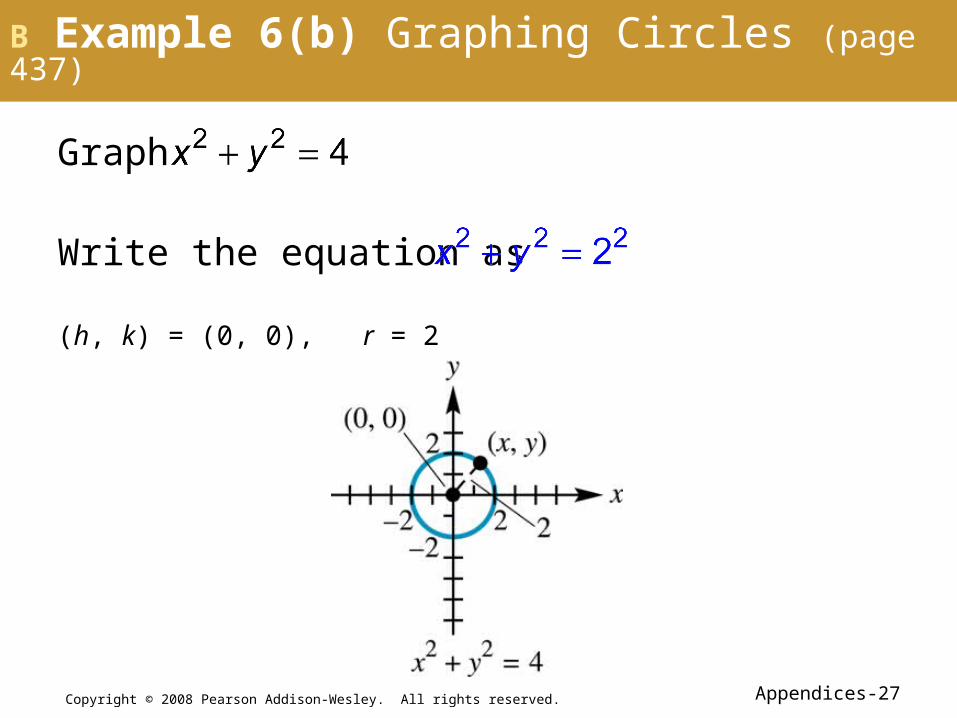
B Example 6(b) Graphing Circles (page 437)
Graph
(h, k) = (0, 0), r = 2
Write the equation as
Copyright © 2008 Pearson Addison-Wesley. All rights reserved. Appendices-28
FunctionsCRelations and Functions ▪ Domain and Range ▪ Determining Functions from Graphs or Equations ▪ Function Notation ▪ Increasing, Decreasing, and Constant Functions

Copyright © 2008 Pearson Addison-Wesley. All rights reserved. Appendices-29
C Example 1 Deciding Whether Relations Define Functions
(page 441)Decide whether the relation determines a function.
M is a function because each distinct x-value has exactly one y-value.
(a)

Copyright © 2008 Pearson Addison-Wesley. All rights reserved. Appendices-30
C Example 1 Deciding Whether Relations Define Functions
(cont.)
(b)
N is not a function because the x-value –4 has two y-values.

Copyright © 2008 Pearson Addison-Wesley. All rights reserved. Appendices-31
Give the domain and range of the relation. Is the relation a function?
{(–4, –2), (–1, 0), (1, 2), (3, 5)}
Domain: {–4, –1, 0, 3}
Range: {–2, 0, 2, 5}
The relation is a function because each x-value corresponds to exactly one y-value.
C Example 2(a) Finding Domains and Ranges of Relations
(page 442)
Copyright © 2008 Pearson Addison-Wesley. All rights reserved. Appendices-32
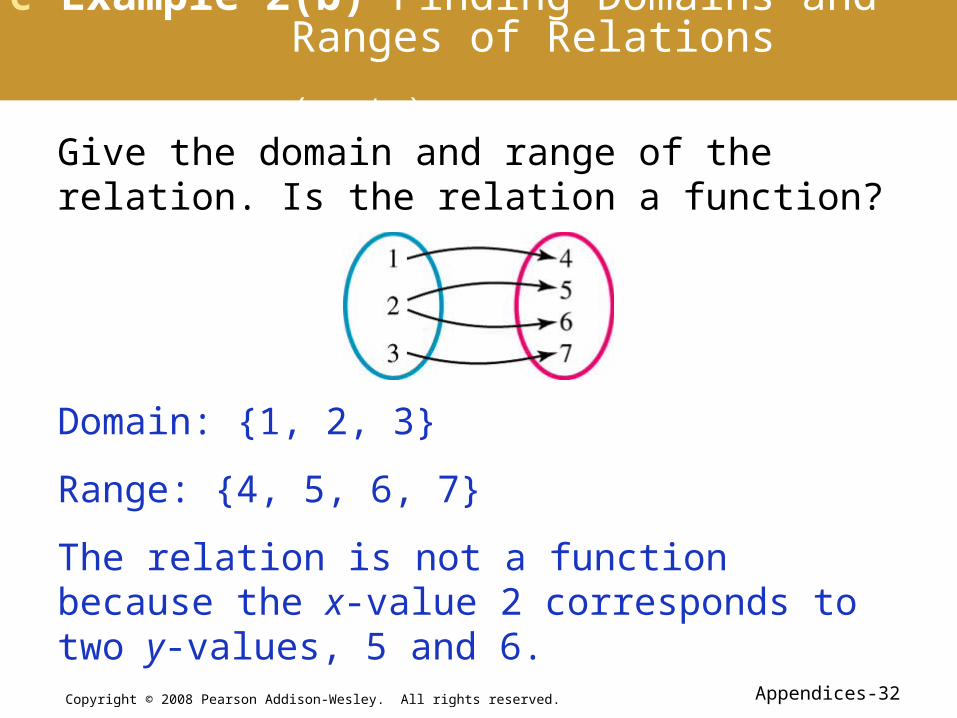
C Example 2(b) Finding Domains and Ranges of Relations
(cont.)
Give the domain and range of the relation. Is the relation a function?
Domain: {1, 2, 3}
Range: {4, 5, 6, 7}
The relation is not a function because the x-value 2 corresponds to two y-values, 5 and 6.

Copyright © 2008 Pearson Addison-Wesley. All rights reserved. Appendices-33
C Example 3(a) Finding Domains and Ranges from Graphs
(page 442)
Give the domain and range of the relation.
Domain: {–2, 4}
Range: {0, 3}

Copyright © 2008 Pearson Addison-Wesley. All rights reserved. Appendices-34
C Example 3(b) Finding Domains and Ranges from Graphs
(cont.)
Give the domain and range of the relation.
Domain:
Range:

Copyright © 2008 Pearson Addison-Wesley. All rights reserved. Appendices-35
Give the domain and range of the relation.
Domain: [–5, 5]
Range: [–3, 3]
C Example 3(c) Finding Domains and Ranges from Graphs
(cont.)

Copyright © 2008 Pearson Addison-Wesley. All rights reserved. Appendices-36
C Example 3(d) Finding Domains and Ranges from Graphs
(cont.)
Give the domain and range of the relation.
Domain:
Range:

Copyright © 2008 Pearson Addison-Wesley. All rights reserved. Appendices-37
Determine if the relation is a function and give the domain and range.
y is found by multiplying x by 2 and subtracting 5.
C Example 4(a) Identifying Functions, Domains, and Ranges (page 444)
y = 2x – 5
Domain: Range:
Each value of x corresponds to just one value of y, so the relation is a function.

Copyright © 2008 Pearson Addison-Wesley. All rights reserved. Appendices-38
Determine if the relation is a function and give the domain and range.
y is found by squaring x by 2 and adding 3.
C Example 4(b) Identifying Functions, Domains, and Ranges (cont.)
y = x2 + 3
Domain: Range:
Each value of x corresponds to just one value of y, so the relation is a function.
Copyright © 2008 Pearson Addison-Wesley. All rights reserved. Appendices-39
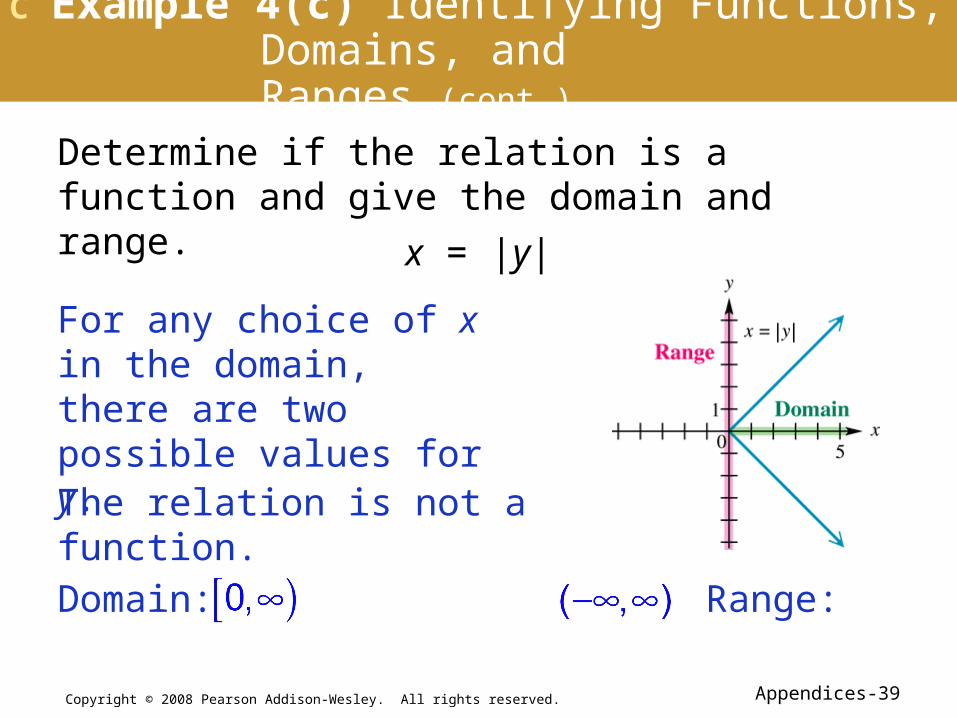
Determine if the relation is a function and give the domain and range.
For any choice of x in the domain, there are two possible values for y.
C Example 4(c) Identifying Functions, Domains, and Ranges (cont.)
x = |y|
Domain: Range:
The relation is not a function.

Copyright © 2008 Pearson Addison-Wesley. All rights reserved. Appendices-40
Determine if the relation is a function and give the domain and range.
y is found by dividing 3 by x + 2.
C Example 4(d) Identifying Functions, Domains, and Ranges (cont.)
Domain: Range:
Each value of x corresponds to just one value of y, so the relation is a function.

Copyright © 2008 Pearson Addison-Wesley. All rights reserved. Appendices-41
Let and .
Find f(–3), f(r), and g(r + 2).
C Example 5 Using Function Notation (page 445)

Copyright © 2008 Pearson Addison-Wesley. All rights reserved. Appendices-42
Find f(–1) for each function.
(a) f(x) = 2x2 – 9
(b) f = {(–4, 0), (–1, 6), (0, 8), (2, –2)}
C Example 6 Using Function Notation (page 446)
f(–1) = 2(–1)2 – 9 = –7
f(–1) = 6

Copyright © 2008 Pearson Addison-Wesley. All rights reserved. Appendices-43
Find f(–1) for each function.
(c) (d)
C Example 6 Using Function Notation (cont.)
f(–1) = 5 f(–1) = 0

Copyright © 2008 Pearson Addison-Wesley. All rights reserved. Appendices-44
The figure is the graph of a function. Determine the intervals over which the function is increasing, decreasing, or constant.
C Example 7 Determining Intervals Over Which a Function is Increasing, Decreasing, or Constant
(page 447)
Increasing on Decreasing on
Constant on

Copyright © 2008 Pearson Addison-Wesley. All rights reserved. Appendices-45
Graphing TechniquesDStretching and Shrinking ▪ Reflecting ▪ Symmetry ▪ Translations

Copyright © 2008 Pearson Addison-Wesley. All rights reserved. Appendices-46
D Example 1 Stretching or Shrinking a Graph (page 451)
x
–2
–1
0
1
2
4 1
1 ¼
0 0
1 ¼
4 1
Create a table of values.
Note that for corresponding values of x, the y-values of g(x) are each one-fourth that of f(x).
Graph the function
Copyright © 2008 Pearson Addison-Wesley. All rights reserved. Appendices-47
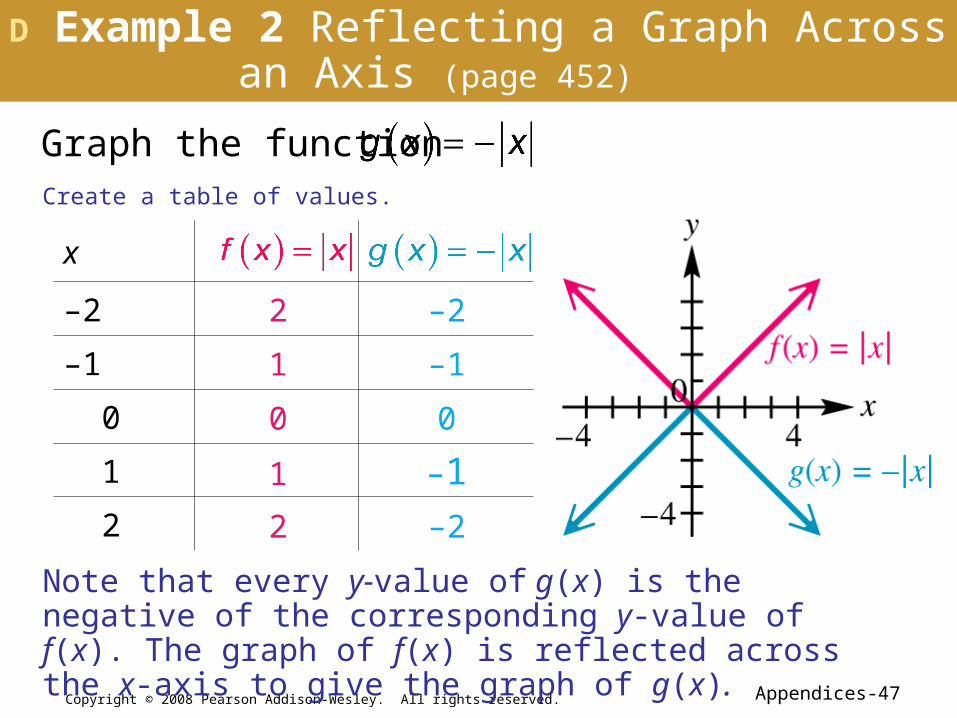
D Example 2 Reflecting a Graph Across an Axis (page 452)
x
–2
–1
0
1
2
2 –2
1 –1
0 0
1 –1
2 –2
Create a table of values.
Note that every y-value of g(x) is the negative of the corresponding y-value of f(x). The graph of f(x) is reflected across the x-axis to give the graph of g(x).
Graph the function
Copyright © 2008 Pearson Addison-Wesley. All rights reserved. Appendices-48
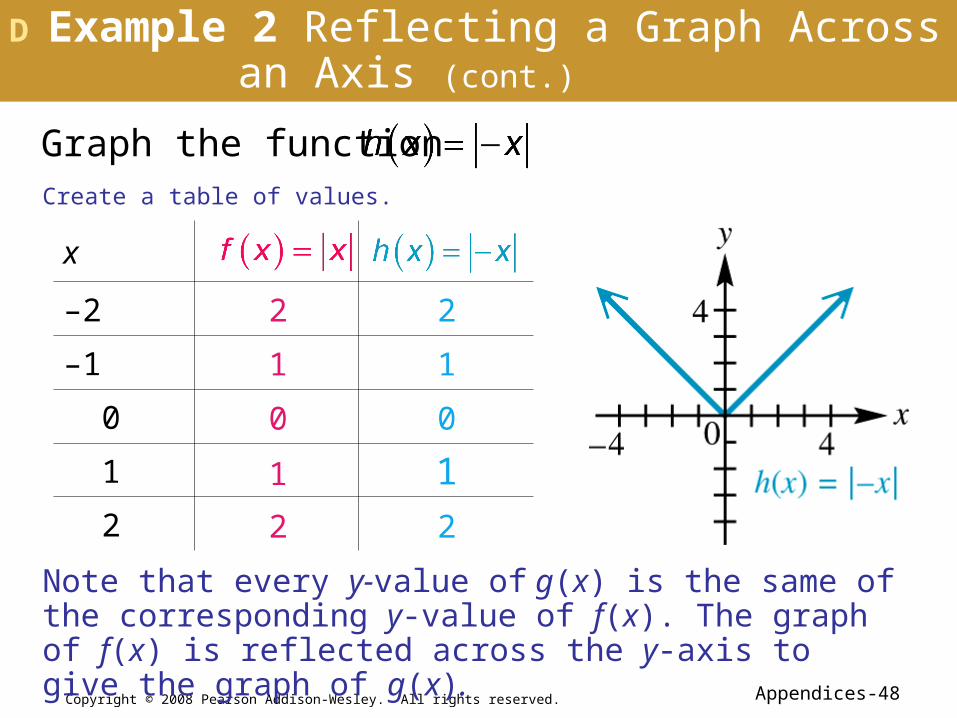
D Example 2 Reflecting a Graph Across an Axis (cont.)
x
–2
–1
0
1
2
2 2
1 1
0 0
1 1
2 2
Create a table of values.
Note that every y-value of g(x) is the same of the corresponding y-value of f(x). The graph of f(x) is reflected across the y-axis to give the graph of g(x).
Graph the function

Copyright © 2008 Pearson Addison-Wesley. All rights reserved. Appendices-49
D Example 3(a) Testing for Symmetry with Respect to an Axis (page 454)
Test for symmetry with respect to the x-axis and the y-axis.
Replace x with –x:
The result is not the same as the original equation.
The graph is not symmetric with respect to the y-axis.
Replace y with –y:
The result is the same as the original equation.
The graph is symmetric with respect to the x-axis.
The graph is symmetric with respect to the x-axis only.

Copyright © 2008 Pearson Addison-Wesley. All rights reserved. Appendices-50
D Example 3(a) Testing for Symmetry with Respect to an Axis (cont.)

Copyright © 2008 Pearson Addison-Wesley. All rights reserved. Appendices-51
D Example 3(b) Testing for Symmetry with Respect to an Axis (page 454)
Test for symmetry with respect to the x-axis and the y-axis.
Replace x with –x:
The result is the same as the original equation.
The graph is symmetric with respect to the y-axis.
Replace y with –y:
The result is the not same as the original equation.
The graph is not symmetric with respect to the x-axis.
The graph is symmetric with respect to the y-axis only.

Copyright © 2008 Pearson Addison-Wesley. All rights reserved. Appendices-52
D Example 3(b) Testing for Symmetry with Respect to an Axis (cont.)

Copyright © 2008 Pearson Addison-Wesley. All rights reserved. Appendices-53
D Example 3(c) Testing for Symmetry with Respect to an Axis (page 454)
Test for symmetry with respect to the x-axis and the y-axis.
Replace x with –x:
The result is not the same as the original equation.
The graph is not symmetric with respect to the y-axis.
Replace y with –y:
The result is the not same as the original equation.
The graph is not symmetric with respect to the x-axis.
The graph is not symmetric with respect to either axis.

Copyright © 2008 Pearson Addison-Wesley. All rights reserved. Appendices-54
D Example 3(c) Testing for Symmetry with Respect to an Axis (cont.)

Copyright © 2008 Pearson Addison-Wesley. All rights reserved. Appendices-55
D Example 3(d) Testing for Symmetry with Respect to an Axis (page 454)
Test for symmetry with respect to the x-axis and the y-axis.
Replace x with –x:
The result is the same as the original equation.
The graph is symmetric with respect to the y-axis.
Replace y with –y:
The result is same as the original equation.
The graph is symmetric with respect to the x-axis.
The graph is symmetric with respect to both axes.

Copyright © 2008 Pearson Addison-Wesley. All rights reserved. Appendices-56
D Example 3(d) Testing for Symmetry with Respect to an Axis (cont.)

Copyright © 2008 Pearson Addison-Wesley. All rights reserved. Appendices-57
D Example 4(a) Testing for Symmetry with Respect to the Origin (page 455)
Is the graph of symmetric with respect to the origin?
Replace x with –x and y with –y:
The result is the same as the original equation.
The graph is symmetric with respect to the origin.

Copyright © 2008 Pearson Addison-Wesley. All rights reserved. Appendices-58
D Example 4(b) Testing for Symmetry with Respect to the Origin (page 455))
Is the graph of symmetric with respect to the origin?
Replace x with –x and y with –y:
The result is not the same as the original equation.
The graph is not symmetric with respect to the origin.

Copyright © 2008 Pearson Addison-Wesley. All rights reserved. Appendices-59
D Example 5(a) Translating Graphs (page 455)
Graph .
Compare a table of values for with .
x
–2
–1
0
1
2
4 6
1 3
0 2
1 3
4 6
The graph of f(x) is the same as the graph of g(x) translated 2 units up.

Copyright © 2008 Pearson Addison-Wesley. All rights reserved. Appendices-60
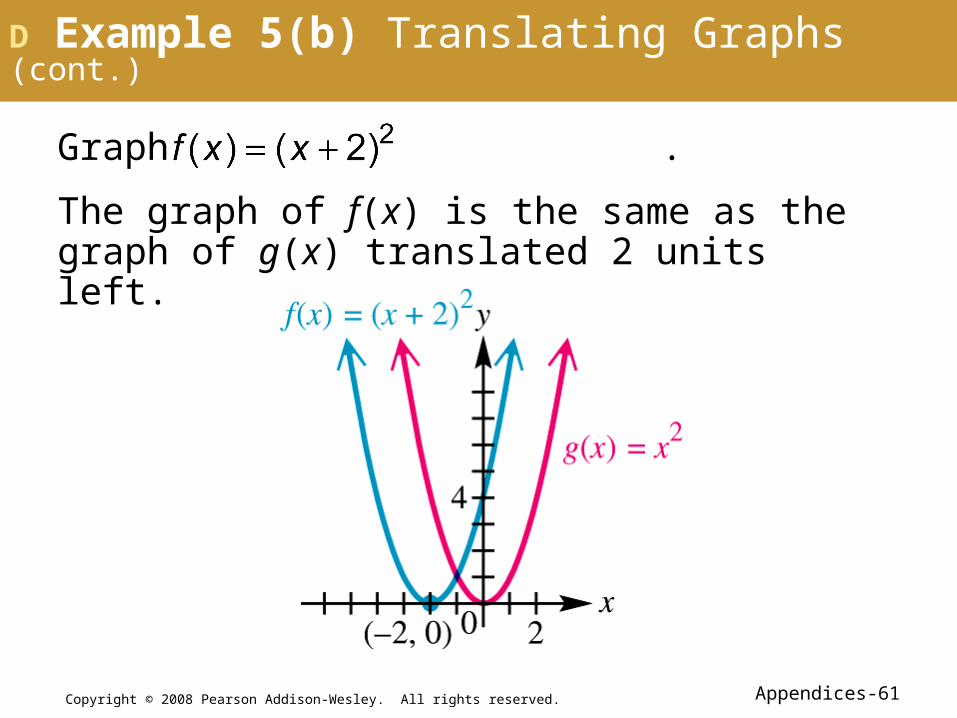
D Example 5(b) Translating Graphs (page 455)
Graph .
x
–4
–3
–2
–1
0
1
16 4
9 1
4 0
1 1
0 4
Compare a table of values for with .
1 9
Copyright © 2008 Pearson Addison-Wesley. All rights reserved. Appendices-61
D Example 5(b) Translating Graphs (cont.)
Graph .
The graph of f(x) is the same as the graph of g(x) translated 2 units left.

Copyright © 2008 Pearson Addison-Wesley. All rights reserved. Appendices-62
D Example 6 Using More Than One Transformation on a Graph
(page 457)
Graph .
This is the graph of translated one unit to the right, reflected across the x-axis, and then translated four units up.