Apparent digestibility of protein, energy and amino acids ... · Materials and methods 2.1....
12
Apparent digestibility of protein, energy and amino acids of six protein sources included at three levels in diets for juvenile white shrimp Litopenaeus vannamei reared in high performance conditions Rodrigo A.P.L.F. de Carvalho a,b, ⁎, Ricardo Haruo Ota a , Vivian Oliveira Kadry a , Albert G.J. Tacon a,c , Daniel Lemos a a Aquaculture Laboratory (LAM), University of São Paulo, Oceanographic Institute, São Paulo, Ubatuba, Brazil b Aquatic Animal Nutrition Laboratory, Unidade de Ciências Agrárias, Escola Agrícola de Jundiaí (EAJ), Universidade Federal do Rio Grande do Norte (UFRN), Brazil c Aquatic Farms Ltd., Hawaii, USA abstract article info Article history: Received 17 March 2016 Received in revised form 31 August 2016 Accepted 5 September 2016 Available online 07 September 2016 The apparent digestibility coefficients (ADC) of six practical protein ingredients, Chilean fish meal (FM), soy pro- tein concentrate (SPC), poultry by-product meal (PBM), corn gluten meal (CGM), meat and bone meal (MBM), and hydrolyzed feather meal (HFM), were determined for juvenile white shrimp (Litopenaeus vannamei) at die- tary inclusion levels of 10, 20 and 30% within a reference diet containing 20% fish meal. The shrimp was stocked in 500 L tanks equipped with automatic feeders and settling columns for solids collection in a recirculating system. The highest growth rates were observed for the shrimp fed with the test diets with FM and SPC, from the 30% to 10% inclusion levels, followed by the byproducts HFM, MBM, PBM and CGM, from the 10% to 30% inclusion levels. The effects of the protein sources and inclusion levels on the apparent digestibility coefficients of ingredients were more pronounced than in the test diets. The calculated ADC of the test ingredients were significantly affect- ed by the ingredient type and inclusion level, with the exception for the ACPD. The highest apparent digestibility coefficients of the ingredients were recorded for FM, SPC, PBM and MBM at the 20% inclusion level and CGM at the 30% inclusion level. The apparent amino acid digestibility (AAAD) recorded for the ingredients were consis- tent with previously reported values for the L. vannamei. The in vivo method for digestibility determination is sub- jected to different factors affecting its accuracy. Further studies should aim to improve the precision and produce reliable data to support feed formulation, nutrient assimilation, and aquatic animal performance. Statement of relevance Knowledge about the nutritional value of ingredients for shrimp diets is needed. This paper introduces new in- formation about the digestibility of commercial feedstuffs given at different levels, in a practical diet. Shrimp were reared in a RAS using specifically designed tanks, with performance comparable to shrimp farms. Effects of the method on the reliability of digestibility data are also discussed. © 2016 Elsevier B.V. All rights reserved. Keywords: Shrimp Litopenaeus vannamei Ingredient Amino acid Digestibility Digestibility method 1. Introduction The importance of shrimp feeds and their capacity to meet nutrition- al requirements, foster good shrimp health, reduce effluent loads, and reduce production costs are well established. All of these aspects may relate to nutrient availability, which is usually evaluated through appar- ent digestibility and growth studies. Ideally, the evaluation of a feed in- gredient should take into account the characteristics of its processing method and composition, the digestibility of the ingredient, the palat- ability of the ingredient, the utilization of the nutrient in terms of weight gain, feed conversion ratio and survival, and functionality for the feed processing (Glencross et al., 2007). Commercial feed producers have formulated feeds for cattle, poultry, swine, and a few fish species based on the availability of nutrients of most of the feed ingredients, whereas many commercial shrimp feeds are still formulated based on total nutrient compositions or digestibility coefficients calculated from other species due to the scarcity of nutrient digestibility data. The evaluation of apparent digestibility coefficients of ingredients used for shrimp diets should be carried out at different die- tary inclusion levels within the range commonly employed by feed manufacturers to produce practical data (Tacon 1996; D'Abramo and Castell, 1997; Lee & Lawrence, 1997; Glencross et al., 2007). This evalu- ation was recommended nearly two decades ago, however, most digest- ibility studies with aquatic animals still employ a reference test ingredient at a fixed inclusion level (30%), regardless of the ingredient Aquaculture 465 (2016) xxx–xxx ⁎ Corresponding author at: Aquatic Animal Nutrition Laboratory, Unidade de Ciências Agrárias, Escola Agrícola de Jundiaí (EAJ). Universidade Federal do Rio Grande do Norte (UFRN), Brazil. E-mail address: [email protected] (R.A.P.L.F. Carvalho). AQUA-632310; No of Pages 12 http://dx.doi.org/10.1016/j.aquaculture.2016.09.010 0044-8486/© 2016 Elsevier B.V. All rights reserved. Contents lists available at ScienceDirect Aquaculture journal homepage: www.elsevier.com/locate/aquaculture Please cite this article as: Carvalho, R.A.P.L.F., et al., Apparent digestibility of protein, energy and amino acids of six protein sources included at three levels in diets for juvenile wh..., Aquaculture (2016), http://dx.doi.org/10.1016/j.aquaculture.2016.09.010
Transcript of Apparent digestibility of protein, energy and amino acids ... · Materials and methods 2.1....
Aquaculture 465 (2016) xxx–xxx
AQUA-632310; No of Pages 12
Contents lists available at ScienceDirect
Aquaculture
j ourna l homepage: www.e lsev ie r .com/ locate /aquacu l tu re
Apparent digestibility of protein, energy and amino acids of six proteinsources included at three levels in diets for juvenile white shrimpLitopenaeus vannamei reared in high performance conditions
Rodrigo A.P.L.F. de Carvalho a,b,⁎, RicardoHaruo Ota a, Vivian Oliveira Kadry a, Albert G.J. Tacon a,c, Daniel Lemos a
a Aquaculture Laboratory (LAM), University of São Paulo, Oceanographic Institute, São Paulo, Ubatuba, Brazilb Aquatic Animal Nutrition Laboratory, Unidade de Ciências Agrárias, Escola Agrícola de Jundiaí (EAJ), Universidade Federal do Rio Grande do Norte (UFRN), Brazilc Aquatic Farms Ltd., Hawaii, USA
⁎ Corresponding author at: Aquatic Animal Nutrition LAgrárias, Escola Agrícola de Jundiaí (EAJ). Universidade F(UFRN), Brazil.
E-mail address: [email protected] (R.A.P.L.F. Carv
http://dx.doi.org/10.1016/j.aquaculture.2016.09.0100044-8486/© 2016 Elsevier B.V. All rights reserved.
Please cite this article as: Carvalho, R.A.P.L.Fthree levels in diets for juvenile wh..., Aquac
a b s t r a c t
a r t i c l e i n f oArticle history:Received 17 March 2016Received in revised form 31 August 2016Accepted 5 September 2016Available online 07 September 2016
The apparent digestibility coefficients (ADC) of six practical protein ingredients, Chilean fishmeal (FM), soy pro-tein concentrate (SPC), poultry by-product meal (PBM), corn gluten meal (CGM), meat and bone meal (MBM),and hydrolyzed feather meal (HFM), were determined for juvenile white shrimp (Litopenaeus vannamei) at die-tary inclusion levels of 10, 20 and 30%within a reference diet containing 20%fishmeal. The shrimpwas stocked in500 L tanks equipped with automatic feeders and settling columns for solids collection in a recirculating system.The highest growth rates were observed for the shrimp fed with the test diets with FM and SPC, from the 30% to10% inclusion levels, followed by the byproducts HFM,MBM, PBMand CGM, from the 10% to 30% inclusion levels.The effects of the protein sources and inclusion levels on the apparent digestibility coefficients of ingredientsweremore pronounced than in the test diets. The calculated ADC of the test ingredients were significantly affect-ed by the ingredient type and inclusion level, with the exception for the ACPD. The highest apparent digestibilitycoefficients of the ingredients were recorded for FM, SPC, PBM and MBM at the 20% inclusion level and CGM atthe 30% inclusion level. The apparent amino acid digestibility (AAAD) recorded for the ingredients were consis-tentwith previously reported values for the L. vannamei. The in vivomethod for digestibility determination is sub-jected to different factors affecting its accuracy. Further studies should aim to improve the precision and producereliable data to support feed formulation, nutrient assimilation, and aquatic animal performance.Statement of relevanceKnowledge about the nutritional value of ingredients for shrimp diets is needed. This paper introduces new in-formation about the digestibility of commercial feedstuffs given at different levels, in a practical diet. Shrimpwere reared in a RAS using specifically designed tanks, with performance comparable to shrimp farms. Effectsof the method on the reliability of digestibility data are also discussed.
© 2016 Elsevier B.V. All rights reserved.
Keywords:ShrimpLitopenaeus vannameiIngredientAmino acidDigestibilityDigestibility method
1. Introduction
The importance of shrimp feeds and their capacity tomeet nutrition-al requirements, foster good shrimp health, reduce effluent loads, andreduce production costs are well established. All of these aspects mayrelate to nutrient availability, which is usually evaluated through appar-ent digestibility and growth studies. Ideally, the evaluation of a feed in-gredient should take into account the characteristics of its processingmethod and composition, the digestibility of the ingredient, the palat-ability of the ingredient, the utilization of thenutrient in terms ofweight
aboratory, Unidade de Ciênciasederal do Rio Grande do Norte
alho).
., et al., Apparent digestibilityulture (2016), http://dx.doi.o
gain, feed conversion ratio and survival, and functionality for the feedprocessing (Glencross et al., 2007).
Commercial feed producers have formulated feeds for cattle, poultry,swine, and a few fish species based on the availability of nutrients ofmost of the feed ingredients, whereas many commercial shrimp feedsare still formulated based on total nutrient compositions or digestibilitycoefficients calculated from other species due to the scarcity of nutrientdigestibility data. The evaluation of apparent digestibility coefficients ofingredients used for shrimp diets should be carried out at different die-tary inclusion levels within the range commonly employed by feedmanufacturers to produce practical data (Tacon 1996; D'Abramo andCastell, 1997; Lee & Lawrence, 1997; Glencross et al., 2007). This evalu-ationwas recommendednearly twodecades ago, however,most digest-ibility studies with aquatic animals still employ a reference testingredient at a fixed inclusion level (30%), regardless of the ingredient
of protein, energy and amino acids of six protein sources included atrg/10.1016/j.aquaculture.2016.09.010
2 R.A.P.L.F. Carvalho et al. / Aquaculture 465 (2016) xxx–xxx
being tested. In addition, if the results of nutritional studieswith aquaticanimals are to be applied to commercial farming, shrimp performancemust be compatible with practical conditions (Tacon, 1996; Divakaranet al., 2000).
The present study evaluated the growth and apparent digestibility ofdry matter, protein, energy and amino acids in six protein sources atthree dietary inclusion levels of a reference diet for juvenile Litopenaeusvannamei. Two trials were carried out in a recirculating systemconsisted of tanks designed for the simultaneous determination of di-gestibility and growth performance in shrimp (Carvalho et al., 2013).
2. Materials and methods
2.1. Ingredients
Six practical protein ingredients were obtained from the Brazilianfeed industry: Chilean fish meal (FM), soy protein concentrate (SPC),poultry by-product meal (PBM), corn gluten meal (CGM), meat andbone meal (MBM) and hydrolyzed feather meal (HFM). According tothe supplier, the Chilean fish meal was made from a mixture of jackmackerel, anchovy and sardines steam cooked at 95 to 100 °C for30min. Alpha-tocopherol was added as an antioxidant. The soy proteinconcentrate was produced by the aqueous alcohol extraction of solventextracted soybean meal followed by a heat treatment. The poultry by-product meal included poultry viscera and head, feet and mincedmeat in small proportions, with butylated hydroxytoluene (BHT) asthe antioxidant. The hydrolyzed feather meal was made from clean
Table 1Nutrient composition of the protein ingredients evaluated in diets for juvenile Litopenaeus vann(NFE) indispensable amino acids (IAA) Arginine - ARG, Histidine - HIS, Isoleucine - ISO, LeucineTRY and Valine - VAL, and non-indispensable amino acids (NIAA) Alanine - ALA, Aspartic acidTyrosine - TYR.
Fish meal1 Soy protein concentrate2 Poultry by-product
FM SPC PBM
IFN 5-01-977 5-08-038 5-03-798
IAA
ARG 5.19 5.17 4.72PHE 2.16 3.00 2.45HIS 1.49 2.06 1.07ISO 2.03 2.52 2.19LEU 3.84 4.77 4.35LYS 5.50 5.18 2.95MET 3.50 1.32 1.73THR 2.29 2.27 2.24TRY 0.08 0.10 0.08VAL 2.54 2.73 3.40
NIAA
ALA 3.90 2.62 3.16ASP 4.53 6.67 3.90CYS 0.26 0.85 5.49GLY 5.44 2.56 5.22GLU 7.27 10.9 6.20PRO 3.16 3.20 4.90SER 2.39 2.94 4.53TYR 1.62 1.81 1.47
ΣAA 57.2 60.7 60.1Dry matter 92.8 93.6 88.8Crude protein 60.2 60.9 58.4Total lipid 10.7 1.05 13.1Gross fiber 0.5 4.2 0.6Ash 21.4 6.2 15.2NFE 0.0 21.2 1.5Energy (MJ kg−1) 21.5 20.1 21.6
Results are mean of two replicates.IFN – International Feed Number.nd: not detectable.Ingredient source.
1 Pesquera San Jose, Santiago, Chile.2 Imcopa, Araucária,PR, Brazil.3 Agroniza, Jacarezinho, PR, Brazil.4 Corn Products, Cabo de Santo Agostinho, PE, Brazil.5 Sebosol, São José do Rio Preto, SP, Brazil.
Please cite this article as: Carvalho, R.A.P.L.F., et al., Apparent digestibilitythree levels in diets for juvenile wh..., Aquaculture (2016), http://dx.doi.o
feathers and clotted blood (6:1 proportion w/w) which were pressed,hydrolyzed, dried, ground and mixed with BHT. Corn gluten meal wasrecovered from corn softened with water (+50 °C), ground and centri-fuged to separate the gluten from the starch. The meat and bone mealwas made from beef residues cooked at 150 to 180 °C and sterilized at133 °C and 300 kPa for 20 min. This product also contained anantioxidant.
2.2. Experimental diets
Prior to processing the diet, the ingredients were ground in a ham-mer mill (Vieira Ltd., Tatuí, SP, Brazil) to a standard particle size ofb600 μm. The composition analysis of the test ingredients is shown inTable 1.
A reference diet was formulated according to the nutrient composi-tions recommended for juvenile Litopenaeus vannamei (Table 2). Thedigestibility of the test ingredients was evaluated following the conven-tional methodology of mixing the ingredient with the reference dietmix, and the digestibility coefficientwas determined by the comparisonof apparent digestibility values between reference and the test diets(Cho et al., 1982). The inclusion levels of the ingredients added to thereference diet were tested at 10, 20 and 30%, giving a total of 18 testdiets , The composition of the reference and test diets is shown inTable 3 and4. Chromiumoxide III (Sigma-Aldrich Co. LLC.)was includedat 0.5% in all diets as an indigestible external marker. (See Table 4.)
The micro ingredients were first mixed in a Y mixer (Marconi Ltda.,Piracicaba, SP, Brazil) for 10min and then homogenized with themacro
amei (as fed, g 100 g−1), except when specified: proximate, energy, nitrogen free extract- LEU, Lysine - LYS, Methionine -MET, Phenylalanine - PHE, Threonine - THR, Tryptophan –- ASP, Cysteine - CYS, Glycine - GLY, Glutamic acid – GLM, Proline - PRO, Serine - SER and
meal3 Corn gluten meal4 Meat and bone meal5 Hydrolyzed feather meal3
CGM MBM HFM
5-02-900 5-00-388 5-03-7952.21 3.65 6.593.50 1.16 3.711.60 0.80 1.551.77 0.85 3.229.06 2.01 6.461.24 2.52 3.603.17 0.58 0.871.84 0.96 3.38nd 0.06 0.142.20 1.32 5.116.05 3.39 3.933.51 1.83 5.432.36 0.03 8.951.58 7.14 6.2112.8 4.02 8.406.07 4.13 7.053.12 1.30 7.682.98 0.61 2.2665.0 36.4 84.592.7 95.5 93.566.1 42.6 81.56.7 10.4 3.40.6 1.5 0.51.3 41.7 3.018.1 0.0 0.025.0 14.4 24.1
of protein, energy and amino acids of six protein sources included atrg/10.1016/j.aquaculture.2016.09.010
Table 2Formulation of the reference diet for the determination of the apparentdigestibility of the six protein sources for juvenile white shrimpLitopenaeus vannamei.
Ingredient %
Wheat flour1 30.0Chilean fish meal2 20.0Soybean meal 46%1 10.0Poultry by product meal3 8.0Broken rice1 6.0Soy protein concentrate4 5.0Squid meal5 5.0Alcohol yeast1 4.0Fish oil6 2.5Fish solubles7 2.5Soy lecithin8 2.0Monocalcium phosphate 9 1.6Vitamin and mineral premix10 1.4Monosodium phosphate11 1.0Chromic oxide12 0.5Magnesium oxide13 0.3Cholesterol14 0.3
100
*Rovimix Intensive Shrimp, Composition per kg of diet (reference diet/test diet 10%/test diet 20%/test diet 30% test ingredient inclusion): vita-min A, 17,500/16,250/13,750/12,500/ IU; vitamin D3, 4,900/4,550/3,850/3,500 IU; vitamin E, 350/325/275/250 UI; vitamin K 3. 7/6.5/5.5/5 mg; vitamin B1, 70/65/55/50 mg; vitamin B2, 56/52/44/40 mg; vita-min B6; 0.14/0.13/0.11/0.1 mg; Nicotinic acid, 210/195/165/150 mg;Pantothenic acid 140/130/110/100 mg; biotin, 2.1/2.0/1.7/1.5 mg; folicacid, 17.5/16.3/13.8/12.5 mg; vitamin C, 350/325/275/250 mg; coline,700/650/550/500 mg; inositol, 280/260/220/200 mg; iron 28/26/22/20mg; copper, 49/45.5/38.5/35 mg; chelated copper, 21/20/17/15 mg;zinc, 147/136.5/115.5/105mg; chelated zinc, 63/58.5/49.5/45mg;man-ganese, 56/52/44/40 mg; selenium, 0.21/0.2/0.17/0.15 mg; chelated se-lenium 0.21/0.2/0.17/0.15 mg; iodine, 2.1/2.0/1.7/1,5 mg; cobalt 0.4/0.4/0.3/0.3mg; chrome 1.1/1.0/0.9/0.8mg; excipient q.s., 14/13/11/10 g.
1 Guabi Nutrição Animal Ltda, Campinas, SP, Brazil.2 Pesquera San Jose, Santiago, Chile.3 Agroniza, Jacarezinho, PR, Brazil.4 Imcopa, Araucária, PR, Brazil.5 Coomarpes Ltda. Mar Del Plata, Argentina.6 Pacific Star, Chile.7 Tecnologia de Alimentos, Peru.8 Sina, Bauru Alimentos Ltda., Bauru, SP, Brazil.9 Serrana, Araxá, MG, Brazil.10 DSM, São Paulo, SP, Brazil*.11 Cadisa, Diadema, SP, Brazil.12 Sigma-Aldrich Co. LLC., Duque deCaxias, RJ, Brazil (min99% pureza,
60,5% de cromo).13 Magnesium do Brasil Ltda, Messejana, CE, Brazil.14 Impextraco, Curitiba, PR, Brazil (colesterol 92%, esteróis totais 99%).
Table 3Proximate composition and energy of the reference and test diets formulated for the eval-uation of the apparent digestibility of the six protein sources for juvenile white shrimp L.vannamei (as fed, g 100 g−1 except when specified).
Diet CP TP EE CF NFE DM Ash E (MJ kg−1)
REFERENCE 39.0 38.9 8.2 0.8 34.8 92.5 9.7 20.0FM10 43.1 43.4 9.2 0.8 31.3 95.0 10.5 20.0FM20 45.3 45.7 9.1 0.4 28.1 93.6 10.7 19.8FM30 47.2 47.4 9.1 0.4 24.4 92.1 10.9 19.9SPC10 40.9 41.5 8.0 1.1 32.3 92.2 10.0 19.5SPC20 42.9 43.3 7.2 1.4 31.5 91.9 9.0 19.6SPC30 45.9 46.5 6.2 1.4 29.8 92.0 8.7 20.4PBM10 41.3 41.9 9.6 0.6 31.7 93.7 10.5 20.1PBM20 43.4 43.5 9.8 0.5 28.5 93.4 11.1 20.2PBM30 46.0 44.6 10.6 0.4 26.7 95.5 11.9 20.5CGM10 42.9 41.2 9.4 0.4 32.9 94.9 9.4 20.9CGM20 45.1 45.3 9.1 0.7 30.1 93.4 8.3 21.2CGM30 46.9 52.0 8.9 0.7 31.4 95.4 7.4 21.1MBM10 40.5 41.0 9.2 0.5 29.7 93.4 13.4 18.2MBM20 40.1 39.2 9.2 0.5 29.0 95.4 16.6 18.9MBM30 40.7 39.3 9.3 0.6 24.2 94.7 19.9 17.9HFM10 44.0 44.8 9.2 0.7 31.4 94.8 9.4 20.2HFM20 48.0 47.9 9.2 0.5 28.4 94.9 8.7 20.7HFM30 52.6 53.7 9.3 0.4 24.4 94.9 8.1 21.2
Crude protein - CP, True protein – TP (ΣAA), Ether extract - EE, Crude fiber - CF, Nitrogenfree extract - NFE, Dry matter - DM, Energy - E. Fish meal - FM, Soy protein concentrate -SPC, Poultry by-product - PBM, Corn gluten meal - CGM, Meat and bone meal - MBM andHydrolyzed feather meal - HFM, at 10, 20 and 30% inclusion level upon the reference dietformulation.
3R.A.P.L.F. Carvalho et al. / Aquaculture 465 (2016) xxx–xxx
ingredients in a bowl mixer for 10 min (G-Paniz, Caxias do Sul, RS, Bra-zil). Boiledwaterwas added to themass followed by anothermixing for15 min. High temperature extrusion was not used. The mass wasmolded into 250 g cakes and steam cooked for 15 min (internal meantemperature of 60 °C). The cooked cakes were pressed as spaghettistrands (mean temperature of 65 °C) through a meat grinder with a2 mm die (C.A.F. Rio Claro, SP, Brazil). Feed strands were dried at 70 °C, ground into 5mm length pellets in a food processor, packed in sealedbags and stored frozen until used.
2.3. Experimental conditions
The study was carried out at the Aquaculture Laboratory of the Uni-versity of São Paulo (LAM-USP) coastal facility in Ubatuba, São Paulo,Brazil. The digestibility system consisted of 36 semi-conical 500 Ltanks with individual settling columns (300 mm × 150 mm in thetrunk and 100 mm × 150 mm × 20 mm in the cone) in a recirculatingsystem. The design and analysis of the cleaning efficiency of the tankand settling columns are described in Carvalho et al. (2013). Seawaterwith salinity of 34± 1‰ (mean± SD)was pumped from the sheltered
Please cite this article as: Carvalho, R.A.P.L.F., et al., Apparent digestibilitythree levels in diets for juvenile wh..., Aquaculture (2016), http://dx.doi.o
Flamengo cove, filtered through 25 μm and 5 μm cartridge filters, anddisinfected by UV before entering into tanks at a flow rate of4 L min−1. Aquatic heaters maintained the water temperature at27 ± 2 °C. Oxygen concentration was further sustained by an air stonepositioned about 30 cm above the tank bottom to avoid the suspensionof solids. Postlarvae (10 days old) of Litopenaeus vannamei from thesame stock (Aquatec Industrial Pecuária Ltda., Barra doCunhaú, RN, Bra-zil) were reared for 20 days in two 1000 L tanks and fed a nursery feed(Potimar 40 PL, Guabi Nutrição Animal Ltda., Campinas, SP, Brazil)followed by the stocking into 7500 L biofloc tank for 61 days and fed a38% CP feed (Potimar 38 Active, Guabi Nutrição Animal Ltda.) untilattaining 4.7 (±1.47) g for the first trial.
The digestibility evaluations were carried out in two trials. Duringeach trial, the reference diet and the nine test diets were evaluated si-multaneously in triplicate. In the first trial, shrimp with a weight of 4.7(±1.47) g were stocked at a density of 63.8 individuals per m2 (46per tank) and fed with the experimental diets for 33 days. The testdiets were composed of FM, SPC and PBM at the inclusion levels of 10,20 and 30%. In the second trial, shrimp of 10.4 (±2.0) g were stockedat a density of 61.1 individuals perm2 (44 per tank) and fedwith the ex-perimental diets for 30 days. Test diets were CGM,MBMandHFM at thesame inclusion levels as the first trial. Two test diets with SPC and PBMat a 30% inclusion level were also evaluated in triplicate in a longer testtrial extending through the first and the second trial (total duration63 days) to evaluate the effect of the duration of the trial period onthe apparent digestibility coefficients.
Shrimpwere adapted to the experimental diets for 7 days before thestart of sampling the feces. The daily allotted feed ration was set basedon the mean individual shrimp size and temperature according toForster et al. (2003), with 80% of the total allotted daily feed amount de-livered continuously through belt feeders (24-h belt feeder, AquaticEcosystems) from 00:00 am until 7:00 am. The remaining 20% washand-fed at 12:00pm for 30min. All unconsumedpelletswere removedafter each feeding period by unscrewing the sampling Falcon® tubefitted to the settling column. At the end of the trials, all individualswere weighed on a digital scale to the nearest 0.1 g.
Water quality parameters were monitored daily for temperature,twice per week for dissolved oxygen (YSI 85, Yellow Springs, USA)and weekly for salinity (Atago refractometer, Japan), pH, unionized
of protein, energy and amino acids of six protein sources included atrg/10.1016/j.aquaculture.2016.09.010
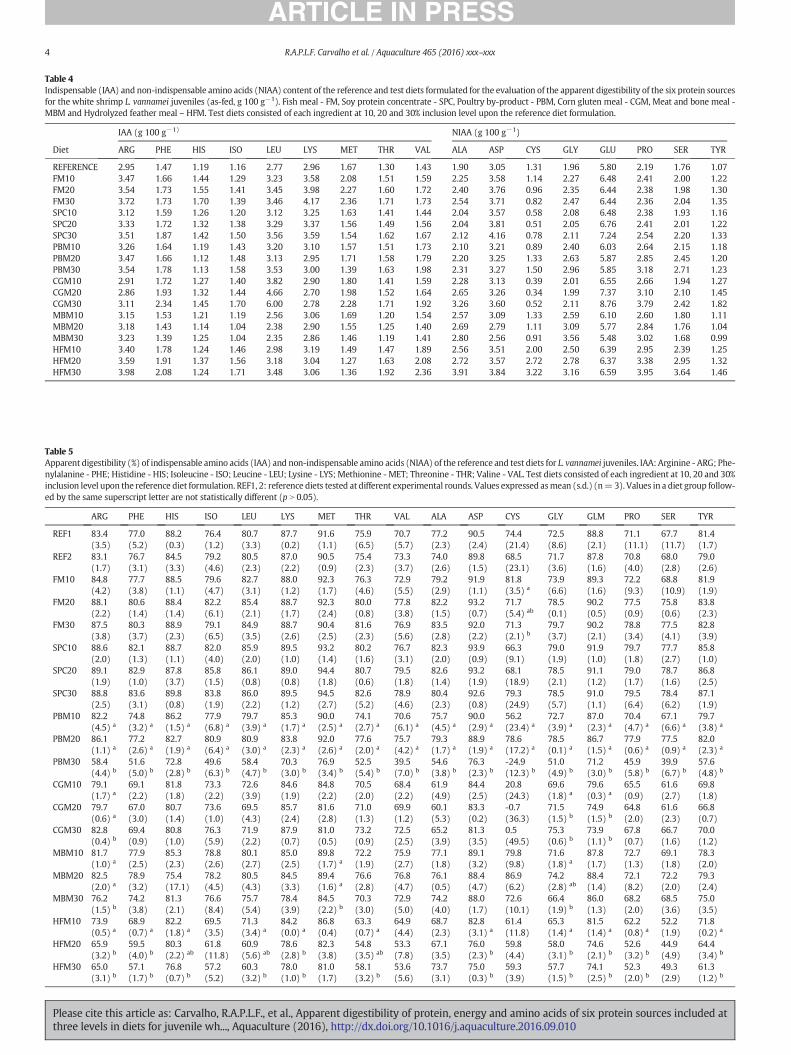
Table 4Indispensable (IAA) and non-indispensable amino acids (NIAA) content of the reference and test diets formulated for the evaluation of the apparent digestibility of the six protein sourcesfor the white shrimp L. vannamei juveniles (as-fed, g 100 g−1). Fish meal - FM, Soy protein concentrate - SPC, Poultry by-product - PBM, Corn gluten meal - CGM, Meat and bone meal -MBM and Hydrolyzed feather meal – HFM. Test diets consisted of each ingredient at 10, 20 and 30% inclusion level upon the reference diet formulation.
IAA (g 100 g−1) NIAA (g 100 g−1)
Diet ARG PHE HIS ISO LEU LYS MET THR VAL ALA ASP CYS GLY GLU PRO SER TYR
REFERENCE 2.95 1.47 1.19 1.16 2.77 2.96 1.67 1.30 1.43 1.90 3.05 1.31 1.96 5.80 2.19 1.76 1.07FM10 3.47 1.66 1.44 1.29 3.23 3.58 2.08 1.51 1.59 2.25 3.58 1.14 2.27 6.48 2.41 2.00 1.22FM20 3.54 1.73 1.55 1.41 3.45 3.98 2.27 1.60 1.72 2.40 3.76 0.96 2.35 6.44 2.38 1.98 1.30FM30 3.72 1.73 1.70 1.39 3.46 4.17 2.36 1.71 1.73 2.54 3.71 0.82 2.47 6.44 2.36 2.04 1.35SPC10 3.12 1.59 1.26 1.20 3.12 3.25 1.63 1.41 1.44 2.04 3.57 0.58 2.08 6.48 2.38 1.93 1.16SPC20 3.33 1.72 1.32 1.38 3.29 3.37 1.56 1.49 1.56 2.04 3.81 0.51 2.05 6.76 2.41 2.01 1.22SPC30 3.51 1.87 1.42 1.50 3.56 3.59 1.54 1.62 1.67 2.12 4.16 0.78 2.11 7.24 2.54 2.20 1.33PBM10 3.26 1.64 1.19 1.43 3.20 3.10 1.57 1.51 1.73 2.10 3.21 0.89 2.40 6.03 2.64 2.15 1.18PBM20 3.47 1.66 1.12 1.48 3.13 2.95 1.71 1.58 1.79 2.20 3.25 1.33 2.63 5.87 2.85 2.45 1.20PBM30 3.54 1.78 1.13 1.58 3.53 3.00 1.39 1.63 1.98 2.31 3.27 1.50 2.96 5.85 3.18 2.71 1.23CGM10 2.91 1.72 1.27 1.40 3.82 2.90 1.80 1.41 1.59 2.28 3.13 0.39 2.01 6.55 2.66 1.94 1.27CGM20 2.86 1.93 1.32 1.44 4.66 2.70 1.98 1.52 1.64 2.65 3.26 0.34 1.99 7.37 3.10 2.10 1.45CGM30 3.11 2.34 1.45 1.70 6.00 2.78 2.28 1.71 1.92 3.26 3.60 0.52 2.11 8.76 3.79 2.42 1.82MBM10 3.15 1.53 1.21 1.19 2.56 3.06 1.69 1.20 1.54 2.57 3.09 1.33 2.59 6.10 2.60 1.80 1.11MBM20 3.18 1.43 1.14 1.04 2.38 2.90 1.55 1.25 1.40 2.69 2.79 1.11 3.09 5.77 2.84 1.76 1.04MBM30 3.23 1.39 1.25 1.04 2.35 2.86 1.46 1.19 1.41 2.80 2.56 0.91 3.56 5.48 3.02 1.68 0.99HFM10 3.40 1.78 1.24 1.46 2.98 3.19 1.49 1.47 1.89 2.56 3.51 2.00 2.50 6.39 2.95 2.39 1.25HFM20 3.59 1.91 1.37 1.56 3.18 3.04 1.27 1.63 2.08 2.72 3.57 2.72 2.78 6.37 3.38 2.95 1.32HFM30 3.98 2.08 1.24 1.71 3.48 3.06 1.36 1.92 2.36 3.91 3.84 3.22 3.16 6.59 3.95 3.64 1.46
Table 5Apparent digestibility (%) of indispensable amino acids (IAA) and non-indispensable amino acids (NIAA) of the reference and test diets for L. vannamei juveniles. IAA: Arginine - ARG; Phe-nylalanine - PHE; Histidine - HIS; Isoleucine - ISO; Leucine - LEU; Lysine - LYS; Methionine - MET; Threonine - THR; Valine - VAL. Test diets consisted of each ingredient at 10, 20 and 30%inclusion level upon the reference diet formulation. REF1, 2: reference diets tested at different experimental rounds. Values expressed asmean (s.d.) (n= 3). Values in a diet group follow-ed by the same superscript letter are not statistically different (p N 0.05).
ARG PHE HIS ISO LEU LYS MET THR VAL ALA ASP CYS GLY GLM PRO SER TYR
REF1 83.4(3.5)
77.0(5.2)
88.2(0.3)
76.4(1.2)
80.7(3.3)
87.7(0.2)
91.6(1.1)
75.9(6.5)
70.7(5.7)
77.2(2.3)
90.5(2.4)
74.4(21.4)
72.5(8.6)
88.8(2.1)
71.1(11.1)
67.7(11.7)
81.4(1.7)
REF2 83.1(1.7)
76.7(3.1)
84.5(3.3)
79.2(4.6)
80.5(2.3)
87.0(2.2)
90.5(0.9)
75.4(2.3)
73.3(3.7)
74.0(2.6)
89.8(1.5)
68.5(23.1)
71.7(3.6)
87.8(1.6)
70.8(4.0)
68.0(2.8)
79.0(2.6)
FM10 84.8(4.2)
77.7(3.8)
88.5(1.1)
79.6(4.7)
82.7(3.1)
88.0(1.2)
92.3(1.7)
76.3(4.6)
72.9(5.5)
79.2(2.9)
91.9(1.1)
81.8(3.5) a
73.9(6.6)
89.3(1.6)
72.2(9.3)
68.8(10.9)
81.9(1.9)
FM20 88.1(2.2)
80.6(1.4)
88.4(1.4)
82.2(6.1)
85.4(2.1)
88.7(1.7)
92.3(2.4)
80.0(0.8)
77.8(3.8)
82.2(1.5)
93.2(0.7)
71.7(5.4) ab
78.5(0.1)
90.2(0.5)
77.5(0.9)
75.8(0.6)
83.8(2.3)
FM30 87.5(3.8)
80.3(3.7)
88.9(2.3)
79.1(6.5)
84.9(3.5)
88.7(2.6)
90.4(2.5)
81.6(2.3)
76.9(5.6)
83.5(2.8)
92.0(2.2)
71.3(2.1) b
79.7(3.7)
90.2(2.1)
78.8(3.4)
77.5(4.1)
82.8(3.9)
SPC10 88.6(2.0)
82.1(1.3)
88.7(1.1)
82.0(4.0)
85.9(2.0)
89.5(1.0)
93.2(1.4)
80.2(1.6)
76.7(3.1)
82.3(2.0)
93.9(0.9)
66.3(9.1)
79.0(1.9)
91.9(1.0)
79.7(1.8)
77.7(2.7)
85.8(1.0)
SPC20 89.1(1.9)
82.9(1.0)
87.8(3.7)
85.8(1.5)
86.1(0.8)
89.0(0.8)
94.4(1.8)
80.7(0.6)
79.5(1.8)
82.6(1.4)
93.2(1.9)
68.1(18.9)
78.5(2.1)
91.1(1.2)
79.0(1.7)
78.7(1.6)
86.8(2.5)
SPC30 88.8(2.5)
83.6(3.1)
89.8(0.8)
83.8(1.9)
86.0(2.2)
89.5(1.2)
94.5(2.7)
82.6(5.2)
78.9(4.6)
80.4(2.3)
92.6(0.8)
79.3(24.9)
78.5(5.7)
91.0(1.1)
79.5(6.4)
78.4(6.2)
87.1(1.9)
PBM10 82.2(4.5) a
74.8(3.2) a
86.2(1.5) a
77.9(6.8) a
79.7(3.9) a
85.3(1.7) a
90.0(2.5) a
74.1(2.7) a
70.6(6.1) a
75.7(4.5) a
90.0(2.9) a
56.2(23.4) a
72.7(3.9) a
87.0(2.3) a
70.4(4.7) a
67.1(6.6) a
79.7(3.8) a
PBM20 86.1(1.1) a
77.2(2.6) a
82.7(1.9) a
80.9(6.4) a
80.9(3.0) a
83.8(2.3) a
92.0(2.6) a
77.6(2.0) a
75.7(4.2) a
79.3(1.7) a
88.9(1.9) a
78.6(17.2) a
78.5(0.1) a
86.7(1.5) a
77.9(0.6) a
77.5(0.9) a
82.0(2.3) a
PBM30 58.4(4.4) b
51.6(5.0) b
72.8(2.8) b
49.6(6.3) b
58.4(4.7) b
70.3(3.0) b
76.9(3.4) b
52.5(5.4) b
39.5(7.0) b
54.6(3.8) b
76.3(2.3) b
-24.9(12.3) b
51.0(4.9) b
71.2(3.0) b
45.9(5.8) b
39.9(6.7) b
57.6(4.8) b
CGM10 79.1(1.7) a
69.1(2.2)
81.8(1.8)
73.3(2.2)
72.6(3.9)
84.6(1.9)
84.8(2.2)
70.5(2.0)
68.4(2.2)
61.9(4.9)
84.4(2.5)
20.8(24.3)
69.6(1.8) a
79.6(0.3) a
65.5(0.9)
61.6(2.7)
69.8(1.8)
CGM20 79.7(0.6) a
67.0(3.0)
80.7(1.4)
73.6(1.0)
69.5(4.3)
85.7(2.4)
81.6(2.8)
71.0(1.3)
69.9(1.2)
60.1(5.3)
83.3(0.2)
-0.7(36.3)
71.5(1.5) b
74.9(1.5) b
64.8(2.0)
61.6(2.3)
66.8(0.7)
CGM30 82.8(0.4) b
69.4(0.9)
80.8(1.0)
76.3(5.9)
71.9(2.2)
87.9(0.7)
81.0(0.5)
73.2(0.9)
72.5(2.5)
65.2(3.9)
81.3(3.5)
0.5(49.5)
75.3(0.6) b
73.9(1.1) b
67.8(0.7)
66.7(1.6)
70.0(1.2)
MBM10 81.7(1.0) a
77.9(2.5)
85.3(2.3)
78.8(2.6)
80.1(2.7)
85.0(2.5)
89.8(1.7) a
72.2(1.9)
75.9(2.7)
77.1(1.8)
89.1(3.2)
79.8(9.8)
71.6(1.8) a
87.8(1.7)
72.7(1.3)
69.1(1.8)
78.3(2.0)
MBM20 82.5(2.0) a
78.9(3.2)
75.4(17.1)
78.2(4.5)
80.5(4.3)
84.5(3.3)
89.4(1.6) a
76.6(2.8)
76.8(4.7)
76.1(0.5)
88.4(4.7)
86.9(6.2)
74.2(2.8) ab
88.4(1.4)
72.1(8.2)
72.2(2.0)
79.3(2.4)
MBM30 76.2(1.5) b
74.2(3.8)
81.3(2.1)
76.6(8.4)
75.7(5.4)
78.4(3.9)
84.5(2.2) b
70.3(3.0)
72.9(5.0)
74.2(4.0)
88.0(1.7)
72.6(10.1)
66.4(1.9) b
86.0(1.3)
68.2(2.0)
68.5(3.6)
75.0(3.5)
HFM10 73.9(0.5) a
68.9(0.7) a
82.2(1.8) a
69.5(3.5)
71.3(3.4) a
84.2(0.0) a
86.8(0.4)
63.3(0.7) a
64.9(4.4)
68.7(2.3)
82.8(3.1) a
61.4(11.8)
65.3(1.4) a
81.5(1.4) a
62.2(0.8) a
52.2(1.9)
71.8(0.2) a
HFM20 65.9(3.2) b
59.5(4.0) b
80.3(2.2) ab
61.8(11.8)
60.9(5.6) ab
78.6(2.8) b
82.3(3.8)
54.8(3.5) ab
53.3(7.8)
67.1(3.5)
76.0(2.3) b
59.8(4.4)
58.0(3.1) b
74.6(2.1) b
52.6(3.2) b
44.9(4.9)
64.4(3.4) b
HFM30 65.0(3.1) b
57.1(1.7) b
76.8(0.7) b
57.2(5.2)
60.3(3.2) b
78.0(1.0) b
81.0(1.7)
58.1(3.2) b
53.6(5.6)
73.7(3.1)
75.0(0.3) b
59.3(3.9)
57.7(1.5) b
74.1(2.5) b
52.3(2.0) b
49.3(2.9)
61.3(1.2) b
4 R.A.P.L.F. Carvalho et al. / Aquaculture 465 (2016) xxx–xxx
Please cite this article as: Carvalho, R.A.P.L.F., et al., Apparent digestibility of protein, energy and amino acids of six protein sources included atthree levels in diets for juvenile wh..., Aquaculture (2016), http://dx.doi.org/10.1016/j.aquaculture.2016.09.010
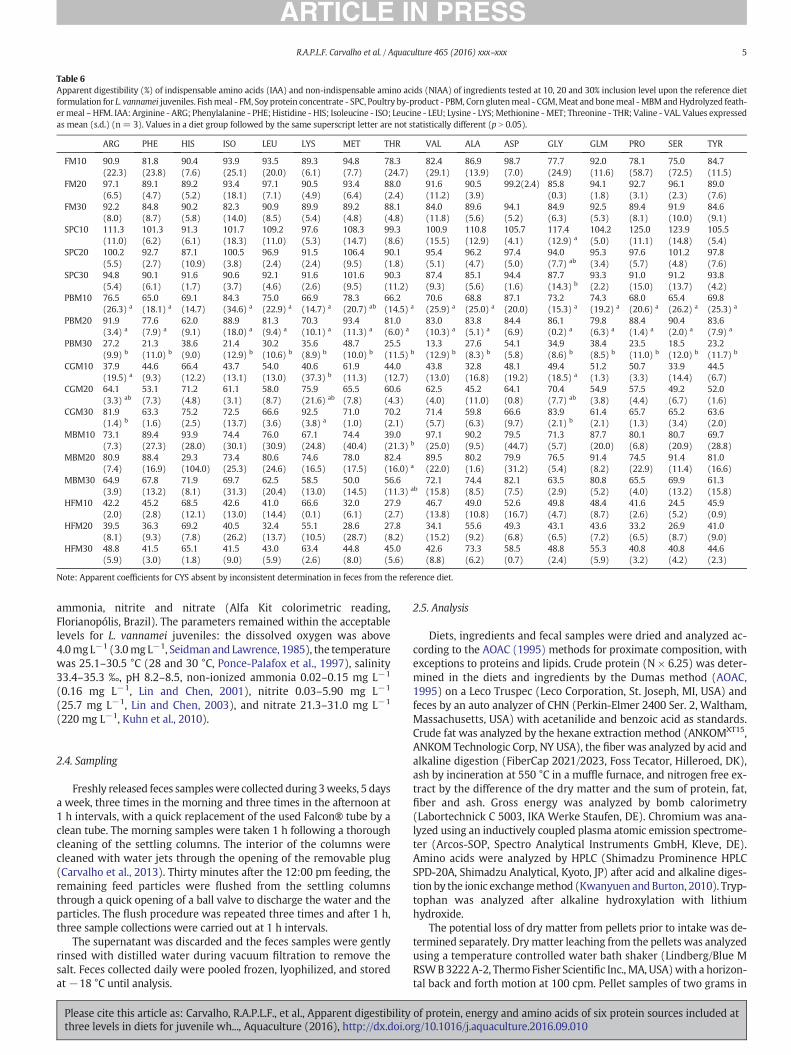
Table 6Apparent digestibility (%) of indispensable amino acids (IAA) and non-indispensable amino acids (NIAA) of ingredients tested at 10, 20 and 30% inclusion level upon the reference dietformulation for L. vannamei juveniles. Fishmeal - FM, Soy protein concentrate - SPC, Poultry by-product - PBM, Corn glutenmeal - CGM,Meat and bonemeal -MBMandHydrolyzed feath-ermeal –HFM. IAA: Arginine - ARG; Phenylalanine - PHE; Histidine - HIS; Isoleucine - ISO; Leucine - LEU; Lysine - LYS;Methionine -MET; Threonine - THR; Valine - VAL. Values expressedas mean (s.d.) (n = 3). Values in a diet group followed by the same superscript letter are not statistically different (p N 0.05).
ARG PHE HIS ISO LEU LYS MET THR VAL ALA ASP GLY GLM PRO SER TYR
FM10 90.9(22.3)
81.8(23.8)
90.4(7.6)
93.9(25.1)
93.5(20.0)
89.3(6.1)
94.8(7.7)
78.3(24.7)
82.4(29.1)
86.9(13.9)
98.7(7.0)
77.7(24.9)
92.0(11.6)
78.1(58.7)
75.0(72.5)
84.7(11.5)
FM20 97.1(6.5)
89.1(4.7)
89.2(5.2)
93.4(18.1)
97.1(7.1)
90.5(4.9)
93.4(6.4)
88.0(2.4)
91.6(11.2)
90.5(3.9)
99.2(2.4) 85.8(0.3)
94.1(1.8)
92.7(3.1)
96.1(2.3)
89.0(7.6)
FM30 92.2(8.0)
84.8(8.7)
90.2(5.8)
82.3(14.0)
90.9(8.5)
89.9(5.4)
89.2(4.8)
88.1(4.8)
84.0(11.8)
89.6(5.6)
94.1(5.2)
84.9(6.3)
92.5(5.3)
89.4(8.1)
91.9(10.0)
84.6(9.1)
SPC10 111.3(11.0)
101.3(6.2)
91.3(6.1)
101.7(18.3)
109.2(11.0)
97.6(5.3)
108.3(14.7)
99.3(8.6)
100.9(15.5)
110.8(12.9)
105.7(4.1)
117.4(12.9) a
104.2(5.0)
125.0(11.1)
123.9(14.8)
105.5(5.4)
SPC20 100.2(5.5)
92.7(2.7)
87.1(10.9)
100.5(3.8)
96.9(2.4)
91.5(2.4)
106.4(9.5)
90.1(1.8)
95.4(5.1)
96.2(4.7)
97.4(5.0)
94.0(7.7) ab
95.3(3.4)
97.6(5.7)
101.2(4.8)
97.8(7.6)
SPC30 94.8(5.4)
90.1(6.1)
91.6(1.7)
90.6(3.7)
92.1(4.6)
91.6(2.6)
101.6(9.5)
90.3(11.2)
87.4(9.3)
85.1(5.6)
94.4(1.6)
87.7(14.3) b
93.3(2.2)
91.0(15.0)
91.2(13.7)
93.8(4.2)
PBM10 76.5(26.3) a
65.0(18.1) a
69.1(14.7)
84.3(34.6) a
75.0(22.9) a
66.9(14.7) a
78.3(20.7) ab
66.2(14.5) a
70.6(25.9) a
68.8(25.0) a
87.1(20.0)
73.2(15.3) a
74.3(19.2) a
68.0(20.6) a
65.4(26.2) a
69.8(25.3) a
PBM20 91.9(3.4) a
77.6(7.9) a
62.0(9.1)
88.9(18.0) a
81.3(9.4) a
70.3(10.1) a
93.4(11.3) a
81.0(6.0) a
83.0(10.3) a
83.8(5.1) a
84.4(6.9)
86.1(0.2) a
79.8(6.3) a
88.4(1.4) a
90.4(2.0) a
83.6(7.9) a
PBM30 27.2(9.9) b
21.3(11.0) b
38.6(9.0)
21.4(12.9) b
30.2(10.6) b
35.6(8.9) b
48.7(10.0) b
25.5(11.5) b
13.3(12.9) b
27.6(8.3) b
54.1(5.8)
34.9(8.6) b
38.4(8.5) b
23.5(11.0) b
18.5(12.0) b
23.2(11.7) b
CGM10 37.9(19.5) a
44.6(9.3)
66.4(12.2)
43.7(13.1)
54.0(13.0)
40.6(37.3) b
61.9(11.3)
44.0(12.7)
43.8(13.0)
32.8(16.8)
48.1(19.2)
49.4(18.5) a
51.2(1.3)
50.7(3.3)
33.9(14.4)
44.5(6.7)
CGM20 64.1(3.3) ab
53.1(7.3)
71.2(4.8)
61.1(3.1)
58.0(8.7)
75.9(21.6) ab
65.5(7.8)
60.6(4.3)
62.5(4.0)
45.2(11.0)
64.1(0.8)
70.4(7.7) ab
54.9(3.8)
57.5(4.4)
49.2(6.7)
52.0(1.6)
CGM30 81.9(1.4) b
63.3(1.6)
75.2(2.5)
72.5(13.7)
66.6(3.6)
92.5(3.8) a
71.0(1.0)
70.2(2.1)
71.4(5.7)
59.8(6.3)
66.6(9.7)
83.9(2.1) b
61.4(2.1)
65.7(1.3)
65.2(3.4)
63.6(2.0)
MBM10 73.1(7.3)
89.4(27.3)
93.9(28.0)
74.4(30.1)
76.0(30.9)
67.1(24.8)
74.4(40.4)
39.0(21.3) b
97.1(25.0)
90.2(9.5)
79.5(44.7)
71.3(5.7)
87.7(20.0)
80.1(6.8)
80.7(20.9)
69.7(28.8)
MBM20 80.9(7.4)
88.4(16.9)
29.3(104.0)
73.4(25.3)
80.6(24.6)
74.6(16.5)
78.0(17.5)
82.4(16.0) a
89.5(22.0)
80.2(1.6)
79.9(31.2)
76.5(5.4)
91.4(8.2)
74.5(22.9)
91.4(11.4)
81.0(16.6)
MBM30 64.9(3.9)
67.8(13.2)
71.9(8.1)
69.7(31.3)
62.5(20.4)
58.5(13.0)
50.0(14.5)
56.6(11.3) ab
72.1(15.8)
74.4(8.5)
82.1(7.5)
63.5(2.9)
80.8(5.2)
65.5(4.0)
69.9(13.2)
61.3(15.8)
HFM10 42.2(2.0)
45.2(2.8)
68.5(12.1)
42.6(13.0)
41.0(14.4)
66.6(0.1)
32.0(6.1)
27.9(2.7)
46.7(13.8)
49.0(10.8)
52.6(16.7)
49.8(4.7)
48.4(8.7)
41.6(2.6)
24.5(5.2)
45.9(0.9)
HFM20 39.5(8.1)
36.3(9.3)
69.2(7.8)
40.5(26.2)
32.4(13.7)
55.1(10.5)
28.6(28.7)
27.8(8.2)
34.1(15.2)
55.6(9.2)
49.3(6.8)
43.1(6.5)
43.6(7.2)
33.2(6.5)
26.9(8.7)
41.0(9.0)
HFM30 48.8(5.9)
41.5(3.0)
65.1(1.8)
41.5(9.0)
43.0(5.9)
63.4(2.6)
44.8(8.0)
45.0(5.6)
42.6(8.8)
73.3(6.2)
58.5(0.7)
48.8(2.4)
55.3(5.9)
40.8(3.2)
40.8(4.2)
44.6(2.3)
Note: Apparent coefficients for CYS absent by inconsistent determination in feces from the reference diet.
5R.A.P.L.F. Carvalho et al. / Aquaculture 465 (2016) xxx–xxx
ammonia, nitrite and nitrate (Alfa Kit colorimetric reading,Florianopólis, Brazil). The parameters remained within the acceptablelevels for L. vannamei juveniles: the dissolved oxygen was above4.0mgL−1 (3.0mg L−1, Seidman and Lawrence, 1985), the temperaturewas 25.1–30.5 °C (28 and 30 °C, Ponce-Palafox et al., 1997), salinity33.4–35.3 ‰, pH 8.2–8.5, non-ionized ammonia 0.02–0.15 mg L−1
(0.16 mg L−1, Lin and Chen, 2001), nitrite 0.03–5.90 mg L−1
(25.7 mg L−1, Lin and Chen, 2003), and nitrate 21.3–31.0 mg L−1
(220 mg L−1, Kuhn et al., 2010).
2.4. Sampling
Freshly released feces sampleswere collected during 3weeks, 5 daysa week, three times in the morning and three times in the afternoon at1 h intervals, with a quick replacement of the used Falcon® tube by aclean tube. The morning samples were taken 1 h following a thoroughcleaning of the settling columns. The interior of the columns werecleaned with water jets through the opening of the removable plug(Carvalho et al., 2013). Thirty minutes after the 12:00 pm feeding, theremaining feed particles were flushed from the settling columnsthrough a quick opening of a ball valve to discharge the water and theparticles. The flush procedure was repeated three times and after 1 h,three sample collections were carried out at 1 h intervals.
The supernatant was discarded and the feces samples were gentlyrinsed with distilled water during vacuum filtration to remove thesalt. Feces collected daily were pooled frozen, lyophilized, and storedat−18 °C until analysis.
Please cite this article as: Carvalho, R.A.P.L.F., et al., Apparent digestibilitythree levels in diets for juvenile wh..., Aquaculture (2016), http://dx.doi.o
2.5. Analysis
Diets, ingredients and fecal samples were dried and analyzed ac-cording to the AOAC (1995) methods for proximate composition, withexceptions to proteins and lipids. Crude protein (N × 6.25) was deter-mined in the diets and ingredients by the Dumas method (AOAC,1995) on a Leco Truspec (Leco Corporation, St. Joseph, MI, USA) andfeces by an auto analyzer of CHN (Perkin-Elmer 2400 Ser. 2, Waltham,Massachusetts, USA) with acetanilide and benzoic acid as standards.Crude fat was analyzed by the hexane extraction method (ANKOMXT15,ANKOM Technologic Corp, NY USA), the fiber was analyzed by acid andalkaline digestion (FiberCap 2021/2023, Foss Tecator, Hilleroed, DK),ash by incineration at 550 °C in a muffle furnace, and nitrogen free ex-tract by the difference of the dry matter and the sum of protein, fat,fiber and ash. Gross energy was analyzed by bomb calorimetry(Labortechnick C 5003, IKA Werke Staufen, DE). Chromium was ana-lyzed using an inductively coupled plasma atomic emission spectrome-ter (Arcos-SOP, Spectro Analytical Instruments GmbH, Kleve, DE).Amino acids were analyzed by HPLC (Shimadzu Prominence HPLCSPD-20A, Shimadzu Analytical, Kyoto, JP) after acid and alkaline diges-tion by the ionic exchangemethod (Kwanyuen andBurton, 2010). Tryp-tophan was analyzed after alkaline hydroxylation with lithiumhydroxide.
The potential loss of dry matter from pellets prior to intake was de-termined separately. Dry matter leaching from the pellets was analyzedusing a temperature controlled water bath shaker (Lindberg/Blue MRSWB3222A-2, Thermo Fisher Scientific Inc., MA, USA)with a horizon-tal back and forth motion at 100 cpm. Pellet samples of two grams in
of protein, energy and amino acids of six protein sources included atrg/10.1016/j.aquaculture.2016.09.010
6 R.A.P.L.F. Carvalho et al. / Aquaculture 465 (2016) xxx–xxx
triplicates were immersed in a 250 ml Erlenmeyer flask at 27 °C and 35‰ for 5 min, which was the time that the pellets remained on the tankbottom until consumption or flush removal. The recovered dry matterwas vacuum filtered, gently rinsed with distilled water for salt removal,and dried to determine the mass. The dry matter losses were used tocorrect the dry matter digestibility data.
The apparent digestibility coefficients of dry matter, crude protein,true protein (sum of analyzed essential and non-essential amino acids,with exception to tryptophan), energy and amino acids of the referenceand test diets were calculated as suggested by Cho et al. (1982):
ADCd ¼ 1− F⁄D�mD⁄mFð Þ
where: ADCd= apparent digestibility coefficient of dry matter (ADMD)or, crude protein (ACPD), energy (AED), or amino acids (AAAD) of thediets; D = % nutrients (or MJ g−1 energy) of the diet; F = % nutrients(or MJ g−1 energy) of the feces; mD = % of marker in the diet; mF =% of marker in the feces.
Apparent digestibility coefficients of dry matter, crude protein, trueprotein, energy and amino acids of test ingredients were calculated asBureau & Hua (2006):
ADCi¼ ADCtd þ ADCtd−ADCrdð Þ � Ird �Nrd=Ii �Nið Þ½ �
where ADCi = apparent digestibility coefficient of dry matter (ADMD)or, crude protein (ACPD), true protein (ATPD), energy (AED), oramino acids (AAAD) of the ingredients, apparent digestibility coefficientof the test diet (ADCtd), apparent digestibility coefficient of the refer-ence diet (ADCrd). Ird = % of the reference diet in the mash; Ii = % ofthe test ingredient in the mash; Nrd = % of nutrient (or MJ g−1 energy)in the reference diet mash (as fed); Ni = % of nutrient (or MJ g−1 ener-gy) in the test ingredient (as fed).
2.6. Calculation and statistics
Weekly growth rate, feed conversion ratio (total feed offered:totalshrimp biomass gain) and survival rates were calculated and comparedamong the treatments. All values were expressed as the mean ± stan-dard deviation, except where specified. The effect of the inclusionlevel and the combined effect of the ingredient and the inclusion levelon the digestibility of the nutrients and the energy were analyzed byone or two-way analysis of variance (ANOVA), respectively, and Tukeytest for post-hoc comparison. Pearson’s correlationwas applied to iden-tify the effects of diet and ingredient composition on the digestibility.The software Statistica 9.1 (StatSoft, Inc. Tulsa, OK, USA) was used forall analysis. Differences were significant at p b 0.05.
3. Results
3.1. Performance
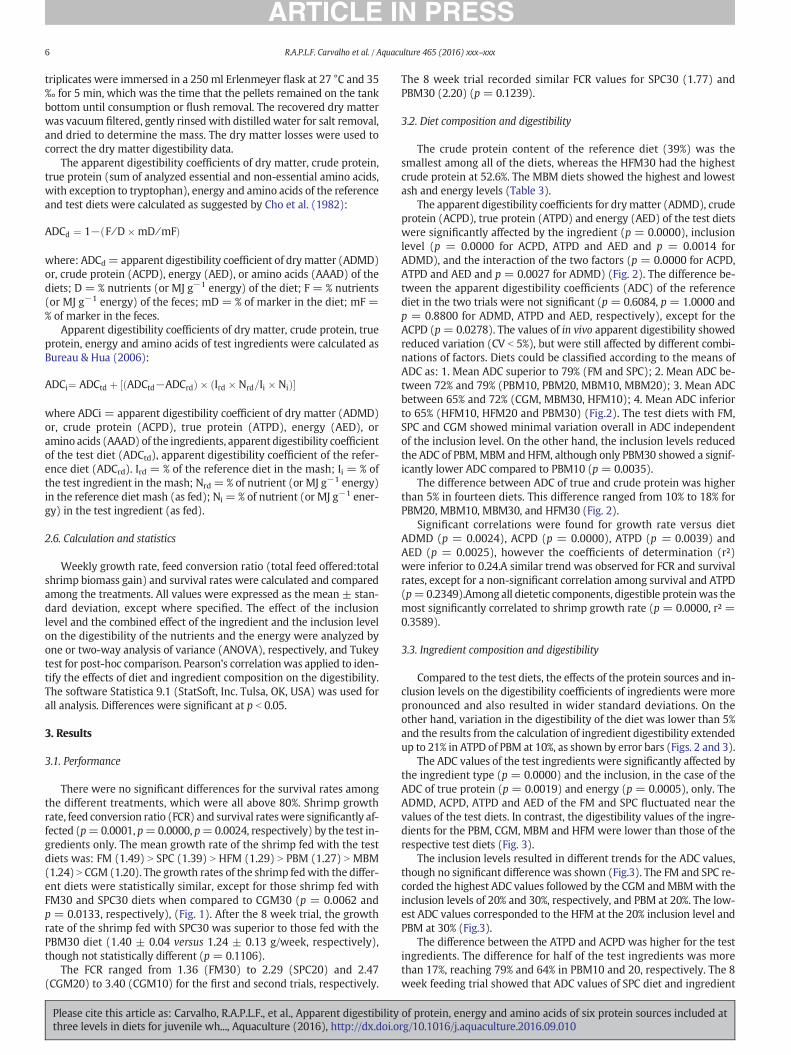
There were no significant differences for the survival rates amongthe different treatments, which were all above 80%. Shrimp growthrate, feed conversion ratio (FCR) and survival rateswere significantly af-fected (p=0.0001, p=0.0000, p=0.0024, respectively) by the test in-gredients only. The mean growth rate of the shrimp fed with the testdiets was: FM (1.49) N SPC (1.39) N HFM (1.29) N PBM (1.27) N MBM(1.24) N CGM (1.20). The growth rates of the shrimp fedwith the differ-ent diets were statistically similar, except for those shrimp fed withFM30 and SPC30 diets when compared to CGM30 (p = 0.0062 andp = 0.0133, respectively), (Fig. 1). After the 8 week trial, the growthrate of the shrimp fed with SPC30 was superior to those fed with thePBM30 diet (1.40 ± 0.04 versus 1.24 ± 0.13 g/week, respectively),though not statistically different (p = 0.1106).
The FCR ranged from 1.36 (FM30) to 2.29 (SPC20) and 2.47(CGM20) to 3.40 (CGM10) for the first and second trials, respectively.
Please cite this article as: Carvalho, R.A.P.L.F., et al., Apparent digestibilitythree levels in diets for juvenile wh..., Aquaculture (2016), http://dx.doi.o
The 8 week trial recorded similar FCR values for SPC30 (1.77) andPBM30 (2.20) (p = 0.1239).
3.2. Diet composition and digestibility
The crude protein content of the reference diet (39%) was thesmallest among all of the diets, whereas the HFM30 had the highestcrude protein at 52.6%. The MBM diets showed the highest and lowestash and energy levels (Table 3).
The apparent digestibility coefficients for drymatter (ADMD), crudeprotein (ACPD), true protein (ATPD) and energy (AED) of the test dietswere significantly affected by the ingredient (p = 0.0000), inclusionlevel (p = 0.0000 for ACPD, ATPD and AED and p = 0.0014 forADMD), and the interaction of the two factors (p = 0.0000 for ACPD,ATPD and AED and p = 0.0027 for ADMD) (Fig. 2). The difference be-tween the apparent digestibility coefficients (ADC) of the referencediet in the two trials were not significant (p = 0.6084, p = 1.0000 andp = 0.8800 for ADMD, ATPD and AED, respectively), except for theACPD (p= 0.0278). The values of in vivo apparent digestibility showedreduced variation (CV b 5%), but were still affected by different combi-nations of factors. Diets could be classified according to the means ofADC as: 1. Mean ADC superior to 79% (FM and SPC); 2. Mean ADC be-tween 72% and 79% (PBM10, PBM20, MBM10, MBM20); 3. Mean ADCbetween 65% and 72% (CGM, MBM30, HFM10); 4. Mean ADC inferiorto 65% (HFM10, HFM20 and PBM30) (Fig.2). The test diets with FM,SPC and CGM showed minimal variation overall in ADC independentof the inclusion level. On the other hand, the inclusion levels reducedthe ADC of PBM, MBM and HFM, although only PBM30 showed a signif-icantly lower ADC compared to PBM10 (p = 0.0035).
The difference between ADC of true and crude protein was higherthan 5% in fourteen diets. This difference ranged from 10% to 18% forPBM20, MBM10, MBM30, and HFM30 (Fig. 2).
Significant correlations were found for growth rate versus dietADMD (p = 0.0024), ACPD (p = 0.0000), ATPD (p = 0.0039) andAED (p = 0.0025), however the coefficients of determination (r²)were inferior to 0.24.A similar trend was observed for FCR and survivalrates, except for a non-significant correlation among survival and ATPD(p=0.2349).Among all dietetic components, digestible proteinwas themost significantly correlated to shrimp growth rate (p = 0.0000, r² =0.3589).
3.3. Ingredient composition and digestibility
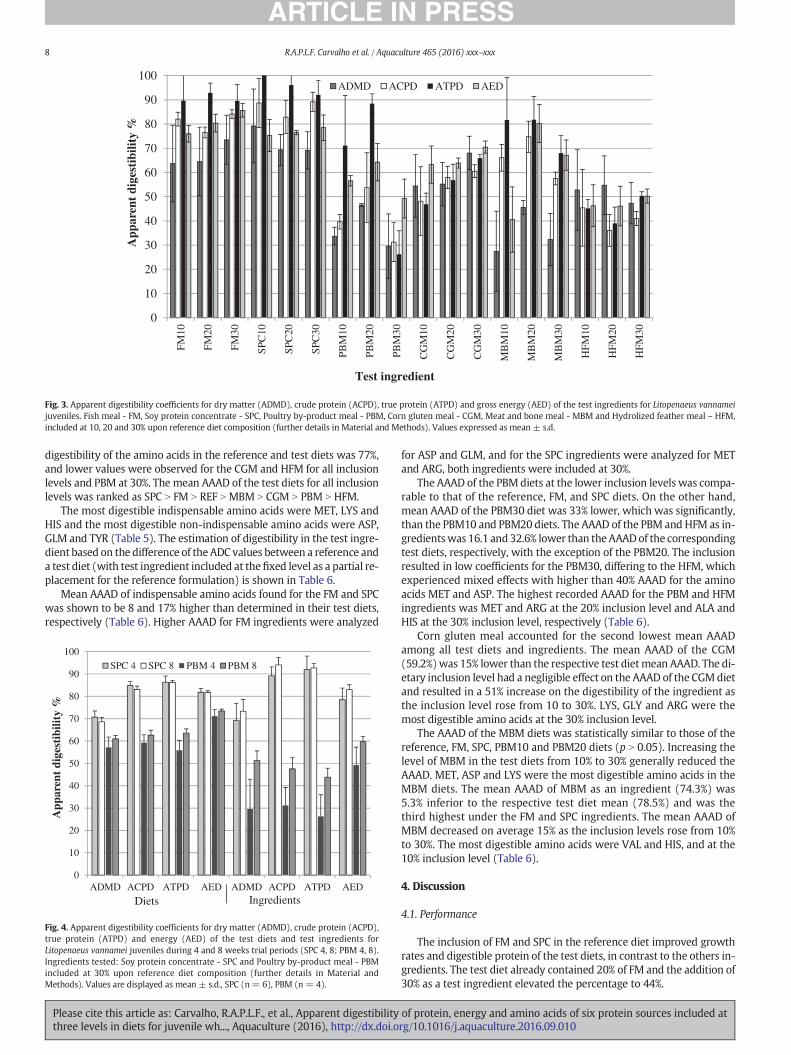
Compared to the test diets, the effects of the protein sources and in-clusion levels on the digestibility coefficients of ingredients were morepronounced and also resulted in wider standard deviations. On theother hand, variation in the digestibility of the diet was lower than 5%and the results from the calculation of ingredient digestibility extendedup to 21% in ATPD of PBM at 10%, as shown by error bars (Figs. 2 and 3).
The ADC values of the test ingredients were significantly affected bythe ingredient type (p = 0.0000) and the inclusion, in the case of theADC of true protein (p = 0.0019) and energy (p = 0.0005), only. TheADMD, ACPD, ATPD and AED of the FM and SPC fluctuated near thevalues of the test diets. In contrast, the digestibility values of the ingre-dients for the PBM, CGM, MBM and HFM were lower than those of therespective test diets (Fig. 3).
The inclusion levels resulted in different trends for the ADC values,though no significant difference was shown (Fig.3). The FM and SPC re-corded the highest ADC values followed by the CGM andMBMwith theinclusion levels of 20% and 30%, respectively, and PBM at 20%. The low-est ADC values corresponded to the HFM at the 20% inclusion level andPBM at 30% (Fig.3).
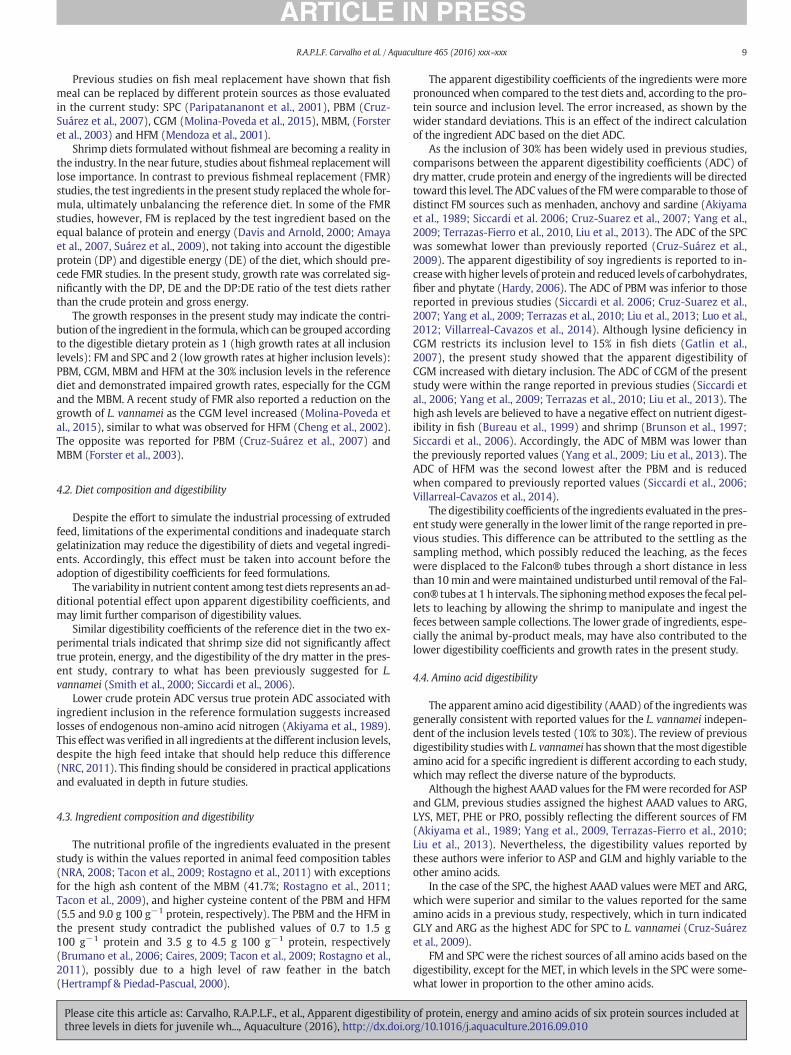
The difference between the ATPD and ACPD was higher for the testingredients. The difference for half of the test ingredients was morethan 17%, reaching 79% and 64% in PBM10 and 20, respectively. The 8week feeding trial showed that ADC values of SPC diet and ingredient
of protein, energy and amino acids of six protein sources included atrg/10.1016/j.aquaculture.2016.09.010
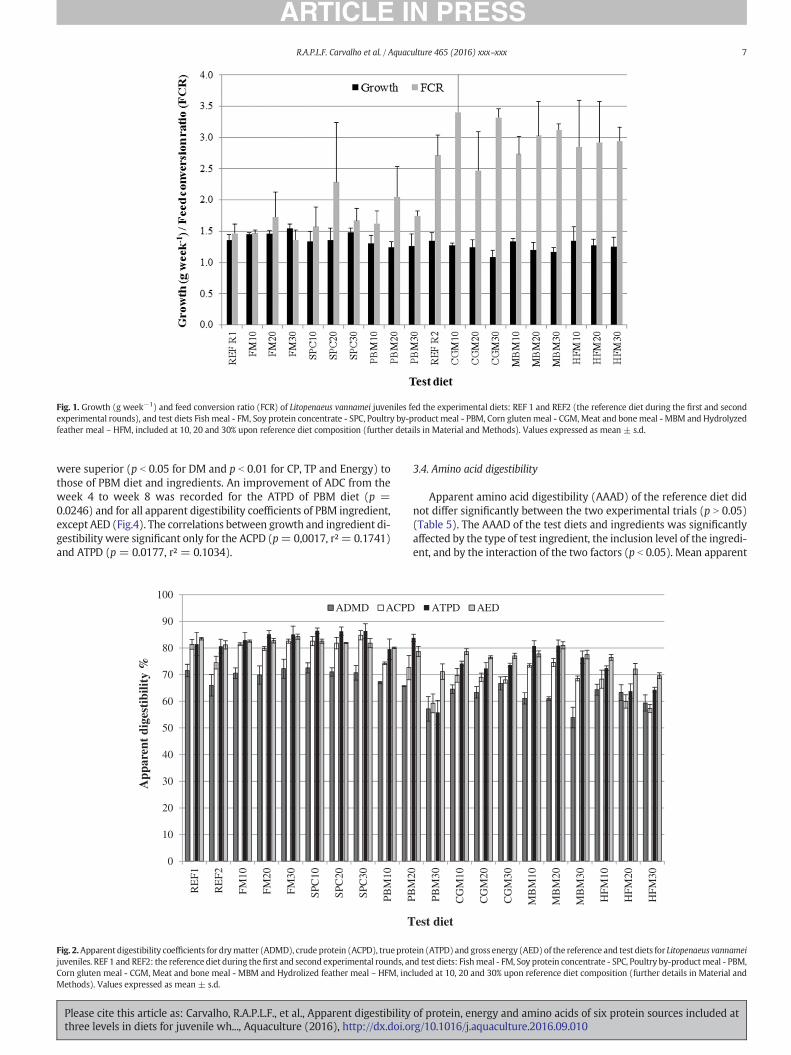
Fig. 1. Growth (g week−1) and feed conversion ratio (FCR) of Litopenaeus vannamei juveniles fed the experimental diets: REF 1 and REF2 (the reference diet during the first and secondexperimental rounds), and test diets Fish meal - FM, Soy protein concentrate - SPC, Poultry by-product meal - PBM, Corn glutenmeal - CGM,Meat and bonemeal - MBM and Hydrolyzedfeather meal – HFM, included at 10, 20 and 30% upon reference diet composition (further details in Material and Methods). Values expressed as mean ± s.d.
7R.A.P.L.F. Carvalho et al. / Aquaculture 465 (2016) xxx–xxx
were superior (p b 0.05 for DM and p b 0.01 for CP, TP and Energy) tothose of PBM diet and ingredients. An improvement of ADC from theweek 4 to week 8 was recorded for the ATPD of PBM diet (p =0.0246) and for all apparent digestibility coefficients of PBM ingredient,except AED (Fig.4). The correlations between growth and ingredient di-gestibility were significant only for the ACPD (p=0,0017, r² = 0.1741)and ATPD (p = 0.0177, r² = 0.1034).
0
10
20
30
40
50
60
70
80
90
100
RE
F1
RE
F2
FM10
FM20
FM30
SPC
10
SPC
20
SPC
30
PBM
10
App
aren
t di
gest
ibili
ty %
ADMD ACPD
T
Fig. 2.Apparent digestibility coefficients for drymatter (ADMD), crude protein (ACPD), trueprotjuveniles. REF 1 and REF2: the reference diet during thefirst and second experimental rounds, anCorn gluten meal - CGM, Meat and bone meal - MBM and Hydrolized feather meal – HFM, incMethods). Values expressed as mean ± s.d.
Please cite this article as: Carvalho, R.A.P.L.F., et al., Apparent digestibilitythree levels in diets for juvenile wh..., Aquaculture (2016), http://dx.doi.o
3.4. Amino acid digestibility
Apparent amino acid digestibility (AAAD) of the reference diet didnot differ significantly between the two experimental trials (p N 0.05)(Table 5). The AAAD of the test diets and ingredients was significantlyaffected by the type of test ingredient, the inclusion level of the ingredi-ent, and by the interaction of the two factors (p b 0.05). Mean apparent
PBM
20
PBM
30
CG
M10
CG
M20
CG
M30
MB
M10
MB
M20
MB
M30
HFM
10
HFM
20
HFM
30
ATPD AED
est diet
ein (ATPD) and gross energy (AED)of the reference and test diets for Litopenaeus vannameid test diets: Fishmeal - FM, Soy protein concentrate - SPC, Poultry by-productmeal - PBM,luded at 10, 20 and 30% upon reference diet composition (further details in Material and
of protein, energy and amino acids of six protein sources included atrg/10.1016/j.aquaculture.2016.09.010
0
10
20
30
40
50
60
70
80
90
100
FM10
FM20
FM30
SPC
10
SPC
20
SPC
30
PBM
10
PBM
20
PBM
30
CG
M10
CG
M20
CG
M30
MB
M10
MB
M20
MB
M30
HFM
10
HFM
20
HFM
30
App
aren
t di
gest
ibili
ty %
ADMD ACPD ATPD AED
Test ingredient
Fig. 3. Apparent digestibility coefficients for dry matter (ADMD), crude protein (ACPD), true protein (ATPD) and gross energy (AED) of the test ingredients for Litopenaeus vannameijuveniles. Fish meal - FM, Soy protein concentrate - SPC, Poultry by-product meal - PBM, Corn gluten meal - CGM, Meat and bone meal - MBM and Hydrolized feather meal – HFM,included at 10, 20 and 30% upon reference diet composition (further details in Material and Methods). Values expressed as mean ± s.d.
8 R.A.P.L.F. Carvalho et al. / Aquaculture 465 (2016) xxx–xxx
digestibility of the amino acids in the reference and test diets was 77%,and lower values were observed for the CGM and HFM for all inclusionlevels and PBM at 30%. The mean AAAD of the test diets for all inclusionlevels was ranked as SPC N FM N REF N MBM N CGM N PBM N HFM.
The most digestible indispensable amino acids were MET, LYS andHIS and the most digestible non-indispensable amino acids were ASP,GLM and TYR (Table 5). The estimation of digestibility in the test ingre-dient based on the difference of theADC values between a reference anda test diet (with test ingredient included at thefixed level as a partial re-placement for the reference formulation) is shown in Table 6.
Mean AAAD of indispensable amino acids found for the FM and SPCwas shown to be 8 and 17% higher than determined in their test diets,respectively (Table 6). Higher AAAD for FM ingredients were analyzed
0
10
20
30
40
50
60
70
80
90
100
ADMD ACPD ATPD AED ADMD ACPD ATPD AED
App
aren
t di
gest
ibili
ty %
SPC 4 SPC 8 PBM 4 PBM 8
Diets Ingredients
Fig. 4. Apparent digestibility coefficients for dry matter (ADMD), crude protein (ACPD),true protein (ATPD) and energy (AED) of the test diets and test ingredients forLitopenaeus vannamei juveniles during 4 and 8 weeks trial periods (SPC 4, 8; PBM 4, 8).Ingredients tested: Soy protein concentrate - SPC and Poultry by-product meal - PBMincluded at 30% upon reference diet composition (further details in Material andMethods). Values are displayed as mean ± s.d., SPC (n = 6), PBM (n = 4).
Please cite this article as: Carvalho, R.A.P.L.F., et al., Apparent digestibilitythree levels in diets for juvenile wh..., Aquaculture (2016), http://dx.doi.o
for ASP and GLM, and for the SPC ingredients were analyzed for METand ARG, both ingredients were included at 30%.
The AAAD of the PBMdiets at the lower inclusion levels was compa-rable to that of the reference, FM, and SPC diets. On the other hand,mean AAAD of the PBM30 diet was 33% lower, which was significantly,than the PBM10 and PBM20 diets. The AAAD of the PBM and HFM as in-gredientswas 16.1 and32.6% lower than theAAADof the correspondingtest diets, respectively, with the exception of the PBM20. The inclusionresulted in low coefficients for the PBM30, differing to the HFM, whichexperienced mixed effects with higher than 40% AAAD for the aminoacids MET and ASP. The highest recorded AAAD for the PBM and HFMingredients was MET and ARG at the 20% inclusion level and ALA andHIS at the 30% inclusion level, respectively (Table 6).
Corn gluten meal accounted for the second lowest mean AAADamong all test diets and ingredients. The mean AAAD of the CGM(59.2%)was 15% lower than the respective test dietmean AAAD. The di-etary inclusion level had a negligible effect on the AAAD of the CGMdietand resulted in a 51% increase on the digestibility of the ingredient asthe inclusion level rose from 10 to 30%. LYS, GLY and ARG were themost digestible amino acids at the 30% inclusion level.
The AAAD of the MBM diets was statistically similar to those of thereference, FM, SPC, PBM10 and PBM20 diets (p N 0.05). Increasing thelevel of MBM in the test diets from 10% to 30% generally reduced theAAAD. MET, ASP and LYS were the most digestible amino acids in theMBM diets. The mean AAAD of MBM as an ingredient (74.3%) was5.3% inferior to the respective test diet mean (78.5%) and was thethird highest under the FM and SPC ingredients. The mean AAAD ofMBM decreased on average 15% as the inclusion levels rose from 10%to 30%. The most digestible amino acids were VAL and HIS, and at the10% inclusion level (Table 6).
4. Discussion
4.1. Performance
The inclusion of FM and SPC in the reference diet improved growthrates and digestible protein of the test diets, in contrast to the others in-gredients. The test diet already contained 20% of FM and the addition of30% as a test ingredient elevated the percentage to 44%.
of protein, energy and amino acids of six protein sources included atrg/10.1016/j.aquaculture.2016.09.010
9R.A.P.L.F. Carvalho et al. / Aquaculture 465 (2016) xxx–xxx
Previous studies on fish meal replacement have shown that fishmeal can be replaced by different protein sources as those evaluatedin the current study: SPC (Paripatananont et al., 2001), PBM (Cruz-Suárez et al., 2007), CGM (Molina-Poveda et al., 2015), MBM, (Forsteret al., 2003) and HFM (Mendoza et al., 2001).
Shrimp diets formulated without fishmeal are becoming a reality inthe industry. In the near future, studies about fishmeal replacementwilllose importance. In contrast to previous fishmeal replacement (FMR)studies, the test ingredients in the present study replaced thewhole for-mula, ultimately unbalancing the reference diet. In some of the FMRstudies, however, FM is replaced by the test ingredient based on theequal balance of protein and energy (Davis and Arnold, 2000; Amayaet al., 2007, Suárez et al., 2009), not taking into account the digestibleprotein (DP) and digestible energy (DE) of the diet, which should pre-cede FMR studies. In the present study, growth rate was correlated sig-nificantly with the DP, DE and the DP:DE ratio of the test diets ratherthan the crude protein and gross energy.
The growth responses in the present study may indicate the contri-bution of the ingredient in the formula,which can be grouped accordingto the digestible dietary protein as 1 (high growth rates at all inclusionlevels): FM and SPC and 2 (low growth rates at higher inclusion levels):PBM, CGM, MBM and HFM at the 30% inclusion levels in the referencediet and demonstrated impaired growth rates, especially for the CGMand the MBM. A recent study of FMR also reported a reduction on thegrowth of L. vannamei as the CGM level increased (Molina-Poveda etal., 2015), similar to what was observed for HFM (Cheng et al., 2002).The opposite was reported for PBM (Cruz-Suárez et al., 2007) andMBM (Forster et al., 2003).
4.2. Diet composition and digestibility
Despite the effort to simulate the industrial processing of extrudedfeed, limitations of the experimental conditions and inadequate starchgelatinization may reduce the digestibility of diets and vegetal ingredi-ents. Accordingly, this effect must be taken into account before theadoption of digestibility coefficients for feed formulations.
The variability in nutrient content among test diets represents an ad-ditional potential effect upon apparent digestibility coefficients, andmay limit further comparison of digestibility values.
Similar digestibility coefficients of the reference diet in the two ex-perimental trials indicated that shrimp size did not significantly affecttrue protein, energy, and the digestibility of the dry matter in the pres-ent study, contrary to what has been previously suggested for L.vannamei (Smith et al., 2000; Siccardi et al., 2006).
Lower crude protein ADC versus true protein ADC associated withingredient inclusion in the reference formulation suggests increasedlosses of endogenous non-amino acid nitrogen (Akiyama et al., 1989).This effectwas verified in all ingredients at the different inclusion levels,despite the high feed intake that should help reduce this difference(NRC, 2011). This finding should be considered in practical applicationsand evaluated in depth in future studies.
4.3. Ingredient composition and digestibility
The nutritional profile of the ingredients evaluated in the presentstudy is within the values reported in animal feed composition tables(NRA, 2008; Tacon et al., 2009; Rostagno et al., 2011) with exceptionsfor the high ash content of the MBM (41.7%; Rostagno et al., 2011;Tacon et al., 2009), and higher cysteine content of the PBM and HFM(5.5 and 9.0 g 100 g−1 protein, respectively). The PBM and the HFM inthe present study contradict the published values of 0.7 to 1.5 g100 g−1 protein and 3.5 g to 4.5 g 100 g−1 protein, respectively(Brumano et al., 2006; Caires, 2009; Tacon et al., 2009; Rostagno et al.,2011), possibly due to a high level of raw feather in the batch(Hertrampf & Piedad-Pascual, 2000).
Please cite this article as: Carvalho, R.A.P.L.F., et al., Apparent digestibilitythree levels in diets for juvenile wh..., Aquaculture (2016), http://dx.doi.o
The apparent digestibility coefficients of the ingredients were morepronounced when compared to the test diets and, according to the pro-tein source and inclusion level. The error increased, as shown by thewider standard deviations. This is an effect of the indirect calculationof the ingredient ADC based on the diet ADC.
As the inclusion of 30% has been widely used in previous studies,comparisons between the apparent digestibility coefficients (ADC) ofdrymatter, crude protein and energy of the ingredients will be directedtoward this level. The ADC values of the FMwere comparable to those ofdistinct FM sources such as menhaden, anchovy and sardine (Akiyamaet al., 1989; Siccardi et al. 2006; Cruz-Suarez et al., 2007; Yang et al.,2009; Terrazas-Fierro et al., 2010, Liu et al., 2013). The ADC of the SPCwas somewhat lower than previously reported (Cruz-Suárez et al.,2009). The apparent digestibility of soy ingredients is reported to in-creasewith higher levels of protein and reduced levels of carbohydrates,fiber and phytate (Hardy, 2006). The ADC of PBM was inferior to thosereported in previous studies (Siccardi et al. 2006; Cruz-Suarez et al.,2007; Yang et al., 2009; Terrazas et al., 2010; Liu et al., 2013; Luo et al.,2012; Villarreal-Cavazos et al., 2014). Although lysine deficiency inCGM restricts its inclusion level to 15% in fish diets (Gatlin et al.,2007), the present study showed that the apparent digestibility ofCGM increased with dietary inclusion. The ADC of CGM of the presentstudy were within the range reported in previous studies (Siccardi etal., 2006; Yang et al., 2009; Terrazas et al., 2010; Liu et al., 2013). Thehigh ash levels are believed to have a negative effect on nutrient digest-ibility in fish (Bureau et al., 1999) and shrimp (Brunson et al., 1997;Siccardi et al., 2006). Accordingly, the ADC of MBM was lower thanthe previously reported values (Yang et al., 2009; Liu et al., 2013). TheADC of HFM was the second lowest after the PBM and is reducedwhen compared to previously reported values (Siccardi et al., 2006;Villarreal-Cavazos et al., 2014).
The digestibility coefficients of the ingredients evaluated in the pres-ent studywere generally in the lower limit of the range reported in pre-vious studies. This difference can be attributed to the settling as thesampling method, which possibly reduced the leaching, as the feceswere displaced to the Falcon® tubes through a short distance in lessthan 10min andweremaintained undisturbed until removal of the Fal-con® tubes at 1 h intervals. The siphoningmethod exposes the fecal pel-lets to leaching by allowing the shrimp to manipulate and ingest thefeces between sample collections. The lower grade of ingredients, espe-cially the animal by-product meals, may have also contributed to thelower digestibility coefficients and growth rates in the present study.
4.4. Amino acid digestibility
The apparent amino acid digestibility (AAAD) of the ingredients wasgenerally consistent with reported values for the L. vannamei indepen-dent of the inclusion levels tested (10% to 30%). The review of previousdigestibility studieswith L. vannamei has shown that themost digestibleamino acid for a specific ingredient is different according to each study,which may reflect the diverse nature of the byproducts.
Although the highest AAAD values for the FMwere recorded for ASPand GLM, previous studies assigned the highest AAAD values to ARG,LYS, MET, PHE or PRO, possibly reflecting the different sources of FM(Akiyama et al., 1989; Yang et al., 2009, Terrazas-Fierro et al., 2010;Liu et al., 2013). Nevertheless, the digestibility values reported bythese authors were inferior to ASP and GLM and highly variable to theother amino acids.
In the case of the SPC, the highest AAAD values were MET and ARG,which were superior and similar to the values reported for the sameamino acids in a previous study, respectively, which in turn indicatedGLY and ARG as the highest ADC for SPC to L. vannamei (Cruz-Suárezet al., 2009).
FM and SPC were the richest sources of all amino acids based on thedigestibility, except for the MET, in which levels in the SPC were some-what lower in proportion to the other amino acids.
of protein, energy and amino acids of six protein sources included atrg/10.1016/j.aquaculture.2016.09.010
10 R.A.P.L.F. Carvalho et al. / Aquaculture 465 (2016) xxx–xxx
For the highest AAAD values for the PBM, the ARG and MET was thesame as the SPC. The AAAD of these amino acids at the 20% inclusionlevel are in agreement with the AAAD coefficients previously reportedfor the same amino acids (Terrazas et al., 2010) or exclusively for theARG (Liu et al., 2013) and were higher than the values reported byother authors (Yang et al., 2009; Liu et al., 2013; Villarreal-Cavazos etal., 2014). In these studies, the GLY, PRO, PHE andHIS were themost di-gestible amino acids. PBM included at 10% and 20% displayed reasonablelevels of all digestible amino acids, except LYS and HIS.
The higher AAAD values for the CGMwere recorded for LYS and GLY,similar to a previous stud (Liu et al., 2013) and a second study whichalso listed the highest digestibility coefficient to LYS followed by ARG(Yang et al., 2009). Other studies indicated ARG and HIS as the highestADC for CGM (Terrazas et al. 2010). In the present study, the CGMamino acid profile indicated low levels of the digestible amino acidsARG, LYS, ASP and GLY.
Similar to the FM, MBM exhibited the highest ADC values for ASPand GLM, however, these values were inferior to those reported by Liuet al. (2013), which showed PRO and GLM as the highest ADCs. On theother hand, a previous study observed GLY and MET to be the most di-gestible amino acids for MBM (Yang et al., 2009). The digestible aminoacid levels of the MBM evaluated in the present study were the lowestamong all ingredients, except for ALA, ARG and GLY.
The HFM showed the lowest AA ADC of this study. ALA and HIS werethemost digestible amino acids, similar to a study that also reported thehighest ADC for HIS followed byMET and PHE (Villarreal-Cavazos et al.,2014). HFMwas the poorest source of digestible MET among the ingre-dients assessed in the present study.
Undercooking or overheating of the PBM and HFM, as suggested bythe higher and lower moisture levels of these ingredients in the presentstudy, combinedwith keratin from the feet and feathers, which containsstrong disulphide bonding, may account for the low amino acid digest-ibility as previously reported for these ingredients (Eissler and Firman,1996; Hertrampf and Piedad-Pascual, 2000, NRA, 2008).
4.5. Comments on methodology
Although the consistency of the results in the present study allowsthe comparison with previous studies, several aspects of the methodol-ogy warrant further discussion on the limitations of the replacementmethod for determining in vivo digestibility of ingredients. Factorsthat may affect digestibility values include: i. rearing system and envi-ronment, ii. ingredient source and processing; iii. feed formulation, ho-mogeneity and processing, iv. feed and feces leaching, v. feces samplingand processing, vi. interactions amongdiet components vii. endogenouslosses, viii. analytical error, and ix. calculation of digestibility coefficients(Tacon, 1996; D'Abramo and Castell, 1997; Smith and Tabrett, 2004;Bureau et al., 1999; Bureau & Hua, 2006; Glencross et al., 2007;Carvalho et al., 2013; Irvin et al., 2015).
As the digestibility of ingredients is calculated, the formula leads to aresult of the interaction among the test ingredient and the other dietarycomponents. In addition to this effect, the increased variationwithin theingredient ADCwhen compared to the variation in the test diets is also aresult of the indirect calculation of ingredient ADC.
Based on the ADC of the test diets, ingredients can be separated intwo groups: Positive Nutritive Value (PNV),which contributed positive-ly to the formulation of the reference diet, so test diet ADCs are higherthan the reference diet ADCs and increase with the inclusion level. Thehigher ADC of the test diet resulted in a higher test ingredient ADC.FM and SPC are in this group.
The second group:Negative Nutritive Value (NNV), ingredient inclu-sion causes a negative effect, hence test diet ADCs are inferior to the ref-erence diet ADC. In this group, a bias in the formula at the higherinclusion levels compensates for a decline of the test diet ADC and in-creases the ingredient ADC, as observed for the CGM and for HFM20to HFM30. If the reduction in test diet ADC is too high, the compensation
Please cite this article as: Carvalho, R.A.P.L.F., et al., Apparent digestibilitythree levels in diets for juvenile wh..., Aquaculture (2016), http://dx.doi.o
is not enough to increase the ingredient ADC, as observed in PBM20 toPBM30 and HFM10 to HFM20. A different reference diet, possibly lessdigestible or with few ingredients, as adopted by Akiyama et al.(1989), may contribute to the evaluation of the digestibility ofingredients.
This effect reinforces the need to evaluate the digestibility of ingredi-ents at different inclusion levels and analyze the behavior of the ADC tocomprehend its nutritional value in the formulation. As an example,HFM at the smallest inclusion level seemed to provide the most repre-sentative value, as the ADC was not compensated by the formula. Thisassumption can be applied to all NNV ingredients.
This suggests that any change of the proportion in the ADC referencediet: ADC test diet caused by different reasons, such as the interaction ofingredients and digestibility of the diets, or other experimental errors,may directly affect the estimation of ingredient ADC. Differences in ref-erence diet formulations can also directly affect ingredient and nutrientdigestibility (NRC, 2011), or indirectly as recently shown with barra-mundi fed with diets with different polysaccharides that may interactwith other dietary nutrients, ultimately affecting digestibility of thediet (Irvin et al., 2015).
Until the variation in the nutrient content and digestibility is com-monplace with the most practical feed ingredients, quality control re-mains necessary for manufacturing of nutritionally consistent aquaticfeeds. The determination of in vivo nutrient digestibility in individualfeed ingredients by conventional replacement into a reference dietmay not be as precise as required for assessing dietary net nutrient con-tribution in some ingredients. Rapid methods based on near infrared(NIR) spectroscopy and in vitro digestion may complement in vivo out-puts and provide further background for decisions in feed formulationand manufacturing.
5. Conclusion
The best growth rates corresponded to the shrimp fed with the testdiets with FM and SPC at a decreasing inclusion order followed by thebyproducts HFM, MBM, PBM and CGM at an increasing inclusion order.
Compared to the test diets, the effects of the protein sources and in-clusion levels on the apparent digestibility coefficients of the ingredi-ents were more pronounced and also resulted in wider standarddeviations.
The calculated apparent digestibility coefficients (ADC) of the testingredients were significantly affected by the ingredient type and theinclusion level, except for the ACPD. The highest apparent ingredient di-gestibility coefficients were recorded for FM, SPC, PBM and MBM at the20% inclusion level and CGM at the 30% inclusion level.
The apparent amino acid digestibility (AAAD) recorded for the in-gredients evaluated in the present study was generally consistent withpreviously reported values for the L. vannamei independent of the die-tary inclusion level presently tested. The most digestible amino acidfor a certain ingredient, however, varied among most of the studies,which may reflect the diverse nature of the byproducts.
The in vivo method to determine the digestibility of ingredients foraquatic animals is subjected to different factors affecting its accuracy.Further studies should explore the interactive effects of different formu-lations to enhance knowledge about ingredients and produce reliableinformation for feed manufacturers to improve nutrient assimilationand animal performance.
Disclosure statement
The authors declare that there is no conflict of interest including anyfinancial, personal or other relationship with other people or organiza-tions within three (3) years of beginning the work that could inappro-priately influence (bias) their work as this work was supported byofficial funding agencies of the Brazilian government and the other con-tributors provided comments and contacts.
of protein, energy and amino acids of six protein sources included atrg/10.1016/j.aquaculture.2016.09.010
11R.A.P.L.F. Carvalho et al. / Aquaculture 465 (2016) xxx–xxx
Contributors
Rodrigo A.P.L.F. de Carvalho – participated in the design, conductedthe research and article preparation.
Ricardo Haruo Ota – technical support in the shrimp trials.Vivian Kadry – technical support in the shrimp trials.Albert G.J. Tacon - participated in the design of the research and ar-
ticle preparation.Daniel Lemos - provided funding, participated in the design of the
research and article preparation.All authors reviewed and approved the final article.
Role of the funding source
1. Fundação de Amparo à Pesquisa do Estado de São Paulo (FAPESP) –provided a fellowship to a graduate technical assistant and resourcesfor acquiring equipments and materials for the trial system.
2. Conselho Nacional de Desenvolvimento Científico e Tecnológico(CNPq) - provided a fellowship to the first author and resources foracquiring equipments and materials for the recirculating system.
3. Instituto Oceanográfico da Universidade de São Paulo (IO/USP) –provided supporting staff and resources for the logistics during theresearch.
4. Guabi Nutrição e Saúde Animal S.A. – donated ingredientes and per-formed chemical analysis of the ingredientes, feed and feces samples.
These funding sources did not play any role in the study design; col-lection, analysis or interpretation of data; in the writing of the report;nor in the decision to submit the article for publication.
Acknowledgements
We gratefully thank the Conselho Nacional de DesenvolvimentoCientífico e Tecnológico (CNPq) for the fellowship provided for thefirst author. Fundação de Amparo à Pesquisa do Estado de São Paulo(FAPESP) (07/07051-9) for the grant that made possible the needed in-vestments for this study. The support of Instituto Oceanográfico daUniversidade de São Paulo (IOUSP) in providing the needed structureand resources is appreciated. We thank Camila Andrade, Fábio Matsueand Fanny Yasumaru for their valuable help during the trials. Dr. AlbertoNunes and Hassan Sabry for manufacturing of the feeds. João ManoelAlves fromGuabi for the technical support, for donating the ingredientsand sponsoring the analysis. Leandro Bruzeguez and André Viana fromPoli-Nutri Alimentos S.A. for the incentive and for donating the ingredi-ents. The assistance of LABTEC, IZ and Central Analitica of USP in chem-ical analysis. Francisco Olbrich and ABCC for all the incentive for thisstudy. DSM for the premix and IMCOPA for the soy protein concentratedonations. We thank Ana Carolina from AQUATEC for donating the postlarvae. The authors thank two anonymous reviewers for their helpfulcomments and Dallas Lee Flickinger for review the text.
Appendix A. Supplementary data
Supplementary data to this article can be found online at http://dx.doi.org/10.1016/j.aquaculture.2016.09.010.
References
Akiyama, D.M., Coelho, S.R., Lawrence, A.L., Robison, E.H., 1989. Apparent digestibility offeedstuffs by the marine shrimp Penaeus vannamei Boone. Nippon Suisan Gakkaishi55, 91–98.
Amaya, E.K., Davis, A., Rouse, D.B., 2007. Replacement of fishmeal in practical diets for thepacific white shrimp (Litopenaeus vannamei) reared under pond conditions. Aqua-culture 262, 393–401.
AOAC - Association of Official Analytical Chemists, 1995. Official Methods of Analysis.16th edition. AOAC International, Arlington, VA, USA.
Brumano, G., Gomes, P.C., Rostagno, H.S., Albino, L.T., Schmidt, M., Generoso, R.A.R., 2006.Aminoácidos digestíveis verdadeiros de alimentos protéicos determinados em galoscecectomizados. R. Bras. Zootec. 35, 2290–2296.
Please cite this article as: Carvalho, R.A.P.L.F., et al., Apparent digestibilitythree levels in diets for juvenile wh..., Aquaculture (2016), http://dx.doi.o
Brunson, J.F., Romaire, R.P., Reigh, R.C., 1997. Apparent digestibility of selected ingredientsin diets for white shrimp Penaeus setiferus L. Aquac. Nutr. 3, 9–16.
Bureau, D.P., Hua, K., 2006. Letter to the editor of Aquaculture. Aquaculture 252, 103–105.Bureau, D.P., Harris, A.M., Cho, C.Y., 1999. Apparent digestibility of rendered animal pro-
tein ingredients for rainbow trout (Oncorhynchus mykiss). Aquaculture 180, 345–358.Caires, C.M., 2009. Dietas de frango de corte com subprodutos de origem animal e
suplementação de creatina. Dissertação de Mestrado. Universidade Federal deUberlândia, Faculdade de Medicina Veterinária, Uberlândia, Minas Gerais 48p.
Carvalho, R.A.P.L.F., Lemos, D., Tacon, A.G.J., 2013. Performance of single-drain and dual-drain tanks in terms of water velocity profile and solids flushing for in vivo digestibil-ity studies in juvenile shrimp. Aquac. Eng. 57, 9–17.
Cheng, Z.J., Behnke, K.C., Dominy, W.G., 2002. Effect of Feather Meal on Growth and BodyComposition of the Juvenile Pacific White Shrimp, Litopenaeus vannamei. J. Appl.Aquac. 12, 57–69.
Cho, C.Y., Slinger, S.J., Bayley, H.S., 1982. Bioenergetics of salmonid fishes: energy intake,expenditure and productivity. Comp. Biochem. Physiol. 73, 25–41.
Cruz-Suárez, L.E., Nieto-López, M., Guajardo-Barbosa, C., Tapia-Salazar, M., Scholz, U.,Ricque-Marie, D., 2007. Replacement of fish meal with poultry by-product meal inpractical diets for Litopenaeus vannamei, and digestibility of the tested ingredientsand diets. Aquaculture 272, 466–476.
Cruz-Suárez, L.E., Tapia-Salazar, M., Villarreal-Cavazos, D., Beltran-Rocha, J., Nieto-López,M.G., Lemme, A., Ricque-Marie, D., 2009. Apparent dry matter, energy, protein andamino acid digestibility of four soybean ingredients in white shrimp Litopenaeusvannamei juveniles. Aquaculture 292, 87–94.
D'Abramo, L.R., Castell, J.D., 1997. Research Methodology. In: D'Abramo, L.R., Conklin, D.E.,Akiyama, D.M. (Eds.), Crustacean Nutrition. Advances in World Aquaculture. WorldAquaculture Society, Baton Rouge, LA, pp. 3–25.
Davis, A.D., Arnold, C.R., 2000. Replacement of fish meal in practical diets for the Pacificwhite shrimp, Litopenaeus vannamei. Aquaculture 185, 291–298.
Divakaran, S., Velasco, M., Beyer, E., Forster, I., Tacon, A., 2000. Soybean meal apparent di-gestibility for Litopenaeus vannamei, including a critique of methodology. In: Cruz-Suárez, L.E., Ricque-Marie, D., Tapia-Salazar, M., Olvera-Novoa, M.A., Civera-Cerecedo, R. (Eds.), Avances en Nutrición Acuícola V. Memorias del V SimposiumInternacional de Nutrición Acuícola. Mérida, Yucatán, México, pp. 267–276 19–22de Noviembre, 2000.
Eissler, C., Firman, J.D., 1996. Effects of hydrolyzed feather meal on the performance ofturkeys. J. Appl. Poult. Res. 5, 246–253.
Forster, I.P., Dominy, W., Obaldo, L., Tacon, A.G.J., 2003. Rendered meat and bonemeals asingredients of diets for shrimp Litopenaeus vannamei (Boone, 1931). Aquaculture 219,655–670.
Gatlin, D.M., Barrows, F.T., Brown, P., Dabrowsky, K., Gaylord, G., Hardy, R.W., Herman, E.,Hu, G., Krogdahl, A., Nelson, R., Overturf, K., Rust, M., Sealey, W., Skonberg, D., Souza,E.J., Stone, D., Wilson, R., Wurtele, E., 2007. Expanding the utilization of sustainableplant products in aquafeeds: a review. Aquac. Res. 38, 551–579.
Glencross, B.D., Booth, M., Allan, G.L., 2007. A feed is only as good as its ingredients: a re-view of ingredient evaluation strategies for aquaculture feeds. Aquac. Nutr. 13, 17–34.
Hardy, R.W., 2006. Worldwide Fish Meal Production Outlook and The Use of AlternativeProtein Meals for Aquaculture. In: Cruz-Suárez, L.E., Ricque-Marie, D., Tapia-Salazar,M., Nieto-López, M.G., Villarreal-Cavazos, D.A., Puello-Cruz, A.C., García-Ortega, A.(Eds.), Avances en Nutrición Acuícola VIII. VIII Simposium Internacional de NutriciónAcuicola. Universidad Autónoma de Nuevo León, Monterrey, Nuevo León, México,pp. 410–419 15–17 Noviembre.
Hertrampf, J., Piedad-Pascual, F., 2000. Handbook on Ingredients for Aquaculture Feeds.Kluwer Academic Publishers, Dordrecht, The Netherlands 573 pp.
Irvin, S., Blyth, D., Bourne, N., Glencross, B., 2015. A study of the discrete and interactiveeffects of different polysaccharides on the digestibility of diets fed to barramundi(Lates calcarifer). Aquac. Nutr. http://dx.doi.org/10.1111/anu.12321.
Kuhn, D.D., Smith, S.A., Boardman, G.D., Angier, M.W., Marsh, L., Flick, G.J., 2010. Chronictoxicity of nitrate to Pacific white shrimp, Litopenaeus vannamei: impacts on survival,growth, antennae length, and pathology. Aquaculture 309, 109–114.
Kwanyuen, P., Burton, J.W., 2010. A modified amino acid analysis using PITC derivatiza-tion for soybeans with accurate determination of cysteine and half-cystine. J. Am.Oil Chem. Soc. 87, 127–132.
Lee, P.G., Lawrence, A.L., 1997. Digestibility. In: D'Abramo, L.R., Conklin, D.E., Akiyama,D.M. (Eds.), Crustacean Nutrition. Advances in World Aquaculture. World Aquacul-ture Society, Baton Rouge, LA, pp. 194–260.
Lin, Y.-C., Chen, J.-C., 2003. Acute toxicity of nitrite on Litopenaeus vannamei (Boone) juve-niles at different salinity levels. Aquaculture 224, 193–201.
Lin, Y.-C., Chen, J.-C., 2001. Acute toxicity of ammonia on Litopenaeus vannamei Boone ju-veniles at different salinity levels. J. Exp. Mar. Biol. Ecol. 259, 109–119.
Liu, X.-H., Ye, J.-D., Kong, J.-H., Wang, K., Wang, A.-L., 2013. Apparent Digestibility of 12Protein-Origin Ingredients for Pacific White Shrimp Litopenaeus vannamei. N. Am.J. Aquac. 75, 90–98.
Luo, L., Wang, J., Pan, Q., Xue, M., Wang, Y., Wu, X., Li, P., 2012. Apparent digestibility co-efficient of poultry by-product meal (PBM) in diets of Penaeus monodon (Fabricius)and Litopenaeus vannamei (Boone), and replacement of fishmeal with PBM in dietsof P. monodon. Aquac. Res. 43, 1223–1231.
Mendoza, R., De Dios, A., Vazquez, C., Cruz, E., Ricque, D., Aguilera, C., Montemayor, J.,2001. Fishmeal replacement with feather-enzymatic hydrolyzates co-extruded withsoya-bean meal in practical diets for the Pacific white shrimp (Litopenaeusvannamei). Aquac. Nutr. 7, 143–151.
Molina-Poveda, C., Lucas, M., Jover, M., 2015. Utilization of corn gluten meal as a proteinsource in the diet of white shrimp Litopenaeus vannamei. Aquac. Nutr. 21, 824–834.
NRA. 2008. Pocket information manual a buyer's guide to rendered products. NationalRenderers Association. 44p. Available at http://assets.nationalrenderers.org/pocket_information_manual.pdf Acessed on June 24th of 2016.
of protein, energy and amino acids of six protein sources included atrg/10.1016/j.aquaculture.2016.09.010
12 R.A.P.L.F. Carvalho et al. / Aquaculture 465 (2016) xxx–xxx
NRC – National Research Council, 2011. Nutrient Requirements of Fish and Shrimp. TheNational Academies Press, Washington, DC 376 pp.
Paripatananont, T., Boonyaratpalin, M., Pengseng, P., Chotipuntu, P., 2001. Substitution ofsoy protein concentrate for fishmeal in diets of tiger shrimp Penaeus monodon.Aquac. Res. 32, 369–374.
Ponce-Palafox, J., Martinez-Palacios, C.A., Ross, L.G., 1997. The effects of salinity and tem-perature on the growth and survival rates of juvenile white shrimp, Penaeusvannamei Boone, 1931. Aquaculture 157, 107–115.
Rostagno, H.S., Albino, L.F.T., Donzele, J.L., Gomes, P.C., Oliveira, R.F., Lopes, D.C., Ferreira,A.S., Barreto, S.L.T., Euclides, R.F., 2011. Tabelas brasileiras para Aves e Suínos:Composição de alimentos e exigências nutricionais. Viçosa, UFV 252p.
Seidman, E.R., Lawrence, A.L., 1985. Growth, feed digestibility, and proximate body com-position of juvenile Penaeus vannamei and Penaeus monodon grown at different dis-solved oxygen levels. J. World Mar. Soc. 16, 333–346.
Siccardi, A.J., Lawrence, A.L., Gatlin, D.M., Fox, J.M., Castille, F.L., Perez-Velazquez, M.,González-Félix, M.L., 2006. Digestibilidad aparente de energía, proteína y materialseca de ingredientes utilizados en alimentos balanceados para el camarón blancodel Pacífico Litopenaeus vannamei. In: Cruz-Suárez, L.E., Ricque-Marie, D., Tapia-Salazar, M., Nieto-López, M.G., Villarreal-Cavazos, D.A., Puello-Cruz, A.C., García-Ortega, A. (Eds.), Avances en Nutrición Acuícola VIII. Universidad Autónoma deNuevo León, Monterrey, Mexico, pp. 213–237 15–17 de Noviembre 2006.
Smith, D.M., Tabrett, S.J., 2004. Accurate measurement of in vivo digestibility of shrimpfeeds. Aquaculture 232, 563–580.
Smith, D.M., Allan, G.L., Williams, K.C., Barlow, C., 2000. Fishmeal replacement research forshrimp feed in Australia. In: Cruz-Suárez, L.E., Ricque-Marie, D., Tapia-Salazar, M.,Olvera-Novoa, M.A., Civera-Cerecedo, R. (Eds.), Avances en Nutrición Acuícola V.Memorias del V Simposium Internacional de Nutrición Acuícola, pp. 277–286 19–22 de Noviembre, 2000. Mérida, Yucatán, México.
Please cite this article as: Carvalho, R.A.P.L.F., et al., Apparent digestibilitythree levels in diets for juvenile wh..., Aquaculture (2016), http://dx.doi.o
Suárez, J.A., Gaxiola, G., Mendoza, R., Cadavid, S., Garcia, G., Alanis, G., Suárez, A., Faillace, J.,Cuzon, G., 2009. Substitution of fish meal with plant protein sources and energy bud-get for white shrimp Litopenaeus vannamei (Boone, 1931). Aquaculture 289,118–123.
Tacon, A.G.J., 1996. Nutritional studies in crustaceans and the problems of applying re-search findings to practical farming systems. Aquac. Nutr. 1, 165–174.
Tacon, A.G.J., Metian, M., Hasan, M.R., 2009. Feed ingredients and fertilizers for farmedaquatic animals: sources and composition. FAO Fisheries and Aquaculture TechnicalPaper 540. Food and Agriculture. Organization of the United Nations, Rome 209p.
Terrazas, M., Civera, R., Ibarra, L., Goytortúa, E., 2010. Coeficientes de utilización digestivaaparente de materia seca, proteína y aminoácidos esenciales de ingredientesterrestres para el camarón del Pacífico Litopenaeus vannamei (Decapoda:Penaeidae). Rev. Biol. Trop. 58, 1561–1576.
Terrazas-Fierro, M., Civera-Cerecedo, R., Ibarra-Martínez, L., Goytortúa-Bores, E., Herrera-Andrade, M., Reyes-Becerra, A., 2010. Apparent digestibility of dry matter, protein,and essential amino acid in marine feedstuffs for juvenile whiteleg shrimpLitopenaeus vannamei. Aquaculture 308, 166–173.
Villarreal-Cavazos, D.A., Ricque-Marie, D., Peña-Rodríguez, A., Nieto-López, M., Tapia-Salazar, M., Lemme, A., Gamboa-Deçgado, J., Cruz-Suárez, L.E., 2014. Apparent digest-ibility of dry matter, crude protein, and aminoacids of six rendered by-products in ju-venile Litopenaeus vannamei. Ciencias Marinas 40, 163–172.
Yang, Q., Zhou, X., Zhou, C., Tan, B., Chi, S., Dong, X., 2009. Apparent digestibility of select-ed feed ingredients for white shrimp Litopenaeus vannamei. Boone. Aquac. Res. 41,78–86.
of protein, energy and amino acids of six protein sources included atrg/10.1016/j.aquaculture.2016.09.010