Carbohydrates and Carbohydrate metabolism (Chemistry of Carbohydrate )

International Journal of Fisheries and Aquaculture Research
Vol.1, No.1, pp.1-16, March 2016
___Published by European Centre for Research Training and Development UK (www.eajournals.org)
1
DIETARY SORGHUM STARCH INFLUENCES GROWTH PERFORMANCE,
APPARENT DIGESTIBILITY COEFFICIENT AND SOME HEPATIC ENZYME
ACTIVITIES OF CARBOHYDRATE METABOLISM IN HYBRID RED
TILAPIA (OREOCHROMIS MOSSAMBICUS × O. NILOTICUS) FINGERLINGS
AbdelMoniem. M. Yones*, Atallah. A. Metwalli
National Institute of Oceanography and Fisheries (NIOF), Shakshouk Aquatic Research
Station, El -Fayoum, Egypt.
ABSTRACT: A 120-day feeding trial was conducted to investigate the effects of dietary
sorghum starch on growth performance, feed utilization, apparent digestibility coefficient
(ADC) and some hepatic enzyme activities regulating glycolytic and gluconeogenic metabolic
pathways of fingerlings hybrid red tilapia (Oreochromis mossambicus × O. niloticus) with
initial body weight of 10.9±0.2 g. Five isonitrogenous and isolipidic diets containing graded
levels of sorghum starch (15, 20, 25, 30 and 35%) were formulated. The results demonstrated
that weight gain (WG), specific growth rate (SGR), protein efficiency ratio (PER) and net
protein utilization (NPU) values increased with increasing dietary sorghum starch up to 30%
. Hepatosomatic index, plasma glucose, triglycerides, liver glycogen and liver lipid
concentration of fish significantly increased with increasing dietary sorghum starch level. ADC
of starch decreased significantly with increasing sorghum starch level over 30%, However,
whole body compositions, and ADC of protein and lipid showed no significant differences.
Dietary sorghum starch supplements tended to enhance gluconokinase and pyruvate kinase
activities of the liver, but insignificant differences were observed in activities of hexokinase,
phosphofructokinase-1, fructose-1, 6-bisphosphatase, and glucose-6-phosphatase in the liver
for all dietary treatments. Based on WG and FCR results, the appropriate dietary sorghum
starch supplementations of fingerlings hybrid red tilapia (Oreochromis mossambicus ×
O.niloticus) can be incorporated up to 30% of diet.
KEYWORDS: Hybrid Red Tilapia, Growth Performance, Whole Body Composition,
Digestibility Coefficient, Sorghum Starch, Hepatic Enzyme Activities.
INTRODUCTION
Carbohydrates are the most economical source of energy available in abundant
quantities at low prices and have a protein-sparing effect in some low-protein diets
and for binding other ingredients [1,2]. Feed supply and feed costs are amongst the
greatest challenges for the development of sustainable fish farming. Therefore, the
aquaculture industry is searching for feed ingredients that can be used to formulate
cheap fish feed [2]. It was estimated that fish meal and fish oil contribute 75% of
the protein and 35% of the energy in aquaculture feed [3]. It has been estimated that
the cost of feed constitutes 74% of total costs for farm-made feeds and 92% for
manufactured pellet feeds [4]. The cost of aquaculture production can be reduced by
efficient feed formulation [5].
Dietary carbohydrate inclusion in several fish species appears to produce positive
effects on growth and digestibility [6,7,8]. However, using the appropriate level of
International Journal of Fisheries and Aquaculture Research
Vol.1, No.1, pp.1-16, March 2016
___Published by European Centre for Research Training and Development UK (www.eajournals.org)
2
carbohydrates in aquafeeds is of great importance, because if the appropriate
amount of carbohydrates is not provided, this may have negative effects on nutrient
utilization, growth, metabolism and health [9,10]. Several studies have reported that
an increase in dietary carbohydrate content improves metabolism, and growth in
tilapia [11,12,13]. Improved growth was observed in tilapia fed diets with 10-40%
inclusion of starch [14,15].
In most aquaculture feeds, complex carbohydrates such as starch have been
introduced as the principal source of carbohydrate due to the fact that dietary
monosaccharides are rapidly absorbed [16] but poorly utilized [17]. There are still
many inter-specific differences in the utilization and metabolism of dietary CHO by
fish. For example, there is a strong relationship between the natural trophic level of
fish species and their ability to utilize CHO, with herbivorous and omnivorous
species usually better at digesting and utilizing CHO than carnivorous species
[18,19,20,21]. Omnivorous fish species such as Nile tilapia and common carp,
which feed at low trophic levels, can efficiently utilize high dietary levels of
carbohydrates (30-50%) in comparison to the high trophic level carnivorous fish
species [18,21,22,23]. In addition, digestibility of CHO by different species appears
to be dependent on the complexity of the CHO as well as its dietary content, with
simpler CHO being more easily digested while digestibility of CHO generally
decreases as dietary content increases [20,24,25,26]. Knowledge of the optimum
inclusion of dietary carbohydrate is indispensable for improving growth
performance of fish and reducing the amount of nitrogen waste and diet costs [27].
However, feeding excessive dietary carbohydrates of fish may have harmful effects
on growth, feed efficiency, physiological dysfunction, and fat deposition by
stimulating lipogenic enzymes [28,29].
Processing CHO by cooking-extrusion has been found to increase digestibility of
CHO in most fish species, largely by breaking down the molecular structure of
starch and increasing the degree of gelatinization [24]. Digestion is thought to be the
primary limiting step in the utilization of starch for growth [20]. The inability of
fish to utilize digested CHO is reflected in reduced growth, inferior feed conversion
ratio (FCR) and lower protein retention efficiency. Excessive dietary CHO may also
decrease the palatability of feeds leading to reduced feed intake. However, fish
which can tolerate and utilize high levels of CHO in their aqua-feeds allow feed
manufacturers much greater flexibility to explore reductions in dietary protein and
lipid content of complete feeds and therefore feed cost.
The digestion and absorption of nutrients are mostly dependent on enzyme activities
involved in breakdown and assimilation of food [30]. Therefore, analysis of enzyme
activities is a convenient and reliable technique that can provide comprehensive
information relating to digestive physiology and nutritional conditions in the fish
[31]. Digestible efficiency of digestible and non-digestible carbohydrates varies in
herbivorous and carnivorous fish species [26,32]. The herbivorous fish species can
utilize part of the non-starch carbohydrates in their diet due to symbiosis with the
gut microbiota. However, most fish species are unable to utilize non-starch
carbohydrates properly because they lack the adequate gut microbiota in their gut
[26].

International Journal of Fisheries and Aquaculture Research
Vol.1, No.1, pp.1-16, March 2016
___Published by European Centre for Research Training and Development UK (www.eajournals.org)
3
The optimal dietary carbohydrate level of hybrid red tilapia (Oreochromis
mossambicus × O. niloticus) has not been reported yet. Therefore, this study was
designed to evaluate the effect of dietary sorghum starch on the growth, feed
utilization, body composition, apparent digestibility, and hepatic enzyme activities
of carbohydrate metabolism on fingerlings hybrid red tilapia (Oreochromis
mossambicus × O. niloticus).
MATERIALS AND METHODS
Experimental Diets
Five isonitrogenous and isolipidic experimental diets were formulated varying only
in their dietary sorghum starch level (15, 20, 25.30 and 35%) (Table1). The dietary
30% protein and 10% lipid level was selected because it is recommended to cover
the requirements of this specie [20]. Fish meal and casein were used as protein
sources where, fish oil and sunflower oil were used as lipid sources. Chromic oxide
(Cr2O3) was used as an inert marker to determine apparent digestibility of nutrients.
Ingredients were ground into fine powder through a 150-μmmesh before pelleting
and an appropriate amount of water was added to produce stiff dough. The dough
was pelleted using California pelleting machine with 2mm diameter.
Table 1. Ingredients and proximate composition of the experimental diets (% DM basis).
Ingredients Sorghum level
15% 20% 25% 30% 35%
Fish meal 10 10 10 10 10
Poultry- by product meal 15 15 15 15 15
Casein1 26 15 15 15 15 15
Sorghum starch2 15 20 25 30 35
Microcrystalline cellulose 34 29 24 19 14
Oil mix3 6 6 6 6 6
Choline chloride 0.5 0.5 0.5 0.5 0.5
Ascorbyl-2-
monophosphate
0.4 0.4 0.4 0.4 0.4
Vitamin. mineral mix4 2.0 2.0 2.0 2.0 2.0
Yttrium oxide 0.1 0.1 0.1 0.1 0.1
Sodium alginate 2.0 2.0 2.0 2.0 2.0
Proximate analysis
Dry matter 91.2 91.4 91.5 91.6 91.4
Crude protein 30.0 30.4 30.8 31.2 31.6
Crude lipid 10.2 10.1 10.2 10.1 10.1
Starch 15.0 19.9 25.1 30.2 34.9
Crude fiber 4.5 4.6 4.8 5.0 5.2
Ash 12.6 12.2 12.4 12.5 12.4
Tannin5 0.25 0.3 0.32 0.36 0.42
Gross energy(MJ kg-1 diet)6 13.86 14.77 15.82 16.77 17.7
ME (MJ kg-1diet)7 11.51 12.26 13.14 13.92 14.7

International Journal of Fisheries and Aquaculture Research
Vol.1, No.1, pp.1-16, March 2016
___Published by European Centre for Research Training and Development UK (www.eajournals.org)
4
1- Casein: crude protein, 93.1%; crude lipid, 1.5% (Gannanzhou Kerui Dairy
Products Development Co., Ltd., Gansu, China).
2- International Starch Institute, Denmark.
3- Oil mixture: fish oil and sunflower oil were mixed as a ratio of 1:1.
4- Vitamin,mineral premix (g/kg of mixture):L-ascorbic acid monophosphate,
120.0;L-α-tocopherylacetate,20.0;thiamin hydrochloride,4.0;riboflavin,9.0;
pyridoxine hydrochloride,4.0;niacin,36.0;D-pantothenic acid hemicalcium
salt,14.5;myoinositol,40.0;D-biotin,0.3;folic acid,0.8;menadione,0.2;retinyl
acetate,1.0;cholecalciferol,0.05;cyanocobalamin,0.01;MgSO4⋅7H2O,80.0;Na
H2PO4⋅2H2O,370.0;KCl,130.0;FeSO4⋅7H2O,40.0;ZnSO4⋅7H2O,20.0;Ca-
lactate,356.5;CuSO4,0.2;AlCl3⋅6H2O,0.15;Na2Se2O3,0.01;MnSO4⋅H2O,
2.0; CoCl2⋅6H2O, 1.0.
5- Tannin = percent tannin on a catechin equivalent basis.
6- Gross energy (MJ Kg-1 diet) was calculated by using the following calorific
values:23.9, 39.8 and 17.6 KJ g-1 diet for protein, ether extract and nitrogen
free extract, respectively[33].
7- The metabolizable energy(MJ Kg-1 diet) of the experimental diets were
calculated as 18.9, 35.7 and 14.7 KJ g-1 diet for protein, lipid and nitrogen free
extract, respectively [34].
Fish and Experimental Design
Hybrid red tilapia (Oreochromis mossambicus×O. niloticus) fingerlings were
obtained from the Kilo 21 hatchery belonging to General Authority for fish resource
development, Alexandria road, Egypt. Fish were acclimated to the system and fed
with the experimental diet twice daily for 2 weeks before the trial. After 24 hour of
starvation, 1500 fish (initial body weight=10.9±0.2g) were randomly selected from
the acclimatized fish and allocated into 15 circular cement pound 2m3 in equal
number (n=100). During the experiment, fish were hand-fed the experimental diets
to apparent satiation twice daily (10:00 p.m. and 4:00 a.m.) and weighting every
two weeks to adjust the amount of feed consumption. The system contained two
water pumps and upstream sandy filter units at a point between the water source
(Lake Qaroun) and tanks. Each pump was drowning the water to the storage tanks
and forced it through polyvinyl chloride (PVC) tubes into the rearing tanks in open
system. The experimental period lasted 120 days after start. Physicochemical
characteristics of water tanks were examined every week according to [35].
Sample Collection and Chemical Analysis
Before the experiment, 20 fish from the same population were randomly selected for
determination of initial whole-body proximate composition. At the end of the
feeding trial, fish were starved for 24 hours prior to sampling. Fish in each tank
were weighed and counted for information on growth, feed efficiency, and survival.
Twenty fish from each tank were randomly selected and anesthetized with tricaine
methanesulfonate (MS-222, 50 mg/L) for individual weight measurements. Blood

International Journal of Fisheries and Aquaculture Research
Vol.1, No.1, pp.1-16, March 2016
___Published by European Centre for Research Training and Development UK (www.eajournals.org)
5
was collected from the caudal vein of individuals using 2.5-mL sterile syringes.
Plasma samples were collected after centrifugation at 3000g for 20min at 4 ºC and
stored at-80 ºC prior to biochemical analysis. Then, the fish were quickly dissected
for organ and tissue sampling. Liver and dorsal muscles were stored at-80 ºC
immediately before further analysis. Finally, twenty fish per tank were randomly
collected for determination of final whole-body proximate composition. After the
sample collection described above, the remaining fish were fed with the same diets
after adding 0.5% chromic oxide (Cr2O3) to determine the apparent digestibility
coefficients (ADCs) for dry matter, crude protein, crude lipid, and starch. Fecal
collection was conducted 5–6 h after the first meal at 10:00 p.m. Fish from each
replicate were anesthetized with MS-222 (50mg/L) and manually stripped of feces
by applying gentle pressure in the anal area according to the method described by
[36]. Feces were collected once a fortnight until sufficient dried feces had been
collected for analysis. Pooled feces from each replicate were freeze-dried and stored
at-20 ºC until analysis of nutrient contents. Analyses of ingredients, diets, fecal
samples, whole-body, and muscle composition were made following the usual
procedures [37]:dry matter was determined by drying samples in an oven at 105 ºC
until constant weight; crude protein was determined by measuring nitrogen (N×
6.25) after acid digestion using the Kjeldahl method; crude lipid was determined by
petroleum ether extraction using the Soxhlet method; ash was determined by
incineration in a muffle furnace at 550 C for 16 h; starch was determined using an
enzymatic method as described by [25]. Tannin content of sorghum starch was
determined using a modified version of [38], vanillin-Hcl assay. One gram of
sorghum starch was placed in a 50ml conical flask and 50ml of analytical grade
methanol was added. The flask was covered with a cork stopper, shaken thoroughly
every few minutes for 2hours and then left to stand at room temperature for an
additional 20h. Two ml of 2% vanillin: 4%Hcl were added to one of the test tube
and 5ml of 4% Hcl to other. The differences in two optical densities (the 4%Hcl
acting as the blank) was read on a Beckman spectrophotometer at 500nm, then
compared to catchin standard curve. Diets and feces chromic oxide were determined
using an inductively coupled plasma-atomic emission spectrophotometer (IRIS
Advantage [HR], Thermo Jarrell Ash, Woburn, MA, USA) after perchloric acid
digestion, triplicate analyses were conducted for each sample.
Enzyme activities
Liver samples were homogenized in four volumes of ice-cold 100mM Tris–HCl
buffer containing 0.1mM EDTA and 0.1% Triton X-100 (v/v), pH 7.8.
Homogenates were centrifuged (Kubota model 6900, Kubota Corporation, Tokyo,
Japan) at 30 000 g at 4°C for 30 min and the resultant supernatants divided in
aliquots and stored at -80°C for further enzyme assays. All enzyme activities were
performed at 25°C and absorbance read at 340nm in a micro plate reader
(ELx808TM, Bio-Tek Instruments, USA). Hexokinase (HK; EC 2.7.1.1) and
glucokinase (GK; EC 2.7.1.2) activities were measured as described by[23] using a
reaction mixture containing 50 mM imidazole–HCl buffer (pH 7.4), 2.5 mM ATP, 5
mM MgCl2, 0.4 mM NADP, 2 units mL1 G6PDH and 1 mM (HK) or 100 mM
(GK) glucose. Pyruvate kinase (PK; EC 2.7.1.40) activity was measured according
to [39] with a reaction mixture consisting of 50 mM imidazole–HCl buffer (pH 7.4),
5 mM MgCl2, 100 mM KCl, 0.15 mM NADH, 1 mM ADP, 2 units mL1 LDH and

International Journal of Fisheries and Aquaculture Research
Vol.1, No.1, pp.1-16, March 2016
___Published by European Centre for Research Training and Development UK (www.eajournals.org)
6
2 mM PEP. Fructose 1,6-bisphosphatase (FBPase; EC 3.1.3.11) activity was
measured as described by [40] using a reaction mixture consisting of 50 mM
imidazole– HCl buffer (pH 7.4), 5 mM MgCl2, 12 mM 2-mercaptoethanol, 0.5 mM
NADP, 2units mL1 G6PDH, 2 units mL1 PGI and 0.5 mM fructose 1,6-
bisphosphate. Glucose 6-phosphate dehydrogenase (G6PDH; EC 1.1.1.49) activity
was measured as described by[41,42], using a reaction mixture containing 50 mM
imidazole–HCl buffer (pH 7.4), 5 mM MgCl2, 2 mM NADP and 1mM glucose-6-
phosphate. The reaction mixture containined 50 mM imidazole–HCl buffer (pH
7.4), 5 mM MgCl2, 0.4 mM NADP and 2 mM L-malate. Protein concentration in
liver crude extracts was determined at 600 nm according to the [43] method using
bovine serum albumin as a standard. All enzyme activities were expressed as per
mg of hepatic soluble activity was defined as the amount of enzyme that catalyzed
the hydrolysis of 1 μmol of substrate per minute at assay temperature. Plasma
glucose and triacylglycerol concentration were determined using commercial kits
from Enzyline, Biomerieux, Linda-A-Velha, Portugal (ALAT/ GPT, ref. 63313;
ASAT/GOT, ref. 63213). Liver and muscle glycogen concentration were
determined at 620 nm using the anthrone reagent method [44].
Growth performance
The following growth performance parameters were calculated as follows:
- Specific growth rate (SGR%)=100×(Ln final weight-Ln initial weight)/ 120.
- Condition factor (CF g/cm-3) = (wet weight)/ (total length-3) ×100.
- Feed conversion (FCR) = (feed given per fish)/ (weight gain per fish).
- Protein efficiency ratio (PER)=(weight gain per fish)/(protein intake per fish).
- Net protein Utilization (NPU%)=100 (Final body protein-initial body protein/
protein intake).
- Hepatosomatic index (HIS %) = (liver weight) /(fish weight) ×100.
- ADC of dry matter (%) = 100 − (100 %Cr2O3in diet ∕ % Cr2O3in feces)
- ADC of nutrients (%) = 100 − (100 ×% nutrient in feces ∕ % nutrient in diet ×%
Cr2O3 in diet ∕ % Cr2O3in feces).
Statistical Analyses
The results are presented as means ± SE of three replications. All data were
subjected to one-way analysis of variance and tested. One way Analysis of Variance
(ANOVA) was applied to test the effect of different sorghum starch levels on
various growth parameters, nutrient utilization, chemical composition and hepatic
enzyme activity of experimental fish according to [45]. Duncan Multiple Range test
was used to detect the significant differences between the means of treatments [46].
All analysis were performed using SAS (version 6, 2004 SAS Institute, Cary, NC,
USA) [47].
International Journal of Fisheries and Aquaculture Research
Vol.1, No.1, pp.1-16, March 2016
___Published by European Centre for Research Training and Development UK (www.eajournals.org)
7
RESULTS
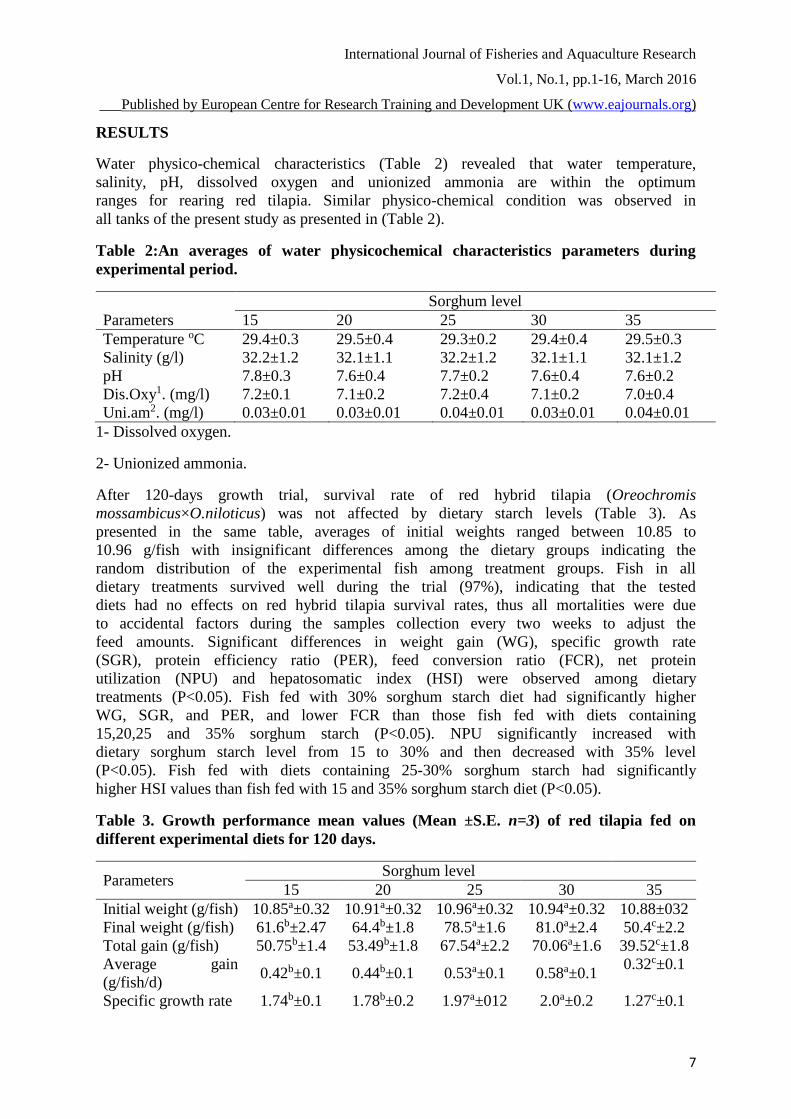
Water physico-chemical characteristics (Table 2) revealed that water temperature,
salinity, pH, dissolved oxygen and unionized ammonia are within the optimum
ranges for rearing red tilapia. Similar physico-chemical condition was observed in
all tanks of the present study as presented in (Table 2).
Table 2:An averages of water physicochemical characteristics parameters during
experimental period.
Sorghum level
Parameters 15 20 25 30 35
Temperature oC 29.4±0.3 29.5±0.4 29.3±0.2 29.4±0.4 29.5±0.3
Salinity (g/l) 32.2±1.2 32.1±1.1 32.2±1.2 32.1±1.1 32.1±1.2
pH 7.8±0.3 7.6±0.4 7.7±0.2 7.6±0.4 7.6±0.2
Dis.Oxy1. (mg/l) 7.2±0.1 7.1±0.2 7.2±0.4 7.1±0.2 7.0±0.4
Uni.am2. (mg/l) 0.03±0.01 0.03±0.01 0.04±0.01 0.03±0.01 0.04±0.01
1- Dissolved oxygen.
2- Unionized ammonia.
After 120-days growth trial, survival rate of red hybrid tilapia (Oreochromis
mossambicus×O.niloticus) was not affected by dietary starch levels (Table 3). As
presented in the same table, averages of initial weights ranged between 10.85 to
10.96 g/fish with insignificant differences among the dietary groups indicating the
random distribution of the experimental fish among treatment groups. Fish in all
dietary treatments survived well during the trial (97%), indicating that the tested
diets had no effects on red hybrid tilapia survival rates, thus all mortalities were due
to accidental factors during the samples collection every two weeks to adjust the
feed amounts. Significant differences in weight gain (WG), specific growth rate
(SGR), protein efficiency ratio (PER), feed conversion ratio (FCR), net protein
utilization (NPU) and hepatosomatic index (HSI) were observed among dietary
treatments (P<0.05). Fish fed with 30% sorghum starch diet had significantly higher
WG, SGR, and PER, and lower FCR than those fish fed with diets containing
15,20,25 and 35% sorghum starch (P<0.05). NPU significantly increased with
dietary sorghum starch level from 15 to 30% and then decreased with 35% level
(P<0.05). Fish fed with diets containing 25-30% sorghum starch had significantly
higher HSI values than fish fed with 15 and 35% sorghum starch diet (P<0.05).
Table 3. Growth performance mean values (Mean ±S.E. n=3) of red tilapia fed on
different experimental diets for 120 days.
Parameters Sorghum level
15 20 25 30 35
Initial weight (g/fish) 10.85a±0.32 10.91a±0.32 10.96a±0.32 10.94a±0.32 10.88±032
Final weight (g/fish) 61.6b±2.47 64.4b±1.8 78.5a±1.6 81.0a±2.4 50.4c±2.2
Total gain (g/fish) 50.75b±1.4 53.49b±1.8 67.54a±2.2 70.06a±1.6 39.52c±1.8
Average gain
(g/fish/d) 0.42b±0.1 0.44b±0.1 0.53a±0.1 0.58a±0.1
0.32c±0.1
Specific growth rate 1.74b±0.1 1.78b±0.2 1.97a±012 2.0a±0.2 1.27c±0.1

International Journal of Fisheries and Aquaculture Research
Vol.1, No.1, pp.1-16, March 2016
___Published by European Centre for Research Training and Development UK (www.eajournals.org)
8
Condition factor
(g/cm-3) 1.8b±0.2 1.9b±0.3 2.32a±0.3 2.4a±0.1
1.5 c±02
Survival rate % 97 97 97 97 97
Feed consumed (g/
fish)* 90.0 92.0 98.0 100.0
110
Feed conversion
ratio 1.8b±0.3 1.71b±0.1 1.42a±0.3 1.42a±0.2
2.78 c ±0.1
PER 1.87b±0.2 1.85b±0.1 2.23a±0.2 2.24a±0.1 1.13 c±0.2
NPU (%) 30.66b±2.4 29.77b±2.8 35.77a±3.2 36.16a±2.8 17.94c±1.8
HSI (%) 1.84b±0.1 1.76b±0.4 2.20a±0.2 2.32a±0.4 2.75 c±0.2
Means in the same row with different superscript letters are significantly different (P<0.05).
*Non-consumed portion of food was collected, dried and deducted from total given ration.
No significant differences were observed in whole body dry matter, crude protein,
crude lipid and ash among dietary treatments (Table 4).
Table 4: Carcass analysis of red tilapia fed on the experimental diets, %w/w basis (Mean
±S.E n=3).
Items Sorghum starch level
Initial 15 20 25 30 35
Dry matter 27.3±1.4 27.5a±1.6 27.5a±1.8 27.2a±1.5 27.1a±1.4 27.4±1.6
Protein 16.8±1.2 16.4a±1.4 16.2a±1.2 16.1a±1.5 16.2a±1.2 16.0±1.2
Lipid 5.0±1.2 5.2a±1.1 5.4a±1.2 5.7a±1.1 5.9a±1.2 6.4±1.1
Ash 5.5±1.1 5.7 a±1.2 5.7 a±1.2 5.5 a±1.1 5.6 a±1.2 5.8±1.2
Means in the same raw with different super script letters are significantly different (P<0.05).
The ADCs of dry matter increased from 70% to 80% with dietary sorghum starch
levels increasing. Fish fed diets containing 30 and 35% sorghum starch were
significantly higher than fish fed with 15% sorghum starch diet P<0.05 (Table 5).
ADCs of starch were significantly lower when dietary sorghum starch level is more
than 30% compared with fish fed with the other sorghum starch diet (P<0.05). On
the other hand, the ADCs of crude protein and crude lipid were not significantly
different among dietary treatments (P>0.05).
Table 5: Apparent digestibility coefficient (ADCs) of the experimental diets (Mean ± S.E
n=3).
ADCs% Sorghum starch level
15 20 25 30 35
Dry mater 70±2.4 71±1.2 74±1.6 76±1.5 80±1.2
Crude protein 91.5±2.2 91.6±1.8 91.4±2.5 91.6±2.4 91.2±1.8
Crude lipid 89.2±1.8 89.0±1.5 89.4±1.6 89.5±1.5 89.1±1.4
Starch 88.6±2.1 86.4±2.4 84.5±2.4 85.2±2.2 80.4±2.4
Means in the same row with different superscript letters are significantly different
(P<0.05).
As it is demonstrated in (Table 6), significantly higher plasma glucose and
triglyceride concentrations were obtained in fish fed diets containing 30 and 35%

International Journal of Fisheries and Aquaculture Research
Vol.1, No.1, pp.1-16, March 2016
___Published by European Centre for Research Training and Development UK (www.eajournals.org)
9
sorghum starch than those fish fed with 15,20 and 25% sorghum starch diets
(P<0.05). However, lower liver glycogen concentrations were observed in fish fed
with 15% sorghum starch diet compared with fish fed the other diets (P<0.05). Fish
fed with 35% sorghum starch diet showed higher liver lipid concentrations than fish
fed with the other diets (P<0.05).
Table 6. Plasma glucose and triglycerides, liver glycogen and lipid concentrations of red
tilapia fed different dietary sorghum starch levels (Mean±S.E n=3).
Parameters Sorghum starch level
15 20 25 30 35
Plasma
glucose
3.12c±0.14 3.18c±0.18 3.45b±0.15 3.52b±0.12 3.86a±0,14
Plasma
triglycerid
es
4.25c±0.16 4.32c±0.14 4.66b±0.18 4.72b±0.16 4.98a±0.11
Liver
glycogen
26.5c±1.12 27.12c±1.15 32.52b±1.22 32.62b±1.44 34.44a±1.22
Liver lipid 322.12c±1.11 322.84c±1.16 333.65b±1.34 334.12b±1.42 342.15a±1.5
6
Means in the same raw with different super script letters are significantly different (P<0.05).
As presented in (Table 7), activities of GK and PK in liver were significantly
affected by dietary sorghum starch levels. GK and PK activities were significantly
higher and positively correlated with dietary sorghum starch levels from 25-35
compared with fish fed with 15% sorghum starch diet (P<0.05). Insignificant
differences were detected in activities of HK, PFK-1,FBPase, and G6Pase in liver
among dietary treatments (P>0.05).
Table 7. Activities of glucolytic and gluconeogenic enzymes in liver of hybrid red tilapia
fed different dietary sorghum starch levels (Mean ±S.E n=3).
Parameters Sorghum starch level
15 20 25 30 35
HK 2.98a±0.18 3.12a±0.14 3.22a±0.12 3.26a±0.15 3.52a±0.16
GK 24.16c±1.1 24.24c±1.4 26.15b±1.2 26.12b±1.5 29.46a±1.8
PK 26.12c±1.4 26.22c±1.2 29.14b±1.6 29.45b±1.4 34.16a±1.2
PFK-1 1.14a±0.16 1.8 a ±0.14 1.21a±0.11 1.25a±0.12 1.22a±0.15
FBPase 15.45a±1.6 16.12a±1.1 16.22a±1.2 16.66a±1.4 16.44a±1.1
G6Pase 11.14a±1.2 11.22a±1.4 11.16a±1.2 12.18a±1.1 12.46a±1.5
Means in the same raw with different super script letters are significantly
different(P<0.05).
HK=hexokinase,GK=gluconokinase,PK=pyruvate kinase,PFK-1=6-phosphofructo-1-
kinase,FBPase=fructose-1,6-bisphosphatase,G6Pase= glucose-6-phosphatase.

International Journal of Fisheries and Aquaculture Research
Vol.1, No.1, pp.1-16, March 2016
___Published by European Centre for Research Training and Development UK (www.eajournals.org)
10
DISCUSSION
In this study, the hybrid red tilapia was growing well under physico-chemical
characteristics of water tanks. This is important finding will improve the extension
of red tilapia culture under scarce and restricted of fresh water supply to fish farms.
These results are in agree with the previous results reported by [48,49], where, this
specie can tolerance to high salinity conduction.
The carbohydrate utilization varies greatly among fish species, where the
appropriate dietary carbohydrate can improve growth and feed efficiency of fish
[21,50]. The present study showed that WG, SGR and CF of hybrid red tilapia
significantly increased with increasing dietary sorghum starch level from 15 to 30%,
while FCR had a contrary tendency. In the same trend, PER and NPU showed a
significance increase up to 30% sorghum starch level. These results are agree with
the results of [51] in red tilapia, [52] in Nile tilapia, [53] in sea bream. However, in
this study, fish fed diets with high sorghum starch contents (>30%) showed a
decreased growth and feed utilization compared with those fed diets containing 30%
or lower sorghum starch levels. Similar findings were reported in sea bream, [53]
and rainbow trout, Oncorhynchus mykiss [54] and gibel carp, Carassius auratus
[28]. In (Table 1) it's clear that the maximum level of tannin was 0.42% in 35%
sorghum starch diet and this value less than 0.59 % in sea bream diet, which had no
negative effects on growth performance [53]. In the present trial, the depressed in
growth performance in 35% sorghum starch diet, maybe due to the decreased in
digestibility coefficient of nutrients in this diet (Table 5).
Enlargement of liver size and glycogen concentration was increased with elevated
levels of dietary carbohydrate in several fish [29]. Absorbed carbohydrate that is not
used for energy usually accumulated in the liver of fish both as lipid and as
glycogen after being converted [54]. This study showed that the value of HSI was
increased with dietary sorghum starch levels. In the same manner, [29] reported that
HSI, liver lipid, and glycogen concentrations increased with increasing in dietary
wheat starch level, and demonstrated that grass carp, Ctenopharyngodon idella, had
a very high capacity of transforming absorbed starch into tissue lipids. For instance,
plasma glucose, triglycerides, liver glycogen and lipid concentration also
significantly increased with increasing dietary sorghum starch levels. These results
found that excess dietary carbohydrate was deposited as lipid and glycogen in
hybrid red tilapia, similar to those observed in European sea bass, Dicentrarchus
labrax [55]. In the present trial, whole-body lipid content of hybrid red tilapia was
positively related to dietary sorghum starch levels and reflected with different
response of this specie to glucose metabolic of starch. These results were in
agreement with the previous results in several fish species [50,52,56]. However,
[27] reported that the body lipid content of gibel carp was stable as the dietary
starch level increased from 24 to 28% and decreased as the starch level increased
from 28 to 40%. This study showed that the dry matter, protein and ash contents of
whole body and muscle were not affected by dietary sorghum starch levels, which
agreed with the findings in European sea bass [23] , gilthead sea bream, Sparus
aurata[23,53] and silver barb [57].
Gelatinization of starch can enhance its digestibility compared to the low
digestibility of native starch [55]. The present results indicated that sorghum starch

International Journal of Fisheries and Aquaculture Research
Vol.1, No.1, pp.1-16, March 2016
___Published by European Centre for Research Training and Development UK (www.eajournals.org)
11
was very well digested by hybrid red tilapia (ADC of starch ≥85.2%) when their
levels were not more than 30%. However, ADC of starch reduced significantly
when dietary sorghum starch level was up to 30%, which is similar to the results of
sea bream [53], cobia, Rachycentron canadum [36], and large yellow croaker,
Pseudosciaena crocea [56]. The progressive enhancement in apparent dry matter
digestibility concomitant with increasing dietary sorghum starch level is in line with
findings in grass carp [29] and it may be explained that higher dietary cellulose
level caused the lowered apparent dry matter digestibility. Dietary starch level is
found to highly influence digestibility of other nutrients, especially lipid [56,58].
The decrease in protein digestibility with increasing dietary carbohydrate level was
reported in white sea bream, Diplodus sargus [59] and large yellow croaker [56].
However, the apparent protein and lipid digestibility in this trial were not affected
by dietary sorghum starch levels, in agreement with the reported results in hybrid
tilapia [60], sea bream [53], cod, Gadus morhua [25,61] and Atlantic salmon, Salmo
salar [5].
Carbohydrates are metabolized by glycolysis or the pentose phosphate pathway,
leading to generation of energy transfer molecules in fish [62,63]. Also, dietary
carbohydrates could depress the increase rate of amino acid metabolism and
utilization by gluconeogenic pathways in salmon fish [64]. Hepatic gluconeogenesis
is an important metabolic pathway in fish; science available scientific data on its
regulation and effects by dietary carbohydrate is relatively scarce and somewhat
discordant. There is a few studies on the key hepatic glycolytic (HK, GK, PFK-1,
and PK) and gluconeogenic (G6Pase and FBPase) enzymes involved in glucose
metabolic pathway in red tilapia. GK catalyzes the phosphorylation of glucose to
glucose-6-phosphate and G6Pase hydrolyzes the glucose-6-phosphate to glucose,
the two key enzymes also catalyzes the hepatic glucose/glucose-6-phosphate cycle
and both play a major role in glucose homeostasis [65]. Our results showed that GK
activities in liver were positively correlated with dietary sorghum starch levels,
confirming that this enzyme could be regulated by dietary carbohydrates in hybrid
red tilapia, as previously observed in rainbow trout [37], European sea bass [23] and
gilthead sea bream [66]. On the other hand, HK activity was not affected by dietary
sorghum starch levels, similar to the findings in rainbow trout, European sea bass,
and gilthead sea bream [23, 53, 67]. In the same manner, our data showed that the
G6Pase activity was not affected by dietary sorghum starch levels in hybrid red
tilapia. Similar findings were reported in rainbow trout, gilthead sea bream and
European sea bass suggesting that G6Pase gene expression and activity were also
unaffected by dietary carbohydrate levels and sources [68,69,70]. PK is a key
glycolytic enzyme that catalyzes the last step in glycolysis, the conversion of
phosphoenolpyruvate to pyruvate [71]. The present results showed that PK activities
in liver were positively correlated with dietary sorghum starch levels, comparable to
those observed in rainbow trout [39] and European sea bass [23]. In this study, the
dietary sorghum starch levels did not affect PFK-1 and FBPase activities in liver, as
it was similar to those reported in other fish species [39,71,72,73], where these
enzymes activities are not regulated by dietary carbohydrates. This finding was
reported in rainbow trout, where FBPase and G6Pase activities were regulated by
dietary protein levels and their activities were significantly higher with fish fed on
68% protein diet rather than 48% protein diet [74].
International Journal of Fisheries and Aquaculture Research
Vol.1, No.1, pp.1-16, March 2016
___Published by European Centre for Research Training and Development UK (www.eajournals.org)
12
In conclusion, our data suggest that the dietary sorghum starch level can
incorporated up to 30% of diet, without negative effects on growth performance,
nutrients utilization, digestibility coefficients, body composition and hepatic
enzyme activities of carbohydrate metabolism in hybrid red tilapia fingerlings. The
present results encourage the use of slain water as alternative to the limited sources
of fresh water in fish culture.
REFERENCES
[1] Keshavanath, P., Manjappa, K. and Gangadhara, B. (2002). Evaluation of carbohydrate
rich diets through common carp culture in manured tanks. Aquaculture Nutrition 8:169-
174.
[2] Stone, D. A. J., Allan, G. L. and Anderson A. J. (2003). Carbohydrate utilization by
juvenile silver perch, Bidyanus bidyanus (Mitchell). III. The protein-sparing effect of
wheat starch-based carbohydrates. Aquaculture Research 34:123-134.
[3] Tacon (1999). Overview of world aquaculture and aquafeed production Data presented
at World Aquaculture 99, Sydney, April 27-May 2.
[4] Da, C.T., Hung,L.T., Berg,H., Lindberg, J.E. and Lundth, T. (2011). Evaluation of
potential feed sources and technical and economic consideration of small-scale
commercial striped catfish (Pangasius hypothalamus) pond farming systems in the
Mekong delta of Vietnam. Aquaculture Research Http//dx.doi.org/10111/j.1365-
2109.2011.03048.x. 1-13.103-122.
[5] Ganguly, S., Dora, K.C., Sarkar, S. and Chowdhury, S. (2013). Supplementation of
prebiotics in fish feed: a review. Reviews in Fish Biology and Fisheries 23(2):195-199.
[6] Li, X.F., Wang, Y., Liu, W.-B., Jiang, G.-Z. and Zhu, J. (2013b). Effects of dietary
carbohydrate/lipid ratios on growth performance, body composition and 51glucose
metabolism of fingerling blunt snout bream (Megalobrama amblycephala). Aquaculture
Nutrition 2:1-12.
[7] Hung, L.T., Lazard, J., Mariojouls, C. and Moreau, Y. (2003). Comparison of starch
utilization in fingerlings of two Asian catfishes from the Mekong River (Pangasius
bocourti) Sauvage, 1880, Pangasius hypophthalmus Sauvage, 1878). Aquaculture
Nutrition 9(4):215-222.
[8] Watanabe, T. (2002). Strategies for further development of aquatic feeds. Fisheries
Science 68(2):242-252.
[9] Li, X.F., Liu, W.B., Lu, K.L., Xu, W.N. and Wang, Y. (2012). Dietary carbohydrate/lipid
ratios affect stress, oxidative status and non-specific immune responses of fingerling
blunt snout bream (Megalobrama amblycephala). Fish & Shellfish Immunology
33(2):316-323.
[10] Erfanullah and Jafri, A.K. (1998). Effect of dietary carbohydrate-to-lipid ratio on growth
and body composition of walking catfish (Clarias batrachus). Aquaculture 161(1-4):159-
168.
[11] Azaza, M.S., Khiari, N., Dhraief, M.N., Aloui, N., Kraϊem, M.M. and Elfeki, A. (2013).
Growth performance, oxidative stress indices and hepatic carbohydrate metabolic
enzymes activities of juvenile Nile tilapia (Oreochromis niloticus), in response to dietary
starch to protein ratios. Aquaculture Research, 1-14.

International Journal of Fisheries and Aquaculture Research
Vol.1, No.1, pp.1-16, March 2016
___Published by European Centre for Research Training and Development UK (www.eajournals.org)
13
[12] Shiau, S.Y. (1997). Utilization of carbohydrates in warm water fish - With particular
reference to tilapia, Oreochromis niloticus× Oreochromis aureus. Aquaculture 151(1-
4):79-96.
[13] Tung, P.H. and Shiau, S.Y. (1993). Carbohydrate utilization versus body size in tilapia
Oreochromis niloticus×Oreochromis aureus. Comparative Biochemistry and Physiology
part A 104(3):585-588.
[14] Amirkolaie, A.K., Verreth, J.A.J. and Schrama, J.W. (2006). Effect of gelatinization
degree and inclusion level of dietary starch on the characteristics of digesta and faeces in
Nile tilapia (Oreochromis niloticus). Aquaculture 260(1-4):194-205.
[15] Anderson, J., Jackson, A.J., Matty, A.J. and Capper, B.S. (1984). Effects of dietary
carbohydrate and fiber on the tilapia (Oreochromis niloticus). Aquaculture 37(4):303-
314.
[16] Deng, D. F., Refstie, S. and Hung, S. S. O. (2001). Glycemic and glycosuric responses
in white sturgeon Acipenser transmontanus after oral administration of simple and
complex carbohydrates. Aquaculture 199:107-117.
[17] Tan, Q., Xie S., Zhu, X., Lei, W. and Yang, Y. (2006). Effect of dietary carbohydrate
sources on growth performance and utilization for gibel carp (Carassius auratus gibelio)
and Chinese longsnout catfish (Leiocassis longirostris Günther). Aquaculture Nutrition
12:61-70.
[18] Hemre, G.I., Mommsen, T.P. and Krogdahl, A. (2002). Carbohydrates in fish nutrition:
effects on growth, glucose metabolism and hepatic enzymes. Aquaculture Nutrition
8:175-194.
[19] Moon, T.W. (2001). Glucose intolerance in teleost fish: face or fiction? Comparative
Biochemistry and Physiology B-Biochemistry & Molecular Biology 129(2-3):243-249.
[20] NRC (2011). National Research Council, Nutrient requirement of fish and shrimps.
National Academy Press, Washington.
[21] Wilson, R. (1994). Utilization of dietary carbohydrate by fish. Aquaculture 124:67-80.
[22] Enes, P., Panserat, S., Kaushik, S. and Oliva-Teles, A. (2011). Dietary carbohydrate
utilization by European sea bass (Dicentrarchus labrax) and gilthead sea bream (Sparus
aurata) Juveniles. Reviews in Fisheries Science 19(3): 201-215.
[23] Enes, P., Panserat, S., Kaushik, S. and Oliva-Teles, A. (2006). Effect of normal and waxy
maize starch on growth, food utilization and hepatic glucose metabolism in European sea
bass (Dicentrarchus labrax) juveniles. Comparative Biochemistry and Physiology
143A:89-96.
[24] Booth, M.A., Anderson, A.J. and Allan, G.L. (2006). Investigation of the nutritional
requirements of Australian snapper Pagrus auratus (Bloch & Schneider 1801):
digestibility of gelatinized wheat starch and clearance of an intra-peritoneal injection of
D-glucose. Aquaculture Research 37: 975-985.
[25] Hemre, G. I., Lie, Ø., Lied, E. and Lambertsen, G. (1989). Starch as an energy source in
feed for cod (Gadus morhua): digestibility and retention. Aquaculture 80:261-270.
[26] Krogdahl, A., Hemre, G.I. and Mommsen, T.P. (2005). Carbohydrates in fish nutrition:
digestion and absorption in post larval stages. Aquaculture Nutrition 11(2),
[27] Mohanta, K. N., S. N. Mohanty, and J. K. Jena (2007). Protein-sparing effect of
carbohydrate in silver barb, Puntius gonionotus fry. Aquaculture Nutrition 13:311-317.
[28] Tan, Q., Wang, F., Xie, S., Zhu, X., Wu, L. and Shen, J. (2009). Effect of high dietary
starch levels on the growth performance, blood chemistry and body composition of gibel
carp (Carassius auratus var. gibelio). Aquaculture Research 40:1011-1018.
International Journal of Fisheries and Aquaculture Research
Vol.1, No.1, pp.1-16, March 2016
___Published by European Centre for Research Training and Development UK (www.eajournals.org)
14
[29] Tian, L. X., Liu, Y. J., Yang, H. J., Liang, G. Y. and Niu, J. (2012). Effects of different
dietary wheat starch levels on growth, feed efficiency and digestibility in grass carp
(Ctenopharyngodon idella). Aquaculture International 20:283-293.
[30] Klein, S., Cohn, S.M. and Alpers, D.H. (1998). The alimentary tract in nutrition. In:
Shils,M.E., Olson, A.J., Shike, M., Ross, A.C. (Eds.), Modern Nutrition in Health and
Disease 605-633.
[31] Bolasina, S., Perez, A. and Yamashita, Y. (2006). Digestive enzymes activity during
ontogenetic development and effect of starvation in Japanese flounder (Paralichthys
olivaceus). Aquaculture 252(2-4), 503-515.
[32] Panserat, S., Skiba-Cassy, S., Seiliez, I., Lansard, M., Plagnes-Juan, E., Vachot, C.,
Aguirre, P., Larroquet, L., Chavernac, G., Medale, F., Corraze, G., Kaushik, S. and Moon,
T.W. (2009). Metformin improves postprandial glucose homeostasis in rainbow trout fed
dietary carbohydrates: a link with the induction of hepatic lipogenic capacities? American
Journal of Physiology-Regulatory Integrative and Comparative Physiology 297(3), 707-
715.
[33] Lozano, N.B.S., Vidal, A.T., Martinez-Llorens, S., Merida, S.N., Blanco,J.E., Lobez,
A.M., Torres, M.P. and Cerda, M.J. (2007). Growth and economic profit of gilthead sea
bream (Sparus aurata L.) fed on sunflower meal. Aquaculture 272: 528-534.
[34] Jobling, M. (1994). Fish bioenergetics, Series,13 published by Chapman & Hall-2-6
Boundary, R, London SBI 8HN, 300pp.
[35] APHA (1992). Standard methods for the examination of water and waste water. American
Public Health Association, Washington, DC, 1134pp.
[36] Ren, M. C., Ai, Q.H., Mai, K. S., Ma, H.M. and Wang, X. J. (2011). Effect of dietary
carbohydrate level on growth performance, body composition, apparent digestibility
coefficient and digestive enzyme activities of juvenile cobia, Rachycentron canadum L.
Aquaculture Research 42:1467-1475.
[37] AOAC (2006). Association of Official Analytical Chemists 14ed. Assoc Office,
Anal.Chem, Washington, Dc.
[38] Price, M.L., Vanscoyoc, S. and Butler, L.G. (1978). A critical evaluation of the vanillin
reaction as an assay for sorghum grain. J.Agric.Food Chem. 26:1214-1218.
[39] Panserat, S., Médale, F., Blin, C., Breque, J., Vachot, C., Plagnes-Juan, E., Gomes, E.,
Krishnamoorthy, R. and Kaushik, S. (2000a). Hepatic glucokinase is induced by dietary
carbohydrates in rainbow trout, gilthead sea bream, and common carp. American Journal
of Physiology-Regulatory Integrative and Comparative Physiology 278:1164-1170.
[40] Foster, G. and Moon, T. (1990). Control of key carbohydrate-metabolizing enzymes by
insulin and glucagon in freshly isolated hepatocytes of the marine teleost Hemitripterus
americanus. Journal of Experimental Zoology 254:55-62.
[41] Metón, I., F. Fernández, and I. V. Baanante (2003). Short and long-term effects of
refeeding on key enzyme activities in glycolysis–gluconeogenesis in the liver of gilthead
seabream (Sparus aurata). Aquaculture 225:99-107.
[42] Panserat, S., Capilla, E., Gutierrez, J., Frappart, P., Vachot, C., Plagnes-Juan E., Aguirre,
P., Breque, J. and Kaushik, S. (2001). Glucokinase is highly induced and glucose-6-
phosphatase poorly repressed in liver of rainbow trout (Oncorhynchus mykiss) by a single
meal with glucose. Comparative Biochemistry and Physiology 128B:275-283.
[43] Bradford, M. M. (1976). A rapid and sensitive method for the quantization of microgram
quantities of protein utilizing the principle of protein-dye binding. Analytical
Biochemistry 72:248-254.
International Journal of Fisheries and Aquaculture Research
Vol.1, No.1, pp.1-16, March 2016
___Published by European Centre for Research Training and Development UK (www.eajournals.org)
15
[44] Carroll, N. V., Longley, R. W. and Roe, J. H. (1956). The determination of glycogen in
liver and muscle by use of anthrone reagent. Journal of Biological Chemistry 220:583-
593.
[45] Snedecore, W.G. and Cochran, W.C.(1987). Statistical Methods. Iowa state Univ., USA.
[46] Duncan, D.B. (1955). Multiple ranges and multiple F. test. Biometric, 11: 1-42.
[47] SAS (2004). SAS User's Guide Version 6 Edition. SAS Institute,Cary,NC.USA.
[48] Watanabe,W., French, K.E., Emst D.H.,Olla,B. and Wicklund, R. (1989). Salinity during
early development influence growth and survival of Florida red tilapia. Journal World
Aquaculture Society 20:134-142.
[49] Garcia-ulloa,M.,Villa,R.L. and Martinez,T.M. (2001). Growth and feed utilization of the
tilapia hybrid (Oreochromis mossambicus × O. niloticus) culture at different salinities
under controlled laboratory conditions. Journal World Aquaculture Society 32:119-121.
[50] Wang, Y., Y. J. Liu, L. X. Tian, Z. Y. Du, J. T. Wang, S. Wang, and W. P. Xiao. (2005).
Effects of dietary carbohydrate level on growth and body composition of juvenile tilapia,
Oreochromis niloticus×O. aureus. Aquaculture Research 36:1408-1413.
[41] Yones, A.M. (2010). Effect of lupin kernel meal as plant protein sources in diets of red
hybrid tilapia(Oreochromis niloticus×O. mossambicus) on growth performance and
nutrients utilization. African J.Biol.Sci.6:1-16.
[52] Yones, A.M and Abdel-Hakim. N. F. (2010). Studies on growth performance and
apparent digestibility coefficient on some common plant protein ingredients used in
formulated diets of Nile tilapia (Oreochromis niloticus). Egyptian J. Nutrition and Feeds
13:589-606.
[53] Yones,A.M. (2005). Effect of dietary sorghum as carbohydrate source and two lipid
levels in feeds of gilthead sea bream (Sparus aurata) on its growth performance.
Egypt.J.Aquat.& Fish.Vol,9:85-99.
[54] Brauge, C., Medale, F. and Corraze, G. (1994). Effect of dietary carbohydrate levels on
growth, body composition and glycaemia in rainbow trout, Oncorhynchus mykiss, reared
in seawater. Aquaculture 123:109-120.
[55] Peres, H. and Oliva-Teles, A. (2002). Utilization of raw and gelatinized starch by
European sea bass (Dicentrarchus labrax) juveniles. Aquaculture 205:287-299.
[56] Cheng, Z. Y., Mai, K. S. , Ai, Q. H. , Li, Y. and He, Z. G. (2013). Effects of dietary
pregelatinized corn starch on growth performance, apparent digestibility coefficient and
digestive enzyme activities of large yellow croaker fingerlings, Pseudosciaena crocea R.
Israeli Journal of Aquaculture-Bamidgeh, 65:843-850.
[57] Mohanta, K. N., Mohanty, S. N., Jena, J. K., Sahu, N. P. and Patro, B. (2009).
Carbohydrate level in the diet of silver barb, Puntius gonionotus (Bleeker) fingerlings:
effect on growth, nutrient utilization and whole body composition. Aquaculture Research
40:927-937.
[58] Hemre, G. I., Sandnes, K., Lie, Ø., Torrissen, O. and Waagbø, R. (1995). Carbohydrate
nutrition in Atlanticsalmon, Salmo salar L.:growth and feed utilization. Aquaculture
Research 26:49-154.
[59] Sá, R., Pousão-Ferreira, P. and Oliva-Teles, A. (2007). Growth performance and
metabolic utilization of diets with different protein: carbohydrate ratios by white sea
bream (Diplodus sargus, L.) juveniles. Aquaculture Research 38:100-105.
[60] Dong X.H., Guo Y.X., Ye D.Y., Song W.D., Huang X.H. and Wang H. (2010) Apparent
digestibility of selected feed ingredients in diets for juvenile hybrid tilapia, Oreochromis
niloticus × Oreochromis aureus. Aquaculture Research 41:1356–1364.
International Journal of Fisheries and Aquaculture Research
Vol.1, No.1, pp.1-16, March 2016
___Published by European Centre for Research Training and Development UK (www.eajournals.org)
16
[61] Hemre, G. I., Karlsen, Ø., Mangor-Jensen, A. and Rosenlund, G. (2003). Digestibility of
dry matter, protein, starch and lipid by cod, Gadus morhua: comparison of sampling
methods. Aquaculture 225:225-232.
[62] Polakof, S., Panserat, S., Soengas, J.L. and Moon, T.W. (2012). Glucose metabolism in
fish: a review. Journal of Comparative Physiology B-Biochemical Systemic and
Environmental Physiology 182(8):1015-45.
[63] Richard, N., Kaushik, S., Larroquet, L., Panserat, S. and Corraze, G. (2006). Replacing
dietary fish oil by vegetable oils has little effect on lipogenesis, lipid transport and tissue
lipid uptake in rainbow trout (Oncorhynchus mykiss). British Journal of Nutrition
96(2):299-309.
[64] Sanchez-Muros, M.J.,Garcia-Rejon,L.,Lupianez,J.A.and De La Higuera,M.
(1996).Long-term nutritional effects on the primary liver and kidney metabolism in
rainbow trout (Oncorhynchus mykiss).II.Adaptive response of glucose 6-phosphate
dehydrogenase activity to high-carbohydrate/low-protein and high-fat/on-carbohydrate
diets.Aquaculture Nutrition 2(4):193-200.
[65] Panserat, S., Capilla, E., Gutierrez, J. , Frappart, P., Vachot, C., Plagnes-Juan, E. Aguirre,
P., Breque, J. and Kaushik, S. (2001). Glucokinase is highly induced and glucose-6-
phosphatase poorly repressed in liver of rainbow trout (Oncorhynchus mykiss) by a single
meal with glucose. Comparative Biochemistry and Physiology 128B:275-283.
[66] Enes, P., Panserat, S., Kaushik, S. and Oliva-Teles, A. (2008a). Growth performance and
metabolic utilization of diets with native and waxy maize starch by gilthead sea bream
(Sparus aurata) juveniles. Aquaculture 274:101–108.
[67] Kirchner, S., Seixas, P., Kaushik, S. and Panserat, S. (2005). Effects of low protein intake
on extra-hepatic gluconeogenic enzyme expression and peripheral glucose
phosphorylation in rainbow trout (Oncorhynchus mykiss). Comparative Biochemistry and
Physiology 140B:333-340.
[68] Panserat, S., Médale, F., Breque, J., Plagnes-Juan E., and Kaushik, S.(2000b). Lack of
significant long-term effect of dietary carbohydrates on hepatic glucose-6-phosphatase
expression in rainbow trout (Oncorhynchus mykiss). Journal of Nutritional Biochemistry
11:22-29.
[69] Caseras, A., Metón, I., Vives, C., Egea, M., Fernández, F. and Baanante, I. V. (2002).
Nutritional regulation of glucose-6-phosphatase gene expression in liver of the gilthead
sea bream (Sparus aurata). British Journal of Nutrition 88:607–614.
[70] Enes, P., Panserat, S., Kaushik, S and Oliva-Teles, A. (2008b). Hepatic glucokinase and
glucose-6-phosphatase responses to dietary glucose and starch in gilthead sea bream
(Sparus aurata) juveniles reared at two temperatures. Comparative Biochemistry and
Physiology 149A:80-86.
[71] Enes, P., Panserat, S., Kaushik, S. and Oliva-Teles, A. (2009). Nutritional regulation of
hepatic glucose metabolism in fish. Fish Physiology and Biochemistry 35:519–539.
[72] Zhou,P.,Wang,M.,Xie,F.,Deng,F. and Zhou,O. (2016). Effect of dietary carbohydrate to
lipid ratios on growth performance, digestive enzyme and hepatic carbohydrate metabolic
enzyme activities of large yellow croaker (Lamichthys crocea). Aquaculture 452: 45-51.
(in press).
[73] Gao,W.,Liu,Y.J.,Tian,L.X.,Maj,K.S.,Liang,G.Y.,Yang,H.J.,Haj,M.Y.and Liuo,W.J.
(2010).Effect of dietary carbohydrate to lipid ratios on growth performance, body
composition, nutrient utilization and hepatic enzyme activities of herbivorous grass carp
(Ctenopharyngodon idella). Aquaculture 16:327-333.