APOPTOTIC EFFECTS AND CHEMICAL INVESTIGATION OF...
155
APOPTOTIC EFFECTS AND CHEMICAL INVESTIGATION OF ACTIVE EXTRACTS OF Curcuma mangga RHIZOMES HONG GIN WAH FACULTY OF SCIENCE UNIVERSITY OF MALAYA KUALA LUMPUR 2018
Transcript of APOPTOTIC EFFECTS AND CHEMICAL INVESTIGATION OF...

APOPTOTIC EFFECTS AND CHEMICAL INVESTIGATION OF ACTIVE EXTRACTS OF Curcuma
mangga RHIZOMES
HONG GIN WAH
FACULTY OF SCIENCE
UNIVERSITY OF MALAYA KUALA LUMPUR
2018

APOPTOTIC EFFECTS AND CHEMICAL
INVESTIGATION OF ACTIVE EXTRACTS OF Curcuma
mangga RHIZOMES
HONG GIN WAH
DISSERTATION SUBMITTED IN FULFILMENT OF
THE REQUIREMENTS FOR THE DEGREE OF MASTER
OF SCIENCE
INSTITUTE OF BIOLOGICAL SCIENCES
FACULTY OF SCIENCE
UNIVERSITY OF MALAYA
KUALA LUMPUR
2018

ii
UNIVERSITY OF MALAYA
ORIGINAL LITERARY WORK DECLARATION
Name of Candidate: HONG GIN WAH
Matric No: SGR130118
Name of Degree: MASTER
Title of Project Paper/Research Report/Dissertation/Thesis (“this Work”): Apoptotic
effects and chemical investigation of active extract of Curcuma mangga
rhizomes
Field of Study: BIOCHEMISTRY AND MOLECULAR BIOLOGY
I do solemnly and sincerely declare that:
(1) I am the sole author/writer of this Work;
(2) This Work is original;
(3) Any use of any work in which copyright exists was done by way of fair
dealing and for permitted purposes and any excerpt or extract from, or
reference to or reproduction of any copyright work has been disclosed
expressly and sufficiently and the title of the Work and its authorship have
been acknowledged in this Work;
(4) I do not have any actual knowledge nor do I ought reasonably to know that
the making of this work constitutes an infringement of any copyright work;
(5) I hereby assign all and every rights in the copyright to this Work to the
University of Malaya (“UM”), who henceforth shall be owner of the
copyright in this Work and that any reproduction or use in any form or by any
means whatsoever is prohibited without the written consent of UM having
been first had and obtained;
(6) I am fully aware that if in the course of making this Work I have infringed
any copyright whether intentionally or otherwise, I may be subject to legal
action or any other action as may be determined by UM.
Candidate’s Signature Date:
Subscribed and solemnly declared before,
Witness’s Signature Date:
Name: ASSOCIATE PROF. DR. NORHANIZA BINTI AMINUDIN
Designation:

iii
APOPTOTIC EFFECTS AND CHEMICAL INVESTIGATION OF ACTIVE
EXTRACT OF Curcuma mangga RHIZOMES
ABSTRACT
Plants have a long history of use in the treatment of many ailments including cancer.
The choices of plant for drug discovery based on ethnopharmacological data rather than
random approach hold greater promise of finding a good candidate for investigation.
Curcuma mangga known “temu mangga” in Malay has been selected for investigation
use as a natural remedy for various diseases in Malaysia including cancer. Crude and
fractionated extracts of C. mangga rhizomes were initially investigated for their growth
inhibitory effects on four human cancer cell lines, namely colorectal adenocarcinoma
cell (HT-29), colorectal carcinoma cell (HCT-116), cervical carcinoma cell (CaSki) and
lung carcinoma cell (A549), and a normal human cell (non-cancer human colorectal cell
line, CCD-18Co) using sulforhodamine B (SRB) colorimetric assay. Dry rhizome
powder of C. mangga was soaked in dichloromethane for three days and the crude
dichloromethane extract (CMD) obtained was washed with n-hexane to give the
hexane-soluble extract (CMDH). The hexane-insoluble residue was dissolved
completely in methanol to give the fractionated methanolic extract (CMDM). All three
extracts (CMD, CMDH and CMDM) generally showed good cytotoxicity effects
against HT-29, HCT-116, A549 and CaSki with IC50 value ranging from 14.3 to 21.0
µg/mL, 15.2 to 18.3 µg/mL, 14.8 to 20.0 µg/mL and 18.7 to 21.2 µg/mL respectively.
All extracts exhibited lower toxicity towards CCD-18Co (IC50 value ranging from 50.3
to 55.0 µg/mL) compared with chemotherapy drug (doxorubicin), with an IC50 value of
0.11 µg/mL. Both CMDH and CMDM were subjected to chemical investigations
resulted isolation and identification of five (5) components, namely longpene A,
zerumin A, coronadiene, (E)-labda-8(17),12-diene-15,16-dial and calcaratarin A. Other
isolated compounds could not be identified. The isolated pure compounds showed weak
iv
cytotoxicity effects against the selected cancer cell lines (IC50 values ranging from 19.1
to 34.7 µg/mL for HT-29; 17.7 to 38.6 µg/mL for HCT-116; 18.6 to 38.3 µg/mL for
A549; 21.8 µg/mL to 30.2 µg/mL for CaSki). The pure compounds were less effective
in preventing the proliferation of cancer cells compared with extracts. Synergism
between the components maybe responsible for the observed activity. CMD was
selected for further molecular investigation of its anticancer effect on HT-29 cell line
for it’s good cytotoxic effects against HT-29. Typical apoptotic morphological features
like membrane blebbing, formation of apoptotic bodies, cell shrinkage and condensation
of chromatin were observed on treated HT-29. The CMD induced cell arrest in G2/M
phase of the cell cycle after 24 hours. Externalization of phosphotidylserine from the
plasma membrane was observed in a concentration- and time-dependent manner. DNA
fragmentation was detected through the Terminal deoxynucleotidyl transferase dUTP
nick end labelling (TUNEL) assay. In the Western blot analysis, the expression levels of
the pro-apoptotic proteins (Bax, caspase 3, -9 and 8) were up-regulated while the anti-
apoptotic proteins (Bcl-2, cIAP-2, XIAP) were down-regulated. The expression levels
of cleaved PARP-1 were up-regulated. This indicated that apoptosis might have
occurred through the intrinsic and extrinsic pathways. As a conclusion, the crude
dichloromethane extract of C. mangga rhizomes has the potential to be further
developed as an anticancer agent against HT-29.
Keywords: Curcuma manga, HT-29, apoptosis
v
KESAN APOPTOTIC DAN PENYELIDIKAN EKSTRAK AKTIF KIMIA DARI
RIZOM CURCUMA MANGGA
ABSTRAK
Tumbuhan mempunyai rekod sejarah yang lama dalam rawatan untuk pelbagai jenis
penyakit termasuk kanser. Pemilihan tumbuhan dalam pencarian ubat-ubatan
berdasarkan data etnofarmakologi mempunyai potensi yang lebih tinggi dalam
pemilihan calon yang sesuai untuk siasatan berbanding dengan pemilihan tumbuhan
secara rawak. Curcuma mangga dikenali sebagai ‘temu mangga’ dalam bahasa Melayu,
telah dipilih untuk kajian sebagai ubat semulajadi bagi pelbagai penyakit di Malaysia
termasuk kanser. Pada peringkat permulaan, kesan kesitotoksikan ekstrak mentah dan
fraksi rizom C. mangga terhadap empat titisan sel kanser manusia, iaitu titisan sel
adenokarsinoma kolorektal (HT-29), titisan sel karsinoma kolorektal (HCT-116), titisan
sel karsinoma servik (CaSki) dan titisan sel karsinoma paru-paru (A549) dan satu titisan
sel normal manusia (sel kolorektal manusia, CCD-18Co) dengan menggunakan asei
kolorimetri Sulforhodamine B (SRB). Serbuk kering rizom C. mangga direndam dalam
diklorometana selama tiga hari dan ekstrak diklorometana (CMD) yang diperolehi telah
dibasuh dengan n-heksana. Pelarut yang mengandungi ekstrak heksana disejatkan dan
fraksi-fraksi heksana (CMDH) telah diperoleh. Sisa ekstrak yang tidak larut dalam
heksana telah dilarutkan dalam metanol untuk menghasilkan fraksi methanol (CMDM).
Ketiga-tiga ekstrak tersebut menunjukkan kesan kesitotoksikan yang baik terhadap HT-
29, HCT-116, A549 dan CaSki dengan nilai IC50 masing-masing antara 14.3 hingga
21.0 μg/mL, 15.2 μg/mL hingga 18.3 μg/mL, 14.8 hingga 20.0 μg/mL dan 18.7 hingga
21.2 μg/mL. Ketiga-tiga ekstrak tersebut juga menunjukkan ketoksikan yang minima
terhadap titisan sel kolorektal manusia normal (nilai IC50 antara 50.3 hingga 55.0 μg/mL
berbanding dengan ubat kemoterapi (doxorubicin), yang memberi nilai IC50 0.11
μg/mL). CMDH dan CMDM telah dikaji selanjutnya. Lima (5) sebatian iaitu longpene

vi
A, zerumin A, koronadiene, (E)-labda-8(17),12-diene-15,16-dial, dan kalkaratarin A.
Sebatian tulen lain yang diasingkan tidak dapat dikenalpasti. Semua sebatian di atas
tidak menunjukkan kesan kesitotoksikan terhadap titisan sel-sel kanser yang dikaji (nilai
IC50 antara 19.1 hingga 34.7 μg/mL untuk HT-29; 17.7 μg/mL hingga 38.6 μg/mL untuk
HCT-116; 18.6 hingga 38.3 μg/mL untuk A549; 21.8 hingga 30.2 μg/mL untuk CaSki).
Sebatian tulen di atas telah didapati kurang berkesan dalam mencegah pertumbuhan sel-
sel kanser berbanding dengan ekstrak. Sinergi antara komponen mungkin telah berlaku.
CMD telah dipilih untuk siasatan molekular lanjut terhadap titisan sel kanser HT-29
kerana ia mempunyai ketoksikan yang baik terhadap sel tersebut. Morfologi apoptosis
seperti blebbing pada membran sel, pembentukan apoptotic bodies, pengecutan sel dan
pemadatan kromatin diperhatikan terjadi apabila sel HT-29 dirawat dengan CMD. CMD
telah menyebabkan pengumpulan sel dalam fasa G2/M pada kitaran sel selepas 24 jam
rawatan. Externalization phosphotidylserina dari membran plasma juga diperhatikan
berlaku mengikut kenaikan konsentrasi dan masa. Fragmentasi DNA dikesan melalui
asai Terminal deoxynucleotidyl transferase dUTP Nick End Label (TUNEL). Analisis
Western Blot menunjukkan tahap ekspresi protein pro-apoptosis (Bax, caspase 3, -9 dan
8) telah meningkat manakala tahap ekspresi protein anti-apoptosis (cIAP2 dan XIAP)
telah menurun. Ekspresi protein PARP-1 juga telah meningkat. Oleh itu, keseluruhan
keputusan ujian menunjukkan bahawa apoptosis berlaku melalui laluan intrinsik dan
ekstrinsik. Kesimpulan, ekstrak diklorometana mentah rizom C. mangga berpotensi
untuk dimajukan sebagai agen anti-kanser terhadap kanser kolon HT-29.
Kata kunci: Curcuma manga, HT-29, apoptosis

vii
ACKNOWLEDGEMENTS
First and foremost, I would like to express my wholehearted gratitude to
Professor Datin Dr. Sri Nurestri Abd Malek, a patient and supportive former
supervisor who had guided me all the way in my study. I also want to thank my
current supervisor, Associate Prof. Dr. Norhaniza Binti Aminudin for giving me
useful suggestion and advise. My deepest thankful to Dr. Lee Guan Serm and Dr.
Hong Sok Lai, who provide me the guidance and knowledge of basics chemistry.
Apart from that, I would like to give my appreciation to University of Malaya
that provides me a two years scholarship which is very helpful for my daily
expenses. Besides that, I would like to thank the research grant granted by the
Minister of Education, High Impact Research (HIR) grant to University of Malaya
which provides me sufficient financial support for the purchase of research materials
and grant for research service.
In addition, I also like to thank my labmates for the tremendous support. I
would also like to thank all the science officers and staffs in the Institute of
Biological Sciences and HIR laboratory. Last but not least, I would love to give my
warmest appreciation to my family and friends for their warm and emotional support
which is very much needed to go through the difficult times and months of despair
during the study.
.

viii
TABLE OF CONTENTS
Abstract ............................................................................................................................ iii
Abstrak .............................................................................................................................. v
Acknowledgements ......................................................................................................... vii
Table of Contents ........................................................................................................... viii
List of Figures ................................................................................................................. xii
List of Tables.................................................................................................................. xiv
List of Symbols and Abbreviations ................................................................................. xv
List of Appendices ......................................................................................................... xvi
CHAPTER 1: INTRODUCTION .................................................................................. 1
CHAPTER 2: LITERATURE REVIEW ...................................................................... 5
2.1 Curcuma mangga..................................................................................................... 5
2.1.1 Taxonomy and geographical distribution ................................................... 5
2.1.2 Genetic information .................................................................................... 5
2.1.3 Nutritional values ....................................................................................... 6
2.1.4 Phytochemical studies ................................................................................ 7
2.1.5 Anticancer activities ................................................................................... 9
2.2 Cancer ................................................................................................................... 12
2.2.1 Cell cycle .................................................................................................. 12
2.2.2 Hallmark of cancers .................................................................................. 14
2.2.3 Carcinogen ................................................................................................ 15
2.2.4 Carcinogenesis .......................................................................................... 16
2.3 Apoptosis in cancer ............................................................................................... 17
2.3.1 Mechanism of apoptosis ........................................................................... 19

ix
2.3.2 External pathway/ Death receptor pathway .............................................. 20
2.3.3 Internal pathway/ Mitochondrial pathway................................................ 21
2.4 Bioaasay investigation .......................................................................................... 23
2.4.1 Cytotoxicity screening .............................................................................. 23
2.4.1.1 SRB cytotoxicity screening ....................................................... 23
2.4.2 Apoptosis detection assay using fluorescence-activated cell sorting
(FACS) ..................................................................................................... 24
2.4.2.1 Terminal dUTP Nick End-Labeling (TUNEL) assay................ 24
2.4.2.2 Cell cycle analysis ..................................................................... 26
CHAPTER 3: METHODLOGY .................................................................................. 27
3.1 Extraction and fractionation of plant sample ........................................................ 27
3.1.1 Plant materials .......................................................................................... 27
3.1.2 Extraction and fractionation of plant materials ........................................ 27
3.1.2a Method A: Crude methanolic extract ........................................ 27
3.1.2b Method B: Crude dichloromethane extract ............................... 28
3.2 Cytotoxicity screening .......................................................................................... 31
3.2.1 Sulforhodamine B (SRB) assay ................................................................ 31
3.2.1.1 Cell culture and reagents ........................................................... 31
3.2.1.2 Procedures of SRB assay ........................................................... 32
3.3 Isolation of the chemical compounds ................................................................... 36
3.3.1 High pressure liquid chromatography (HPLC) ........................................ 36
3.3.2 Nuclear Magnetic Resonance (NMR) and q-Time-Of-Flight (qTOF)
mass spectrometry .................................................................................... 37
3.4 Apoptotic cell morphology assessment ................................................................ 38
3.4.1 Phase contrast microscopy ....................................................................... 38
3.4.2 Fluorescence microscopy ......................................................................... 38

x
3.5 Apoptosis biochemical assay ................................................................................ 42
3.5.1 Detection of externalization of phosphatidylserine (PS) through
binding of Annexin V to PS ..................................................................... 42
3.5.2 Detection of DNA fragmentation ............................................................. 42
3.5.3 Cell cycle analysis .................................................................................... 43
3.5.4 Western blot analysis ................................................................................ 43
3.5.4.1 Antibodies and chemicals .......................................................... 43
3.5.4.2 Sodium dodecyl sulphate polyacrylamide gel electrophoresis
(SDS-PAGE) procedures ........................................................... 44
3.6 Statistical analysis ................................................................................................. 46
CHAPTER 4: RESULTS .............................................................................................. 47
4.1 Extraction of plant materials .................................................................................. 47
4.2 Cytotoxicity assay of plant extracts and fractions ................................................. 48
4.3 Isolation and identification of chemical compounds ............................................. 52
4.3.1 CMDH and CMDM from Method B ........................................................ 53
4.4 Cytotoxicity assay of isolated pure compounds .................................................... 58
4.5 CMD extract induced morphological changes in HT-29 cells .............................. 59
4.6 Effects of CMD on induction of early and late apoptosis in HT-29 cell lines ..... 61
4.7 Effects of CMD on DNA fragmentation in HT-29 cells ....................................... 65
4.8 Effects of CMD on the cell cycle arrest and the cell cycle regulatory proteins in
HT-29 cells ............................................................................................................ 68
4.9 Effects of CMD on the level of pro-apoptotic and anti-apoptotic proteins in
HT-29 cells ....................................................................................................... 71
4.10 Cleavage of PARP-1 by CMD via the activation of caspases in HT-29 cells ..... 72
CHAPTER 5: DISCUSSION ....................................................................................... 73
5.1 Cytotoxicity screening of extracts and isolated compounds ................................. 73

xi
5.2 Apoptotic morphology of HT-29 cells induced by CMD ...................................... 76
5.3 Early- and late apoptosis event in HT-29 cells induced by CMD ......................... 76
5.4 DNA fragmentation in HT-29 cells induced by CMD .......................................... 77
5.5 Cell cycle arrest and changes of cell-cycle regulatory proteins ............................ 78
5.6 Changes of level of pro- and anti-apoptotic proteins in HT-29 cells .................... 80
5.7 Cleavage of PARP-1 through the activation of caspases ...................................... 83
CHAPTER 6: CONCLUSION ..................................................................................... 85
References ....................................................................................................................... 87
List of Publications and Papers Presented ...................................................................... 99
Appendix ....................................................................................................................... 101
xii
LIST OF FIGURES
Figure 2.1: Rhizome of Curcuma mangga ............................................................................ 5
Figure 2.2: Cell cycle phases divided into four phases: G0/G1, S, G2 and M phase ..... 13
Figure 2.3: Hallmarks of cancer ...................................................................................... 15
Figure 2.4: Extrinsic and intrinsic pathways ................................................................... 22
Figure 2.5: Schematic illustration of DNA strand-break labelling by TdT-mediated
Br-dUTP attachment to 3′OH ends and polymerization, followed by
immunocytochemical (FITC) detection of BrdU ......................................... 25
Figure 3.1: A summary of the bioassay-guided chemical investigation of rhizome C.
mangga from Method B ............................................................................... 30
Figure 3.2: The procedure of SRB assay ........................................................................ 34
Figure 3.3: A summary of the sample preparation for Hoechst 33342 and propidium
iodide double staining microscopy ............................................................... 40
Figure 4.1: Percentage of growth inhibition on various cancer cell lines (A: HT-29;
B: HCT 116; C: A549; D: CaSki) by all extracts from Method A (CMM,
CMH, CME and CMW) and Method B (CMD, CMDH and CMDM) ........ 49
Figure 4.2: HPLC profiles of CMDH and CMDM ......................................................... 54
Figure 4.3: The chemical structure of isolated compounds were elucidated and
identified as following compounds: Longpene A, Zerumin A,
Coronadiene, (E)-labda-8(17),12-dien-15,16-dial, Calcaratarin A .............. 56
Figure 4.4: Morphological changes in phase contrast microscopy ................................. 60
Figure 4.5: Nuclear morphological changes under fluorescence microscopy ................ 61
Figure 4.6: CMD induced externalization of PS in HT-29 ............................................. 63
Figure 4.7: CMD induced DNA fragmentation in HT-29............................................... 66
Figure 4.8: CMD induced cell cycle arrest in HT-29...................................................... 69
Figure 4.9: Effects of CMD on cell cycle regulatory proteins in HT-29 ........................ 70
Figure 4.10: Effects of CMD on the levels of pro- and anti-apoptotic proteins in HT-
29 ............................................................................................................... 71

xiii
Figure 4.11: Induction of CMD on activation of caspases and cleavage of PARP-1 in
HT-29 ......................................................................................................... 72
Figure 5.1: The transition of one phase to another phase in cell cycle is tightly
controlled and regulated through the binding of a series of cyclin-
dependant kinases (Cdks) to their respective cyclins ................................ 80

xiv
LIST OF TABLES
Table 2.1: Proximate analysis, vitamin content, and amino acid profiles of the
rhizomes of C. mangga .................................................................................. 6
Table 2.2: Chemical constituents of C. mangga ............................................................... 8
Table 2.3: Summary events in cell cycle phase .............................................................. 14
Table 3.1: Basic medium and different supplements for different cancer cell lines ....... 32
Table 4.1: Yield of crude and fractioned extracts of C. mangga rhizome from Method
A and Method B ............................................................................................ 48
Table 4.2: Cytotoxic activities (IC50 values) of extracts from Method A on various
cancer cell lines and human normal cell (CCD-18Co) in comparison to
Doxorubicin .................................................................................................. 51
Table 4.3: Cytotoxic activities (IC50 values) of extracts from Method B on various
cancer cell lines and human normal cell (CCD-18Co) in comparison to
Doxorubicin .................................................................................................. 52
Table 4.4: 1H NMR data of longpene A in CDCl3 .......................................................... 57
Table 4.5: 13C NMR data of longpene A in CDCl3 ......................................................... 57
Table 4.6: Yield of compounds after 100 runs of collection from semi-preparative
analysis ......................................................................................................... 58
Table 4.7: Cytotoxic activities of identified compounds on various cancer cell lines
and human normal cell (CCD-18Co) and doxorubicin after 72 hours of
incubation ..................................................................................................... 58

xv
LIST OF SYMBOLS AND ABBREVIATIONS
13C : Carbon-13
°C : Degree celcius
Δ : Delta
µ : Micro 1H : Proton
A549 : Human lung carcinoma cell line
AGS : Human gastric cancer
AIDS : Acquired immune deficiency syndrome
ALS : Autosampler
Apaf-1 : Apoptotic protease activating factor 1
ATCC : American Type Culture Collection
BIR : Baculovirus IAP repeat
Bp : Base pair
BrdU : Fluorescein-conjugated anti-Bromo deoxyuridine
BSA : Bovine serum albumin
BxPc-3 : Human pancreatic cancer
CAN : Acetonitrile
CaSki : Human cervical carcinoma cell line
Caspases : Cysteinyl aspartate-specific proteinases
CCD-18Co : Non-cancer human colon cell line
CDCl3 : Deuterated chloroform
CDK : Cyclin dependent kinase
cIAP : Cellular IAP
CMD : Crude dichloromethane extract
CMDH : n-Hexane extract (Method B)
CMDM : Methanolic extract (Method B)
CME : Ethyl acetate extract
CMH : n-Hexane extract (Method A)
CMM : Crude methanolic extract
CMW : Crude water extract
CNS : Central nervous system
CO2 : Carbon dioxide
COSY : Correlation spectroscopy
DAD : Diode array detector
DAPI : 4′,6-diamidino-2-phenylindole
DBB : DNA-binding domain
DCM : Dichloromethane
DEPT : Distortionless enhancement by polarization transfer
DIABLO : Direct IAP binding protein with low pI
DISC : Death-inducing signalling complex
DMSO : Dimethyl sulfoxide
DNA : Deoxyribonucleic acid
DR : Death receptor
DU-145 : Human prostate cancer
dUTP : Deoxyuridine-triphosphatase
ER : Estrogen receptor
ESI : Electrospray ionisation
FACS : Fluorescence-activated cell sorting

xvi
FasL/FasR : Fas ligand
FC-AS : Fraction collector
FITC : Fluorescein Isothiocyanate
HCl : Hydrochloric acid
HCT 116 : Human colorectal carcinoma cell line
HER2 : Human epidermal growth factor receptor 2
HIR : High Impact Research
HPLC : High pressure liquid chromatography
HRP : Horseradish peroxidase
HSBC : Heteronuclear multiple-bond correlation spectroscopy
HSQC : Heteronuclear single-quantum correlation spectroscopy
HT-29 : Human colorectal adenocarcinoma cell line
HtrA2 : Omi/high temperature requirement protein A
IAF : Apoptosis inducing factor
IAP : Inhibitor of apoptosis protein
IC50 : Half maximal inhibitory concentration
J : Joule
KB : Nasopharyngeal epidermoid cell
kDa : Kilo Dalton
LD : Lethal dose
LDH : Lactate dehydrogenase leakage
LNCaP : Human prostate cancer
MCF-7 : Human breast adenocarcinoma cell line
MEM : Minimum Essential Medium
MHz : Megahertz
MRC-5 : non-cancer human fibroblast cell
mRNA : Messenger RNA
MTT : 3-(4,5-Dimethylthiazol-2-Yl)-2,5-diphenyltetrazolium bromide
NADH : Nicotinamide Adenine Dinucleotide
NCI : National Cancer Institute
NMR : Nuclear Magnetic Resonance
NOESY : Nuclear Overhauser effect spectroscopy
OD : Optical density
OMM : Outer mitochondrial membrane
PARP-1 : Poly-ADP-ribose-polymerase-1
PBS : Phosphate buffer saline
PBST : Phosphate buffer saline with Tween-20
PC-3 : Prostate cancer cell
PI : Propidium iodide
PS : Phosphatidylserine
RIPA : Radioimmunoprecipitation assay
RIPs : Ribosome-Inactivating Proteins
RNA : Ribonucleic acid
rpm : Revolutions per minute
RPMI : Roswell Park Memorial Institute 1640
SD : Standard deviation
SDS : Sodium dodecyl sulphate
PAGE : Polyacrylamide gel electrophoresis
Smac : Second mitochondria-derived activator
SRB : Sulforhodamine B

xvii
LIST OF APPENDICES
Appendix 1: The 1H NMR spectral of longpene A ....................................................... 101
Appendix 2: The 1H NMR spectral of longpene A (Expansion 1) ............................... 102
Appendix 3: The 1H NMR spectral of longpene A (Expansion 2) ............................... 103
Appendix 4: The 1H NMR spectral of longpene A (Expansion 3) ............................... 104
Appendix 5: The 13C NMR spectral of longpene A ...................................................... 105
Appendix 6: The 13C NMR spectral of longpene A (Expansion1) ............................... 106
Appendix 7: The DEPTQ NMR spectral of longpene A .............................................. 107
Appendix 8: The DEPTQ NMR spectral of longpene A (Expansion 1) ....................... 108
Appendix 9: The HSQC NMR spectral of longpene A................................................. 109
Appendix 10: The HSQC NMR spectral of longpene A (Expansion 1) ....................... 110
Appendix 11: The HMBC NMR spectral of longpene A ............................................. 111
Appendix 12: The HMBC NMR spectral of longpene A (Expansion 1) ...................... 112
Appendix 13: The HMBC NMR spectral of longpene A (Expansion 2) ...................... 113
Appendix 14: The HMBC NMR spectral of longpene A (Expansion 3) ...................... 114
Appendix 15: The 1H NMR spectral of zerumin A....................................................... 115
Appendix 16: The 1H NMR spectral of zerumin A (Expansion 1) ............................... 116
Appendix 17: The 1H NMR spectral of zerumin A (Expansion 2) ............................... 117
Appendix 18: The 1H NMR spectral of zerumin A (Expansion 3) ............................... 118
Appendix 19: The 13C NMR spectral of zerumin A ..................................................... 109
Appendix 20: The 13C NMR spectral of zerumin A (Expansion 1) .............................. 120
Appendix 21: The 1H NMR spectral of coronadiene .................................................... 121
Appendix 22: The 1H NMR spectral of coronadiene (Expansion 1) ............................ 122
Appendix 23: The 1H NMR spectral of coronadiene (Expansion 2) ............................ 123
xviii
Appendix 24: The 1H NMR spectral of coronadiene (Expansion 3) ............................ 124
Appendix 25: The 13C NMR spectral of coronadiene ................................................... 125
Appendix 26: The 13C NMR spectral of coronadiene (Expansion 1) ........................... 126
Appendix 27: The 1H NMR spectral of (E)-labda-8(17),12-diene-15,16-dial .............. 127
Appendix 28: The 1H NMR spectral of (E)-labda-8(17),12-diene-15,16-dial
(Expansion 1)......................................................................................... 128
Appendix 29: The 1H NMR spectral of (E)-labda-8(17),12-diene-15,16-dial
(Expansion 2)......................................................................................... 129
Appendix 30: The 1H NMR spectral of (E)-labda-8(17),12-diene-15,16-dial
(Expansion 3)......................................................................................... 130
Appendix 31: The 13C NMR spectral of (E)-labda-8(17),12-diene-15,16-dial ............. 131
Appendix 32: The 13C NMR spectral of (E)-labda-8(17),12-diene-15,16-dial
(Expansion 1)......................................................................................... 132
Appendix 33: The mass spectral of longpene A ........................................................... 133
Appendix 34: The mass spectral of zerumin A ............................................................. 133
Appendix 35: The mass spectral of coronadiene .......................................................... 134
Appendix 36: The mass spectral of (E)-labda-8(17),12-diene-15,16-dial .................... 134
Appendix 37: The determination of protein concentration of treated sample using
BSA standard curve ............................................................................... 135

1
1
CHAPTER 1: INTRODUCTION
On 1966, Francis Peyton Roux, a tumour virologist and Nobel winner stated that the
special and interesting pattern method of a tumour which can kill a man that are
widespread, invasive, incontrollable and reduced growth. The definition of tumour or
cancer by Roux during that time is almost similar with the new refine meaning of cancer
nowadays. Currently, cancer is defined as a class of disease with ungoverned cell
proliferation and spreading of mutated cells (Society, 2015). Uncontrolled and
spreading of cancer can lead to death by causing malnutrition through nutrient
competition with normal cells and weaken our body immune system (Lam, 2003).
The World Cancer Report (2008) estimated that 12 million new cases of cancer were
diagnosed; 7 million cancer deaths and 25 million people were living with cancer in
2008 alone. It is expected by 2030 that there will be 17 million cancer deaths annually;
27 million incident cases of cancer and 75 million people are living with cancer within
five years of diagnosis (Boyle & Levin, 2008). Cancer incidences are associated with
aging, unhealthy lifestyle including unbalanced diets and lack of physical activities,
smoking, environmental pollutants, infectious agents such as hepatitis B virus and
human papillomavirus, ultra violet radiations and occupational hazards (Boyle & Levin,
2008; Kleinsmith, 2006; Lim, 2002; Mack, 2004). Over the years, tobacco smoking is
found to be responsible for about 30.0%, while infectious agents contributed about
20.0% of all deaths due to cancers worldwide (Boyle & Levin, 2008).
Typically, the conventional treatments for cancer are surgery, chemotherapy and
radiotherapy (Chorawala et al., 2012; Portugal et al., 2009). Surgery is most direct and
efficient way to cure cancer disease by directly removing the localized tumours (Lam,
2003). However, surgery process is far less effective against cancers that spread
throughout the body and it also increased the risks of bacterial infection that might

2
cause fatality during the surgery. Conventional chemotherapy utilized a variety of
cytotoxic drugs to treat localized and metastasized cancers (Cellarier et al., 2003;
Chidambaram et al., 2011; Chorawala et al., 2012). Unfortunately, the processes of
cancer cell are similar to normal cell and their differences lies in their activities but not
functions. Therefore, normal cell would be killed along with the cancer cells during
chemotherapy. Radiotherapy is usually the last option of cancer treatment and it has the
same problem like chemotherapy which is causing damage to normal cell. There is a
limit for patient to undergo radiotherapy because the patient might die from radiation
poisoning since exposure to radiation has cumulative effects. The side effects of
conventional treatments are bone marrow suppression, depression, emesis weight loss,
nausea, weakness, hair loss, and anaemia, and acute kidney failure, induction of
oxidative stress and reduction of intrinsic plasma antioxidant (Ajith et al., 2008; Ajith et
al., 2007; Avendaño & Menéndez, 2008; Borek, 2004; Lam, 2003; S. Sharma & K.
Gupta, 1998; Sharma et al., 1997). Thus, a more specific and high efficacy anticancer
drug with minimal harmful to our body is needed.
Natural product is one of the best alternatives for new anticancer agent development.
Natural product is playing an important role in traditional medicines and it serves as the
most fundamental and basis of earlier drugs (Butler et al., 2014). Over half of the
world’s population especially those from the developing country is depending on
traditional plant-derived medicines for their primary health care and plant have a long
history in application of cancers’ treatment (Cragg et al., 2009). Herbal or plant-derived
medicines typically contain different type of pharmacologically active compounds that
contribute to different therapeutic effect in disease treatment included cancer (Ernst,
2005). Among the best-known plant-derived anticancer agents applied in clinical use are
the vinca alkaloids, vinblastine, vincristine, taxanes, campothcin derivatives and others
(Cragg & Newman, 2013; Prakash et al., 2013).
3
Turmeric have been documented at least for 6,000 years in history of medicine
(Ravindran, 2007). Curcuma mangga, a species of rhizome plant under the family of
Zingiberaceae, is first reported in the Andaman Island, India in year 1984 (Balakrishnan
& Bhargava, 1984). C. mangga is locally known as “Temu mangga/kunyit putih’ in
Indonesia and “Khamin khao’ in Thailand (Ali et al., 2010) while it is known as “Temu
pauh’ in Malaysia because of the pleasant mango-scent rhizomes. It can be found in
Peninsular Malaysia, Thailand, Indonesia and India. C. mangga is one of the many
plants which is quite often used in traditional medicinal in Indonesia, mainly used to
treat fever, stomach-ache and chest pain. In our search for potentially active ingredients
from C. mangga, we have set out to conduct intensive investigations with the following
objectives:
1. To determine the active fractions from the rhizomes of C. mangga by evaluating the
growth inhibitory effect of crude extract, fractionated extracts against selected
cancer cells (HCT116, HT-29, A549 and CaSki) by SRB assay in a concentration-
and time-dependent manner
2. To isolate and identify bioactive compounds from the biologically active fractions
of C. mangga
3. To observe the induction of apoptosis by examining the morphological
characteristics and expression level of apoptotic protein of HT-29 cells when treated
with dichloromethane extract (CMD) using phase contrast microscopy. fluorescence
microscopy via Hoechst PI double dye-staining assay and western blot.
4. To investigate the induction of apoptosis in HT-29 cells treated with CMD through
the TUNEL assay using flow cytometry analysis.
5. To investigate the effect of CMD on the cell cycle of HT-29 cells.

4
6. To determine the percentage of cells in CMD treated through externalization of
phosphotidylserine using Annexin V-FITC/PI staining and flow-cytometry analysis.

5
CHAPTER 2: LITERATURE REVIEW
2.1 Curcuma mangga
2.1.1 Taxonomy and geographical distribution
The similar and unique aroma of the unripe mango rhizome of C. mangga and C.
amada makes these two species to distinguish from one another (Babu et al., 2011;
Leong-Škorničková et al., 2010). However, the inflorescences produced by these two
species are different where C. mangga produced lateral inflorescence while C. amada
produced terminal inflorescence (Babu et al., 2011; Leong-Škorničková et al., 2010).
Besides that, C. mangga mostly found in Indonesia while C. amada is native to Eastern
India (Babu et al., 2011).
2.1.2 Genetic information
Up-to-date, there are no more than ten research works on the genomic studies and
genetic profiling on Curcuma species (Apavatjrut et al., 1996; Ardiyani, 2003; Joseph et
al., 1999; Leong-Skornickova et al., 2007; Prana et al., 1978; Sirisawad et al., 2003;
Skornickova & Sabu, 2005). Genetic data on C. mangga is limited where so far only
two investigations which were done by Prana et al. (1978) and Ardiyani (2003). Prana
Figure 2.1: Rhizome of Curcuma mangga
6
et al. (1978) and Škorničková et al. (2007) showed similar findings that the C. mangga
have 42 diploid numbers but Ardiyani (2003) reported the presence of 63 diploid
numbers.
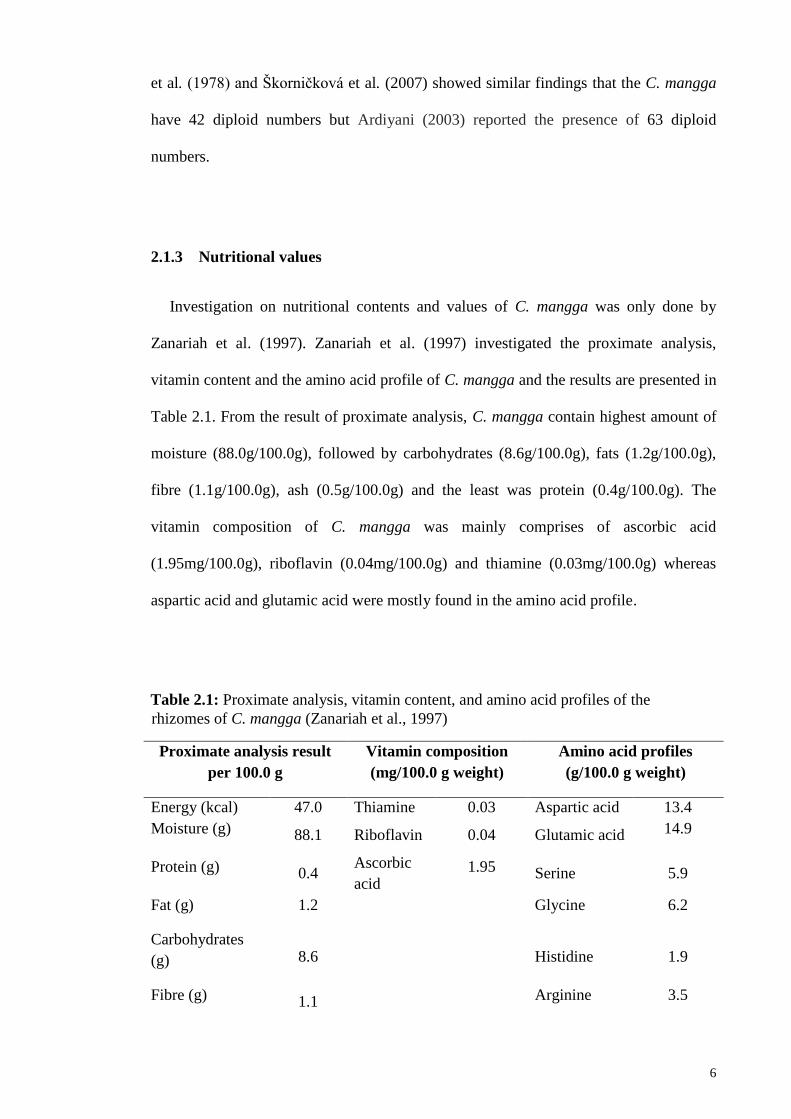
2.1.3 Nutritional values
Investigation on nutritional contents and values of C. mangga was only done by
Zanariah et al. (1997). Zanariah et al. (1997) investigated the proximate analysis,
vitamin content and the amino acid profile of C. mangga and the results are presented in
Table 2.1. From the result of proximate analysis, C. mangga contain highest amount of
moisture (88.0g/100.0g), followed by carbohydrates (8.6g/100.0g), fats (1.2g/100.0g),
fibre (1.1g/100.0g), ash (0.5g/100.0g) and the least was protein (0.4g/100.0g). The
vitamin composition of C. mangga was mainly comprises of ascorbic acid
(1.95mg/100.0g), riboflavin (0.04mg/100.0g) and thiamine (0.03mg/100.0g) whereas
aspartic acid and glutamic acid were mostly found in the amino acid profile.
Proximate analysis result
per 100.0 g
Vitamin composition
(mg/100.0 g weight)
Amino acid profiles
(g/100.0 g weight)
Energy (kcal) 47.0 Thiamine 0.03 Aspartic acid 13.4
Moisture (g) 88.1 Riboflavin 0.04 Glutamic acid 14.9
Protein (g) 0.4 Ascorbic
acid 1.95 Serine 5.9
Fat (g) 1.2 Glycine 6.2
Carbohydrates
(g) 8.6 Histidine 1.9
Fibre (g) 1.1 Arginine 3.5
Table 2.1: Proximate analysis, vitamin content, and amino acid profiles of the
rhizomes of C. mangga (Zanariah et al., 1997)

7
Proximate analysis result
per 100.0 g
Vitamin composition
(mg/100.0 g weight)
Amino acid profiles
(g/100.0 g weight)
Ash (g) 0.5 Threonine 1.0
Alanine 3.0
Proline 6.2
Tyrosine 2.6
Valine 6.4
Isoleucine 3.9
Leucine 8.2
Phenlyalanine 5.0
Lysine 0.7
2.1.4 Phytochemical studies
Myrcene is one of the main constituent in the essential oil of the rhizomes of C.
mangga with the amount ranging from 46.5% to 81.4% (Jantan et al., 1999; Wahab et
al., 2011; Wong et al., 1999). Abas et al. (2005), Liu and Nair (2011) and Malek et al.
(2011) are among researchers that have reported the investigations on the chemical
constituents isolated from C. mangga. Cucurmanggoside is one of the new labdane
diterpene glucoside identified by Abas et al. (2005) from the rhizomes of C. mangga
together with other known compounds and the chemical constituents isolated from C.
mangga are summarized in Table 2.2.
Table 2.1, continued

8
Compounds References
cucurmanggoside (Abas et al.,
2005)
labda-8(17),12-diene-15,16-dial
(Abas et al.,
2005; Liu &
Nair, 2011;
Malek et al.,
2011)
calcaratarin A
(Abas et al.,
2005; Liu &
Nair, 2011)
zerumin B
(Abas et al.,
2005; Liu &
Nair, 2011)
scopoletin (Abas et al.,
2005)
demethoxycurcumin
(Abas et al.,
2005;
Kaewkrock et
al., 2009; Malek
et al., 2011;
Tewtrakul &
Subhadhirasakul,
2008)
bisdemethoxycurcumin (Abas et al.,
2005)
1,7-bis(4-hydroxypehnyl)-1,4,6-heptatrien-3-one (Abas et al.,
2005)
curcumin
(Abas et al.,
2005; Malek et
al., 2011)
p-hydroxycinnamic acid (Abas et al.,
2005)
(E)-15,16-bisnorlabda-8(17),11-dien-13-on
(Kaewkrock et
al., 2009; Malek
et al., 2011;
Tewtrakul &
Subhadhirasakul,
2008)
(E)-15,15-diethoxylabda-8(17),12-dien-16-al (Kaewkrock et
al., 2009)
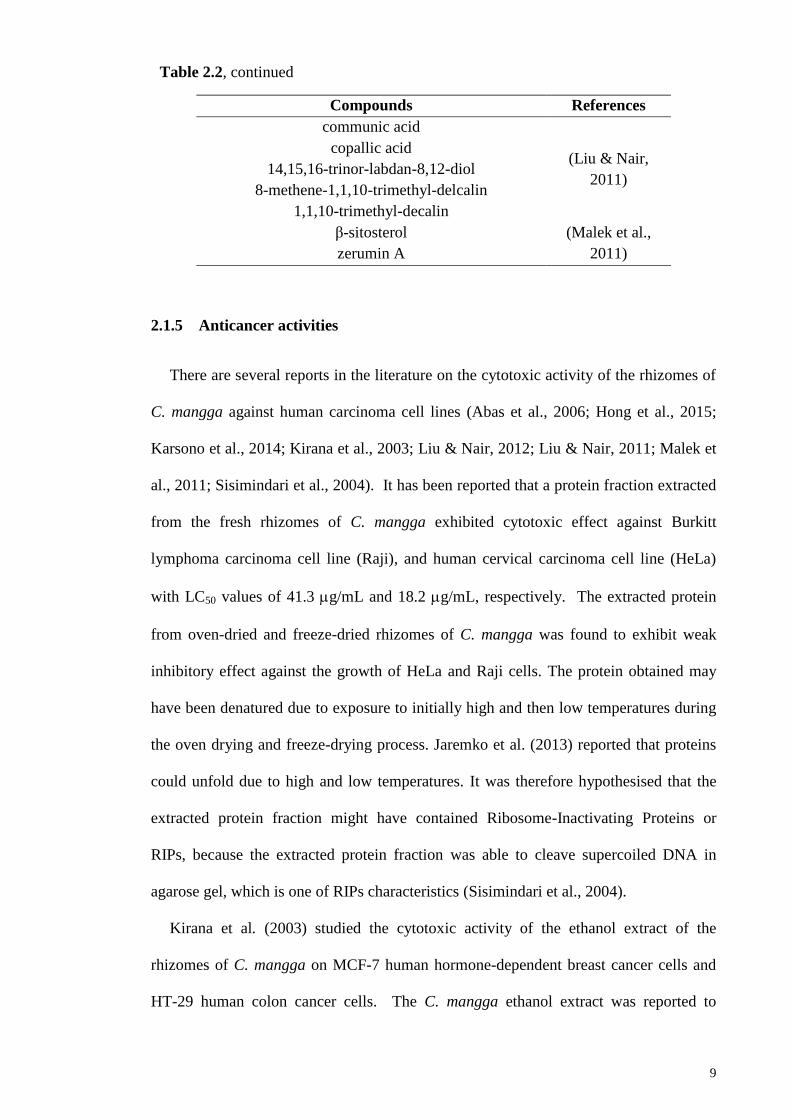
Table 2.2: Chemical constituents of C. mangga
9
Compounds References
communic acid
(Liu & Nair,
2011)
copallic acid
14,15,16-trinor-labdan-8,12-diol
8-methene-1,1,10-trimethyl-delcalin
1,1,10-trimethyl-decalin
β-sitosterol (Malek et al.,
2011) zerumin A
2.1.5 Anticancer activities
There are several reports in the literature on the cytotoxic activity of the rhizomes of
C. mangga against human carcinoma cell lines (Abas et al., 2006; Hong et al., 2015;
Karsono et al., 2014; Kirana et al., 2003; Liu & Nair, 2012; Liu & Nair, 2011; Malek et
al., 2011; Sisimindari et al., 2004). It has been reported that a protein fraction extracted
from the fresh rhizomes of C. mangga exhibited cytotoxic effect against Burkitt
lymphoma carcinoma cell line (Raji), and human cervical carcinoma cell line (HeLa)
with LC50 values of 41.3 g/mL and 18.2 g/mL, respectively. The extracted protein
from oven-dried and freeze-dried rhizomes of C. mangga was found to exhibit weak
inhibitory effect against the growth of HeLa and Raji cells. The protein obtained may
have been denatured due to exposure to initially high and then low temperatures during
the oven drying and freeze-drying process. Jaremko et al. (2013) reported that proteins
could unfold due to high and low temperatures. It was therefore hypothesised that the
extracted protein fraction might have contained Ribosome-Inactivating Proteins or
RIPs, because the extracted protein fraction was able to cleave supercoiled DNA in
agarose gel, which is one of RIPs characteristics (Sisimindari et al., 2004).
Kirana et al. (2003) studied the cytotoxic activity of the ethanol extract of the
rhizomes of C. mangga on MCF-7 human hormone-dependent breast cancer cells and
HT-29 human colon cancer cells. The C. mangga ethanol extract was reported to
(Continued)
Table 2.2, continued
10
exhibit weak cytotoxic activity against both cells with IC50 values of 44.7 ± 2.7 µg/mL
and 91.0 ± 5.9 µg/mL, respectively. In 2011, Liu and Nair reported that methanol,
water and ethyl acetate extracts of the rhizomes of C. mangga showed mild cytotoxic
effects against human lung, stomach, colon, central nervous system (CNS) and breast
carcinoma cell lines with percentage of growth inhibition ranging from 9% to 46% at
200 µg/mL. In the same study, the ethyl acetate extract exhibited no activity on CNS
carcinoma cell lines. In the following year, Liu and Nair (2012) found that the methanol
and water extracts of the leaves of C. mangga exhibited slightly stronger cytotoxic
activity in comparison to the rhizomes extracts with growth inhibition percentage
ranging from 18% to 46% against prostate (DU-145 and LNCaP), gastric (AGS) and
pancreatic (BxPc-3) human cancer cells at 100 µg/mL. These findings were in
agreement with Malek et al. (2011) who reported that the methanol extract of the
rhizomes of C. mangga showed only mild cytotoxic activity against MCF-7,
nasopharyngeal epidermoid cell line (KB), lung cell line (A549), cervical cell line (Ca
Ski), colon cell line (HCT 116) and HT-29 cells with IC50 values ranging from 22.0
1.1 to 36.8 3.8 µg/mL.
In the same communication, Malek et al. (2011) reported that the hexane fraction
exhibited good cytotoxic activity against MCF-7, KB, A549, Ca Ski, and HT-29 cells
with IC50 values ranging from 8.1 0.2 to 17.9 0.3 g/mL while the ethyl acetate
fraction showed moderate cytotoxic activity against MCF-7, KB, A549, HCT116, and
HT-29 cells with IC50 values ranging from 18.5 0.1 to 47.1 0.5 g/mL. The
methanol extract and its hexane and ethyl acetate fractions were not toxic to non-cancer
human fibroblast cell line MRC-5, which was in agreement with Kirana et al. (2003)
who reported that the ethanol extract of C. mangga has low toxicity toward SF 3169
skin fibroblasts.

11
Studies by Widowati et al. (2011) reported that the ethanol extract of the rhizomes of
C. mangga showed no antiproliferative activity against human breast ductal carcinoma
cell line, T47D. Again, in 2013, Widowati and colleagues investigated the
antiproliferative activity of the aqueous ethanol of the rhizomes of C. mangga and found
the extract showed no antiproliferative activity against the same cell line, T47D. The
results obtained by Widowati et al. (2013) were in agreement with those obtained by
Liu and Nair (2011) and Malek et al. (2011). Both T47D and MCF-7 cells are classified
under the same cluster (Luminal A), where both cells shared the same characteristics
such as lack of expression of human epidermal growth factor receptor 2 (HER2),
expressed estrogen receptor (ER), amenable to hormone therapy and chemotherapy and
expressed low Ki67, which is proliferation marker in breast cancer (Holliday & Speirs,
2011). The lack of antiproliferative activity reported by Widowati et al. (2011) may be
due to low exposure time of the extract to the cells as they treated T47D cells for 24
hours, while other researchers treated cancer cell lines for at least 72 hours (Abas et al.,
2006; Kirana et al., 2003; Malek et al., 2011). Thus, it can be deduced that the
antiproliferative activity exhibited by the extracts of the rhizomes of C. mangga is time
dependent, where the growth inhibition is very low within 24 hours of treatment and
highest after 72 hours.
Karsono et al. (2014) reported that 70% aqueous ethanol extract exhibited reduction
of prostate cancer (PC-3) cell viability from 100.0% (control) to 25.7% at concentration
ranged between 50 – 200 g/mL after 24 hours treatment. In the following year, Hong
et al. (2015) reported that the hexane (CMH) and ethyl acetate (CME) extract of C.
mangga rhizome exhibited cell inhibition on HT-29 after 24 hours treatment with IC50
values of 39.3 6.0 g/mL and 32.2 2.7 g/mL respectively. Both studies also
showed the almost similar pattern of results on the cell cycle distribution where the

12
accumulation of cell at G0/G1 and cell reduction in S phase either treated with aqueous
or non-aqueous extract. Cell accumulation at G2/M and S phase disappeared at the
highest dose (200 g/mL) in studies by Karsono et al. (2014) while there was still cell
accumulation at G2/M and S phase even at the highest dose of 40 g/ml shown by Hong
et al. (2015). Excessive use of high concentration of extracts in Karsono et al. (2014)
might have caused the cells to experience shock and then died instantly which explained
why cell accumulation occurred in the G0 phase. However, these findings suggested the
possibility of the type of chemical constituents in the extract of C. mangga which
induced cell cycle arrest in both cells.
2.2 Cancer
2.2.1 Cell cycle
A living organism such as human originated from a single cell which then develop
into a fertilized egg, and continues to grow and develop to form a human being housed
50 trillion living cells in the body (Boerner et al., 2002). Duplication of the numerous
materials is one of the criteria for making two cells from a single cell where the
duplication of hereditary molecules stored in the DNA of chromosomes, is one the best
example to describe the process of a cell division (Pardee, 2002). In order for a cell to
duplicate its DNA and other cell constituents and divided into two daughter cells, cells
must enter into four individual phases called G1 phase, S phase, G2 phase and M phase
in order to complete the task. Combination of these phases known as cell cycle.
Cell cycle is generally illustrated with a circular diagram (Figure 2.2). Cell cycle can
be divided into two phases called interphase (G1 phase, S phase and G2 phase) and
mitosis (M phase). Interphase is the period when the cell begins to accumulate material
and nutrients, and doubling of the genetic molecules before undergoes mitosis where the

13
mitophase is the period when separation from one original cell (“mother cell”) and split
into two daughter cells with identical genome and DNA information (Behl & Ziegler,
2014; King & Cidlowski, 1998; Shackelford et al., 1999). Interphase occurs
approximately 95% and the mitosis only takes 5% for a complete cell cycle.
A sensor mechanism, called checkpoints is used to maintain the correct order of
events by monitoring the progression and transition of one phase to another phase in
cell cycle. The G in G1 and G2 phase stands for gap that act as a guardian to monitor the
condition of the extracellular and intracellular condition to ensure everything is in order
before the next cell cycle is initiated (Behl & Ziegler, 2014; King & Cidlowski, 1998;
Pardee, 2002). The event occurs in each phase are summarized in Table 2.3.
Figure 2.2: Cell cycle phases divided into four phases: G0/G1, S, G2 and M phase
(Behl & Ziegler, 2014)

14
Phase Events occur
Interphase
G1 (or known as pro-
mitotic post synthetic)
phase
Cell begins to grow, formation of cytoplasm and organelles;
synthesis of mRNA, histone protein and the enzyme of the
DNA replication machinery
S or synthesis phase Doubling of genomic data and packaging of genomic DNA
G2 (or known as
premitotic or post-
synthetic) phase
Round up and increase in general cell size; synthesis of RNA
Mitosis phase Two daughter cells are split from a single cell by separating
the doubled DNA arranged in chromosome, as well as the
cellular nucleus.
2.2.2 Hallmark of cancers
Hanahan and Weinberg (2000) suggested that cancer cells normally manifest six
essential alterations to the cell physiology that progress towards malignant growth
which are self-sufficient growth signals, insensitivity to antigrowth signals, evasion of
apoptosis, limitless replicative potential, sustained angiogenesis and tissue invasion and
metastasis (Figure 2.3). However, some new emerging hallmark of cancers had been
discovered and discussed by recent researchers.
Table 2.3: Summary events in cell cycle phase (Behl & Ziegler, 2014; King
& Cidlowski, 1998; Shackelford et al., 1999)

15
2.2.3 Carcinogen
Carcinogen is defined as an agent that can cause cancer. There are multiple factors
that can caused cancer such as radiation, chemicals, viruses and others which resulted in
the most cases of the human cancers. Carcinogens can be classified into several classes
based on the mechanisms by which these agents react on the cell or tissue. Genotoxic
carcinogens, metabolized carcinogens and physical carcinogens are the three main
classes of carcinogens. Genotoxic carcinogens like organic chemicals (hydrazine,
ethylene dibromide) are direct-acting carcinogen and have the ability to cause damage
directly to the DNA, protein and cellular constituents due to the reactivity of their
functional groups (Gooderham & Carmichael, 2002). Alternatively, metabolized
carcinogens like 2-acetylaminofluorene require the metabolic activation in order to exert
their carcinogenic properties through hydroxylation of the amide nitrogen to produce a
metabolite that has a higher carcinogenic effect than the parent molecule (Gooderham &
Carmichael, 2002). Ultraviolet radiation is one of the best example of physical
Figure 2.3: Hallmarks of cancer (Hanahan & Weinberg, 2000)
16
carcinogens that will increase the risk of carcinogenesis by exposing the radiation
energy to the biological materials and cause changes on the bonds that are holding them
which subsequently lead to chemical changes and possibly biological effects (Schwartz,
2002).
Carcinogens in the diet that trigger the initial stage include moulds and aflatoxins
(for example, in peanuts and maize), nitrosamines (in smoked meats and other cured
products), rancid fats and cooking oils, alcohol, and additives and preservatives
(Sugimura et al., 2002). The complementary of unhealthy lifestyle (smoking, poor
exercise, imbalance diet) and stressful working environment (contaminated area, high
exposure to UV radiation and chemical waste) can cumulatively lead to DNA damage
and the progression of cancer (Hecht, 2002; Schwartz, 2002; Vainio et al., 2002).
Genetic or specific of inherited trait is another important factor that will lead to the
progression of cancer besides with the exposure to carcinogens (Evans, 2002). Thus,
patients that has familial adenomatous polyposis condition are more susceptible to colon
cancer.
2.2.4 Carcinogenesis
A normal cell is regulated with multi-signalling pathways in response toward the
environmental or external factors that either promote or suppress cell growth. Loss of
regulations in a cell could lead a normal cell to transform into a neoplastic cancer cell in
multistage process and this process is known as carcinogenesis (Devi, 2005).
Carcinogenesis can be divided into three main stages which are initiation, promotion
and progression. Initiation is the first step in carcinogenesis whereby the cellular
genome begins to mutate when induced by carcinogens. The mutated genetic
information will then be carried over to the progeny cell. Alteration of a typical cell to a
17
cancer cell is controlled by a DNA sequence called oncogenes. The mutated cell in the
initiation stage is less harmful but a prolonged transformed cell which is repeatedly
exposed to carcinogens will stimulate the proliferation of the initiated cell. In addition,
expression of the initial mutation is determined by the interaction among the oncogenes
and the temporarily changes of specific gene expression can be also caused by a few
factors like lipid metabolites, cytokines and certain phorbol esters. The final stage of the
carcinogenesis is progression and during this stage, mutations and chromosomal
aberration and the increase of maglinant sub-population occured. This process could be
accelerated by prolonged exposure to carcinogenic stimuli which will lead cells to
further proliferation and growth into a tumour. Heterogeneity of the cell population will
increase as the tumour size and further lead to more mutation (Devi, 2005).
2.3 Apoptosis in cancer
Cell death is one of the important processes to maintain the balance of physiology for
most of the metazoan species (Reed, 2002). During development and aging, many cells
have undergone cell death in order to secure the development and functionality of the
body such as the formation of the organs and separation of toes during embryo
development (Elmore, 2007; Schulze-Osthoff, 2008). Programmed cell death normally
occurred through an ordered sequences of process known as “apoptosis”, a term
originated from Greek with meaning of falling of leaves from trees in autumn (Lawen,
2003; Reed, 2002; Schulze-Osthoff, 2008; Wong, 2011; Wu et al., 2001). Apoptosis
plays important role in our body such as maintaining the cell populations in tissue,
human defence system, normal embryo development and maintenance of body
homeostasis (Elmore, 2007; Rastogi & Sinha, 2010; Reed, 2002). The leverage between
cell death and cell division need be balance and be controlled regularly because
18
excessive or less activities in either cell death or division will bring consequence effects
to the body. Excessive of cell death will lead to acquired immune deficiency syndrome
(AIDS) and neurodegenerative diseases such as Alzheimer and Parkinson syndrome
while reduced of apoptosis will lead to cancer, persistent viral infection, or autoimmune
disorders (Wu et al., 2001).
Another mode of cell death is necrosis which is defined as catabolic, passive and
degraded processes that caused cell injury (Elmore, 2007; Hung & Chow, 1997; Wu et
al., 2001). Differences between necrosis and apoptosis in the context of morphological
and biochemical characteristics can be distinguished even though some of the
characteristics overlap among these two-cell death modes. Typical characteristics of
necrosis are initial cell swelling and loss of cell membrane function resulted in
increased permeability and intracellular edema; lyses of nuclear chromatin into ill-
defined plumps; dilation of organelles and lysosomal degradation that cause cell erupted
and cytosolic constituents are released into the extracellular environment that will
provoke an inflammatory responses (Bjelaković et al., 2005; Elmore, 2007; Hung &
Chow, 1997; Proskuryakov et al., 2003; Schulze-Osthoff, 2008).
In contrast, apoptosis is an anabolic, innate and genetically steering process that
eliminates the injured single cell (Bjelaković et al., 2005). The morphological changes
of apoptotic cell are characterized by pyknosis, membrane blebbing, formation of
apoptotic bodies and cell shrinkage while the biochemical changes include DNA
fragmentation and externalization of phosphotidylserine at the cell surface (Hung &
Chow, 1997; Lawen, 2003; Rastogi & Sinha, 2010; Wong., 2011; Wu et al., 2001).

19
2.3.1 Mechanism of apoptosis
The mechanism of apoptosis commonly comprises of multiple molecules that
possesses up- and down-regulatory effects. The factors that decide the fate of both pro-
and anti-apoptotic molecules are the trigger factors and cell type. It is less possible that
the apoptosis of a cell controlled by the changes of a solitary element.
Typically, a group of proteolytic enzymes known as cysteinyl aspartate-specific
proteinases (caspases) that play important roles in the process of apoptosis. Caspases
play an important role in the mechanism of apoptosis (Rastogi & Sinha, 2010; Wong.,
2011) and can be divided into initiator caspases (caspase-8, -9 and -10) and effector
caspases (caspases-3, -6 and -7). All caspases are produced in the cells as catalytically
inactive zymogen known as procaspases and are required to undergo proteolytic
activation during apoptosis (Riedl & Shi, 2004). The effector caspases are activated by
initiator caspases through cleavage at specific internal aspartate residues that split into
the large (~p20) and small subunits (~p10) where both of these subunits are tightly
associated with each other to form a caspase monomer (Riedl & Shi, 2004). In contrast,
initiator caspases are auto-activated and under apoptotic condition, the activation of
initiator caspases will trigger a cascade of downstream caspase activation which is
strictly regulated and usually requires the assembly of a multi-component complex
(Riedl & Shi, 2004). The cascade effects by the activated caspase occur through two
paths, which are extrinsic pathway or/and intrinsic pathway.
2.3.2 External pathway/ Death receptor pathway
External pathway or known as extrinsic death receptor pathways (Figure 2.4) initiate
apoptosis through the involvement of transmembrane receptor-mediated interactions
which often refers to binding of death ligands to the death receptor (Elmore, 2007;

20
Wong, 2011). Members of tumor necrosis factor (TNF) receptor gene superfamily are
one the example of death receptor that involved in the extrinsic death receptor pathway.
Common similarities shared among these members of the TNF receptor family are the
domains with enriched extracellular cyteine and consists of a cytoplasmic domain of
about 80 amino acids known as death domain. The function of death domain is
transmitting the death signal from the cell surface to the intracellular signalling
pathways and the top characterized ligands and corresponding death receptor included
FasL/FasR, TNF α/TNFR1, Apo3L/DR3, Apo2L/DR4 and Apo2L/DR5 (Elmore, 2007).
The formation of an adapter protein and the whole ligand-receptor-adaptor protein
complex, also known as death-inducing signalling complex (DISC) is the result of
binding death ligand to the death receptor. The assembly and activation of pro-caspase 8
is initiated by DISC followed by the initiation of apoptosis by activated form of caspase
8 by cleaving the downstream or other exercutioner caspases (Elmore, 2007; Lawen,
2003; Rastogi & Sinha, 2010; Riedl & Shi, 2004; Wong, 2011). Link between caspase-8
and caspase-3 and the link caspase and the mitochondria pathway through Bid.
2.3.3 Internal pathway/ Mitochondrial Pathway
Internal pathway or known as intrinsic mitochondrial pathways (Figure 2.4) initiates
apoptosis through a varied collection of non-receptor-mediated stimuli that generate
intracellular signals such as hypoxia, permanent damaged genetic materials, high
oxidative stress and concentration of cytosolic calcium ions that act directly on targets
within the cell and are mitochondrial events either in negative or positive pattern
(Elmore, 2007; Wong, 2011). One of the most significant characteristics of the intrinsic
mitochondrial pathway is the release of the pro-apoptotic protein, cytochrome c from
the mitochondria into the cell cytoplasm due to the high permeability of the
21
mitochondria caused by the intracellular stimuli (Wong, 2011). The intrinsic pathway is
regulated by a group of protein under the family Bcl-2 that consists of pro-apoptotic
protein (e.g. Bax, Bad, Bak) and anti-apoptotic protein (e.g. Bcl- 2, Bcl-W). The
function of the anti-apoptotic proteins is to prevent the release of mitochondrial
cytochrome c into cytoplasm. In contrast, the pro-apoptotic proteins enhance and
promote the release of mitochondrial cytochrome c into the cytoplasm (Wong, 2011).
Other apoptotic protein molecules such as apoptosis inducing factor (IAF), direct IAP
binding protein with low pI (DIABLO), second mitochondria-derived activator (Smac)
and Omi/high temperature requirement protein A (HtrA2) are released as well from the
intermembrane space of the mitochondria. The cytochrome c release from the
mitochondria will bind with Apaf-1 and caspase-9 to form a complex known as
apoptosome that will activate the effector caspase, caspase-3. Additionally,
Smac/DIABLO or OMI/HtrA2 promote the activation of caspase by disrupting the
interaction of inhibitor of apoptosis proteins (IAPs) with the caspases (caspase-3 or -9)
through binding to IAPs (Elmore, 2007; Wong, 2011).

22
Figure 2.4: Extrinsic and intrinsic pathways (R&D System, 2012)

23
2.4 Bioassay investigation
2.4.1 Cytotoxicity screening
Evaluation or screening of compounds for their potential cytotoxicity at cellular level
via short term in vitro cytotoxicity assays with cultured cells has been widely used as
these assays are inexpensive, rapid, sensitive and reproducible and could further reduce
the use of animals for LD50 and other similar tests (Borenfreund et al., 1988; Chiba et al.,
1998; Fotakis & Timbrell, 2006; Weyermann et al., 2005). The common methods that
used for determine cell viability after exposure to toxic compounds are methyl
tetrazolium (MTT) assay, lactate dehydrogenase leakage (LDH) assay and neutral red
assay (Fotakis & Timbrell, 2006). However, a better and novel approach of cytotoxicity
screening method was discovered and it is known as the sulforhodamine B (SRB) assay.
Therefore, the modified SRB cytotoxicity assay described by Houghton et al. (2007)
was utilised to determine the cytotoxic activity of the extracts and isolated compounds
from C. mangga.
2.4.1.1 SRB cytotoxicity assay
There were two main techniques used to determine the cytotoxic effect of the natural
products. These techniques include the reagents 3-(4,5-Dimethylthiazol-2-Yl)-2,5-
diphenyltetrazolium bromide (MTT) and 2,3-bis(2-methoxy-4-nitro-5-sulphophenyl)-
2H-tetrazolium-5-carboxanilide sodium salt (XTT). These reagents used in tetrazolium-
based assays are dependant to the metabolic reduction by mitochondria in viable cells to
produce a coloured formazan product. However, if the activities of the mitochondria
were inhibited by cellular levels of NADH and glucose, or disrupted by other factors, it
would affect and afford varies and inconsistent results. (Houghton et al., 2007).

24
SRB assay was first developed in year 1990 by Skehan et al. and this cytotoxicity
screening method was eventually adapted by the National Cancer Institute (NCI) for the
routine use of in vitro antitumor screen (Papazisis et al., 1997; Skehan et al., 1990).
SRB is an anionic bright pink aminoxanthene protein dye with two sulfonic groups and
it has the molecular formula of C27H30N2O7S2 and molecular weight of 558.66 (Voigt,
2005). The SRB dye electrostatically and pH-dependently binds to the protein basic
amino acid residues. In other word, the SRB assay relies on the measurement of whole
protein content of the cell based on the binding of SRB dye on the basic amino acid of
the cell (Vichai & Kirtikara, 2006). Compared to MTT assay, the SRB assay produces
higher sensitivity and linearity results which are suitable for the study of
chemosensitivity for sub-confluent monolayer and multilayer cell clusters that contain
high cell numbers. SRB assay was also more stable than MTT assay which allowed the
plates to be stored for up to months (Keepers et al., 1991). The other advantages of
using SRB assay are inexpensive, rapid detection and a better signal-to-noise ratio
(Keepers et al., 1991; Papazisis et al., 1997; Skehan et al., 1990; Vichai & Kirtikara,
2006; Voigt, 2005).
2.4.2 Apoptosis detection assay using fluorescence-activated cell sorting (FACS)
2.4.2.1 Terminal dUTP Nick End-Labeling (TUNEL) assay
DNA laddering is a technique used to visualize the endonuclease cleavage products
of apoptosis (Wyllie, 1980). TUNEL assay was first described and established by
Gavrieli and co-worker in year 1992. TUNEL assay is one of the few methods used to
detect DNA fragmentation through the incorporation of the enzyme terminal
deoxynucleotidyl transferase (TdT) to the labelled deoxyuridine-triphosphatase (dUTP)
into free 3’-hydroxyl termini while resulted from the breakage of genomic DNA into

25
high molecular weight single stranded DNA and low molecular weight double stranded
DNA (Ito et al., 2006; Kressel & Groscurth, 1994; Kumari et al., 2008; Loo, 2002;
Martinez et al., 2010; Taatjes et al., 2008). Pre-fixation of cells with crosslinking agents
such as ethanol or formaldehyde is important to prevent the extraction of small DNA
fragments (Huang et al., 2005; Wlodkowic et al., 2011). Typically, the labelling of
double strands breaks procedure (Figure 2.5) is completed with only fluorescein-
conjugated anti-Bromo deoxyuridine (BrdU) antibody, or combined with another colour
fluorochrome of DNA binding staining dye such as propidium iodide. The double
staining in TUNEL assay allowed the users to distinguish apoptotic and non-apoptotic
cells as well as cell distribution in these sub-populations (Huang et al., 2005). The
advantages of TUNEL assay are high sensitivity, cheap and easy to handle and therefore,
this assay is considered as a general method for detection of DNA fragmentation and
identifying apoptotic cell under the appropriate condition (Loo, 2002; Wlodkowic et al.,
2011).
Figure 2.5: Schematic illustration of DNA strand-break labelling by TdT-mediated
Br-dUTP attachment to 3’OH ends and polymerization, followed by
immunocytochemical (FITC) detection of BrdU (Huang et al., 2005)
26
2.4.2.2 Cell cycle analysis
Cell cycle analysis is used to determine the stage when the cells are growth arrested.
The DNA content is different in different type of phases. The cell cycle analysis
depends on the intensity of stain binding to the DNA which directly reflects the content
of DNA within the cell (Darzynkiewicz, 2010; Nunez, 2001; Pozarowski &
Darzynkiewicz, 2004; Rabinovitch, 1993). The stained materials or cells are then
analyzed using flow cytometer to measure the emitted fluorescence by stained materials.
The measured fluorescence is converted into electronic pulse which is proportional to
the amount of DNA content (Nunez, 2001). There are many types of different dye
which have high affinity towards DNA such as propidium iodide (PI), 4′,6-diamidino-2-
phenylindole (DAPI) and Hoechst dye. For PI, addition of RNAse A is important to
digest the RNA and prevent false positive outcome during the staining process because
PI can bind to both DNA and double stranded RNA (Darzynkiewicz, 2010; Nunez,
2001; Pozarowski & Darzynkiewicz, 2004). DAPI and Hoechst dye bind to the minor
groove of DNA and thus addition of RNAse is not required. Other parameters should be
of concerned to improve the analyzing of DNA content within the cells which include
cell numbers for analysis and type of fixation agent such as ethanol or formaldehyde
(Darzynkiewicz, 2010). When the stained materials analyzed using flow cytometer, the
doublet which might be form when cells clumped together after cell fixation should be
excluded as this would produce false high DNA content in the G2/m phase. The doublet
is actually two singlet cell clumped together in the G0/G1 phase (Darzynkiewicz, 2010;
Nunez, 2001; Pozarowski & Darzynkiewicz, 2004).
27
CHAPTER 3: METHODOLOGY
3.1 Extraction and fractionation of plant sample
3.1.1 Plant material
The rhizomes of C. mangga were obtained from Yogjakarta, Indonesia in July 2014.
A voucher specimen (voucher number: HI 1331) was deposited in the Herbarium of
Institute of Biological Sciences, Faculty of Science, University of Malaya.
3.1.2 Extraction and fractionation of plant materials
Two methods (Method A and Method B) were employed for the extraction and
fractionation procedure. The difference between these methods was the solvent used in
the extraction of the crude extract. However, Method B was selected as a final choice in
the plant extraction and fractionation and this will be further discussed in Section 3.3.1.
Both methods are summarized in Section 3.1.2a and 3.1.2b.
3.1.2a Method A: Crude methanolic extract
The dried, ground and powdered rhizome C. mangga (1.0 kg) was soaked in
methanol for three days at room temperature. The solvent containing extract was then
decanted, dried with anhydrous sodium sulphate and evaporated using a rotary
evaporator (Buchi, Model: R-210), yielded 106.4g of dark brown methanol extract
(CMM). The crude methanol extract was then extracted with hexane until the solvent
was colourless. The extracting solvent was subsequently dried with anhydrous sodium
sulphate and evaporated to obtain a yellowish-brown extract (CMH).

28
The insoluble residue was further fractionated using a mixture of ethyl acetate
and water (ratio 1;1) and two layers of liquid were obtained with the ethyl acetate at the
top layer. This ethyl acetate layer was separated from the aqueous layer using a
separating funnel. The aqueous layer was extracted repeatedly with fresh ethyl acetate
until the extracting solvent become colourless. All ethyl acetate layers obtained were
combined and dried with anhydrous sulphate, then evaporated to obtain a sticky dark
brown fraction (CME). The aqueous layer was evaporated to remove any extracting
solvent and then freeze dried to obtain a gummy light brownish yellow extract (CMW).
The yield of crude methanolic extracts, hexane, ethyl acetate and water fractions are
shown in Table 4.1. The percentage of the fractions was calculated based on the yield of
crude methanolic extracts.
3.1.2b Method B: Crude dichloromethane extract
Dried powdered rhizomes of C. mangga (1.0kg) were soaked in dichloromethane
(DCM) for three days at room temperature. The solvent was removed, desiccated with
anhydrous sodium sulphate and evaporated using a rotary evaporator to yield a
yellowish-brown crude DCM extract (CMD). The CMD was then extracted with n-
hexane until the solvent became colourless. The solvent-containing extract was then
dried with anhydrous sodium sulphate and evaporated using a rotary evaporator to give
a yellowish oily hexane fraction (CMDH). The hexane-insoluble residue was then
further dissolved in methanol which was then dried with anhydrous sodium sulphate.
After filtration, the filtrate was evaporated to give a dark yellowish brown methanolic
fraction (CMDM).

29
The extraction procedure is shown in Figure 3.1. The yield of crude DCM extracts
(CMD), hexane (CMDH) and methanolic fractions (CMDM) are shown in Table 4.1.
The percentage of the fractions was calculated based on the weight of the DCM extracts.

30
Figure 3.1: A summary of the bioassay-guided chemical investigation of rhizome
C. mangga from Method B
Soaked in DCM for 3 days at room temperature
Filtration and removal of solvent
Extraction with n-hexane
Filtration and
removal of solvent
Dissolved with methanol
Filtration and
removal of solvent
Dried, ground C. mangga rhizome
Crude dichloromethane extract (CMD)
n-Hexane layer n-Hexane insoluble residue
n-Hexane extract (CMDH)
Methanol layer
Methanolic extract (CMDM)
Cytotoxicity assay
Active fractions
Active chemical compounds
Apoptosis biochemical assay
Apoptotic morphology detection
31
3.2 Cytotoxicity screening
3.2.1 Sulforhodamine B (SRB) assay
The cytotoxic effects of the CMD, CMDH, CMDM and isolated pure compounds
were investigated performed with SRB assay as described by Houghton et al. (2007)
with modification against the following selected human cancer cell lines, namely HT-29
(human colorectal adenocarcinoma cell line), HCT-116 (human colorectal carcinoma
cell line), A549 (human lung carcinoma cell line). CaSki (human cervical carcinoma
cell line) and CCD-18Co (non-cancer human colon cell line)
3.2.1.1 Cell culture and reagents
All cell lines were purchased from American Type Culture Collection (ATCC, USA).
Type of basic media and supplements for each cell lines are shown in Table 3.1 and all
supplements were purchased from Sigma-Aldrich, USA. All cells were grown in 25cm3
tissue culture flasks (Corning, USA). The cell lines were incubated and maintained in
incubator (Esco, Model: CCL-170B-8) under condition of humidified 5.0% CO2
atmosphere at 37°C. When the cells achieved 80-90% confluency, they were detached
by accutase (Sigma-Aldrich) and sub-cultured into new sterile culture flasks for further
propagation.
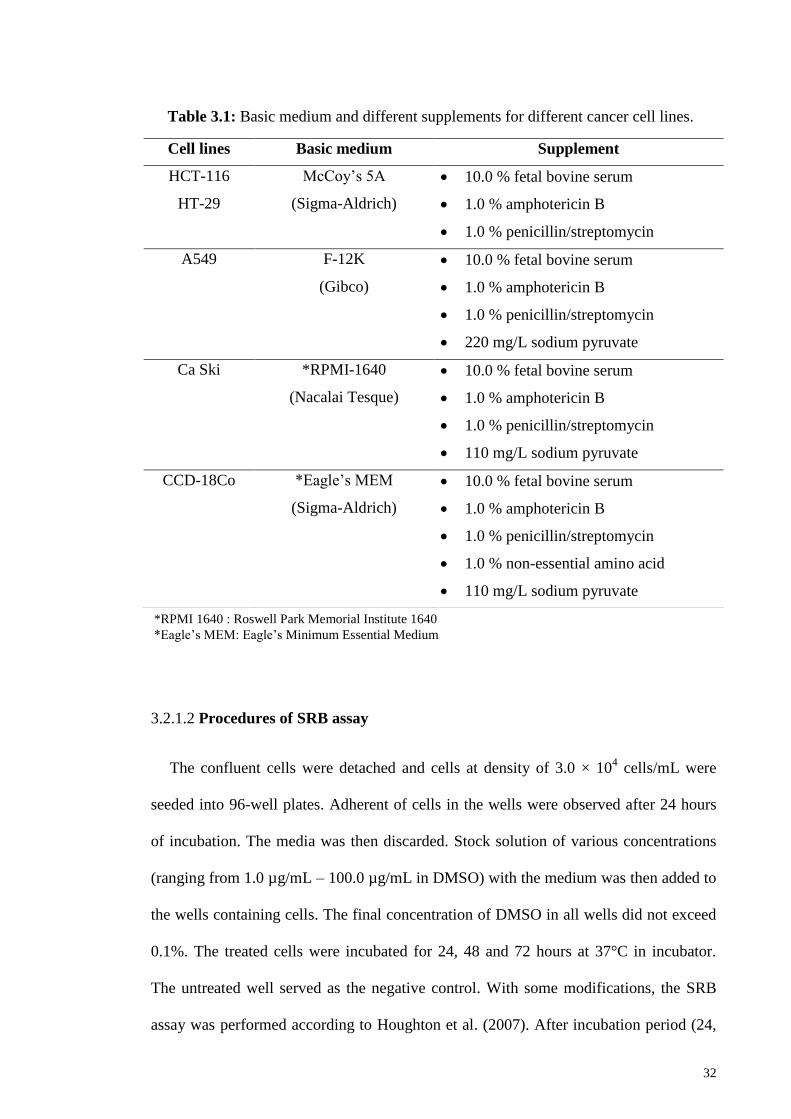
32
3.2.1.2 Procedures of SRB assay
The confluent cells were detached and cells at density of 3.0 × 10⁴ cells/mL were
seeded into 96-well plates. Adherent of cells in the wells were observed after 24 hours
of incubation. The media was then discarded. Stock solution of various concentrations
(ranging from 1.0 µg/mL – 100.0 µg/mL in DMSO) with the medium was then added to
the wells containing cells. The final concentration of DMSO in all wells did not exceed
0.1%. The treated cells were incubated for 24, 48 and 72 hours at 37°C in incubator.
The untreated well served as the negative control. With some modifications, the SRB
assay was performed according to Houghton et al. (2007). After incubation period (24,
Cell lines Basic medium Supplement
HCT-116 McCoy’s 5A 10.0 % fetal bovine serum
HT-29 (Sigma-Aldrich) 1.0 % amphotericin B
1.0 % penicillin/streptomycin
A549 F-12K 10.0 % fetal bovine serum
(Gibco) 1.0 % amphotericin B
1.0 % penicillin/streptomycin
220 mg/L sodium pyruvate
Ca Ski *RPMI-1640 10.0 % fetal bovine serum
(Nacalai Tesque) 1.0 % amphotericin B
1.0 % penicillin/streptomycin
110 mg/L sodium pyruvate
CCD-18Co *Eagle’s MEM 10.0 % fetal bovine serum
(Sigma-Aldrich) 1.0 % amphotericin B
1.0 % penicillin/streptomycin
1.0 % non-essential amino acid
110 mg/L sodium pyruvate
Table 3.1: Basic medium and different supplements for different cancer cell lines.
*RPMI 1640 : Roswell Park Memorial Institute 1640
*Eagle’s MEM: Eagle’s Minimum Essential Medium

33
48 and 72 hours), 50.0 µl of 40.0% (v/v) ice cold trichloroacetic acid (TCA) was added
to each well and kept at 4.0°C for an hour. The medium containing TCA was discarded
and the plates were added with 50.0 µL of distilled water to remove the excess TCA in
the wells. The washing process was repeated 4 times. Next, 50.0 µL of 0.4% (w/v) SRB
dye (Sigma) was added into well and the plates were incubated at room temperature for
30 minutes. The excess SRB dye was removed and the plates were washed with 50.0 µL
of 1% (v/v) acetic acid for 5 times. 100.0 µL of 10mM of Tris Base was added to the
wells in the plate and the plate agitated for 500 rpm in the Thermo Shaker, BioSan,
Latvia for 5 minutes to solubilise the bound SRB dye in every well. The dye absorbance
(optical density, OD) was then determine using a microplate reader (Synergy H1 Hybrid,
Biotek) at wavelengths 570 nm and 630 nm equipped with Gen5 Data Analysis software
(Biotek). The procedure of SRB is shown in Figure 3.2.
The experiment was conducted in triplicates. For each sample, the mean data from
triplicates were expressed in terms of cell inhibition percentage relative to the negative
control. The percentage of cell inhibition values was obtained by calculation of
absorbance of the control (ODcontrol) and of the samples (ODsample) using equation as
shown below:
Percentage of inhibition = OD control – OD sample
× 100% OD control
*OD = Optical density
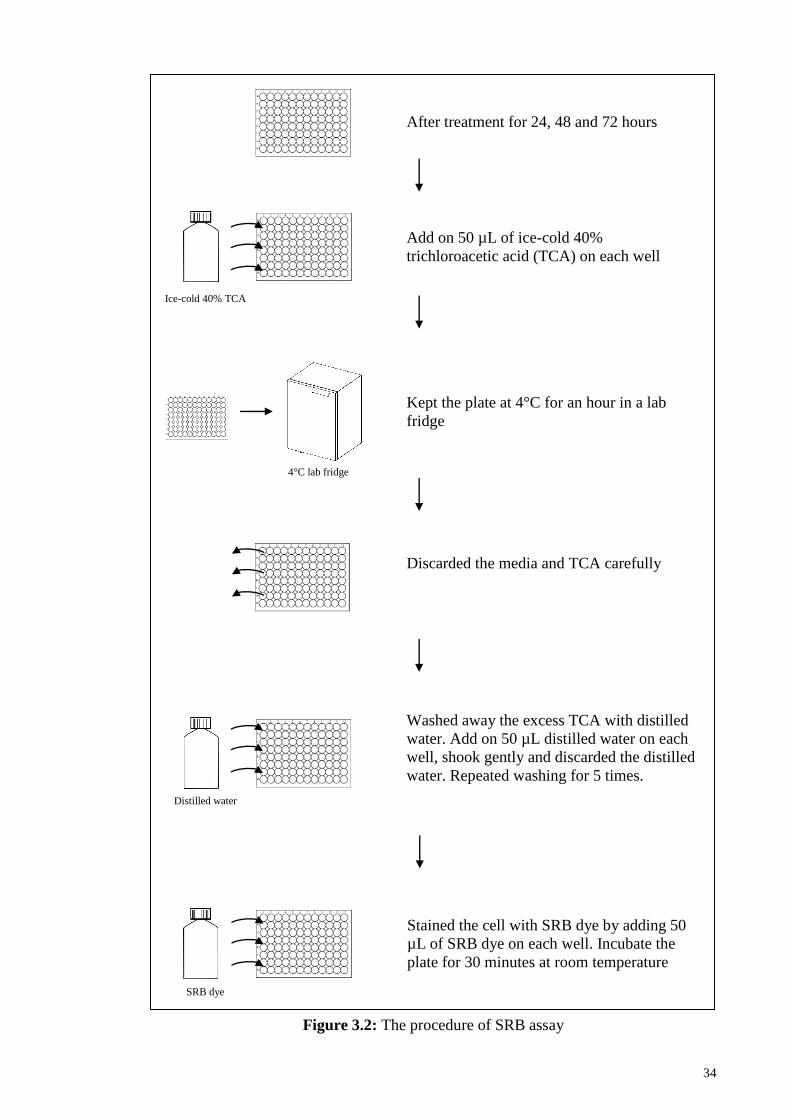
34
After treatment for 24, 48 and 72 hours
Add on 50 µL of ice-cold 40%
trichloroacetic acid (TCA) on each well
Kept the plate at 4°C for an hour in a lab
fridge
Discarded the media and TCA carefully
Washed away the excess TCA with distilled
water. Add on 50 µL distilled water on each
well, shook gently and discarded the distilled
water. Repeated washing for 5 times.
Stained the cell with SRB dye by adding 50
µL of SRB dye on each well. Incubate the
plate for 30 minutes at room temperature
Ice-cold 40% TCA
4°C lab fridge
Distilled water
SRB dye
Figure 3.2: The procedure of SRB assay

35
Figure 3.2, continued
Discarded the SRB dye carefully
Washed away the u dye with 1% acetic acid.
Add on 50 µL acetic acid on each well,
shook gently and discarded the acid.
Repeated washing for 5 times.
Solubilised the bound SRB dye by adding
100 µL of Tris base on each well
Shake the plate for 5-10 minutes at 500 rpm
to ensure homogenous solubilisation of
bound SRB dye by Tris base.
Read the absorbance in a microplate reader
with working wavelength 570 nm and 630
nm.
Tris base
Acetic acid

36
3.3 Isolation of the chemical compounds
3.3.1 High pressure liquid chromatography (HPLC)
Fractionated hexane (CMH) and ethyl acetate (CME) extracts from Method A and,
fractionated hexane (CMDH) and hexane-insoluble (CMDM) extracts from Method B
were initially injected into an Agilent 1260 infinity HPLC system comprising of a
quaternary pump equipped with a 1260 autosampler (ALS), a 1290 thermostat, a 1260
thermostatted column compartment (TCC), a 1260 diode array detector (DAD VL+), a
1260 fraction collector (FC-AS) and Agilent OpenLAB CDS Chemstation software for
analytical HPLC analysis. Binary eluent of chromatographic-grade acetonitrile (ACN)
and ultrapure water were utilized in the analytical analysis under the following gradient
conditions: 0 to 5 minutes of linear gradient from 30 to 40% ACN; 5 to 15 minutes of a
linear gradient from 40 to 70% ACN; 15 to 30 minutes of a linear gradient from 70 to
100% ACN; 35 to 40 minutes of isocratic 100% ACN; and 40 to 45 minutes of linear
gradient from 100 to 30% ACN at a flow rate of 1.0 ml/min. An analytical column,
ZORBAX Eclipse XDB-C18 (4.6 × 250 mm, 5 μm) was used in the analytical HPLC
analysis and the temperature was set to 30°C. The extracts were prepared to a
concentration of 5 mg/mL in methanol and filtered through a 0.45 mm membrane filter
(Sartorius). The sample (5.0 μL) was injected onto the column and the peaks were
detected by monitoring the UV absorbance at 214 and 280 nm.
Next, the extracts were prepared at 50 mg/mL in methanol and further injected into
the Agilent Semi Prep XDB-C18 column (9.4 × 250 mm, 5 μm) with sample injection
volume of 100 μL at a flow rate of 5.00 mL/min. The selected peaks in the resulting
chromatogram were repeatedly collected using a fraction collector and the retention
times of similar fractions from each round were analyzed with software to ensure no
overlap with other fractions. Similar fractions from each round were then combined, the

37
mobile phases were evaporated using a rotary evaporator at 40°C, and the fractions
were weighed.
The isolation of pure compounds from the fractionated CMH and CME extracts were
halted due to low solubility in methanol during sample preparation for analytical and
semi-preparative analysis. Besides that, the chromatography profile during semi-
preparative analysis was unrepeatable and certain peaks in the chromatogram
disappeared after 10 to 15 rounds. The CMH and CME extracts easily caused blocking
of the semi-preparative column even though the column had been well flushed/washed
with a solvent mixture of 70% methanol and 30% chloroform, and ACN. Therefore,
CMDH and CMDM extracts from Method B was selected for further semi-preparative
analysis. Eight peaks were observed in the HPLC analysis from each CMDH and
CMDM extracts, and the eluents of the peaks from each extract were collected and then
pooled to give eight fractions, based on the similarity of spots on TLC. Fractions that
showed a single spot on TLC were subjected to analytical HPLC analysis to determine
their purity.
3.3.2 Nuclear Magnetic Resonance (NMR) and q-Time-Of-Flight (qTOF) mass
spectrometry
The Bruker Advance III (Germany) 600 MHz NMR spectrometer which was used to
obtain 1D NMR spectrum (such as 1H,
13C and DEPT) and 2D NMR spectrum (such as
HSQC, HSBC, COSY and NOESY), was located at the High Impact Research (HIR)
central building, University of Malaya. Deuterated chloroform (Merck) with
tetramethylsilane (TMS) as internal standard was used to dissolve the pure compounds.
The NMR chromatograms were analyzed with ACD/NMR Processor Academic Edition
software.

38
The spectrometer of Bruker Impact II Ultra-High Resolution (UHR) QqTOF was
used to determine the mass spectra of pure compounds. The acquisition parameters were
as follow: Electrospray ionisation (ESI) as source, negative ion polarity, scanning from
50 m/z to 2,000 m/z, 180°C of dry heater and 5.0 l/min for dry gas.
3.4 Apoptotic cell morphology assessment
3.4.1 Phase contrast microscopy
Cells at a density of 3.0 × 10⁴ cells/mL were seeded into sterile 24-well plate and
incubated overnight to ensure the cells adhered on the surface of the plate. The cells
were treated the with three concentrations (20.0 µg/mL, 30.0 µg/mL and 40.0 µg/mL) of
the CMD extract and incubated for 24, 48 and 72 hours in a CO2 incubator. Different
morphological changes of the treated cells such as cell shrinkage, cell detachment,
rounding and blebbing of membrane were observed. The image of the morphological
changes of the treated cells was captured at 40X magnifications under phase contrast
microscope (Zeiss Axio Vert, A1).
3.4.2 Fluorescence microscopy
The double staining method that using two types of dyes (Hoechst 33342 and
propidium iodide) for observing the changes of nuclear morphology of cells using
fluorescence microscopy. The procedures in cell seeding and treatments were as
described in the previous experiment in Section 3.4.1 except that the cells treated only
for 24 hours in the experiment. After the incubation period, both media and harvested
cells were further centrifuged at 1500 rpm for five minutes. The cell pellets were
washed with ice-cold phosphate buffer saline (PBS) solution and re-suspended with
39
PBS solution. The cell suspensions were then incubated with Hoechst 33342 in the dark
at 37°C and humidified 5% CO2 incubator for seven minutes. Then PI was added into
the cell suspension and further incubated in the dark under for 15 minutes at room
temperature. Ices were used to deactivate and stabilize the activity of Hoechst dye. The
cell samples were loaded on a slide and the morphology of cells was examined under
fluorescent microscope (Leica, Germany DM16000B). The image of nuclear
morphological changes of the cells was captured at 40X magnifications. The general
procedure in performing the double staining on cell using dye Hoechst 33342 and PI
was illustrated in Figure 3.3.

40
After treatment for 24 hours, transfer the media from the plate
into to 15.0 mL centrifuge tubes
Negative control 20.0 µg/mL 30.0 µg/mL 40.0 µg/mL
Add 300.0 µL of accutase into the plate and incubate in CO2
incubator for 5-10 minutes to detach the cell
Transfer the cell suspension from the plate into the previous
centrifuge tube and centrifuge the cell for 5 minutes at 1,000 rpm
Accutase
Re-suspend the cell with 1.0 mL of ice-cold PBS and centrifuge the
cell for 5 minutes at 1,000 rpm.
Ice-cold PBS
Figure 3.3: A summary of the sample preparation for Hoechst 33342 and propidium
iodide double staining microscopy

41
Re-suspend the cell with 43.9 µL of media and transfer the suspended
cell into 1.5 mL centrifuge tube containing 4.8 µL of 100 µg/mL
Hoechst 33342 dye for staining the cell in the dark
Negative control
20.0 µg/mL 30.0 µg/mL 40.0 µg/mL
Media
1.5 mL centrifuge tube containing 4.8 µL of Hoechst dye
Stain the cell and incubate in CO2 incubator for
7 minutes in dark condition
Stain the cells with 1.3 µL of 100 µg/mL propidium iodide for 15
minutes under dark condition in room temperature
Propidium iodide
Put the stained cells on ice to inactivate the staining process of
Hoechst dye and the stained cells are ready for observation under the
fluorescence microscope
Figure 3.3, continued
42
3.5 Apoptosis biochemical assay
3.5.1 Detection of externalization of phosphatidylserine (PS) through binding of
Annexin V to PS
Detection of early and late apoptosis by binding of Annexin V to phosphatidylserine
(PS) was analyzed using a flow cytometer. Briefly, 1.2 × 10⁵ cells/mL was plated into
12-well plate and treated with 3 different concentrations (20.0, 30.0 and 40.0 µg/mL)
for 24, 48 and 72 hours in triplicates. The cells were harvested into 15.0 mL centrifuge
tubes and washed with ice cold PBS. Cell pellet was re-suspended with Annexin-V
binding buffer and transferred into 1.5 mL centrifuge tube. For negative and positive
control, 400 µL of binding buffer was used to re-suspend cell pellet from each control
and each control would divide into another four tubes by transferring 100 µL cell
suspension into new tubes. Suspended cells were stained with Annexin-V for 15
minutes by adding 10 µL of Annexin V. After 15 minutes, the cells were centrifuged
and re-suspended with 500 µL of binding buffer. Propidium iodide was added into the
cell suspension prior analyzed with flow cytometer. Detection of apoptosis was
performed using Accuri C6 flow cytometer. For each measurement, 10, 000 events were
counted where cell population was distributed into different quadrants and each
quadrant was analysed with quadrant statistics. Lower left quadrant represented viable
cells; lower right quadrant represented early apoptotic cell; and upper right quadrant
represented late apoptotic or necrotic cells.
3.5.2 Detection of DNA fragmentation
Detection of DNA fragmentation was performed using the APO-BrDU TUNEL
Assay Kit (Invitrogen). HT-29 cells at a density of 5 × 10⁵ cells/mL were grown on 6-
wells plate overnight, and treated with three different concentrations for 24, 48 and 72

43
hours at 37°C and 5% CO2. The untreated cells were grown as a negative control. The
cells were harvested, washed with PBS and fixed with 1% (w/v) paraformaldehyde. The
cells were centrifuged, washed and fixed with ice-cold 70% ethanol. Labelling of DNA
was performed based on the instructions given by the manufacture, and then the
percentage of DNA fragmentation in cells were analysed by flow cytometer (Accuri C6).
3.5.3 Cell cycle analysis
The cell cycle analysis was performed according to Ho et al. (2013) with slight
modifications. Briefly, HT-29 cells were plated at cell number of 3.0 × 10⁵ cells/mL and
treated with crude CMD extract for 24 hours in triplicates. The cells were harvested,
washed and then fixed with 70% ethanol. The cell fixation took overnight time in -20°C
freezer. The next day, the fixed cells were centrifuged to become pellet, washed with
ice-cold PBS and re-suspended with staining buffer containing 50 mg/mL of propidium
iodide, 0.1% Triton-X-100, 0.1% sodium citrate, and 100 mg/mL of RNase. The cell
suspension was incubated in the dark condition for 30 minutes at room temperature. The
stained cell was then analyzed with Accuri C6 flow cytometer.
3.5.4 Western blot analysis
3.5.4.1 Antibodies and chemicals
The usage of different type of antibodies in the Western blot included the primary
antibodies for DR5, cleaved PARP-1 (cleaved p25), and antibodies against polyclonal
XIAP and polyclonal cIAP2 were obtained from GeneTex whereas antibodies in
counter with monoclonal Bax, monoclonal p21, monoclonal p53 and β-actin were
obtained from Thermo Scientific. Antibodies against polyclonal caspase-3, monoplonal

44
caspase-8, polyclonal caspase-9, monoclonal CDK-4, monoclonal cyclin D1 and
polyclonal p27 were obtained from Cell Signalling. The horseradish peroxidase (HRP)-
labelled anti-mouse and anti-rabbit secondary antibodies were obtained from Thermo
Scientific. Radioimmunoprecipitation assay (RIPA) buffer and stripping buffer were
purchased from Thermo Scientific. Bovine serum albumin (BSA) premix sets and
Bradford reagent were bought from Bio-rad.
3.4.4.2 Sodium dodecyl sulphate polyacrylamide gel electrophoresis (SDS-PAGE)
procedures
In order to examine the changes in expression levels changes of the apoptotic
proteins, the HT-29 cells (2.0 × 10⁶ cells/mL) were plated in a 25cm
3 tissue culture flask
and treated with crude CMD extract (40 µg/mL) for different time intervals (0, 3, 6, 12,
18 and 24 hours) in an incubator with 5% of CO2 at temperature of 37°C. The treated
cells were washed with ice cold 1X PBS and harvested using cell scraper. The harvested
cells were lysed with 200µL of RIPA buffer containing 25mM Tris-HCl pH 7.6,
150mM NaCl, 1% NP-40 (Tergitol-type NP-40), 1% sodium deoxycholate and 0.1%
SDS (Sodium Dodecyl Sulphate) for 30 minutes on ice. The lysates were then
centrifuged at 14,000 rpm for 30 minutes at 4°C and the supernatants were collected.
Protein concentrations in the supernatant were determined using Bradford method (Bio-
rad Laboratories). Briefly, a standard curve with absorbance reading against protein
concentration (mg/mL) was plotted by using seven different concentrations (2.0, 1.5,
1.0, 0.75, 0.50, 0.25, 0.125mg/mL) of pre-mix BSA solution. The protein concentration
of the samples was obtained by determine the x-intercept (protein concentration) value
from the standard curve.

45
For protein denaturation, the protein samples were boiled at 100°C for five
minutes. Before the protein denaturation, the proteins were mixed with denaturation
buffer (1M Tris-HCl, pH 6.8, 25% SDS, β-mercaptoethanol, 100% glycerol, 1%
bromophenol blue) at the ratio of 3 parts of proteins to 1 part of denaturation buffer.
Equal amount of proteins (50 µg) was loaded onto the 12% SDS-PAGE gel for gel
electrophoresis and 20 ampere currents at maximum (When the usage of current
exceeds 20 amperes, the SDS gel tend to melt and affect the protein separation) was
applied to a single gel electrophoresis (e.g. 40 amperes for two gels electrophoresis). A
pre-stained protein ladder (Thermo Scientific) was loaded onto the gel as well to
identify the approximate size of the protein running in the gel during the electrophoresis.
The proteins in the gel were then electroblotted onto a nitrocellulose membrane (Merck)
using wet transfer method for 2 hours by applying 90V current supply. The
nitrocellulose membranes were then blocked with Blocking One (Nacalai Tesque, Inc)
for one hour. The membranes were then probed with a specific primary antibody (1:
1,000 dilutions in blocking buffer) overnight at 4°C by rocking the membrane with a
rocker. Next, the unbound antibody in the membranes were removed by washing with
PBS containing 1X of Tween-20 (PBST. Then, the membranes were incubated by HRP-
conjugated secondary antibody with the dilutions of 1: 10,000 in blocking buffer on the
rocker at room temperature for one hour. After incubation with the secondary antibody,
the membranes were again washed with PBST for 3 times to remove unbound
secondary antibody. The visualization of the protein bands was performed using
enhanced chemiluminescence (WesternBright ECL, Advansta) and the pictures of the
visualized protein bands were taken on Fusion-FX7 gel imaging (Vilber, Germany) with
its build-in Fusion-CAPT software. The membranes were then rocked vigorously with
stripping buffer for 15 minutes to remove all the bound substances on the membrane.
The stripped membranes were washed, blocked with blocking buffer and incubated with

46
another specific primary antibody if necessary. The concentration of the cell lysate as
well as subcellular constituents were determined by using the β-actin. Software ImageJ
was performed to quantity the densitometric values of the bands and the results were
normalized with the loading control sample (β-actin). The normalized results were then
expressed in fold change comparative to control.
3.6 Statistical analysis
All results were expressed as mean ±SD and all the experiments were performed at
least twice using sample triplicate. All raw data were statistically processed with IBM
SPSS Statistics 22.0 software. T-test was performed to determine the significant
differences between the treated cell and non-treated cell. P < 0.05 was considered
statistically significant.
47
CHAPTER 4: RESULTS
4.1 Extraction of plant materials
Two different extraction methods were performed on C. mangga rhizomes as
described in Section 3.1.2a and 3.1.2b. In Method A, the initial extracting solvent
(Section 3.1.2a) was methanol followed by partitioning with n-hexane, ethyl acetate and
water consecutively on Method B (Section 3.1.2b) the initial extracting solvent was
dichloromethane, followed by fractionation with n-hexane and methanol.
The yield of crude methanolic extract (25.0% based on 1.0 kg powdered sample)
from Method A was three times higher that of the crude dichloromethane extract from
Method B (7.50 %) (Table 4.1). The percentage of fractionated extracts was calculated
according to the weight of crude extracts. The initial fractioning solvent on the crude
extracts for both methods were similar (n-hexane) but the percentage yield based on
crude extracts were different. For Method A, the percentage yield of fractionated n-
hexane extract (CMH) based on crude methanolic extract (CMM) was 33.6%. In
contrast, the percentage yield of fractionated n-hexane extract (CMDH) based on crude
dichloromethane extract (CMD) from Method B was 60.53% which was almost twice
amount that the percentage yield of CMH.
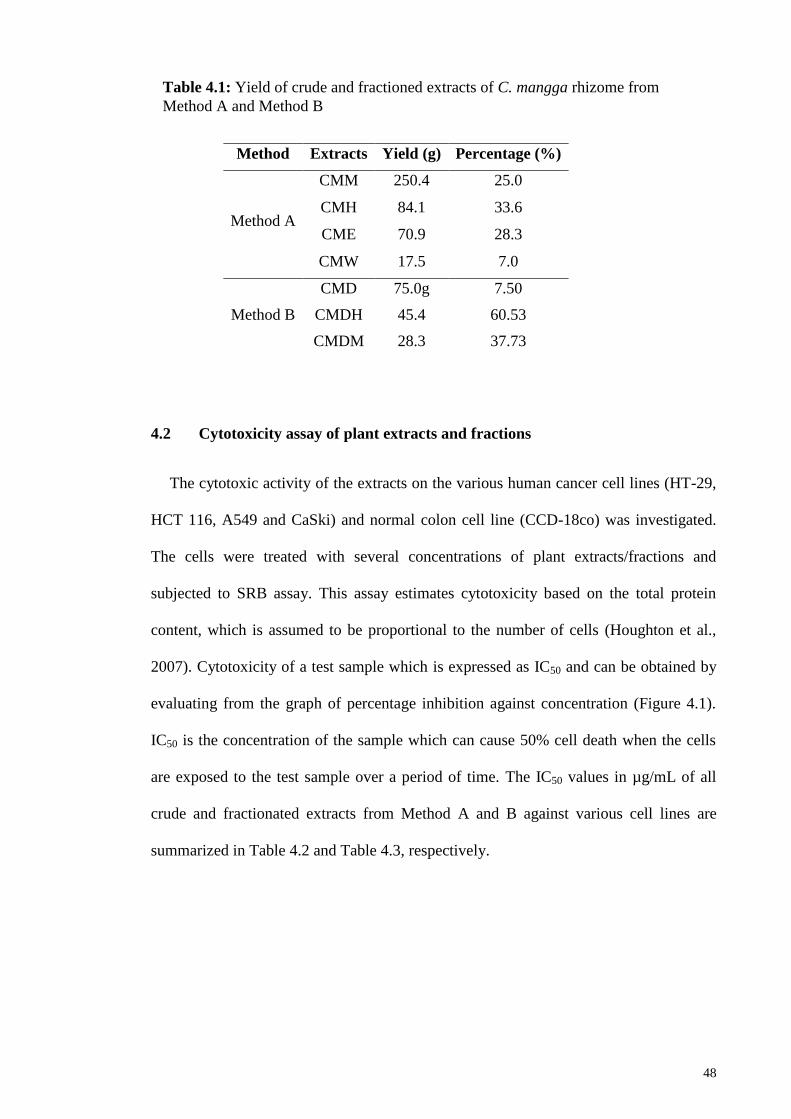
48
4.2 Cytotoxicity assay of plant extracts and fractions
The cytotoxic activity of the extracts on the various human cancer cell lines (HT-29,
HCT 116, A549 and CaSki) and normal colon cell line (CCD-18co) was investigated.
The cells were treated with several concentrations of plant extracts/fractions and
subjected to SRB assay. This assay estimates cytotoxicity based on the total protein
content, which is assumed to be proportional to the number of cells (Houghton et al.,
2007). Cytotoxicity of a test sample which is expressed as IC50 and can be obtained by
evaluating from the graph of percentage inhibition against concentration (Figure 4.1).
IC50 is the concentration of the sample which can cause 50% cell death when the cells
are exposed to the test sample over a period of time. The IC50 values in µg/mL of all
crude and fractionated extracts from Method A and B against various cell lines are
summarized in Table 4.2 and Table 4.3, respectively.
Method Extracts Yield (g) Percentage (%)
Method A
CMM 250.4 25.0
CMH 84.1 33.6
CME 70.9 28.3
CMW 17.5 7.0
Method B
CMD 75.0g 7.50
CMDH 45.4 60.53
CMDM 28.3 37.73
Table 4.1: Yield of crude and fractioned extracts of C. mangga rhizome from
Method A and Method B

49
A
B
CMD: 14.3 µg/mL
CMD: 15.2 µg/mL
Figure 4.1: Percentage of growth inhibition on various cancer cell lines (A: HT-29;
B: HCT 116; C: A549; D: CaSki) by all extracts from Method A (CMM, CMH,
CME and CMW) and Method B (CMD, CMDH and CMDM). Three replicates were
conducted in each sample.

50
C
D
Figure 4.1, continued
CMDH: 14.8 µg/mL
CMD: 18.7 µg/mL

51
Cell
lines
Time
(hours)
IC50 values (µg/mL) of extract/fraction from
Method A Doxorubicin
(µg/mL) CMM CMH CME CMW
HT-29
24 42.1 ± 1.3 39.3 ± 2.4 32.2 ± 5.1
>100 0.36 ± 0.4 48 32.6 ± 0.6 17.9 ± 1.2 32.1 ± 5.4
72 34.4 ± 1.1 21.7 ± 0.8 15.6 ± 4.4
HCT-
116
24 29.9 ± 1.3 15.8 ± 1.7 13.4 ± 0.8
>100 0.28 ± 0.1 48 28.3 ± 0.9 13.1 ± 0.8 17.7 ± 0.7
72 18.1 ± 0.7 16.1 ± 0.2 16.6 ± 0.5
A549
24
>100
30.8 ± 4.3 66.7 ± 3.1
>100 0.63 ± 0.1 48 33.3 ± 2.5 45.7 ± 2.5
72 23.2 ± 1.1 31.7 ± 2.3
CaSki
24 58.1 ± 3.1 57.9 ± 4.4 65.3 ± 3.7
>100 0.23 ± 0.2 48 57.8 ± 2.2 55.1 ± 1.1 61.1 ± 3.2
72 33.2 ± 2.4 31.9 ± 0.4 41.9 ± 1.4
CCD-
18Co 72 45.8 ± 1.3 22.5 ± 0.9 22.8 ± 0.9 >100 0.11 ± 0.1
Table 4.2: Cytotoxic activities (IC50 values) of extracts from Method A on various
cancer cell lines and human normal cell (CCD-18Co) in comparison to doxorubicin
The IC50 value shows 50% reduction in cell viability caused by several concentrations of extracts
according to SRB assay. Doxorubicin was used as positive control. Mean ± standard deviation of three
replicates from three independent experiments is expressed in each value.

52
4.3 Isolation and identification of chemical compounds
Fractionated extracts from both methods were subjected to HPLC for isolation of
pure compounds. However, the fractionated extracts from Method A was halted from
further isolation chemical compounds because both CMH and CME extracts caused
clogging in the column after 10 to 15 rounds. After the column was washed and back-
flushed, the chemical profile of the extracts was found to be inconsistent and the
retention of the peaks in the chromatogram shifted. Meanwhile, CMDH and CMDM
extracts did not display the same problem as found in CMH and CME extract during the
semi-preparative isolation. Therefore, only CMDH and CMDM were further
investigated.
Cell
lines
Time
(hours)
IC50 values (µg/mL) of extract/fraction from
Method B Doxorubicin
(µg/mL) CMD CMDH CMDM
HT-29
24 47.0 ± 1.4 48.0 ± 1.8 49.0 ± 0.8
0.36 ± 0.4 48 14.2 ± 1.0 14.0 ± 0.7 18.0 ± 0.5
72 14.3 ± 0.2 16.3 ± 0.5 21.0 ± 0.4
HCT-
116
24 20.9 ± 1.3 22.7 ± 0.7 22.6 ± 1.7
0.28 ± 0.1 48 17.7 ± 0.4 18.1 ± 0.6 15.7 ± 0.5
72 15.2 ± 0.8 17.8 ± 0.7 18.3 ± 0.8
A549
24 18.6 ± 0.8 16.0 ± 1.7 19.4 ± 0.7
0.63 ± 0.1 48 18.6 ± 0.8 16.0 ± 1.7 19.0 ± 1.2
72 16.5 ± 0.4 14.8 ± 0.6 20.0 ± 0.7
CaSki
24 33.4 ± 0.9 35.6 ± 0.5 42.8 ± 0.8
0.23 ± 0.2 48 23.5 ± 0.5 23.7 ± 0.7 35.1 ± 0.7
72 18.7 ± 0.7 19.5 ± 0.3 21.2 ± 0.4
CCD-
18Co 72 50.3 ± 0.5 52.4 ± 1.1 55.0 ± 2.4 0.11 ± 0.1
Table 4.3: Cytotoxic activities (IC50 values) of extracts from Method B on various
cancer cell lines and human normal cell (CCD-18Co) in comparison to doxorubicin
The IC50 value shows 50% reduction in cell viability caused by several concentrations of extracts
according to SRB assay. Doxorubicin was used as positive control. Mean ± standard deviation of three
replicates from three independent experiments is expressed in each value.

53
4.3.1 CMDH and CMDM from Method B
The active hexane-soluble fraction (CMDH) was subjected to HPLC, as described in
Chapter 3 (Section 3.3.1). After repeated semi-preparative analysis, eight compounds
were isolated. Only four compounds were successfully identified using NMR and qTOF
mass spectrometry and the mass spectral and NMR data were found to be consistent
with those reported in the literatures (Itokawa et al., 1988; Nakamura et al., 2008; Xu et
al., 1995; Xu et al., 2015). These compounds were longpene A (peak corresponding to
H1), zerumin A (peak corresponding to H2), coronadiene (peak corresponding to H3)
and (E)-labda-8(17),12-dien-15,16-dial (peak corresponding to H7). Meanwhile, the
active hexane-insoluble fraction (CMDM) was also subjected to HPLC and 8eight
compounds were isolated after repeated semi-preparative analysis. Only one compound
was identified as calcaratarin A (peak corresponding to M8) which was consistent with
published data (Kong et al., 2000). The HPLC profile of CMDH and CMDM is shown
in Figure 4.2, and the structures of the isolated compounds are illustrated in Figure 4.3.
Longpene A is a rare type of norditerpene with an ent-labdane skeleton (Xu et al., 2015).
Zerumin A, (E)-labda-8(17),12-dien-15,16-dial and calcaratarin A are labdane
diterpenes and only differ by functional groups attached on the basic skeleton structure.
Coronadiene is a labdane-type trinorditerpene. All isolated compounds has been
reported previously in C. mangga except longpene A. Although longpene A was first
reported by Xu et al. (2015), it has never been reported to exist in C. mangga. The 1H
and 13C NMR data for longpene A is shown in Table 4.4 and 4.5 respectively. The
yield of compounds collected from semi-preparative analysis is shown in Table 4.6.

54
H1 H2
H3
H4
H5
H6
H7
H8
A
Figure 4.2: HPLC profiles of CMDH and CMDM. (A) Eight peaks were detected in
HPLC profile of CMDH. Seven peaks (H1-H5, H7, and H8) were detected in
wavelength 214 nm while one peak (H6) was detected in wavelength 280 nm. Only
H1, H2, H3 and H7 were identified. (B) Eight peaks were also detected in HPLC
profile of CMDM. Seven peaks (M1-M4, M6, M7 and M8) were detected under
wavelength 214 nm while one peak (M6) was detected in wavelength 280 nm. Only
one compound (M8) was identified.

55
M1 M2
M3
M4
M5
M6 M7
M8
B
Figure 4.2, continued

56
Figure 4.3: The chemical structure of isolated compounds were elucidated and
identified as following compounds: Longpene A (Xu et al., 2015); Zerumin A (Xu et
al., 1995); H3: Coronadiene (Nakamura et al., 2008); (E)-labda-8(17),12-dien-15,16-
dial (Itokawa et al., 1988); and Calcaratarin A (Kong et al., 2000).
Calcaratarin A
Zerumin A
Longpene A
Coronadiene
(E)-labda-8(17),12-dien-15,16-dial
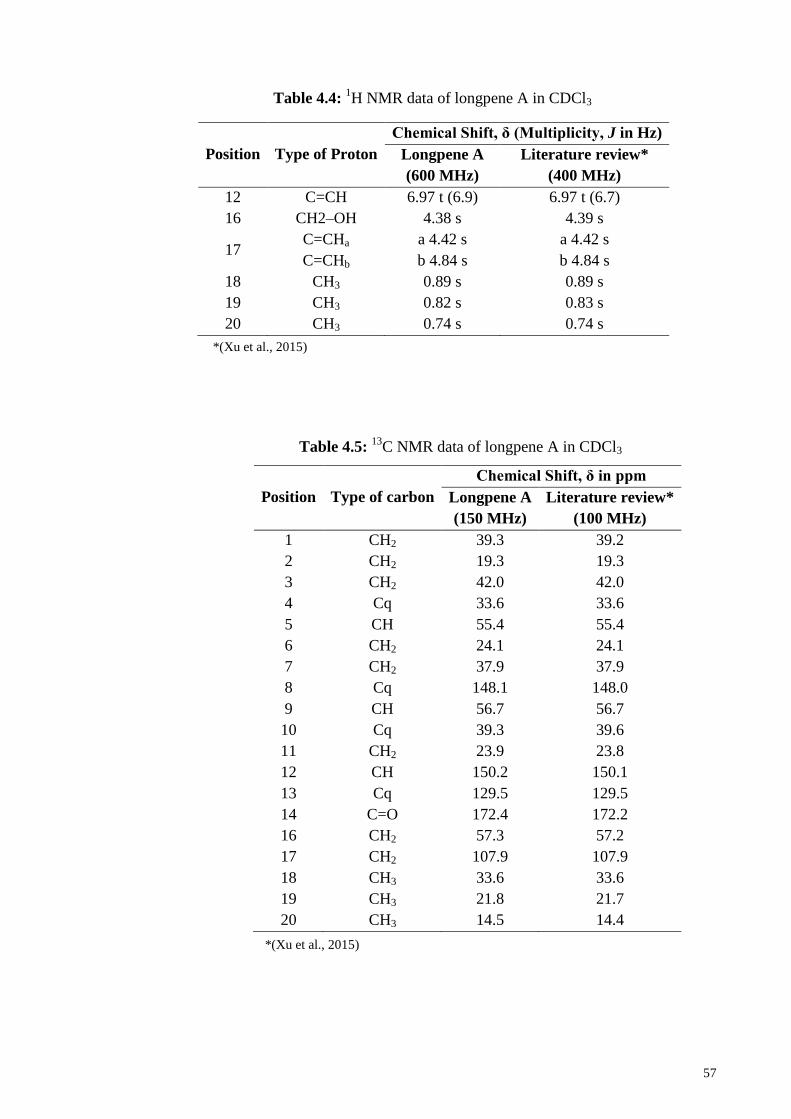
57
Position Type of Proton
Chemical Shift, δ (Multiplicity, J in Hz)
Longpene A
(600 MHz)
Literature review*
(400 MHz)
12 C=CH 6.97 t (6.9) 6.97 t (6.7)
16 CH2–OH 4.38 s 4.39 s
17 C=CHa a 4.42 s a 4.42 s
C=CHb b 4.84 s b 4.84 s
18 CH3 0.89 s 0.89 s
19 CH3 0.82 s 0.83 s
20 CH3 0.74 s 0.74 s
Position Type of carbon
Chemical Shift, δ in ppm
Longpene A
(150 MHz)
Literature review*
(100 MHz)
1 CH2 39.3 39.2
2 CH2 19.3 19.3
3 CH2 42.0 42.0
4 Cq 33.6 33.6
5 CH 55.4 55.4
6 CH2 24.1 24.1
7 CH2 37.9 37.9
8 Cq 148.1 148.0
9 CH 56.7 56.7
10 Cq 39.3 39.6
11 CH2 23.9 23.8
12 CH 150.2 150.1
13 Cq 129.5 129.5
14 C=O 172.4 172.2
16 CH2 57.3 57.2
17 CH2 107.9 107.9
18 CH3 33.6 33.6
19 CH3 21.8 21.7
20 CH3 14.5 14.4
Table 4.4: 1H NMR data of longpene A in CDCl3
Table 4.5: 13
C NMR data of longpene A in CDCl3
*(Xu et al., 2015)
*(Xu et al., 2015)

58
Compounds/fractions Weight of yield (mg)
Longpene A 14.2
Zerumin A 18.2
Coronadiene 8.6
H4 4.8
H5 18.2
H6 9.2
(E)-labda-8(17),12-dien-15,16-dial 52.3
H8 6.0
M1 15.9
M2 14.1
M3 2.9
M4 23.0
M5 6.3
M6 10.2
M7 11.4
Calcaratarin A 28.1
4.4 Cytotoxicity assay of isolated pure compounds
All compounds (including identified and unidentified compounds) were tested for
cytotoxicity screening against the same cell lines that were tested for the crude extracts.
The cytotoxic effects of the compounds on the selected cell lines are expressed as IC50
values are shown in Table 4.7.
Compounds IC50 in µM
HCT-116 HT-29 A549 CaSki CCD-18Co
Longpene A >100 >100 >100 >100 >100
Zerumin A 76.7 ± 3.8 61.9 ± 1.6 58.5 ± 2.2 >100 >100
Coronadiene 87.1 ± 3.1 86.2 ± 5.7 >100 >100 >100
(E)-labda-8(17),12-
dien-15,16-dial 39.0 ± 0.7 63.2 ± 1.0 >100 72.1 ± 5.6 60.1 ± 4.2
Calcaratarin A >100 >100 >100 >100 >100
Doxorubicin 0.7 ± 0.7 0.5 ± 0.2 1.2 ± 0.2 0.4 ± 0.4 0.2 ± 0.2
Table 4.6: Yield of compounds after 100 runs of collection from semi-preparative
analysis
Table 4.7: Cytotoxic activities of identified compounds on various cancer cell lines and
human normal cell (CCD-18Co) and doxorubicin after 72 hours of incubation
The IC50 value shows 50% reduction in cell viability caused by several concentrations of
extracts according to SRB assay. Doxorubicin was used as positive control. Mean ± standard
deviation of three replicates from three independent experiments is expressed in each value.

59
4.5 CMD extract induced morphological changes in HT-29 cells
Cell undergoing apoptosis showed several morphological characteristics which
included cell shrinkage, cell blebbing and others. These can be observed under the
phase contrast microscope. CMD has the highest cytotoxicity effect on HT-29 cells, so
HT-29 cells were selected for this experiment. After treatment with CMD extract with
various concentrations (20, 30 and 40 µg/mL) for 24, 48 and 72 hours, it was observed
there were fewer cells and less interaction between the remaining cells. Other apoptotic
morphological changes of the treated cells included cytoplasm vacuolization, membrane
blebbing, cell shrinkage, nuclear disintegration and formation of apoptotic bodies. Cell
numbers were gradually decreased and the apoptotic morphological changes were
observed more frequently as the cell were treated with higher concentration as well as
longer incubation time with CMD extract. The observed morphological changes in
treated cells under phase contrast microscopy are shown in Figure 4.4.
The examination of morphological alteration of nuclear was performed with double
staining with Hoechst 33342 and propidium iodide (PI). Dull blue colour was observed
in untreated cell was indicated viable and healthy cell. In contrast, the vibrant blue and
pink fluorescence with condensed/fragmented nuclei were observed in a population of
the treated cells after 24 hours of treatment. The bright blue with fragmented and
condensed nuclei indicated cells undergoing early apoptosis while cells with pink
fluorescence undergo late apoptosis. As the concentration of plant extract increased on
the treated cells, more bright blue and pink fluorescence cells were observed. Some
necrosis-like cell death (red colour) was observed in treated cells after 24 hours
treatment. The observed morphological changes in treated cells with fluorescence
microscopic are shown in Figure 4.5. This technique provides a method to distinguish
between early and late apoptosis, and necrosis of treated cells the morphological
changes observed from the phase contrast microscopy and fluorescence microscopy
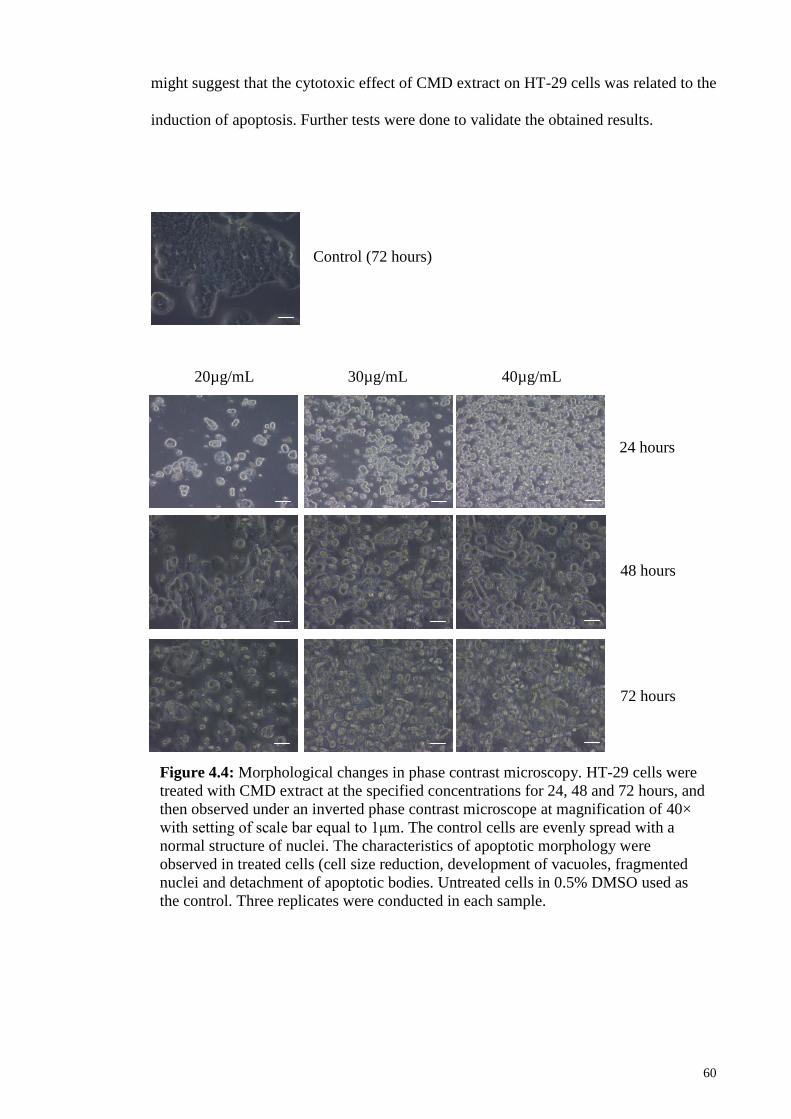
60
might suggest that the cytotoxic effect of CMD extract on HT-29 cells was related to the
induction of apoptosis. Further tests were done to validate the obtained results.
Control (72 hours)
20µg/mL 30µg/mL 40µg/mL
24 hours
48 hours
72 hours
Figure 4.4: Morphological changes in phase contrast microscopy. HT-29 cells were
treated with CMD extract at the specified concentrations for 24, 48 and 72 hours, and
then observed under an inverted phase contrast microscope at magnification of 40×
with setting of scale bar equal to 1μm. The control cells are evenly spread with a
normal structure of nuclei. The characteristics of apoptotic morphology were
observed in treated cells (cell size reduction, development of vacuoles, fragmented
nuclei and detachment of apoptotic bodies. Untreated cells in 0.5% DMSO used as
the control. Three replicates were conducted in each sample.
1 2
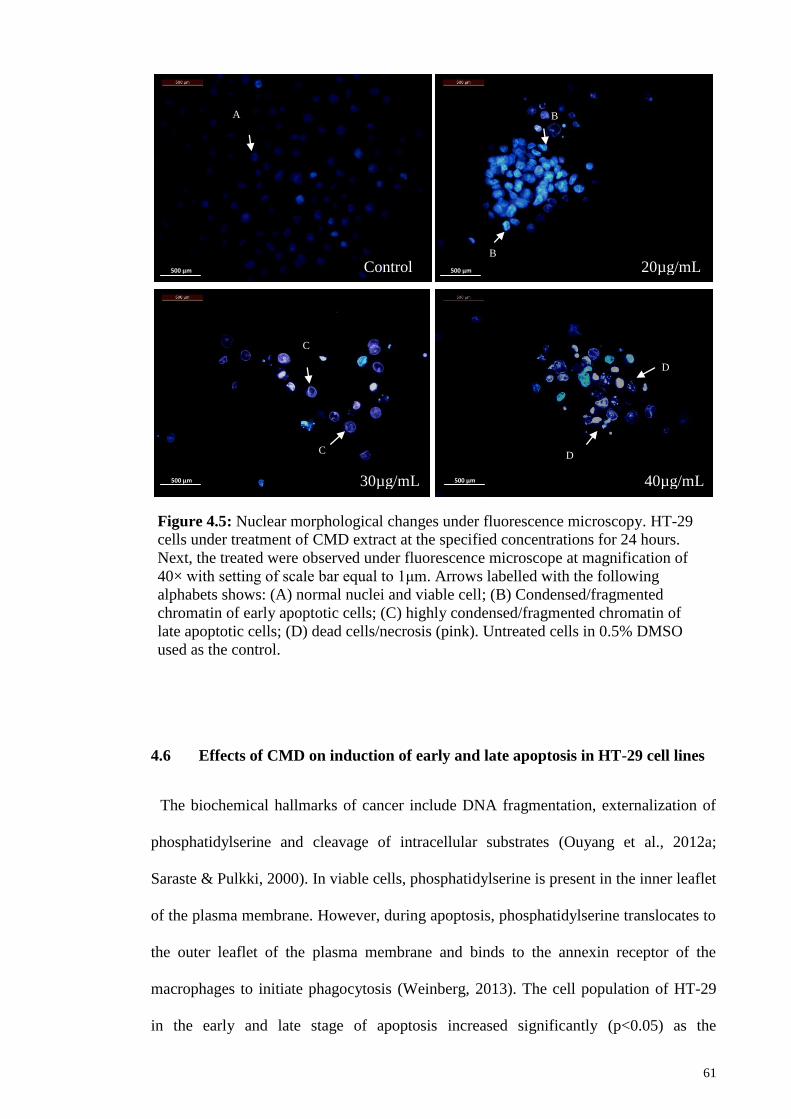
61
4.6 Effects of CMD on induction of early and late apoptosis in HT-29 cell lines
The biochemical hallmarks of cancer include DNA fragmentation, externalization of
phosphatidylserine and cleavage of intracellular substrates (Ouyang et al., 2012a;
Saraste & Pulkki, 2000). In viable cells, phosphatidylserine is present in the inner leaflet
of the plasma membrane. However, during apoptosis, phosphatidylserine translocates to
the outer leaflet of the plasma membrane and binds to the annexin receptor of the
macrophages to initiate phagocytosis (Weinberg, 2013). The cell population of HT-29
in the early and late stage of apoptosis increased significantly (p<0.05) as the
Figure 4.5: Nuclear morphological changes under fluorescence microscopy. HT-29
cells under treatment of CMD extract at the specified concentrations for 24 hours.
Next, the treated were observed under fluorescence microscope at magnification of
40× with setting of scale bar equal to 1μm. Arrows labelled with the following
alphabets shows: (A) normal nuclei and viable cell; (B) Condensed/fragmented
chromatin of early apoptotic cells; (C) highly condensed/fragmented chromatin of
late apoptotic cells; (D) dead cells/necrosis (pink). Untreated cells in 0.5% DMSO
used as the control.
20µg/mL
30µg/mL 40µg/mL
Control B
C
C D
D
500 µm 500 µm
500 µm 500 µm
A B

62
concentration and exposure time to crude CMD extract were increased. Figure 4.6
shows the detection of early and late apoptosis induced by crude CMD extract. After 48
hours treatment, the population of early apoptotic cells (Annexin-V single positive cells)
were increased from 6.4% ± 0.30, 12.4% ± 0.70, and 16.2% ± 0.20 at 20, 30 and 40
µg/mL respectively, while the population of late apoptotic cell (Annexin-V/PI double
positive cells) increased from 10.3% ± 0.20, 24.3% ± 0.40 and 42.7% ± 0.40 at 20, 30
and 40 µg/mL respectively. The percentage of late apoptotic cells was significantly
increased and greater than the percentage of early apoptotic cells in concentration of 30
and 40 µg/mL.
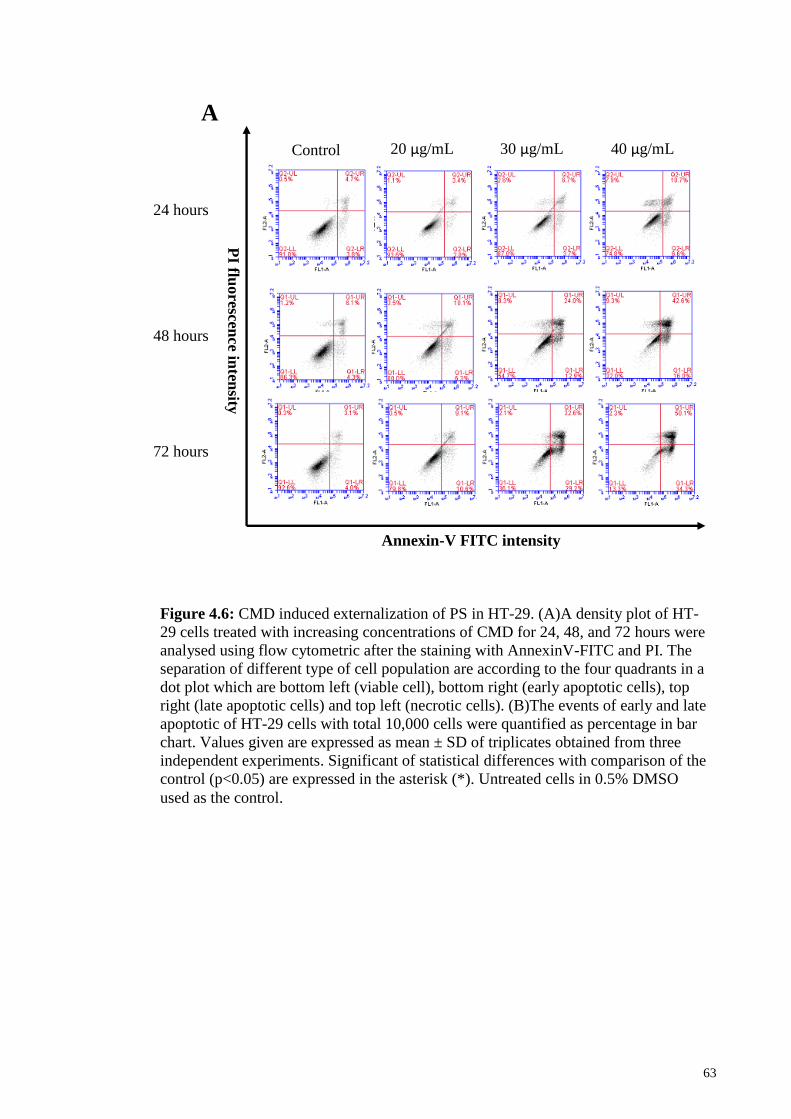
63
Control 20 µg/mL 30 µg/mL 40 µg/mL
24 hours
PI flu
orescen
ce in
tensity
48 hours
72 hours
Annexin-V FITC intensity
A
Figure 4.6: CMD induced externalization of PS in HT-29. (A)A density plot of HT-
29 cells treated with increasing concentrations of CMD for 24, 48, and 72 hours were
analysed using flow cytometric after the staining with AnnexinV-FITC and PI. The
separation of different type of cell population are according to the four quadrants in a
dot plot which are bottom left (viable cell), bottom right (early apoptotic cells), top
right (late apoptotic cells) and top left (necrotic cells). (B)The events of early and late
apoptotic of HT-29 cells with total 10,000 cells were quantified as percentage in bar
chart. Values given are expressed as mean ± SD of triplicates obtained from three
independent experiments. Significant of statistical differences with comparison of the
control (p<0.05) are expressed in the asterisk (*). Untreated cells in 0.5% DMSO
used as the control.

64
B
*
*
*
*
*
*
*
*
*
*
*
*
*
*
*
Figure 4.6, continued

65
4.7 Effects of CMD on DNA fragmentation in HT-29 cells
Figure 4.7 showed DNA fragmentation in HT-29 induced by CMD extract. The
upper quadrant represents the percentages of DNA fragmentation in HT-29 after
treatment with CMD extract. The DNA fragmentation in HT-29 cells increased
significantly (p<0.05) in a time- and concentration dependent manner. Based on the
results, the DNA fragmentation increased from 0.8 ± 0.01% (control), to 16.2 ± 0.6%,
69.5 ± 0.3% and 72.9 ± 0.6% when treated with increasing concentration of CMD (20-
40 µg/mL) after 72 hours of incubation. It was observed that DNA fragmentation in HT-
29 were drastically increased when the cells were treated at concentration of 30 and 40
µg/mL compared to lowest concentration, 20 µg/mL. The outcome from the TUNEL
assay supported the hypothesis that CMD induced apoptosis in HT-29 cells.
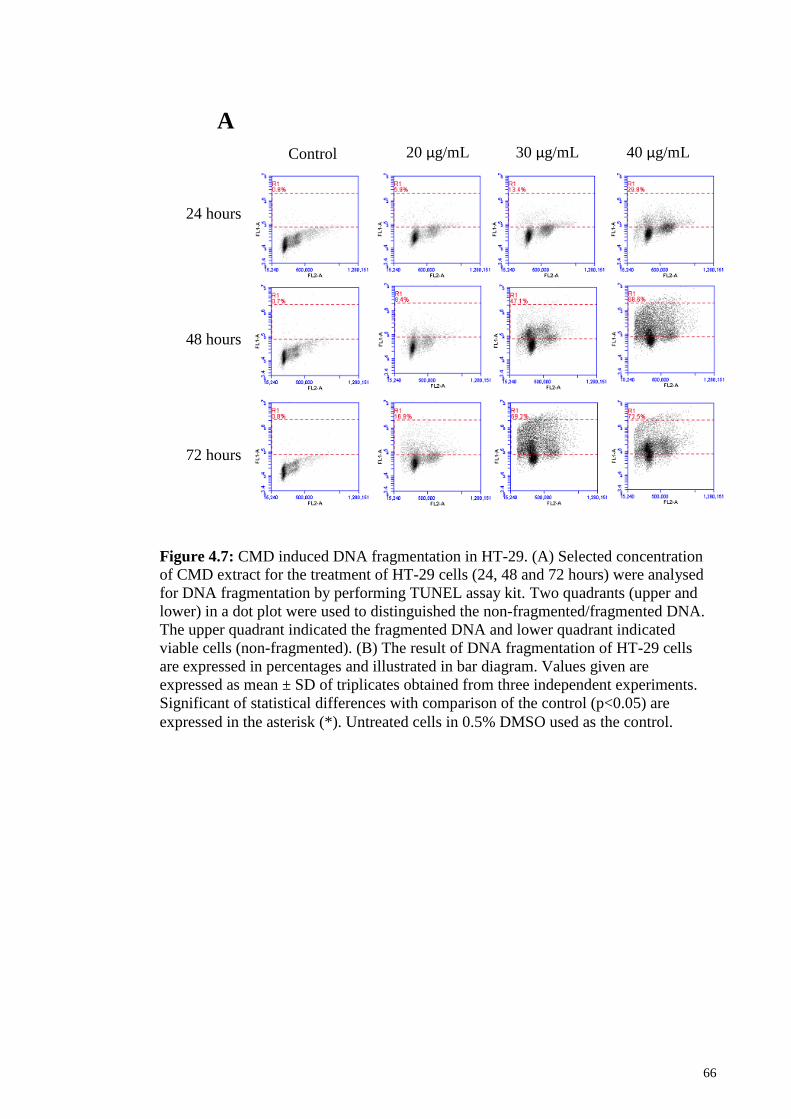
66
40µg/mL
Control 20 µg/mL 30 µg/mL 40 µg/mL
24 hours
48 hours
72 hours
A
Figure 4.7: CMD induced DNA fragmentation in HT-29. (A) Selected concentration
of CMD extract for the treatment of HT-29 cells (24, 48 and 72 hours) were analysed
for DNA fragmentation by performing TUNEL assay kit. Two quadrants (upper and
lower) in a dot plot were used to distinguished the non-fragmented/fragmented DNA.
The upper quadrant indicated the fragmented DNA and lower quadrant indicated
viable cells (non-fragmented). (B) The result of DNA fragmentation of HT-29 cells
are expressed in percentages and illustrated in bar diagram. Values given are
expressed as mean ± SD of triplicates obtained from three independent experiments.
Significant of statistical differences with comparison of the control (p<0.05) are
expressed in the asterisk (*). Untreated cells in 0.5% DMSO used as the control.

67
B
Figure 4.7, continued
*
*
*
*
*
*
*
*
*
*
*
*
*
*
*
*
*
*

68
4.8 Effects of CMD on the cell cycle arrest and the cell cycle regulatory proteins
in HT-29 cells
The regulation of cell cycle development is commonly linked with cell proliferation.
The initiation of molecular mechanisms cell cycle arrests on HT-29 cells were examined
by further test. After 24 hours treatment, there was an increase and accumulation of
cells in the G2/M phase at all concentration as shown in Figure 4.8. Decreased of cell
population in G0/G1 phase and increased of cell accumulation in S phase with increased
of concentration. The treated cells when treated with 20, 30 and 40 µg/mL of CMD
extract accumulated in the G2/M phase from 12.76 ± 0.01% (control), 26.10% ± 0.02%,
39.66 ± 0.06% and 44.16 ± 0.02% respectively. The treatment of HT-29 cells with
CMD extract over more than 24 hours induced more cell death and caused insufficient
cell numbers for data interpretation. Further investigation on the molecular mechanisms
underlying cell cycle arrest in HT-29 treated with CMD extract involve the study of
proteins which play important roles in regulation of cell cycle progression using the
western blot analysis. As shown in Figure 4.9, CMD treatments drastically increased the
levels of cyclin-dependant kinase inhibitor, p21 and p27 in HT-29 cells. Consistent with
the activation of cyclin-dependent kinase inhibitor was then significantly decrease in the
levels of cyclin-dependant kinases Cdk4, and the cell cycle regulatory protein, cyclin
D1 in HT-29 cells after 18 hours treatment with CMD extract. Three replicates were
conducted for the western blot analysis on the proteins that regulates cell cycle
progression.

69
Control 20 µg/mL
30 µg/mL 40 µg/mL
24 hours
Cell co
un
ts
PI fluorescence intensity
A
Dip G1: 66.98 %
Dip G2: 12.76 %
Dip S: 20.27 %
Dip G1: 65.56 %
Dip G2: 26.10 %
Dip S: 8.44 %
Dip G1: 49.67 %
Dip G2: 39.66 %
Dip S: 10.78 %
Dip G1: 37.95
Dip G2: 44.16
Dip S: 17.87 %
Figure 4.8: CMD induced cell cycle arrest in HT-29. (A) HT-29 were treated with
the selected concentrations of CMD for 24 hours and the DNA of the cells were
stained using PI. Flow cytometry was used for analysing the content of DNA in HT-
29 cells and the DNA distribution in cell cycle (G0/G1, S and G2/M phases) was
quantified with software called the ModFit. (B) The result of accumulation of HT-29
cells in each phase are expressed in percentages and illustrated in bar diagram. Values
given are expressed as mean ± SD of triplicates obtained from three independent
experiments. Significant of statistical differences with comparison of the control
(p<0.05) are expressed in the asterisk (*). Untreated cells in 0.5% DMSO used as the
control.

70
CDK4
Cyclin D1
p21
p27
(Hours) 0 3 6 12 18 24 kDa
34
37
21
27
1.000 0.930 0.878 0.530 0.291 0.000
1.000 1.462 1.037 1.597 0.535 0.372
1.000 0.533 0.048 0.818 1.477 1.453
1.000 3.866 4.872 6.015 7.373 8.105
β-actin 45
B
Figure 4.8, continued
Figure 4.9: Effects of CMD on cell cycle regulatory proteins in HT-29. Cells were
incubated in the absence or presence of CMD (40.0 μg/mL) for the indicated times,
and followed by protein extraction. Changes in levels of the cyclin D1, cyclin
dependent kinase (Cdk) 4 and Cdk inhibitors (p21Cip1
and p27Kip1
) were analyzed by
Western blot. Untreated cells in 0.5% DMSO served as the control. β-actin was used
as the loading control. The results from representative experiments were expressed
relative to the proteins level at 0 hr after normalization to β-actin signals.
*
*
*
*
*
*
*

71
4.9 Effects of CMD on the level of pro-apoptotic and anti-apoptotic proteins in
HT-29 cells
The expression level of pro-apoptotic and anti-apoptotic proteins in HT-29 were
altered after treatment with crude CMD extract as shown in Figure 4.10. The expression
level of pro-apoptotic protein Bax was drastically increased in HT-29 in a time-
dependent manner after incubation with CMD extract. The expression level of Bax
increased approximately 6-fold compared to the negative control (at zero-hour
treatment), between 12 to 24 hours of treatment. The expression level of anti-apoptotic
proteins such as xIAP and cIAP-2 were altered in a time-dependent manner after
incubation with CMD extract. The expression level of xIAP was initially increased but
was downregulated after 12 hours treatment with CMD extract while the expression
level of cIAP-2 decreased after 6 hours of treatment and remained constant up to 24
hours. Three replicates were conducted for the western blot analysis on both pro- and
anti-apoptotic proteins.
Bax
xIAP
cIAP-2
(Hours) 0 3 6 12 18 24 kDa
23
53
70
1.000 2.202 5.707 6.126 5.691 6.162
1.000 1.079 1.429 0.973 0.535 0.522
1.000 0.470 0.249 0.530 0.373 0.257
β-actin 45
Figure 4.10: Effects of CMD on the levels of pro- and anti-apoptotic proteins in HT-
29. HT-29 cells were treated with CMD (40.0 μg/mL) for specified time points, and
followed by protein extraction and western blot analysis. CMD extract increased the
level of pro-apoptotic protein (Bax) and inhibit the anti-apoptotic proteins (XIAP
and cIAP-2). The results from representative experiments were expressed relative to
the protein level at 0 hr after normalization to β-actin signals.
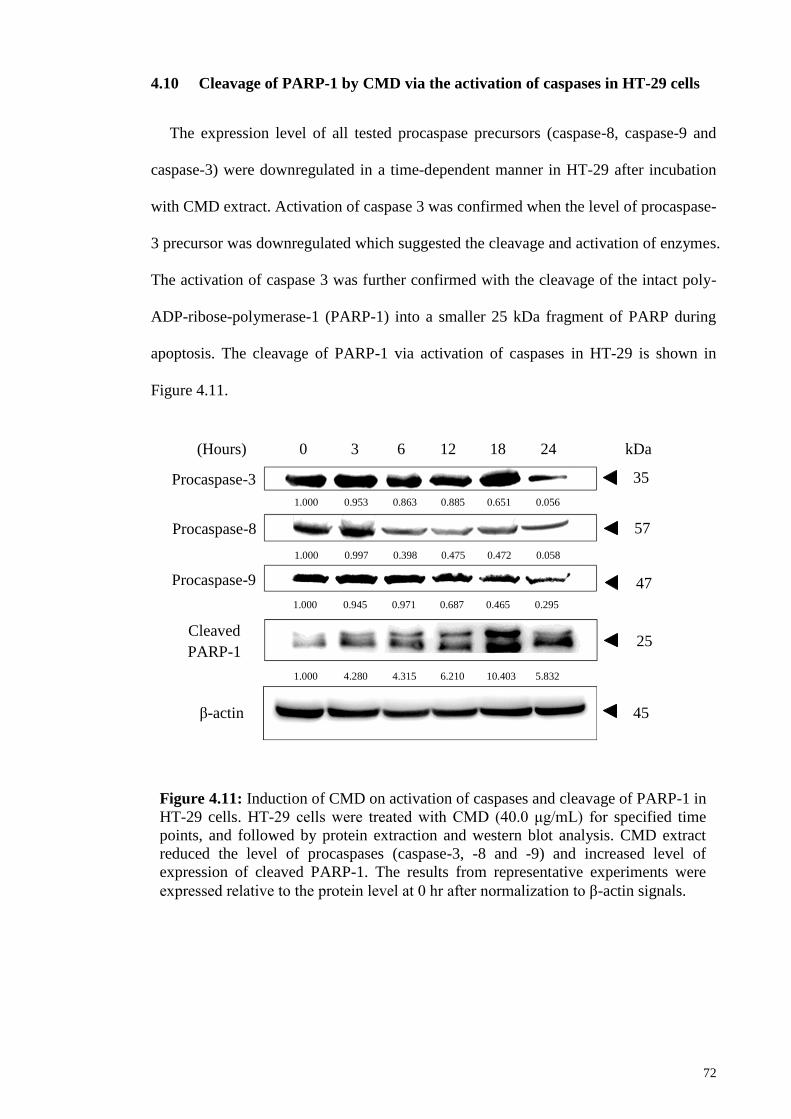
72
4.10 Cleavage of PARP-1 by CMD via the activation of caspases in HT-29 cells
The expression level of all tested procaspase precursors (caspase-8, caspase-9 and
caspase-3) were downregulated in a time-dependent manner in HT-29 after incubation
with CMD extract. Activation of caspase 3 was confirmed when the level of procaspase-
3 precursor was downregulated which suggested the cleavage and activation of enzymes.
The activation of caspase 3 was further confirmed with the cleavage of the intact poly-
ADP-ribose-polymerase-1 (PARP-1) into a smaller 25 kDa fragment of PARP during
apoptosis. The cleavage of PARP-1 via activation of caspases in HT-29 is shown in
Figure 4.11.
Procaspase-3
Procaspase-8
(Hours) 0 3 6 12 18 24 kDa
35
57
47
1.000 0.953 0.863 0.885 0.651 0.056
1.000 0.997 0.398 0.475 0.472 0.058
1.000 0.945 0.971 0.687 0.465 0.295
β-actin 45
Procaspase-9
25 Cleaved
PARP-1
1.000 4.280 4.315 6.210 10.403 5.832
Figure 4.11: Induction of CMD on activation of caspases and cleavage of PARP-1 in
HT-29 cells. HT-29 cells were treated with CMD (40.0 μg/mL) for specified time
points, and followed by protein extraction and western blot analysis. CMD extract
reduced the level of procaspases (caspase-3, -8 and -9) and increased level of
expression of cleaved PARP-1. The results from representative experiments were
expressed relative to the protein level at 0 hr after normalization to β-actin signals.

73
CHAPTER 5: DISCUSSION
5.1 Cytotoxicity screening of extracts and isolated compounds
A plant extract is considered to have cytotoxic effect if the IC50 is 20 µg/mL or lower
after 48 to 72 hours of treatment (Marchetti et al., 2015). The hexane-soluble fraction
(CMH) from Method A exhibited good cytotoxic effect on HT-29 and HCT-116 cells
after 72 hours of treatment of cells (IC50 values of 21.7 ± 0.8 µg/mL and 16.1 ± 0.2
µg/mL respectively), but it was not active against A549 and CaSki cells (IC50 values of
23.2 ± 1.1 µg/mL and 31.9 ± 0.4 µg/mL respectively) after 72 hours of treatment. CME
also showed good cytotoxic effect on HT-29 and HCT-116 cells (with IC50 values of
15.6 ± 4.4 µg/mL and 16.6 ± 0.5 µg/mL respectively) but poor cytotoxic effect on A549
and CaSki cells (with IC50 values of 31.7 ± 2.3 µg/mL and 41.9 ± 1.4 µg/mL
respectively) after 72 hours of treatment. Crude methanolic extract (CMM) only showed
good cytotoxicity effect on HCT-116 cells with the IC50 values of 18.1 ± 0.7 µg/mL, but
displayed poor or no growth inhibitory activities against other cell lines (IC50 values of
more than 30.0 µg/mL). Many of the results obtained for extracts from Method A was
not consistent with results from Malek et al. (2010). The differences might be due to the
type of assay used for evaluating the effects induced by the extract. However, the water
extract did not exert any damage on all cell treated lines with IC50 values more than
100.0 µg/mL which was consistent with the result of Malek et al. (2010).
On the other hand, all crude extract and active fractions from Method B showed good
cytotoxic effect on all tested cell lines with IC50 values less than 22.0 µg/mL. Crude
dichloromethane extract (CMD) showed the strongest cytotoxic effect on HT-29 cell
with IC50 values of 14.3 ± 0.2 µg/mL compared to other tested cell lines. The hexane-
soluble fraction (CMDH) from Method B showed the strongest cytotoxic effect on
A549 cell with IC50 value of 14.8 ± 0.6 µg/mL while the hexane-insoluble fraction
74
(CMDM) showed the highest cytotoxic effect on HCT-116 cell with IC50 value of 15.7
± 0.5 µg/mL. In summary, the overall cytotoxic performances of crude extract and
active fractions from Method B displayed better cytotoxic effects against all tested
cancer lines. In addition, extracts from Method B exerted lower toxicity on normal
colon cell line, CCD-18Co (with IC50 values greater 50.0 µg/mL) compared to the
chemotheraphy drug, doxorubicin. Extracts from Method A showed higher toxicity with
IC50 values less than 50.0 µg/mL except the water extract (CMW) in comparison to
extracts in Method B. In general, extracts from Method A showed cytotoxic effects on
selective tested cancer cell lines while extracts from Method B showed cytotoxic effects
on all tested cancer cell lines.
Pure compounds are considered active when the IC50 values in vitro assay is 50 µM
or less (Boik, 2001). Based on the results of cell lines after 72 hours incubation shown
in Table 4.7, compound (E)-labda-8(17),12-dien-15,16-dial exhibited good cytotoxic
effect on HCT116 after 72 hours treatment displayed IC50 values of 39.0 ± 0.7 µM
respectively. Meanwhile, compounds zerumin A and (E)-labda-8(17),12-dien-15,16-dial
showed moderate cytotoxicity on HT-29 with IC50 value of 61.9 ± 1.6 µM and 63.2 ±
1.0 µM respectively. Zerumin A exhibited moderate cytotoxicity against A549 cells
with IC50 value of 58.5 ± 2.2 µM after 72 hours treatment. Longpene A, zerumin A,
coronadiene, (E)-labda-8(17),12-dien-15,16-dial and calcaratarin A showed weak
cytotoxic effect against CaSki. Other unidentified compounds showed weak or no
cytotoxicity against all tested cell lines. As mentioned previously, zerumin A and (E)-
labda-8(17),12-dien-15,16-dial degraded over time and the cytotoxic effects were also
reduced with time.

75
Typically, pure compounds had higher potency in anticancer effects than the crude or
fractionated extracts. Based on the cytotoxicity screening results, the crude and
fractionated extracts displayed better cytotoxic effect than the isolated pure compounds.
Besides that, the cytotoxicity screening results by crude and fractionated extracts were
consistent even though the extracts were stored for more than three months (as shown in
Table 4.3). This suggests that the compounds were more stable in the extract form and
synergism between the compounds could explain for the good cytotoxic effects shown
by the crude and fractionated extracts against tested cancer cells. Synergism or
potentiation is the effect of combination which is greater than the sum of individual
effects (Rasoanaivo et al., 2011). Thearubigins, polymeric polyphenols found in black
tea, did not inhibit any growth of tumor, but when combined with genistein from
soybean, the combination would suppress the human prostate tumor growth as well as
causing cell arrest in G2/M phase (HemaIswarya & Doble, 2006). Another example of
synergism effect was shown by a combination of four thiazolidinone compounds which
exhibited higher cytotoxicity than the individual compounds against paclitaxel-sensitive
lung carcinoma (H460) and P-gp over-expressing paclitaxel-resistant cell (H460/TaxR)
with minimal toxicity against normal fibroblasts cell (HemaIswarya & Doble, 2006).
Then the cytotoxic effect of crude and fractionated extracts in comparison to the
individual compounds might be due to the combined synergism effect of the individual
compounds.
Hence, the crude dichloromethane extract (CMD) was selected for further
investigation on the cell death mechanism of HT-29 since CMD exhibited the lowest
IC50 value on HT-29.

76
5.2 Apoptotic morphology of HT-29 cells induced by CMD
Cells undergoing apoptosis have characteristics of morphological and biochemical
features. The morphological characteristics of apoptosis include membrane blebbing, a
reduction in cell size (pyknosis), cell rounding, chromatin condensation, nuclear
fragmentation, presence of apoptotic bodies, and cell detachment due to loss of cellular
adhesion (Duprez et al., 2009; Ola et al., 2011a; Ouyang et al., 2012b; Wong, 2011). All
these morphological changes can be observed in Figure 4.4 and 4.5 and thus, these
results support the induction of apoptosis in HT-29 cells by CMD.
5.3 Early- and late apoptosis event in HT-29 cells induced by CMD
One biochemical event of apoptosis is the externalization of phosphotidylserine.
Annexin V-PI staining was performed to detect early and late apoptosis in treated HT-
29 cells. Annexin V dye can easily bind to the externalized phosphatidylserine (PS) on
the outer membrane of apoptotic cells (Elmore, 2007). The presence of PS on the cell
surface is one of the most significant characteristics in apoptosis due to the negative
charge of phospholipid with its ability to modify the interactions with other lipids that
might disrupt the lipid supporting structures (Demchenko, 2012). During early
apoptosis, cell membrane asymmetry is disrupted causing the exposure of PS residues to
the outer cell membrane leaflet and Annexin V is strongly associated with PS residues
(van Engeland et al., 1997; van Engeland et al., 1998). Therefore, the application of
Annexin V conjugated to FITC enables apoptotic cells to be identified and quantified on
a single-cell basis by flow cytometry. Studies on detection of early and late apoptosis
induced by CMH and CME extract also showed percentages of cell population undergo
early and late apoptosis increased in a concentration- and time-dependant manner (Hong
et al., 2015). The percentages of early and late apoptotic cells induced by CMD extract

77
were lower in comparison to those of CMH and CME after 24 hours of treatment. After
48 and 72 hours treatment, the percentages of early and late apoptotic cells induced by
CMD extract were higher than shown by both CME and CMH extract which was
reported by Hong et al. (2015). Up-to-date, this is the second report on detection of
externalization of PS by active fraction from C. mangga. However, the results from this
study further support the apoptotic events in HT-29 induced by CMD extract.
5.4 DNA fragmentation in HT-29 cells induced by CMD
Cleavage of chromosomal DNA is one of the biochemical hallmark of cell apoptosis.
Cleavage occurs in the internucleosomal regions of double-stranded DNA and the DNA
strands are cleaved into approximately 200 base pair (bp) long DNA fragments by
endogenous DNases (Maiese et al., 2012; Saraste & Pulkki, 2000). A chromosome is
mainly made up with DNA and histones in which the DNA strands tightly wrap around
the core of histones and the primary function of histomes is controlling the folding of
DNA strand into a chromatin. It has been suggested by Lee et al. (1996) that the
endonucleases catalyze the DNA fragmentation during the relaxation of chromatin
structure as the histones structure was modified when treated with anticancer agent.
This suggested that the mechanism of CMD extract in DNA fragmentation of HT-29
could be related to changes in histones associated with the DNA strands. TUNEL assay
is used to observe this biochemical hallmark, which involves in situ labeling of DNA
strand breaks (DSBs) by 5-bromo-2'-deoxyuridine 5'-triphosphate (BrdU) incorporation
and detection using a dye-labeled anti-BrdU antibody (Darzynkiewicz et al., 2008;
Gavrieli et al., 1992). The outcomes from the TUNEL assay showed DNA
fragmentation occurred in HT-29 cells when treated with CMD extract. This indicated

78
that CMD extract caused individual of apoptosis in HT-29 cells. This is the first report
of induction of DNA fragmentation by C. mangga rhizomes extract.
5.5 Cell cycle arrest and changes of cell-cycle regulatory proteins
One of the significant hallmark of cancer that showed ungoverned cell
growth/proliferation in cancer is unregulated cell cycle. Mutation on key checkpoint
genes is responsible for the disruption of molecular mechanisms on regulation of cell
cycle in cancer (Novak & Tyson, 2003). Cell cycle are separated by two phases that
comprises of M phase (mitosis) and S phase (DNA synthesis), divide by G1 and G2
phase which served as the separation gaps (Han et al., 2012). A sequence of cyclin-
dependant kinases (Cdks) are responsible to the regulation of phase transition in cell
cycle through binding to their respective regulatory proteins like cyclins as shown in
Figure 5.1. The binding of Cdks with their respective cyclins would trigger different
downstream biochemical events that involved the phosphorylation of the targeted
proteins (Vermeulen et al., 2003). The presence of endogenous CDKs inhibitor such as
p21Cip
and p27Kip
or the degradation of cyclins is negatively regulating the activities of
CDK-cyclin complexes (Vermeulen et al., 2003). High level of cyclin D1 is maintained
throughout the G/M phase to G0/G1 phase and the level of cyclin D1 is automatically
reduced when it reached S phase since it interfere with the DNA synthesis processes
(Stacey, 2003). Phosphorylation of the retinoblastoma (Rb) proteins and the release of
E2F transcription factor into the nucleus activate the transcription of cell cycle related
genes which will be inhibited through the binding of p21 and p27 into CDK4/cyclin D
and CDK2/cyclin E complexes respectively (Giacinti & Giordano, 2006; Munoz-
Alonso et al., 2005). When DNA damage is present or the DNA synthesis during the S
phase is incomplete, the G2/M checkpoint halts cells from entering the M phase where
the cells can undergo mitosis (Kastan & Bartek, 2004). Therefore, the G2/M phase is

79
one of the decisive phase for the fate of the damaged cells, which either activate the
repairing of damaged DNA, or activate apoptosis if the DNA damage is irreparable
(Blagosklonny & Pardee, 2002; Huang et al., 2008; Molinari, 2000). Hong et al. (2015)
reported that the CMH and CME extracts of C. mangga rhizome induced cell cycle
arrest in G0/G1 phase and G2/M phase in HT-29 after 72 hours of treatment. However, in
this study, CMD extract induced higher percentage of cell arrest in G2/M phase
compared to those displayed by CMH and CME extracts. This might be due to the
presence of different active compounds in the CMD, CMH and CME extracts.
The cell cycle arrest at the G2/M phase is consistent with the downregulation of Cdk4
and cyclin D1 after 18 hours of treatment. CMD extract as shown by the Western blot
analysis in Figure 4.9. Downregulation Cdk-4 and cyclin D1 is necessary to inhibit the
progression of HT-29 cells into the G0/G1 phase. The increase in the level of p21 and
p27 protein was also observed in the Western blot analysis. These two proteins
responsible in deactivation of CDK-4 and cyclin D1 protein.

80
5.6 Changes of level of pro- and anti-apoptotic proteins in HT-29 cells
In the Western blot analysis, it was found that the expression level of pro-apoptotic
and anti-apoptotic proteins in HT-29 were altered after treatment with crude CMD
extract. In a typical intrinsic apoptotic pathway, the signals that trigger cell deaths are
produced and originated from within the cell itself. The mitochondrion is a key
organelle that acts as an initiator and executioner of the intrinsic apoptotic pathway
besides its classic function as a site for cellular ATP generation (Harris & Thompson,
Figure 5.1: The transition of one phase to another phase in cell cycle is tightly
controlled and regulated through the binding of a series of cyclin-dependant kinases
(Cdks) to their respective cyclins (Herrup & Yang, 2007)

81
2000; Zeestraten et al., 2013). Bcl-2 family members responsible for both positive and
negative stimuli and the activation of the intrinsic apoptotic pathway is determined by
the integration among them (Aggarwal & Takada, 2005). Bcl-2 family members can be
divided into two groups: pro-apoptotic (Bax, Bak, Bad) and anti-apoptotic (Bcl-2, Bcl-
xL, Bcl-w) proteins (Lindsay et al., 2011; Ola et al., 2011b). Bax and Bak are the
proteins that play an important role in promoting the release of cytochrome c from the
mitochondria into the cytosol by elevating the permeability of the outer mitochondrial
membrane (OMM) through the oligomerization of Bax and Bak (Hunter et al., 2007;
Lindsay et al., 2011; Pietenpol & Stewart, 2002). Release of cytochrome c then binds
with adaptor Apaf-1 and procaspase 9 to form the apoptosome which later lead to the
activation of caspase-9 and -3 (Baliga & Kumar, 2003; Gross, 2001). In contrast, the
anti-apoptotic proteins bind with pro-apoptotic proteins and antagonize their functions
by inhibiting the pore formation of OMM through balancing the mitochondrial
membrane potential (Harris & Thompson, 2000; Jain et al., 2013; Tamm et al., 2001).
Therefore, the upregulation of Bax in HT-29 treated with CMD extract promote the
permeability of OMM and thus the formation of pore on OMM that lead to release of
cytochrome c, formation of apoptosome and downregulation of procaspase-9 (activation
of caspase-9) as shown in Figure 4.11.
There are eight types of proteins that can be found in the human inhibitor of
apoptosis protein (IAP) family members which is characterized with one to three
Baculovirus IAP Repeat (BIR) domain(s) at the N-terminal that approximately consists
of 70 amino acids (Berthelet & Dubrez, 2013; de Almagro & Vucic, 2012; Wei et al.,
2008). The IAPs such as X-linked IAP (XIAP), cellular IAP (cIAP)-1, cIAP-2,
81dimmers81g and others facilitated the regulation of cell death in multiple ways,
ranging from inhibition of apoptosis through inhibiting the activities of caspases to cell
cycle and inflammation (de Almagro & Vucic, 2012; Wei et al., 2008). XIAP is one the
82
best characterized IAP and the most potent endogenous caspase inhibitor that directly
binds and inhibit caspases (Graber & Holcik, 2011). XIAP has three BIR domains
(BIR1, BIR2. BIR3) that has high affinity but uneven functions on caspases. For
example, the BIR3 domain of XIAP binds to the active site of monomeric caspase-9 to
form a heterodimer that prevent cell death. XIAP also binds to caspase-3/-7 through the
BR2 and the linker regions between BIR1 and BIR2 by blocking active binding site of
caspases (Wei et al., 2008). However, XIAP can be inhibited by IAP antagonists such as
second mitochondria-derived activator of caspases/direct IAP binding protein with low
Pi (Smac/DIABLO) and high-temperature-regulated A2/Omi (HtrA2/Omi). These IAP
antagonists are cleaved into active forms during the release of apoptogenic proteins
including cytochrome c, Smac/DIABLO and HtrA2/Omi from the mitochondria into the
cytosol (Wei et al., 2008). The released active Smac/DIABLO binds to the BIR3
domain of XIAP through its IAP-binding motif to prevent the further binding of XIAP
on caspase-9, which then accelerate the XIAP autoubiquitination and degradation (Li et
al., 1997; Wei et al., 2008). On the other hand, cIAP-2 inhibits cell apoptosis through its
E3 ligase activity (Hu & Yang, 2003; Rodrigue-Gervais et al., 2014). It has been
demonstrated that the cIAP-2 inhibited programmed cell death by directly suppressing
the pro-apoptotic activity of caspases and also aiming the pro-apoptotic components of
the tumor necrosis factor alpha (TNF-α) signalling pathway for ubiquitin degradation
(Conte et al., 2006; Guicciardi et al., 2011). In the study, it can be observed that the
levels of both XIAP and cIAP -2 were downregulated in HT-29 after treatment with
CMD extract and subsequently resulted in the activation of caspases-8, -9 and -3.

83
5.7 Cleavage of PARP-1 through the activation of caspases
Based on the results of this study, the levels of all tested caspases were activated
which eventually lead to the cleavage of PARP-1 (Figure 4.11). PARP-1 is an abundant
and chromatin-associated enzyme that play important role in poly-ADP-ribosylation
that maintain the genomic integrity by binding to single- or double-stranded DNA break
to activate and initiate auto-ribosylation (D’Amours et al., 2001; Ko & Ren, 2012; Los
et al., 2002). Therefore, frequent activity of DNA repair in cancer is due to the
upregulation of PARP-1(Ko & Ren, 2012). In contrast, PARP-1 also plays an important
role in cell death which included apoptosis and necrosis. Necrosis cell death is only
initiated when the energy level is extremely depleted (D’Amours et al., 2001). On the
other hand, active executioner caspases (caspase-3 or -7) cleave PARP-1 into two
different size of fragments: a 24/25 kDa of DNA-binding domain (DBB) and an 89 kDa
catalytic fragment during execution stage in apoptosis (Chaitanya et al., 2010; Tian et
al., 2000). After the cleaving of PARP-1 by caspases, the DBB binds irreversibly to the
DNA strand breaks which then inhibit the DNA repairing enzyme and thus attenuate the
DNA repairing (Chaitanya et al., 2010) which lead to apoptosis cell death. Therefore,
cleaving of PARP-1 by caspase is one of the hallmark of apoptosis. Effector or
executioner caspases are usually inactive dimmers in the cytosol and are only activated
by active initiator caspases so that the effector caspases become active and it is then
able to cleave PARP-1 which halt the DNA repairing process and eventually apoptosis
cell death (Alenzi et al., 2010). In this study, initiator caspases (caspase-8 and -9) were
activated in HT-29 treated with CMD extract that provide a strong support for the
activation of caspase-3 and PARP-1. Besides that, the level of activated caspase-8 is
higher than the activated caspase-9 suggesting that the extrinsic apoptotic pathway is
the main cell-signalling pathway in HT-29 induced by CMD extract rather than the
intrinsic pathway. Based on the western blot and the DNA fragmentation analysis, all

84
procaspases were downregulated (caspases are activated) which lead to cleavage of
PARP-1, DNA fragmentation and apoptosis cell death.

85
CHAPTER 6: CONCLUSIONS
Four compounds were successfully isolated and identified from CMDH and these
four compounds were longpene A, zerumin A, coronadiene and (E)-labda-8(17),12-
dien-15,16-dial. Only one compound, calcaratarin A was isolated from fraction CMDM.
The compound (E)-labda-8(17),12-dien-15,16-dial exhibited good cytotoxic effect on
HCT 116 with an IC50 value of 39.0 ± 0.7 µM after 72 hours of incubation. Zerumin A
showed moderate cytotoxic effect on A549 with IC50 value of 58.5 µM after 72 hours
treatment. All the identified compounds have no growth inhibitory effect against HT-29
and CaSki while other unidentified compounds displayed no toxicity towards all cell
lines. Interestingly, the CMD extract from which CMDH and CMDM were derived
showed better inhibitory effects in comparison to the pure compounds. Synergism
between the compounds may have been responsible for this effect.
Apoptotic morphologies were observed in HT-29 treated with CMD in
concentration- and time-dependent manner. Cell shrinkage, membrane blebbing,
cytoplasm vacuolization, formation of apoptotic bodies and nuclear disintegration were
observed in phase contrast microscopy while chromatin condensation was observed in
fluorescence microscopy. These morphological changes in HT-29 treated by CMD is
first evidence of induction of apoptosis in HT-29 by CMD extract. Externalization of
phosphotidylserine and DNA fragmentation in HT-29 were detected after treatment with
CMD extract for 24, 48 and 72 hours. The CMD extract increased the population of
early- and late apoptosis, and DNA fragmentation in HT-29 in concentration- and time-
dependent manner. Besides that, cell population were arrested in G2/M phase was
detected as well in HT-29 after treatment with CMD extract for 24 hours. These
findings further validated the induction of apoptosis in HT-29 after treated with CMD
extract.

86
Western blot analysis was further performed to analyze the damage in protein
expression in HT-29 induced by CMD extract. The CMD extract increased the level of
expression of cell cycle regulatory proteins (cyclin D1, Cdk4, p21, p27) in HT-29 that
was correlated to the G2/M phase arrest in the cell cycle analysis. Besides that, CMD
extract also increased the expression level of pro-apoptotic protein, Bax as well as
decreased the expression level of anti-apoptotic proteins (XIAP and cIAP-2). The level
of expression of activated caspase-8 and -9 suggested that apoptosis in HT-29 was
induced by CMD extract via extrinsic and intrinsic signalling pathway. Activation of
caspase-8 and -9 would lead to activation of caspase-3 that caused cleavage of PARP-1
and then cell death. These western blot analyses suggested that the extrinsic-, intrinsic
signalling pathway as well as the cell cycle progression were altered in HT-29 after
treatment with CMD extract which that contributed to cell apoptosis in HT-29.
In conclusion, the active crude and fractions of C. mangga rhizomes exhibited
good cytotoxic effects against various cancer cell lines (IC50 values: 14.3 ± 0.2 µg/mL
on HT-29; 15.2 ± 0.8 µg/mL on HCT 116; 16.5 ± 0.4 µg/mL on A549 and 18.7 ± 0.7
µg/mL on CaSki) after 72 hours of incubations and the effects were even better than the
isolated pure compounds. The CMD extract induced typical apoptotic morphological
and biochemical characteristics in HT-29. Apoptosis may have occurred mainly through
the extrinsic pathway through caspase-8 and to a lesser extent through the mitochondrial
pathway through the up-regulation of Bax, cytochrome c release and caspase-9.
Activation of caspase-8 and 9 triggers the activation of caspase-3 which led to the DNA
fragmentation and PARP-1 cleavage. This eventually led to cell death via apoptosis.
Therefore, the CMD extract of C. mangga rhizomes has the potential to be developed
into an anticancer agent for the treatment of colon cancer (HT-29). The result observed
in this study thus supported the traditional use of C. mangga rhizomes in cancer-related
diseases.

87
REFERENCES
Abas, F., Lajis, N. H., Israf, D. A., Khozirah, S., & Kalsom, Y. U. (2006). Antioxidant
and nitric oxide inhibition activities of selected Malay traditional vegetables.
Food Chemistry, 95(4), 566-573.
Abas, F., Lajis, N. H., Shaari, K., Israf, D. A., Stanslas, J., Yusuf, U. K., & Raof, S. M.
(2005). A labdane diterpene glucoside from the rhizomes of Curcuma mangga.
Journal of Natural Products, 68(7), 1090-1093.
Aggarwal, B. B., & Takada, Y. (2005). Pro-apototic and anti-apoptotic effects of tumor
necrosis factor in tumor cells. Role of nuclear transcription factor NF-kappaB.
Cancer Treatment and Reserve, 126, 103-127.
Ajith, T. A., Aswathy, M. S., & Hema, U. (2008). Protective effect of Zingiber
officinale roscoe against anticancer drug doxorubicin-induced acute
nephrotoxicity. Food and Chemical Toxicology, 46(9), 3178-3181.
Ajith, T. A., Nivitha, V., & Usha, S. (2007). Zingiber officinale Roscoe alone and in
combination with α-tocopherol protect the kidney against cisplatin-induced
acute renal failure. Food and Chemical Toxicology, 45(6), 921-927.
Alenzi, F. Q., Lotfy, M., & Wyse, R. (2010). Swords of cell death: Caspase activation
and regulation. Asian Pacific Journal of Cancer Prevention, 11(2), 271-280.
Ali, R. M., Samah, Z. A., Mustapha, N. M., & Hussein, N. (2010). ASEAN herbal and
medicinal plants. Jakarta, Indonesia: ASEAN Secretariat.
American Cancer Society (2015). Cancer facts and figures 2015. Retrieved from
https://www.cancer.org/content/dam/cancer-org/research/cancer-facts-and-
statistics/annual-cancer-facts-and-figures/2015/special-section-breast-
carcinoma-in-situ-cancer-facts-and-figures-2015.pdf
Apavatjrut, P., Sirisawad, T., Sirirugsa, P., Voraurai, P., & Suwanthada, C. (1996).
Studies on chromosome number of seventeen Thai Curcuma species.
Proceedings of 2nd National Conference on Flower and Ornamental Plant.
Ardiyani, M. (2003). Systematic study of Curcuma L.: Turmeric and its allies.
(Unpublished doctoral dissertation). University of Edinburgh, Edinburgh,
Scotland.
Avendaño, C., & Menéndez, J. C. (2008). Medicinal chemistry of anticancer drugs (pp.
1-8). Amsterdam: Elsevier.
Babu, K. N., Shiva, K. N., Sabu, M., Minoo, D., & Ravindran, P. N. (2011). Turmeric.
In R. J. Singh (Ed.), Genetic resources, chromosome engineering, and crop
Improvement (pp. 451-512). Boca Raton, Florida: CRC Press.
Balakrishnan, N. P., & Bhargava, N. (1984). The genus Curcuma L. (Zingiberaceae) on
Andaman and Nicobar Islands. Journal of the Bombay Natural History Society,
81, 510-514.
88
Baliga, B., & Kumar, S. (2003). Apaf-1/cytochrome c apoptosome: an essential
initiatorof caspase activation or just a sideshow? Cell Death Differ, 10(1), 16-18.
Behl, C., & Ziegler, C. (2014). Cell aging: Molecular mechanisms and implications for
disease.Berlin, Germany: Springer.
Berthelet, J., & Dubrez, L. (2013). Regulation of apoptosis by inhibitors of apoptosis
(IAPs). Cells, 2(1), 163-187.
Bjelaković, G., Nagorni, A., Bjelaković, M., Stamenković, I., Arsić, R., & Katić, V.
(2005). Apoptosis: Programmed cell death and its clinical implications.
Medicine and Biology, 12, 6-11.
Blagosklonny, M. V., & Pardee, A. B. (2002). The restriction point of the cell cycle.
Cell Cycle, 1(2), 103-110.
Boerner, J. L., Biscardi, J. S., & Parsons, S. J. (2002). Overview of oncogenes. In M.
Alison (Ed.), The cancer handbook (Vol. 1, pp. 25-34). London, UK: Nature.
Boik, J. (2001). Natural compounds in cancer therapy: Promising nontoxic antitumor
agents from plants & other natural sources. Princeton, Minnesota, USA: Oregon
Medical Press, LLC.
Borek, C. (2004). Dietary antioxidants and human cancer. Integrative Cancer Therapies,
3(4), 333-341.
Borenfreund, E., Babich, H., & Martin-Alguacil, N. (1988). Comparisons of two in vitro
cytotoxicity assays—The neutral red (NR) and tetrazolium MTT tests.
Toxicology In Vitro, 2(1), 1-6.
Boyle, P., & Levin, B. (Eds.). (2008). World cancer report 2008. Lyon, France:
International Agency for Research on Cancer.
Butler, M. S., Robertson, A. A. B., & Cooper, M. A. (2014). Natural product and
natural product derived drugs in clinical trials. Natural Product Reports, 31(11),
1612-1661.
Cellarier, E., Durando, X., Vasson, M., Farges, M., Demiden, A., Maurizis,
Maldemomont, J., & Chollet, P. (2003). Methionine dependency and cancer
treatment. Cancer Treatment Reviews (0305-7372).
Chaitanya, G. V., Alexander, J. S., & Babu, P. P. (2010). PARP-1 cleavage fragments:
signatures of cell-death proteases in neurodegeneration. Cell Communication
and Signaling : Cell Commun Signal, 8, 31-31.
Chiba, K., Kawakami, K., & Tohyama, K. (1998). Simultaneous evaluation of cell
viability by neutral red, MTT and crystal violet staining assays of the same cells.
Toxicology in Vitro, 12(3), 251-258.
Chidambaram, M., Manavalan, R., & Kathiresan, K. (2011). Nanotherapeutics to
overcome conventional cancer chemotherapy limitations. Journal of Pharmacy
and Pharmaceutical Sciences, 14(1), 67-77.

89
Chorawala, M. R., Oza, P. M., & Shah, G. B. (2012). Mechanisms of anticancer drugs
resistance: An overview. International Journal of Pharmaceutical Sciences and
Drug Research, 4(1), 1-9.
Conte, D., Holcik, M., Lefebvre, C. A., LaCasse, E., Picketts, D. J., Wright, K. E., &
Korneluk, R. G. (2006). Inhibitor of apoptosis protein cIAP2 Is essential for
lipopolysaccharide-induced macrophage survival. Molecular and Cellular
Biology, 26(2), 699-708.
Cragg, G. M., Grothaus, P. G., & Newman, D. J. (2009). Impact of natural products on
developing new anti-cancer agents. Chemical Reviews, 109(7), 3012-3043.
Cragg, G. M., & Newman, D. J. (2013). Natural products: A continuing source of novel
drug leads. Biochimica et biophysica acta, 1830(6), 3670-3695.
D’Amours, D., Sallmann, F. R., Dixit, V. M., & Poirier, G. G. (2001). Gain-of-function
of poly(ADP-ribose) polymerase-1 upon cleavage by apoptotic proteases:
implications for apoptosis. Journal of Cell Science, 114(20), 3771-3778.
Darzynkiewicz, Z. (2010). Critical Aspects in Analysis of Cellular DNA Content.
Current Protocols in Cytometry, 7, 1-10.
Darzynkiewicz, Z., Galkowski, D., & Zhao, H. (2008). Analysis of apoptosis by
cytometry using TUNEL assay. Methods, 44(3), 250-254.
de Almagro, M. C., & Vucic, D. (2012). The inhibitor of apoptosis (IAP) proteins are
critical regulators of signaling pathways and targets for anti-cancer therapy.
Experimental Oncology, 34(3), 200-211.
Demchenko, A. P. (2012). The change of cellular membranes on apoptosis:
fluorescence detection. Experimental Oncology, 34(3), 263-268.
Devi, P. U. (2005). Basic of carcinogenesis. Health Administrator, 1, 16-24.
Duprez, L., Wirawan, E., Berghe, T. V., & Vandenabeele, P. (2009). Major cell death
pathways at a glance. Microbes Infect, 11(13), 1050-1062.
Elmore, S. (2007). Apoptosis: A review of programmed cell death. Toxicologic
Pathology, 35(4), 495-516.
Ernst, E. (2005). The efficacy of herbal medicine – an overview. Fundamental &
Clinical Pharmacology, 19(4), 405-409.
Evans, G. (2002). Inherited predispositions to cancer. In M. Alison (Ed.), The cancer
handbook (Vol. 1, pp. 35-48). London, UK: Nature.
Fotakis, G., & Timbrell, J. A. (2006). In vitro cytotoxicity assays: Comparison of LDH,
neutral red, MTT and protein assay in hepatoma cell lines following exposure to
cadmium chloride. Toxicology Letters, 160(2), 171-177.

90
Gavrieli, Y., Sherman, Y., & Ben-Sasson, S. A. (1992). Identification of programmed
cell death in situ via specific labeling of nuclear DNA fragmentation. Journal of
Cell Biology, 119(3), 493-501.
Giacinti, C., & Giordano, A. (2006). RB and cell cycle progression. Oncogene, 25(38),
5220-5227.
Gooderham, N. J., & Carmichael, P. L. (2002). Mechanisms of chemical carcinogenesis.
In M. Alison (Ed.), The Cancer Handbook (Vol. 1, pp. 273-291). London, UK:
Nature.
Graber, T. E., & Holcik, M. (2011). Distinct roles for the cellular inhibitors of apoptosis
proteins 1 and 2. Cell Death & Disease, 2(3), e135.
Gross, A. (2001). BCL-2 proteins: regulators of the mitochondrial apoptotic program.
IUBMB Life, 52(3-5), 231-236.
Guicciardi, M. E., Mott, J. L., Bronk, S. F., Kurita, S., Fingas, C. D., & Gores, G. J.
(2011). Cellular inhibitor of apoptosis 1 (cIAP-1) degradation by caspase 8
during TNF-related apoptosis-inducing ligand (TRAIL)-induced apoptosis.
Experimental Cell Research, 317(1), 107-116.
Han, C. R., Jun, D. Y., Woo, H. J., Jeong, S.-Y., Woo, M.-H., & Kim, Y. H. (2012).
Induction of microtubule-damage, mitotic arrest, Bcl-2 phosphorylation, Bak
activation, and mitochondria-dependent caspase cascade is involved in human
Jurkat T-cell apoptosis by aruncin B from Aruncus dioicus var. kamtschaticus.
Bioorganic & Medicinal Chemistry Letters, 22(2), 945-953.
Hanahan, D., & Weinberg, R. A. (2000). The hallmarks of cancer. Cell, 100(1), 57-70.
Harris, M. H., & Thompson, C. B. (2000). The role of the Bcl-2 family in the regulation
of outer mitochondrial membrane permeability. Cell Death Differ, 7(12), 1182-
1191.
Hecht, S. S. (2002). Tobacco use and cancer. In M. Alison (Ed.), The Cancer Handbook
(Vol. 1, pp. 398-412). London, UK: Nature.
HemaIswarya, S., & Doble, M. (2006). Potential synergism of natural products in the
treatment of cancer. Phytotherapy Research, 20(4), 239-249.
Herrup, K., & Yang, Y. (2007). Cell cycle regulation in the postmitotic neuron:
oxymoron or new biology? Natural Review Neuroscience, 8(5), 368-378.
Holliday, D., & Speirs, V. (2011). Choosing the right cell line for breast cancer research.
Breast Cancer Research, 13(4), 215.
Hong, G. W., Hong, S. L., Lee, G. S., Yaacob, H., & Malek, S. N. A. (2015). Non-
aqueous extracts of Curcuma mangga rhizomes induced cell death in human
colorectal adenocarcinoma cell line (HT29) via induction of apoptosis and cell
cycle arrest at G0/G1 phase. Asian Pacific Journal of Tropical Medicine, 9(1),
8-18.

91
Houghton, P., Fang, R., Techatanawat, I., Steventon, G., Hylands, P. J., & Lee, C. C.
(2007). The sulphorhodamine (SRB) assay and other approaches to testing plant
extracts and derived compounds for activities related to reputed anticancer
activity. Methods, 42(4), 377-387.
Hu, S., & Yang, X. (2003). Cellular inhibitor of apoptosis 1 and 2 are ubiquitin ligases
for the apoptosis inducer Smac/DIABLO. Journal of Biological Chemistry,
278(12), 10055-10060.
Huang, M., Halicka, H. D., Traganos, F., Tanaka, T., Kurose, A., & Darzynkiewicz, Z.
(2005). Cytometric assessment of DNA damage in relation to cell cycle phase
and apoptosis. Cell Proliferation, 38(4), 223-243.
Huang, M., Miao, Z. H., Zhu, H., Cai, Y. J., Lu, W., & Ding, J. (2008). Chk1 and Chk2
are differentially involved in homologous recombination repair and cell cycle
arrest in response to DNA double-strand breaks induced by camptothecins.
Molecular Cancer Therapeutics, 7(6), 1440-1449.
Hung, R. W. Y., & Chow, A. W. (1997). Apoptosis: Molecular mechanisms, regulation
and role in pathogenesis. The Canadian Journal of Infectious Diseases, 8(2),
103-109.
Hunter, A. M., LaCasse, E. C., & Korneluk, R. G. (2007). The inhibitors of apoptosis
(IAPs) as cancer targets. Apoptosis, 12(9), 1543-1568.
Ito, Y., Shibata, M.-A., Kusakabe, K., & Otsuki, Y. (2006). Method of Specific
detection of apoptosis using formamide-induced DNA denaturation assay.
Journal of Histochemistry & Cytochemistry, 54(6), 683-692.
Itokawa, H., Yoshimoto, S., & Morita, H. (1988). Diterpenes from the rhizomes of
Alpinia formosana. Phytochemistry, 27(2), 435-438.
Jain, M. V., Paczulla, A. M., Klonisch, T., Dimgba, F. N., Rao, S. B., Roberg, K., . . .
Łos, M. (2013). Interconnections between apoptotic, autophagic and necrotic
pathways: implications for cancer therapy development. Journal of Cellular and
Molecular Medicine, 17(1), 12-29.
Jantan, I. B., Ahmad, A. S., Ali, N. A. M., Ahmad, A. R., & Ibrahim, H. (1999).
Chemical composition of the rhizome oils of four Curcuma species from
Malaysia. Journal of Essential Oil Research, 11(6), 719-723.
Jaremko, M., Jaremko, Ł., Kim, H.-Y., Cho, M.-K., Schwieters, C. D., Giller, K., . . .
Zweckstetter, M. (2013). Cold denaturation of a protein dimer monitored at
atomic resolution. Natural Chemical Biology, 9(4), 264-270.
Joseph, R., Joseph, T., & Jose, J. (1999). Karyotypes of 6 species of the genus Curcuma
Linn. Cytologia (Tokyo), 64(3), 313-317.
Kaewkrock, K., Wattanapiromsakul, C., & Tewtrakul, S. (2009). Nitric oxide inhibitory
substances from Curcuma mangga rhizomes. Songklanakarin Journal
of Science and Technology, 31(3), 293-297.

92
Karsono, A. H., Tandrasasmita, O. M., & Tjandrawinata, R. R. (2014). Molecular
effects of bioactive fraction of Curcuma mangga (DLBS4847) as a
downregulator of 5alpha-reductase activity pathways in prostatic epithelial cells.
Cancer Management and Reserve, 6, 267-278.
Kastan, M. B., & Bartek, J. (2004). Cell-cycle checkpoints and cancer. Nature,
432(7015), 316-323.
Keepers, Y. P., Pizao, P. E., Peters, G. J., van Ark-Otte, J., Winograd, B., & Pinedo, H.
M. (1991). Comparison of the sulforhodamine B protein and tetrazolium (MTT)
assays for in vitro chemosensitivity testing. European Journal of Cancer and
Clinical Oncology, 27(7), 897-900.
King, K. L., & Cidlowski, J. A. (1998). Cell cycle regulation and apoptosis. Annual
Review of Physiology, 60(1), 601-617.
Kirana, C., Record, I. R., McIntosh, G. H., & Jones, G. P. (2003). Screening for
antitumor activity of 11 species of Indonesian Zingiberaceae using human MCF-
7 and HT-29 cancer cells. Pharmaceutical Biology, 41(4), 271-276.
Kleinsmith, L. A. (2006). Principles of cancer biology. San Francisco, USA: Pearson
Benjamin Cummings.
Ko, H. L., & Ren, E. C. (2012). Functional Aspects of PARP1 in DNA Repair and
Transcription. Biomolecules, 2(4), 524-548.
Kong, L.-Y., Qin, M.-J., & Niwa, M. (2000). Diterpenoids from the rhizomes of Alpinia
calcarata. Journal of Natural Products, 63(7), 939-942.
Kressel, M., & Groscurth, P. (1994). Distinction of apoptotic and necrotic cell death by
in situ labelling of fragmented DNA. Cell and Tissue Research, 278(3), 549-556.
Kumari, S., Rastogi, R. P., Singh, K. L., Singh, S. P., & Sinha, R. P. (2008). DNA
damage: Detection strategies. EXCLI Journal, 7, 44-62.
Lam, M. (2003). Beating Cancer with Natural Medicine. United States of America:
Authorhouse.
Lawen, A. (2003). Apoptosis-an introduction. BioEssays: News and Reviews in
Molecular, Cellular and Developmental Biology, 25(9), 888-896.
Lee, E., Furukubo, T., Miyabe, T., Yamauchi, A., & Kariya, K. (1996). Involvement of
histone hyperacetylation in triggering DNA fragmentation of rat thymocytes
undergoing apoptosis. FEBS Letters, 395(2), 183-187.
Leong-Skornickova, J., Sida, O., Jarolimova, V., Sabu, M., Fer, T., Travnicek, P., &
Suda, J. (2007). Chromosome numbers and genome size variation in Indian
species of Curcuma (Zingiberaceae). Annals of Botany, 100(3), 505-526.
Leong-Škorničková, J., Šída, O., & Marhold, K. (2010). Back to Types! Towards
Stability of Names in Indian Curcuma L. (Zingiberaceae). Taxon, 59(1), 269-
282.

93
Li, P., Nijhawan, D., Budihardjo, I., Srinivasula, S. M., Ahmad, M., Alnemri, E. S., &
Wang, X. (1997). Cytochrome c and dATP-dependent formation of Apaf-
1/Caspase-9 complex initiates an apoptotic protease cascade. Cell, 91(4), 479-
489.
Lim, G. C. (2002). Overview of cancer in Malaysia. Japanese Journal of Clinical
Oncology (0368-2811).
Lindsay, J., Esposti, M. D., & Gilmore, A. P. (2011). Bcl-2 proteins and
mitochondria—Specificity in membrane targeting for death. Biochimica et
Biophysica Acta (BBA) - Molecular Cell Research, 1813(4), 532-539.
Liu, Y., & Nair, M. (2012). Curcuma longa and Curcuma mangga leaves exhibit
functional food property. Food Chemistry, 135(2), 634-640.
Liu, Y., & Nair, M. G. (2011). Labdane diterpenes in Curcuma mangga rhizomes
inhibit lipid peroxidation, cyclooxygenase enzymes and human tumour cell
proliferation. Food Chemistry, 124(2), 527-532.
Loo, D. T. (2002). TUNEL Assay. In V. V. Didenko (Ed.), In situ detection of DNA
damage: Methods and protocols (pp. 21-30). Totowa, NJ: Humana Press.
Los, M., Mozoluk, M., Ferrari, D., Stepczynska, A., Stroh, C. & Schulze-Osthoff, K.
(2002). Activation and caspase-mediated inhibition of PARP: A molecular
switch between fibroblast necrosis and apoptosis in death receptor signaling.
Molecular Biology of the Cell, 13(3), 978-988.
Mack, T. M. (2004). Cancers in the urban environment. London, England: Elsevier
Academic Press.
Maiese, K., Chong, Z. Z., Shang, Y. C., & Wang, S. (2012). Targeting disease through
novel pathways of apoptosis and autophagy. Expert Opinion on Therapeutic
Targets, 16(12), 1203-1214.
Malek, S. N. A., Lee, G. S., Hong, S. L., Yaacob, H., Wahab, N. A., Faizal Weber, J.-F.,
& Shah, S. A. A. (2011). Phytochemical and cytotoxic investigations of
Curcuma mangga rhizomes. Molecules, 16(6), 4539-4548.
Marchetti, C., Clericuzio, M., Borghesi, B., Cornara, L., Ribulla, S., Gosetti, F. &
Burlando, B. (2015). Oleuropein-enriched olive leaf extract affects calcium
dynamics and impairs viability of malignant mesothelioma cells. Evidence-
Based Complementary and Alternative Medicine, 2015-9.
Martinez, M. M., Reif, R. D., & Pappas, D. (2010). Detection of apoptosis: A review of
conventional and novel techniques. Analytical Methods, 2(8), 996-1004.
Molinari, M. (2000). Cell cycle checkpoints and their inactivation in human cancer. Cell
Proliferation, 33(5), 261-274.

94
Munoz-Alonso, M. J., Acosta, J. C., Richard, C., Delgado, M. D., Sedivy, J., & Leon, J.
(2005). p21Cip1 and p27Kip1 induce distinct cell cycle effects and
differentiation programs in myeloid leukemia cells. Journal of Biological
Chemistry, 280(18), 18120-18129.
Nakamura, S., Okazaki, Y., Ninomiya, K., Morikawa, T., Matsuda, H., & Yoshikawa,
M. (2008). Medicinal flowers. XXIV. Chemical structures and hepatoprotective
effects of constituents from flowers of Hedychium coronarium. Chemical and
Pharmaceutical Bulletin, 56(12), 1704-1709.
Novak, B., & Tyson, J. J. (2003). Modelling the controls of the eukaryotic cell cycle.
Biochemical Society Transactions, 31(Pt 6), 1526-1529.
Nunez, R. (2001). DNA measurement and cell cycle analysis by flow cytometry.
Current Issues in Molecular Biology, 3(1467-3037), 67-70.
Ola, M. S., Nawaz, M., & Ahsan, H. (2011a). Role of Bcl-2 family proteins and
caspases in the regulation of apoptosis. Molecular and Cellular Biochemistry,
351(1-2), 41-58.
Ola, M. S., Nawaz, M., & Ahsan, H. (2011b). Role of bcl-2 family proteins and
caspases in the regulation of apoptosis. Molecular and Cellular Biochemistry,
351(1), 41-58.
Ouyang, L., Shi, Z., Zhao, S., Wang, F. T., Zhou, T. T., Liu, B., & Bao, J. K. (2012a).
Programmed cell death pathways in cancer: a review of apoptosis, autophagy
and programmed necrosis. Cell Proliferation, 45(6), 487-498.
Ouyang, L., Shi, Z., Zhao, S., Wang, F. T., Zhou, T. T., Liu, B., & Bao, J. K. (2012b).
Programmed cell death pathways in cancer: a review of apoptosis, autophagy
and programmed necrosis. Cell Proliferation., 45(6), 487-498.
Papazisis, K. T., Geromichalos, G. D., Dimitriadis, K. A., & Kortsaris, A. H. (1997).
Optimization of the sulforhodamine B colorimetric assay. Journal of
Immunological Methods, 208(2), 151-158.
Pardee, A. B. (2002). Regulation of cell cycle. In M. Alison (Ed.), The cancer handbook
(Vol. 1, pp. 13-24). London, UK: Nature.
Pietenpol, J. A., & Stewart, Z. A. (2002). Cell cycle checkpoint signaling: Cell cycle
arrest versus apoptosis. Toxicology, 181-182, 475-481.
Portugal, J., Bataller, M., & Mansilla, S. (2009). Cell death pathways in response to
antitumor therapy. Tumori, 95(4), 409-421.
Pozarowski, P., & Darzynkiewicz, Z. (2004). Analysis of cell cycle by flow cytometry
Checkpoint Controls and Cancer (Vol. 281, pp. 301-311).
Prakash, O., Kumar, A., Kumar, P., & Ajeet, A. (2013). Anticancer potential of plants
and natural products: A review. American Journal of Pharmacological Sciences,
1(6), 104-115.

95
Prana, M., S., Sastrapradja, S., Hawkes, J. G., & Lubis, I. (1978). A cytological study of
some Indonesian Curcuma species. Journal of Root Crops, 4, 31-35.
Proskuryakov, S. Y. a., Konoplyannikov, A. G., & Gabai, V. L. (2003). Necrosis: A
specific form of programmed cell death? Experimental Cell Research, 283(1), 1-
16.
Rabinovitch, P. (1993). Introduction to cell cycle analysis. San Diego, USA: Phoenix
Flow Systems, Inc.
Rasoanaivo, P., Wright, C. W., Willcox, M. L., & Gilbert, B. (2011). Whole plant
extracts versus single compounds for the treatment of malaria: Synergy and
positive interactions. Malaria Journal, 10(Suppl 1), S4-S4.
Rastogi, R. P., & Sinha, R. P. (2010). Apoptosis: Molecular mechanisms and
pathogenicity. EXCLI Journal, 8, 155-181.
Ravindran, P. N. (2007). Turmeric, At the golden spice of life. In P. N. Ravindran, K. N.
Babu & K. Sivaraman (Eds.), Turmeric: The genus Curcuma (pp. 1-13). Florida,
USA: CRC Press.
Reed, J. C. (2002). Apoptosis. In M. Alison (Ed.), The cancer handbook (Vol. 1, pp.
119-134). London, UK: Nature.
Riedl, S. J., & Shi, Y. (2004). Molecular mechanisms of caspase regulation during
apoptosis. Nature Reviews Molecular Cell Biology, 5(11), 897-907.
Rodrigue-Gervais, Ian G., Labbé, K., Dagenais, M., Dupaul-Chicoine, J., Champagne,
C., Morizot, A. & Saleh, M. (2014). Cellular inhibitor of apoptosis protein
cIAP2 protects against pulmonary tissue necrosis during influenza virus
infection to promote host Survival. Cell Host & Microbe, 15(1), 23-35.
S. Sharma, S., & K. Gupta, Y. (1998). Reversal of cisplatin-induced delay in gastric
emptying in rats by ginger (Zingiber officinale). Journal of Ethnopharmacology,
62(1), 49-55.
Saraste, A., & Pulkki, K. (2000). Morphologic and biochemical hallmarks of apoptosis.
Cardiovascular Research, 45(3), 528-537.
Schulze-Osthoff, K. (2008). Introduction. In H. S. Rode (Ed.), Apoptosis, ctyotoxicity
and cell proliferation (Vol. 4, pp. 2-16). Mannheim, Germany: Roshe
Diagnostics GmbH.
Schwartz, J. L. (2002). Physical causes of cancer. In M. Alison (Ed.), The cancer
handbook (Vol. 1, pp. 307-315). London, UK: Nature.
Shackelford, R. E., Kaufmann, W. K., & Paules, R. S. (1999). Cell cycle control,
checkpoint mechanisms, and genotoxic stress. Environmental Health
Perspectives, 107(Suppl 1), 5-24.
Sharma, S. S., Kochupillai, V., Gupta, S. K., Seth, S. D., & Gupta, Y. K. (1997).
Antiemetic efficacy of ginger (Zingiber officinale) against cisplatin-induced
emesis in dogs. Journal of Ethnopharmacology, 57(2), 93-96.

96
Sirisawad, T., Sirirugsa, P., & Suwanthada, C. (2003). Investigation of chromosome
numbers in 20 taxa of Curcuma. Proceedings of the 3rd Symposium on the
family Zingiberaceae, Khon Kaen, Thailand. Applied Taxonomic Research
Centre, Khon Kaen University.
Sisimindari, S., Sudibyo, R. S., & Astuti, E. (2004). Cytotoxic effects of protein fraction
isolated from Curcuma mangga Val rhizomes and containing ribosome-
inactivating proteins on cancer cell-lines and normal cell. Indonesian Journal of
Chemistry, 4(3), 206-211.
Skehan, P., Storeng, R., Scudiero, D., Monks, A., McMahon, J., Vistica, D., Warren, J.
Bokesch, H., Kenney, S., & Boyd, M. R. (1990). New colorimetric cytotoxicity
assay for anticancer-drug screening. Journal of the National Cancer Institute,
82(13), 1107-1112.
Skornickova, J., & Sabu, M. (2005). The recircumscription of Curcuma L. to include
the genus Paracautleya R.M.Sm. Gard. Bull. Singapore, 57.
Stacey, D. W. (2003). Cyclin D1 serves as a cell cycle regulatory switch in actively
proliferating cells. Current Opinion in Cell Biology, 15(2), 158-163.
Sugimura, T., Wakabayshi, K., & Nagao, M. (2002). Dietary genotoxins and cancer. In
M. Alison (Ed.), The cancer handbook (Vol. 1, pp. 388-397). London, UK:
Nature.
Taatjes, D. J., Sobel, B. E., & Budd, R. C. (2008). Morphological and cytochemical
determination of cell death by apoptosis. Histochemistry and Cell Biology,
129(1), 33-43.
Tamm, I., Schriever, F., & Dörken, B. (2001). Apoptosis: Implications of basic research
for clinical oncology. The Lancet Oncology, 2(1), 33-42.
Tewtrakul, S., & Subhadhirasakul, S. (2008). Effects of compounds from Kaempferia
parviflora on nitric oxide, prostaglandin E2 and tumor necrosis factor-alpha
productions in RAW264.7 macrophage cells. Journal of Ethnopharmacology,
120(1), 81-84.
Tian, R.-H., Zhang, G.-Y., Yan, C.-H., & Dai, Y.-R. (2000). Involvement of poly(ADP-
ribose) polymerase and activation of caspase-3-like protease in heat shock-
induced apoptosis in tobacco suspension cells. FEBS Letters, 474(1), 11-15.
Vainio, H., Fletcher, T., & Boffetta, P. (2002). Occupational cause of cancer. In M.
Alison (Ed.), The cancer handbook (Vol. 1, pp. 413-419). London, UK: Nature.
van Engeland, M., Kuijpers, H. J., Ramaekers, F. C., Reutelingsperger, C. P., & Schutte,
B. (1997). Plasma membrane alterations and cytoskeletal changes in apoptosis.
Experimental Cell Research, 235(2), 421-430.
van Engeland, M., Nieland, L. J., Ramaekers, F. C., Schutte, B., & Reutelingsperger, C.
P. (1998). Annexin V-affinity assay: A review on an apoptosis detection system
based on phosphatidylserine exposure. Cytometry, 31(1), 1-9.

97
Vermeulen, K., Van Bockstaele, D. R., & Berneman, Z. N. (2003). The cell cycle: A
review of regulation, deregulation and therapeutic targets in cancer. Cell
Proliferation, 36(3), 131-149.
Vichai, V., & Kirtikara, K. (2006). Sulforhodamine B colorimetric assay for
cytotoxicity screening. Nature Protocols, 1(3), 1112-1116.
Voigt, W. (2005). Sulforhodamine B assay and chemosensitivity. In R. D. Blumenthal
(Ed.), Chemosensitivity: Volume 1 In Vitro Assays (pp. 39-48). Totowa, NJ:
Humana Press.
Wahab, I. R. A., Blagojević, P. D., Radulović, N. S., & Boylan, F. (2011). Volatiles of
Curcuma mangga Val. & Zijp (Zingiberaceae) from Malaysia. Chemistry &
Biodiversity, 8(11), 2005-2014.
Wei, Y., Fan, T., & Yu, M. (2008). Inhibitor of apoptosis proteins and apoptosis. Acta
Biochimica et Biophysica Sinica, 40(4), 278-288.
Weinberg, R. (2013). The Biology of Cancer, Second Edition: Taylor & Francis Group.
Weyermann, J., Lochmann, D., & Zimmer, A. (2005). A practical note on the use of
cytotoxicity assays. International Journal of Pharmaceutics, 288(2), 369-376.
Widowati, W., Mozef, T., Risdian, C., Ratnawati, H., Tjahjani, S., & Sandra, F. (2011).
The comparison of antioxidative and proliferation inhibitor properties of Piper
betle L., Catharanthus roseus [L] G.Don, Dendrophtoe petandra L., Curcuma
mangga Val. extracts on T47D cancer cell line. International Research Journal
of Biochemistry and Bioinformatics, 1(2), 22-28.
Widowati, W., Mozef, T., Risdian, C., & Y, Y. (2013). Anticancer and free radical
scavenging potency of Catharanthus roseus, Dendrophthoe petandra, Piper
betle and Curcuma mangga extracts in breast cancer cell lines. Oxidants and
Antioxidants in Medical Science, 2(2), 137-142.
Wlodkowic, D., Telford, W., Skommer, J., & Darzynkiewicz, Z. (2011). Apoptosis and
beyond: Cytometry in studies of programmed cell death. Methods in Cell
Biology, 103, 55-98.
Wong, K. C., Chong, T. C., & Chee, S. G. (1999). Essential oil of Curcuma mangga
Val. and Van Zijp rhizomes. Journal of Essential Oil Research, 11(3), 349-351.
Wong, R. (2011). Apoptosis in cancer: from pathogenesis to treatment. Journal of
Experimental & Clinical Cancer Research, 30(1), 87.
Wu, M., Ding, H.-F., & Fisher, D. E. (2001). Apoptosis: Molecular mechanisms eLS
(pp. 1-8): John Wiley & Sons, Ltd.
Wyllie, A. H. (1980). Glucocorticoid-induced thymocyte apoptosis is associated with
endogenous endonuclease activation. Nature, 284(5756), 555-556.
Xu, H.-X., Hui, D., & Sim, K. Y. (1995). The isolation of a new labdane diterpene from
the seeds of Alpinia zerumbet. Natural Product Letters, 7(1), 29-34.

98
Xu, J., Ji, F., Kang, J., Wang, H., Li, S., Jin, D., Zhang, Q, Sun, H., & Guo, Y. (2015).
Absolute configurations and NO inhibitory activities of terpenoids from
Curcuma longa. Journal of Agricultural and Food Chemistry, 63(24), 5805-
5812.
Zanariah, J., Noor, R., & Rosnah, O. (1997). Nutritional composition of common
Zingiberaceae species used in traditional medicines and cooking. Journal of
Tropical Agriculture and Food Science, 25(2), 225-229.
Zeestraten, E. C. M., Benard, A., Reimers, M. S., Schouten, P. C., Liefers, G. J., van de
Velde, C. J. H., & Kuppen, P. J. K. (2013). The prognostic value of the
apoptosis pathway in colorectal cancer: A review of the literature on biomarkers
identified by immunohistochemistry. Biomarkers in Cancer, 5, 13-29.

99
PUBLICATION AND PAPER PRESENTED
Publication
1. Hong, G. W., Hong, S. L., Lee, G. S., Yaacob, H., & Malek, S. N. A. (2015). Non-
aqueous extracts of Curcuma mangga rhizomes induced cell death in human
colorectal adenocarcinoma cell line (HT29) via induction of apoptosis and cell cycle
arrest at G0/G1 phase. Asian Pacific Journal of Tropical Medicine, 9(1), 8-18.
Paper presented
Hong, G. W., (2014) Anti-proliferation and acute toxicity studies of Curcuma mangga
rhizomes. Paper presented at the Conference on Natural Products for Health and Beauty,
Phuket, Thailand.

100

10
1
Appendix 1: The 1H NMR spectral of longpene A
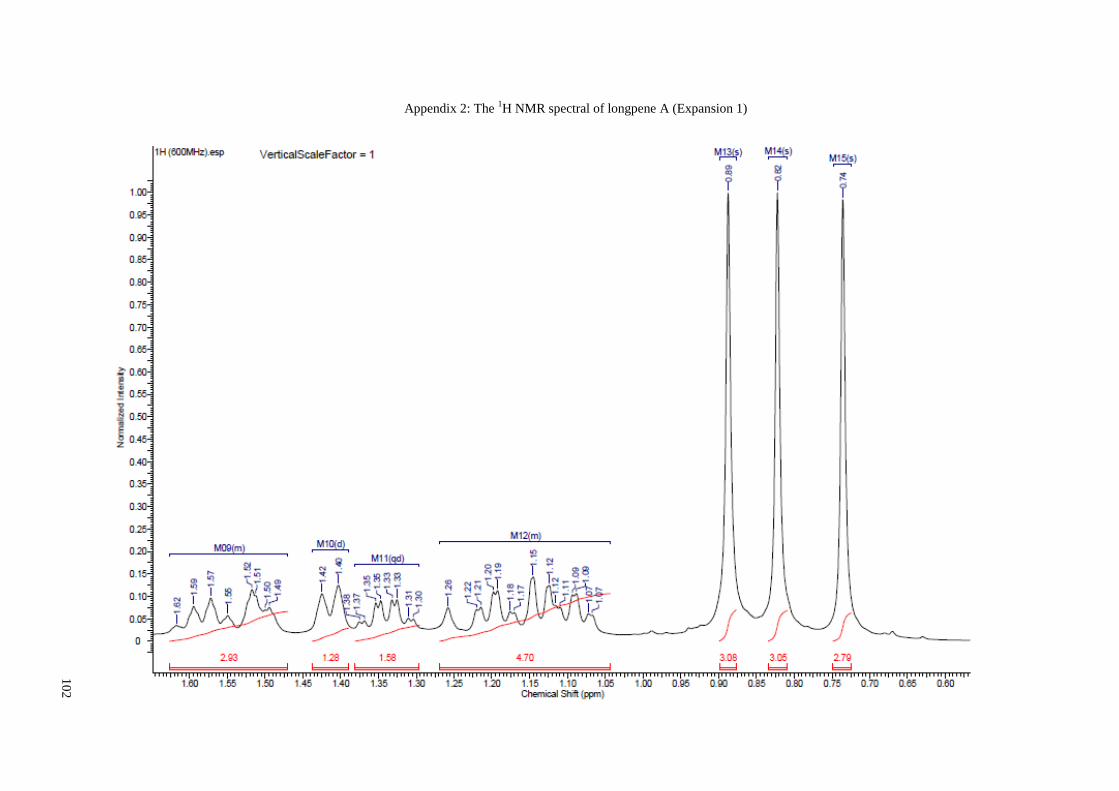
10
2
Appendix 2: The 1H NMR spectral of longpene A (Expansion 1)
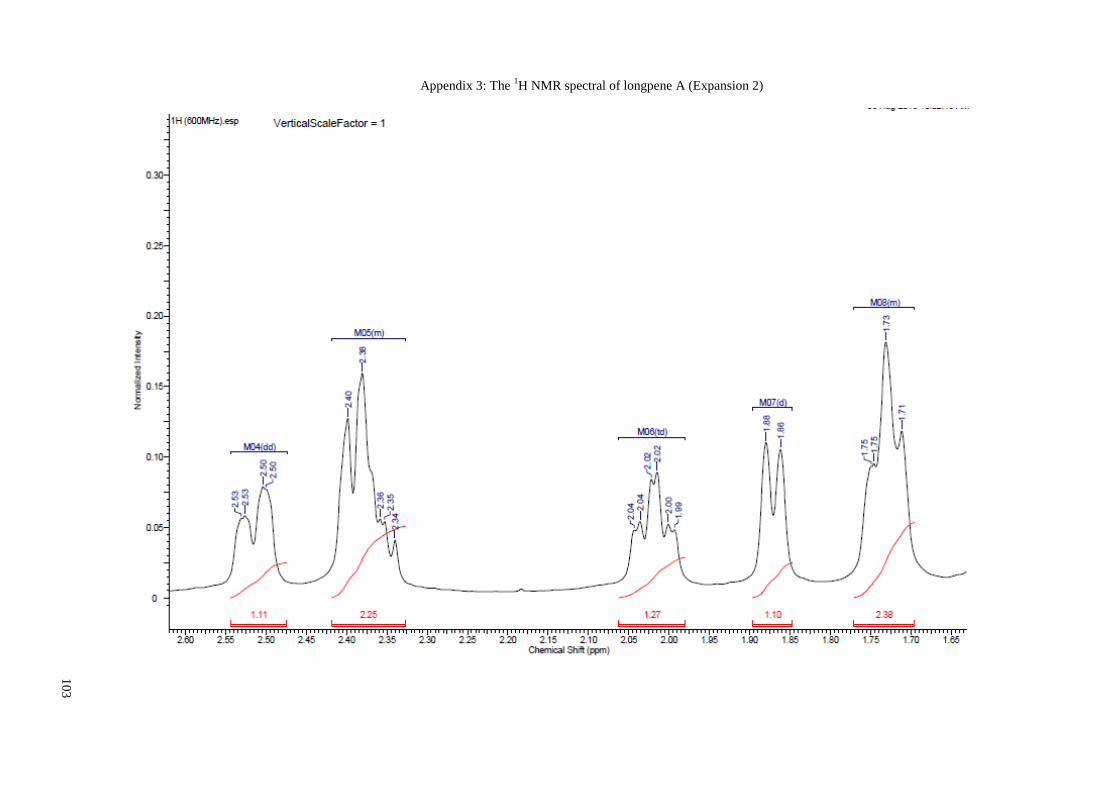
10
3
Appendix 3: The 1H NMR spectral of longpene A (Expansion 2)

10
4
Appendix 4: The
1H NMR spectral of longpene A (Expansion 3)
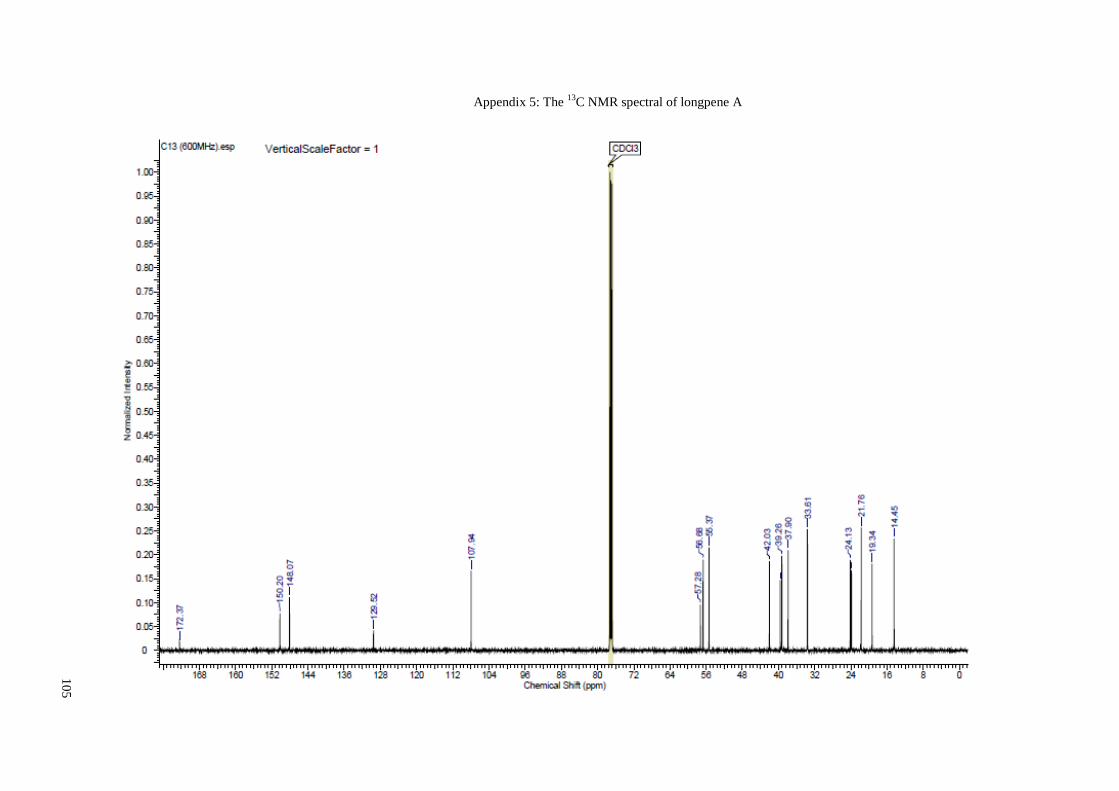
10
5
Appendix 5: The
13C NMR spectral of longpene A

10
6
Appendix 6: The
13C NMR spectral of longpene A (Expansion1)

10
7
Appendix 7: The DEPTQ NMR spectral of longpene A
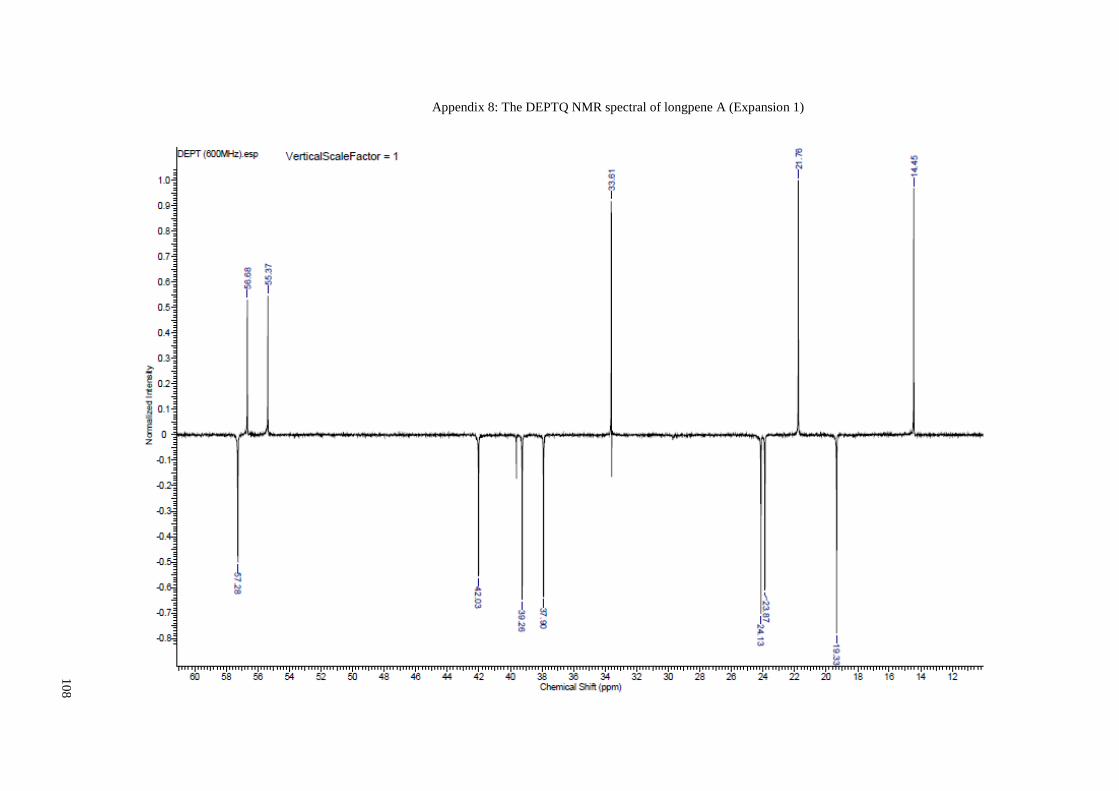
10
8
Appendix 8: The DEPTQ NMR spectral of longpene A (Expansion 1)
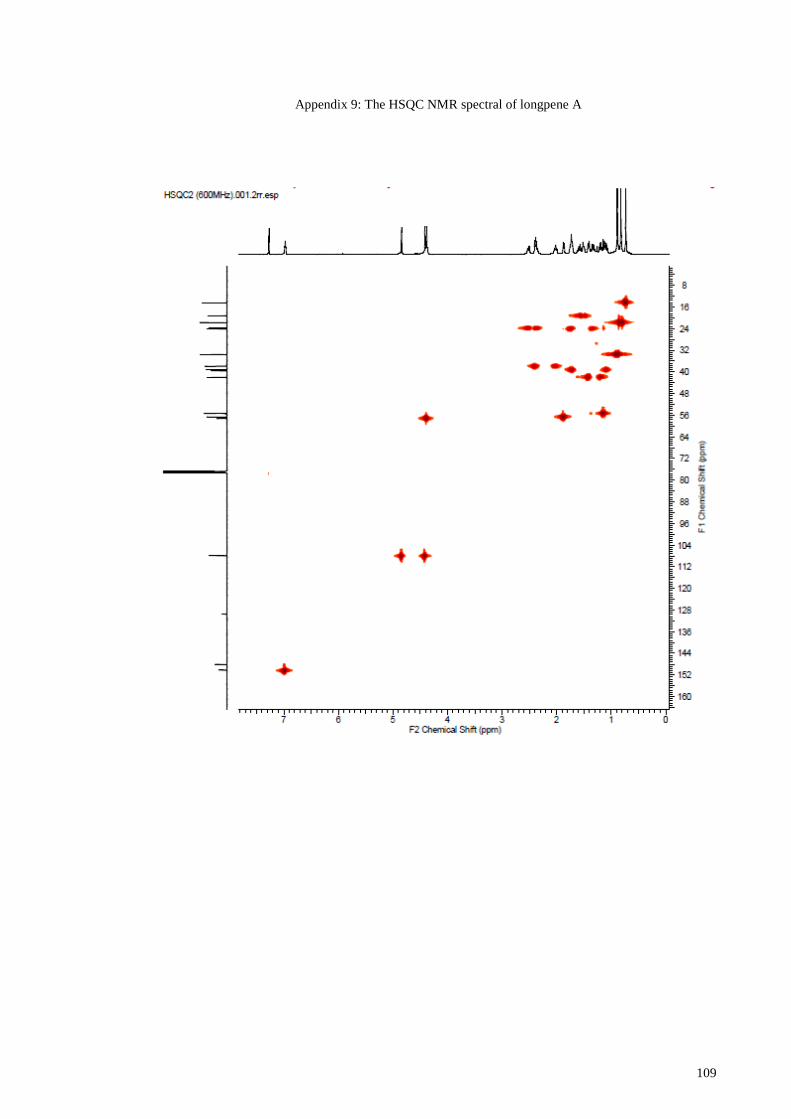
109
Appendix 9: The HSQC NMR spectral of longpene A
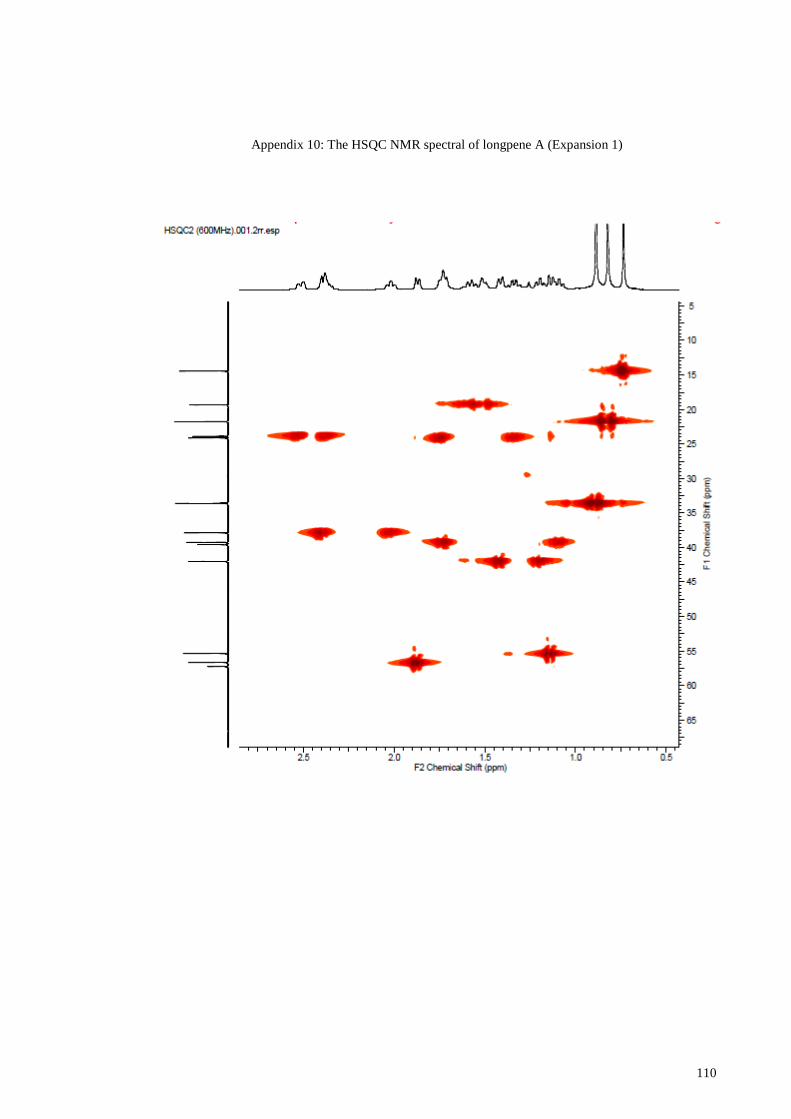
110
Appendix 10: The HSQC NMR spectral of longpene A (Expansion 1)

111
Appendix 11: The HMBC NMR spectral of longpene A
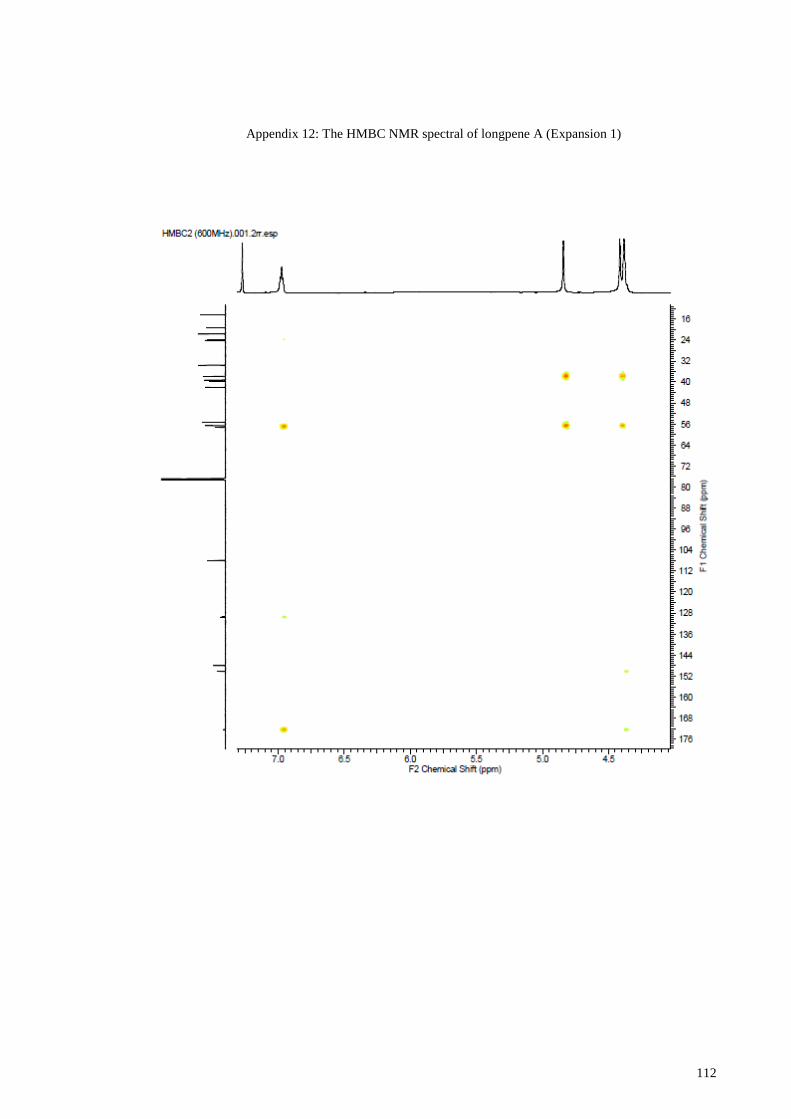
112
Appendix 12: The HMBC NMR spectral of longpene A (Expansion 1)
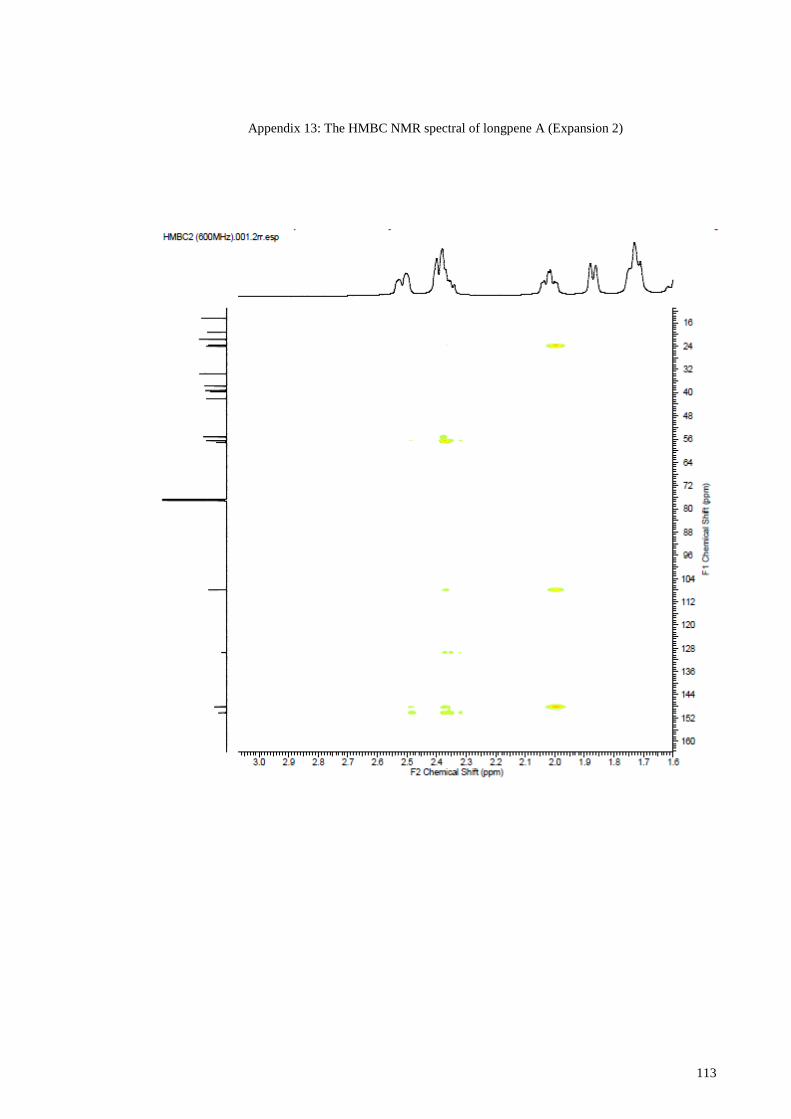
113
Appendix 13: The HMBC NMR spectral of longpene A (Expansion 2)
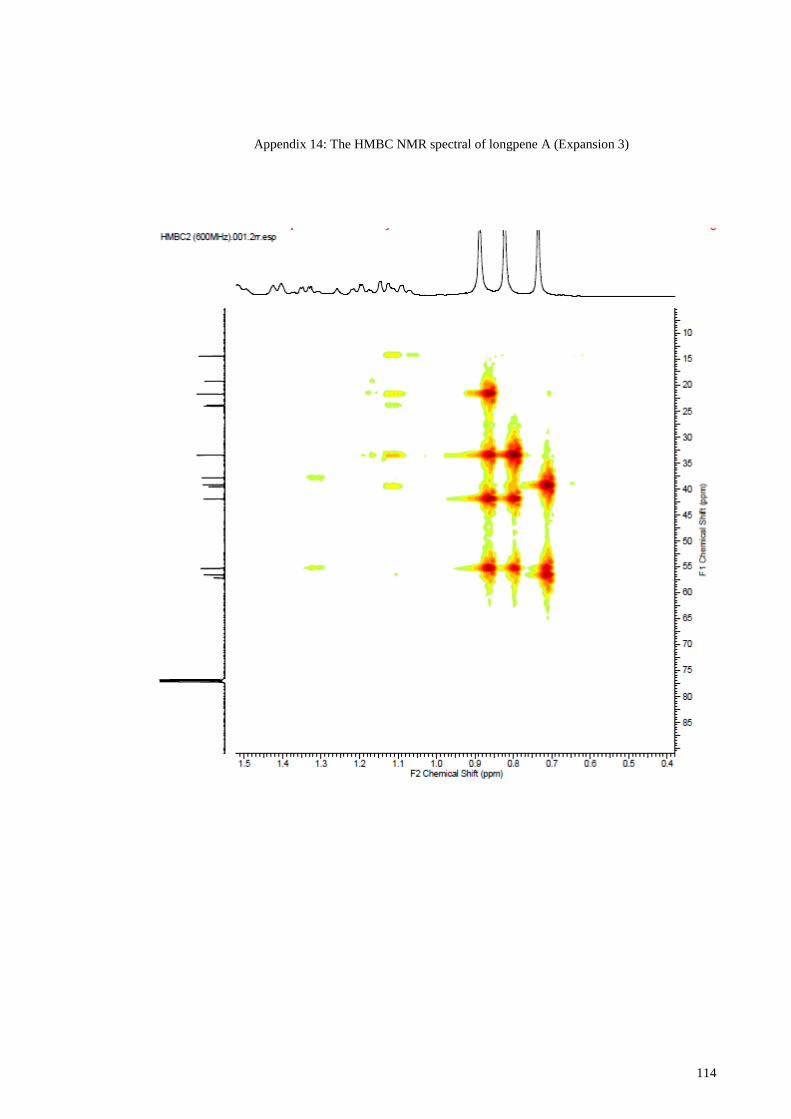
114
Appendix 14: The HMBC NMR spectral of longpene A (Expansion 3)
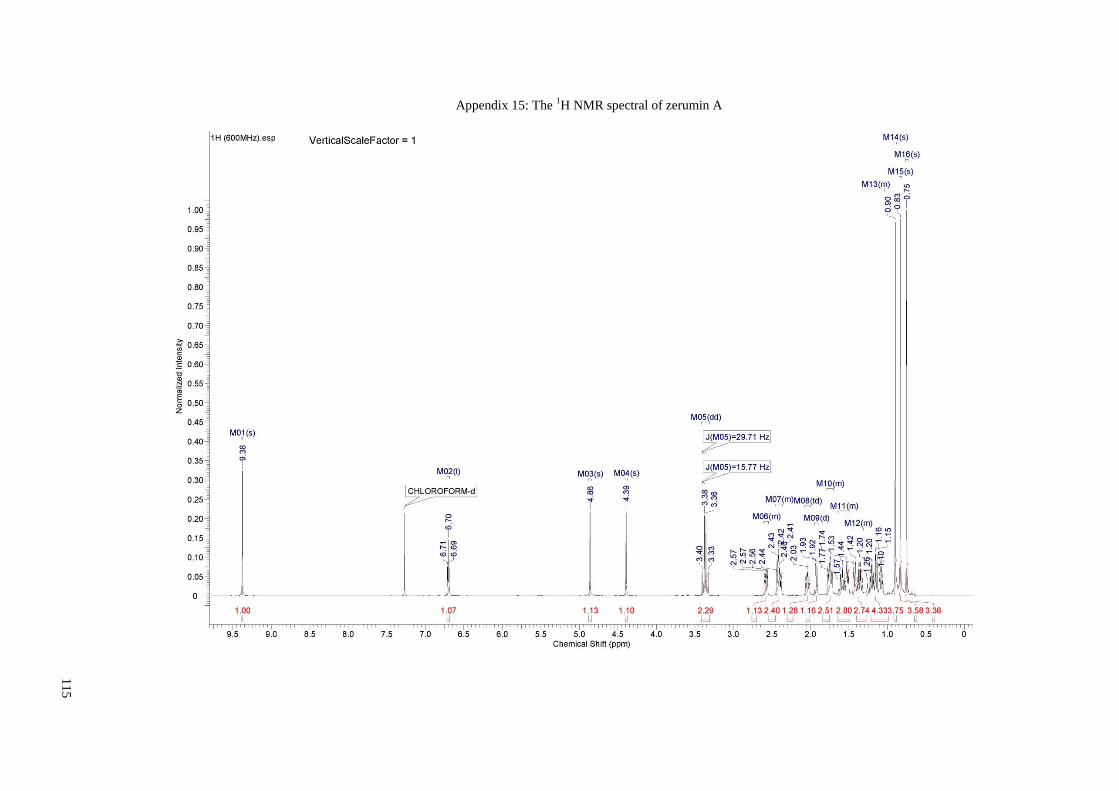
11
5
Appendix 15: The 1H NMR spectral of zerumin A

11
6
Appendix 16: The
1H NMR spectral of zerumin A (Expansion 1)
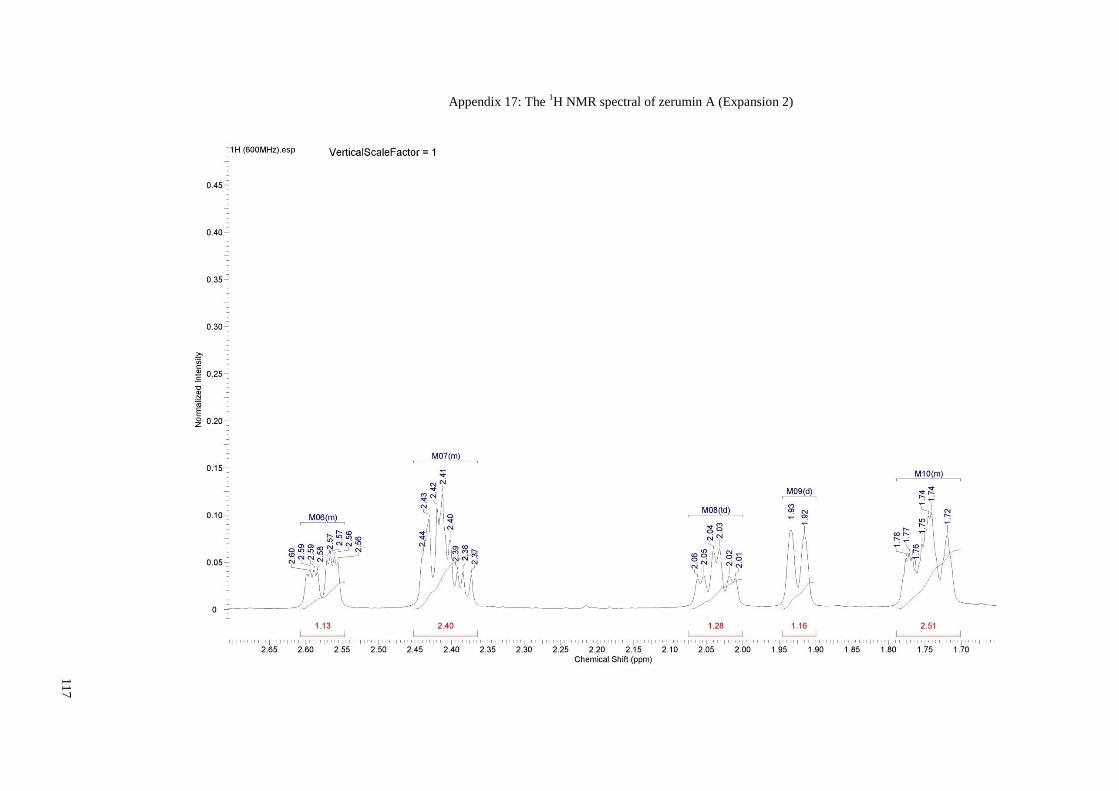
11
7
Appendix 17: The
1H NMR spectral of zerumin A (Expansion 2)
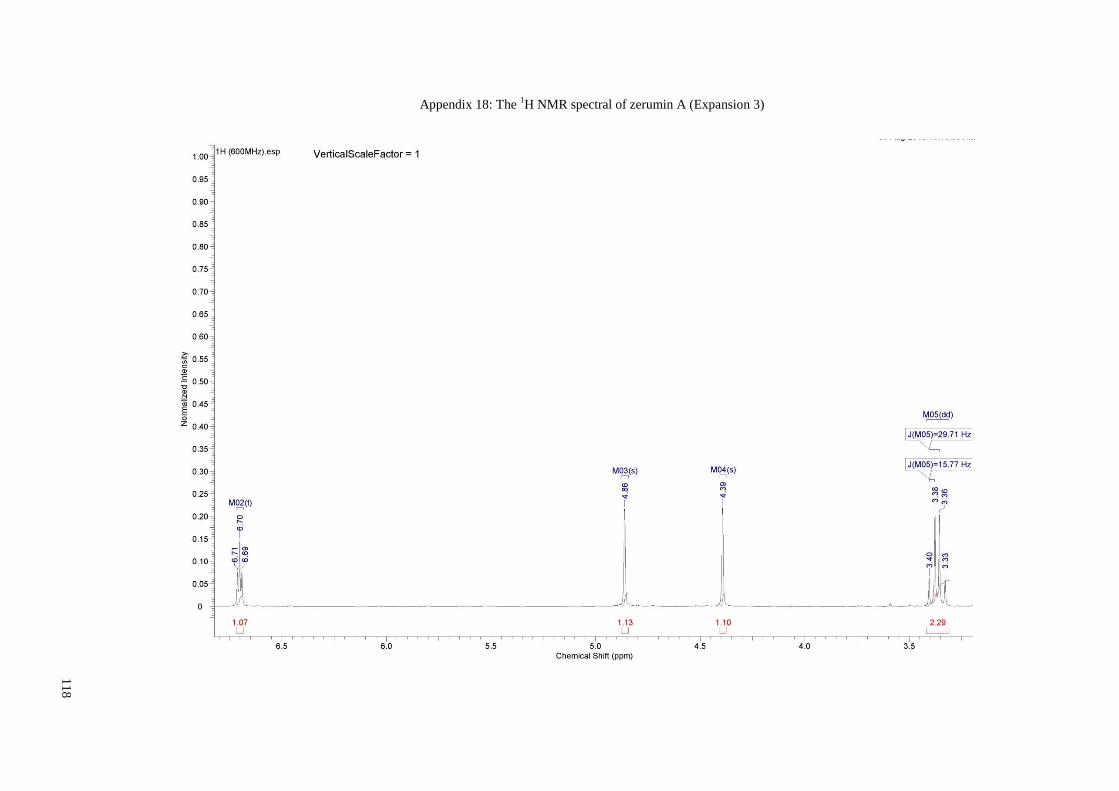
11
8
Appendix 18: The 1H NMR spectral of zerumin A (Expansion 3)
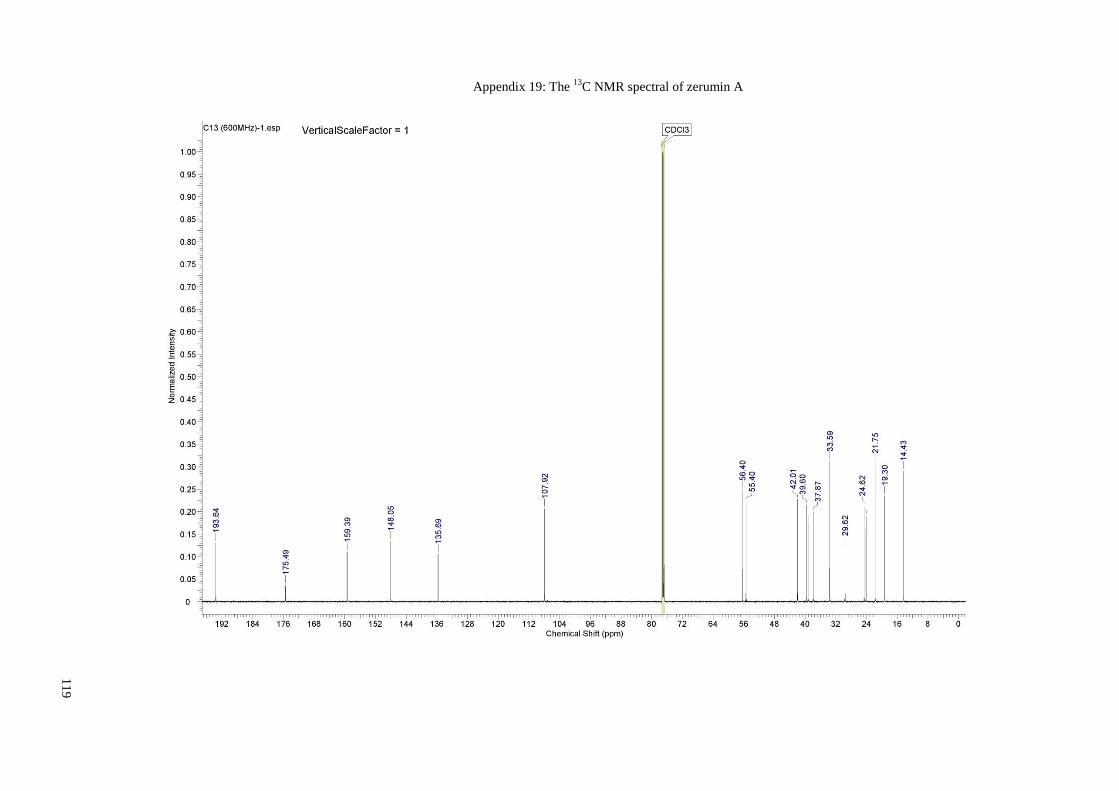
11
9
Appendix 19: The 13
C NMR spectral of zerumin A

12
0
Appendix 20: The 13
C NMR spectral of zerumin A (Expansion 1)
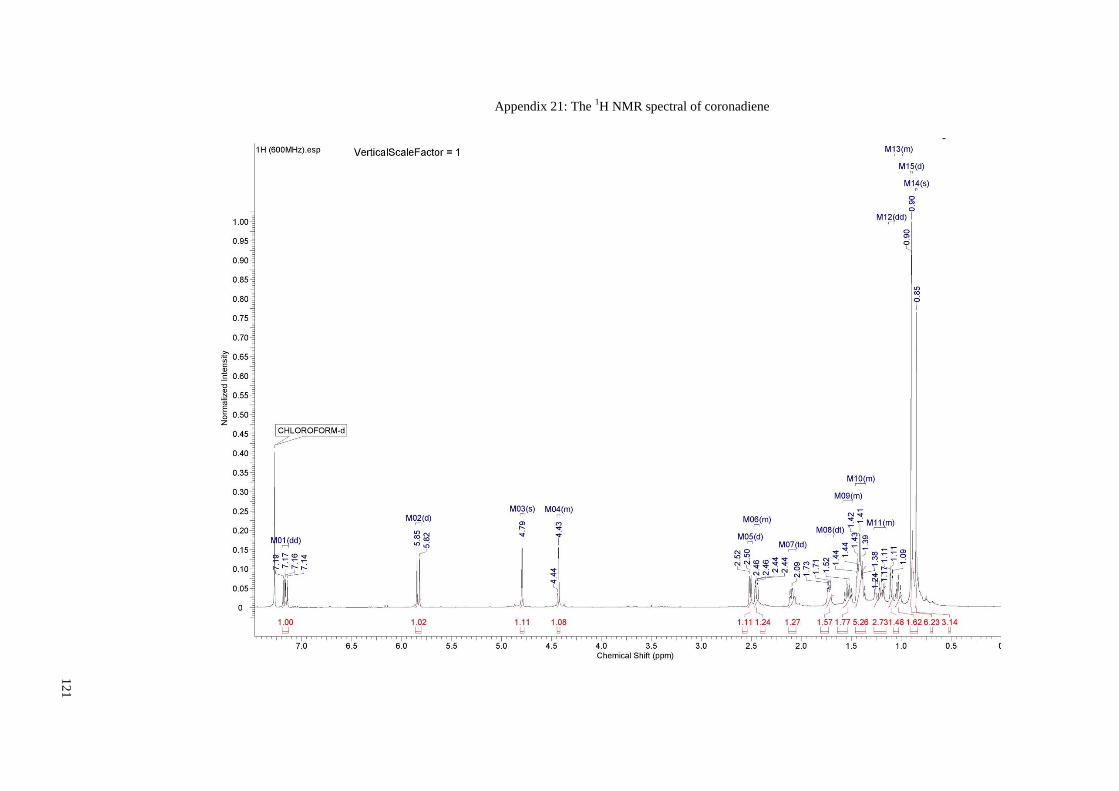
12
1
Appendix 21: The 1H NMR spectral of coronadiene

12
2
Appendix 22: The
1H NMR spectral of coronadiene (Expansion 1)

12
3
Appendix 23: The 1H NMR spectral of coronadiene (Expansion 2)

12
4
Appendix 24: The
1H NMR spectral of coronadiene (Expansion 3)

12
5
Appendix 25: The
13C NMR spectral of coronadiene
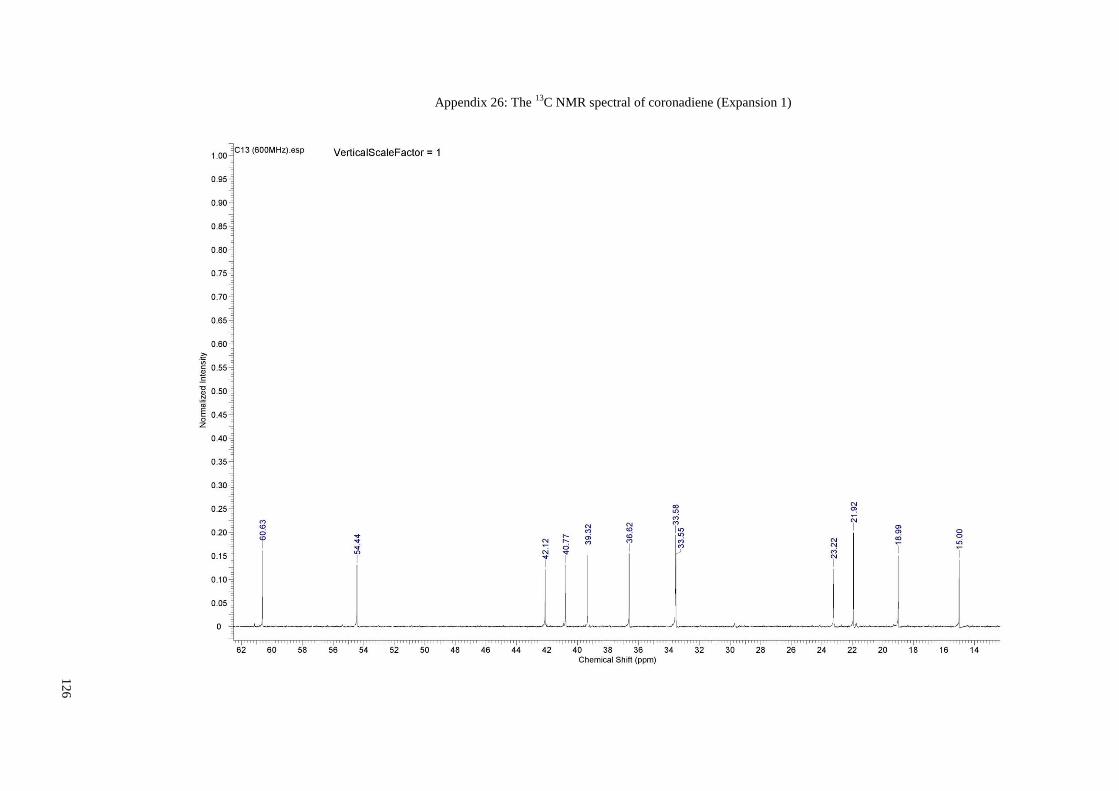
12
6
Appendix 26: The
13C NMR spectral of coronadiene (Expansion 1)

12
7
Appendix 27: The 1H NMR spectral of (E)-labda-8(17),12-diene-15,16-dial
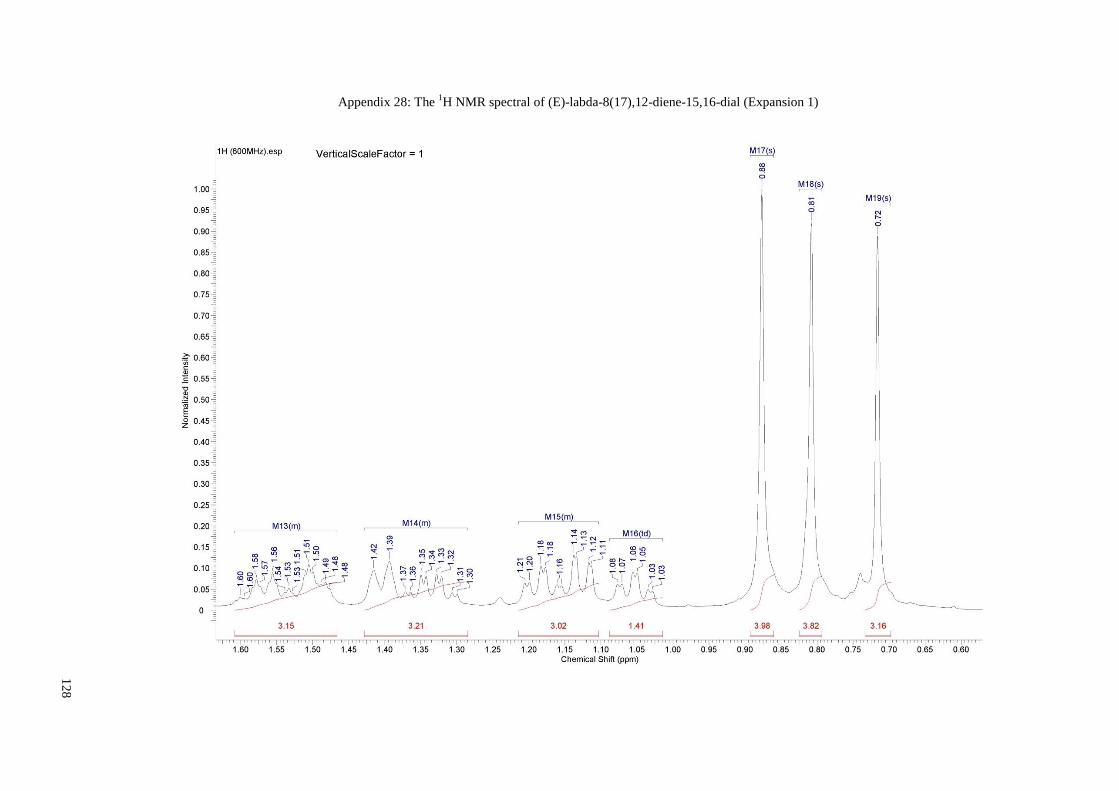
12
8
Appendix 28: The
1H NMR spectral of (E)-labda-8(17),12-diene-15,16-dial (Expansion 1)

12
9
Appendix 29: The
1H NMR spectral of (E)-labda-8(17),12-diene-15,16-dial (Expansion 2)
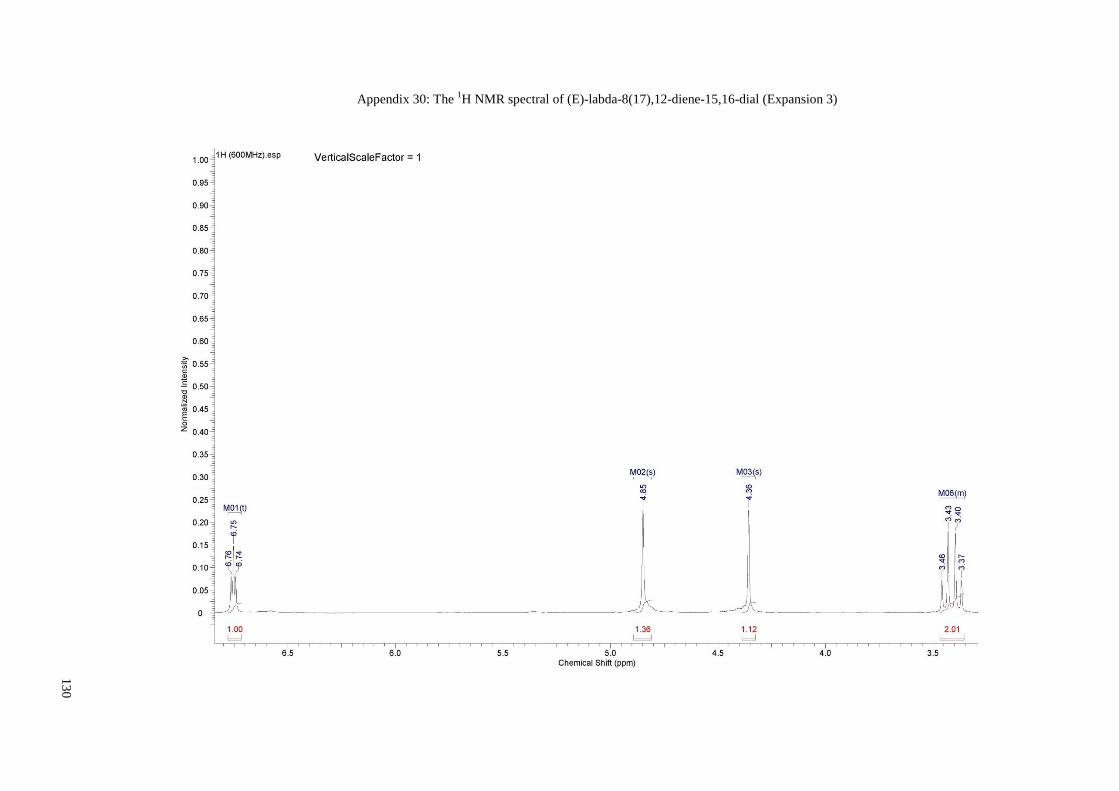
13
0
Appendix 30: The
1H NMR spectral of (E)-labda-8(17),12-diene-15,16-dial (Expansion 3)

13
1
Appendix 31: The 13
C NMR spectral of (E)-labda-8(17),12-diene-15,16-dial

13
2
Appendix 32: The 13
C NMR spectral of (E)-labda-8(17),12-diene-15,16-dial (Expansion 1)

133
Appendix 33: The mass spectral of longpene A
Appendix 34: The mass spectral of zerumin A

134
Appendix 35: The mass spectral of coronadiene
Appendix 36: The mass spectral of (E)-labda-8(17),12-diene-15,16-dial
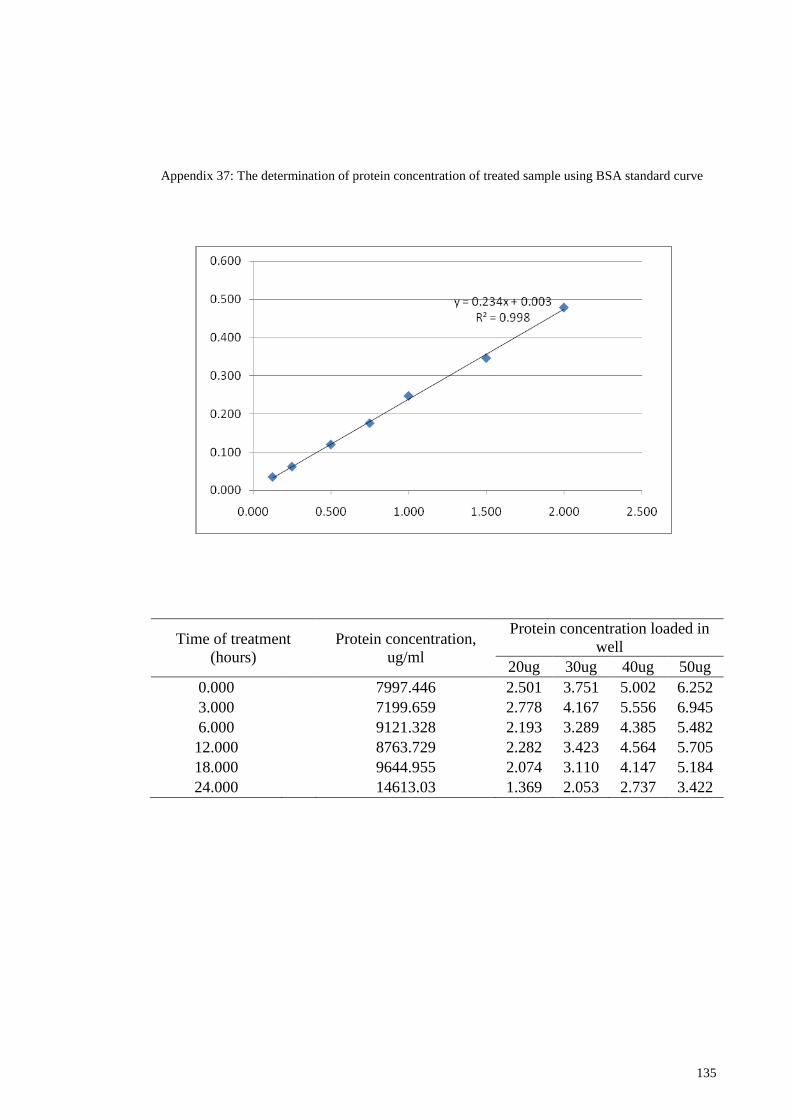
135
Time of treatment
(hours)
Protein concentration,
ug/ml
Protein concentration loaded in
well
20ug 30ug 40ug 50ug
0.000
7997.446 2.501 3.751 5.002 6.252
3.000
7199.659 2.778 4.167 5.556 6.945
6.000
9121.328 2.193 3.289 4.385 5.482
12.000
8763.729 2.282 3.423 4.564 5.705
18.000
9644.955 2.074 3.110 4.147 5.184
24.000
14613.03 1.369 2.053 2.737 3.422
Appendix 37: The determination of protein concentration of treated sample using BSA standard curve