APM Automation Solutions Ltd. ROI (Payback) Model Eyal Cohen APM Annual International Partners...
29
APM Automation Solutions Ltd. APM Automation Solutions Ltd. ROI (Payback) Model Eyal Cohen APM Annual International Partners Conference May 4, 2011
-
Upload
leona-armstrong -
Category
Documents
-
view
216 -
download
0
Transcript of APM Automation Solutions Ltd. ROI (Payback) Model Eyal Cohen APM Annual International Partners...

APM Automation Solutions Ltd.APM Automation Solutions Ltd.
ROI (Payback) Model
Eyal CohenAPM Annual International Partners
ConferenceMay 4, 2011
What is the key competitive advantage of APM scanners?
APM International Partners Meeting 2May 2011

Key Competitive Advantage of APM Scanners
Accurate Inventory Measurement
APM International Partners Meeting 3May 2011
WHY IT IS IMPORTANT TO IMPROVE INVENTORY MEASUREMENT ACCURACY ?
May 2011 APM International Partners Meeting 4

APM International Partners Meeting 5
Improving Inventory Measurement Accuracy
Substantial Cost Savings Across the Supply-Chain
May 2011
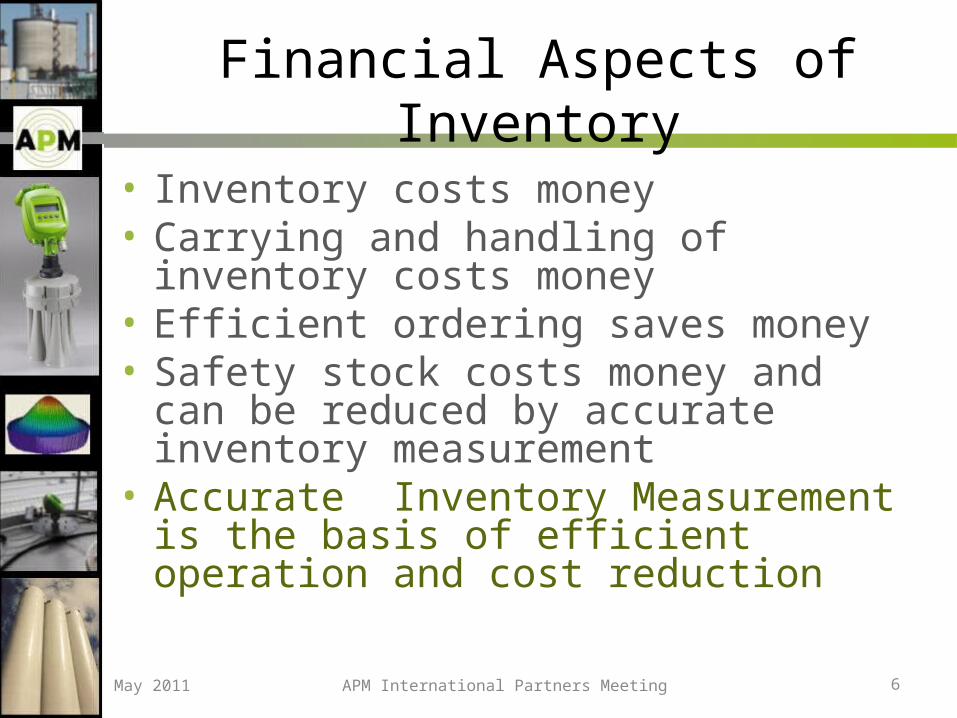
Financial Aspects of Inventory
• Inventory costs money• Carrying and handling of inventory costs
money• Efficient ordering saves money• Safety stock costs money and can be
reduced by accurate inventory measurement
• Accurate Inventory Measurement is the basis of efficient operation and cost reduction
May 2011 APM International Partners Meeting 6

Negative Effects of Inaccurate Inventory Measurement
• High safety stock levels
• Non-optimal utilization of storage capacity
• Excess ordering
• Excess delivery costs
APM International Partners Meeting 7May 2011

What is Inventory Carrying Cost?
APM International Partners Meeting 8May 2011

What Makes Up Inventory Carrying Costs?
• Inventory carrying costs are made up of the following . . . .
May 2011 APM International Partners Meeting 9

What Makes Up Inventory Carrying Costs? (2)
• Capital costs include the investment in inventory . . . .
May 2011 APM International Partners Meeting 10

What Makes Up Inventory Carrying Costs? (3)
• Inventory service costs include insurance, physical handling, and taxes
May 2011 APM International Partners Meeting 11

What Makes Up Inventory Carrying Costs? (4)
• Storage space costs include public, plant, rented, and company owned warehouses
May 2011 APM International Partners Meeting 12

What Makes Up Inventory Carrying Costs? (5)
• Inventory risk costs are made up of obsolescence, damage, shrinkage, and relocation costs
May 2011 APM International Partners Meeting 13
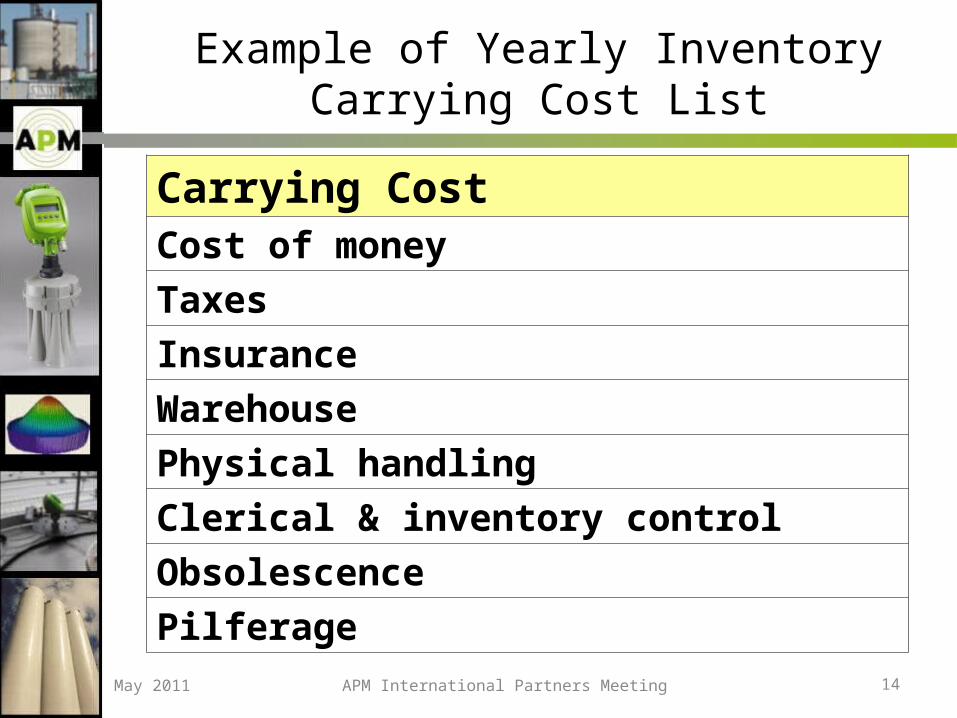
Example of Yearly Inventory Carrying Cost List
APM International Partners Meeting 14
Carrying CostCost of moneyTaxesInsuranceWarehousePhysical handlingClerical & inventory controlObsolescencePilferage
May 2011

Common Inventory Carrying Cost
APM International Partners Meeting 15
(1) Richardson, Helen: Transportation & Distribution, “Control Your Costs then Cut Them” Dec. 1995(2) Total inventory carrying costs can be estimated or be based on available customer data.
Carrying Cost (1) Potential Range
Cost of money 6% - 12%
Taxes 2% - 6%
Insurance 1% - 3%
Warehouse 2% - 5%
Physical handling 2% - 5%
Clerical & inventory control 3% - 6%
Obsolescence 6% - 12%
Deterioration & pilferage 3% - 6%
Total Cost (per year) 25% - 55%
May 2011

Inventory Carrying Costs In Summary
• Total inventory carrying costs can be broken down by
May 2011 APM International Partners Meeting 16

How Companies Calculate Their Inventory Carrying Cost
APM International Partners Meeting 17May 2011

Inventory Carrying Cost Calculation
1. Over 65% of all companies do not compute inventory carrying cost, but use rough estimates instead.*
2. The “rule of thumb” for inventory carrying costs is 25% of inventory value on hand
3. The cost of capital is the leading factor in determining the percentage of carrying cost.
* Richardson, Helen: Transportation & Distribution, “Control Your Costs then Cut Them” December, 1995
APM International Partners Meeting 18May 2011

How APM Scanners Can Reduce Inventory Carrying Cost?
APM International Partners Meeting 19May 2011

APM International Partners Meeting 20
APM’s scanners improve inventory measurement accuracy by 15%-20%
Reducing the carrying cost of the safety stock by 15-20%
Reducing the safety stock by 15-20%
May 2011

APM International Partners Meeting 21
Safety Stock Level Before and After Installation of APM Scanner
The immediate benefit of accurate volume measurement is reduction in the need for safety stock by at least 10% of the silo storage volume
Minimum Level - Reordering PointSafety stock with APM Scanner
Maximum Level
More storage room
Less safety storage
Maximum Level
May 2011

Example: Financial Value of 10% Reduction in Safety Inventory
APM International Partners Meeting 22
The reduction in inventory is directly related to size of the silo and value of the stored materials.
Silo size Width (meter) 7.8 Height (meter) 25.5 Volume (cubic meter) 1,218
Calcium Carbonate Density 2.9 Weight (ton) 3,532 Cost per ton (US$) $500 Max (100%) value of the stored materials (US$) $1,765,904 Reduction in safety stock (%) 10% Total reduction in inventory (US$) $176,590
May 2011

Example: Carrying Costs and ROI Calculation
May 2011 APM International Partners Meeting 23
InvestmentAPM 3DLevelScanner (MV Model) $6,700
Installation $900
Total investment $7,600
Saving calculationReduction in safety stock $176,950
Carrying cost factor (per year) 25%
Total saving (per year) $44,150
Additional potential savingLower maintenance cost (mainly anti bridging treatment)
Scheduling for silos filling & emptying
Accumulated storage by material type
Theft control
Total saving $44,150
ROINet return on investment (ROI) $36,540
Net return on investment (ROI) (%) 480%
Payback Period (months) 2 months

Case Studies
APM International Partners Meeting 24May 2011

Shemen Haifa, Israel• Silo capacity 10,000 tons• Material Soy Beans• Price per ton $US 700• Error measurement rate by previous technologies 15-20%• Excess safety stock (10,000@15%) 1,500 tons • APM error measurement rate 1%-3%• APM safety stock (10,000@3%) 300 tons • Reduction in safety stock 1,200 tons
• Actual reduction in inventory value per year $840,000
• Saving in carrying costs per year (25%) $210,000
While the investment cost for APM MVL2 System - $25,000
APM International Partners Meeting 25May 2011

Gadot -BioChemical Industries, Israel
• Silo capacity 200 tons
• Material Citric Acid
• Price per ton US$ 800
• Material buildup inside the silo blocked 40% of the silo volume
• Error rate when using previous measurement 80 tons (200*40%)
• APM- measurement error 6 tons (200*3%)
• Using APM reduced inventory value by 74x800 $59,200
• Saving in carrying cost per year (25%) $14,800
While the total investment for APM MV Scanner$7,600
APM International Partners Meeting 26May 2011

Gadot -BioChemical Industries (cont.)
• Additional savings:– Penalty (5%) US$ 3,200 per order on
returned of excess 80 tons (ordering 200 tons while free capacity is only 120 ton)
– US$ 6,000 - cost to remove build up materials (per event)
– Cost of operation downtime due to lack of material (per case)
APM International Partners Meeting 27May 2011

Kraft Food, Sweden
• Silo capacity 80 tons (refilled every week)
• Ordering level – 40 tons
• Material – Sugar US$ 350 per ton
• Error measurement rate using previous 17-25%
• Error measurement rate using APM scanner 1-3%
• Reduction in inventory using APM Scanner = $4,760(80 ton* 20% less 80 ton@*3% = 13.6 ton* $350)
• Higher maintenance cost for bi-weekly clean-up of the radar sensor compared with once a year clean-up needed for APM Scanner
APM International Partners Meeting 28May 2011

APM International Partners Meeting 29May 2011