
APL programs for stock assessment - arlis. · PDF fileAPL Programs for Stock Assessment ......
110
a93 · c_3 (3 -:(lq63 APL Programs for Stock Assessment D. Rivard Department of Fisheries and Oceans Fisheries Research Branch 240 Sparks Street Ottawa, Ontario K 1A OE6 rs rsn f5l f"Fl) .b rv & lnformation ARLIS -Alaska Resources LI ra services Librarv Building, Suite 111 July 1980 3211 Providence Drive Anchorage,AK 99508 Canadian Technical Report of Fisheries and Aquatic Sciences No. 953 1. Govemrrent d Canada Gouvemement du Canada Fisheries and Oceans Ocåans -· ...... .
Transcript of APL programs for stock assessment - arlis. · PDF fileAPL Programs for Stock Assessment ......

~H· a93 ·c_3 (3
-:(lq63 APL Programs for Stock Assessment
D. Rivard
Department of Fisheries and Oceans Fisheries Research Branch 240 Sparks Street Ottawa, Ontario K 1 A OE6
~ rs ~ rsn ~n f5l f"Fl) .b rv & lnformation
ARLIS -Alaska Resources LI ra
services Librarv Building, Suite 111
July 1980 3211 Providence Drive
Anchorage,AK 99508
Canadian Technical Report of Fisheries and Aquatic Sciences No. 953
1. Govemrrent d Canada Gouvemement du Canada Fisheries and Oceans ~et Ocåans
-· ...... .

Canadian Ted:nnncai R.eport of
Fnslhleries a1111d Aquatic Schmces
These reports contain scientific and technical information that represents an important contribution to ex:isting knowledge but which for some reason may not be appropriate for primary Scientific (i.e. Journa() publication; Technical Reports are directed primarily towards · a worldwide audience and have an international distdbution. No restriction is placed on subject matter and the series reflectsthe broad interests and policies of the Department of Fisheries and Oceans, namely, fisheries management, technolo'gy and development, ocean sciences, and aquatic environments relevant · tö Canada.
Technical Reports may be cited as full publications. The correct citation appears. above the·abstract of each report. Each report will be abstracted in Aquatic Sciences and Fisheries Abstracts and will be indexed annualfy in the Department's index to scientific and technical publications. ·
Numbers 1-456 in this series were issued as Technical Reports of the Fisheries Research Board of Canada. Numj)ers 457-714 were issued as Department of the Environment, Fisheries and Marine Service, Research and Development Directorate Technical Reports. N umbers 715-924 Were issued as Department of Fi~heries and the Environment, Fisheries and Marine Service Technical Reports. The current series name was changed with report number 925. ·
Details on the availability of Technical Reports in hard copy may be obtained from the issuing establishment indicated on the front cover. ·
R.apport tecllmnque ca!l1ladiell11 des
sciences hanieu~nques et aquatnqjues
Ces rapports contiennent des renseignements scientifiques et techniques qui constituent une contribution importante aux connaissances actuelles mais qui, pour une raison ou pour une autre, ne semblent pas appropries pour Ia publication d~ms un journal scientifique. II n'y a aucune restriction quant au sujet, de fait, Ia serie reflete Ia vaste gamme des interets et des politiques du Ministere des Peches et des Oceans, notamment gestion des peches, techniques et developpement, sciences oceaniques et environnements aquatiques, au Canada. ·
Les Rapports techniques peuvent etre consideres comme des publications completes. Le titre exact paraitra au haut du resume de chaque rapport, qui sera publie dans Ia revue Aquatic Sciences and Fisheries Abstracts et qui figurera dans !'index annuel des publications scientifiques et techniques du Ministere.
Les numeros 1-456 de cette serie ont ete publies å titre de Rapports techniques de I'Office des recherches sur Ies pecheries du Canada. Les numeros 457-714, å titre qe Rapports techniques de Ia Direction generale de Ia recherche et du developpement, Service des peches et de Ia mer, ministere de I'Environnement. Les numeros 715-924 ont ete publies å titre de Rapports techniques du Service des peches et de Ja mer, Ministere des Peches et de l'Environnement. Le nom de Ia: serie a ete modifie å partir du numero 925.
La page couverture porte Ie nom de l'etablissement auteur ou l'on peut se procurer ies rapports sous couverture cartonnee.
Canadian Technical Report of
Fisheries ·and Aquatfc Sciences 953
July 1980
0
APL'PROGRAMS FOR STOCK ASSESSMENT
coordinated by
D. Rivard
,· .. ,: , ·:··.··· ·:~ . . r.:· '· :!
_; ~-- . .• -~ ' ' ·-· ......
Fisheries and Oc~ans .
Fisheries Research Branch'
'··''' • ~; 1.1 ·• . : • :.'. ' ~:
. . . ::~ ':) ••• 1 (' :,· ••

- ii -
©Minister of Supply and Services Canada 1980
Cat. No. Fs 97-6/953E ISSN 0706-6457
Correct citation for this publication:
Rivard, D. 1980. APL programs for stock assessment. Can. Tech. Rep. Fish. Aquat. Sci. 953: 103 p.

- iii -
TABLE OF CONTENTS
ABSTRACT - RESUME • • • • • • • • • • • • • • • • • • • • • • • • v
INTRODUCTION •••••• I •••••••••• ' ••••••••• I • 1
General Instructions I Itt II f I It It I I I I I I 1
Sensitivity Analysis .................. 1
Notation I I II I I It I I I II I II I I I I I I I Ill I I I I 3
DESCRIPTION OF APL FUNCTIONS 4
1. Utility Functions •••••••••••••••••• 5
2. Sequential Population Analysis by Cohort Analysis (COHORT),,,,,,,,,,,, 9
3. Sequential Population Analysis by Gulland's Method (VPA),,,,,,,,,,,,,, 19
4, Estimating the Coefficients of the Von Bertalanffy Growth Equation (VONB) •••. ,., •••• , ••• ,.,.,, ••••••••• 25
5. Computation of Yield from a Given Recruitment (BEVHOLT) ••••••••••••••• 30
6. Computation of Yield from a Given Recruitment by the Method of Thompson and Bell (YIELD) ••••••••••• 35
7. Calculation of Total Mortality by Paloheimo's Method (PALOHEIMO),,,,,, 39
8, Estimating Survivors in the current Year (SURVIVOR) .•.•• ,.,,.,,,,,,,.,,, 42
9. Catch Projections (MPROJECT),,,,,,,, 53
REFERENCES,,,,,,.,,,,,,,.,,,,,,,,,, •• ,,,., 62
APPENDIX A: LISTING OF APL FUNCTIONS,,,,,, 63
Utility Functions ... . , , , , , . , .. , , .. , , , , . 64
A~PLUS •••.•••••••••••••••• I •••••• I I. 64
BECOMES, ••• ,, ••••••• ,.,,, •• ,., •• ,,,. 65
DAT .•.•.•••.•••••••.••• I ••••• I •••••• 64
FETCHllONLY.,,., ••.•• ,.,,, •••• ,,., •• , 67
FFULR ••••••••••••••• , •• , •••• ,,,.,, •• 68
FILEllFETCH •• , ••.•..•• , , , . , , , , , • , • • • • 6 7
HEADER ••••••• I ••••••••••••••••••••• I 64
INPUTllMAT •••••••••••••••• , • • • • • • • • • • . • 65
MEANF. I •••••••••••••••••••• I •••••••••• 66
OUT. I •••• Ill •• I •••• I. I I •••• I •• I ••••••• 66
OUT6.F, ••••••••• I I •••••• I •••••••••• I ••• 68
RESET.6INDICES •• I I. I •••• I. I. I •• I. I ••• I • 65
TABLE ••• I I ••• I •••••••••••••••••••• I. I I 68
WEIGHTED6FMORT,,,,,,,,,,,,,,,,,,,,,,,, 66
Main Functions,,, .•. ,.,,, •.•.• , .. , ..... , , 69
BEVHOLT •• I •• I. I. I I I. I I I ••• ti I. I I I ••• I I. 69
COHORT I. I I. I I. I •••••••• I I •••• I I I I. I I. I 72
GRAPHllPRODUCTION ••••••••••••••••••. 75
GRAPHllNET liP ROD •• , •••••• , • • • • • • • • • • • 7 5
PRllNOllSMOOTH, •• , • , , • • • . • • • • • • • . . . • • 7 5
MPROJECT ••••••••••••• ,., .•••••••••••.• 76
MPROJ .•.•••••••.••••.••• , •••••..••• 78
MPROJOUT. , , .•••••••••••••••• , • • • . • • 7 9
CALCC.,,., •••••••• , •.••••. , ••••.•.• 78
PALOHEIMO, ••. I I ••• I I I. I ••••••••••••••• 80
SURVIVOR.,, ••••• , ••• ,,.,,, ••• ,.,., ••.• 81
SURVIVORlliNT,. , •• , • , •••• , , , , , ••••• , 82
ESTllVARllSURV, •..• , ••••••••• ,, •••.•• 83
WEIGHTED.fiS • • , • , . , , • , • , • , , •••• , • , • • • 83
KllCONST.,, ••• ,,.,,,, ••••• , •• , ••.• ,. 85
ESTL\SURVIVORS •••• , •••• , • , • • • • • • • • • • 85
DIAGllSUM, •• , • , ••••••..• , ••• , •• , . • . • 86
ANALllVAR, •••• , •••• ,, ••••••••••••••• 86
VONB ••••.•••. I I ••••••••••••••••••••••• 88
llFN •••• , •••••••••••••••• , •.•••••.•• 89
VPA •.•••.•• I •••••••••••••••••••••••••• 90

YIELD ••.•.•••.• I •• I •• I •••••••••••••• 92
YIE • . G G ' G " " " • G " •• I • II • 0 • • • • • • • • • • • 93
APPENDIX B: NAMES OF APL VECTORS AND MATRICES .•••• , ••.•.•••••• , •• , , . , ••• , • • • 94
APPENDIX C: SIGN ON AND SIGN OFF •• ,,,,,,,,l02
APPENDIX D: TERMINALS SUPPORTED BY THE PLOTTING ROUTINES,,,,,,,,,,,,,,,,,,,,,,l03
********************
- iv -

- v -
ABSTRACT
Rivard, D. 1980. APL programs for stock assessment. Can. Tech. Rep. Fish. Aquat. Sci. 953: 103 p.
This technical report supplies basic information on FISH, an APL-Package designed to provide assistance in stock assessment. The Package encompasses APL-functions for sequential population analysis, yield-per-recruit analysis and catch projections, and can also be used to determine the "sensitivity" of the calculated quantities with respect to certain parameters of interest in management. The calculations of the cohort analysis are extended so as to provide estimates of the surplus production and net production from a given stock. A new method is introduced for estimating survivors in the current year: the method combines catch-at-age data and the research vessel abundance index-at-age, and produces estimates of survivors in the current year, as ~>Jell as estimates of the corresponding variances. Each APL-function is discussed, its use is explained and the description is accompanied by numerical examples.
Key words: stock assessment, sequential population analysis, cohort analysis, yield-per-recruit analysis, sensitivity analysis, surplus production, fisheries management.
RESUME
Rivard, D. 1980. APL programs for stock assessment. Can. Tech. Rep. Fish. Aquat. Sci. 953: 103 p.
Nous presentons, dans ce rapport technique, la documentation de base pour FISH, une banque de programmes ecrits en APL pour assister le biologiste lors de l'evaluation des stocks. Cette serie de programmes permet l'analyse sequentielle des populations, l'analyse de la production par recrue et la projection des prises; elle peut aussi etre utilisee pour evaluer la "sensitivite" des valeurs ainsi calculees quant a certains parametres qui suscitent un interet particulier pour la gestion des peches. L'analyse de cohorte est etendue pour produire une estimation de la production excedentaire et de la production nette pour un stock donne. Une nouvelle methode est introduite pour evaluer le nombre de survivants a la fin de l'annee courante: cette methode utilise les donnees de distribution des prises par groupe d'age, ainsi qu'un indice d'abondance par groupe d'age etabli a partir des bateaux de recherche, et evalue le nombre de survivants pour l'annee courante, ainsi que la variance correspondante. Chacun des programmes est discute; son mode d'utilisation est expose et s'accompagne d'exemples numeriques.
Mots-cles: evaluation des stocks, analyse sequentielle des populations, production par recrue, analyse de cohorte, analyse de sensitivite, production excedentaire, gestion des peches.

- 1 -
Introduction,
This document gathers basic information on FISH, an APL-package designed to provide assistance in stock assessment. It describes APL-functions which can be used to perform sequential population analysis, yield-perrecruit analyses and catch projections. All functions are designed to be used interactively: the user is prompted to input data, the appropriate checks are immediately performed and error- or warning-messages are printed to assist the user in the execution of a function.
This software is based on APL-functions written ·in the Resource Branch, Maritimes Region, by various members of the Fisheries Systems and Data Processing Group. The original functions have been described hy W.H. Marshall, in CAFSAC Research Document 78/12. Original functions have been modified by Rivard and Doubleday (1979~ so as to include a sensitivity analysis in certain population parameters. That revision included also a revision of the method which is used to determine Fmax and Fo.l in the yield-per-recruit analysis and the introduction of a new function for the calculation of yieldper-recruit by the method of Beverton and Holt.
In the present report, the information has been updated to accomodate the latest modifications brought to the package. The major modifications include a new function for the evaluation of total and net production from the cohort analysis, the introduction of a new method for the estimation of survivors in a given year from catch-at-age data and from agespecific research indices, as well as new functions to calculate weighted and unweighted fishing mortalities and to analyse catch rates. Since the number of new functions has increased considerably in the last year, it has been necessary to use the file system in order to avoid the multiplication of workspaces. A series of utility-functions have been written to retrieve the desired functions and to assist the user in preparing his active workspace,
Finally, we -.•ould like to thank A. Boudriaul t and C. Clements, who contributed to the development of the APL-functions.
General Instructions.
The workspace 2719067 FISH contains the utility-functions needed to access the APLfunctions described herein. These functions are currently implemented on the I.P. Sharp TimeSharing System in Tpronto. The sign on procedure for the Sharp APL System is described in "An Introduction to Sharp APL", from I.P. Sharp Assoc. Ltd* (see also Appendix B).
In order to load the workspace FISH, type
)LOAD 2719067 FISH
You can now access any of the APL-f.u.nctions described herein by typing
FILE~FETCH '2719067 fiZe name'
where fiZe name is one of the file names listed :i.n Table I. Note that one file usually contains more than one APL-function and that all APtfunctions stored in a given file are activated when the FILE~FETCH command is executed. Then in order to execute the desired APL-function, type in the name of the function. You will be prompted by a message which indicates the type of data to be entered. As you input data, proper checks are performed to ensure that you enter data in an acceptable format. The verifications performed by the program concern the length of input vectors and the range of acceptability of certain values. When the workspace FISH is loaded, a page width of 120 characters is automatically defined. If a smaller or larger page width is desired, simply type in
OPW+xxxx
where xxxx is the maximum number of characters per line.
If you want to abort, for some reason, the execution of a function after you have been prompted to input characters, you have to depress the following keys:
0 BACKSPACE U BACKSPACE T BACKSPACE
In order to escape from an input loop after you have been prompted to input numeric data, you have to type in + • Finally, you can terminate your APL session by typing
)OFF
The computer will respond by the usual sign off messages and you can hang up and turn off your terminal,
Sensitivitz Analysi~.
A "sensitivity analysis" represents a way to quantify the magnitude of the change in the response, say h, of a given system due to small perturbations in the values of its parameters.
*I,P. Sharp Associates Limited, Suite 1400, 145 King Street West, Toronto, Ontario. M5H 1JB

- 2 -
File name APL-functions stored in this file
PFliYIELD YIELD YIE BEVHOLT
PFliPROJECT MPROJECT MPROJ MPROJOUT CALCC
PFliPROD COHORT VPA FFULR GRAPHt.PRODUCTION GRAPHliNETLIPROD MEANF WEIGHTEDliFMORT
PFliPALOHEIM PALOHEIMO
PFliVONB VONB liFN
PFLISURVIVOR SURVIVOR SURVIVORliiNT KLICONST ESTLISURVIVORS ESTliVARliSURV WEIGHTEDliS DIAGLISUM ANALLIVAR
Workspace FISH DAT HEADER BELL BECOMES INPUTLIMAT FILEliFETCH FETCHliONLY
OUT RESETLIINDICES MPLUS PRliNOliSifOOTH "'ABLE
Table I. List of file names and description of file components.
In this APL-package, a sensitivity analysis can be performed on certain parameters of interest in management.
In their simplest form, sensitivity coefficients are calculated by taking the first partial derivative of a dependent variable with respect to a parameter. In other words, if a mathematical model is given by h(b 1, b2 , ••• ) where the bi are the parameters, the sensitivity of h with respect to a parameter bi is calculated as
X. ~
In practice, Xi is often approximated as
[1]
[z]
where o is a small quantity (e.g. o = 0.001) which represents a small perturbation of the parameter. For our purposes, it is convenient to define a different coefficient which is less influenced by the order of magnitude of both the dependent variable, h, and the parameters, bi.
Relat~':'-'~-~,g_sit!y_,:!JY.:. coe.~Ji.c:J._':'.~.· Let d be a small relative change in the deterministic value bi of one parameter, then the perturbed value of the parameter can be written as
[3]
Note that (dbi) represents the small perturbation which is applied to bi, while the quantity d is really an expression which indicates the magnitude of the relative change in the parameter value (d = (llbi)/bi ). Also the change in the
response of the dependent variable h which is caused by the small perturbati~n of the parameter bi can be expressed as
Llh [4]
The relative change in the response of the dependent variable h can simply be expressed as llh/h. We will now write the relative sensitivity coefficients as
h 3b. l
h
llh
hd
Therefore represents the ratio of the
. [s]
relative changes of the dependent variable h to a given relative change in the parameter bi. Note that the relative sensitivities are pure numbers (i.e. no units can be attributed to them).
The analyse
the response of our model to small perturbations of the parameters. A negative value for XXi indicates that a decrease (increase) of the parameter value will give rise to an increase (decrease) of the dependent variable h~ On the contrary, a positive sign indicates that an increase (decrease) of the parameter value will give rise to an increase (decrease) of the dependent variable h. A value of zero for XX. indicates that the dependent variable is not
1
influenced by the changes in the value of the parameter bi• A value of one (1) for Jxxil indicates that a 1% change in the parameter value is accompanied by a 1% change in the output variable h. This correspondence is approximately true for small changes of the parameter value.
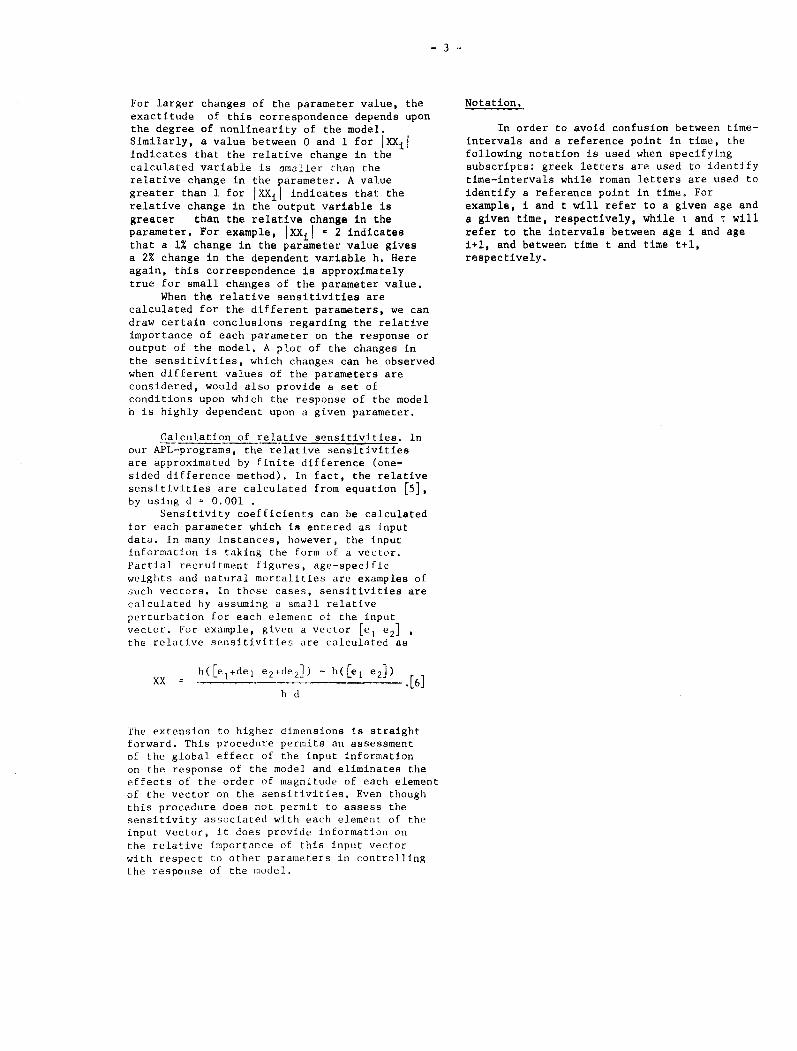
For larger changes of the parameter value, the exactitude of this correspondence depends upon the degree of nonlinearity of the model. Similarly, a value between 0 and 1 for lxxil indicates that the relative change in the calculated variable is omaller than the relative change in the parameter, A value greater than 1 for jxxil indicates that the relative change in the output variable is greater than the relative change in the parameter, For example, lxxil = 2 indicates that a 1% change in the parameter value gives a 2% change in the dependent variable h. Here again, this correspondence is approximately true for small changes of the parameter value.
- 3 -
When the relative sensitivities are calculated for the different parameters, we can draw certain conclusions regarding the relative importance of each parameter on the response or output of the model. A plot of the changes in the sensitivities, which changes can be observed when different values of the parameters are considered, would also provide a set of conditions upon which the response of the model h is highly dependent upon a given parameter.
Calculation of relative sensitivities. In our APL-progra;s, th~-;~lative sensitivities are approximated by finite difference (onesided difference method). In fact, the relative sensitivities are calculated from equation [5), by using d = 0.001 .
Sensitivity coefficients can be calculated for each parameter which is entered as input data. In many instances, however, the input information is taking the form of a vector. Partial recruitment figures, age-specific weights and natural mortalities are examples of such vectors. In those cases, sensitivities are calculated by assuming a small relative perturbation for each element of the input vector. For example, given a vector [e 1 e 2] ,
the relative sensitivities are calculated as
XX h([e 1+del e 2 .de 2])- h([e 1 e 2))
h d .[6]
The extension to higher dimensions is straight forward. This procedure permits an assessment of the global effect of the input information on the response of the model and eliminates the effects of the order of magnitude of each element of the vector on the sensitivities, Even though this procedure does not permit to assess the sensitivity associated with each element of the input vector, it does provide information on the relative importance of this input vector with respect to other parameters in controlling the response of the model.
Notation,
In order to avoid confusion between timeintervals and a reference point in time, the following notation is used when specifying subscripts: greek letters are used to identify time-intervals while roman letters are used to identify a reference point in time. For example, i and t will refer to a given age and a given time, respectively, while \ and T will refer to the intervals between age i and age i+l, and between time t and time t+l, respectively.

- 4 -
DESCRIPTION OF APL FUNCTIONS.

- 5 -
l.Utility Functions.
The following functions have been written to assist the user in preparing the data before executing certain APL-functions. For example, the functions VPA, COHORT and PALOHEIMO require that a matrix of data be created before calling these functions, The functions INPUT~MAT and BECOMES have been written to prepare and to update such matrices. Other utility functions are also available to output vectors or matrices with the appropriate heading. All utility functions described herein are kept in workspace 2719067 FISH,
Input-~utput Functions.
INPUnMAT The function INPUT~MAT is used to create
a matrix of data, The user is prompted to enter data column-wise. Checks are performed at each step so as to ensure that entries are nonnegative and that the dimensions of each vector agree with the dimensions of the initial vector. The resulting data-matrix, which is stored in the global variable MAT, is printed in output.
In order to enter the function, type in INPUT~AT. Then you will be prompted for input as follows:
ENTER FIRST YEAR AND YOUNGEST AGE-GROUP? -enter two numbers representing the first
year and the youngest age-group for your datamatrix. These values are used for headings only; dummy values, say 1 1, may be used if desired.
ERRORS: -you must enter two non-negative integers.
ENTER AGE-SPECIFIC DATA FOR EACH YEAR (ONE YEAR PER LINE), STARTING WITH YOUNGEST AGE. TERMINATE ENTRY WITH A SCALAR AFTER NEXT PROMPT.
-enter one vector of data for each column of the matrix, Each vector entered is followed by a 'CARRIAGE RETURN'. Then wait for the prompt-signal before entering the next vector. When the last vector has been entered, depress the 'CARRIAGE RETURN' key, wait for the promptsignal and type in a scalar (say 1), followed by a 'CARRIAGE RETURN'.
ERRORS: -dimensions must agree with the first vector entered;
-all entries must be non-negative.
ALIGN PAPER -adjust paper for printing the data-matrix
and depress the 'CARRIAGE RETURN' key to start.
The data-matrix will be printed at your terminal, with a short message indicating that the data is stored in the global variable MAT. You can now assign a name to the matrix, say NAME, by typing
NAME+-MAT
You must assign a name to your newly created matrix if you are planning to create other matrices through INPUT~MAT. Otherwise, the information which is kept in MAT will be overwritten.
AA YY BECOMES XXXX The diadic function BECOMES is used to
correct erroneous entries of the matrix MAT. The user identifies the erroneous entry by specifying the age-group (AA) and the year (YY); he then assigns a new value (XXXX) to this location.
ERRORS: -indices must refer to an existing entry of the matrix MAT;
-the new value XXXX must be nonnegative.
RESET~INDICES MMMM The monadic function RESET~INDICES is used
to reset the indices of a matrix MMMM before using the output function OUT. The user is prompted to input the following information:
ENTER FIRST YEAR AND YOUNGEST AGE-GROUP. -enter two numbers representing the first
year and the youngest age-group for your data matrix MMMM.
ERRORS: -you must enter two non-negative numbers.
The function RESET~INDICES will assign the proper values to the global variables YR and AG, which variables are used by OUT for producing the proper labels in output.
xx OUT mmmm The diadic function OUT is used to output
the matrix or the vector mmmm with xx decimal digits, Prior to using the function OUT, it may be necessary to define the variables YR and AG by using the function RESET~INDICES (YR and AG are defined during the execution of COHORT, INPUT~MAT, VPA or MPROJECT; if these functions have been executed , it is not necessary to redefine YR and AG through the use of the function RESET~INDICES). In addition, you can assign a title to the output table by typing
TIT+'any title for the table'
The matrix mmmm is printed with a format which considers the page width, the number of digits before the decimal point and the sign of any element of the matrix or vector, The current date is also printed in a standard format.

BELL The function BELL is used to turn off the
bell signal. But note that the bell signal is re-activated when an error is encountered. In order to turn off the bell signal again, simply type BELL.
(a,b) AbPLUS mmmm The diadic function AbPLUS is used to sum
the values contained in a given matrix mmmm, from age-group a to the oldest age-group represented in the matrix. The value b is used to indicate that the summation is to be taken b-a+l times, i.e. for each age-group between a and b. For example, if a=3 and b=5, the function AbPLUS will calculate, when applied to the matrix of population numbers, the 3+, 4+ and 5+ (respectively) in the population, for every year specified in the matrix of population numbers. The results are printed in output and take the form of a vector, when a=b, or of a matrix, when b>a,
The function AbPLUS is often used in conjunction with the function OUT for printing totals on the bottom line of a given table.
- 6 -

A AN EXAMPLE
INPUTt.MAT RNTER FIRST YEAR AND YOUNGEST AGE GROUP
0: 1965 2
- 7 -
ENTER AGE~SPECIFIC DATA FOR EACH YEAR(ONE JEAR PER LINE), STARTING WITH YOUNGEST AGE. TERMINATE ENTRY WITH A SCALAR AF'l'ER NEXT PROMPT 0:
0:
[]:
337 144 61 26 11 5 4
104 115 63 30 14 6 2
69 107 73 32 MUST BE NON•NF:GA'l'IVE AND DIMENSIONS MUST AGREE WITH FIRST VECTOR n:
69 107 73 32 14 6 3 0:
69 111 109 60 25 10 4 0:
69 111 113 89 48 18 7 0:
1 ALIGN PAPER
DA'l'A S'l'ORFD IN MAT 29/11/79
I 1965 1966 1967 1968 1969
---+-------------------------2 337 104 69 69 69 3 144 115 107 111 111 4 61 63 73 109 113 5 26 30 32 60 89 6 11 14 14 25 48 7 5 6 6 10 18 8 4 2 3 4 7
3 2100 BECOMES 104 INDICES MUST BE PRESENT IN MATRIX. FO~AT IS: AGE YEAR BRCOMF.S N~BER
3 1966 BECOMES 110 8 1968 BECOMES 6 2 1969 BECOMES 114
CATCHt.MATRIX+MAT
TIT+ 1CATCH MA'l'EIX'
0 OUT CATCHt.MATRIX
CATCH MATRIX 29/ii/79
I 1965 1966 1967 1968 1959
---+-------------------------2 I 337 104 69 69 114 3 I 144 110 107 111 111 4 I 61 63 73 109 113 5 I 26 30 32 60 89 6 I 11 14 14 25 48 7 I 5 6 6 10 18 8 I 4 2 3 6 7

- 8 -
0 OUT CATCH~ATRIX,[1] (2,4)
CATCH MATRIX 9/ 6/80
1965 1966 1967 1968 1969 •••+P~~~~-~---~~-~•••••••••••
2 337 104 69 69 114 3 144 110 107 111 111 4 61 63 73 109 113 5 26 30 32 60 89 6 11 14 14 25 48 7 5 6 6 10 18 8 4 2 3 6 7
~-~+·----·-------~·~--~~--~~-2+1 588 329 304 390 500 3+1 251 225 235 321 386 4+1 107 115 128 210 275
(2,2) A6PLVS CATCH~ATRIX 588 329 304 390 500
2 3 A6PLVS CATCH~ATRIX 588 329 304 390 500 251 225 235 321 386
RESETMNDICF.S CATCH6MA'l'RIX
A6PLVS CATCH~ATRIX
ENTF.R FIRST YEAR AND YO~GEST AGE GROUP 0:
1970 6
TIT+'NEW CATCH MATRIX'
0 OUT CATCH~ATRIX
NEW CATCH MATRIX 29/11/79
1970 1971 1972 1973 1974
---+-----------~-~-----------6 337 104 69 69 114 7 144 110 107 111 111 8 61 63 73 109 113 9 26 30 32 60 t>r'
O:J
10 11 14 14 25 48 11 5 6 6 10 18 12 4 2 3 6 7

- 9 -
2. Sequential Population Analysis by Cohort Analysis (COHORT).
This program calculates population numbers at age and the instantaneous rate of fishing mortality at age by using the method of cohort analysis described in Pope (1972). In other words, given historical information on catch-atage and given an estimate of the instantaneous rate of natural mortality as well as an estimate of instantaneous fishing mortality for the last year of historical catch and for the last age-groups, the program reconstructs the age-composition of the stock and estimates the corresponding rates of fishing mortality for a specified number of years. In addition, the program calculates sensitivity coefficients for population numbers and for instantaneous fishing mortalities with respect to both natural mortality and initial fishing mortalities. Sensitivity coefficients are also calculated for the estimated number of recruits with respect to individual catches.
If information on weight-at-age is available, the program also calculates surplus and net production from the stock. Production is assumed to have two components: an exogenous component, recruitment, and an endogenous component, production due to somatic growth. Annual net production is calculated as the total production diminished by the losses of biomass due to fishing and natural deaths.
In addition to the above-mentioned information, the program calculates the mean age and the mean weight of individuals in the catch,
Input Information
The input information required by COHORT consists of:
m
c \ ,T
first year of prediction;
final year of prediction;
age of youngest age~group;
age of oldest age-group;
catch between time t and t+l and for age i to i+l. Note that T refers to the period t, t+l, while t refers to age-interval i, i+l.
(i b, ••• , m) : the instantaneous rate of fishing mortality for each age-category in the final year (tf).
FJ.I T
' (t = t 0 , ••• , tf) : the instantaneous rate of fishing mortality for the oldest age-group in each year.
Mt (i = b, ••• , m) : the instantaneous rate of natural mortality for age i (those are assumed to be constant for all years considered),
wi+.5 t+.s: ~i = b, .... m; t = to• ... , tf) ' we1ght-at-age, expressed in
kilograms, Those are required only when population biomass is to be calculated (and production). The weights are taken as mid-year estimates.
Algorithm.
The calculations are performed in the following manner:
Population numbers: Ni,t The program calculates population numbers
by using three different equations.
A) for the first (m-b-1) age-groups in the final year (i.e. fori= b, •.• , m-1 and t = t ), the Ni t are calculated as f
'
where
B) for the oldest age-group in each year (i.e. for i = m and t = t 0 , ... , tf)j the population numbers are calculated as [2 .l if fishing is not complete for the oldest age-group and as
[2. 2]
if the fishing is complete for the oldest age-group.
Fishing is considered to be incomplete if the last row of the catch table (i.e. corresponding to the oldest age-group) includes only the catches from the oldest age-group but not the catches of older fish from the same cohort. If the catches of older fish have been added to the last row of the catch table or if there are no older fish, then fishing should be considered to be complete.
Note that J.l refers to the age-interval m,m+l, while Tf refers to the time-interval tf,tf+l.

C) for the remainder of the table (i,e, for i b, •.• , m-1 and t = t 0 , ,,,, tf-1), population numbers are calculated by using the approximation
[2. 3]
Finally, the total population numbers are calculated for each year as
N, 't
m I Ni,t (t
i=b
Population biomass: Bi,t •
An 'average biomass' estimate and an estimate for 'population biomass at the beginning of the year' are calculated from the estimated population numbers and from the weight-at-age data. The 'average biomass' is calculated as
Population biomass at the beginning of the year is calculated as
where Wi,t represents weight-at-age corrected to the beginning of the year, The wi,t are approximated by
(ln Wi-.S,t-,5 + ln wi+,5,t+,s)/2 e
For t = t 0 and i = b, the wi,t are approximated by the relationship
e( 2 ln Wi+.S,t+.S- ln Wi+l,t+l)
For t = tf+l and i = m+l, the weights are approximated by the equation
W _ (2 ln Wi+.5,t+.5 - ln Wi,t) i+l, t+l - e
Catch biomass: Yt,,
Wi+.5,t+,5 Ct,,
- 10 -
Mean weight of individuals in catch: w,
Mean age of individuals in catch: I,
Production over T,
For each age-group, total production between t and t+l (or say over a period T) is evaluated from the summation of:
l)the observed change in biomass between t and t+l:
2)the loss of biomass through natural mortality:
-z W N (1-e t '') i+.5,t+.5 i,t
3)the loss of biomass through fishing mortality: Yt,T •
Since a number of cohorts exist simultaneously in the exploited population, total production over T can be evaluated from
Bb,t + G,,,
Bb,t + L bBt,c + L Dt,T + L Yt,c l l
where Bb,t is the recruitment (expressed in biomass units) entering the exploited population at the beginning of the period ' (exogenous component) and G.,, is the increase of biomass due to growth only (endogenous component)*, The net production can now be calculated as
where P::, , or 'surplus production', is defined as
p** .. ' Surplus production is thus defined as the excess of recruitment and growth over the loss of biomass through natural deaths.
"Note that the progro~ also calculates the distribution of the growth component over the different age-g~oups from the evaluation of (Gt,T I G.,,) x 100, where Gt,T = bBt,T + Dt,T + Yt,c See R~vard, 1980.

Production/Biomass ratio.
The production per unit biomass is calculated for each year as
Fishing mortalities,
Age-specific rates of fishing mortality are calculated for each year (i.e. fori= b, ••• , m-1 and t = t 0, ••• , tf-1) as
1 i, t [
N
n Ni+l,t+l ) - . [2 .5]
Note that the instantaneous rates of fishing mortality are provided as input data for each age-group in the final year and for the oldest age-group in each year.
An indication of the overall fishing mortality is obtained by calculating the following weighted F:
The summation is taken over the fully recruited ages only. The weighted F is calculated for each year t of the cohort analysis and appears on the bottom line of the table for age-specific fishing mortalities.
Sensitivity coefficients.
The sensitivity coefficients are calculated for the population numbers and for the instantaneous fishing mortalities with respect to each parameter. Since the input parameters are either vectors or matrices, the sensitivities are approximated by considering the changes in the response of calculated quantities to small relative perturbations for each element of the input vectors (or matrices).
However, when we perturb simultaneously each element of the catch matrix, the relative sensitivities of Ni t with respect to the catch matrix take the value of 1.00 • In other words, if we increase simultaneously all catch values by 1%, we also expect all Ni t to increase by 1%. In addition, the relative sensitivities of the instantaneous fishing mortalities with respect to the catch matrix are taking the value of zero. This null value indicates that any systematic perturbation of the catch matrix will not influence our estimation of the instantaneous fishing mortalities. Since the above-mentioned results are constant for any catch matrix, these sensitivities are not calculated by the function COHORT.
- 11 -
For the population numbers (Ni t) and the fishing mortalities (Fl ,), th~ sensitivities are approximated by con~idering a small relative perturbation for each element of the vectors
[ F l, 'f J i b, ••• , m
[ FJ.l,' J t to, ••• , tf
and
[ Mt J i b, •• ., m
Finally, we perform a sensitivity analysis for Nb,t and Ni,to with respect to individual entries of the catch matrix. The sensitivities of the estimated population numbers at age b are particularly important for the assessment of future recruitment to the stock. Here, the matrix of sensitivities is formed in the following manner:
1) for each element in the top row of the matrix of population numbers, i.e. for t = t 0 , ••• , tf, we calculate the relative sensitivities as
where k = 0, .•• , Ctct-1);
2) for the last (m-b-1) elements of the first column of the matrix of population numbers, i.e. fori= b+l, ..• , m, we calculate the relative sensitivities as
N ac i,t 0 t+k,<0+k
where k 0, ... , (m=i~l)
Overall sensitivity of recruitment to parameters.
In order to assess the effect of simultaneous perturbations of initial parameter values on the calculation of recruitment, we define the following index, which is calculated for each year:
where XRt 8 is the relative sensitivity of recruitme~t to parameter 8 in a given year t. This index provides information on the overall sensitivity of the calculated recruitment in consecutive years with respect to initial

parameter values. The square root of this index provides an approximation of the overall relative change which can be registered for the calculated recruitment when small perturbations are applied simultaneously to each parameter (see Rivard and Doubleday, 1979b), The vector It (t = t 0 , ••. , tf) is printed in output under the heading 'Overall sensitivity of recruitment'.
We also define an index Isp which gives insight on the overall importance of input parameters for the evaluation of recruitment in different species or in different stocks. This index is calculated as
I sp years I I t
t
The calculated value for I is printed in output under the heading •5eerall Sensivitity Index'.
In order to initiate the program, type COHORT. Then you will be prompted for input as follows: [note that a catch matrix (C t, 1: : i = b, ... , m; t = t 0 , ... , tf) must be created before entering the function)
NAME OF CATCH MATRIX? ..•
-enter the name of the catch matrix.
ERRORS: -the name entered must represent an APL variable;
-the variable must be a matrix; -there should not be negative values in the matrix.
SENSITIVITY ANALYSIS TO BE PERFORMED (YES OR NO)?
-enter either YES or NO, in order to indicate if you want to calculate the relative sensitivity coefficients.
ERRORS: -you must enter either YES or NO.
FIRST YEAR, YOUNGEST AGE-GROUP AND FIRST FULLY RECRUITED AGE-GROUP?
-enter three numbers representing the first year in the catch table, the youngest age-group in the catch table and the first fully recruited age-group.
ERRORS: -you must enter exactly three numbers; -all figures must be non-negative integers.
NATURAL MORTALITY?
-enter either a single number (M) or a vector giving a separate instantaneous rate of natural mortality (Mi) for each age-group i. When a single number is entered, the Mi are set equal to M for all i.
- 12 -
ERRORS: -you must enter one number or a vector of numbers with the same number of elements as there are rows in the catch matrix;
-the natural mortality must be equal to or greater than zero.
WEIGHT AT AGE KNOWN (YES OR NO)?
-enter either YES or NO, in order to indicate if weight-at-age data are available.
ERRORS: -you must enter either YES or NO.
ENTER WEIGHT AT AGE DATA (KG): VECTOR OR MATRIX.
-enter either a vector or a matrix of weights at age (Wit : i = b, ... , m; t = t 0 , ..• , tf). When~ vector is entered, growth is assumed to be constant through time.
ERRORS: -the vector must have the same length as there are rows in the catch matrix;
or -the matrix must have the same dimension as the catch matrix;
-all entries must be positive.
ENTER 1 IF MATRIX IS TO BE PRINTED. OTHERWISE ENTER 0. ONE NUMBER IS REQUIRED FOR EACH MATRIX:
F
CATCH BIOMASS MEAN WEIGHT OF INDIVIDUALS IN CATCH WEIGHTS AT THE BEGINNING OF THE YEAR POPULATION BIOMASS AT THE BEGINNING OF THE
YEAR
-enter a vector of O's or l's to indicate which matrices are to be printed.
ERRORS: -you must enter a vector of O's and/or l's;
-the input vector must have dimension 4.
VALUES FOR LAST YEAR (XXXX)?
-enter the values of the instantaneous rate of fishing mortality for the last year represented in the catch matrix: (Fi tf' i = b, .•• ,m). You can also enter a single number representing the fishing mortality to be applied to all age-groups in the final year.
ERRORS: -you must enter one number or a vector of numbers with the same number of elements as there are rows in the catch matrix;
-the fishing mortalities must be greater than zero.
F VALUES FOR OLDEST AGE GROUP (XX)?
-enter the values of the instantaneous rate of fishing mortality for the oldest age-group represented in the catch matrix: Fm,t• t = t 0, ..• , tf. You can also enter a single value representing the fishing mortality to be applied to the oldest age-group in all years.

- 13 -
ERRORS: -you must enter one number or a vector of numbers having the same number of elements as there are columns in the catch matrix;
-the fishing mortalities must be greater than zero.
IS FISHING COMPLETE FOR THE LAST AGE GIVEN (YES OR NO)?.,.
-enter either YES or NO, in order to specify which equation is to be used to calculate the population numbers for the oldest age-group. Fishing is considered to be complete if the catches of older fish have been added to the last row of the catch table or if there are no older fish,
ERRORS: -you must enter either YES or NO.
Graphical output.
In addition to the above-mentioned calculations, the user can generate two graphs showing 1) the variation of the components of production (recruitment, growth) through time and 2) the fluctuations of surplus production and of the loss of biomass due to fishing mortality , The first graph is produced with the function GRAPH6PRODUCTION, while the second graph is obtained by execution of the function GRAPH6NET6PROD. In order to use these plotting functions, you must copy the workspace 39 MAGIC in your active workspace and you must specify the type of terminal being used. This is achieved by the following commands:
)COPY 39 MAGIC 6SUPERPLOT 'TERMINAL,xxxx'
where xxxx identifies the type of terminal being used (the terminals which are supported by the plotting package are listed in Appendix D), Note that only terminals with graphical capabilities can be selected,
In order to initiate the first graph, type
GRAPH6PRODUCTION
The function GRAPH6PRODUCTION uses the data stored by COHORT in the variable DATAl, Paper will advance to the next page; then adjust paper and depress the 'SPACE BAR' followed by a 'CARRIAGE RETURN' to start. In order to output the second graph, type
GRAPH6NET6PROD
The function GRAPH6NET6PROD uses the data stored by COHORT in the variable DATA2. Paper 1vill advance to the next page; adjust paper and depress the 'SPACE BAR' followed by a 'CARRIAGE RETURN' to start. Annual net production corresponds to the difference between the two lines plotted.
Calculating mean F-values and partial recruitment figures.
A series of functions have been written to calculate an overall rate for the age-specific fishing mortalities, These functions operate on FISHMORT, the matrix of age-specific fishing mortalities which is available as a global variable after execution of the function COHORT.
MEANF This function calculates an unweighted mean
for the annual rate of fishing mortality from the following relationship:
F ( I F ) I nb of age-groups T l, T
Here, the summation is over all age-groups. In order to print the vector of unweighted mean-F's, simply type in MEANF after execution of the function COHORT.
WEIGHTEMFMORT This function calculates a weighted mean for
the annual rate of fishing mortality from the formula
where the summations are taken over all agegroups. In order to print a vector of weighted F's, type in WEIGHTED6FMORT after execution of the function COHORT.
FFULR n ( n = first fully recruited age-group) This function calculates an overall rate of
fishing mortality for the period T from the equation
F T
ln( m-2 I
i=i r
N I i,t
m-1 I Ni+l,t+l ) - M •
i=i r
where ir is the first fully recruited age-group. In order to print a vector representing this overall rate of fishing mortality, type in FFULR n after executing the function COHORT.
PR6N06SMOOTH This function is used to calculate partial
recruitment figures from the age-specific fishing mortalities stored in the global variable FISHMORT. The partial recruitment figures are calculated as
where FMAX, is the maximum value of F 1 , T 1vhich is observed over the period Tl they are, in fact, relative measure of catchability for the different ages, In order to print the matrix of partial recruitment figures, type in PR6N06SMOOTH; results are stored in the global variable SEL.

- 14 -
-An Exam~
FILE6FETCH '2719067 PF6PROD'
COHORT NAME OF CATCH MATRIX? ••••• CCC (the matrix CCC is printed on page 22)
SENSITIVITY ANALYSIS TO BE PERFORMED (YES OR NO)? NO FIRST YE'AR, YOUNGE'ST AGE' GROUP AND FIRST FULLY RECRUITE:D AGE• GROUP? 0:
1965 2 6 NATURAL MORTALITY? 0:
• 2 WE'IGHT AT AGE KNOWN(YES OR NO)? res ENTER WEIGHT AT AGE DATA (KG): VECTOR OR MATRIX 0:
• 08 .15 • 2~ • 29 • 31 • 32 • 33 • 34 • 35
ENTER 1 IF MATRIX IS TO BE PRINTED. OTHERWISE ENTER 0. ONE NUMBER IS REQUIRED FOR EACH MATRIX CATCH BIOMASS MEAN WEIGHT OF INDIVIDUALS IN CATCH WEIGH1'S AT THE BEGINNING OF THE YEAR POPULATION BIOMASS AT THE BEGINNING OF THE YEAR 0:
0 1 0 0 F VALUES FOR LAST YEAR (1977)? 0:
.12 .164 .304 .36 .4 .4 .4 .4 .4 F VALUES FOR OLDES'l' AGE GROUP (10)? 0:
.139 .351 .372 .525 .34 .514 .562 .773 .564 .358 .389 .352 .4 IS FISHING COMPLETE FOR LAST AGE GIVEN(YES OR NO)? ••.•• NO
POPULATION NUMBERS
1965 1966 1967 1968 1969 1970 1971
29/ 5/80
1972
---+---------~----~--------------------~--~----------------------~--~-------2 I 2573883 1520603 1256924 2361178 622711 789346 863222 5168989 3 I 961249 1916581 1205487 985697 1252997 446009 549520 576299 4 I 1301419 763071 1324796 925051 734694 677987 312531 292773 5 I 343998 855456 571734 868943 698456 493877 296884 159812 6 I 91885 236624 420997 368733 463037 426419 222392 140313 7 I 40626 65645 152581 200631 235996 278799 240340 113680 8 I 4460 31730 41105 72489 82269 136659 127000 112063 g ! 1033 3144 18991 29585 30415 46911 74556 58717
10 I 314 797 1045 15179 10251 19160 19161 27908 ---+----------~--~~-~~~~~~~~~~b~=~=~~~~~~~~~M~------~-----------------------
2+1 5318867 5393652 4993660 5827485 4130826 3315169 2705607 6650555 3+1 2744984 3873049 3736736 3466307 3508114 2525823 1842385 1481566 4+1 1783735 1956468 2531249 2480610 2255117 2079814 1292865 905267 5+1 482316 1193397 1206453 1555559 1520423 1401827 980334 612494
1973 1974 1975 1976 1977
-·-+~--~---~~~--~~*··--~----~-----~-~------------2 799690 1261696 1683197 194992 541745 3 3644541 627897 92594 7 1164915 141620 4 406700 2474822 472818 614285 807496 5 105319 233871 1468646 303543 384765 6 60983 55082 143341 854384 183070 7 46669 26799 31295 7157~ 500638 8 48678 20691 14594 17156 41444 9 47684 23925 12133 9018 9551
10 24498 21092 9668 6784 4166
---+-•--~-------·---------------~----~--~-------~ 2+1 5184762 4745875 4761638 3236650 2614495 3+1 4385072 3484179 3078441 3041658 2072750 441 740531 2856282 2152494 1876743 1931130 5+1 333831 381460 1679676 1262458 1123634

- 15 -
MEAN POPULATION BIOMASS (KG) 29/ 5/80
1965 1966 1967 1968 1969 1970 1971 1972 1973
·••+----~-----~---~-------~------~-----------~------------------------------2 178328 108556 89266 139917 42356 52977 56810 348997 56827 3 128753 240378 158863 128109 140437 56298 61164 72987 453307 4 255094 159073 259415 193549 145521 110761 54648 44003 74966 5 83222 177703 134223 187003 159876 98679 60584 29749 22477 6 24190 59377 92171 92208 112580 100607 50221 26371 12888 7 11518 16775 34436 42487 58185 61777 53800 24524 10220 8 1242 8190 11560 15987 20771 33822 29209 24864 11500 9 309 648 5785 6202 8281 10537 16141 13310 11084
10 93 214 278 3779 2772 4793 4693 6245 5995
--•+----------··---------~--------------------------------~-----------------2+1 682749 770915 785997 809239 690780 530252 387269 591051 659264 3+1 504420 662359 696731 669322 648423 477275 330459 242054 602437 4+1 375668 421981 537868 541214 507986 420976 269295 169066 149130 5+1 120574 262907 278453 347665 362466 310216 214647 125063 74164
1974 1975 1976 1977
---+·---------··········-~-~--------2 86814 112656 13351 37089 3 82004 113923 146297 17806 4 462763 91668 117746 152229 5 53629 328837 69093 85438 6 13043 32034 205167 42676 7 6426 7527 17646 120470 8 5291 3822 4285 10284 9 5350 3128 2136 2442
10 5658 2557 1825 1096
-~-+---~--------~--·-------·--------2+1 720977 696152 577546 469532 3+1 634163 583497 564195 432442 4+1 552159 469574 417898 414636 5+1 89396 377906 300151 262407
WARNING: WEIGHT AT AGE IS AVAILABLE FOR ONE YEAR ONLY. POPULATION BIOMASS, AS C ALCULATF.D, MAY BE' BIASF'D.
MEAN WEIGHT OF INDIVIDUALS IN CATCH 29/ 5/80
l 1965 1966 1967 1968 1969 1970 1971 1972 1973 1974 1975 1976 1977
I o.18 0.23 0.25 0.17 0.22 o.2s 0.23 o.16 0.1s 0.22 0.21 o.2s 0.26
MEAN AGE OF INDIVIDUALS IN CATCH 29/ 5/80
1965 1966 1967 1968 1969 1970 1971 1972 1973 1974 1975 1976
3.31 4.17 4.67 3. 53 4.19 4. 86 4.64 3. 49 3.70 3. 93 3.93 4.66
1977 --·+•-........... 5.02
DISTRIBUTION OF GROWTH OVER AGES (PER CENT) 29/ 5/80
1965 1966 1967 1968 1969 1970 1971 1972 1973 1974 1975 1976 ••-+•••••P••••·----------------PP-------------------~-----------------------
2 49.3 24.5 22.2 34.6 14.5 26.2 34.7 77.5 11.5 20.5 33.4 5.7 3 26.6 46.5 33.7 27.3 42.2 24.0 32.8 14.0 78.7 16.6 29.2 53.3 4 21.2 18.6 34.3 25.0 26.5 31.9 18. 8 5.9 8.3 59.6 14.6 26.9 5 2.4 9.2 7.3 10.5 12. 1 11.4 8.6 1.6 1.0 2.8 21.8 6.5 6 0.3 1.1 1.9 1.9 3.2 4.1 2. 5 0.4 0.2 0.3 0.8 7.2 7 0.2 0.2 0.4 0.4 0.9 1.3 1.4 0.2 0.1 0.1 0.1 •J.4 8 o.o o. 1 0.1 0.2 0.3 0.7 0.7 0.2 0.1 0.1 0.1 0.1 9 0.0 0.0 0.1 o.o 0.1 0.2 0.3 0.1 •).1 o.o o.o o.o
10 0.0 0.0 0.0 0.0 o.o o. 1 0.1 0.1 0.1 0.1 o.o o.o

1977 ... -.. .. +fiio•- ... --
2 18.0 3 8.6 4 55.2 5 12.6 6 2.2 7 3.0 8 0,3 9 0.1
10 o.o
SOURCE
RECRUITMENT BIOMASS GROWTH TOTAL PRODUCTION
- .16 -
PRODUC'J.'ION
1965 1966
150376 88839 227589 279816 377965 368655
1967
73434 253331 326765
1968
137949 252588 390537
1969
36381 182936 219317
29/ 5/80
1970
46117 126602 172719
LOSS THROUGH FISHING SURPLUS PRODUCTION NET PRODUCTION
95016 169374 241415 214472 146399 45098
172784 169565 -3219
236722 203395 240474 228689 81161 66668
-8033 -122235 -173806
SOURCE
RECRUITMENT BIOMASS GROWTH TOTAL PRODUCTION
LOSS THROUGH FISHING SURPLUS PRODUCTION NET PRODUCTION
SOURCE
1971
50433 102558 152991
180983 75537
105446
1977
-·----~~-~~~---~--~·--+--~~-----RECRUITMENT BIOMASS 31651 GROWTH 129773 TOTAL PRODUCTION 161424
--~--------~------~---+·--------LOSS THROUGH FISHING 155194 SURPLUS PRODUC'l'ION 67518 NET PRODUCTION -87676
1972 1973 1974
301992 46721 73713 282550 311874 265783 584542 358595 339496
189599 153089 194455 466331 226742 195301 276733 73653 846
PRODUCTION/BIOMASS RATIO
I 1965 1966 1967 1968 1969 1970 1971 1972 1973 1974 1975
1975
98339 211444 309782
198328 170552 -27776 -
1976
11392 148370 159763
155851 44253
111598
29/ 5/80
1976 1977
I o.55 0.48 o.42 0.48 0.32 0.33 o.4o o.99 o.54 o.47 0.4~ 0.28 0.34
FISHING MORTALITY 29/ 5/80
1965 1966 1967 1968 1969 1970 1971 1972 1973 1974 1975 1976 P~•+•••·~-~---~~~P--•~P~••••••••-••-~~·-••••••••••~••••••P•--•••••~-~·-••••-
2 0.095 0.032 0.043 0.434 0.134 0.162 0.204 0.149 0,042 0.109 0,168 0.120 3 0.031 0.169 0.065 0.094 0.414 0.156 0.430 0.149 0.187 0.084 0.210 0.166 4 o. 220 0,089 0.222 0.081 0.197 0.626 0.471 0.822 0,353 •). 322 0.243 o. 268 5 0.174 0.509 0.239 0.429 0.293 0.598 0.549 o. 763 0,448 0.290 0.342 0.306 6 0.136 0.239 0.541 0.246 0.307 D. 373 0.471 0.901 0.622 o. 365 0.494 0.334 7 0.047 0.268 0.544 0.691 0.346 0.586 o. 563 0.648 0.613 0.408 0.401 0.346 8 0.150 0.313 0.129 0.669 0,362 0.406 0.571 0.654 0,510 0.334 0.281 0.386 9 o. 060 o. 902 0.024 0.860 0,262 0.695 0,783 0.674 0,616 0.706 0.381 0.572
10 0.139 0.351 0.372 0.525 0.340 0.514 0.562 o. 773 0,564 0.358 0.389 0.352
6+1 0.110 0.258 0.499 0.454 0.323 0.463 0.559 0,739 0,589 0.423 0.455 0.339
1977 -~-+ ...............
2 0.120 3 0.164 4 0.304 5 0.360 6 0.400 7 0.400 8 0.400 9 0.400
10 0.400
<:+I (\ iJ.(\(\

l.
c 0 M p 0 N F: N T s
0 F
p R 0 D u c 1.' I 0 N
l.
)COPY 39 MAGIC 6SUPERPLOT 'TERMINAL,Xl620' GRAPH6PRODUCTION
(Paper will advance to the next page)
- 17 -
(Adjust paper, and depress the 'SPACE BAR' followed by a 'CARRIAGE RETURN')
600,000
500,000
40'),000
300,000
1965
PRODUCTION VERSUS TIME
G ..... RECRUITMENT t:r••• GROWTH 'il---- TOTAL PRODUCTION
•tt-----&
El ..
1967
' ' '
• .(! ••••••• .t:> b······
1969 1971 YEAR
()·· ...
1973
•••• E>. ®···· ···-
1975 1977

.!.
p R 0 D u c T I 0 N
500,000
400,000
300,000
200,000
100,000
- 18 -
GRAPHLINETLIPROD
(paper will advance to the next page) (adjust paper; depress the 'SPACE BAR' followed by a 'CARRIAGE RETURN')
1965
SURPLUS PRODUCTION AND YIELD VERSUS TIME
8--- SURPLUS PROD 1!.····· FISHING LOSS
1967 1969 1971 YEAR
1973 1975 1977

- 19 -
3. Sequential Population Analysis by Gulland's method (VPA).
This program calculates population numbers at age and the instantaneous rates of fishing mortality at age by using a virtual population analysis (Gulland, 1965; Pope, 1972). That is, given historical information on catch-at-age and given an estimate of the instantaneous rate of natural mortality as well as an estimate of the instantaneous rates of fishing mortality for the last year of historical catch and for the last age-groups, the program reconstructs the age-composition of the stock and estimates the corresponding rates of fishing mortality for a specified number of years, Sensitivity coefficients are calculated for population numbers and for instantaneous rates of fishing mortality with respect to both natural mortality and initial fishing mortalities, and with respect to individual entries of the catch matrix.
Input Information.*
The input information required by VPA consists of:
b
m
F l, T f
Fll,T
first year of the catch matrix;
final year in the catch matrix;
age of youngest age-group in the catch matrix;
age of the oldest age-group in the catch matrix;
( t = t 0 , ... , t f ; i = b, ... , m) : catch-at-age, given in numbers;
(i = b, ••. , m): the instantaneous rate of fishing mortality for each age-group in the final year (tf);
(t = t 0, .•• , tf): the instantaneous rate of fishing mortality for the oldest age-group in each year;
(i = b, .•. , m): the instantaneous rate of natural mortality for each age-group (those are assumed to be constant for all years considered);
wi+.5.t+.5 (i = b, ... , m; t =to~:··· tf): · weight-at-age, expressed 1n
kilograms. Those are required only when population biomass is to be calculated. The weights are taken as mid-year estimates.
*The notation follows that of Chapter 2.
The function VPA calculates the population numbers at age and the instantaneous rate of fishing mortality at age; when information on weight-at-age is available, the function also calculates the catch biomass (yield) and the population biomass. The calculations are performed in the following manner:
~ula!:,;!-.<2!!.....1]-~mbe~: Ni, t The function calculates the population
numbers by using three different equations:
A)for the first (m-b-1) age-groups in the final year (i.e. fori= b, ••• , m-1 and t = tf)j the Ni,t are calculated from equation [2.1 •
B)for the oldest age-group in each year (i.e, fori= m and t = t 0, ••• , tf), the Ni,t are calculated as equation [2.1] in COHORT if fishing is not complete for the oldest agegroup and as equation [2.2] in COHORT if fishing is complete for the oidest age-groups.
C)for the remainder of the table (i.e. for i = b, •.. , m-1 and t = t 0 , ••• , tf-1), the population numbers are calculated as
Ni+l,t+l
In order to use the preceding equation, an estimate of F1 T is necessary, That estimate can be obtained by using the catch equation
Equation [3.2] involves only one unknown, namely F1 ,,, which the function calculates by using the Newton-Raphson method of successive approximations (see Seber, 1973: section 1.3.8). An initial estimate of F1 l is calculated by using equations [2.3] and' 2.5] . Successive values of F1 ,, are then calc~lated by the Newton-Raphson method. We ex1t the iterative process when
F +M F (e l,T l -1) \ 'T
F \ 'T + Ml

- 20 -
Once the final value of F1 T has been found, the Ni t are calculated by usihg equation [3.1] which is'given above.
Catch Biomass: Y1 ,,
Mean weight of individuals in catch: w,
Mean population biomass: B1 ,,
-z W N (1-e 1 •')/Z i+.S,t+.S i,t t,T
Fishin~~.E}_?,li ti..§_~: F \ T
Age-specific rates ot fishing mortality are determined from equRtion [3.2]. Thereafter, an indication of the overall fishing mortality rate is obtained by calculating the following weighted F:
where the summation is taken over all ages, The weighted F is calculated for each year of the cohort analysis and is printed on the bottom line of the table for age-specific rates of fishing mortality.
Sensitivity coefficients. The sensitivity coefficients are calculated
for the population numbers and for the instantaneous rates of fishing mortality with respect to each parameter. The sensitivities are approximated by considering the changes in the response of calculated quantities to small relative perturbations for each element of the input vectors (or matrices).
As in COHORT, the relative sensitivities of Ni t with respect to the catch matrix take the value of 1.00, while the relative sensitivities of the instantaneous rates of fishing mortality with respect to the catch matrix take the value of zero. In other words, if we increase simultaneously all catch values by 1%, we expect that all Ni.t will increase by 1%; however, the estimated rates of fishing mortality will not be modified by such perturbation of the catch values. Since these results are constant for any catch matrix, these sensitivity coefficienrs are not calculated by the function VPA.
For the population numbers, Ni,t• and for the instantaneous rates of fishing mortality, F1 ,, the sensitivity coefficients are approximated by considering a small relative perturbation for each element of the input vectors
[F\ •'f] i b, ••• , m
[Fll, ,] t to• .... , tf;
and
[MJ i b, - .. ' m
Finally, we also perform a sensitivity analysis for Nb t and Ni t with respect to individual entrie~ of the ' 0 catch matrix. The calculations are performed as in COHORT. The overall sensitivity of recruitment to parameters is also estimated as in COHORT.
Input Format.
In order to initiate the program, type VPA. Then you will be prompted for input as follows: [note that a catch matrix (C 1 ,,: i = b, •.• , m; t = t 0 , ..• , tf) must be previously created before calling the function]
NAME OF CATCH MATRIX? ••.
-enter the name of the catch matrix.
ERRORS: -the name entered must represent an APL variable;
-the variable must be a matrix; -there should not be negative values in the matrix.
SENSITIVITY ANALYSIS TO BE PERFORMED (YES OR NO)?
-enter either YES or NO, in order to indicate if you want to calculate the relative sensitivity coefficients.
ERRORS: -you must enter either YES or NO.
FIRST YEAR AND YOUNGEST AGE-GROUP?
-enter two numbers representing the first year in the catch matrix and the youngest age-group in the catch matrix.
ERRORS: -you must enter exactly two numbers; -these values must be non-negative integers.

- 21 -
NATURAL MORTALITY?
-enter either a single number (M) or a vector giving a separate value M1 for each age-group i.
ERRORS: -you must enter one number or a vector of numbers having the same number of elements as there are rows in the catch matrix;
-the natural mortalities must be equal to or greater than zero.
WEIGHT AT AGE KNOWN (YES OR NO)?
-enter either YES or NO, in order to indicate if weight-at-age data are available.
ERRORS: -you must enter either YES or NO,
ENTER WEIGHT AT AGE DATA (KG): VECTOR OR MATRIX.
-enter either a vector or a matrix of weightat-age (Wi+.S,t+, 5 : i = b, ,,,, m; t = t 0 , ,,,, tf), When a vector is entered, growth is a assumed to be constant through time.
ERRORS: -the vector must have the same length as there are rows in the catch matrix;
or -the matrix must have the same dimension as the dimensions of the catch matrix;
-all entries must be positive.
STARTING F VALUES FOR LAST YEAR (XXXX)?
-enter the values of the instantaneous rates of fishing mortality for the last year represented in the catch matrix (F 1 1 : i b, •.. , m). You can also enter a si~gle number representing the rate of fishing mortality to be applied to all age-groups in the final year.
ERRORS: -you must enter one number or a vector of numbers having the same number of elements as there are rows in the catch matrix;
-the values entered must be greater than zero,
STARTING F VALUES FOR OLDEST AGE-GROUP (XX)?
-enter the values of the instantaneous rate of fishing mortality for the oldest age-group represented in the catch matrix (F)J,T : t t 0 , .•. , tf). You can also enter a single
value representing the instantaneous rate of fishing mortality to be applied to the oldest age-group in each year.
ERRORS: -you must enter one number or a vector of numbers having the same number of elements as there are columns in the catch matrix;
-the values entered must be greater than zero.
IS FISHING COMPLETE FOR THE LAST AGE GIVEN (YES OR NO)?,.,
-enter either YES or NO, in order to specify which equation is to be used to calculate the population numbers for the oldest agegroup, Fishing is considered to be complete if the catches of older fish have been added to the last row of the catch matrix or if there are no older fish.
ERRORS: -you must enter either YES or NO.

- 22 -
FILE6FETCH '2719067 PFdPROD'
CCC 210796 43630 47948 751706 70536 106916 144167 649254 29656 118301 235590 19922 55634
26450 270068 68430 79933 384467 58166 173662 71984 562616 45600 158941 161637 19468 232147 58591 238394 65107 118960 285361 106170 148516 109530 616206 92356 130597 192823
49752 308775 109814 274518 160723 201097 113561 77207 34422 53199 384646 72334 106061 10592 45479 159203 72827 110852 120223 75593 75384 25562 15254 50599 219788 55066
1693 13970 57948 90617 62506 111911 93620 49065 19361 8120 9357 18960 150588 561 7722 4497 31977 22595 41257 50022 48700 17604 5313 3239 4967 12466
54 1690 409 15441 6345 21271 36618 26055 19836 10964 3481 3556 2873 37 215 296 5668 2693 7039 7536 13792 9661 5787 2842 1835 1253
VPA NAME OF CATCH MATRIX? ••••• CCC
SENSITIVITY ANALYSIS TO BE PERFORMED (YES OR NO)? YES FIRST YPAR AND YOUNGEST AGE GROUP? 0:
1965 2 NATURAL MORTALITY? 0:
• 2 WEIGHT AT AGE KNOWN (YES OR NO)? YES ENTER WEIGHT AT AGE DA'l'A (KG): VECTOR OR MATRIX 0:
.08 .15 .24 .29 .31 .32 .33 .34 .35 STARTING F VALUES FOR LAST YEAR (1977)? 0:
• 12 • 164 • 304 • 36 . 4 • 4 • 4 • 4 • 4 STARTING F VALUES FOR OLDEST AGE GROUP (10)? 0:
• 139 • 351 • 372 • 525 • 34 • 514 • 562 • 773 • 564 • 358 • 389 • 352 • 4 IS FISHING COMPLETE FOR LAST AGE GIVEN(YES OR NO)? ...•• NO
POPULATION NUMBERS
1965 1966 1967 1968 1969 1970 1971 1972 1973 1974 1975 1976
2 I 2555438 1 509187 1245990 2337439 617038 781819 858341 5145804 797586 1258831 1681078 194912 3 I 954984 1902099 1196227 976849 1239563 441613 543780 572961 3627993 626238 923973 1164126 4 I 1289495 757994 1314034 917640 727683 669945 309156 289450 404236 2463699 471585 613409 5 I 341492 846811 567745 861286 692 566 488670 29337fi 157955 104611 232596 1463426 303009 6 I 91214 234778 416723 366025 458939 422546 220214 138542 60445 54783 142607 852645 7 I 4')549 65134 151300 198651 234158 276122 238022 112541 46322 26632 31156 71420 8 I 4421 31671 40764 71995 81707 135572 125949 111088 48288 20611 14519 17112 9 I 1033 3114 18990 29321 30373 46607 73978 58355 47428 23766 12102 8975
i0 314 797 1045 15179 10251 19160 19161 27908 24498 21092 9668 6784 ~--+~~---P~---~~-----~---~---••P•••••p~--~-~-~--~~---"~~---·••P•••~~-·-••••P~p~--~-·-·~-~-------~-~--~~~---~----
2+1 5278940 5351583 4952817 5774385 4092279 3282054 2681976 6614603 5161408 4728249 4750114 3232390 3+1 2723502 3842396 3706827 3436945 3475241 2500236 1823635 1468799 4363823 3469418 3069036 3037478 4+1 1768518 1940298 2510600 2460096 2235678 2058622 1279855 89583 8 735829 284318') 2145063 1873352 5+1 479023 1182303 1196566 1542457 1507995 1388677 970699 606388 331593 379481 1673478 1259943
1977 ... ...,. .. +,.. .... <~o> __ ....... _~
2 541745 3 141620 4 807496 5 384765 6 183070 7 500638 8 41444 9 9551
10 4166 .......... + .. ""' ....... _ ..........
2+1 2614495 3+1 2072750 4+1 1931130 5+1 1123634

·- 23 -
MEAN POPULATION BIOMASS (KG) 12/ 6/80
1965 1966 1967 1968 1969 1970 1971 1972 1973 1974 1975 1976 1977 ~~~+•-~~~~--~·-~-~•••~~~~-~~~~~~~-~-~~-~~~-~b~~-~~~~~~m~bw~~-~~--~~~~$~~~-~~~~~~=b~•b••~P~k~-~-~~W•®-~~-~--~
2 177017 107732 88477 138468 41956 52449 56485 347423 56677 86623 112545 13348 37089 3 127905 238497 157618 126924 138859 55719 60501 72556 451258 81789 113718 146245 178')6 4 252644 157991 257225 191960 144064 109449 54038 43588 74532 460881 91465 117656 152229 5 82595 175904 133263 185352 158480 97671 59847 29438 22339 53345 327895 69027 85438 6 24007 58898 91247 512 545 99667 49724 26095 12789 12978 31912 204940 42676 7 11497 16640 34171 42123 57727 61220 53303 24300 10160 6389 7500 17625 120470 8 1231 8181 11460 15915 20633 33556 28994 24683 11415 5274- 3803 4279 1028'+ 9 309 644 5785 6169 8275 10498 16068 13263 11050 5329 3124 2130 2442
10 93 211~ 278 3779 2772 4793 4693 621+5 5995 5658 2557 1825 1096 ~-•+•~~~~~~~.~~-~~~-~~~·~b~-~$~~~~~@~~~~~~~~~~~~-~~~~~~~F~~~P-~~~~~~-~~·~FP~-·-~·••b~~~-~~-~-~~~~~~-~~-&a~F~
2+1 677299 764701 779525 802201 68tl311 525021 83652 587590 656216 718266 694519 577074 469532 3+1 500282 656969 691047 663733 642356 472572 327166 240167 599539 631643 581974 563726 432442 4+1 372377 1+18472 533429 536809 503496 416854 266666 167612 148280 549854 468257 417481 414636 5+1 119732 260481 276205 344849 359432 307405 212628 124023 73748 88973 376792 299826 262407
WARNING: WEIGHT AT AGE IS AVAILABLE FOR ONE YEAR ONLY. POPULATION BIOMASS, AS CALCULATED MAY BE BIASED.
CATCH BIOMASS (KG) 12/ 6/8Cl
1965 1966 1967 1968 1969 1970 1971 1972 1973 1974 1975 1976 1977 ~P-+~-~~-~---~$~~-k·-~-~·~---~-~~~~-~-~~~~~~-~-~-0~9-~~-~~~~b~k~~~~~~~~~~~~p~~~-~---··-~-~*~~~-~-~~---~P---
2 I 16864 3490 3836 60136 5643 8553 11533 51940 2372 9464 18847 1594 4451 3 I 3967 4::>510 10264 11990 57670 8725 26049 10798 84392 6840 23841 24246 2920 4 I 55715 14062 57215 15626 28550 68487 25481 35644 26287 147889 22165 31343 46278 5 I 14428 89545 31846 79610 46610 58318 32933 2239Cl 9982 15428 111547 20977 30758 6 I 3284 14098 49353 22576 34361+ 37269 23434 23369 7924 4729 15686 68134 17070 7 I 542 4470 18543 28997 20:JCl2 35812 29958 15701 6196 2598 2994 6067 48188 8 I 185 2548 1484 10552 7456 13615 16507 16071 5809 1753 1069 1639 4114 9 I 18 575 139 5250 2157 7232 12450 8859 6744 3728 1184 1209 977
10 I 13 75 104 1984 943 2464 2638 4827 3381 2025 995 642 439 --•+••-~•-@•--~~·----~-~~~b·~~-~~P•b~~-~-·~~-~a~~~-P~-~--~~~~~~~-~-~~~--p~$~--~--~P~--P--0~~~-kab.~.b~-~~~~
2+1 95016 1693 74 172784 236722 203395 240474 18::>98:!\ 189599 153::>89 194455 198328 155851 155194
MEAN WEIGHT OF INDIVIDUALS IN CATCH 12/ 6/80
I 1965 1966 1967 1968 1969 197::> 1971 1972 1973 1974 1975 1976 1977 ~-~+~-~-~~·~·--•-•P•~-~~~~~-~~~-P~~~~@~~~~~~~~~&~~~~PPU~W~~~~~p@~-~~~
I 0.18 0.23 0.25 0.17 0.22 0.25 0.23 0.16 0.18 0.22 0.21 0.25 0.26
FISHING MORTALITY 12/ 6/80
2 0. 095 0.032 o. 043 0.434 0.134 0.163 0.150 Cl. 042 0.109 ::>.167 Cl.119 0.120 3 0.031 0.170 o. 065 o. 094 0.415 0.149 o. 87 0.084 0.210 0.166 0.164
o. 221 0,089 0.222 o. 081 0.198 0.626 0.472 0.818 0.353 0.321 o. 242 o. 266 0.304
5 0 .. 175 0.509 0.239 0.430 ~L 294 0.597 550 0.761 o. 44'1 '), 289 ·). 340 0 •. 304 0.360 6 0.137 0.239 o. 541 0.247 0.308 0.374 o. 471 896 0,620 0.364 0,492 0.332 0.400 7 0.047 Cl. 269 o. 543 0.688 0.346 Cl.585 0.562 0.645 0.610 0,407 0.399 0.344 0.400 8 0.150 0.311 0.129 0.663 '). 361 0.406 0.569 0.651 :J. 509 :J. 332 o. 281 0,383 Cl.400 9 0.059 Cl.892 0.024 0.851 o. 261 0.689 0.775 o. 668 0,610 0.699 0.379 Cl.568 0.400
l:J 0.139 Cl.351 0.372 0.525 0.340 0.514 Cl.562 o. 773 o. 564 0.358 0.389 0.352 0.400 -~m+•~~--~-~p~~-b~~----~-~P*~®---~~~~~~~bP~~~~~~-b~~-~~-~-~~~P~~-·PPP~••P··~-~--pb
2+1 0.120 0.179 0.176 0.322 0.295 0.403 0.408 0.233 0.200 0.235 Cl.249 0.246 G.294
PARTIAL DE'RIVATIVES OF POPULATION WITH RESPECT TO PARAMETERS
SENSITIVITY TO TERMINAL F 12/ 6/80
1965 1966 1967 1968 1969 1970 1971 1972 1973 1974 1975 1976 1977 ---+~~---~~--~~-~~~~b~~~~~~=~?P~-~~~~~~~~~~~~~~~~~--~~--~~~~-~~-~~P~~~--~~~¢~~----~--~~~~~~-~~~
2 1 -:J.037 -::>,033 -0.013 -0.420 -0.467 -0.617 -0.818 -Cl.942 3 1 -a.os1 -o.os1 -0.253 -o.s2o -0.729 -:J.922 4 1 -0.038 -0.189 -0.476 -0.64-1 -0.860 s 1 -o.120 -0.420 -0.605 -0.836 6 1 -0.214 -0.357 -0.588 -Cl.819 71 .525 376 -0.819 8 1 -0.297 -0.353 -0.560 -0.819 9 1 .791 -0.576 -0.467 -0.819
10 1 .933 -0.824 .839-0.819

- 24 -
SENSITIVITY TO NATURAL MORTALITY 12/ 6/80
1965 1966 1967 1968 1969 1970 1971 1972 1973 1974 1975 1976 1977 -~-+~"~-~·~-~--P•P-~-~~p~~~~-P~P~-~-~----·~-~~~-~~-~-~~---··-P••••••••··~~~----~~-
2 0.750 0.933 o. 777 0.402 0.611 0.498 0.647 0.638 0.701 0.528 0.405 0.272 0.095 3 0.864 o. 616 0.761 0.607 0,370 0.485 0.369 0.572 0.526 0.527 0.378 0.262 o. 094 4 0,462 0.688 0.512 0.605 0.458 0.313 0.350 0.318 0.448 0.414 0.364 0.245 o. 092 5 0,539 0.352 0.543 0.416 0.448 0.337 0,308 0.306 o. 409 0.398 0.336 0.238 o. 091 6 0.566 0.423 0.326 0,465 0.389 0.370 0.339 0,268 0.355 0.387 0.300 0.234 0.090 7 0,557 0,434 0.312 0.294 0.368 0.296 0.295 0.288 0.331 0,382 0.317 0.232 0.090 8 0.331 0.379 0.339 0.271 0.298 0.282 0.260 0.250 o. 269 0.333 0,327 0.227 0.090 9 0.280 0.169 0.284 0.173 0.243 0.188 o. 177 o. 190 0.198 0.188 0.228 0.203 0.090
10 0.094 o. 091 o. 091 o. 088 o. 091 o. 088 0,087 0,084 o. 087 o. 091 o. 090 0.091 0.090
PARTIAL DERIVATIVES OF ESTIMATED F WITH RESPECT TO PARAMETERS ~~--~-~~---~---~--~-~~~~~~--~~--~--~~~-~--~P·-~-*~-~~----~-·~
SENSI'l'IVITY TO TE'RMINAL F 12/ 6/80
1965 1966 1967 1968 1969 1970 1971 1972 1973 1974 1975 1976 1977 ~--+~P--~~~~·F·~-~~~~~~~~~~~~p~~F••e~~~~--•·•~-·-~~-~----~~---·~~~~-~---·•••••P·~-
2 0.038 o. 060 0.033 0. 016 0. 030 0.045 0.147 0.235 0.428 0.492 0.670 0,868 1. 000 3 0.083 0.044 o. 063 o. 036 0.024 o. 035 0. 061 0.175 o. 277 0.456 o. 577 0.791 1. 000 4 0.043 o. 088 o. 053 o. 068 0.041 o. 040 0.048 0.114 o. 225 0.357 0.536 0.732 1. 000 5 0.130 0.061 0.103 0.074 o. 082 o. 062 o. 072 0.089 0.210 0.309 0.497 0.704 1.000 6 0.229 0.160 0.103 0.131 0.106 0.114 0.104 0. 148 0.174 0.314 0.457 0.694 1.000 7 0.537 0.280 0.237 0.191 0.176 0.166 0.182 0.182 0.308 0.288 0.459 0.690 1. 000 8 0.320 0.642 0.342 0.432 0.319 0.257 0.295 0.334 0.321 0.488 0.405 o. 677 1. 000 9 0.815 0.545 0.759 0.564 0.678 o. 541 0.466 0.545 0.622 o. 588 0.695 0.621 1. 000
10 1. 000 1. OOQ 1. 000 1. 000 1.000 1. 000 1. 000 1. 000 1. 000 1. 000 1.000 1. 000 1. 000
SENSITIVITY TO NATURAL MORTALITY 12/ 6/80
1965 1966 1967 1968 1969 1970 1971 1972 1973 1974 1975 1976 1977
-~-+------~-----------~-----p--~~~----------------~--------------------------------~~---------2 -0.686 -0.850 -o. 695 -0.388 -o. 551 -0.437 -o. 611 -0.585 -0.617 -0.457 -0.338 -0.187 Q,000 3 -0.779 -0.567-0.686 -0.536 -0.345 -0.421 -0.346 -0.513 -0.473 -0.449 -0.316 -0.182 o.ooo 4 -0.411 -0.619 -0.467 -o. 530 -0.401 -o. 311 -o. 331 0.356 -o. 425 -0.378 -0.306 -0.174 o.ooo 5 -0.484 -0.341 -o. 507 -o. 404 -0.412 -0.338 -0.290 -0.327 -o. 399 0.353 -0. 289 -0.170 o.ooo 6 -o. 503 -().371 -0.312 -0.420 -0.346 -0.336 -0.316 -0.294 -0.366 -0.355 -0.270 -0.168 o.ooo 7 -0.471 -0.390 -0.294 -0.296 -0.329 -o. 280 o. 275 -Q, 28') -o. 33 2 -D.357 -0.276 -0.168 D.OOO 8 -0.254 -0.335 -o. 260 -o. 259 -o. 248 -o. 235 -o. 229 -0.228 -o. 233 -0.285 -o. 210 -0.165 0.000 9 -0.189 -0.137 -0.189 -0.139 -0.172 -0.145 -0.138 -0.146 -0.152 -0.146 -0.166 -o. 154 0.000
10 0.000 ·). 000 0.000 o.ooo 0.000 Q,OOQ o. 000 o.ooo 0.000 o. 000 0. 000 o.ooo o.ooo
PARTIAL DERIVATIVES OF POPULATION NUMBERS FOR YOUNGEST AGE GROUP
SENSITIVITY TO INDIVIDUAL CATCH VALUES 12/ 6/80
1965 1966 1967 1968 1969 1970 1 0'71 ..l.;::;ll,l.
1 0'1:) .J. ::J I L 1973 197'1 1975 1976 1977
••~+••--~·~-~--~--~--~P·~~-~-P~----~------~~~-~----~----~------~----~--~----~---·• 2 0.091 0.032 o. 043 0.355 0.126 0,151 0.186 0.139 0.041 0.104 0.155 0.113 1. 000 3 0.031 0.143 o. 061 0.087 0.222 0.127 0.300 0.113 0.148 o. 077 0.170 '), 130 0.887 4 0.199 0.083 0.154 o. 071 0.157 o. 2Q1 Q, 284 0.313 0. 210 0.197 0.191 0.171 o. 717 5 0.161 0.323 0.190 0.216 0.214 0.325 0. 098 0.252 o. 089 0.125 0.151 0.183 0.557 6 0.128 0.180 0.204 0.154 0.107 0.196 0.149 0.079 Q.102 0.048 0.145 0.105 o. 511 7 0.046 0.207 0.280 0.142 o. 161 0.132 o. 186 0.118 0.025 Q. 040 o. 036 o. 066 o. 264 8 0.140 0.257 0. OBi o. 189 0.043 0.130 '), 072 0.118 0 .. 052 0 .. 008 0 .. 019 0.023 0.160 9 0.058 0.516 0.017 0.341 o. 046 o.oso 0.141 0.046 0.059 Q, 039 0.007 0.026 0.050
10 1.000 0.942 0.353 0.682 0.250 0.153 0. 049 0.119 0.047 o. 069 0.038 0.014 o. 033
OVERALL SENSITIVITY OF RECRUI'l'MEN'l' 12/ 6/80
I 1965 1966 1967 1968 1969 1970 1971 1972 1973 1974 1975 1976 1977 ---+·---~--~--p~~-----·----·~~-----~p~~-p----~--·~-·~~-~~----·~-~-~~~-~~~-
I 0.84 1. 01 0.89 0.63 0.75 0.69 0.77 0.80 1. 00 o. 94 1. 05 1. 24 1. 38
OVERALL SENSITIVITY INDEX: 0.921780309

- 25 -
4. Estimating the Coefficients of the Von Bertalanffy Growth Equation (VONB),
The function VONB estimates the coefficients of the Von Bertalanffy growth equation, as well as the corresponding variances, by using the Marquardt method (Ricker, 1975; Bard, 1974). Length-at-age data are the only data required for executing this function. But VONB can also be used to fit a Bertalanffy relationship to weight data.
Input Information.
The input information required by the function VONB consists of:
n the total number of observations;
length at age t,
Algorithm,
The Von Bertalanffy growth equation is a non-linear model of the form
± E: [ 4 .1]
where 100
, K and t 0 are the unknown parameters, In general, we refer to 1
00 as the 'mean
asymptotic length', to K as the 'Brody Growth Coefficient' and to t 0 as the 'hypothetical age at which the fish would have been zero length if it had always grown in the manner described by the equation' (see Ricker, 1975),
By using the Marquardt algorithm, we find the values of Loo, K and to which minimize the sum of squares of the residuals
2 s
The Marquardt process which coefficients, regression of as follows:
K
algorithm is an iterative requires initial estimates of the These are calculated from the Lt+l on Lt (slope b, constant a)
a I ( 1 - b ) [ 4. 2]
- ln (b) [ 4. 3]
t +l ln ( 1 - t [ 4.4] K 1
00
Variance estimates are calculated as
where
- 8 is the vector of parameters: [LooK t 0]; [a£t;as] is a 3 by n matrix representing the partial derivative of Lt (t=l, •.. , n) with respect to each parameter;
- v8 is a 3 by 3 matrix refered to as the variance-covariance matrix.
The correlation matrix of the estimated parameters is then calculated from the variancecovariance matrix.
An alternative formulation.
Equation [4,1] can be rewritten as
~ ( 1 _ e-K(t-to)) ± £
K [ 4 .s]
where w, K and t are the three unknowns to be estimated by usi&g the Marquardt algorithm. The estimates of w and K can be used to estimate 1 00 :
Loo w/K
Galluci and Quinn (1979) suggest that the new parameter w is more robust than either K or Loo. They recommend the use of parameter w as a means to compare statistically growth between regional stocks (see also Kingsley et al., 1980).
Output.
In order to monitor the convergence of the Marquardt algorithm, the following information is printed:(the user is refered to the Sharp APL reference manual for statistical functions if additional information is necessary)
A) the sum of squares and the eigenvalues of the moment matrix, as calculated by using the initial parameter estimates;
B) a message indicating \·lhich convergence criterion has been met: namely, the iteration is stopped if
-the relative change in each parameter is less than 0.00001,
-the relative change in the sum of squares is less than 0.00001,
-the total number of iterations exceeds 20;
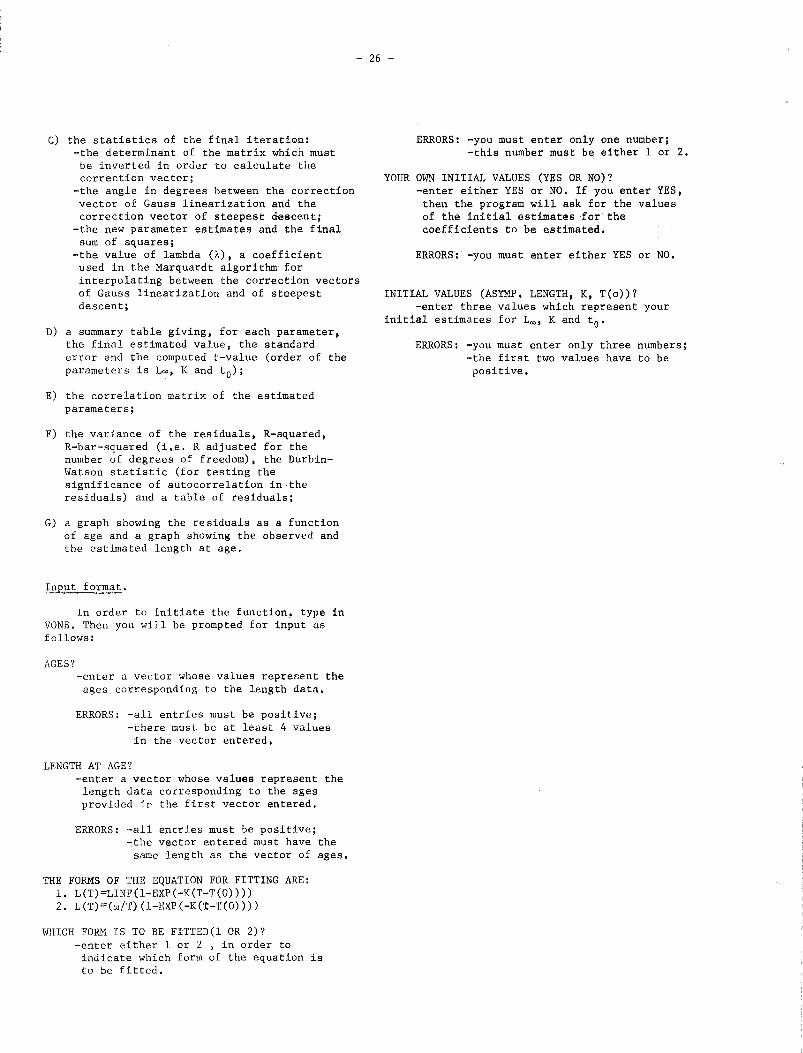
- 26 -
C) the statistics of the final iteration: -the determinant of the matrix which must
be inverted in order to calculate the correction vector;
-the angle in degrees between the correction vector of Gauss linearization and the correction vector of steepest descent;
-the new parameter estimates and the final sum of squares;
-the value of lambda (A), a coefficient used in the Marquardt algorithm for interpolating between the correction vectors of Gauss linearization and of steepest descent;
D) a summary table giving, for each parameter, the final estimated value, the standard error and the computed t-value (order of the parameters is Loo, K and t 0);
E) the correlation matrix of the estimated parameters;
F) the variance of the residuals, R-squared, R-bar-squared (i.e. R adjusted for the number of degrees of freedom), the DurbinWatson statistic (for testing the significance of autocorrelation in the residuals) and a table of residuals;
G) a graph showing the residuals as a function of age and a graph showing the observed and the estimated length at age.
Input format.
In order to initiate the function, type in VONB. Then you will be prompted for input as follows:
AGES? -enter a vector whose values represent the ages corresponding to the length data,
ERRORS: -all entries must be positive; -there must be at least 4 values in the vector entered,
LENGTH AT AGE? -enter a vector whose values represent the
length data corresponding to the ages provided in the first vector entered.
ERRORS: -all entries must be positive; ~the vector entered must have the
same length as the vector of ages,
THE FORMS OF THE EQUATION FOR FITTING ARE: 1. L(T)=LINF(l-EXP(-K(T-T(O)))) 2, L(T)=(w/T)(l-EXP(-K(T-T(O))))
WHICH FORM IS TO BE FITTED(l OR 2)? -enter either 1 or 2 , in order to indicate which form of the equation is to be fitted,
ERRORS: -you must enter only one number; -this number must be either 1 or 2.
YOUR OWN INITIAL VALUES (YES OR NO)? -enter either YES or NO. If you enter YES,
then the program will ask for the values of the initial estimates for the coefficients to be estimated.
ERRORS: -you must enter either YES or NO.
INITIAL VALUES (ASYMP, LENGTH, K, T(o))? -enter three values which represent your
initial estimates for 100 , K and t 0 •
ERRORS: -you must enter only three numbers; -the first two values have to be positive,

- 27 -
AN EXAMPLE,
FILEfiFETCH '2719067 PFfiVONB'
AGF:S 2 2 3 4 4 4 5 6 6 7 8 9 10 10 11 12 13 14 14 15 16 16
LENGTHS 0.77 0.81 1.52 2.3 2.36 2.32 3.01 3.65 3,81 4.51 5.37 6.65 7.19 7.3 7.75 7.13 8.12 7.82 7.9 9.42
9.82 9.7
AGE'S? [1:
VONB
AGES
LENGTH AT AGE? 0:
LENGTHS
THE FORMS OF THE EQUATION FOR PITTING ARE: 1. L(T)=LINF(l•EXP(•K(T•T(O)))) 2. L(T)=(w/T)(l•F:XP(•K(T•T(O)))
w'HICH FORM IS TO BF: FITTED( 1 OR 2 )? [!:
2
YOUR OWN INITIAL VALUES (YES OR NO) ? NO
VON BF:RTALANFFY PARAMETERS
ORDER OF PARAMETERS IS AS FOLLOw'S: 1. w 2. BRODY GRO~lTH COFFFICIENT 3, T( 0)
INITIAL PARAMETER VALUES 1. 000923 a. 06394 7 2. 035363
PRELIMINARY ANALYSIS
INITIAL SUM OF SQUARES 8. 2619663EQ
EIGFNVALUES OF MOMENT MATRIX 5.2788667£'1 3. 0846627EO 1. 8029452E4
13/ 6/80
ITERATION STOPS. RELATIVE CHANGE' IN E'ACH PARAMETER LESS THAN 0. 00001.
ITERATION NUMBER 2 DF1'ERMINANT ANGLE' IN SCALED COORDINATES NEil' PARAMETER ESTIMATES
1. 012151 o. 065994 1. 400601
NEW SUM OF SQUARES LAMBDA
(FINAL ITERATION) 1. 3125709E3 2. 92 DEGREES.
3.6909289EO 1.00000E1

- 28 -
APPROXIMATE STATISTICS FROM LINEAR THEORY
ESJ'. PAR.
1.012151 o. 065994 1. 400601
STD. ERR.
0.106946 0. 017923 o. 299104
T-VALUE
9.464095 3. 682011 4.682659
CORRELATION MATRIX OF THE F.STIMATED PARAMETERS 1.000000 0.978405 0.834029 0.978405 1.000000 0.753207 0.834029 0.753207 1.000000
VARIANCE OF RESIDUALS ••••••• R SQUARED ••....••••••..••..• R-EAR SQUARED .••••••••..•..• DURBIN•WATSON STA'I'ISTIC ••••.
OBSERVED Y ESTIMATED Y
o. 770000 o. 594840 0.810000 0.594840 1.520000 1. 536327 2.300000 2.417687 2.360000 2.417687 2.320000 2.417687 3. 010000 3.242761 3.650000 4.015143 3.810000 4. 015143 4.510000 4.738197 5.370000 5.415075 6.650000 6.048725 7.190000 6. 641908 7.300000 6.641908 7.750000 7.197209 7.130000 7.717045 8.120000 8.203684 7. 820000 8.659243 7.900000 8.659243 9.420000 9.085709 9.820000 9.484940 9.700000 9.484940
0.194259 0.980427 0.978366 1.070183
RESIDUALS
0.175160 0.215160
-0.016327 -o. 117687 -0.057687 -0.097687 -0.232761 -0.365143 -0.205143 -0.228197 -0.045075
0.601275 0.548092 0.658092 o. 552791
-0.587045 -0.083684 -0.839243 -0.759243
0.334291 0.335060 0.215060
ESTIMATF OF THF ASYMPTOTIC LENGTH IS: 15.337018

E X p E c T E D
M I N u s
0 B s E
1.50 +
1. 00 +
o. 50 +
I
I I •
- 29 -
RESIDUALS
o.oo +~---·~--.+···-·~~--+----.----+~---·--~-+--·-·----+
R -0.50 +
v E D
L E N G T H
-1.00 + o.o
9.82 +
7. 86 +
5.89 +
3. 93 +
1. 96 +
0
3.2 6.4 9.6 12.8 AGES
OBSERVED AND EXPEC~l'ED LENGTH A'l' AGE
Q
Q
Q
Q 0
0
Q
0
0
0 0
0
Q
16. 0
0
0
0
0.00 +·•--'---•+••·-·----+-~--··-~·+•---·~-·-+----'···-+ 0.0 3.2 6.4 9.6 12.8 16.0
AGES

- 30 -
5. Computation of Yield from a Given Recruitment (BEVHOL~
This program estimates the equilibrium yield by the method of Beverton and Holt. In other words, the program calculates population numbers and biomass, as well as catch numbers and weight from a given recruitment. The control parameters of the model are 1) the growth characteristics of the stock, 2) age of the recruits, 3) age at first capture and 4) maximum age attained. The program generates a table showing numbers and biomass of exploited population, catch numbers, catch biomass (yield) and the average weight for predetermined values of the instantaneous rate of fishing mortality. The program also calculates relative sensitivity coefficients of computed quantities with respect to certain parameters.
The input information required by the program consists of (the notation follows Gulland, 1969):
-M the instantaneous rate of natural mortality;
-t c
-t 0
age of the recruits (i.e. average age at which fish enter the "target" population);
age at first capture (tc ~ tR);
the hypothetical age at which the fish would have been zero weight if it had always grown according to the assumed Brody's relationship;
maximum age attained;
-W the average asymptotic weight of a fish;
-K the Brody growth coefficient.
Algorithm.
For predetermined values of the instantaneous rate of fishing mortality (F), the following calculations ·are performed by the method of Beverton and Holt (1957, see page 310):
Average numbers per recruit in the ~loited phase
-M(tc-tR) e ------F+M
Average biomas~ recruit for fish in the exploited phase:
[ ~) = -M(t -tR) e c W
00
3 -nK(tc-to) -(F+M+nK)(tL-tc) L un e (1-e ) X
n=O F + M + nK
where
Catch per recruit
[ f] = F N R
Average we~f fish caught:
W ( Y I R ) I ( Cl R )
Yield per recruit:
[ ~ } = F
Let A
B
c
D
t
t
B R
c
c
tL
tR
to
tc
F + M + nK
uo
ul
uz
u3
= 1
=-3
= 3
=-1
-1.
Then the value of F can be determined from the slope max
X
CFe-DC
D

- 31 -
Fmax is the value of F in X which ensures that X = 0, In practice, Fmax is found by the method of "false position" (Seber, 1973):
1) Find an initial value F~ax and calculate X with F = Fgax• In order to determine F~ax• the vector of calculated yields per recruit is searched for a maximum. The value of F which corresponds to the maximum yield per recruit is taken as the starting value for the iterative process.
2) Let F~ax = Fgax- 0,005 and calculate X(F~ax)'
3) For all i > 1, calculate
where
Fi-1 max
i-1 i-1 i-2 X(Fmax) ( Fmax - Fmax )
X(Fi-1) - X(Fi-2) max max
Exit the iterative process when
X(Fi ) max
Convergence is usually rapid and direct. However, the value of Fmax may become excessively large when the yield-per-recruit curve is nearly asymptotic. In that case, the iterative procedure will produce values of Fmax which exceed the computing capacity of the computer; in addition, convergence then becomes much slower. In order to avoid these problems, the iteration is aborted and a warning message is issued when Fmax is seen to take a value greater than 10 or when the number of iterations exceeds 30.
Determin~tion~~:
Similarly, Fo.l is the value of F which ensures that X' = 0.1 x SL, where SL is the value of the slope X at F = 0. The iterative procedure for the determination of Fo.l appears as:
1) Find an initial value Fg,l = 0.7 Fmax and calculate
0 X(FO.l) - (0.1 X SL)
If convergence is not achieved during the 0 estimation of Fmax• Fo,l is given the
arbitrary value 0.1 •
1 2) Let F0 •1
0 Fo.l - 0.005 and calculate
X(F 1 ) - (0.1 x SL)
0.1
3) For all i > 1, calculate
i i-1 i-1 FO.l FO.l - H
where
i-1 H
i-1 i-2 FO.l - FO.l
_ Q(Fi-2) 0.1
4) Exit the iterative process when
-6 ~ 1. 0 X 10
Sensitivity coefficients.
For each quantity computed in the yield per recruit analysis, sensitivity coefficients are calculated with respect to M, K, t 0, tR and t • All sensitivity coefficients are a~proximated by finite difference. For a given F-value, the sensitivity coefficients are evaluated by taking the partial derivative of (N/R), (BIR), W, (CIR) and (YIR) with respect to a chosen parameter, say 8, Therefore, the relative sensitivity coefficients are calculated as (assuming R = 1):
XNe e ;m I N <l8
XB 8 8 <lB I B ae
xc8
8 ac I c ae
xw8 e aw I w ()8
XY8 e ClY I Y ae
For each parameter 8 considered, a table of sensitivity coefficients is constructed. !ach r~w of that_table contains the value of XN8 , XB 8 , xc8 , xw
8 and XY8 for a given F.
The program also calculates the sensitivity of Fmax and Fo.l with respect to M; K, t 0 , tR and tc' That is,
(lFmax I ae ) X
<lF0•1 I ae
e I Fmax
e 1 F 0.1
where e is the chosen parameter.

Input format,
In order to initiate the program, type BEVHOLT. Then you will be prompted for input as follows:
NATURAL MORTALITY?
-enter a number representing the instantaneous rate of natural mortality (M).
ERRORS: -you must enter a single value; -the entry must be greater than zero.
ASYMPTOTIC WEIGHT? (GR)
-enter a number representing the asymptotic weight of a fish,
ERRORS: -you must enter a single value; -the entry must be greater than zero.
BRODY COEFFICIENT (PARAMETER K OF BRODY'S EQUATION?
-enter a value representing the Brody growth coefficient.
ERRORS: -you must enter a single value; -the entry must be a value between
0 and 1.
HYPOTHETICAL AGE AT WHICH THE FISH WOULD HAVE ZERO WEIGHT ACCORDING TO BRODY'S EQUATION?
-enter a value representing t0
•
ERRORS: -you must enter a single value.
AGE OF RECRUITMENT TO STOCK?
-enter a value representing the average age at which fish enter the "target" population.
ERRORS: -you must enter a single value; -the entry must be greater than zero.
AGE AT FIRST CAPTURE?
-enter a value representing the age at first capture (tc),
ERRORS: -you must enter a single value; -the entry must be greater than zero.
MAXIMUM AGE ATTAINED?
-enter a value representing the maximum age ( tL).
ERRORS: -you must enter a single value; -the entry must be greater than zero.
- 32 -
ENTER A VECTOR OF ZEROS AND/OR ONES TO INDICATE WITH RESPECT TO WHICH PARAMETERS THE SENSITIVITY COEFFICIENTS ARE TO BE CALCULATED:
NATURAL MORTALITY BRODY COEFFICIENT AGE AT ZERO WEIGHT AGE AT FIRST CAPTURE AGE OF RECRUITMENT
-enter a value of 1 to indicate that sensitivity coefficients are to be calculated with respect to this parameter. Enter a value of 0 to delete calculation of sensitivity coefficients.
ERRORS: -the entry must be a vector of dimension 5;
-all entries must be 0 or 1.
MAXIMUM FISHING MORTALITY IN OUTPUT TABLE?
-enter a positive value which indicates the maximum fishing mortality for which we want to perform the calculations, This value is used to control the amount of printing. Reasonable values for this entry range between 0.5 and 2.0 , A value smaller than 0.1 forces the program to find the value of FO.l and F~ax and to calculate the correspond~ng yield per recruit; this will yield the smallest amount of output. A value greater than 2.0 may generate a large amount of output when sensitivities are requested for all parameters.
ERRORS: -you must enter a single value; -the entry must be greater than zero
(the program will reset this entry to a value of 5.0 if a value greater than 5.0 is entered).
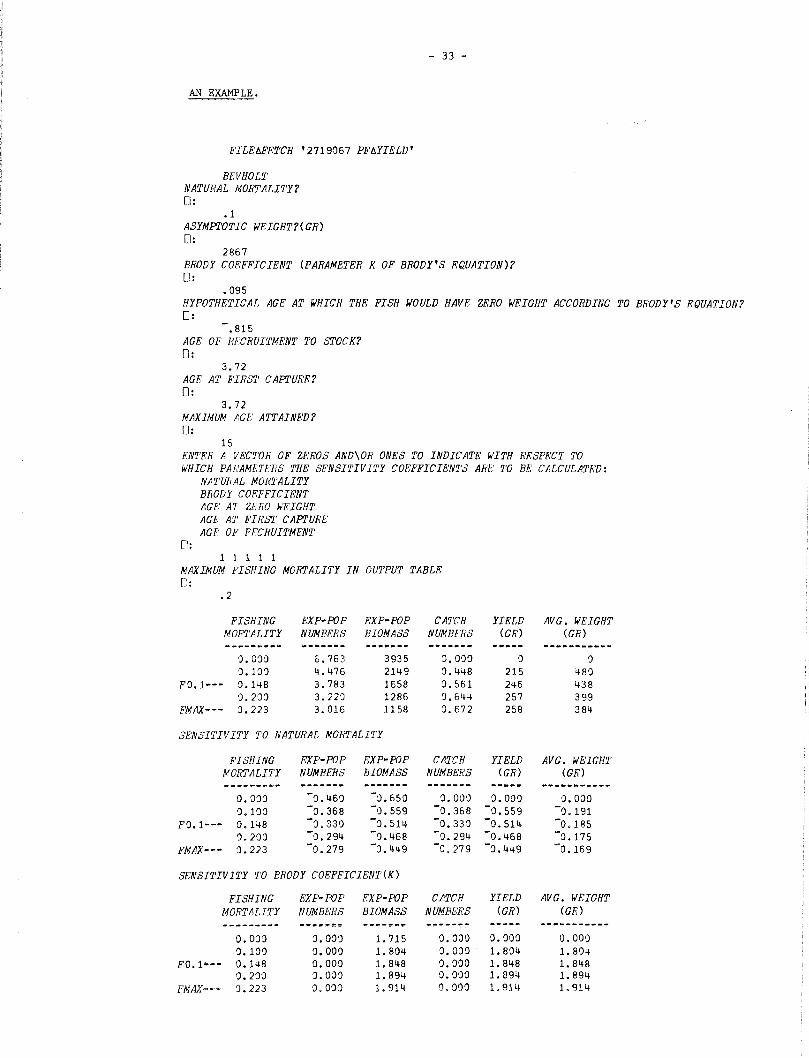
AN EXAMPLE.
FILE6FF.TCH '2719067 PF6YIELD'
BEVHOL'l' NATURAL MORTALITY? 0:
.1 ASYMPTOTIC WEIGHT?(GR) 0:
2867
- 33 -
BRODY COEFFICIENT (PARAMETER K OF BRODY'S EQUATION)? 0:
• 095 HYPOTHETICAl: AGE A'l' WHICH THE FISH WOULD HAVE ZERO WEIGHT ACCORDING TO BRODY'S EQUA'l'ION? lJ:
.815 AGE OF RFCRUI2'MENT TO STOCK? 0:
3. 72 AGE AT FIRS'l' CAPTURE? [J:
3.72 MAXIMUM AGE ATTAINED? 0:
15 ENTER A VECTOH OF ZF.'ROS AND\OR ONES TO INDICATE WITH RESPF.'CT TO w'HICH PAIIAMF:TF:RS THE SENSITIVITY COEFFICIEN'l'S ARE '1'0 BE CALCULATE'[):
[1:
NATURAL MORTALITY BRODY COEFFICIENT AGE A'I Zf:,'JiO wEIGHT AGE A'l' FIRST CAPTURE AGE OF RECRUITMENT
1 1 1 1 1 MAXIMUM FISHING MORTALITY IN OUTPUT TABLE [1:
• 2
FISHING E'XP•POP EXP·POP CATCH MOR'l'ALITY NUMBT\RS BIOMASS NUMBFRS ..................... ................ ................... ... ...........
o. 000 6.763 3935 o. 0•)0 0.100 4.476 2149 0.448
FO. 1·-· 0.148 3.783 1658 0.561 0.20') 3.220 1286 0.644
FMAX·-- o. 223 3.016 1158 0.672
SENSITIVITY TO NATURAL MOiffALITY
FISHING EXP-POP EXP•POP CATCH MORTALITY NUMBERS BIOMASS NUMBERS
---·----· ------· ................. -------0.0')') -0.460 -0.650 o.ooo 0.100 -0.368 -0.559 -0.368
F0.1•-• 0.148 -0.330 -0.511+ -0.330 -0.200 0.294 -0.468 -0.294 FMAX·-- 0.223 -0.279 -0.1+49 -o. 279
SENSITIVITY TO BRODY COEFFICIEN'l'(K)
FISHING EXP·POP EXP-POP CATCH MORTALITY NUMBERS BIOMASS NUMBERS
---------- ........ .,.,.~ .. ~ ----!" ... ~ -------0. 000 '). 00') 1.715 o. 000 0.100 o. 000 1. 804 o. 000
FO.l•-· 0.148 0.000 1. 848 o.ooo 0.200 0.00') 1.894 o.ooo
FMAX--~ 0.223 o. 00') 1.914 0.000
YIELD (CR)
0 215 246 257 258
YIELD (GR)
0.000 -0.559 -0.514 -0.468 -0.449
YIELD (GR)
o. 000 1. 804 1.848 1. 894 1.914
AVG. WEIGHT (GR)
0 480 438 399 384
AVG. WEIGHT (GR)
o.ooo -0.191 -0.185 -0.175 -0.169
AVG. WEIGHT (GR)
o. 000 1. 804 1. 848 1.894 1.914

- 34 -
SENSITIVITY TO AGE AT ZERO WEIGHT
FISHING EXP-POP EXP-POP CATCH YIELD AVG. WEIGHT MORTALITY NUMBERS BIOMASS NUMBERS (GR) (GR) _ ................... ...... ,.. .......... ,.. •-to>---- ..................... .. .......... _____ ,..
a.ooo (),000 -0.146 a.ooo o.oao o.oao a.10a a.ooo -0.170 o. 000 -0.170 -0.170
F0.1-~- a.148 a.ooo -0.182 0.000 -0.182 -0.182 0.200 0.000 -o. 196 o.ooo -0.196 -0.196
FMAX--~ a. 223 a. ooo -o.2a1 0.000 -0.201 -o. 201
SENdiTIVI'l'Y TO AGE A'l' FIRST CAPTURF:
FISHING EXP .. POP EXP-POP CATCH YIELD AVG. WEIGHT MORTALITY NUMBERS BIOMASS NUMBERS (GR) (GH)
---~- ... --- ............ ,.. ... ... ............... ................... ........................
o.ooo -a.55a -0.116 a.ooo o.oaa a.ooo 0.1aa -a.459 0.159 -a.459 0.159 a.618
FO. 1--- a.H8 -a. 432 0.276 -a.432 a.276 0. 7Q8 0.200 -a. 411 a.388 -a. 411 a.388 a.8aa
FMAX--- a. 223 -a.404 a.434 -o. 404 a.434 a.839
SENSITIVI'l'Y TO ACE OF RECRUITMENT
FISHING EiXP-POP EXPo POP CATCH YIELD AVG. WEIGHT MORTALITY NUMBERS BIOMASS NUMBE'RS (GR) (GR) ......................... ------- -----""- ------- ........... ____ ,.. __
0. O'JO ·). 37 2 a.372 0.000 a.ooa o.oao a. laO o. 372 a.372 '),372 0.372 o. 000
FO.l--- 0.148 0.372 0.372 0.372 0.372 o.ooo 0.2aa '). 37 2 a.372 a.372 0.372 o. O•JQ
FMAX--- a.223 0.372 a.372 0,372 ']. 372 a.oaa
SENSITIVITY OF FMAX AND Fa.1 TO PARAMETERS
PARAMETERS FMAX F0.1 .................... _ .. SENSITIVITY TO NATURAL MORTALITY 0.3265 0.0173 SENSITIVITY TO BRODY CO!!,'FFICIENT(K) a.3275 0.7684 SENSITIVITY TO AGE AT ZERO WRIGHT a.0993 -o.la94 SEN3I'l'IVI2'Y TO AGE AT FIRST CAP'l'UR/:.' a.75a3 0.5468 SENSITIVITY TO AGE OF RECRUITMEN'l' o.oaoa 0.1186

- 35 -
6. Computation of Yield from a Given Recruitment by the Method of Thompson and Bell (YIELD).
This program uses the Thompson and Bell's method to determine the yield for a single recruit at various levels of fishing mortality (ref. Ricker, 1975). The program generates a table showing catch numbers, yield (kg), average weight and a relative index of the yield per unit-effort. For these calculated quantities, the relative sensitivities are calculated with respect to input parameters.
The input information required by the program consists of:
b age of youngest age-group;
m age of oldest age-group;
w (i " b, ... , m) weight at age i, i kilograms;
in
r (i " b, ... , m) : a value, between 0 and i 1, which indicates the proportion of
fishing mortality which can be allocated to age group i (often referred to as "partial recruitment" to fishing mortality);
M (i " b, ... , m) : instantaneous rate of i natural mortality for age i.
Algorithm.
For predetermined values of instantaneous rate of fishing mortality (F,), the following calculations are performed by the method of Thompson and Bell:
Catch per recru~~ (in numbers):
c.
where
and
-z. ( 1 - e ~
also, the N. are calculated from the recursive r~lationship (by assuming that Nb = 1):
N i
N i-1
Yield per recruit (kg):
m Fi e-zi y I wi Ni- ( 1 -. i=b zi
where F i'
z i and Ni are defined as in c.
Avera_g~ weight Cks2 of fish caught:
w Y. I c.
Relative index of Yield per unit of effort:
I I MAX r y' (F) ]
F l F
where F takes the values of fishing mortality which appear in the output table.
Determination of Fmax:
F can be determined from the slope X " a(Y,)Ii)lf;l~ . So Fmax is the value of F. in X which ensures that X " 0. In practice, X is found by finite difference and Fmax is evaluated by the method of "false position" (Seber, 1973):
1) Find an initial value, F~ax• and calculate X 0 0
with F, " Fmqx • In order to determine F~ax~ the vector ot calculated yields per recru~t ~s searched for a maximum. The value of F which corresponds to the maximum yield per recruit is taken as the starting value for the iterative process.
l 0 l 2) Let Fmax" Fmax- 0.005 and calculate X(Fmax>·
3) For all i > 1, calculate
where
i-1 H
i-1 i-1 i-2 X(Fmax) C Fmax Fmax
Exit the iterative process when
-9 ~ 1.0 X 10

- 36 -
Then the final value F~ax is taken as the true value, Fmax'
When the yield-per-recruit curve is nearly asymptotic, the value of Fmax may become excessively large and convergence becomes much slower. In order to avoid memory overflow, the iterative process is aborted and a warning message is issued when Fmax is seen to take a value greater than 10 or when the number of iterations exceeds 30.
Determination of FO.l:
Similarly, F0 1 is the value of F in X which ensures that'X = 0.1 x SL, where SL is the slope a(Y.)/aF. at F. = 0. The iterative procedure for the determination of FO.l appears as:
0 l) find an initial value, FO.l
and calculate 0.7 Fmax•
0 X(FO.l) - (0.1 X SL)
If convergence to a final value is not a&hieved during the estimation of Fm
9x,
Fo.l is given the arbitrary value 0.1 ,
2) let
3) For all i >
where
i.-1 H
0 FO.l - 0.005 and calculate
1 X(FO.l) - (0.1 X SL)
1, calculate
i-1 FO.l
i-1 H
i-1 i-1 i-2 Q(Fo.1> (Fo.l - Fo.1>
Q(F~~i) - Q(F~~i)
Exit the iterative process when
i I Q (F ) I 1. 0 X 10-9
0.1 i
Then the final value FO.l is taken as the true value, FO.l .
Sensitivity coefficients.
Since input parameters (mortality, ,.,eightat-age,partial recruitment) are expressed as vectors, the relative sensitivities of calculated quantities are approximated from equation [6]. In other words, the sensitivities
are calculated from the response of the calculated quantities to small relative perturbations in each element of the input vector under consideration. This can be shown to be equivalent to the response obtained from a small relative perturbation of the mean of the input vector.
Input format.
In order to initiate the program, you have to type YIELD. Then you will be prompted for input as follows:
WEIGHT AT AGE? (KG)
-enter a vector of weights at age (Wi' i • ' m).
b, .•
ERRORS: -the values entered must be positive.
PARTIAL REC~UITMENT?
-enter the values ri (i = b, ••. , m) which indicate the proportion of fishing mortality which can be allocated to age-group i.
ERRORS: -the vector must have the same length as the vector of weights at age;
-the values entered must all be greater than or equal to zero and less than or equal to one.
NATURAL MORTALITY?
-enter either a single number (M) or a vector which cssigns a separate instantaneous rate of natural mortality (Mi' i = b, ..• , m) for each age-group i. When a single number is entered, the Mi are set equal to M for all i.
ERRORS: -the entry must either be a single number or a vector which has the same length as the vector of weights at age;
-all entries must be greater than zero.
SENSITIVITY COEFFICIENTS FOR THE FOLLOWING PARAMETERS:
NATURAL MORTALITY PARTIAL RECRUITMENT WEIGHT AT AGE
-enter a vector of zeros and/or ones, to indicate your choice of parameters for which the sensitivity coefficients are to be calculated.
ERRORS: -the vector must have exactly three elements;
-the values entered must be zeros or ones,
MAXIMUM FISHING MORTALITY IN OUTPUT TABLE?
-enter a positive value which indicates the maximum fishing mortality for which we want to perform the calculations. This value is used to control the amount of printing. Reasonable

values for this entry range between 0.5 and 2.0. A value smaller than 0.1 forces the program to find the value of F 1 and Fmax• and to calculate the correspon~lng yield per recruit; this will yield the smallest amount
- 37 -
of output. A value greater than 2.0 may generate a large amount of output when sensitivities are requested for all parameters.
ERRORS: -you must enter a single value; -the entry must be greater than
zero (the program will reset this entry to a value of 5.0 is a value greater than 5.0 is entered).

- 38 -
A AN EXAMPLE.
WG 0.766 1.017 1.727 2.512 3,287 3.994 4.806 5,607 6,481 8.046
PR 0.474 0.632 0.737 0.895 0,947 0,947 1 1 1 1
FILE~FETCH '2719067 PF~YIELD 1
YIELD WEIGHT AT AGE? (KG) 0:
we PARTIAL RECRUITMENT? 0:
PR NATURAL MORTALITY? 0:
• 2
SENSITIVITY COEFFICIENTS FOR THE FOLLOWING PARAMETERS: (ENTER A VECTOR OF ZEROS AND/OR ONES IN THIS ORDER)
NATURAL MORTALITY PARTIAL RPCRUITMENT WF:IGHT AT AGE
0: 0 1 0
MAXIMUM FISHING MO~lALITY IN OUTPUT TABLE 0:
0,8
YIELD PER RECRUIT ANALYSIS
FISHING CATCH YIELD AVG.WEIGHT YIELD PER MORTALITY (NUMBER) (KG) (KG) UNIT EFFORT ... -------- -------- ........................ --------·--0.1000 o. 253 o. 666 2.638 1.000 0.2000 0.402 o. 920 2.289 0.690
F0.1--- 0.2285 0.433 o. 954 2.203 0.627 0.3000 o. 497 1. 001 2.013 0,501
FMAX·-· 0.3751 0.549 1. 013 1.846 0.405 0.4000 0.563 1. 012 1.797 0,380 0.5000 c. 611 0.995 1.629 0.299 0.6000 0.648 0.970 1.497 0.243 0.7000 0.678 0.944 1. 392 0.202 0.8000 c. 703 0.919 1. 308 0.172
SENSITIVITY TO PARTIAL RECRUITMENT
FISHING CATCH YIELD AVG. WEIGHT YIELD PER MORTALITY (NUMBER) (KG) (KG) UNIT EFFORT
-----~---................ p ............ ....................... . .......................
0.1000 0.750 0.603 -0.147 o.ooo 0.2000 c. 581 0.310 -o. 271 -o. 293
F0.1-·• 0. 2285 C.545 o. 243 -0.301 -o. 359 0.3000 0.469 0.106 -o. 363 -0.496
FMAX·-- 0.3751 0.410 0.000 ~0.410 -0.603 0.4000 c. 394 -0.028 -0.422 -o. 631 0.5000 0.342 -0.113 -0.455 -o. 715 0.6000 0.305 -0.164 -o. 469 -0.767 0.7000 o. 277 -0.194 -0.471 -o. 796 0,8000 0.255 -0.209 -0.464 -o. 812
SENSITIVITY OF FMAX AND F0.1 TO PARAMETERS.
PARAMETERS FMAX .... _ ...................... .... F0.1 ..........
SENSITIVITY TO PARTIAL RECRUITMENT -0.9990 -o. 9988

- 39 -
7. Calculation of total mortality by Paloheimo's method (PALOHEIMO).
The function PALOHEIMO provides est:i.mates of the instantaneous rate of total mortality (Z) by using the method of Paloheimo (Ricker, 1975). An estimate of the catchability coefficient (q) and an estimate of the instantaneous rate of natural mortality (M) are calculated by regressing Z against f, the fishing effort.
Input Information.
The input information required by the function PALOHEIMO consists of:
t 0
b
m
u \ , T
the first year represented in the CPUE matrix;
final year represented in the CPUE matrix;
age of the youngest age-group in the CPUE matrix;
age of the oldest age-group in the CPUE matrix;
(i = b, ... , m; t = t0
, ... , tf) a matrix (time- and age-specific) of catch per unit of effort (CPUE);
f T
t t 0 , ••• , tf ) : a vector whose values represent annual estimates of fishing effort for the period covered by the CPUE matrix.
_Algorithm.
This function approximates the mean of the instantaneous mortality rates for a cohort in two consecutive years from the relationship
z - ln ( lJ I U ) l+l,T+l <,T
An overall estimate of mortality for the period T,T+l is calculated as
z T,T+l
Finally, the mean effort for the period~,T+D is given by
f T,T+l
and the regression of z~,T_+l against f will ' T,T+l
provide an estimate of the instantaneous rate of natural mortality (M) and an estimate of the catchability coefficient (q). The regression model appears as
z T0T+l
where M is the regression constant and where q appears as the slope of the regression line. Note that M and q are assumed to be constant over the whole period covered by the data.
Input Format.
In order to initiate the function, type in PALOHEIMO. Then you will be prompted for input as follows: [note that the matrix of age- and time-specific CPUE must be previously created before entering the function]
ENTER NAME OF CPUE MATRIX FOR RESEARCH VESSELS (NUM/TOW)?
-enter the name of the CPUE matrix.
ERRORS: -the name entered must represent an APL variable.
ENTER FIRST YEAR AND YOUNGEST AGE-GROUP?
-enter two numbers representing the first year and the youngest age-group represented in the CPUE matrix.
ERRORS: -you must enter exactly two numbers; -the two values entered must be non-negative integers.
REGRESSION WITH AN INDEX OF FISHING EFFORT DESIRED?(YES OR NO)
-enter either YES or NO in order to indicate if the regression of Z against fishing effort is to be performed.
ERRORS: -you must enter either YES or NO.
ENTER VALUES OF FISHING EFFORT?
-if the answer to the preceding prompt is YES, enter a vector whose values represent annual estimates of fishing effort for the period covered by the CPUE matrix.

ERRORS: -the dimensions of the vector must be equal to the dimensions of each row of the CPUE matrix;
-each entry must be greater than zero.
Graphical Output.
The function PALOHEIMO g~nerates_a graph showing the observed points (Z 1 f )
T,T+ ' T T+l and two points of the regression line (~he regression line is obtained by tracing a straight line through these two points).
- 40-
AN EXAMPLE
FILE~FETCH '2719067 PF~PALOHEIM'
MAT 0.45 0. 513 o. 59 '), 563 o. 546 o. 22 o. 27 0.326 0.363 0.342 0.125 ·J. 125 0.127 ').146 0.159 0.05 o. 057 0.052 0.051 0.057 o. 027 o. 024 •). 012 0.019 0.017 0.009 0.011 0. 009 o. 008 0.006
PALOH/<.'IMO F:NTF:R NAMF: OF CPU MATRIX FOR RFSE'ARCH VFSSE'LS(NUM/'I'OW) MAT F:NTE'R FIRST YF:AR AND YOUNGFSF AGF: GROUP r;.
1975 3
ESTIMATES OF TOTAL MOR'l'ALI'l'IF:S(Z) 13/ 6/80
1975 1976 1977 1978
~--+·~-~~h--~-~~~~---~-··-~----3 o. 511 0.453 0.486 0.498 4 o. 565 0.754 0.803 0.825 5 0.785 o. 877 0.912 0. 941 6 0.734 1. 558 1. 007 1. 099 7 0.898 :J. 981 0.405 1. 153
-~-+-~---~-----~~---~----------3+1 0.699 0.925 0.723 0.903
REGRF:SSION WITH AN INDEX OF FISHING EFFORT DE'SIRED(YES OR NO)? YF:S ENTER VALUES OF FISHING EFFORT 0:
350 432 440 560 THERF: MUS1' BE 5 VALUF:S ALL NON-NEGATIVE. RE•F.NTER
0: 350 432 440 450 590
WAS ANOVA I.'AS CORRELA'l'ION ALIGN PAPFR

MEAN OF DEPF:NDENT VARIABLE'
VARIABLE CONSTAN'I' TERM
1
MEAN
448.00000
- 41 -
0.81232
ESTIMATED COEFFICIEN'l' 0.18937 0.00139
MULTIPLE CORREDATION COEFFICIENT (R*2) •••••••••••• CORREC'I'ED R*2 (R*2) •••••••••••••••••••••••••••••••
STD. ERROR 0.54595 0.00121
0.3968456421 0.0952684631 1.3159007701 0.1123210365 3.1129800356
F-STATISTIC FOR-SIGNIFICANCE OF REGRESSION( 1, 2) STANDARD ERROR OF 'l'HE' ESTIMATE: •••••••••••••••••••• DURBIN'*WATSON STATISTIC ••••••••••••••••••••••••••• COEFFICIENT OF VARIATION (AT THE MEAN OF Y) •• ( o jo) 13.8271684155
0.94 +
0.75 +
z o. 56 + N E' A N
0.38 +
I I I I
o. 19 .v I I I I
0.00 +•--~'·---+·--~·----+---·'·---+-•·-'---~+·---'----+ 0.0 108.0 216.0 324.0 432.0 540.0
FISHING EFFORT
T-V AWE 0.34686 1.14713

- 42 -
8. Estimating Survivors in the current year (SURVIVOR)
In this section, we introduce a new method for estimating survivors in the current year (W.G. Doubleday, pers. comm.). The method combines catch-at-age information and a research vessel abundance index-at-age, and produces estimates of survivors-at-age in the current year, as well as variance estimates. In input, this iterative method requires an initial estimate of survivors for the last year and for the oldest age-group, an estimate of natural mortality and a matrix of catch-at-age for all years considered. Convergence to final estimates of survivors is generally direct and rapid.
In practice, our estimation is derived from a comparison between mid-year estimates obtained from research vessels and mid-year population numbers calculated from a VPA formula. Underlying assumptions specify that 1) catch is taken uniformly during the year, 2) that the research vessel abundance index is a mid-year estimate and that 3) the instantaneous rate of natural mortality is a 'known' constant which can be applied to all years and all agegroups of the catch matrix. The survivor estimates are end-of-year estimates. In order to 'tune' the research vessel abundance index with the VPA population numbers, we need to define calibration constants which have to be estimated within a pre-defined calibration block,
l~~t Information. The input information required by the
function SURVIVOR consists of
b
Ill
c 1, T
first year represented in the catch matrix;
final year represented in the catch matrix;
final year of the calibration block;
age of the youngest age-group in the catch matrix;
age of the oldest age-group in the catch matrix;
age at which fish are fully recruited to both commercial exploitation and research surveys;
age of the oldest age-group in the calibration block (note that il.;; i2);
(i b, ... ,m; t = t 0 , ••• ,tf) catch between time t and t+l and for age-group i,i+l. Note that T refers to the period t,t+l, while 1 refers to age-group i,i+l.
instantaneous rate of natural mortality.
A · (i = b, ... ,m; t = t 0 , ... ,tf) i+,S,t+.S' research vessel abundance index-
at-age;
so m,t (t = t 0 , ••• ,te) an initial
of survivors 1n population oldest age-groups;
estimate for the
(i = b, .•• ,m) an initial estimate of survivors in population for each age-groups in the final year.
Algorithm. From the initial estimates of survivors i•1
the population, we calculate a series of calibration constants which are used to generate successive estimates of survivors in the population. For each iteration, the following calculations are performed:(superscripts refer to the lTh iterative step)
l)Calibration of the survey index: A mid-year population estimate can be
derived from the survey index as follows:
Nl i+.S,t+.S
[ 8.1]
The ki+.S are calibration constants (one value for each age-group between band i 1). From [8.1], we derive the following expression for the estimation of the calibration constant ki+.S:
l l
ln ki+.S L ln(Nl·+ 5 t+ s)-ln(Ai+ 5 t+ s) . ' . . ' . , [8. 2]
(t 1 -t 0 +1)
where the summation is taken from t = t 0 to t= t 1 •
For i 1,i,i2! we calculate a single calibration constant, k , from the formula
i 2 t1 l ~1 ~oln(Ni+.S,t+,S)-ln(Ai+.S,t+,S). [s.~
(t 1-t 0+1) (i2-i 1+1)
The logarithmic transformation is necessary, both for r 8. 21 and r 8. 3l ' in order to eliminate the infl~enc~ of the ~rder of magnitude for the survey index-at-age.
In order to estimate mid-year estimates of the at-age. These are derived relationship
k. and k, we need 1+.5 population numbers-from the iterative
l Ni+.S,t+.S
£ CINTi+.S,t+.5+SINTi+.S,t+.5 [s. 4]

\vhere CINT and
CINTi+. 5 ,t+, 5
or
CINT, l+.S,t+.S
and
or
f SINT
i+.S,t+.S
('_ SINT. 5 + S l+. ,t .
SINT are calculated as
tf-t . ( ) (eM(J+.5)_eM j-.5 ) _cl+j,T+j
j=l M
+ c l,T
f (m-i+.5)M 5m, t+m-i_ e
2)Estimating survivors in the final year and for the oldest age-groups in each year:
Prom the estimated ki+.S and k, we estimate a weighted average of the survivors in the final year from the relationship
where (let j ~ i)
f (kj+.5 Aj+.5,tf-i+j+.5
e -M(i-j+.5)
and
The si,t ,j are independent estimates of the survivors in the final year, for age-group i, The number of estimates which can be evaluated is equal to the length of the cohort. Variances for successive estimates of survivors are estimated as
- 43 -
when j < i 1 and as
f Var s. t .
l, f•J
Hhen j ;.
f RMS
i1
• The quantity RMS is evaluated as
i t [N~ -k~ xA. s] 2 L2 ~] l+.S;t+.S l+.S l+.S,t+.
i=b t-to i+.S,t+.S
Finally, the pooled variances of the estimated survivors for the current year are calculated as
[ t )-1 L 1/Var s'. t . j l, f.J
Similar formulae have been developed in order to estimate the survivors for the oldest agegroups. That is
where
x e-M(m-j+,S) (j~m)
and
t w . m, t,J
f_ -1 m t -1 (Var S .) I L(Var S )
m,t,J g=b m,t,g
The Sm t j are independent estimates of the surviv6r~ for the oldest age-group in each year t. Variances for successive estimates of survivors are estimated as

(k,f_ A / RMS.t j+.S j+.5,t-m+j+,5
when j < i 1 and as
Var Sf . m, t,J (k.t 2 l
. 5 A. 5 . 5 ) RMS J+. J+, ,t-m+J+,
when j > i 1 • Finally, the pooled variances of the estimated survivors for the oldest agegroups are calculated as
' s~l )-1 1.. 1 I Var m, t,j
3) Iterations ( l = 0, 1, ... ) : Steps l) and 2) are repeated in an
iterative manner in order to produce successive estimates of ki+.5• k, si,tf and sm,t' as well as estimates of the corresponding variances, Convergence is considered to be achieved when
s~ - s~-l I ~. t . 1., t
s~ l,t
~ 0.001
for each age-group in the final year (t ) and for each age-group m in the different f years t considered,
The iterative process can also be stopped when the total number of iterations exceeds a given value (provided in input).
4) Final iteration.
- 44 -
~ the end of the iterative process, the following information can be printed in a matrix form:
the integrated survivors: SINTi+.5,t+.5 the population numbers: Ni+.5.t+,5 the estimated survivors: Si,tf,j and Sm,t,j the estimated variance of
survivors: Var Si,tf,j and Var sm,t,.i
The weighted estimates (time-specific) of survivors for the last age-groups and the weighted estimates (age-specific) of survivors for the last year are also printed, as well as their corresponding variance, The final estimates of K. 5 (ag~-specific) are finally printed,
~+.
along with their corresponding variances, standard errors and degrees of freedom, In addition, the matrix of residuals (ei,t i=b, ... ,m; t= t 0 , ... , tf) is calculated as
ln (Ki+.5 Ai+.5,t+.5 ) - ln Ni+.5,t+.5 '
b~l-.Y.?}_!? __ o_f va.riance. In order to identify the presence of
systematic errors in the residuals (like the errors related to age-effects, year-effects and year-class effects), an analysis of variance is performed in the following manner:
1) Calculation of the sum-of-squares of residuals:
sss I I ef,t i t
2) Calculation of the sum-of-squares of residuals (RES) for a regression which considers that the ei t come from a model showing a yeareffect, an ~ge-effect and a year-class effect. The regression model has the form
\1 + a1 year.l + .•• +ax year.x
+ b1 age.l + •.• +by age.y
+ c1 year-class.l + ... +
c year-class.z ± E z
where year.l, •.. , year.x, age.l, ... , age.y, year-class.l, ... , year-class.z are dummy variables taking the value of 0 or 1. Note that this model has more parameters to estimate than there are independent normal equations. This model is modified, in practice, so as to remove the singularity problems which will arise in an attempt to estimate the coefficients of the above-mentionned model. The sum-ofsquares due to this regression is refered to as SS in the following text.
3) Calculat:i.on of the sum-of-squares (SS2) due to regression for a regression model which considers that the ei t come from a model showing only a year-effect and a year-class effect.
4) Calculation of the sum-of-squares (SSl) due to regression for a regression model wh:l.ch considers that the ei t come from a model showing only a year-effect. The mean-square error is calculated as
MSl SSl I ( x-1

- 45 -
Source of variation Sum of squares degrees of Mean square F value freedom
Constant Cf:ei,t)2/ r 1
Age SS4 X - 1 MS4 MS4/MSR
Year SSl y - 1 MSl MSl/MSR
Year-class SS3 z - 1 MS3 HS3/MSR
Residuals RES s** MSR = RES/s
Total sss r*
* **
number of residuals in the initial matrix r - x - y - z + 2
Table 5.1 • Analysis of variance for testing the presence of systematic errors in the residuals.
5) The sum-of-squares due to a year-class effect is calculated as
SS3 SS2 - SSl
The corresponding mean-square error is then calculated as
MS3 SS3 I (z-1)
6) The sum-of-squares due to an age-effect is calculated as
SS4 SS - SS2
while the corresponding mean-square error has the form
HS4 SS4 I (y-1)
Then the table of analysis of variance is constructed as shown in Table 5.1 .
_Input Format. In order to initiate the function, type in
SURVIVOR. Then you will be prompted for input as follows: [note that a catch matrix (C
1 T:
i b, •.• , m; t = t 0 , ••• , tf) and a malrix of 'research vessel abundance index' (Ai+.S,t+. 5 : i = b, ... , m; t = t 0 , •.. , tf) must be previously created before starting the program J
FIRST YEAR AND YOUNGEST AGE-GROUP?
-enter two numbers representing the first year and the youngest age-group in the catch matrix.
ERRORS: -you must enter exactly two numbers; -these values must be non-negative integers.
FINAL YEAR AND OLDEST AGE-GROUP IN CALIBRATION BLOCK??
-enter two numbers representing the final year and the oldest age-group of the calibration block.
ERRORS: -you must enter exactly two numbers; -these two values must be, respectively, greater than the two values entered in the preceding prompt.
AGE AT WHICH K SHOULD LEVEL OFF?
-enter a single value representing the age at which fish are fully recruited to both commercial exploitation and research surveys.
ERRORS: -you must enter one number which is greater than the value representing the youngest age-group, but smaller than or equal to the value of the oldest age-group in the calibration block.

- 46 -
N"AME OF RESEARCH VESSEL ABUNDANCE MATRIX?
-enter the name of the matrix tabulating the research vessel abundance-index.
ERRORS: -the name entered must correspond to an APL variable;
-the variable must be a matrix; -there should not be negative values in the matrix.
NAME OF CATCH MATRIX?
-enter the name of the catch matrix.
ERRORS: -the name entered must correspond to an APL variable;
-the variable must be a matrix; -there should not be negative values in the matrix;
-the dimensions of this matrix must be equal to the dimensions of the 'research vessel abundance' matrix.
SURVIVORS IN POPULATION FOR LAST YEAR?
-enter a vector representing initial estimates of survivors in population for each age-groups in the last year.
ERRORS: -the vector should have the same dimensions as the dimensions of each column of the catch matrix;
-each value entered must be positive.
SURVIVORS IN POPULATION FOR OLDEST AGE-GROUPS?
-enter a vector representing initial estimates of survivors in population for the oldest age-group in each year.
ERRORS: -the vector should have the same dimension as the dimension of each row of the catch matrix;
-each value entered must be positive.
NATURAL MORTALITY?
-enter a single value representing the instantaneous rate of natural mortality for each age-group i.
ERRORS: -you must enter only one number; -the natural mortali.ty must be equal
to or greater than zero,
MAXIMUM NUMBER OF ITERATIONS?
-enter a number representing the maximum number of iterations to be allowed in the current run.
ERRORS: -you must enter only one number; -the value entered must be greater
than zero.
ENTER 1 IF MATRIX IS TO BE PRINTED. OTHERWISE ENTER O. ONE NUMBER IS REQUIRED IN VECTOR FOR EACH MATRIX:
INTEGRATED CATCH INTEGRATED SURVIVORS ESTIMATED SURVIVORS ESTIMATED VARIANCE OF SURVIVORS WEIGHTED SURVIVORS OUTLIERS OF RESIDUALS
-enter a vector of O's and/or l's in order to indicate which matrices are to be printed.
ERRORS: -you must enter a vector containing only O's and/or l's;
-the input vector must have six entries.
ANALYSIS OF VARIANCE TO BE PERFORMED (YES OR NO)?
-enter either 'YES' or 'NO', in order to indicate if the analysis of variance is to be performed on the residuals.
ERRORS: -you must enter either 'YES' or 'NO'.

- 47 -
FTLEI'IFETCH '2719067 PFI'ISURVIVOR'
RESEARCH VESSEL ABUNDANCE INDRX 8/ 1/80
1965 1966 1967 1968 1969 1970 1971 1972 1973 1974 1975 1976
-~-+--~--~-~$p·-~-~~-----~~·p~--~~-k~~~-~~~~-$-~~-p·--~-----·~-----~-·------·-·--·------2 47188 27436 20061 35263 9443 10968 13220 93968 3 21477 28398 19193 14992 11476 5945 8530 9107 4 15110 12437 17190 11707 9562 7072 3122 2537 5 4122 9073 6438 10160 7088 466!~ 2918 1440 6 765 2055 3359 4268 4087 3682 2097 1122 7 278 637 1171 2008 2617 2418 2093 924 B 94 152 379 644 1402 1382 1085 889 9 9 60 106 234 362 774 742 507
10 0 6 44 60 120 228 408 515
CATCH MATRIX
1965 1966 1967 1968 1969 1970
2 210796 43630 47948 751706 70536 106916 3 26450 270068 68430 79933 384467 58166 4 232147 58591 238394 65107 118960 285361 5 49752 308775 109814 274518 160723 201097 6 10592 45479 159203 72827 110852 120223 7 1693 13970 5791+8 90617 62506 111911 8 561 7722 4497 31977 22595 41257 9 54 1690 409 15441 63!+5 21271
10 37 215 296 5668 2693 7039
SURVIVOR FIRST YEAR AND YOUNGEST AGE GROUP? 0:
1965 2 FIN AI: YF:AR AND OLDEST AGE GROUP IN CALIBRATION BLOCK D:
1970 8 AGF AT WHICH K SHOULD LEVEL OFF [1:
6 NAMF: OF RFSF:ARCH VESSF:L ABUNDANCE\ MATRIX RV!JMAT NAME OF CATCH MATRIX? CATM SURVIVORS IN FOPULATION FOR LAST YEAR? 0:
1971
144167 173662 106170 113561
75593 93620 50022 36618
7536
70000 400000 50000 200000 20000 4000 1500 5000 SURVIVORS IN FOR OW!-:ST AGE GROUP? [1:
14709 54558
4211 1203
419 566 369 339 287
1972
649254 71984
148516 77207 75384 49065 48700 26055 13792
1 100 1500 1000 4000 7000 15000 15000 10000 7000 3000 5000 NATURAL MORTALITY 0:
0.2 MAXIMUM NUMB8'R OF nERA'l'IONS? 0:
10 RNTEli 1 IF MATRIX IS TO BE PRINTED. OTHERWISF ENTER 0. ONF: NUMBER IS RP:QUIRED IN VFXTOR FOR EACH MATRIX INTEGRATED CATCH INTF:G RATED SURVIVORS F:STIMATED SURVIVORS F:STIMATED VARIANCE OF SURVIVORS WEIGHTED SURVIVORS Oif.FDIFRS OF RE'SIDUALS
0 0 1 1 1 1 ANALYSIS OF VARIANCE' TO BE PERFORMED(YE'S OR NO)? YES
18790 30595 3450 8503 12318 17053
27082 6145 6985 2534 13822 3351
435 1252 6592 181 248 630 302 116 128 228 192 58 190 95 122
1973 1974 1975
29656 118301 235590 562616 45600 158941 109530 616206 92356
34422 53199 384646 25562 15254 50599 19361 8120 9357 17604 5313 3238 19836 10964 3481
9661 5787 2842
8/ 1/80
1976
19922 161637 130597
72334 219788
18960 4967 3556 1835

- 48 -
ITERATION 1 RMS=0.02475074238 ojo CHANGE IN SURVIVORS=110.5401764
AGE SURVIVORS K -2 152952 52:-04
3 874298 59.06 4 343942 64.79 5 183048 71.45 6 400943 80.73 7 36735 80.73 8 6799 80.73 9 2151 80.73
10 8243 80.73
ITERATION 2 RMS=0.01432995738 0/0 CHANGE IN SURVIVORS=10.54317433
AGE SURVIVORS K -2 154728 52:-61
3 888078 59.96 4 35277'-1 66.45 5 189644 74.07 6 442160 89.07 7 41781 89.07 8 8065 89.07 9 2751 89.07
10 9515 89.07
ITERATION 3 RMS=0.01308929534 ojo CHANGE IN SURVIVORS=4.625389576
ACF: SURVIVORS K -2 155752 52:-93
3 896123 60.50 4 357508 67.28 5 193144 75.43 6 462675 93.30 7 J.f4322 93.30 8 8708 93.30 9 3064 93.30
10 10164 93.30
ITERATION 4 RMS=0.01264046776 o;o CHANGE IN SURVIVORS=2.25145645
ACE SURVIVORS K
2 156278 53.10 3 900255 60.77 4 359943 67.71 5 194943 76.14 6 473222 95.52 7 45640 95.52 8 9047 95.52 9 3228 95.52
10 10505 95.52
ITERATION 5 RMS=0.01244700991 o;o CHANGE IN SURVIVORS=1.140071357
AGE SURVIVORS K -2 156555 53:-19
3 902424 60.91 4 361220 67.94 5 195885 76.50 6 478702 96.68 7 46327 96.68 8 9227 96.68 9 3314 96.68
10 10683 96.68

- 49 -
ITF:RATION 6 J?"'S=0.0123564317 ojo CHANGE IN SURVIVORS=0.58528B7504
AGE SURVIVORS !(
2 156700 53:-24 3 903560 60.99 4 361888 68.05 5 196378 76.70 6 481557 97.28 7 46686 97.28 8 9320 97.28 9 3359 97.28
10 10776 97.28
ITF.'RATION 7 RMS=0.01231187254 0/0 CHANGE IN SURVIVORS=0.3028787829
AGF: SURVIVORS K -2 156775 53.26
3 904154 61.03 4 362238 68.12 5 196636 76.80 6 483045 97.60 7 46873 97.60 8 9369 97.60 9 3383 97.60
10 10824 97.60
ITERATION 8 RMS=0.01228934311 o;o CHANGE IN SURVIVORS=0.1573808265
AGF SURVIVORS K 2 156815 53-:27 3 904464 61.05 4 362420 68.15 5 196770 76.85 6 483 822 97.77 7 46971 97.77 8 9395 97.77 9 3395 97.77
10 10850 97.77
ITFRATION 9 RMS=0.01227778083 ojo CHANGF IN SURVIVORS=0.08195092202
AGF: SURVIVORS K 2 156836 53-:28 3 904626 61.06 4 362515 68,16 5 196840 76.88 6 484227 97,85 7 47021 97,85 8 9408 97.85 9 3401 97.85
10 10863 97.85
FINAL ITERATION (10)
POPULATION NUMBERS 8/ 1/80
1965 1966 1967 1968 1969 1970 1971 1972 1973 1974 1975
2 2235287 1338938 1114582 1811383 527370 663964 730330 4333552 737801 1049503 1542756 3 970945 1650084 1068392 865410 983920 373730 414946 501624 3000787 569595 732702 4 1169136 755676 1121271 814285 617521 504261 230425 194296 327588 1921413 402769 5 309929 71031+2 541219 684763 562176 358683 235963 106210 78756 195737 1124803 6 84913 210689 372890 361182 389703 333870 171118 108430 41554 42402 113276 7 25975 58313 125345 193637 234615 218087 177044 84208 47107 19153 23697 8 8857 16863 39589 62460 108772 145545 106572 81473 39443 27704 10645 9 884 6206 10287 23129 34352 69206 83977 53320 36299 19498 18739
10 24 598 4212 5549 11007 22044 43918 46427 27841 18426 9891

- 50 -
1976
l!.&.ho+-------·· 2 183806 3 1084763 4 469316 5 255579 6 650730 7 61937 8 13009 9 5629
10 12970
ESTIMATED SURVIVORS 8/ 1/80
1965 1966 1967 1968 1969 1970 1971 1972 1973 1974 1975 1976
2 I 71581 36384 0 23210 0 0 38389 758027 219664 333214 969406 156847 3 I 111424 39338 37036 18768 0 485 44669 69169 648476 166307 376951 865329 4 I 0 60576 3t~399 9509 16967 4826 0 724 26899 438664 208830 3687!~0
5 I 18945 31939 20086 52718 8215 7590 7004 5242 16239 46503 438300 198707 6 I 4597 12735 18235 58465 24819 24713 21500 11454 3152 9499 53936 479316 7 I 2921 10687 11284 37617 46174 29821 27750 10700 14984 2511 9843 46800 8 I 3857 1123 7158 16968 53438 29216 20400 17278 5591 11978 3957 8935 9 I 416 31~34 2380 8508 17369 41045 27069 17855 11643 9713 10927 3429
10 I 4 458 3773 2629 9307 16867 32537 39088 20869 14052 7080 9920
ESTIMATED VARIANCE OF SURVIVORS 8/ 1/80
1965 1966 1967 1968 1969 1970 1971 1972
2 3020772392 1021166892 54595894 8 1686921587 180468596 363226539 712157419 53680044158 3 1225968495 2143447607 979091684 597396136 350039790 140142453 389413753 662158425 4 1128392751 764475858 1460455165 677345810 451909311 247161249 65037050 64036516 5 159397663 772190316 388821885 968292693 471262781 204067837 72255258 26257187 6 13267068 95793880 255883707 ~13106900 378832201 307425810 90258169 2585~~17
7 2359026 12420897 41985244 123447424 209700039 178918236 134105621 26137061 8 400176 1055526 65526'-!9 18956621 89795150 87200349 53797061 36078961 9 5178 246356 763338 3727915 8906074 40857175 37540647 17505321
10 6 Ll060 198458 367479 1452328 5294114 16902449 26994293
1973 1974 1975 1976 -~-+·--·-~p~---~--~~~-~~-~~b~~@·••~~b~-~a~~·•=•~$~--~~-~
2 I 1962213234 4776738566 18892737260 358350382 3 I 35454243852 1284859624 4022219746 11500324627 4 ! 263232084 16244108001 1247791836 2404930209 5 I 27338340 180984929 8030131194 703988788 6 ! 5383383 8628920 106872776 4416285111 7 l 9806030 1490353 4192268 40363865 8 I 6222561 4159071 922962 1653490 9 I 7848861 3552356 2519339 339650
10 I 8400684 3658600 920952 1508915
WEIGHTED SURVIVORS 8/ 1/80
1965 -i nee 1967 1968 1969 1970 1971 1972 1973 1971> 1975 1976 .!,.;:JVU
2 I 115 80 0 9 0 0 1162 30741 31895 79834 366810 156847 3 I 1044 89 85 20 0 1 113 2253 39817 36878 107255 537900 4 I 0 910 115 32 24 13 0 11 2204 58787 47683 175476 5 I 301 380 594 265 39 23 66 40 584 5541 118822 80420 6 I 274 337 654 1626 319 181 150 303 118 1083 10884 236271 7 I 229 680 681 2796 2530 811 465 258 1045 340 2309 25004 8 I 831 197 863 2269 5461 3849 1845 1077 566 1970 866 5315 9 I 183 1202 577 1804 4944 9219 8285 4963 3335 1722 2966 2039
10 I 4 256 1640 1324 5065 8077 17666 16637 12089 8636 4841 4496
RMS=0.01227179951

- 51 -
ESTIMATED SURVIVORS FOR 4GE 10 (WEIGHTED)
YEAR SURVIVORS STANDARD E'RROR [.!::_. (0/0) 1965 4 2 65.31 1966 439 2276 48 10.86 1967 3673 86230 294 8. 00 1968 2328 185097 430 18.48 1969 8686 790333 889 10.24 1970 16610 253511>6 1592 9.59 1971 36177 9177270 3029 8.37 1972 35475 11489559 3390 9.55 1973 20612 4866283 2206 10.70 1974 13930 2248398 1499 10.76 1975 7603 629723 794 10.44 1976 10870 683 954 827 7.61
F:STIMATF.D SURVIVORS FOR 1976 (WEIGHTlW)
AGF SURVIVORS VARIANCE STANDARD ERROR f·!::.· (0/0) 2 156847 358350382 18930 12.07 3 904710 7148756923 84550 9.35 4 362565 1144453779 33830 9.33 5 196877 284915169 16879 8.57 6 484438 2176938657 46658 9.63 7 47048 21565574 4644 9.87 8 9'+15 983554 992 10.53 9 3405 201998 449 13.20
10 10870 683954 827 7.61
FINAL ESTIMATION FOR K
~ K LN UJ_) VAR(LN(K) STANDARD ERROR D.F 2 53.28 3. 9713 O:Oo86- 0.0379 6 3 61.06 4. 0901 0.0435 0,0852 6 4 68.17 4.2184 0.0073 0.0349 6 5 76.89 4.3397 0.0054 0.0300 6 6 97.90 4.5744 0.0191 0.0326 17 7 97.90 4.5744 o. 0191 0,0326 17 8 97.90 4. 5744 0.0191 0.0326 17 9 97.90 4.5744 0.0191 0.0326 17
10 97.90 4.5744 o. 0191 0.0326 17
RF:SIDUALS 8/ 1/80
1965 1966 1967 1968 1969 1970 1971 1972 1973 1974 1975 1976
---+----~~~-~--~~----$~~~~~b~~b®~~·-~~~~-~~b·~---~·--~~·-b-~--~-----------·--------------·----------2 I 0.1177 0.0879 -0.0418 0.0366 -o. 0470 -0.1276 -0.0362 0.1444 0.0604 -0.0471 0.0551 0,0001 3 I 0.3006 0.0497 0.0926 0.0562 -0.3394 -o. 0291 o. 2274 0.1031 0.1046 -0.0925 0.0262 -0.0409 4 I -0.1266 0.1151 0.0442 -o. 0201 0.0542 -0.0449 -0.0793 -0.1165 -0.1320 -0.0399 0.0394 0,0146 5 I 0.0225 -o. o1so -0.0891 0.1318 -0.0310 -0.0001 -0.0504 0.0417 0.1610 -o. 0044 -0.0567 0.0080 6 I -0.1258 -0.0461
~
0. 258 0.1456 0.0263 0.0765 0.1822 0.0133 -o. 0122 0.0035 0.0792 -o. OOB4 7 I 0.0452 0.0671 -0.0892 0.0151 0.0881 0.0818 0,1461 0.0716 0.1623 -0.0798 0.0245 -0.0040 8 I 0.0341 -0.1249 -0.0654 0.0097 o. 2327 -o. 0732 -0.0030 0.0658 -o. 0876 0.0642 0.0681 -0.0410 9 I -0.0354 -0.0528 0. 0073 -o. 0100 0.0299 0.0911 -0.1446 -0.0719 -0.0884 0.1367 0,0046 0.0054
10 0.0005 0,0334 0.0266 0.0590 0,0612 0.0135 -0.0954 0.0831 0.0108 0.0080 -0.0596 -o. 0838
MEAN OF RESIDUALS=0.01150081995 STANDARD DF.V IATJON OF RFSTDUALS=O. 09162356148
OUTLIERS OF RESIDUALS 8/ 1/80
I 1965 1966 1967 1968 1969 1970 1971 1972 1973 1974 1975 1976 ---+••P~b~~-~-~~~~~b•~•v*g~-~-=~W~~b~~~~~~P~b~~~~~~~b-~~~-~-~=--~
2 o.oo 0.00 0.00 0.00 o.oo 0.00 0.00 o.oo 0.00 o.oo 0.00 o.oo 3 0.30 o.oo o.oo o.oo -o. 34 o.oo 0.23 0.00 o.oo o.oo 0.00 o. 00 4 0.00 o.oo 0, 00 o.oo o.oo o. 00 o. 00 o.oo 0.00 0.00 0.00 0.00 5 o.oo 0.00 o.oo o.oo o. 00 o.oo o. 00 o.oo o.oo 0.00 o.oo o. 00 6 o.oo o. 00 o.oo o.oo 0.00 0.00 0.00 o.oo o. 00 o. 00 o.oo o.oo 7 0.00 o.oo 0.00 o. 00 0.00 o. 00 0.00 0.00 o.oo 0.00 o.oo 0.00 8 o.oo 0.00 o.oo o.oo 0.23 0.00 0.00 o.oo o.oo o.oo o. 00 o. 00 9 00 o. 00 0.00 o.co o.oo o. 0.00 0.00 00 o. 00 o.oo 0.00
10 0.00 0.00 o.oo o.oo 0.00 0.00 o.oo 0.00 o. 00 0.00 o.oo o.oo

- 52 -
ANALYSIS OF VARIANCE
SOURCE B STAND ERROR OF B CON~ 0.011 AGE 3 0.017 0.042
4 -o. 047 0.044 5 -0.013 0.047 6 -o. oo5 0.051 7 0.023 0.056 8 -0.018 0.062 9 -0.035 0.068
10 -0.021 0,069 YEAR 1966 -0.017 0.049
1967 -o. 058 0.050 1968 0.023 0,053 1969 -o. 013 o. 056 1970 -0.025 0.060 1971 -0.007 0.065 1972 0.013 0.070 1973 0.001 o. 076 1974 -0.019 0.083 1975 0.013 0.089 1976 -0.019 0.086
YRCLASS 1956 0.024 0.100 1957 0.041 0.089 1958 o. 011 0.080 1959 -0.002 0.074 1960 0.005 0,068 1961 0.015 0.064 1962 0.065 0.060 1963 0.052 0.057 1964 0.048 0.059 1965 0.042 0.060 1966 -o. 023 0.062 1967 -0.011 o. 066 1968 0,019 o. 071 1969 -0.004 o. 077 1970 0.029 0.084 1971 0.009 0.091 1972 0.004 0.100 1973 -0.010 0.112
SUMMARY OF ANALYSIS OF VARIANCE
SOURCT? ss DF MS F CONSTANT O.Ol40 1 AGE 0.04596 8 0.0057 0.549 YEAR 0.04338 11 0.0039 o. 377 YRCLASS 0.06556 19 0.0035 0.330 RESIDUALS 0.74335 59 0.0108 TOTAL 0.91227 108

- 53 -
9, Catch Projections (MPROJECT).
This program simulates a population over a number of years by the combination of 1) a simple catch equation, 2) age-specific information on weight and 3) a discrete function representing age-specific allocation of fishing mortality (partial recruitment). It generates tables (both age- and time-specific) showing population numbers and biomass, numbers and biomass of mature fish, catch numbers and biomass, as well as fishing mortalities. The program also calculates surplus and net production from the stock. Annual net production is calculated as the total production diminished by the loss of biomass due to fishing and to natural deaths. The program also calculates the mean age and the mean weight of individuals in the catch.
The relative sensitivity coefficients are calculated with respect to certain parameters (ref, Arnold and Beck, 1977). The parameters of interest here are initial population numbers, recruitment, partial recruitment, weight-at-age, and annual rates of flshing and natural mortality.
Input Information.
In this section, greek letters are used to identify time-intervals. For example, 1 refers to age-interval i,i+l , while T refers to the time-interval t,t+l .
The input information required by the program consists of:
to initial year;
t final f
year of projection;
b age of youngest age-group;
m age of oldest age-group;
N. 0
(i = b, .•. , m) : population numbers at ~, age i, at the beginning of the initial
year t0
;
C (i = b, , .. , m) : catch (in numbers), if t,O known, for the initLal time period;
Wi+,S (i = b, ... , m) : weight-at-age i+.S, in kilograms. These are taken as midyear estimates;
r (i \
= b, ... , m) : partial recruitment. These are values, between 0 and 1, which indicate the proportion of fishing mortality which can be allocated to age-group i,i+l • The r
1 are constant for all years of prediction considered);
M1
(i = b, ... , m): instantaneous rate of natural mortality for age i,i+l (assumed to be constant for all years of prediction considered);
R.,t (t = t 0 , ... , tf): estimated recruitment (in numbers) to the youngest age-group at the beginning of year t;
F • 'T
(t = t 0 , ••• , tf) : an estimate of instantaneous fishing mortality for each year considered in the projection;
or
Q, T (t = to, ... , tf) : an estimate of total ' catch or quota for each year considered
in the projection;
(i = b, •.. , m) : a value, between 0 and 1, indicating the proportion of fish in age-group i which are assumed to have attained maturity (those values are assumed to be constant for all years of prediction considered).
For a given time horizon, the population numbers, the population biomass, the catch (both in numbers and in biomass units) and the instantaneous fishing mortalities are calculated from the following relationships:
!g_e-specific fishing mortali tie'!.: F t,T
The calculation of the instantaneous fishing mortalities is governed by the information provided in input:
A) Estimates of population and catch, both in numbers, may be available for the initial year t 0 • Then age-specific fishing mortalities are calculated by the following iterative procedure:
STEP 1. [9 .1].
STEP 2. Then we calculate the catch as follows (let j - 0):
j j j
Fl '0 -z,,o c\ 'o N
l '0 ( 1 e ) [9. 2]
zto
where zj I, 0
Fj 1 '0
+ M1
STEP 3: If lc~ 0 - C1 0 1 < 0.01 for all i, then F1
0 is accepted as'the final value for
the instantaneous fishing mortality. If not, calculate a Fj+lo from the relationship
\'
Fj+l 1 '0
j (Cl,O-ClO)
Cl + C2

where Cl
C2 N. 1,0
Then steps 2 and 3 are repeated in an iterative manner in order to find the final values for the instantaneous fishing mortalities.
If catches are not available for the first year, an estimate of annual fishing mortality is provided in input. Then,
F r F t,O •• 0
and the C1
,0
are calculated as in [9.2].
B) For the years of prediction (t > t 0), the fishing mortalities can be evaluated in two ways:
l) When an estimate of the annual fishing mortality, F, T• is given, the agespecific fishing mortalities are calculated as
F r F l ,T l 0
, T
2) When quotas, say Q, T' are entered as input data in a giv&n year t, the instantaneous fishing mortalities are calculated according to the following iterative procedure:
STEP 1: Fo r l, T l
j Fj -zJ STEP 2: c ~ N (1-e l 'T)
l,T zj i,t 1, T
j Fj where z + M
1, T 1, T 1
STEP 3: If IQ.,,- 2Cc 1 ,, wi+.s)l "0.1,
then the Fj are accepted as the final values for 1 'T the instantaneous fishing mortality. If not, calculate the next F-value from the recursive equation
j+l F
1, T
Q, T
2 c w 1,T i+.S
- 54 -
Then steps 2 and 3 are repeated in an iterative manner in order to find the final values for the instantaneous fishing mortalities.
~ighted __ ~ishing mortalities (FT):
An indication of the overall fishing mortality for a given stock can be obtained through the calculation of the following index weighted F:
\vhere the summation is taken over all age-groups • The weighted F is calculated for each year t of the project:!.on and appears on the bottom line of the table for age-specific fishing mortalities.
Population numbers (Ni,t):
N. 1,t
where
z 1 ,T
-z N e 1-l,T-1 i-l,t-1
Fish are assumed to leave completely the exploited stock when i>m • In other words, Nm,t is the population for the last age-group. For each year of prediction, the numbers in the first age-group considered are set equal to the recruits, R.,t .
Population biomass (average biomass for the current year):
-z W N.t(l-e
1•')/Z i+.S 1, 1,T
Catch, in numbers (C ): ----------- l, T
Yield (Y 1
,) :
'

- 55 -
Number of mature fisiJ. (N, ,t):
N, ,t
B.,t
m
L di wi Ni,t i=b
Components of production:
The comuonents of nroduction are calculated as in COHORT (see page 10).
Mean weight of individuals in the catch (W,):
Sensitivity coefficients.
Since input parameters (population numbers in the initial year, recruitment in years of prediction, partial recruitment, weight-at-age, annual fishing and natural mortalities) are expressed as vectors, the relative sensitivities are calculated from the response of the predicted catch to small relative perturbations in each element of the input vector under consideration. In fact, the relative sensitivities are approximated from equation [6].
In order to initiate the function, type in MPROJECT. Thereafter, you will be prompted for input as follows:
FIRST YEAR AND YOUNGEST AGE-GROUP?
-enter two numbers representing respectively the year on which the projection is to start and the youngest age (b) to be included in the projection.
ERRORS: -you must enter 2 positive integers,
NllliBERS AT AGE FOR XXXX?
-enter the vector of population numbers (Ni,to• i = b, ..• , m) for the year on which the projection is to start (the first number in the vector should be for the youngest age-group as entered above).
ERRORS: -the values entered must be nonnegative.
CATCH AT AGE KNOWN FOR XXXX? (YES OR NO)
-enter either YES or NO. If you enter YES, then the program will ask for the values of the catch at age.
CATCH AT AGE FOR XXXX?
-enter the vector of catch at age (Ci,to• i= b, ••• , m) for the first year of the projection.
ERRORS: --the catch vector must have the same length as the vector of numbers at age;
-the values entered must be nonnegative;
-the catch numb<:>rs must be less than or equal to the population numbers.
WEIGHT AT AGE? (KG)
-enter a vector of weights at age (Wi, i b, ••• , m).
ERRORS: -the vector must have the same length as the vector of numbers at age;
-the weights must be positive.
PARTIAL RECRUITI1ENT TO FISHING? (VALUES BETWEEN 0 AND 1)
-enter the values (ri, i = b, , , • , m) \vhich indicate the proportion of fishing mortality which can be allocated to agegroup i.
ERRORS: -the vector must have the same length as the vector of numbers at age;
-the values entered must be greater than or equal to zero and less than or equal to one. But at least one value should be different than zero.
NATURAL MORTALITY?
-enter either a single number (M) or a vector giving separate instantaneous rate of natural mortality (M., i = b, ... , m) for each age-group i, wfien a single number is entered, the Mi are set equal to M for all i.
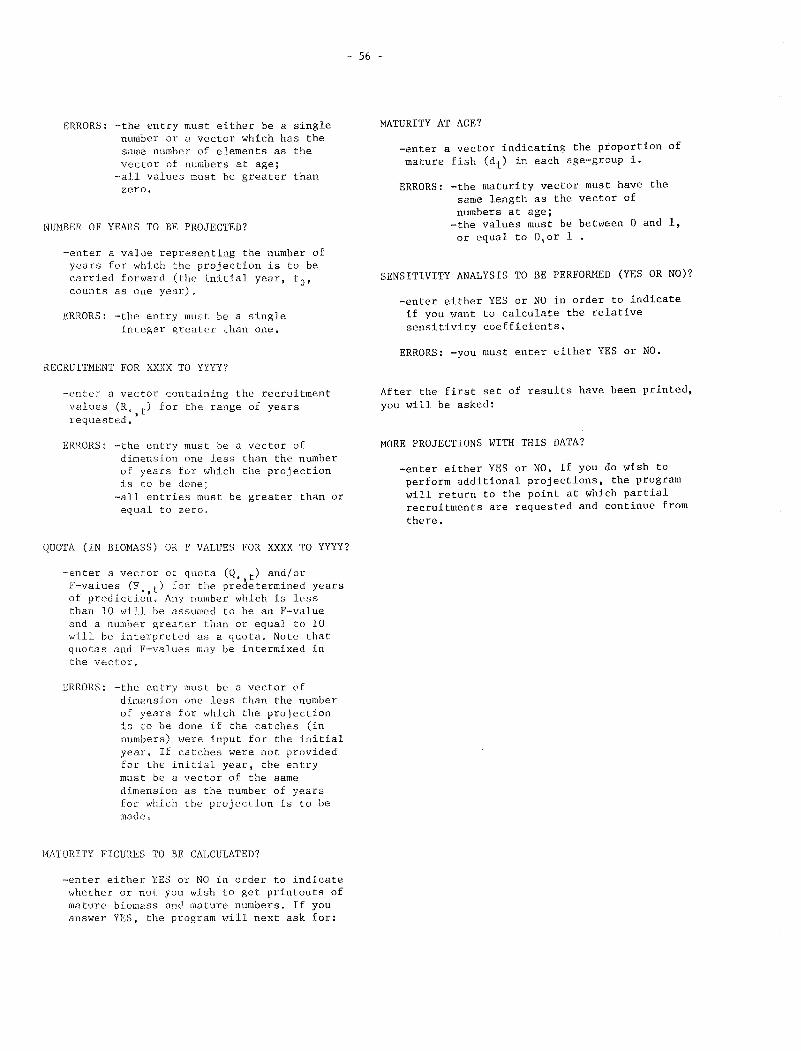
ERRORS: -the entry must either be a single number or a vector which has the same number of elements as the vector of numbers at age;
-all values must be greater than zero.
NUMBER OF YEARS TO BE PROJECTED?
-enter a value representing the number of years for Hhich the projection is to be carried forward (the initial year, t 0 , counts as one year).
ERRORS: -the entry must be a single integer greater than one.
RECRUITMENT FOR XXXX TO YYYY?
-enter a vector containing the recruitment values (R,,t) for the range of years requested.
ERRORS: -the entry must be a vector of dimension one less than the number of years for Hhich the projection is to be done
-all entries must be greater than or equal to zero.
- 56 -
MATURITY AT AGE?
-enter a vector indicating the proportion of mature fish (di) in each age-group i.
ERRORS: -the maturity vector must have the same length as the vector of numbers at age;
-the values must be between 0 and 1, or equal to O,or 1
SENSITIVITY ANALYSIS TO BE PERFORMED (YES OR NO)?
-enter either YES or NO in order to indicate if you want to calculate the relative sensitivity coefficients.
ERRORS: -you must enter either YES or NO.
After the first set of results have been printed, you will be asked:
MORE PROJECTIONS WITH THIS DATA?
-enter either YES or NO. If you do wish to perform additional projections, the program will return to the point at which partial recruitments are requested and continue from there.
QUOTA (IN BIOMASS) OR F VALUES FOR XXXX TO YYYY?
-enter a vector of quota (Q, t> and/or F-values (F. t> for the predetermined years of predictio~. Any number which is less than 10 will be assumed to be an F-value and a number greater than or equal to 10 Hill be interpreted as a quota. Note that quotas and F-values may be intermixed in the vector.
ERRORS: -the entry must be a vector 0f dimension one less than the number of years for which the projection is to be done if the catches (in numbers) were input for the initial year, If catches were not provided for the initial year, the entry must be a vector of the same dimension as the number of years for which the projection is to be made,
MATURITY FIGURES TO BE CALCULATED?
-enter either YES or NO in order to indicate whether or not you wish to get printouts of mature biomass and mature numbers. If you answer YES, the program will next ask for:

- 57 -
An example.
FILEbFETCH '2719067 PFbPROJECT'
MPROJE'C'l' FIRST YFAR AND YOUNGEST AGE GROUP? [l:
1978 3 NUMBFRS A2' AGE FOR 1978? 0:
1000 427 182 78 33 14 6 CA'l'CH AT AGE KNOWN FOR 1978?(YES OR NO) YES CATCH A'l' AGE FOR 1978? D:
337 144 61 26 11 5 4 w'F:IGH'l' A 'I' AGr:? (KG) : FEC'l'OH OR MATRIX r::
1.86 5.53 8.8 10.96 12.28 13.6 14.5 PARTIAL RECRUITMENT TO F'ISHING?(VAWES BETf.lEEN 0 AND 1) 0:
.3 .6 .8 .9 1 1 1 NATURAL MOJrTArJTY? D:
.1 NUMBER OF YEARS TO BE PROJFCTFD? [l:
5 RFCRUI7'MFNT FOn 1979 '1'0 1982? [J:
1000 1000 1000 1000 QUO'l'A (IN BIOMA8S) OJ, F VAWFS FOR 1979 '10 1982? 0 . .
3952 4410 1 1
MATUHITY FIGURF'S TO EW CALCULI!TFD?(YES OH NO) NO
SFNSI'l'.TVI'l'Y ANAUSIS TO BF PFF.FORMFD (YES OJ.' NO)? YF.'S
POPU!,ATION NUMBFRS 19/ 6/80
1978 1979 1980 1981 1982
3 I 1000 1000 lO'JCl 10Cl0 10QO 4 I 427 586 691 691 670 5 I 182 25Q 309 364 343 6 I 78 107 110 136 148 7 I 33 '+6 43 44 50 8 ! 14 19 17 16 15 9 I 6 8 7 6 5 ~-~+--~~·~~----P--b~~@b·-~~--~~--~
3+1 1740 2016 2177 2257 2231 4+1 740 1Cl16 1177 1257 1231 5+1 313 43() 486 567 561 6+1 131 18:-J 177 2Cl2 218
POPULATION BIOMASS (AVE:RAGF.) i()/ 6/80 ~'>I
I 1978 1979 1980 1981 1982 -z-+~-~---ti~-~---~~~~-~-~~~~---P-~~---~---~--b~--
3 I 1440.36 1554.67 1554.69 1533.01 1533.01 4 I 1828.25 2391. 68 2821.26 2747.06 2665.85 5 I 1241.93 1500.88 1854.10 2113.35 1990.30 6 I 663.79 769.14 792. 11 942.12 1025.9() 7 I 314.68 356.63 333.96 330.00 372.58 8 I 145.26 167.12 145.30 130.55 121.65 9 I 49.00 72.71 65.55 54.68 l.f6. 33
--~+-------~--~--~~------~--~-----~-~--------~---3+1 5683.25 6812.84 7566.98 7850.76 7755.63 4+1 4242.9() 5258.1 6012.29 6317.75 6222.61 5+1 2414.65 2866.49 3191.02 3570.69 3556.77 6+1 1172.73 1365.60 1336.92 1457.34 1566.47

- 58 -
CATCH NUMBERS 19/ 6/80
I 1978 1979 1980 1981 1982
v•-+p-------~----~pp~~----~--
3 I 337 226 226 247 247
4 I 144 234 275 298 289
5 I 61 123 152 192 181
6 I 26 57 59 77 84 7 I 11 26 24 27 30
8 I 5 11 10 10 9
9 I 4 5 4 4 3
---+·-----~~~~--~-~~~Q~-~~·--3+1 588 681 750 855 844
4+1 251 455 524 608 597
5+1 107 2 21 248 310 308
6+1 46 99 97 118 127
CATCH BIOMASS 19/ 6/80
1978 1979 1980 1981 1982
--~+------------·---------------~-3 I 627 420 420 460 460
'+ I 796 1292 1523 1648 1600
5 I 537 1081 1335 1691 1592
6 I 285 623 642 8'+8 923
7 I 135 321 301 330 373
8 I 68 150 131 131 122
s I 58 65 59 55 46
-~-+--------------~-~-------------3+ I 2506 3952 4410 5162 5116
4+1 1879 3532 3990 4702 4656 5+1 1083 22'-11 2'-167 3054 3056 6+1 546 1160 1132 1363 1464
Mt:AN WF:IGHT OF INDIVIDUALS IN CATCH 19/ 6/80
I 1978 1979 1980 1981 1982
4.3 5.8 5.9 6.0 6.1
FIS!IING MO!i1'ALITY 19/ 6/8 0
1978 1979 1980 1981 1982
3 0.435 o. 270 0.270 0.300 0.300 4 0.436 0.540 0.540 0.600 (),600
5 0.432 0.720 0. 720 0.800 0.800
6 0.429 '). 81!) 0.810 0.900 0.900 7 0.429 0.900 0.900 1. 000 1. 000 8 0.468 0.900 0.900 1. ooa 1. 000 9 1. 184 0.900 0.900 1. 00!) 1. 000
3+1 0.437 0.456 0.466 0.529 0.529
DIS'J'HIB!JI'ION OF GhOW'l'H OVER AGFS (PF.RCli'NT) 19/ 6/80
1978 1979 1980 1981 1982
3 44.4 39.8 36.0 34. 8 35.4 4 38. 3 42.0 44.8 43,4 42.9 5 12.5 13.2 14.8 16. 8 16.2 6 3,3 3. 5 3. 2 3.9 4.3 7 1.0 1.0 (). 8 o. 8 0.9 8 0.4 '). 4 o. 3 0.3 0.3 9 0.1 o. 1 ·J.l o. 1 o. 1
PRODUC'l'ION 19/ 6/80
SOURCE
RECRUITMENT BIOMASS GROWTH TOTAL PRODUC'l'ION
WSS 2'HROUGH FISHING SURPLUS PRODUCTION NET PRODUC'l'ION
1978 1979 1980 1981 1982
1079 1079 1079 1079 1079 3534 4299 4757 48~4 4754 4613 5378 5836 5922 5833
2506 3952 4410 4045 4697 5079 1539 745 669
5162 5137
-25
5116 5058 -58

- 59 -
PRODUC'l'ION I BIOMASS RA'l'IO 19/ 6/8 0
I 1978 1979 1980 1981 1982
I o.81 o.79 o.77 o.75 o.7s
SENSITIVITY OF CA'I'CH BIOMASS WITH RESPECT TO PARAME''I'ERS
SFNSITIVITY 1'0 NATURAL MORTALITY 19/ 6/80
1978 1979 1980 1981 1982 •••+•-•·-~~--~~~••#P•=~----a-~-~~~~~•••
3 I o. 000 0.142 0.321 -o. 047 -0.047
4 I o.o0o -0.005 0.116 -0.258 -0.14Lf
5 I o. 000 -0.019 -0.095 -0.528 -0.356
6 I o.ooo -o. o2s -o. Ji+7 -o. 787 -0.628
7 I o.ooo -0.031 -0.179 -0.863 -0.886 8 I o.ooo -0.031 -0.198 -o. 920 -0.963 9 I 0.000 -0.034 -0.198 -0.939 -1. 020
SFNSITIVITY TO PARTIAL RECRUI'J'ME'NT
1978 1979 1980 1981 1982
-·-+----------------~----p·----------3 I 0. 000 Cl.000 0.000 o. 860 o. 860 4 I 0.000 0.000 0.000 0.735 0,434
5 I 0. 000 0.000 o. 000 o. 659 0.059 6 I 0. 000 0.000 0.000 0.624 -0.177
7 I o.ooo '), 000 0.000 0.590 -0.310
8 I o.ooo '). 002 o. 001 0.590 -0.410
9 I 0.000 '), 001 0.002 0.590 -0.410
SFNSI1'IVI'l'Y TO WEIGHT 19/ 6/80
1978 1979 1980 1981 1982
3 I 1.000 -o. 21s -0.986 1. 000 1. 000 4 I 1. 000 -o. 058 -0.350 1. 614 1. 000 5 I 1. 000 0.040 0.185 2.605 1.614 6 I 1. 000 a. 086 o. 511 3.392 2.605 7 I 1. 000 0.130 0.709 3.849 3. 392 8 I 1.000 •), 130 0,834 4.180 3.849 9 I 1.000 0. 130 0.834 4.306 4.180
SFNSI'l'IVI'l'Y TO POPULATION NUMBF.RS IN
1978 1979 1980 1981 1982
-~-+~-·-~~-~~---~-~--~~--9~-·-~------~---~~ 3 0.000 1. 676 2. 108 o.ooo 0.000
-4 0. 000 o. 085 1. 315 0.652 0.000
5 o.ooo 0.219 0.913 1. 823 0.652
6 0.000 o. 278 1. 340 4.324 1.823
7 0.000 0.335 1. 584 4.890 4.324
8 0.000 0.336 1. 753 5.277 4.890
9 0.000 0.395 1. 751+ 5,446 5.277
Sl':NSITIVl'I'Y '1'0 RF:CHUITME'NT 19/ 6/80
1978 1979 1980 1981 1982 -~~+~-~~--*-~-®----~----~~e~~--~~~P~•--
3 o. 000 0.871 0.382 1. 000 1.000 4 0.000 -0.112 0.503 1. 191 1. 000 5 0.000 -0.102 -0.407 1. 422 1. 191 6 0.000 -0.097 -0.357 0.589 1.422 7 o.ooo -0.092 -·o. 321 0.679 0,589
8 0.000 -o. 092 -0.308 0.756 0.679
9 0.000 -o. 092 -0.308 o. 770 0.756
MORE PROJ!<:C'I'IONS WITH THIS DATA?( YF:S Oli NO) YF:S
19/ 6/80
1978? 19/ 6/80

- 60 -
PARTIAL RECRUI1WENT TO FISHING?(VALUES BETWEFN 0 AND 1) 0:
.3 .65 .8 .9 1 1 1
NATURAL MORTALITY? 0:
• 1 NUMBER OF YFARS TO BE PROJEC'l'ED? 0:
5 RECRUITMENT FOR 1979 '1'0 1982? 0:
1000 1000 1000 1000 QUOTA (IN BIOMASS) OR F VALUES FOR 1979 TO 1982? 0:
3952 4410 5162 5116
MA'l'URITY FIGURES 1'0 BE: CALCULA'l'FD?(YES OR NO) NO
SENSI'l'IVITY ANALYSIS TO BF PERFORMED (YES OR NO)? NO
POPULATION NUMBERS 19/ 6/8 0
1978 1979 1980 1981 1982
---+-----------·-----------~------3 I 1000 1000 1000 1000 1000 4 I 427 586 691 691 670 5 I 182 250 309 364 343 6 I 78 107 110 136 148 1 I 33 46 43 44 50 s I 14 19 17 16 15 9 I 6 8 7 6 5
---+----·-··----·~---···-·----~---3+1 17'10 2016 2177 2257 2231 4+ 740 1016 1177 1257 1231
5+1 313 430 486 557 561 6+1 131 180 177 202 218
POPULATION BIOMASS (AVI-:RACF) 19/ 6/80
1978 1979 1980 1981 1982
3 I 1440.36 1554.67 1554.69 1533.01 1532.98 .. I 1828.25 2391.68 2821.26 2747.05 2665.74 5 I 1241. 93 1500.88 1854.10 2113.34 1990.19 6 I 663.79 769.14 792.11 942.12 1025.84 7 I 314.68 356.63 333. 96 330.00 372. 55 8 I 145.26 167.12 145.30 130.55 121.65
9 I 49.00 72.71 65.55 54.68 46.33
-~~+~~~~-~~~--~~~-~~·---~~--~~~~--------·~-~-----3+1 5683. 25 6812.84 7566.98 7850.73 7755. 27 4+1 4242.90 5258.17 6012.29 6317.72 6222.29
5+1 2414.65 2866.49 3191.02 3570.68 3556.55
6+1 1172.73 1365.60 1336.92 1457. 34 1566.36
CATCH l'VUMBF.RS 19/ 6/80
I 1978 1979 1980 1981 1982
--*+·------~----~p~~------~·-3 I 337 226 226 247 2it7 'l I 144 234 275 298 289 5 I 61 123 152 192 181 6 I 26 57 59 77 8i.f 7 I 11 26 24 27 30 8 I 5 11 10 10 9 9 I 4 5 4 4 3
Op~+~----"·-~--~~~---~~------3+1 588 681 750 855 844 4+1 251 455 524 608 597 5+1 107 221 248 310 308 6+1 46 99 97 118 127

- 61 -
CATCH BIOMASS 19/ 6/80
1978 1979 1980 1981 1982
~~-+~~~------~-----~--------P·~--P 3 627 420 420 '<60 460 4 796 1292 1523 1648 1600 5 537 1081 1335 1691 1592 6 285 623 642 848 923 7 135 321 301 33') 373 8 68 15') 131 131 122 9 58 65 59 55 46
---+--•----~U~~--p---~--M·--~~---~
3+1 2506 3952 4410 5162 5116 4+1 1879 3532 3990 4702 4656 5+1 1083 2241 2467 3054 3056 6+1 546 1160 1132 1363 1464
MEAN WtiC!!'I' OF INDIVIDUALS IN CA'l'CH 19/ 6/80
I 1978 1979 1980 1981 1982
4.3 5,8 5.9 6.0 6.1
FISHING MORTALI'l'Y 19/ 6/80
1978 1979 1980 1981 1982
3 I 0.435 0.270 0.270 0.300 0.300 4 I 0.436 o. 540 o. 540 0.600 0,600 5 I 0,432 o. 720 0. 720 0.800 0.800 6 I 0.429 0.810 '). 810 0.900 0.900 7 I 0.429 0.9')0 0.900 1. 000 1. 000 8 I 0.468 o. 9')0 0,900 1.000 1. 000 9 I 1. 184 0.900 0.900 1. 000 1. 000
3+1 0.437 0.456 0.466 0.529 0.529
DISTRIBUTION OF Gli'Ow"l'f! OVER AGFS (PF:RCENT) 19/ 6/80
1978 1979 1980 1981 1982
3 44.4 39.8 36.0 34.8 35.4 4 38.3 42.0 44,8 lt3.4 42.9 5 12. 5 13.2 14. 8 16. 8 16. 2 6 3.3 3. 5 3.2 3.9 4.3 7 1.0 1.0 0.8 0.8 0.9 8 0.4 0.4 0.3 0.3 0.3 9 0.1 o. 1 o. 1 o. 1 0.1
PRODUCTION
SOURCE 1978 1979 1980
RECRUITMENT BIOMASS GROWTH TOTAL PRODUCTION
1079 1079 1079 3534 4299 4757 4613 5378 5836
LOSS THROUGH FISHING SURPLUS PRODUCTION NFT PRODUCTION
2506 3952 4045 4697 1539 745
4410 5079
669
PRODUC'l70NIBIOMASS RATIO 19/ 6/80
1978 1979 1980 1981 1982
I o.81 0.79 o.77 o.7s o.7s
l>IORE PROJFCTIONB WITH THIB DATA?(YES OR NO) NO
19/ 6/80
1981 1982
1079 1079 4844 4754 5922 5833
5162 5137 -25
5116 5057 -59

- 62 -
REFERENCES
Bard, Y, 1974. Nonlinear Parameter Estimation. Academic Press, New York, 341 pages,
Beck, J.V. and K,J, Arnold, 1977. Parameter Estimation in Engineering and Science. John Wiley and Sons, New York, 501 pages.
Beverton, R.J.H. and S.J. Holt. 1957, On the Dynamics of Exploited Fish Populations. U.K. Min, of Agric,, Fish and Food, Fish. Invest. (ser, 2) 19. 533 pages.
Galluci, V.F. and T,J. Quinn II. 1979. Reparameterizing, Fitting, and Testing a Simple Growth Model. Transactions of the Am. Fish. Soc. 108: 14-25.
Gilman, L. and A.J. Rose, 1974, APL, an Interactive Approach. John Wiley & Sons Inc., New York. 384 pages,
Gulland, J.A. 1965. Estimation of mortality rates. Annex to Arctic Fisheries Working Gro~p Report (meeting in Hamburg, January 1965). ICES, C.M. 1965, Doc. No. 3 (mimeographed),
Gulland, J.A. 1969. Manual of Methods for Fish Stock Assessment. Part I: Fish Population Analysis. FAO Fisheries Series, Rome, 154 pages.
Kingsley, M.C.S., V.F. Galluci and T,J, Quinn II. 1980. Von Bertalanffy Growth Parameters. Trans, Am. Fish, Soc, 109: 252-253,
Pope, J.G, 1972. An Investigation of the Accuracy of Virtual Population Analysis Using Cohort Analysis. Int. Comm, Northwest Atl. Fish, Res. Bull. 9: 65-74
Rivard, D. 1980. Back-calculating production from cohort analysis, with discussion on surplus production for two redfish stocks, CAFSAC Research Document 80/ , 26 pages.
Rivard, D. and W.G. Doubleday. 1979a. APL Programs for Stock Assessment, including a Sensitivity Analysis with respect to Input Parameters. Fish. Mar. Serv. Tech. Rep. 853. 80 pages,
Rivard, D. and hf.G. Doubleday. 1979b. Response of Cohort Analysis to Input Parameters. CAFSAC Research Document 79/45. 26 pages.
Seber, G.A.F. 1973. The Estimation of Animal Abundance and Related Parameters. Griffin, London. 506 pages.
***************************************

- 63 -
APPENDIX A
LISTING OF APL FUNCTIONS

- 64 -
UTILITY FUNCTIONS
DAT
The function DAT prints the current date in a standard format.
V X+DAT [1] X+1~ 3 0 ~100T~3t0TS [2] X[3 6}•-' I'
v
HEADER ( calling form: HEADER SUB )
The function HEADER prints, on the OUTPUT file, the characters sent in the right argument, SUB, and underlines them.
V HEADER SUB [ 1 J • ' [2] SUB [3] (pSUB)p'"''
v
MPLUS ( calling form: AGES A6PLUS MATRIX )
The diadic function A6PLUS calculdtes the sum of the values contained in MATRIX for the range of age-groups which is specified by the values of the vector AGES.
V VECT+AGES A6PLUS MATRIX [1J CNT+FIRSTAGE+1+AGES [2] LASTAGE+1+AGES [3J +(v/(2=pAGES,AGES),(LASTAGE<FIRSTAGE),(LASTAGE>AG[pAG]),FIRSTAGE<AG[1])/
ERROR [4] +(A/( 0'5LASTAGE~FIRSTAGE). ( 2=pAGES)) /OK [5] ERROR:+'J,Ot~'INVALID. FORMAT IS: FIRSTAGE LASTAGE PLUS MATRIX' [6] OK:VECT++/[ 1] MATRIX+( (FIRSTAGE•AG[ 1]), O)'i-MATRIX --[7] CHECK:+(CNT>LASTAGE)/SHAPE [8] VECT+VECT,[1]+/[1] MATRIX+ 1 0 +MATRIX [ 9 J CNT+CNT+ 1 (' +CHECK [10] SHAPE:VECT+((1+LASTAGE~FIRSTAGE),1tpMATRIX)pVECT
v

- 65 -
INPUTLIMAT
INPUTLIMAT is an utility function used to create a matrix of data. The matrix which is created by INPUTLIMAT is called MAT.
V INPUT~AT;TFMP;CHECK;SAVE;SIZE [ 1] RET1:' ENTER FIRST YEAR AND YOUNGEST AGE GROUP ' [ 2] +(A/ (STORE=f STORE) ( Os2+STORE), 2=pSTORE+ ,0) /OK1 [3] +RET1,0+~'MUST BE TWO NON•NEGATIVE NUMBERS' [ 4] OK1 :.YEAR<-1 +STORE 0 AGE+l +STORE [5] ' ENTER AGE~SPECIFIC DATA FOR EACH YEAR(ONE YEAR PER LINE), STARTING WITH
YOUNGES'l' AGE. (6" 'TERMINATE ENTRY WITH A SCALAR AFTE'R NEXT PROMPT' [ 7] RET2 [8] +(Ai(OsTEMP+(SIZE,1)pTEMP))/OK2 [ 9] +RET2, Ot~' MUS1' BE' NON~>NEGA1'IVE NUMBE'RS' [10] OK2:CHl\CK+!O [ 11 J SAVE+TEMP [ 12] MAT+TEMP [13] NE'XT:SIZE+pTFMP+,O [14] +(A/SIZE=1)/LABEL [15] TEMP+(SIZE,1)pTEMP [16] +(A/(Af0STEMP),(A/(pSAVE)=pTEMP))/OK3 [ 17] +NEX'l', Otr!J+' MUST BE NON,. NEGATIVE AND DIMENSIONS MUST AGREE WITH FIRST VECTO
[18] [19] [ 20 J [21] [ 22] [ 23 J [24] [25] [26]
[1) [2] [3] (4]
[ 5]
[6] [7] [S] [ 9] [10 J
v
R' OK3 :CHECK+MAT
MAT+MAT,TEMP +NEXT
LABEL: YR•- -1 +YEAR+1 pMAT[ 1;] AG+--1 +AGE+! pMA7'[; 1] TIT+' DATA S'l'ORED IN MAT' 'ALIGN PAPEH' R<{JDL 5 0 OUT MAT
BECOMES (calling form: EDIT BECOMES VALUE)
The function BECOMES is used to correct erroneous entries of the matrix MAT. VALUE is the corrected value to be inserted in the matrix MAT, at the location Identified by EDIT.
V EDIT BECOMES VALUE;EDITAGE;EDITYEAR;ROW;COL EDITAGE+1 +EDIT
v
ElJITYEAR4-1 +EDIT +(2=pEDIT,EDIT)IERROR +(A/ (EDITYEAR?.YEAR). (EDITAGE'cAGE) ' ( 2=pEDIT). ( 1=pVAWE). ( A/VALUE?.O) ,A/EDIT >0)/0K1 ERROR:+O,Ot~'INDICES MUST BE PRESENT IN MATRIX. FORMAT IS: AGE YEAR BECOM
ES NUMBER' OK1:ROW+1+EDITAGE-AGE
COL+1+EDITYEAR-YEAR +(A/ (ROW5.1 tpMAT) '(COL$1 +pMAT)) /OK2 +ERROR
OK2:MAT[ROW;COL]+VALUE
RESETliiNDICES (calling form: RESETLIINDICES NAME)
This function is used to reset the indices of a matrix NAME before using the output function OUT.
VRESETAINDICES[O]V V RESETliiNDICES NAME;TEMP
[1] RET: 'E'NTER FIRST YEAR AND YOUNGEST AGE GROUP' [2) +(A/(TEMP=rTEMP) ,(OS2+'J'EMP) ,2=pTEMP+,O)/OK [3] TWO NON~NEGATIVE NUMBERS [4] OK:YEAR+1tTEMP 0 AGE+1tTEMP [5] YR+-1+YEAR+lpNAMF[1 ] [6] AG+--1+AGE+1 ;1]
'V

- 66 -
MEANF
The function MEANF calculates an unweighted mean for the annual rates of fishing mortality which are stored in the matrix FISHMORT.
V MEANF [1] FUW+(+/[1] FISHMORT)tpFISHMORT[;1] [2] TIT+'MEAN FISHING MORTALITY (UNWEIGHTED)' [3] YR+-1+YEAR+\pFISHMORT[1;] [4] 4 OUT FUW
v
WEIGHTEDLIFMORT
The function WEIGHTEDllFMORT calculates a weighted mean for the annual rates of fishing mortality which are stored in the matrix FISHMORT.
V WE'IGHTEDtJFMORT [1] FW0:(+/[1](POFWBxFISHMORT))t+/[1) POPNB [2] YR+ 1+YEAR+tpFISHMORT[1;] [3] TIT+'WEIGHTED FISHING MORTALITIES' [4 J L; OUT FWC
v
OUT ( calling form: A OUT B )
The function OUT prints, with A decimal places, the matrix B, sent in the right argument, The matrix B ts printed with an adequate format which considers the number of digits before the decimal point and the sign of any element of the matrix. The function OUT calls the function DAT and outputs the current date,
V A OUT B;C;D;W;Y;FW;TE'S1' [1] +(1~ppB)/CHECK1 [2] ~(i,pB)pB [3] CHECK1:A+,~(2,-1tpB)p(5f2+(A~O)+A+(O>(l/[1] B))+r1o-1rrt[1]IB),(-1tpB)pA [4] fW+(20+pTIT)rCCPW)l4++/((pA)p 1 0)/A [5] Y+YR [6] ' ' [7] ((-8+FW)t((L0.5xfW~pTIT)p 9 '),TIT),DAT [8] SK1:' ' [9] C+-1+(CfW<4++\A[-1+2xl0.5xpA])t1 [10] ~(2xClpY)tA [11] D[2xtClpY]+O [12] ' I',D'f(ClpY)+Y [13] '·-•+ 1 ,(+/A[-1+2•tC])p'~' [14] +(1~1tpB)/MAT [15] (1 4 p' 1'),((2xC)tA)V(1,C)tB [16] -+CHECK [17] MA'1':(2 0 'l'((pAG),1)pAG),(((pAG),2)p 1 I 1 ),((2xC)tA)1f((pAG),C)tB [18] +((pAG)=1tpB)/CHECK [19] 1 ---+',(+/A[-1+2xtC])p'-' [20] (2 0 1'UTEST,1)pAG)),(((TEST+(1tpB)•pAG),2)p 1 +1 1 ),((2xC)tA)1f{((pAG)-1tpB)
,C)tB [21] CHECK:A+(2xC)+A [22] ~( O,CHB [ 23 J Y+-C+Y [24] ~<o~pA)/SK1
v

- 67 -
FETCHllONLY ( calling form: FETCHllONLY NANE )
The function FETCHllONLY is used to 'define' the pack specified by the value of the variable NAME. This function is used by the function FILEllFETCH.
V FETCHllONLY PACKNAME [1] OPDEFLPACKNAME
v
FILEllFETCH calling form: FILEllFETCH FILENAME )
The function FILEl'IFETCH is a utility function which is used to fetch the APL-functions which have been stored in permanent files. FILENAME specifies the name of the permanent file to be fetched.
V FILEAFETCH FILEANAME [1l DUNTIE [WUMS [2] FILEANAMF OTIE FN+1+f /O,ONUMS [3] PACK+OREAD FN,l [4] FFTCH60NLY 'PACK'
v
FFULR (calling form: FFULR :c)
The function FFULR calculates an overall rate of fishing mortality for the fullyrecruited age-groups. The variable x is a value representing the first fully-recruited age-group.
V FFULR X [1] +(A/(X>O),((pAG)~X-AG[1~))/0K [2J +O,Ot~'AGE NOT PRFSFNT' [3 1 OK:NO+((X~AG[1J),O)+POFWB [4] FULR~(8( (+f[1}C1 -1 ~NO))H/[1J(1 1 +NO)))-f.~ ( 5 J TIT~' FULLY JWCRUITF:D F'ISHMORTA!.ITY' [6:1 4 OUT FUT,R
v

- 68 -
TABLE (Calling form: A TABLE B)
The function TABLE prints, with A decimal places, the matrix B, sent in the right argument. This function is used to tabulate, with appropriate headings, the information provided in the matrix B. The function TABLE also calls the function DAT.
V A TABU' B A~.~(2,(p8)[2])p(5f2+(A%0)+A+(O>(li[1J B))+f1091ffi[1JIB),((pB)[2])pA ~((pTIT1)>(pLB)[2])1CHANGELB
[1] [2] [3] [4] [5] [6 J [7] [ 8] [ 9] [10 J [11] [12] [13] [14] [15] [ 16] [17] [18] [19J [20]
NEX1':FW~( 20+pTJT)f ( [JDW) L( pLB) [ 2]++ I ( ( pA) p 1 0) I A
Y+YR 0 ' ' ((-8+FW)t((l0.5xFW~pT1T)p' '),TIT),DAT +((pTIT1)>(pLB)[2J)ICHANGELB
SK1:' '(' C+-1+(00W<(pLB)[2]+4++\AC1+2xt0.5xpA]h1 ~(2xClpY)tA 0 D[2xtClpY]+O ( VTIT1), (( 2+( pLB)[ 2]•( pTIT1)) p' '),'I ',D'f(ClpY)t Y ((2+(pL8)[2J)p 1 ~'),'+ 9 ,(+1A[-1+2xtC])p'~' ( v( ( ~SE'CT[ 2]), O)HB), ( (SECT[2], 3)p' I'), ( ( 2xC)tA) 'f(SECT[l] ,C)tB ( (2+(pLB)[2])p• .. • ), 1 +1 , (+IAC1+2xtC])p'"' (v((SECT[1]),0)tLB),((SECT[2],3)p' I '),((2xC)+A)v((•SECT[2]),C)+B A+( 2xC)+A B+-( D,C)+B Y+CH +( O:tpA) I SK 1 •0
CHANGELB:LB+-LB,((pLB)[1J,((pTIT1)•(pLB)[2]))p' I
+NEXT ll
OUT/iF (calling form: A OUT/iF B)
The function OUT/iF is used to output a matrix of fishing mortalities when a vector of weighted fishing mortalities is printed at the bottom of the table. The quantity A represents the first fully recruited age-group.
[1] [2] [3] [4] [5] [6] [ 7] [8] [ 9] [10] [ 11 J [12] [13] [14] [15J [16] [17] [18] [19] [20] [ 21 J [22] [ 23] [ 2l~J
V FA OUT6F B;C;D;W;Y;FW;'IFST +(1%ppB)ICHF:CK1 B+-( 1, pB) pB
CHECK1:A+,~(2,-1tpB)p(Sr2+4+(0>(ll[1] FW+-(20+pT ITH ( [JDI.')l4++ I (( pA) p 1 J) I A Y+Yli'
' '
B))+f1'J$1ffl[lJIB),(-1tpB)p3
( C8+Fll'lt ( < l o. S><FW•pTIT) p • '),TIT) ,DA'l'
\)
SK1:' ' C+-1+([PW<4++\A[-1+2x,o.5xpA])t1 ~( 2xClpY)tA D[2><lClpY]+O
I' ,DV(CLpY)tY 1 -~~+',(+IA[-1+2xlC])p 1 •'
+( l;tl tpB) /MA'l' (1 4 p' 1'),((2xC)tA)v(1,C)tB +CHECK
MA1':(2 0 1'((pAG),l)pAG),(((pAG),2)p' I '),((2xC)tA)v((pAG),C)tB ~((pAG)=l+pB)ICHECK '··-+ 1 ,(+1A[-1+2xiC])p'·' ( 2 a 1'( (TEST ,1 )p-1 +FA+lTE'ST)) ' ( ((TEST+( HpB)ppAG). 2)p '+I I). (( 2xC) +A) •< (( pAG)-ltpB) ,C) +B
CHECK:A+( 2xC)+A B+(O,CHB Y+C+Y +( Q;tpA) I SK1

- 69 -
MAIN FUNCTIONS
BEVHOLT
This function computes the yield from a given recruitment by the method of Beverton and Holt.
V BF:VHOLT;MF:S;M; L;l\7 ; K;TI;'l'R; TC; V;RP;RFW; T1 ;T2 ;2''3 ;T4;FLG;FLG1 ;FLG2 ;SL ;P1 ;F;NO; 'l'L; B;C; Y; w'B; SV; IN; A ;CHECK; TIT; V; TFMP; VEC; INC; LIM; Z; KFP;IND; F01 ;FMAX; FLG9 ;'l'CI; 'l'CR;E'; V ;MA ;MAX ;D ;H;TOT;FT;FLAG3;I;DEB;EX;FP;N;OUTM;P2;TLC;IND;KKK;OUTF
[ 1l MFS.,_' ONE: PO SI'l'IV E V AWE'. RE· ENTli'R ' [2 1 ERl:'NATVRAL MORTALITY?' [3] +(A/(M>~),1=pM+,0)/ER2 [41 +F:Rl,Ot~ES [ 5 J ER2: 'ASYMPT01'IC WEIGHT?( GR) 1
[61 +(A/(W>0),1=pW+,0)/FR3 [ 7 J +FR2, Ot~I+MES [BJ ER3: 1 BRODY COEFFICIENT (PARAMETE:R K OF BRODY"S EQUA'I'ION)? 1
[9] +(A/(K$l),(K~~),1=pK+,0)/FR4
[ 1 OJ +FR3 I Ot~· MUST Bli' BE'l'WFEN 0 AND 1. RE-ENTER ' [11] ER4:'HYPOTHF:TICAD AGli' AT WHICH THli' FISH WOULD HAVE ZFRO WEIGHT ACCORDING '1'0 BRODY"S
EQUATION?' [12] +(1=pTI+,0)/ER5 [ 13] +E'R<+, Ot['!J+' ONE VALVF' ONDY. RE-ENTER 1
[ H] ERS:' AGE OF RFCRUITMFNT TO STOCK? 1
[15] +(A/(TR>~),l=pT/i'+,[i)/ER6
[16] +ERS,Ot~~MES [17] FR6:'AGF' AT FIRST CAPTURE?' [18] +(A/(TC>~),1=pTC+,[I)/E'R7 [ 19] +f/i'6, Oti'I+MF:S [2~] FR7: 'MAXIMUM AGE ATTAINED?' [ 21 J +( A/(TL>O) ,l.=pTD-•-,[!) /ER8 [ 2 2] +FR7, Ot[!Hv.'F.S [ 23] fRB: 'ENTEJI A VF'C'J'OH OF ZEROS AND\ OR ONFS TO INDICATE WITH RESPECT TO' [24] 'WHICH PARAMETERS THE SENSITIVITY COEFFICIENTS ARE TO BE CALCULATED:' [25] NATURAL MORTALITY' (' 1 BRODY COEFFICIENT' [ 26] AGE AT ZERO Wr:IGHT' < 1 AGF.' AT FIRS'I CAPTURE' [27] AGE OF RECRUITMENT' [28] +(A/((SV=0)vSV=1),5=pSV+,Q)/ER9 [29] +E'RB,O't[!i+'MUST BE A VECTOR OF 5 ELEMENTS WITH ZPROS AND/OR ONE'S' [30 1 F'R9:'MAXIMUM FISHING MORTAUTY IN OUTPU'l' TABDE' [31] +( A/(KKK>~) '1=pKKK•-.Dl!FS1 [ 32] -+FR9, O+[!~ME$ [33 1 FS1:+(KKK<5)/FS2 (' KKK+-5 [34:' ES2;KKK+5+KKK+f(KKKx1CJ) [35] IN+(SV=l)/lpSV [36J A+I+IND+l < FMAX+F01+6p0 ( FLG+FLC9+0 (' 'I'IT+ 6 35 p' ' [37] u+ 1 -3 3 -1 < TEM~VEC+M,K,TI,TC,TR [38] F+NO+B+C+Y+WB+((1++/SV),KKK)p0 (' FT+TOT+H+30p0 [39] DP1:R~*-VEC[l]><TCI~VEC[4]·VEC[5J [40] T1+VEC[2]xTCI+VEC[4]-VEC[3] [ 41 J T2+RP><TDC+T[.•VEC[ 4] [42] 1+1 (' V+2 ,~ FLC2 ..... F[A;IJ+~ (' "'DD [43] .4A:I+2 (' F[A;IJ-+-~.0001 ( FLG+-1 ( +DD [44] BB:SL+l000><Y[A;2] ( I+1 ( FLG+-2 [45] CC:I+I+l [46] +(((KKK-5)tl~)<F[A;I]+F[A;I~1]+0.1)/FF
[47] DD:P1+0 < N+l ( Z+F[A;I]+VEC[1] [48] EE:T3+Z+VEC[2]><N'"1 [49] P1+P1+(1·*-T3><TLC)x(U[N]x*•T1xN-1)tT3 [50] +( 5>N+-N+ 1) !FE [51] NO[A;I]+RPx(1•*~ZxTLC)tZ
(52] B[A;I]+RPxWxP1 [53~ C[A;I]+F[A;I]xNO[A;I] [54] Y[A;I]+F[A;I]xB[A;I] [55] WB[A;I]+Y[A;I]tC[A;I] [56] +((FDG=0),FLG=1)/AA,BB [57~ +((V=0),V=1)/Hfl,OO

[58J +CC [59] FF:I+I~l [60] -+(Ml )/PF1 [61] MAX+Y[1 ]tf/Y[1;]
- 70 -
[ 62 J FT[ 11+-P[ 1 ;MAX] ( L•-E+-V+O ( +II [63 FF1 :F'T[ LI+FMAX[ 1J ( [;<-E+V+0 ( +II [64] GG:MA+I+-I+1 [65] m4AX[A]+F[A;I]+FT[L] ( F[A;I]+F[l;I] ( •DD [66] HH:L+F+O ( V+l [67] +(11=1 )/HH1 [68] F1'[1:l•-FOH1J ( +II [69] Hlll:F'Z'[i}•-0. 7xFNAX[1J [70] +(FLG971)/II ( F'T+(pFT)pO ( FT[1]+0.1 [711 II:+(V/(30~L+L+1),(v/(IFT)>10))/VV [ 72} PL.+'J (' N+1 [ 73] JJ: IJ<-F'T[L] +VE'C[ 1 ]+ VEC[ 2 ]xN•1 [74] +(1CJ'J<ID)/NN [75] P2+-P2+U[N]x(*-(N-1)xVEC[2]xTCI)x((TLCxFT[L]xEX)tD)+(1•EX+*•DxTLC)x(D•FT[L])tD*2 [76] +(5>N+N-1)/JJ [ 77] TOT[L}+W><P2x*~VFC[ 1Jx'I'CR [7SJ +(V=1)/LL [79] KK:+(f,'=l)/MM [80] FT[L+l~+FT[L]-0,005 < E+l (+II [81] LL:TO'I[L}~-'I'O'I'[L]-SL ( +KK [82J M.M: +( 8. 000':JQ0Q'J1;> ITOT[L] )INN [ 83 J H[ LJ+-( TOT[ L] xF'I'[L]- F'I'[ L-1 J) t1'0'I'[LJ -'I'OT[ £<·1 J [84] FT[T.+l]+F'I'[LJ-l![L] < +II [85] NN:+(V='J)/GG [86] FP+I+1+1 [87l FOl[A}•-F[A;Jl·,..F'Z'[L] (: F[A;I]+F[l;IJ <' +DD [88] OO:DFB+( (pi+li), 7)p' ' [ 89] I+!£'[ 1 ;IJ [90] DFB[I!MA;l+'FMAX~-~• [91~ DEB[I!FP;]+-'F0.1 .. -~• [92:i ->(M1)/PP1 [ 93 J +QQ
[94] PP1:'l'TI'l'[A;J [95J NO[A;J+(19'J0xNO[A;]~NO[l;])fN0[1;] [96] B[A;]+(1'J00xB[A;]~B[l;])fB[l;] [97] C[A;l+(1000xC[A;]~C[l;])tC[1;] [98] Y[A;J+(100'J•Y[A;]•Y[1;])tY[l;] [99] WB[A ]+( lQ')QxWB[A; ]-WB[ 1 ;] )tWB[ 1; J [ lQ·)~QQ:. [10L1 ' FISHING EXP'"POP EXP-POP CATCH YIELD AVG. WEIGHT' [182] ' MORTALJ'l'Y NUMBFRS BIOMABS NUMBERS (Glr) (GR)'
[183] --~------ ------- ------- ------- -----------' [104] C[A;1J+Y[A;1]+'J [ 1 Q5: OU'TM+NO[A; I] ,B[A; I] ,C[A; I] ,Y[A; I] ,WB[A ;IJ [1')6~ OUTM[ 1+4><KKK·2J-•-O [1Q7JQQQ +(A>1)/QQR [l:J8~ (vDf'B), 7 3 12 3 10 'J 10 3 8 Q 11 0 1'01(6,KKK-2)p(F[l;l],OU'l'M) [189: FISHMOHT+F[l;IJ (' YIF.'LDP8RRf'.'CRUI2'+Y[1;IJ (' MEANWFIGHT+WB[l;I] [110JQQR:(A>l)/('l'DEB), 7 3 12 3 10 3 10 3 8 3 113 1'0l(6,KKK-2)p{F[l;I],OUTM)
[111 1 +((piN)<l)/WW [112J VEC•-TEMP [113J VEC[IND]+VEC[INDJ+I(0.001><VEC[IND<-1+IN]) [114l A+A+l ~' ' ' [115} +( Cn!D~2), (IND=3), (IND=4), (IND= 5)) IRR ,SS ,T'I' ,T1' 1 [116] TIT[A; ]+'SENSITIVITY TO NATURAL MORTALI'l'Y ' ( +UU [117]RR:TIT[A }•-'SENSITIVITY TO BRODY COEFE'ICI!>.'N'I'(K)' <' +UU [118]SS:1'TI'[A; }<-'SENSITIVl'l'Y TO AGE' A'I' ZF:RO WEIGHT 1 C: +UU [119-;TT:'I'IT[A;]+'SENSITIVITY TO AGE A'I' FIRS'!' CAPTURE' t +UU [12'J]TT1:'IIT[A;]+'SF:NSITIVITY TO AGE OF RECRUITMENT [121JUU:IN+HIN:: +LP1 [122]VV:+(FLG9=1)/NN (' ' ' f 123 ~ 'WARNING: CONVERGENCE: CRI1'fo:RION NOT SATISFIED AFTER 30 ITE'RA'I'IONS.'

- 71 -
(124: ' THE VALUE OF FMAX AND 'lHll' CORRESPONDING DERIVATIVES MAY' [125] 1 BE INACCURATE'.' (' '·C': FLG9+1 ( +NN [126]WW:FLAG3+A [127l +(FLAG3=1)/0 [128l A+-1 (' ' ' [129] 'SENSITIVITY OF FMAX AND F0.1 TO PARAMETERS' f' ' '
[130] ' PARAMETERS FMAX F0.1' [131] ' ~--- .. -~~~- ~"'--' [132] IN+(SV=l )hpSV [133]WW1:A+A+1 (' lND+l+IN [134] +(A>FLAG3)/0 [135] F.MAX[A]+(1000xFMAX[A]~FMAX[1])fF.MAX[1] [ 136 J FOl [A]+( 1 00'JxF01 [A J .. ·F01 [1 J )fFO 1 [ 1} [137] OUTF+(FMAX[A],F01[A]) [l38]WWW:('¥TI1'[A;l), 15 4 15 4 l'OUTF [139] IN+l+IN 0 +WW1
v

- 72 -
COHORT
The function COHORT calculates population numbers at age and the instantaneous rate of fishing mortality at age by using the method of cohort analysis described in Pope (1972). If information on weight is also provided in input, the function calculates population biomass at age, as well as total and net production,
The function COHORT calls the utility functions OUT, HEADER, OUTiiF• TABLE and DAT.
V COHOR'J: ;J; I ;MORT; FI; FC ;X; YR; Y;TIT;NAM ;CATCH ;A ;CHECK;CHECKl ;CHECK2; ZZ; YY ;POP ;CTEMP;FIT;FCT;F;SUB;SENSM;SENSMF;SENSMF1;XX;K;L;IN1;XK;IK;JK;M1;M2;Z
[ 1] A-<-CHEC K+ZZ+ YY-<-1 [2~ NAM+ONL 2 ( FLAG+O [3] FRO:'NAME OF CA'l'CH MATRIX? ••••• ' [4] +(V/NAMA. (' '~X)/X+,~)/OK1 [5] +ERIJ,Oti!J+'NAM8D MATRIX DOES NOT EXIST. RE•ENTER ' [6] OK1:+(2=ppCA'l'CH+H)/OK2 [7] +ERO,Ot[VH( ':t:X)/X),' IS NOT A MATRIX.' [8} OK2 +(A/0S,CATCH)/ER05 [9] +O,Oti!J+'N8GATIVE VALUES IN CATCH MATRIX.' [10] EROS:' ' r 'SENSI'l'IVITY ANALYSIS '1'0 BE PERFORMED (YES OR NO)?' [ 11] +( (A/' YES' =3tCHECK1), -A/' NO' =2tCHECK1+( ' ':t:CHE'CK1) /CHECK1+ ,['J) IER1 ,EROS [ 12] ER1: 'FIRST y·gAR, YOUNGEST AGE GROUP AND FIRST FULLY RF:CRUI'l'ED AGE-GROUP?' [13] •(A/(X=fX),(OS3tX),3;::pX<-,O)/OK3 . [ 14] -~FR1, O+i!J+' MUST BE 2 NON• NEGATIVE INTEGERS. RE .. ENTER 1
[15] OK3:YR+(-1+X[1])+lJ+(pCATCH)[2] [16] AG+(-1+X[2])+ti+(pCATCH)[1] [ 17] POP...F4-MORT+SENSM+( 4 ,I ,J) pO [18] ER2:'NATURAL MORTALITY?' [19] +(V/(1,I)=pM<-,OJ/OK4 [ 20] +ER2, Oti!J+' FITHER 1 OR ', (vi),' NUMBERS. RE•ENTER 1
[21~ OK4;+(A/M?O)/OK5 [22] +ER2,0t'!"r+-'MORTALITIES MUST BE POSITIVE. RF•EN'l'ER' [23] OKS:'WEIGHT AT AGE KNOWN(YF:S OR NO)?' [ 24 J +( (A/' NO' =2+CHFCK2) ,-A/ 1 YF:S' =3tCHECK2+(' • :t:CHECK2) /CHECK2+,f'J)/ER3 ,OKS [25] BMASS:'EN'!'ER WEIGHT AT AGE DATA (KG): VECTOR OR MATRIX' [26] +( A/{A/04/GT), (2=ppWG'l'+O) )/MAT [27] +(l=ppWGT)!VECTOR [28] ERROR:+BMASS,Oti!J+' WEIGHTS MUST BE POSITIVE [ 29] VECTOR:+( ( pWGT) =pCATCH[ ;1 J )/RE'SHAPE [30] +BMASS,Oti!J+'DIMENSION MUST AGREE, ' [31] RESHAPE:WGT+(( 1)~GT [ 32] FLAG+l <': +PRIN'I'OPTION [33] MAT:+((pWGT):t.pCATCH)/EMASS [34] PRINTOPTION ~'ENTER 1 IF MATRIX IS TO BE PRINTED. OTHP.RWISE ENTER O.' (35] 'ONE NUMBE!< IS REQUIRED FOR EACH MATRIX' [36] 'CATCH BIOMASS' ~ 'MEAN WEIGHT OF INDIVIDUALS IN CATCH' [37] 'WEIGH'l'S AT THE BEGINNING OF THE YEAR' [38] 'POPULATION BIOMASS AT THE BEGINNING OF THE YEAR' [39] +(A/(4=+/(1=PRINTMAT),(O=PRINTMAT)),4=pPRINTMAT+,0)/ER3 [40] +PRINTOPTION,Ot~~'RE~EWTER [41] ER3:'F VALUES FOR LAST YEAR (',(v-1tYR),')?' [42] +(V/(LI)=pFI+,O)/OK6 [43] +E'R3,0+i!J+'EITHER 1 OR ,(vi),' NUMBERS. RE~ENTER' [44] OK6:+(A/FI>O)/ER4 [ 4 5] +ER3, Otf"r!-' MORTALITIES MUS'l' BE POSITIVE. REP ENTER ' [46] 8Ri+: F VALUE:S FOR OLDEST AGE GROUP ( ,(v-HAG),')?' [47] +(V/(1,J)=pi'7C+,O)/OK8 [48] +ER4,0H'J+-'E1THE'R 1 OR ',(vJ),' NUMBERS. RF'"ENTER' [49] OKB:+(A/FC>O)/OK9 [50] +ER4 Otf'J+' MORTALI'l'IES MUST BE POSITIVE. RE,.ENTER ' [51J OK9:V+X[3]-AG[1] [52] RET:F[A ;I; ]+FC+JpFC [53] F[A [54] pM) [55] POP[A ;J]><FI+MORT[A ;J])tE'I><1"'*.,.FI+MORT[A;;J] [56] POP[A ;I; ]+-(CA'l'CH[I; ]xFC+MORT[A ;I;] )+FC
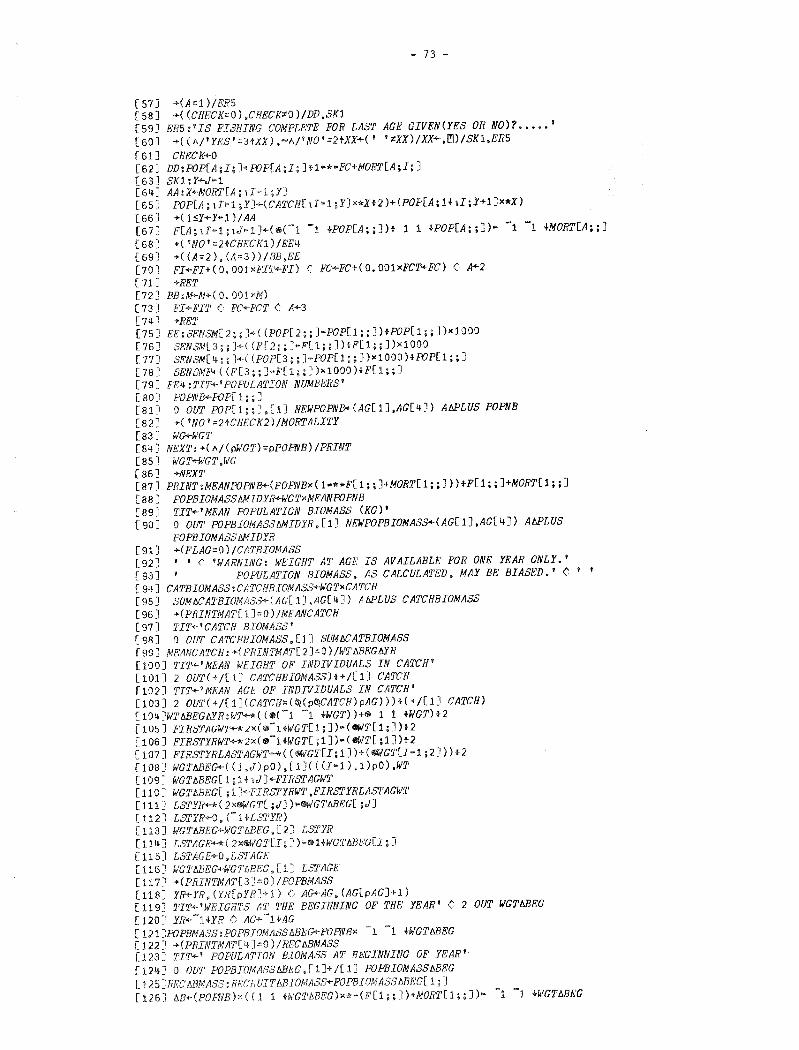
- 73 -
[ 57 J +(A = 1 ) I ER5 [58] +((CHRCK=O).CHECK~O}/DD,SK1 [59] ER5:'IS FISHING COMPLETE FOR LAST AGE GIVEN(YES OR NO)? ••••• ' [601 +((A/ 1 YES 1 =3tXX),-A/ 1 N0'=2tXX+( 1 '~XX)/XX+,~)!SK1,ER5
[ 61] CHECK+O [62] DD:POP[A ;I; ]+POP[A ;I; ]i-l"*'"FC+MOR1'[A ;I;] [63] SK1 :Y+J"'1 (64] AA:X+MORT[A;,I-1;Y] [65] POP[A;ti~1;Y]+(CATCH[ti-1 x*Xi2)+(POP[A;1+li;Y+1]x*X) [66] +(1S:Y+Y•1)/AA [67] F[A;;I~1;1J-1]+(e(-1 -1 *POP[A;;])t 1 1 +POP[A;;])• -1 -1 +MORT[A;;] [68] +('N0'=2tCHECK1)/EE4 [69] +((A=2),(A=3))/llB,EE [70] FI+FI+(0.001><FIT+FI) <: FC-+-FC+(0.001xFCT+FC) ( A+2 [71] +RET [72 J BB :M<-M+( 0. 001 xM) [ 73] FI+-FIT ( FC+-FCT ( A+3 [74] +RET [75 J EE': SENSM[ 2;; ]+( (POP[2;; ]·POP[1;;] )iPOP[l;;] )><1 000 [76] SENSM[3;;J~((F[2 ;] .. F[1;;])+F[1;;])x1000 [ 77] SENSM[ 4; }•-( (POP(3;; ]-POP[1;;] )xl 000 )H'OP[ 1;;] [78] SENSMF+((F[3;;]-F[1;;])x1000)fF[1;;] [79] E'F4 :TIT+'POPULATION NUMBERS' [80] POFWB+POP[1;;] [81] 0 OUT POP[1;;J,[1] NF.WPOPNB+(AG[1],AG[4]) AM'LUS POPNB [82} +( 1N0'=2+CHFCK2)/MORTALITY [83] W~WGT [84 J m,'XT: +C A/(pWG'l') ==pPOFWB) !PRINT [ 8 5 l WGT+-WG'l' ,WC [86} +NEXT [87] PRINT:MEANPOPNB+(POPNBx(1•*~F[1;;]+MORT[1;;]))iF[1;;]+MORT[1;;] [88] POPBIOMASSAMIDYR+WGTxMEANPOPNB [89] TIT+'MEAN POPULATION BIOMASS (KG)' [90] 0 OUT POPBIOMASSAMIDYR,[1] NEWPOPBIOMASS+(AG[1],AG[4]) AAPLUS
POPBIOMASSAMIDYR [91] +(FLAG=O)/CATBIOMASS [92] ' '~'WARNING: WEIGHT AT AGE IS AVAILABLE FOR ONE YEAR ONLY.' [ 93] POPULATION BIOMASS, AS CALCULATED, MAY BE' BIASED. 1
( 1 1
[ 94] CATBIOMASS:CATCHBIOMASS+-WG'J'xCATCH [95 J Sl!MllCATBIOMASS•(AG[ 1J ,AG[4 J) AM'WS CA'l'CHBIOMASS [96 J +(PRINTMAT[ 1]=0 )/MEANCATCH [97] TI'l'+'CATCH BIOMASS' [98] 0 OUT CATCHBIOMASS,[l) Sl!MllCATBIOMASS [99] MRANCATCH: +(PRINTMAT[ 2]=0)/WTMJEGMR [100] TIT+'MEAN WEIGHT OF INDIVIDUALS IN CATCH' [101] 2 OUT(+/[1] CATCHBIOMASS)t+/[1] CA2CH [102] TIT+'MEAN AGE OF INDIVIDUALS IN CATCH' [103] 2 OUT(+/[1](CATCHx(~(p~CATCH)pAG)))+(+/[1] CATCH) [104]WTMJEGAYR:WT~*((®(-1 -1 •wGT))+e 1 1 +WGT)i2 [ 105] FIRSTAGW'l'+* 2x(e-HWGT[1;] )~{ <IWT[ 1;] )f2 [106] FIRSTYRWT+*2x(~-1+WGT[;1])•(8WT[;1])t2 [107] FIRSTYRLASTAGWT4~((.WGT[I;1])+(~GT[I~1;2}))t2 [108] WGTMJE~((1,J)p0),[1J(((I•1),1)p0),WT [109J WGThBEG[ ;1+iJ]+FIRSTAGWT [110] WGTMJEG[ ;ll+FIRS'l'YRWT,FIRSTYRLASTAGWT [ 111 J LSTYR+*( 2xt~WGT[ ;J] ),.(//)f/G'J'MJEG[ ;J] [112] LSTYR+O, CHL.'3'l'YR) [113] WGTMJEG<-WG'l'8BEG,[2] LSTYR [ 111~ J LSTAGE+*( 2x(//)f/GT[I;] )-~HWGTMJEG[I; J [115] LSTAGE+O,LS'l'AGE [116] WGTMJE~WG'l'8BEG,[ ] LSTAGE [117] +(PRINTMAT[3:=0)/POPBMASS [118] YR+YR, ) C A~AG, (AG[pAG]+1) [ 119] TIT+'WEIGHTS A'l' THE BEGINNING OF THE YEAR' ( 2 OUT WGT6BEG [120] YR+-ltYR 0 A~-l+AG [ 121 ]POPBMASS:POPBIOMASSMJBG<-POPNB>< -1 -1 tWGThBEG [122] +(PRINTMAT[4]=0)/REC6BMASS [123] TIT+' POPULATION BIOMASS AT BEGINNING OF YEAR' [124] 0 OUT POPBIOMASSMJEG,[1]+/[1] POPBIOMASSMJEG [ 125 ]FF:C 11BMASS: 1;] (126] 6B+(POFWB)x((1 1 +WGTABEG)><*-(F[1 ;])+MORT[l;;J)• -1 -1 +WGT6BEG

[ 127] NE''l'PROD<-( +/[ 1] AB)+RECRUIT!JBIOMASS [ 128] FISHINGBIOMASSLOSS+CA'l'CHxWG'I' [129] DT<-MORT[l; ]xPOPBIOMASS!JMIDYR [ 130] BG<-M+DT+FISHINGBIOMASSLOSS
74 -
[131] TIT+-'DISTRIBUTION OF GHOWTH OVER AGES (PER CE'N2')' ( 1 OUT(BG+((pBG)p(+/[1] BG)))x100
( 132] PRODUC1"ION+( +/[ 1] BG)+RECRUl'l'bB.TOMASS [133] LB+'RE'CRUITMENT BIOMASS GROviTH TOTAL PRODUC'I'lON LOSS THROU
GH FISHINGSURPWS PRODUC'l'ION NET PRODUCTION [134] LB+- 6 20 pLB [ 135 J TIT1+' SOURCF:' (' 'J'IT+' PRODUC'l'ION [ 136 J Ol!lM+RECRUI'l'nBIOMASS, ( + /[ 1 J BG) ,PRODUCTION. ( + /[ 1] FISHINGBIOMASSLOSS) • (
PRODUC'l'ION<-+ /[ 1] DT) ,NET PROD [137] OU7M+(6,pYR)p0l!JM [ 13 8 ] SECT+ 3 3 [139] 0 TABLE OUTM [140J DATA1+(-3 0 +OUTM) [ 141 J DATA!:JYJr'4 ·1 00><( 1, pYR) pYR [ 142 J DATA 2+( 2, pYH) p(OUTM[ 5;] ,OUTM[ 4;]) [ 143 J TIT+' PRODUCTION I BIOMASS RATIO' [ 144 J 2 OUT(PRODUC'J'IONt ( + /[ 1] POPBIOMASS!:lMIDYR)) [ 145 ]MORTALI'I'Y: FWGT+( +/[ 1]( ((V, O)+POPNB)x ( (V, O)+FISHMORT+F[ 1;; J)) )H/[ 1]( (V • O)+
POPNB) [146] 'l'IT+'FISHING MORTALITY' (' (V+AG[1J) Ol!J'!JF FISHMOR'J',[1] FWG'l' [147] +( 'N0'=2tCHE:CK1)/0 [ 148] SUB+' PARTl!lL DERIVATIVES OF POPULATION WITH RF'SPECT TO PARAMFTERS' (
HEADER SUB [149] TI'l'+'SFNSITIVITY TO TERMINAl. F' (; 3 OUT S!i"NSM[2;;] [150} TIT+'SFNSI'riVITY TO NATURAL MORTALITY' (' 3 OUT SENSM[4;;] [ 151} OVERSENS+(S8NSM[ 2 ;1; ]* 2 )+SRNSM[ 4; 1; ]* 2 [ 152] SUB+' PARTIAL DERIVATIVES OF l\STIMATED F WITH RE.'SPE'C'J' TO PARAMETERS' (;
!!FADER SUB [153] TIT+'Sf:NSITIVI'l'Y TO 'I'ERMINAL P' ( 3 OUT SENSM[3;;] [154] TIT+'SFNSITIVITY TO NA'I'URAL MORTALITY' C 3 OUT SENSMF [155] SUB+'PARTIAL DFRIVATIVES OF POPULAUON NUMBERS FOR YOUNGF.ST AGE GROUP' [156] HEADEN SUB [157J XK+( 1 ;])pO (; J+I+lK+JK+O [ 15BJEEO :!<+( -J. 5) [ 159]E'E1 :I+I+1 (; J+J+l < K+K+1 [160] XK[I;J]+(CATCH[l;J]x(*(MOffl[1;I;J]xK)))fPOP[l;(I~K·0.5);(J-K•0.5)] [ 161 +( (I=pFI)v(,J=pFC) )/F:E2 [162' +FI-:1 [163]F'l\2:+(1K:::(( 1))/EE3 [ 164] I+IK+IK+1 ( J+O (' +-EEO [165]EF:3:J+JK+JK+1 < < +(JK<pFC)/FE'O [166] M1+(pFI)pMORT[ ;pFC] [ 167] M2+( pFC) pMORT[l ;pFI; J [ 168 J FIT+XK[ ;pFC]><FIT..,-( pXK[; pFC]) pF'IT+( ( *( .. 0. 5><M1) )xZt(FJxl .. *( ~Z+-Fl +Mi))) [ 169 J FCT+XK[pFI; ]><F'C1'<-( pXK[pFI: J) pFCT+( ( ( *{ -o. 5xM2)) t(FC)) x (Z+FC+M2)) [170! +( 'YES'=3tXX)/EE'6 [ 171 J FCT+FCTHN1+( pFCT) piN1+( 1'"*'"Z) [ 172 ]F.86 :XK[pFI; J~-FC1' ( XK[ ;pF'C]+PIT [173] TIT+'SF.'NSI'J'IVITY '1'0 INDIVIDUAD CATCH VADUES' C 3 OUT XK [174-] OVERSENS+OVERSENS+XK[ ;]*2 < I+l [ 175 ]SliM: OV FRSF:NfJt.-OVE'RSl!1'NS+ ((I tX K[ I+ 1 ] ) fftioO )* 2 [176] I+I+1 [1?7] +( (( HpXK)-I)>O)/SiJM [ 178] OVERSF:NS<-OVERSENS*O. 5 [179] 'l'IT+'OVt:RALL SC:NSI1'IVI'l'Y OF RE'CRUITMENT [180] 2 OUT OVERSENS [181 J ISP+( +/OVE'RSE'NS)tpOVERSE'NS [182] ' I (' 'OVF:HAU SENSITIVITY IND!i'X: I' VfiSP
'J

- 75 -
GRAPH~PRODUCTION
The function GRAPH~PRODUCTION can be used after a call to the function COHORT in order to generate a graph showing the variations of the components of production (recruitment, growth) through time.
[ 1 J [ 2 J [3] [4] [ 5 J [6] [7] [ 8 J [9] [ 10] [ 11] [12]
V GRAPHAPRODUCTION ASUPERPLOT 'RESET' PER+l
v
NEWTITLE 'PRODUCTION VERSUS TIME' NEWLABE'L 'RECRUITMENT ,GROWTH ,TOTAL PRODUC'l'ION' ASUPERPLOT 'XLABEL,YEARI' ASUPERPLOT 'YLABEL,COMPONENTS OF PRODUCTION/' ASUPERPLOT 'LINE,1,STR,BLACK,DOT,0,1/' ASUPERPLOT 1 LINE',2,STR,BLACK,SDASH,A,11' ASUPERPLOT 'LINE,3,STR,BLACK,SOLID,V,1/ 1
DATA+DATAAYR PUT DATAl PLOT ABOVE
GRAPH~NET~PROD
The function GRAPH~NET~PROD can be used after a call to the function COHORT in order to generate a graph showing the fluctuations of annual net production (the area between the two lines plotted) through time.
V GRAPH t.NETAPROD [1] ASUPERPLOT 'RESET' [ 2 J [ 3 J [ 4 J [51 [6J [7] [8] [ 9 J [ 1 ·J J
v
PER+1 NEWTITLE 'SURPLUS PRODUCTION AND YIELD VERSUS TIME' NEWLABEL 'SURPLUS PROD,FISHING LOSS' ASUPERPLOT 'YLABEL,PRODUCTIONI' ASUPERPLOT 'LINE,1,STR,BLACK,SOLID,0,11' ASUPF.RPLOT 'LINE,2,STR,BLACK,DOT,6,1/' DATA+-DATAAYR PUT DATA 2 PLOT ABOVE
PMNOl.ISMOOTH
The function PR~NO~SMOOTH calculates 'partial recruitment' figures and store the results in the global variable SEL,
V PRANO~~OOTH;INTERSEL [1] ~AX+[fFISHMORT 0 I+1 [2] SEL+((piNTERSEL),1)piNTERSEL+-FISHMORT[;I]+F.MAX[I] [3] NEXT:+((pFMAX)<I+I+1)/PRINT [4] SEL+SEL,((piNTERSEL),1)piNTERSEL+FISHMORT[;I]+FJMAX[I] [5] +NEXT [6] PRINT:TIT+'SELECTIVI1'Y COEFFICIENTS CALCULA'l'ED WITHOUT SMOO'l'HING' [7] YR+-1+YEAR+tpFISHMORT[1;] [8] AG+-1+AGE+tpFISHMORT[;1] [9] 2 Olfl' SEL
v

- 76 -
MPROJECT
The function MPROJECT prepares input data required by MPROJ. The function MPROJECT also calls ~ROJOUT, which function prints the output tables evaluated in MPROJ, The function MPROJECT provides also for more projections from the same data when desired, MPROJECT may be seen as the "main" program, which calls the different subroutines necessary to perform the catch projections and to output the results.
[1J [2:1 [3] [4J [5J [6] [7J [BJ [ 9] [ 1 0] [ 11J [12] [13] [14J [15] [16] (17] [18] [ 19] [ 20l ( 21] [ 22~ [23]
[ 24] [ 25] [26] [ 27,
[ 28:1 [29~ [30] [31] [321 [33] [34 1
[3!;} [36] [37] [38] [39] [40:' [ 41] [42] [43J [44] [45] [46] [47] [48] [ 49] [50j [51] [52] [53] [54] [55] [56 J [57:
V MPROJFCT; Yli'; AG;X ;N; ANS; Y; POP; CAT; SEL ;MAT;REC;CURR; F;SE'NSM; A ;D;I;ONES;SUB;1TT;REX1 ;OU'l'M; OU'l'Ml; CHF:C Kl ;CHF.CK2
FR1: 'FIRS'!' YEAR AND YOUNGFS'I' AGE GROUP? 1
+(A/(X=fX),(Os2tX),2=pX+,Q)/ER2 +ER1, Otl11+1 MUST BF 2 NON-NEGATIVF: IN'l'P:GFRS. RE·ENTI\'R '
F'R2:'NUMBFRS AT AGF FOR ',(vX[1]), '?' +( A/OSPOP... ,[1) I FR3 +ER2, Ot~i+' POPULATION NUMRERS MUS'l' BE POSITIVE. RE-EN'l'EH 1
FR3:AG+-l+X[2~+tpPOP CAT+( pAG)p-1
ER4:'CA'l'Cfl AT AGE KNOWN FOR ',('fX[1]),'?(YRS OR NO)' +( (A/' NO' =2+Cl!F'CK) , ~A/' YF'S' =3tCl!ECK+-( 1 '~HF:CK) /CHECK+ .~i) I ER6 ,ER4
ER5:'CA'l'CH AT AGF' FOR 1 ,(vX[1]),'?' •( A/(CA'J?O). (pAG)=pCAT+,[l)/SK1 ->-FRS,Ot['I-+-'ONE NON•NEGATIVF CA7'CH FOR F.ACH OF ',(vpAG),' AGES. RF.-F:N'l'ER'
SK1:+(A/CATSPOP)/FR6 -•FRS, Ot['i+'CA'l'CHFS MUS'l' Br. U:SS THAN POPULA'l'ION NUMBFHS. RF-EN'l'Ell '
FR6:'WFIGH'l' AT AGf? (KG) :VECTOR OR MATRIX' +(A/ (vI ( ( pCAT) =pWG), ( (ph G)[ lJ=pCIIT)), OSWG+{I) /FR7 +ER6, Ot['i+'ONE NON~NFGATIV! WF.IGHT FOR r:ACH OF ', (11pAG),' AGES. RF:~FNTER 1
FR?:'PAR'J'IAL RF:CRUI'l'MFN7 TO FISHING?(VAWES BE'JWEEN 0 AND 1)' +( (pAG)=pSf:L+-,[I)/SK2 +FR?. Ot[',<+'ONF: VAWE FOR EACH OF I. (VpAG). I AGES. RF-F:N'l'"Rft I
SK2:+( 11/(V/SFU-0), (SF£?0) ,SEL:>1 )/ER8 +FR?, Ot['l+' PAHTJAL RECRUI'J'MFNTS MUS2' Bl· BFTWF:F:N 0 AND 1 AND A'l' DE'AST ON F. VAWE' MUST DIFFFH FROM o. RF-FNTER I
FR8: 'NATURAL MORTALITY?' +(vI ( 1, pAG) =pM+,[ i) /SK3 +FH8,0t['J•-'EI'l'HF:R 1 Off ',(lp/IG),' VAL/JP'S. RF:-FN'l'ER I
SK3:+(11/M>O)/FR9 +F'R8,0tl'I-+-'MOm'ALITIE'S MU::)T Bf, POSITIVt. RF.-F:NnH '
ER9: 'NllMBER OF YF:ARS TO BF PROJF'CTW?' +<A/< 1 =pYH) • <Y R= r Y H l , 1 <Y H+-. m; sK4 +ER9, Ot['l+-'A POSI'l'IVF IN'l'FGER GRE'A'l'E:R TH!IN ONE. RF'-EN'I'ER 1
SK4:YR+-1+X[1}+,YR FR10:'RFCRUITMF'N'l' FOil ',(lYR[2]),' TO ',(v-HYR),'?' +(A/ (R[C?O)' c 1 +pYR) =pREC+ ,[J) I SK6 +FRIO, Ot['l+( ,-l+pYR),' POSITIVF: VALUES. RF.•ENTER '
SK6 :Y+ YR[ 1 J+v /-1 :t ,CAT +( Y=YR[l J) I SK5 D+-( pYA') -1 -+-EH13
SK5 :D+-( pYR) F:R13:'QUOTA <IN BIOMASS) 011 F VALUr:S FOR 1 ,(11Y),' TO ',(v-HYR),'?'
---< A/(IJN&o >, < pYR! =pANs+-< <Y7YR[ 11) ;::>) .rv ALb.Qu+- .m 1 FR14 +ER13, Ot~f<.-("!'D),' NON.,.NEG!ITIVF' NUMBERS. RE•ENTER 1
FRH:' ' (' 'MATURITY FIGURF:S TO BE CALCULATRD?(YES OR NO)' M!lT+( pAG) pO -+-( (A/'N0'=2tY) ,-A/'YE'S'=3tY+-(' ':tY)/Y+{!J)/ER16,ER14
f<R15 :I MA'l'URI'l'Y AT AGE?. -+( ( pAG) =pMAT+ ,[])I SK? ~ER15, O+['l+'ONE VIILUt: FOR l\ACfl OF ', (vpAG), 1 AGES. RE•EN'l'FR '
SK? :+(A/ (MAT?O) ,MA'T'Sl) I ER16 +ER15, Otf'J<-'MA'l'URITit:S MUST BE BETI;'EEN 0 AND 1. RF-F.'N'l'ER '
F'R16:' ' ( 'SENSITIVITY ANALYSIS TO BF PERFORMED (YES OR NO)?' +( ( 11/ 1 YE:S I =3+CHEC K 1) ,-A/' NO. =2tCHECK 1+-(CFJECK17- 1 ') /Cl!ECKl+,['J) /ER17 ,/?R16
E:R17 :RFC1+REC SK8 :-+-( 1 =ppWG) I VFCTOR
I>'G1'<-WG •SK9
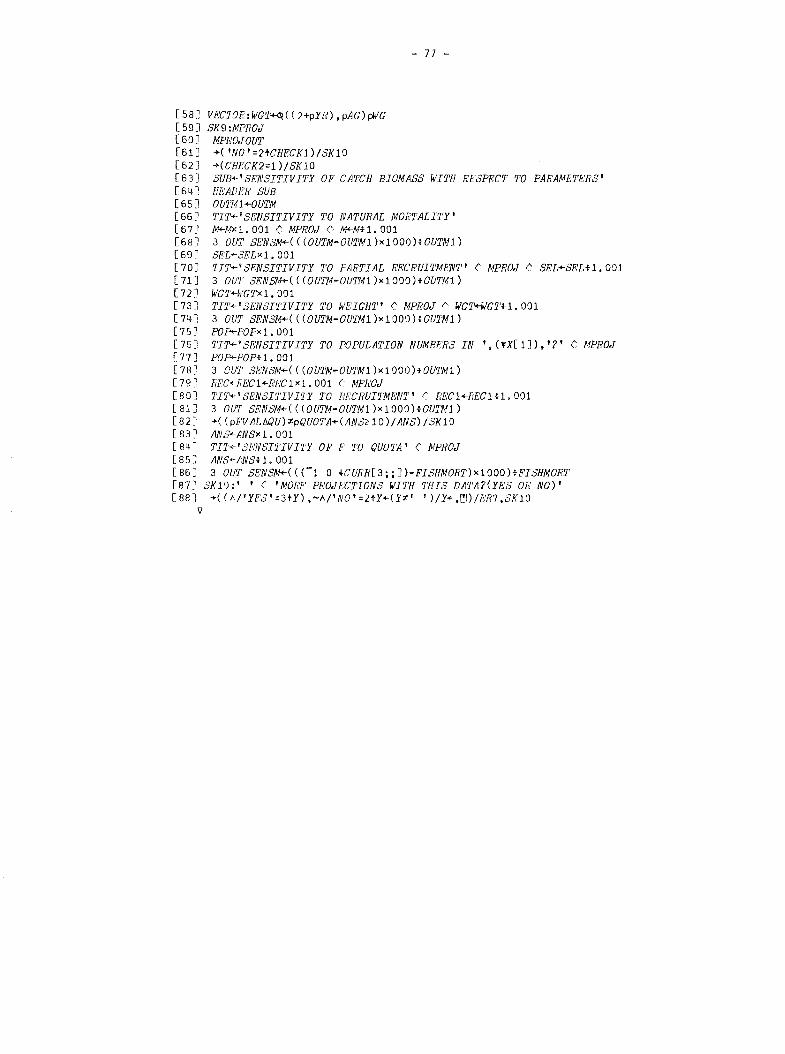
[58 J V l\'C'l'Oli: WGT-Hsl ( ( 2+pYR) , pAG) r;WG [59] SK9 :MPROJ [60} MPROJOUT [61] +( 'N0'=2+CHECK1)/SK10 [62] +(CHECK2=1)/SK10
- 77 -
[63] SUB+'SENSITIVITY OF CATCH BIOMASS WITH RESPECT TO PARAMETERS' [64] HEADFR SUB [65] OW'Ml+OUTM [66} TIT+ 1SENSITIVITY TO NATURAL MOR'l'ALITY' [67) /v,'<-Mxl. 001 C MPROJ C M+MH. 001 [68] 3 OUT SENSM+(((OUTM•OUTM1)x1000)+0UTM1) [69] SEL+SELxl. 001 [70] TIT+'SF:NSITIVITY TO PARTIAL RECRUITMENT' C MPROJ C SEL+SI'.'LH.001 [71] 3 OUT SENSM+(((OUTM-OU'l'Ml)xlOOO)+OUTM1) [72} WGT+ftiGTxl. 001 [73] TIT+' SENSITIVITY TO WEIGHT' ( MPROJ ( WGT+WG'l'H. 001 [74:i 3 OUT SF.'NSM+-( ( (OU'I'M·OUTMl )x1000)tOUTM1) [75] PO~POPx1.001 [76} 'l'IT+'SE'NSITIVITY TO POPULATION NUMBFRS IN ',(1'X[l]),'?' C MPROJ [77] PO~POPtl.001 [78] 3 OUT SE'NSM+(((Ol!'l'M-OUTM1)x1000)tOUTM1) [79 J REC+REC1+li'EC1 Xl. 001 ( MPROJ [80] TIT+'SE'NSITIVI'IY TO RF.'CRUITM!\'NT' f' REC1+RECH1. 001 [ 81 J 3 Oll'l' SENSM+-( ( (OUTM·OUTMl )x 1000 )tOU7'1\!1) [82] +((pFVALAQU)~pQUOTA+(AN~~10)/ANS)/SK10 [83] ANs+ANSx1.001 [ 84] TI'I+'Sl-:NSI'l'IVI'l'Y OF F TO QUOTA' (' MPROJ [85] ANS+JINSH.OOl [86:! 3 OUT SENSM+((Cl 0 KUHR[3;;])·FISHMORT)xlOOO)tFISHMORT [87] SK10:' 1
( 'MORf' PROJF'CTIONS WITH THIS DJITJI?(YES OR NO)' [88] +( ( A/'YF'S 1 =3tY) ,-A/ 1 N0'=2tY+(Y~· ')/Y+,f'j)/F:R7,SK10
II

- 78 -
MPROJ
The function MPROJ calculates population numbers and biomass, catch (both in numbers and biomass), age-specific fishing mortalities and sensitivity coefficients with respect to certain parameters, The function MPROJ performs all the calculations by using the data entered as input information in MPROJECT.
V MPROJ;C;C1;C2;X;Z;ZS;S [ 11 INIT:CUR!i+-( 3, ( pAC), pYFi') p-1 [2l CURR[1;; 1]+POP [3:: CURR[2;;1]+CAT ~" RF:C+RE'C1 {' CEJF:CK2+0 [4' X+-1 [ 5' FINP: +( ( v /CUR!i[ 2; ;X] :1'-1) ,ANS[X]?: 10) /CHF:Cl': ,YIC ALC [ 6-, CUliR[ 3; ;X]+-SFLxANSE:A :1 [ 7' CUR/1[ 2; ;X]+-CUJIR[ 3; ;Xl CALCC CUJIR[ 1; ;Xl [ 8-. +UPDATE' [g·· C!IF'CK:CUJ1R[3: ;X]+-Srt; [ 1 ') +( A/CURM 1; ;X] >CURl\[ 2: ;X]) I ADJUS'l' [11 'CATCH G!IFA'l'F'li THAN POPUL/i'liON' [ 12 CURFr[ 2; ;X]+CU!:ll[ 2: ;X] lCURH 1; ;X] [ 13 !IDJUS'l: C+-CURR[ 3; ;X] C!IDCC CURR[ 1; ;X] c 14 ... co. op r; !c-culiM 2: :xJ l ;uPDATE [15 ·: C1+--(CWiR[3; ;X]xCUhli'[ 1; ;X]tCURR[3; ;X]+M)x*·CU!di[3; ;X]+M [ 16 ., C2+-• (CUHR[ 1; ;X] xMt (CURli[ 3; ;X]+M)* 2 )x 1-*-CUR!i[ 3; ;X]+M [ 1 7~ ClJRR[ 3; ;X]+CUJih[ 3; ;X] ·(CUhli[ 2; ;X] -C).;Cl +C2 [1&' +ADJUST [19~ YICALC:CUR!i[3;;X~+-SE:D [20: +(ANS[X] <+ /w'GJ[ ;X] xCUliR[ 1; ;X]) I ADJ'l'O@O [21~ 'QUOTA GREATLh THAN FOPUDAHON BIOMMS FOR YF:AR ',(~YH[lJ+X-1) [ 2/-, CUliR[3; ;X]+-Sn ' Cl!F'CK2+-1 [ 23 CUJIR[ 2; ;X]+CUF!i [ 3; ;X] C!IFCC CU!rli[ 1; ;X] [ 24' +UPDM'F [25~ ADJ'l'OOUO:ClJRJ1[2;;X]+CUHR[3;;X] C!ILCC CU!iR[1;;Xl [ 26, +( o. 01 > IANS[Xl-+ /w'CT[ ;X] xCURR[ 2: ;X]) /UPD;';'J'F: [ 27 ·; CUH!i [ 3; ;X]+CUHR[ 3; ;X] xANS[X] f+ /11-'CH ;X] xCURb'C 2; ;X] [ 28 ·, +ADJTOQUO [29~ UPDAT!':: +( ( pYR)<X+-X+1 )/FXIT [30:' CUHR[ 1; ;X]+-( l+HFC), -HCUliR[ 1; ;X]+CUR!i[ 1; ;X-1 >*·CURH[ 3; ;X-1 ]+M [31: F:F'C+HMC [32l +FINP [ 3 3 ~ FXI'l': CUHR+Or ClJ!lR, [ 2]+ /[ 2 J or CU!IR [34:' OUTM+(-1 0 -tCURR[2;;])xWG'l'[;tpYR]
v
CALCC (Calling form: F CALCC N)
The function CALCC calculates the catch in numbers by using the formula
c F N ( 1 - e-z ) z
The parameters F and N must be sent as left and ri~ht a~sumQnt rQapootivo1y.
This function is used by MPROJ.
V CATCH+F CALCC N [1] CATCH+((FxN)tF+M)x1~*-F+M
v

[ 1 J rn [3] [ 4 "J
[5:' [6] [7] [8] [9] [ 10 J [ 11l [12] [13] [14] [15] [16] [17 1
[ 18 "! [19] [ 20 ~ [ 21} [22] [ 23 J [2<' [ 25 J [26] [ 27] [ 28: [291 [ 3 Ol [31] [32] [33 J [34] [35] [36J [37l [38l [39] [ 4o:: [41] [42l [431 [44] [45] [ 46 J [47] [ 48 J [ 49} [50"! [51] [52 J [53] [54 J
[55] [56 J [571
- 79 -
MPROJOUT
The function MPROJOUT outputs all the information which has been stored in tables by MPROJ. The calculations of the numbers and biomass of mature fish in the populat:Lon is also performed within this function. The function MPROJOUT calls the utility functions OUT and HEADER.
V MPROJOU'I;X;TI'l';I TI1'+' POPULATION NUMBERS' POHvB+ -1 0 +CURR[1;;] 0 OUT POPNB,[1](AG[l],AG[4J) AN:'LUS POPNB TIT+'POPULATION BIOMASS (AVERAGE)' I+(pPOPNB)[1J ~ J+(pPOPNB)[2] FISHMOR'J'+ -1 0 -1-C U!i'R[ 3;;] MOR'T~( (J ,I) pM) ME'ANPOP+-( POPNBx ( 1 ~*"'FISHMOR'I'+MORT)) tFISHMORT+MORT POPBIONASSf:JMIDYR+OUTM+MFANPOPxviCT[ ;1 + tJ+ 1 J 2 OUT OUTM,[1J(AG[l],AC[4:1) AN:'LUS OUTM TIT+' MATURE' NUMBRRS' +(11/0=f.:AT)/N2 OUTM+C1 0 +CURR[ 1;;] )xO((( pYR), pAG) pMAT 0 OUT OUTM, [ 1 ]+ /[ 1] OUTM TIT+' MA'l'URE BIOMASS 1
OUTM+C1 0 +CURH[1;;])xw'G'/'[;1hJ+1JxG(((pY!i'),pAG)pMAT 2 OUT OlJ'l'M, [ ll+ /[ 1] OUTM
f/2: 'II'!'+' CATCH NUMBERS' 0 OUT CATCH,[1}(AC[1],AC[4)) AN:'WS CATCH+ -1 0 +CURR[2;;] 'l'IT+'CA'l'C!! BIOMASi)' OUTM+(-1 0 +CURR[2;;])x 0 -1 + 0 1 +WGT 'J OUT OUTM,[1J(AC[1J,AG[4J) liN:'LUS OU'l'M 'I'IT+' MF'AN WEIGHT OF INDIVIDUALS IN CATCH' 1 OUT(+/[1] OU'IM)t+/[1 -1 0 +CUHR[2;;] 'l'IT+- 1 FISHING MO!i'l'ALITY' FWG7+(+/[1}(POlWBxFISHMORT))t+/[1J POPNB 3 OU'l' FISHMOR'l', [ 1 1 FWG'l'
WTI:1BFG{I,Jll:WT+*( (®(-1 -1 WC7) )+~.t 1 1 +WG7')t2 Flh'STAG~''l'+* 2x( Q -HWG'l'[ 1; l )- ( ISWT[ 1;] )t 2 FIRSTYRJ,''l'+*2x(!$-HWC'l'[ ;1 ~ )-(ISWT[ ;1 1
, )t2 F'IRS7'YRLASTAGWT+* ( ( ll!WGT[I; 1 J )+ ( ISWGT[I~ 1; 2})) t 2 WCTtoBEG+( ( 1,J+ 2 )pO), [1 ]( ( (I-1) ,1) pO) ,WT WC'16BFG[ 1 ;lhJ+2J+FIRSJ'AGI.'T WG'I'6BEG[; 1 ~+FIHSFY/Iw''l' ,FIRS7'YRLASTACW'l' LSTACE+*(2xlliWCT[I;l)~lliWCTt1BFG[I;J f.iC'I'6BFC+WGT1:1BEG, [ 1 J LSFAGE +(Pl!INTN:'ROD[ 1]=0) /POPBMASS YR+(YR[l]-1),YR,(YR[pYF1]+1) ( AG+AG,AC[pAC]+l 'l'IT+'WF'ICHTS A1' THF BEGINNING OF THR YEAR' ( 2 OlJ'l' w'CTt.BEG YR•--H HYR ( AG+-HAG
POPBMASS:POPBIOMASSl\BEG+POPNBx -1 1 + 0 -1 +WC'l't.BEC ~(PliiN'l'/IPHOD[ 2 ]=0) I REC bBMASS 'l'I'l'+' POPULATION BIOMASS AT BEGINNING OF YF:AR' 'J OUT POPBIOMASS6BEC,[1]+/[1] POPBIOMASS6BEG
REC IJBMASS: RECRUIT l\BIOMASS+POPBIOMASS DREG[ 1;] IJB+POPNBx( ( 1 2 +WCT6BEG)x*~(FISHMORT)+MOR'l') .. -1 -1 + 0 1 +WGT6BEG NETPROD+( +/[ 1] 6B)+RECRUIT6BIOMASS FISHINGfiiOMASSLOSS+CATClfxWG'l'[; 1 + ;J+ 1] DT+NORTxPOPBIOMASSbMIDYR BG+bB+ D2'+ PI SH 1 NGBIOM ASS LOSS 'l'IT+' DISTRIBU'l'ION OF GROWTH OVER AGES (PEHCEN'l')' 1 OUT(BG-t((pBC)p(+/[1] BG)))><100 PRODUC'l'ION+( +/[ 1 J BG)+RECRUITt.BIOMASS LB+' RECRUITMEN'l' BIOMASS CJiOWTH TOTAL PRODUC'J'ION LOSS THROUGH FIS!!INGSURPLUS PR
ODUCTION NET PRODUCTION LB+ 6 20 pLB 'l'ITl•-'SOUJ!CF:' ( 'I'IT+'PRODUC'l'ION' PROD+RF:CRUIT6BIOMASS,(+/[1] BC),PRODUCTION,(+/[1] FISHINGBIOMASSLOSS) (PRODUC'I'ION-+/[1~ DT),
NE''l'PROD [58:1 PROD+(6,pYR)pPFrOD [59 1 SF.CT+ 3 3 [60] 0 TABLE PROD [61] 'l'IT+'PRODUC'IION!BIOMASS RATIO [62] 2 OUT Pb'ODUC'l'ION++/[1] POPBIOMASS!JMIDYH
v

- 80 -
PALOHEIMO
The fun~tion PALOHEIMO estimates the annual rates of total mortality (Z), the catchability coeffic1ent (q) and the annual rate of natural mortality (M). PALOHEIMO calls the library functions REGR and PLOT, as well as the utility functio~ FILEL1FETCH.
V PAWHEIMO [1] NAM+ONL 2 [2] ENTRY:'ENTE'R NAME OF CPU MATRIX FOR RESEARCH VRSSELS(NUM/'l'OW)' [3] RE6ENTRY1:~(vfNAMA.=CHECK1+(-1tpNAM)t(' '~CHECK1)/CHECK1+,~)/RET [4l ->-REI:Ji:N'I'RY,Ot~'NAMED MATRIX DOES NOT EXIS'I'. RE-ENTER. 1
[5l RET: 'ENTER FIRST YEAR AND YOUNGEST AGE GROUP' [6] +(A/(TEMP=fTEMP),(0~2+TEMP),2=pTEMP+,0)/0K1
[7] +RET,O+~'MUST BE TWO NON-NEGATIVE NUMBERS [ 8] OK1 :YEAR+HTRMP (· AGE+HTEMP [9] YR+(YEAR-1 )h -2+YEAR+Hp1.CHECK1 [10] AG+(AGE-1)+t-2+AGE+1tp1.CHECK1 [11:: CPUE+.~C!Jt,'CK1 [12] CPUE+CPUF.+(CPUE=O)x9.9999x10*70 [13] Z+(-1 -1 +CPUE)t(l 1 +CPUE) [14] INSERT+((Z>1000)+(Z<10*-3)) [ 15 J 2+e2+INSE'R'1'+2x~INSERT
[16] 1'IT+ 1 ES'l'IMATES OF TOTAL MORTALITIES(2) 1
[17] 3 OU'I' 2,[1] ZMEAN+(+/[1] 2)t(p2[;1])-+/[1J INSERT [18] TEST:' ' (" 'REGRESSION WITH AN INDEX OF FISHING EFFORT DESIRED(YES OR NO)?' [19] +((A/ 1 N0'=2+CHECK2),-A/ 1YES'=3+CHECK2+( 1 '~HECK2)/CHECK2+,~)/0,TEST [20] 'ENTER VALUES OF FISHING EFFORT' [21] RE6ENTRY2:+(A/(FVAL>0),(1+p2MEAN)=pFVAL+Cl)!CALC [22] +REL1ENTRY2,0+~' THERE MUST BE ',(v1+p2MEAN),' VALUES ALL NON•NEGATIVE. RE-ENTER' [23] CALC:F+((-1+FVAL)+(1+FVAL))t2 [24] F+((pF),l)pF [25] FILEM'F.'TCH '2719067 PFMEGRF:SS' [26} NOANOVA (" NOCORRELATION (" ZMEAN REGR F [27} DIST+fCftF)t30 [28] 2+B[1;]+(B[2;]xFF+DISTx 1 30) [29l ZMlfAN+((pZMEAN),1)p2MEAN [30] 2+((p2),1)p2 [31] FF+((pFF),l)pFF [32] 2+2,[1] ZMEAN [33] FF+FF,[l] F [34] DATA+FF,Z,((2,1)p1),[1J((pF[;1]),1)p2 [35] [~DEF PAGRAPHICS [36] ABSCISSA LOW LIMIT 0 (: ORDINATE LOW LIMIT 0 [37] ABSCISSA HIGH LIMITftFF r:- ORDINATE HIGH LIMITfr2 [38] ABSCISSACOL 1 (" SYMBOI£0L 3 ( PLOTCHARS •.o' [39] AXES FLOATING(" NORMAL [ 40] SET ABSCISSA TOTAL 6 SPACED 10 NUMBERF:D 1 [41] SET ORDINATE TOTAL 6 SPACED 5 NUMBERE'D 1 [42] ABSCISSA TEXT 'FISHING EFFORT' [43] ORDINATF: TEXT '2MEAN' [ 44] PLOT DATA
v

- 81
SURVIVOR
The function SURVIVOR · d . ~s use to input data which are required for estimating the survivors ~n the current year. This function may be seen as the 'main' program which calls the subroutines necessary to perform the calculations and to outpu~ the results. Namely, SURVIVORS calls the functions SURVIVOR6INT K6CONST EST6SURVIVORS WEIGHTED6S and ANAL6VAR. ' ' '
V SURVIVOR;NAM;X;P1;P2;ITF.R;NUMAITER;RVABUND;CATCH;SYR;SAG;I;T;YR;AG;YRPT; AGPT;BLKSIZE'AG;BLKSIZEYR;CALBLK;CHECK;CHECK1;CHECK2;K;KT;KT2;LNDIF;LNK; MVAR;MVAR2;0UTM;CNT;MM;PRINTMAT;KK;SHAT;SUM;I1
[1] NA~L 2 ( ITER+1 [ 2 J ER1: *FIRST YEAR AND YOUNGF:ST AGE GROUP? 1
E3J ... < A/(P1=rP1) co::s2+P1), 2=pP1+,D>IER2 [4] +ER1,0t~'MUST BE 2 POSITIVE INTEGERS. RE-ENTER ' [5] ER2:'FINAL YEAR AND OLDEST AGE GROUP IN CALIBRATION BLOCK' [6] ~(A/(O<P2-P1),(P2=fP2),(0~2tP2),2=pP2+,0)1ER3 [7] ~ER2, Ot~' MUST BE' 2 POSITIVE INTEGERS LARGER THAN INITIAL VALUES. RE-ENT
E'R ' [8] ER3:'AGE AT WHICH K SHOULD LEVEL OFF' [9] +(A/(I1~P2[2]) 2]<I1+,0)/ER4 [10] +ER3,0+~'MUST BE SINGLE VALUE BETWEEN 1 ,(VP1(2]),' AND 1 ,VP2(2J [11] ER4:'NAME OF RESEARCH VESSEL ABUNDANCE MATRIX' [12] +(viNAMA,=X+(-1tpNAM)t(' '~X)IX+,~)IOK1 [13] +ER4,0t~'NAMED MATRIX DOES NOT EXIST. RE-ENTF.R ' [14] OK1:~(2=ppRVABUND+~X)/OK2 [15] +FR4,0t~((' '~X)IX),' IS NOT A MATRIX. RE-ENTER' [16] OK2:f(A/O<,RVABUND)IER5 [17] +O,Ot~+'NEGATIVE VALUES IN RESEARCH VF.SSEL ABUNDANCE MATRIX' [18] ER5:'NAME OF CATCH MATRIX?' [19] +(VINAMA,=X~(-ltpNAM)t(' '~X)IX+,~)IOK3 [20) +ER5,0+~'NAMED MATRIX DOES NOT EXIST. RE-ENTER ' [21] OK3:+(2=ppCATCH+2X)IOK4 [22] +F.R5,0t~((' '~X)IX),' IS NOT A MATRIX. RE-ENTER 1
[23] OK4:+(AI(pCATCH)=pRVABUND)IOK5 [24] +ER5,0t~'DIMENSIONS MUST BE THE SAME AS THOSE OF THE CATCH MATRIX' [25J OK5:+(Aj0~,CATCH)IOK6 [26] +O,Ot~+' NEGATIVF VALUE IN CATCH MATRIX' [27] OK6:YR+-1+P1[1]+tT+(pCATCH)[2] [28] A~-1+P1[2]+ti+(pCATCH)[1] [29] ER6:'SURVIVORS IN POPULATION FOR LAST YEAR?' [30] +((1,I)=pSYR+,0)10K7 [31] +ER6,0t~+'ENTER 1 VALUE FOR EACH ROW OF CATCH MATRIX. RE-ENTER ' [32] OK7:+(11/0~SYR)/FR7 [33] +ER6,0t~'VALUES MUST BE POSITIVE. RE-ENTER ' [34] ER7 'SURVIVORS IN POPULATION FOR OLDEST AGE GROUP?' [35] +((l,T) ,0)IOK8 [ 36] +ER7, ENTER ONE VALUE FOR EACH COLUMN OF CATCH MATRIX. RE•F:NTE'R ' [37] OK8:+(A/0SSAG)/ER8 [38] +ER7,0t~+'VALUES MUST BE POSITIVE. RE-ENTF.R ' [39] ER8:'NATURAL MORTALITY' [40) +(AI(A/NZO),O=ppM+Q)/FR9 [41] +ER8,0t~+'NATURAL MORTALITY MUST BE 1 POSITIVE NUMBER. RE•ENTER ' [42] ER9:'MAXIMUM NUMBER OF ITERATIONS?' [ 43 J +(A/ (NUMf1ITER?:.1) 'O=ppNUMAITER+fJ) I ER1 0 [44] +ER9,0t~' MUST BE ONE NUMBF.R?:.1, RE-ENTER ' [45] ER10:'F:NTER 1 IF MATRIX JS TO BE PRINTED. OTHERWISE ENTF:R 0.' [46] [47] [48]
'ONF NUMBER IS REQUIRED IN VECTOR FOR EACH MATRIX' 'INTEGRATED CATCH' C 'INTEGRATED SURVIVORS' ( 'ESTIMATED SURVIVORS ' 'ESTIMATF.D VARIANCE OF SURVIVORS' C 'WF.IGHTED SURVIVORS' ¢ 'OUTLIERS OF R ESIDUALS 9
[49] +(A/(6=+1(1=PRINTMAT),(O~PRINTMAT)),6=pPRINT.MA1~,0)1ER11
[50] +ER10,0t~'RE-ENTER ' [51] ER11:'ANALYSIS OF VARIANCE TO BE PERFORMED(YES OR NO)?' [52] •((AI'YES'=3tCHECK),-AI'N0'=2+CHECK~(' '~HECK)/CHECK+,~)IOK9,ER11 [53] OK9:YRPT+P2[1] C AGPT+P2[2] [54] ~AG[pAG] 0 CN~O [55] SUM+CATCHx(-1+*M+2)tM [56 J SUMMA'l'ION +(vI (C!IFCK2+T~CNT+1) ,CHECK1+I~1 +CN~CNT+1 )I LAST

- 82 -
[57] +(A/(1=CHECK1),CHECK1=CHECK2)/LAST [58] SUM+SUM+(((*MXCNT+0.5)~*MXCNT-0.5)+M)x(((CNT,CNT)+CATCH),(((•CNT)+I),CNT)
p0),[1](CNT,T)p0 [59] +SUMMATION [60] LAST:SUM[I;]+CATCH[I;]x(-1+*Mf2)+M [61J SUM[;T]+CATCH[;T]x(-1+*Mf2)+M [ 62] CINT+SUM [63] +(PRINTMAT[1]=0)/SURVEY [64] 1'IT+'INTEGRATED CATCH' 0 0 OUT CINT [65] SURVEY:SURVIVOR6INT [ 66] POPNB+CINT+SINT [67] +(ITER~NUM6ITFR)/CONSTANT
[68] TIT+'POPULATION NUMBERS' [69] 0 OUT POPNB [70] CONSTANT:KbCONST [71] EST~URVIVORS [72] FST6VAR~URV [73] WEIGHTED~ [74] +(ITER=NUM6ITER)/VARIANCFANALYSIS [75] ITER+-ITER+1 0 SYR+SURV6LAST6YR 0 SAG+SURV60LDESTMG [76] +SURVEY [77] VARIANCEANALYSIS:+('N0'=2+CHECK)/O [ 78] ANAL6VAR
v
SURVIVORLIINT
This function is used to calculate the integrated survivors (SINT. 5 5
) and to print the calculated values after the last iteration. l+. ,t+.
[1] [2] [3] [4] [5] [6] [7] [8] [ 9] [10] [11~ [ 12] [13] [14] [15] [16] [17] [18]
V SURVIVOR6INT;UPPER6;LOWER6;ROW;COL;CNT1;CNT2;TIT UPPFR6+LOWFR6+(pCATCH)p0
v
COL+-T 0 ROW+I 0 CNT1+CNT2+1 UPPER6[;T]+SYR 0 LOWER6[I;]+SAG UPPER:+(1~CO~+COL-1)/LOWER UPPER6[;COL]+(CNT1+SYR),[1] CNT1p0 +(I~CNT1+CN'1'1 +1 )/UPPER
LOWER:+(l>ROW+ROW-1)/JOIN LOWER6[ROW;]+(CNT2~SAG),CNT2p0
+(T~CNT2+CNT2+1)/LOWER JOIN:UPPER6+UPPER6x(I,T)pF1+*MXYR[T]+0.5•((P1[1]•1)+tYR[T]) LOWER6+LOWER6x~(T,I)pF2+*MXAG[I]+0.5•((P1[2]-1)+1AG[I])
UPPER6+UPPER6xUPPERLI~LOWER6
SINT+UPPERLI+LOWERLI +(ITER~NUM6ITER)/0 ' '0 'FINAL ITERATION (',(•ITER),')' +(PRINTMAT[2]=0)/0 TIT+'INTEGRATED SURVIVORS' 0 OUT SINT

- 83 -
EST6VARl1SURV
The function EST6VAR6SURV calculates the variance for the successive estimates of survivors which are calculated by the function EST6SURVIVORS. The function EST6VAR6SURV is called by the 'main' function SURVIVOR.
V EST6VAR6SURV;FACTOR;OUTERFACT [1] RMS+(+/[1]+/((BLKSIZEAG,BLKSIZEYR)t(POFWB~COR6R)+POFWB)*2)tBLKSIZEAGx
BLKSIZEYR [ 2] EST6VAR6S+(EE*2 )xRMS><COR6R*2 [3] FACTOR+(I,T)p1+1tBLKSIZEYR [4! FACTOR[(1+BLKSIZEAG~CALBLK)+ti;]+OUTRRFAC~1+1tBLKSIZEYR><CALBLK [5] FACTOR[ ;BLKSIZEYRhT]+OUTERFACT [6] EST6VAR6S~EST6VAR6S><FACTOR [7] +(ITER~NUMMTER)/0 [8] +(PRINTMAT[4]=0)/0 [9] TI~'ESTIMATFD VARIANCE OF SURVIVORS' [10] 0 OUT RSTllVAR&<;
v
WEIGHTED6S
The function WEIGHTED6S calculates the weighted average of the survivors for each age-group in the final year (Si t ) and of the oldest age-group in each year (Sm t). This function is also u~e~ to output the statistics which are necessar~ to monitor the convergence of the iterative process and to print the results after the fiual iteration (estimated survivors, estimated K, residuals). The function WEIGHTEDliS is called by the 'main' function SURVIVOR.
V WFIGHTED6S;POOL;POOLAG;POOLYR;INV6VAR;CNT;POOLED6VAR;W;W6SURV;CRIT6YR; PERC6SURV;INV6SURV6SUM;VAR686LAST6YR;VAR6860LDRST6AG;STANDAER6LAST6YR; STANDllER60LDFST6AG;C6VhLAST6YR;CllV60LDEST6AG;OUTM1;0UTM2;0UTM3;STANDAER6K ;DF;SD6RESID;MFAN6RE'SID;UPPERBND;LOWE'RBND;OUTER
[1] POOL+INV6VAR+1tEST6VAR68 0 DIAGllSUM INVhVAR [2] POOLAG+POOLYR+(I,T)pO [3] POOLAG[1;]+POOL[1;] 0 POOLYR[;1]+POOL[;1] [4] CN~O [5] UPPER:+(v/(I<1+CNT),T<1+CNT+CNT+1)/COLUMN [6] POOLAG[CNT+1;]+(CNTpO),(•CNT)~POOL[1;] [7] ... UPPER [8] COLUMN:CN~ [9] LOWER:+(V/(I<1+CNT),T<1+CNT+CNT+1)/CALC [ 10 l POOLYR[ ;CNT+1]+(CNTp0), ( -CNTHPOOL[ ;1] [ 11] +LOWER [12] CALC:POOLED6VAR+POOLYR+POOLAGxPOOLAG~POOLYR [13] W+1tEST6VAR6S><POOLEDllVAR [14] 'tl6SURV+W><SHAT [15] +(ITER~NUM6ITER)/SUM [16] +(PRINTMAT[5]=0)/SUM [ 17] TIT+'WEIGHTED SURVIVORS' 0 0 OUT WllSURV [18] SUM:WDSURV+WDSURV+0,00001XW~SURV=O [19] SURV6YR+SURV6AG++/ 1 1 ~W6SURV [20] CN~O [21] NEXTCOL:+(TSCNT+CNT+1)/0LDESTAGE [22] SURV6YR+SURVIY!R, +I 1 1 ~( O,CNT) W 6SURV [ 23] +NEXTCOL [24] OLDESTAGE:CNT+O [25] NEXTROW:+(IsCNT+CNT+1)/WEIGHTEDS [26] SURVMG+SURVMG,+/ 1 1 ~(CNT,O)+WllSURV [ 27] ->-NEXTROW [28] WF:IGHTEDS:SURVIVORS+(¢>HSURVMG) ,SURVIY!R [29] SURV!lOLDESTMG+TtSURVIVORS [30] SURV6LAST6YR+¢(•I)tSURVIVORS

[31] +(ITER=N~AITER)/FINALITERATION [32] CRITAY~(ISYR~SURV6LASTAYR)+SYR [33] +(A/(A/0.001~CRIT6YR))/CONVERGENCEMET [34] PERC6SURV+(+/CRIT6YRxlOO)+I
- 84 -
[35] I I 0 'ITERATION '.(~ITER),' RMS=',(•RMS) [36] 1 0/0 CHANGE IN SURVIVORS= 1 ,(~PERC6SURV) [37} ' I ( I AGE SURVIVORS K' [38] OUTM+(((pAG),1)pAG),(((pAG),1)pSURVALAST6YR),((pAG),1)pK [39] 4 0 12 0 12 2 ~OUTM [40 J +0 [41] FINALITERATION:N~AITE~ITER [42] INV6SURV6SU~(~l+POOL[;1]),POOL[1;] [ 43] VAR6SALAST6Y~1 t$( .. I) t INV 6SURV 6SUM [44] VAR6S60LDESTAAG+1+T+INV6SURV6SUM [45] STANDAERALAST6Y~VAR6SALAST6YR*0.5 [46] STANDAERAOWEST6AG+VAR6SAOWESTAAG*O. 5 [47] CAVALAST6YR+lOOxSTANDAERALAST6YRtSURVALAST6YR [48] CAVAOLDEST6AG+100xSTANDAERAOLDESTAAGtSURV60LDESTAAG [49] I I 0 'RMS='. (VRMS) [50 J • ' 0 I ESTIMATED SURVIVORS FOR AGE '.('MG[IJ). I (WEIGHTED) I 0 I I
[51] YEAR SURVIVORS VARIANCE STANDARD ERROR C.V.(0/0) 1
[52] OUTM1+(((pYR),1)pYR),(((pYR),1)pSURV60LDEST6AG) --[53} OUTM1+0UTM1,(((pYR),1)pVAR6SAOLDEST6AG),(((pYR),1)pSTANDAER60LDEST6AG) [54] OUTM1+0UTM1,(((pYR),1)pC6VAOLDESTAAG) [55] 8 0 15 0 15 0 12 0 12 2 ~OUTM1 [56] 1 '0' ESTIMATED SURVIVORS FOR ',(VYR[T]),' (WEIGHTED)' 0 1 1
[57] AGE SURVIVORS VARIANCE STANDARD ERROR C.V.(0/0)' [58] OUTM2+(TfPAG),1)pAG),(((pAG),1)pSURVALAST6YR),((pAG),l)pVARiSALAST6YR [59] 0UTM2+0UTM2,(((pAG),l)pSTAND6ERALAST6YR),((pAG),1)pCAVALAST6YR [60] 8 0 15 0 15 0 12 0 12 2 VOUTM2 [61 J STANDAERM+MVAR*O. 5 [62] I • (\ I FINAL ESTIMATION FORK' [63] 1 1 ~ ' AGE K LN(K) VAR(LN(K) STANDARD ERROR D.F' [64] OUTM3+( ( (pAG) ,1)pAG), (( (pAG) ,l)pK) ,TfPAG) ,l)pLNK [65] DF+(((Il·AG[1]),1)pYR[T]·YRPT),[1]((1+AG[I]•I1),1)p-1+CALBLKxBLKSIZEYR [66] OUTM3+0UTM3,(((pAG),l)pVARALNK),(((pAG),1)pSTANDAER6K),DF [67] 4 0 10 2 10 4 10 4 15 4 8 0 vOUTM3 [68] RESIDUAL+(®KKxRVABUND)~$POPNB [69] TIT+'RESIDUALS' [ 70 J 4 OUT RESIDUAL [71] MEANARESID+(+/+/[1] RESIDUAL)+-1+Txi [72] SD6RESID+((+/+/[1](RESIDUAL•MEAN6RESID)*2)+(IxT)-1)*0.5 [ 73 ~ UPPERBND+MEAN 6RF'SID+2xSD6RESID [74] LOWERBND+MEAN6RESID-2xSD6RESID [75] OUTFR+RESIDUALx{RESIDUAL<LOWERBND)+(RESIDUAL>UPPERBND) [76] +(PRINTMAT[6]=0)/0 [77] 1 '0' MEAN OF RESIDUALS=',(VMEANARESID) [78] STANDARD DEVIATION OF RESIDUALS=',(•SDARESID) [79] TIT+'OUTLIERS OF RESIDUALS' 0 2 OUT OUTER [80 J +0 [81] CONVERGENCEMET:' '0 'FINAL ITERATION ('.(•ITER),')' [82] +(PRINTMAT[2]=0)/POP [83] TIT+ 1INTEGRATED SURVIVO~S' ¢ 0 OUT SINT [84] POP:TIT+ 1 POPULA'I'ION NUMBERS' 0 0 OUT POPNB [85] +(PRINTMAT[3]=0)/NEXT [86] TIT+'ESTIMATED SURVIVORS' (' 0 OUT SHAT [87] NEXT:+(PRINTMAT[4]=0)/NEXT1 [88J TIT+'ESTIMATED VARIANCE OF SURVIVORS' C 0 OUT EST6VAR6S [89] NEXT1:+(PRINTMAT[5]=0)/FINALITERATION [90] TIT+'WEIGHTED SURVIVORS' ( 0 OUT W6SURV [91] +FINALITERATION
'V

- 85 -
KliCONST
The function KliCONST is used to estimate the calibration constants, Ki+.S• and their variances. The function KliCONST is called by the 'main' function SURVIVOR.
V KACONST [:] BLKSIZEYR+YRPT+1-YR[1] [2] BLKSIZEAG+AGPT+1•AG[1] [3] LNDIF+GPOPNBtRVABVND [4] LNK+(KT++/(BLKSIZEAG,BLKSIZEYR)+LNDIF)+BLKSIZEYR [5] LNK+((-CALBLK)+LNK),(1+AG[I]·I1)pKT2+(+/[1]((I1•AG[1])+KT))+BLKSIZEYRx
CALBLK+1+AGPT•I1 [6] LNKK~(T,I)pLNK [7] VARliLNK&gUM++/((I1•AG[1]),BLKSIZEYR)+(LNKK+(eRVABVND)-ePOPNB)*2 [8] MVAR+(VARliLNK+VAR6LNKliSUM+BLKSIZEYR-1)+BLKSIZEYR [9] CALBLK+1+AGPT•I1 [10] MVAR2+(VAR6LNKT~(+/[1] VAR6LNKliSUM)+-1+BLKSIZEYRxCALBLK)+BLKSIZEYRx
CALBLK [11] VAR6LNK+VAR6LNK,(1+AG[I]~I1)pVAR6LNKT2 [12] MVAR+MVAR,(1+AG[I]•I1)pMVAR2 [13] K+*LNK+VAR6LNK+2
v
ESTliSURVIVORS
The function ESTliSURVIVORS provide estimates of survivors for all age-groups in the last year (Sit ,i) and for the oldest age-group in each year (Sm t j). This function is calie~ oy the 'main' function SURVIVOR, ' '
V ESTASURVIVORS;CNT;ROW;COL;TIT;E [1] E+(I,T)p0.5 [2] CNT+O 0 ROW+I-1 [3] INCREASE1:+(v/(T~1+CNT+CNT+1),ROW~O)/INCREASE [4~ E[ROW;IT•CNT]+E[ROW;IT·CNT]+CNT [5] ROW+ROW-1 ( +INCREASE1 [6] INCRF.ASE:CNT+O 0 COL+T•1 [7] INCREASE2:+(V/(IS1+CNT+CNT+l),COLSO)/MORTADJUST [BJ E[ti·CNT+1;COL]+E[li-CNT+1;COL]+CNT [9] COL+COL•1 ( +INCRF.ASE2 [10] MORTADJUST:EE+*~MxE [11] KK~(T,I)pK [12 J SHAT+EEx(CORtill+KKxRV ABVND)•CINT [13] SHAT+SHATxOSSHAT [14] +(ITER~NUM6ITER)/O [15] +(PRINTMAT[3]=0)/0 [16] TIT~'ESTIMATED SURVIVORS' [17] OOlfl'SHAT
v

- 86 -
DIAGLISUM ( calling form: DIAGLISUM MATRIX )
DIAGLISUM is an utrulity function which is used by the function WEIGHTEDLIS in order to perform summations along the diagonals of a matrix (global variable called MATRIX). The results are stored in the global variable (vector) POOL.
V DIAGhSUM MATRIX [ 1] CNT+O [2] SUMMATION:•{vf{CHECK2+T<1+CNT),CHECK1+I<1+CNT+CNT+1)/0 [ 3 J +(A/ { 1=CHECK1) ,CHECK1=CHECK2)/0 [4] POOL+POOL+{((CNT,CNT)~MATRIX),(((~CNT)+I),CNT)p0),[1](CNT,T}p0 [5] +SUMMATION
v
ANALLIVAR
The function ANALLIVAR performs an analysis of variance on the residuals in order to identify the presence of systematic errors. ANALLIVAR is called only once by the 'main' function SURVIVOR, at the end of the iterative process.
V ANAL6VAR;CNT;YY;AGES;YEARS;YEARCLASS;AGE;DIMAYR;CLASS;YRCLASS;YRAYRCL; DATA;TEMP1;TFMP2;B;VAR6B;SSQ6B;STANDGER6B;CONST;SSQ;TOT6SSQ;RESID6SSQ;SS; SS1;SS2;LABEL;LABEL1;0UTM;OUTM1;TYEARS;TYRAYRCL;MS6RESID;DF6AG;DF6YR; DFAYRCL;MS6AG;MS6YR;MS6YRCL;F6AG;F6YR;F6YRCL;RESID6DF
[1] YY+Y•,RESIDUAL 0 CONST+(+/Y}tpY 0 Y+Y~CONST [2] AGEs+(T,I)pO [ 3] CNT+1 [4] AGES[<T;CNT]+1 [5] YEARS+DIMAYR+(tT) 0 .=tT [6] CLASS+(tT)o.=li+T~AG[1] [ 7] Yfi:ARCLASS+( ( =I)+CNT)fCLASS [ 8] YFARCLASS[; 1 I -CNT]-+-0 [9] NF.XTAGE:+(I<CNT+CNT+1)/REGRESSION [10] AGF+(T,I)pO [11] AGE[lT;CNT]+1 [12] AGEs+AGES,[1] AGE [13] YEAR3+YEARS,[1] DIMAYR [14] YRCLASS+((~I)+CNT)fCLASS [15] YRCLASS[;<I-CNT]+O [16] YEARCLASS+YEARCLASS,[1] YRCLASS [ 17] +NEXT AGE [18] RFGRESSION:AGF.S+ 0 1 +AGES [19] YEARS+ 0 1 +YF.ARS [20] YEARCLASS+ 0 1 +YEARCLASS [21] DATA+AGES,YRbYRCL+YEARS,YEARCLASS [22] TEMP1~{TDATA~DATA)+.><DATA [23] TEMP~TDATA+.xY [24] B+TEMP1+.xTEMP2 [25] MS&9ESID+S~{((~Y)+.><Y)~(~B)+,><TEMP2)t{pY)-pB [26] VARGB+TEMP1><S2 [27] SS+B+,xTEMP2 [28] ' ' C 1 ANALYSIS OF VARIANCE' (; ' ' [29] SOURCE B STAND ERROR OF B ' [30] SSQGB+(pY)><CONST*2 -[31] 'CONSTANT ', 10 3 ~CONST [32] STANDGER68+(1 1 ~VARbB)*O. 5 [33] LABEL+'AGE 1 ,((7x1•2)p 1 '),'YEAR ',(7><T•2)p 1 '
[34] LABEL+LABEL,'YRCLASS',(7><I+T~AG[1])p' ' [35] LABEL+((pB),7)pLABEL [36] OUTM+(( ,1)pOUTM+(1+AG),(1tYR),(YR[1]-AG[1])+1I+T~AG[1]+1

[ 37] [38] [ 39] [40] [41] [42] [43] [44] [45] [46] [ 47] [48] [ 49] [50 J [51 J [52 J [53 J [54 J
[55 J [56] [57] [58 J [59] [60]
v
- 87 -
OUT~OUTM,(((pB),1)pB),((pSTANDagR68),1)pSTANDagRAB '7A1,I5,2F10.3 1 OFMT(LABEL;OUTM) TOT6SS~(~YY)+.xYY RESID6SS~TOT6SSQ•SSQAB+SS I I (; I SUMMARY OF ANALYSIS OF VARIANCE' 0 I I
' SOURCE SS DF MS F' 'CONSTANT'. 12 4 BO "PSSQAB-;1 -TYEARS~YEARS SS1+((00TYEARS+.xYEARS)+.xTYEARS+.xY)+.xTYEARS+.xY TYRAYRCL~YRAYRCL SS2+((00TYRAYRCL+.xYRAYRCL)+.xTYRAYRCL+.xY)+.xTYRAYRCL+.xY SSMO+-SS-SS2 C SSAYRCL+SS2-SS1 DFMO+-I•1 C DFAYR+T•1 0 DF6YRCL+I+T·AG[1] MSMO+-SSMGtDFMG 0 MS6YR+SS1 +DFAYR MSAYRCL+SSAYRCLtDFAYRCL FMO+-MSMGtMSM?ESID 0 FAYR+MSAYRtMSM?ESID FAYRCL+MSAYRCL+MSARESID OUTM1+SSMG,DFMG,MSMG ,FMC ,SS1,DF6YR ,MSAYR ,FAYR ,SSAYRCL ,DFAYRCL ,MSAYRCL ,FAYRCL OUTM1+(3,4)p0UTM1 LABEL1+(3,7)p'AGE ','YEAR ','YRCLASS' '7A1,F12.5,IB,F12.4,F10.3 1 0FMT(LABEL1;0UTM1) RFSIDfiD~(pY)•1+DFMG+DF6YR+DF6YRCL 'RESIDUALS', 12 58 0 12 4 "PRESID6SSQ,RESIDWF,RESID6SSQtRESIDfiDF 'TOTAL 1 , 12 5 8 0 "PTOT6SSQ,pY

- 88 -
VONB
The function VONB is used to estimate the parameters of the Bertalanffy equation by using the Marquardt algorithm. VONB calls the library functions MARQUARDTP and the utility function FILEL'lFETCH. Graphical output is obtained through the use of the function PLOT.
V VONB;L;AG;X;Y;P;PL;B;OUTM [ 1 J FILEI'PETCH I 271906 7 PF6MARQ' [2] E'Rl:' I(' 'AGE'S?' [3] +(A/0<AG+,0)/SK1 [4] +E'Rl,O+['I+'AGES MUS'l' BE' POSITIVE. RF•ENTE'R 1
[5' SK1:AG+AG[P+~AG] [6] +(3<+/PL+AG~l~AG)/FR2
(7] +ERl,Otf!J+'MUS'l' BE MORE THAN 3 DIS'l'INCT AGES. RE~ENTER 1
[8] FR2:' ' ~' 'LENGTH AT AGE?' [9l +( (pAG)=pL+,[I)/01<1 [10) +F,'R2,0tf!J+'ONE LENGTH FOR EACH OF ',("l'pAG),' AGES. RE-E'NTER 1
[11J OKl:+(A/L>0)/01<2 [12] ->-E'R2, Ot['J+' LENGTHS MUST BE' POSITIVE. RE'-ENTF:R 1
[ 13] 01<2: 1 ' (' 'THE FORMS OF THE EQUA'l'ION FOR FIT'l'ING ARE: 1
[14 1 1. L('l')=LINFO~EXP('"K(T-T(O))))' [15] 2. L(T)=(w/T)(l~FXP(~K(T•T(O)))' [16] ER3:' 'f' 'WHICH FORM IS '1'0 BE FITTED(l OR 2)?' [ 1 7] +(A/ (vI ( 2=FORM), 1=FORM) ,1=ppFORM+ ,[))I ER4 [18] +ER3,0t['I+-'FORM MUST BE 1 OR 2. RE•ENTER ' [19~ ER4:' '(' 'YOUR OWN INITIAL VALUF:S (YES OR NO) ?' [ 2•J] +( (A/' NO' =2tCHFCK) ,~A/' YES. =3+Cl!ECK+( I I ~flECK) /CHECK+ ,f!J)/ INI'I't:,VALUES,ER4 [21] OK3:+(FOnM=2)/FOnM2 [221 FORM1:' 'f' 'INITIAl. VALUES FOR ASYMPTOTIC LFNGTH, K, AND '1.'(0)? 1
[23] +(A/(A/0~2+INITIAL),3=piNITIAL~,Q)/OK4
[ 21+} +FORM1, O+("J+'MUST FNTF'R 3 NUMBERS THE FIRST 2 OF WHICH ARE POSITIVE. RE'•E'NTER [25] FORM2: ' f' 'INITIAL VALUE·:S FOR w, K, AND T(O)?' [26l +( Aj(A/')~2HNITIAL) ,3=piNI'l'IAL+,Ol/OK4 [27l +FORM2,0+f'II+-'MUS'I' EN'l'FR 3 NUMBERS THF FIRST 2 OF WHICH ARF: POSI'J'IVE. RE-ENTER [28] INI'l'LIVALUF:S:L+L[P] [29] X+((-1+4/PL)p1),[1.5] -l~P+PL/L [30] Y+HP [31} ~(~(~X)+,xX)+,x(~X)+,xY
[32} +(FORM=2)/SK2 [331 P+(B[1]t1~B[2]),$®B[2]
[34~ ->SK3 [35] SK2:P+((B[l]t1~B[2])x~B[2:),~~B[2] [36] £NI'l'IAL+P,((+/AG)tpAG)+(®1~(P[2Jx(+/L)tpL)tP[l])tP[2] [371 +OK4 [38] SK3:INITIAL+P,((+/AG)tpAG)+(®1P((+/L)tpL)tP[1])tP[2] [39] OK4:LIMIT+20 [40] PRIN'l' FVERY 20 [ 41 J ' ' (' ( 62+ ( 22p' '),'VON BFRTALANFFY PARAMETERS 1
) ,DA'l' ( ' ' [42] ' ORDER OF PARAMETERS IS AS FOLLOWS:' [43] +(FORM=2)/ALTERNAT [44] 1. MF:AN ASYMPTOTIC LENGTH' [45] +NEXT [46] ALTF:RNAT:' 1. w [47] NEXT:' 2. BRODY GROWTH COEFFICIENT' [48] 3. T( 0)' [49} ' ' (' 'INITIAD PARAMETER VALUFS' ( 14 6 l'(3,1)p!JIITIAL [5'Jl L MARQUARDTP AG [51] +(FORM=1)/SK4 [52J ' ' (' 'ESTIMATE OF THE ASYMPTOTIC LENGTH IS: ', 14 6 l'B[l]tB[2] [53] SK4:0UTM~(5,pAG)pAC,M[;1],M[;2],(M[;2]•M[;1]),(M[;2J~M[;l])tM[;1] [54] DATA+OUTM[ 1],[1.5] OUTM[;4J - - - - -[55] oPDEF P!:>GRAPHIC S [56] 'l'I'l'LE TEXT 'RESIDUALS' [57] NORMAL (' ' ' (' ' ' [58] ABSCISSACOL 1 (' SYMBOLCOL 0 [59] ABSCISSA TEXT 'AGES' [60l ORDINATE 'l'EXT 'EXPl':CTED MINUS OBSE'RVED' [ 61 ~~ AH'S FLOATING

liFN
- 89 -
[62] ABSDISSA HIGH LIMITf/OUTM[;l] [63] ORDINATE HIGH LIMITf/OUTM[;q] [64} PLOT DA1'A [65] DATA~(3,pAG)pOUTM[;l],M[;2],M[;l] [66] 1'ITLE TEX1' 'OBSERVED AND FXPlCTE:D LENGTH A1' AGF.'' [ 6 7 J ORDINATE TEXT 1 LENGTH 1
[68] AXES FIXED (' ABSDISSA HIGH LlMITf /DATA[ ;1] [69] ORDINATE HIGH LLMIT(f/DATA[;2])f(f/DATA[;3]) [70] ABEriSSA LOW LIMIT 0 ('; ORDINATE LOW LIMIT 0
[ 71 J ' ' (' ' ' \' MULTIPLE 0 PLOT DATA v
The function liFN is used by the library function MARQUARDTP to estimate the parameters of the Bertalanffy equation.
V R+A 6FN X [1] +(FORM=2)/0THER [2] R+A[l]xl•*•A[2lxX•A[3] [ 3 J +()
[41 OTHER:R+(A[l]tA[2])xl•*•A[2]xX•A[3J v

- 90 -
VPA
The function VPA calculates population numbers at age and the instantaneous rates of fishing mortality at age by using a virtual population analysis (Gulland, 1965; Pope, 1972),
V VPA;CATCH;J;I;M;MORT;FI;FC;X;YR;AG;Y;TIT;FT;T.MP;EXP;FFM;DIF;NAM;CHECK; CHECK1;SENSM;SENSMF;SENSMF1;F;POP;TEMP;A;CTEMP;FIT;BCT;SVB;IN1;K;L
[1] A+CHECK+1 [ 2] NAM<{JN L 2 C FLA(}+{J [ 3] ERO: 'NAME OF C ATCEJ MATRIX?, .. , 1
[4] ->-(v/NAMA, ( '7X)/X+,I!J)/OK1 [5] +ERO,Ot~'NAMED MATRIX DOES NOT EXIST. RE•ENTER 1
[6] OK1:~(2=ppCATCH+~X)/OK2 [7] +ERO Ot~((' 7X)/X), IS NOT A MATRIX.' [8] OK2:+(A/0S,CATCH)/ER05 [9] +O,Ot~'NEGATIV!i' VALUES IN CATCH MATRIX.' [10] EROS:' ' 0 'SENSITIVITY ANALYSIS TO BE PERFORMED (YES OR NO)?' [11] Cl!ECK1+,f!J [12] ER1:'FIRST YEAR AND YOUNGEST AGE GROUP?' [13] +(A/(X=rX),(OS2tX) /OK3 [14] •ER1,0t[!]~-'MVST BE 2 NON~NEGATIVE INTEGERS. RE-ENTER 1
[15] OK3:YR+( 1])+tJ+(pCATCH)[2] [16] AG+(-1+X[2])+ti+(pCATCH)[1] [17] PO~~MORT+SENS~(4,I,J)p0 [18] TEM~(I,J)pO [19] ER2:'NATURAL MORTALIT.Y?' [20] +(v/(1,I)=p~,0)/0K4 [21] -•ER2,0t~'EITHER 1 OR ',(VI),' NUMBERS. RE•ENTER 1
[22] OK4:+(A/M>O)/OK5 [23] +ER2,0tf!J+'MORTALITIES MUST BE POSITIVE, RE•ENTER ' [24] OK5:'WEIGlfl' AT AGE KNOWN (YES OR NO)?' [25] +((A/ 1N0 1 =2tCHECK2),-A/'YES'=3tCHECK2+( 1 1 7CHECK2)/CHECK2+,~)/ER3,0K5 [26] BMASS:'ENTER WEIGHT AT AGE DATA (KG): VECTOR OR MATRIX' [27] -+(A/(A/041G'l'), (2=ppWGT<{]) )/MAT [28) +(1=ppWCT)/VECTOR [29] ERROR:+BMASS,Ot~' WEIGHTS MUST BE POSITIVE [30] VECTOR:+((pWGT)=pCATCH[;1])/RESHAPE [ 31] +EM ASS, Ot~+' DIMENSION MUST AGREE, ' [ 32] RESHAPE: WGT+( ( pWGT) ,1) pWGT [33] FLAG+1 0 +ER3 [34] MAT:+((pWGT)7pCATCH)/BMASS [35] ER3: 'STARTING F VALUES FOR LAST YEAR ( ', (l'-HYR),' )? ' [36] +(v/(1,I)=pFI+,0)/0K6 [37] +ER3 Ot~'EITHER OR , (vi),' NUMBERS. RE .. ENTER 1
[38] OK6:+(A/FI>O)/ER4 [39] +ER3,0t~'MORTALITIES MUST BE POSITIVE. RE•ENTER 1
[40) ER4:'STARTING F VALUES FOR OLDEST AGE GROUP (';(v-1tAG),')?' [41] V/( ,J)=pFC+,O)!OKB [42] +ER4 O·t~'EITHER OR W,(VJ),' NUMBERS. RE-ENTER I [43] OK8:+(A/FC>O)/OK9 [ 44] -+E'R4 Ot~' MORTALITIES MUST BE POSITIVE. RE-ENTER ' [45] OK9:F[A I;]+JpFC [46] F[A [47] [ 48] POP[A;; ~J]xFI +MORT[A; ;J] )+Fix1:;..w~FI+MORT[A o ;J] [49] POP[A ;I; ]+(CATCH[I; ]><FC+MORT[A ;I; ])tFC [50] ->-(A=1)/ER5 [51] ~((Cl!ECK=O).CHECK~O)/EE,SK1 [52] ERS:'IS FISHING COMPLETE FOR LAST AGE GIVEW(YES OR NO)? ••••• ' [53] -+((A/'YES'=3tXX).-A/'N0'=2tXX+(' '~XX)/XX+,~)/SK1,ER5 [54] [55] ;I;]+POP[A ]t1~*~FC+MORT[A;I;] [56] SK1 :Y+J~1 [57] AA:X+MORT[A>ti-1;Y] [58] POP[A ti=1 )+(POP[A;1+ti;Y+1]x*X) [59] F[A ti•1;Y]tPOP[A;1+li;Y+1])-X [60] BB:'I'M~(EX~*FT+X)><FFM+FTtFT+X

- 91 -
[61] +(A/0.00001>IDIF+T.MP~FF.M+CATCH[tiP1;Y]tPOP[A;1+ti;Y+1])/CC [ 62] F[A; ti -1 ;Y]+FT•FT-DIFfT.MP+Xx(EXP .. 1) t (F'l'+X)* 2 [ 63] ->BB [64] CC:POP[A ti-1;Y]+POP[A;1+ti;Y+l]x*X+FT [65] +(1$J+Y-1)/AA [66] F[A ti-l ]+(liil( -1 +POP[A;;])f 1 1 +POP[A;;])- -1 -1 -1-MORT[A;;] [67] •('N0'=2+CHECK1)/EE4 [68] +((A=2) (A=3))/FF,GG [69] FI+FI+( 0. 001><FIT+FI) 0 FC+FC+( 0. 001><FCT+-FC) C A+2 [70] +OK9 [71] FF:M<-M+(0.001><M) ( FI+FIT(\ FC+FCT(; A+3 [72] +OK9 [73] GG:SENSM[2; ]+((POP[2;;]-POP[1;;])tPOP[1;;])x1000 [74] SENS.M[3 ;]+((F[2; J-F[l;;])tF[l;;])xlOOO [ 75] SENSM[ 4 ; ]+( (POP[3;; ]"'P0P[1;;] )><1000 )tPOP[ 1;;] [76] SENSMF+((F[3; J-F[l; ])x1000)tF[1;;] [77] EE4 :TIT+' POPULATION NUMBF.'RS' [78] POFWB+POP[l;;] [79] 0 OUT POPNB,[1](AG[1].AG[4]) A!PLUS POPNB [80] +( 1N0'=2+CHECK2)/MORTALITY [81] WG+WGT [82] NEXT:+( A/( pWG'I') =pPOPNB) /PRINT [ 83] WGT+-WGT ,WG (; ">-NEX'I' [ 84 J PRINT :POPBIOMA!:i'i)'*·WGT>< ( (POPNB>< ( 1'"*~-F[ 1;; ]+MORT[ 1;;])) tF[ 1;; ]+MORT[ 1;;]) [85] TI'I'+'MEAN POPULATION BIOMASS (KG)' [86] 0 OUT POPBIOMASS,[l] NEWPOPBIOMASS+(AG[1},AC[4]) AAPLUS POPBIOMASS [87] +(FLAC=O)/CATBIOMASS [88] ' (; '¥/ARNING WEICHT AT AGE IS AVAILABLE FOR 0/VF.' YEAR ONLY.' [ 89] POPULATION BIOMASS, AS CALCULATED MAY BE BIASE.'D.' (' 1 1
[ 90] CATBIOMASS: CATC!JBIOMASS+WCT><CATCH [911 'l'IT+'CATCH BIOMASS (KG)' [92] ClOUT CATCHBIOMASS,[l]+/[1] CATCHBIOMASS [93] TIT+'MEAN WEIGHT OF INDIVIDUALS IN CATCH' [ 94 J 2 OU7'( + /[ 1 J CATCHBIOMASS) t+ /[ 1J CATCH [95] MORTALI'l'Y: Z."WGT+( +/[ 1 ](POFWB><FISHMORT+F[ 1;; 1)) t+/[ 1] POP/VB [96] TIT+'FISHING MORTALITY' (' 3 OUT FISHMORT,[1] FWCT [97] +( 'N0'=2tCHECK1)/0 [ 98] SUB+' PARTIAL DF:RIVATIVES OF POPULATION WITH RESPECT TO PARAMETERS' (' HEADER SUB [99] TI'I'+-'SENSITIVITY 'I'D TERMINAL F' (; 3 OUT SENSM[2;;] [1CIO] TIT+'SENSITIVITY '1'0 NATURAL MOR'l'ALITY' ( 3 OUT SENSM[4;;] [1CI1J OVERSENS+(SENSM[2;1;]*2)+SENSM[4;1;]*2 [102] SUB+'PARTIAL DERIVATIVES OF ES'IIMATED F WITH RESPECT TO PARAMF:TERS' ('HEADER SUB [103] TIT+'SENSI'l'IVITY TO TERMINAL F' \: 3 OUT SEIVSM[3;;] [ 104] TIT+'SBNSITIVITY '1'0 NATURAL MORTALITY' ( 3 OUT SF:NSMF [105] SUB+'PARTIAL DERIVATIVES OF POPULATION NUMBERS FOR YOUNGF:ST ACE GROUP' [106] HEADER SUB [1071 XK+( 1 ])pO \ J+I+IK+JK+Q [ 108 ]EEO [109]FF1:I+I+1 ( J+J+1 (' K+K+1 [110] XK[I ;J] (w(MORT[1;I;J]xK)))tPOP[1;(I~K=Q.5);(J=K~a.5)] [111] +((I=pFI)v(J=pFC))/FE2 [112] +EEl [113]EE2:~(IK=((pFI) ))/EE3 [114] I+IK+IK+l (' J+O ( +EEO [115]EE3:J+JK+JK+1 0 I+O 0 +(JK<pFC)/EEO [116] Ml+(pFI) ;pFC] [117] M2+(pFC)pMORT[1;pFI;] [118] FIT+XK[;pFC]><FIT+(pXK[;pFC])pFIT+((*(~0.5><Ml))xZt(F1><1~*(PZ+FI+M1))) [ 119] FC'I'+XK[pF I: ]xFCT'<-( pXK[pFI:]) pFCT+i ( ( *( •0. 5><M2)) tFC)x (Z+FC+M2)) [120] ~('YES =3tXX)/EE6 [ 121] FCT+FCTHN 1+( pFC7') piN1+( l~*'"Z) [122]EF.'6 ]+FCT ~ XK[;pFC]+FIT [123] 7'11'~-'SENSITIVITY TO INDIVIDUAL CATCH VALUES' ( 3 OUT XK [124] OVERSENS+OVERSENS+XK[l;]*2 0 I+1 [ 125 ]SUM:OVf.'RSENS+OVERSENS+( (HXK[I+1;]) ,Ip0)*2 [126] I+I+1 [127] +(((1tpXK)~I)>O)/SUM [ 128 J OVERSE'NS+OVERSENS*O, 5 [ 129] TIT+'OVERALL SENSITIVITY OF RECRUITMENT' [1 ] OUT OVERSENS [131] ISP+( tpOVERSENS [132] 0 OVERALL SENSITIVITY INDF.'X: ',~ISP
v

- 92 -
YIELD
The function YIELD calculates the yield for a single recruit at various levels of fishing mortality by the method of Thompson and Bell (ref, Ricker, 1975).
V YIELD;M;OUTM;OUTM1;0VTM2;~X;MAX;SL;ROT;WGT;SEL;FLG;FLG1;WGT1;L;H;A;IN;IND;M1;SEL1; FLG9;FLAG3;FT;TOT;TIT;F.MAX;FT;F01;MSL;XSL;I;SV;KKK;OUTF
[1] ERO:'WFIGHT A'l' AGE? (KG)' [2] +(A/0<WG'1~,0)/ER1 [3] +ERO,Ot~'WEIGHTS MUST BE POSITIVE. RE•ENTER ' [ 4 J F'R1: 'PARTIAL RECRUITMENT? 1
[5] +((pWGT)=pSEL+,0)/0K1 [6] +ER1,0t~+'ONP. VALUE FOR EACH OF ',(YpWGT),' AGES. RE~ENTER' [7] OK1:+(A/(SEL~O),SEL~1)/ER2 [8] +ER1,0tl~'PARTIAL RECRUITMENTS MUST BE BETWEEN 0 AND 1. RE-ENTER ' [9] ER2:'NATURAL MORTALITY?' [10] +(V/(1,pWGT)=pM+,0)/0K2 [11] +ER2,0t~'EITHER 1 OR ',(YpWGT),' N~BERS. RE-ENTER I
[12] OK2:+(A/M>O)/OK3 [13] +ER2,0t~'MORTALITIES MUST BE POSITIVE. RE-ENTER ' [14] OK3:M+(pWGT)pM [ 15] ER3:' ' (' 'SENSITIVITY COEFFICIENTS FOR THE FOLLOWING PARAMETERS:' [16] '(ENTER A VF:CTOR OF ZE'ROS AND/OR ONES IN THIS ORDER)' [17] NATURAL MORTALITY' 0 ' PARTIAL RECRUITMENT' 0 ' WEIGHT AT AGF' [18] +(A/((SV=O)vSV=1),3=pSV+,0)/ER4 [19] +ER3,0t~'MUST BE A VECTOR OF 3 ELEMENTS WITH ZEROS AND/OR ONES' [20] ER4:'MAXIMUM FISHING MORTALITY IN OUTPUT TABLE' [21] +(A/(KKK>O) 1=pKKK+,0)/ES1 [22] +ER4,0t~'ONE POSITIVE VALUF., RF•ENTER' [23] ES1:+(KKK<5)/ER5 0 KKK+5 [24] FR5:KKK+2+KKK+f(KKKx10) [25] IN+(SV=1)/tpSV 0' ' [ 26] YIELD PER RECRUIT ANALYSIS' ~· ' ' [27] Ml+M 0 SFL1+SEL 0 WGT1+WGT 0 FLG9+0 [28] FT+TOT+H+30p0 0 A+1 0 TI~ 4 35 p' ' 0 ~AX+F01+4p0 [29] AA:MSL+YIE 0.0001 ( SL+1000xMSL[3] [30] OUTM+YIE O.l><FMX+t (KKK~2) 0 +(M1 )/CC [31] BB:MAX+OUTM[;3]lr/OUTM[;3] [32] FT[1]+0UTM[MAX;1] 0 FLG1+0 [ 33] CC:L+O [34] II:+(v/(30<L+L+1),(v/(IFT)>10))/VV [35] XSL+YIE(FT[L]-0.001),(FT[L]+0.001) [36] TOT[L]+500><XSL[2;3]•XSL[1;3] 0 +(FLG1=1)/LL [37] KK:~(L>2)/MM [38] FT[L+l]+FT[L]-0,005 0 +II [39] LL:TOT[L]+TOT[L]-SL 0 +KK [40] MM:+(0.000000001~ITOT[L])/NN [41] H[L]+(TOT[L]xFT[L]~FT[L-1])tTOT[L]-TOT[L•1] [42] FT[L+l]+FT[L]-H[L] ( +II [43] NN:+(FLC1=1)/NN1 [44] ~AX[A]+FT[L] [45] FT[1]+0.7xVMAX[A] 0 FLG1+1 [46] +(FLG9~1)/NM 0 FT+(pFT)pO 0 FT[1]+0.1 [47] NM:+(A=1)/CC [48] FT[1]+F01[1J 0 +CC [49] NN1:F01[A]+FT[L] [50] NN05:0UTM+OUTM,[1] YIE FMAX[1],F01[1] [51] OUTM+OUTM[I+~OUTM[;1];] [52] OUTM+OUTM,[2](0UTM[;3]t0UTM[;2]),[1.5] OUTM[;3]tOUTM[;1] [53] OUTM[;5]+0UTM[;5Jtr/OUTM[;5] [54] +(A=1)/NN2 [55] OUTM[;2]+((1000xOUTM[;2]-0UTM1[;2])tOUTM1[;2]) [56] OiffM[;3]+((1000><0UTM[;3]-0UTM1[;3])tOUTM1[;3]) [57] OUTM[;4]+((1000><0lJTM[;4]•0UTM1[;4])tOUTM1[;4]) [58] OUTM[;5]+((1000xOUTM[;5]-0UTM1[;5l)tOUTM1[;5])

- 93 -
[59] NN2: I '
[60] FISHING CATCH YIELD AVG. WEIGHT YIELD PER' [61] MORTALITY (NUMBER) (KG) (KG) UNIT EFFORT' [62] •P•••-b•• ·-~----· ··--------- -----------' [63] RO~(KKK,7)p' ' [64] ROT[ItKKK;]+'F0.1•-·' [65] ROT[It(KKK~1);]+'FMAX•--' [66] (vROT), 7 4 10 3 9 3 10 3 14 3 ~OUTM [67] M+M1 0 SEL+SEL1 0 WC~WGT1 [68] +((piN)<l)/WW [69] +(2~A+A+1)/00 [70] OUTMl+OUTM [ 71 J FISHMORT+OUTM[; 1 J 0 YIELDPERRFCRUIT+OUTM[ ;3] \:· MFANWEIGH~OUTM[ ;4] [72] OO:IND+1+IN \:• I I
[73] +((IND=2),IND=3)/RR,SS [74] VTIT[A;]+'SENSITIVITY TO NATURAL MORTALITY [75] M4-M+(0.001><M) 0 -.uu [76] RR:~TIT[A;]+ 1 SFNSITIVITY TO PARTIAL RECRUITMENT 1
[77] SEL+SEL+(0.001><SEL) 0 +UU [78] SS:~TIT[A;]+'SENSITIVITY TO WEIGHT AT AGE [ 79 J WGT+WGT+( 0. 001 ><WGT) [SOl UU:IN+1HN [81] FLC1+0 0 FT[1]+P.MAX[1] (': +AA [82] VV:+(FLG9)/NN \: ' ' [83] 'WARNING: CONVERGENCE CRITERION NOT SATISFIED.' [84] THE VALUE OF FMAX AND THE CORRESPONDING DERIVATIVES MAY' [ 85] MAY BE INACCURATE.' 0 ' ' 0 FLG9+1 0 +NN [86] WW:FLAG3+A [87] +(FLAG3=1)/0 [88] A+-1 (' 1 1 (: 'SENSITIVITY OF FMAX AND F0.1 TO PARAMETERS.' (' ' ' [ 89] PARAMETERS FMAX FO. 1'
[90] ·-----b·b- ··-·' [91] IN+(SV=1)/tpSV [92] WW1:A+A+1 (' IN!)<-1HN [93] +(A>FLAG3)/0 [94] P.MAX[A]+(1000xf.MAX[A]•P.MAX[1])fP.MAX[1] [95] F01[A]+-(1000><F01[A]•F01[1])tF01[1] [96] OUTF+(FMAX[A],F01[A]) [97] WWW:(vTIT[A;]), 15 4 15 4 ~OUTF [98] IN+1+IN 0 +WW1
v
YIE (Calling form: YIE X)
The function YIE is used by the function YIELD to calculate the number of fish caught from each recruit and the total weight of fish caught from each recruit.
VYIE[O]V V Y+YIE X;NUM;CAT;YLD;I;FT;~P
[1] N~+(pX)p1
[2] CAT+YLD+(pX)pO [3] I+-1 [4] AA:FT+X><SEL[I] [ 5] CAT+CAT+TMP+NUM><F"l'x( 1=*=F"l'+M[IJ )tFT+M[IJ [6] YLD+YLD+TMP><WGT[I] [7] NUN+NUM><*•FT+M[I] [8] +((pWGT)~I+I+1)/AA [9] Y~(3,pX)pX,CAT,YLD
v

- 94 -
APPENDIX B
NAMES OF APL VECTORS AND MATRICES
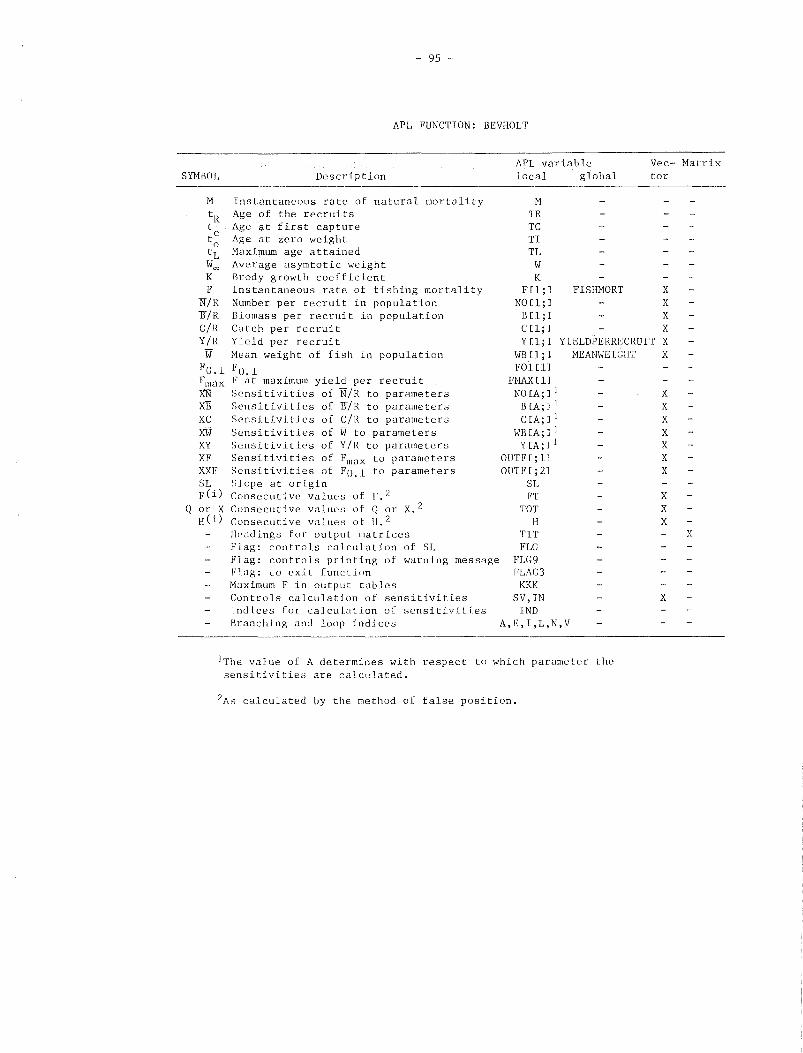
- 95 -
APL FUNCTION: BEVHOLT
APL variable SYMBOL Description local global
Vee- Matrix tor
Q
M
tR t
t~ tL woo K F
N/R "IT/R C/R Y/R w
Fo.l Fmax xN XB XC xw XY XF XXF SL F(i)
or X H ( i)
Instantaneous rate of natural mortality Age of the recruits Age at first capture Age at zero weight Maximum age attained Average asymtotic weight Brody growth coefficient Instantaneous rate of fishing mortality Number per recruit in population Biomass per recruit in population Catch per recruit Yield per recruit Mean weight of fish in population
Fo.1 F at maximum yield per recruit Sensitivities of N/R to parameters Sensitivities of "IT/R to parameters Sensitivities of C/R to parameters Sensitivities of W to parameters Sensitivities of Y/R to parameters Sensitivities of Fmax to parameters Sensitivities of Fo.l to parameters Slope at origin Consecutive values of F. 7
2 Consecutive values of Q or X. Consecutive values of H. 2 Headings for output matrices FLag: controls calculation of SL Flag: controls printing of warning message Flag: to exit function Maximum F in output tables Controls calculation of sensitivities Indices for calculation of sensitivities Branching and loop indices
M TR TC TI TL
\</ K
FU;J NO U; J
B U; J
FISHMORT X X X X C U; J
y U; J YIELDPERRECRUIT X W!Hl;J FOHlJ
FMAXUJ NOCA;J 1
B (A•J l
C [A; J 1
WB[A;J 1
y [A; J 1 OUTF [; lJ OUTF[;2J
SL FT
TOT H
TIT FLG
FLG9 FLAG3
KKK SV,IN
IND A,E,I,L,N,V
MEANWEICHT X
X X X
X X X X
X X X
X
1Thc value of A determines with respect to which parameter the sensitivities are calculated.
2As calculated by the method of false position.
X

Symbol
B i+.5,t+.5
8i,t
y l, T
D l, T
P* • 'T
p • 'T
~B \ 'T
F l,T
F T
- 96 -
APL FUNCTIONS: COHORT, GRAPH~PRODUCTION, GRAPH~NET~PROD
Description APL variable Vector local global
Catch matrix CATCH as given
Initial F-values for the last year FI X
Initial F-values for the oldest age-groups FC X
Natural mortalities MORT
Weight-at-age WGT X
Calculated population numbers POP [1; ;] POPNB
Calculated population biomass POPBIOMASS~MIDYR
Calculated pop. biomass at beginning of year POPBIOMASS~BEG -
Catch biomass (yield)
Mean weight of individuals in catch
Mean age of individuals in catch
Loss of biomass through natural mortality
Net production (annual)
Recruitment biomass
Total production
Growth component of production
Observed change of biomass over time
Calculated fishing mortalities
Weighted F
Sensitivities of N to parameters i,t
Sensitivities of F to parameters l, T
Headings for output tables
Overall sensitivity of recruitment
Overall sensitivity index
Components of production (for graph)
Production - deaths ; fishing loss
CATCHBIOMASS FISHINGBIOMASSLOSS
X
X
DT
NETPROD X
RECRUIT~BIOMASS X
PRODUCTION
BG
~B
F [1; ;] FISHMORT
SENSM[2; ;] SENSM [4; ;] , XK SENSM [3; ;] SENSMF
TIT
OVERS ENS
ISP
DATAl
DATA2
X
X
X
X
Matrix
X
X
X
X
X
X X
X
X
X
X
X X X X
X
X

Symbol
N. 0 l,
w i+,5
r \
M \
R • 't
F • 't
Q . 't
c \ 'T
N. l,t
- 97 -
APL FUNCTIONS: MPROJECT, MPROJ, MPROJOUT
Description
Population numbers for the initial year
Catch vector for the initial year
Weight-at-age
Partial recruitment
Natural mortality
Estimated recruitment
Initial F-values for years of projection
Quota for years of projection
Maturity at age
Calculated fishing mortalities
Projected catch
Projected population numbers
APL variable Vector Matrix local global
POP
CAT
WGT
SEL
M
REG
ANS
ANS
MAT
CURR[3;;]1
FISHMORT l
CURR[2;;J CATCH6NUM
l CURR[l; ;J POPNB
X
X
X
X
X
X
X
X
X
X
X
X
B. 5 t 5 Projected population biomass 1.+. ' + ~
OUTM 1 POPBIOMASS X
y \ 'T
N . 't
B • 't
Projected yield (catch biomass)
Projected number of mature fish in population
Projected biomass of mature fish in pop.
Headings for output tables
Sensitivities of yield to parameters
Mean weight of individuals in the catch
l
OUTMl
l OUTM
l OUTM
TIT
SENSM 2
l OUTM
Overwritten during the calculation of sensitivities
2The same matrix is used for each parameter
X
X
X
X
X
X

- 98 -
APL FUNCTIONS: SURVIVOR and related functions.
Symbol
Ai+.S,t+.S
so m, t
Description
First year in catch matrix
Final year of calibration block
First fully recruited age
Oldest age-group in calibration block
Catch matrix
Matrix of research vessel abundance index
Initial estimate of survivors for the oldest age-groups
Initial estimate of survivors for the final year (all age-groups)
N. Population numbers, mid-year l+.S,t+.S
Calibration constants
Natural logarithm of calibration constants
CINT Integrated catch
SINT Integrated survivors
s. j l,tf, Estimated survivors for final year
sm, t .j Estimated survivors for oldest age-groups
Var si,tf,j Variance of estimated survivors
Var S Variance of estimated survivors m, t,j
Maximum number of iterations
s. l,tf
and sm, t Weighted average of survivors
e Matrix of residuals i,t
Matrix of outliers of residuals
SS4 Sum of squares due to an age-effect
MS4 Mean square due to an age-effect
SSl Sum of squares due to a year-effect
MSl Mean square due to a year-effect
SS3 Sum of squares due to a yearclass-effect
MS3 Mean square due to a yearclass-effect
APL variable Vector Matrix local global
Pl[l]
P2 [1]
Il
P2 [2]
CATCH
RVABUND
SAG
SYR
K
LNK
SHAT
SHAT
NUMlliTER
WllSURV
OUTER
MSMG
SSl
MSllYR
MSllYRCL
as given
as given
as given
as given
POPNB
CINT
SINT
ESTliVARllS
ESTL1VARL1S
RESIDUAL
SSMG
SSL1YRCL
X
X
X
X
X
X
X
X
X
X
X
X
X
X
X
X

Symbol
b
lJ l, T
f T
z l,T
q
M
Symbol
n
K or K'
- 99 -
APL FUNCTION: PALOHEIMO
Description
First year in the CPUE matrix
Youngest age-group in the CPUE matrix
Matrix of catch per unit of effo~t (time- and age-specific)
Annual estimates of fishing effort
Mean instantaneous rate of mortality
Overall mortality rate for the period T,T+l
Mean effort for the period T,T+l
Catchability coefficient (estimated)
Instantaneous rate of natural mortality (estimated)
APL FUNCTION: VONB
Description
Total number of observations
Length-at-age or weight-at-age
Mean asymptotic length or weight
Brody Growth Coefficient
Hypothetical age for zero length or zero weight
APL variable Vector Matrix local global
TEMP [1]
TEMP [2]
as given X CPUE X
FVAL X
Z X
X
F X
B [2 ;J
B [1;]
APL variable Vector Matrix local global
pL
L as given X
~[1]
~[2]
~[3]

SYMBOL
F m,T
M
N. :L,t
F 1, T
- 100 -
APL FUNCTION: VPA
Description
Catch matrix
Initial F values for the last year
Initial F's for oldest age-groups
Natural mortality
Calculated population numbers
Calculated F values
Sensitivities of Ni,t to parameters
Sensitivities of F1 ,T to parameters
Headings for output tables
Overall sensitivity of recruitment
Overall sensitivity index
Calculated population biomass
Catch biomass (yield)
APL Variable Vector Matrix local global
CATCH
FI
FC
MORT
POP[l;;)
F [1; ;J
SENSM[2; ;) SENSM[4;;J ,XK SESSM[3; ;]
SENSMF TIT
as given
X
X
POPNB
FISHMORT
X
OVERS ENS X
ISP
POPBIOMASS
CATCHBIOMASS-
X
X
X
X
X X X X
X
X

- 101 -
APL FUNCTIONS: YIELD, YIE
SYMBOL Description APL variable local global
Vee- Matrix tor
w I
Fo.l Fmax SL F(i)
Q or X H (i)
Weight at age Partial recruitment Instantaneous rates of natural mortality Instantaneous rate of fishing mortality Catch per recruit Yield per recruit
Average weight of fish caught Relative index of yield per unit-effort Fo.1 F at maximum yield per recruit Slope at origin Consecutive values of F. 1
Consecutive values of Q or x. 1
Consecutive values of H. 1
Sensitivities of c. to parameters Sensitivities of Y. to parameters Sensitivities of W to parameters Sensitivities of I to parameters Headings for output matrices Flag: controls calc. of Fo.l and Fmax Flag: controls printing of warning mes-
sage Flag: to exit function Maximum F in output tables Controls calculation of sensitivities Indices for calc. of sensitivities Branching and loop indices
WGT SEL M
X X X
OUTMl[;ll FISHMORT X OUTMl [; 2J X OUTM1[;3l YIELDPERRE- X
CRUIT OUTM1[;41 MEANWEIGHT X OUMT1[;5J X
FOl [ll FMAXUJ
SL FT TOT
H OUTM[; 2J 2
OUTM[; 3J 2
OUTM[; 41 2
OUTM[;5J 2
TIT FLGl
FLG9 FLAG3
KKK SV,IN
IND A,I,L
X X X X X X X
X
1As calculated by the method of false position.
2The matrix OUTM is overwritten after the calculation of sensitivities for each parameter.
X

- 102 -
APPENDIX C
SIGN ON and SIGN OFF
This appendix briefly describes the sign on and sign off procedure for I.P. Sharp APL, in Ottawa.
SIGN ON:
SIGN
1) Turn on your terminal and acoustic coupler (on terminal, LCL/COM switch set to COM)
2) Dial 9-563-9458
3) Wait for high-pitched tone and place the phone into the acoustic coupler.
4)
5)
Type: O) and press the RETURN key.
Type: )Account,no:password and press the RETURN key.
6) Then the Computer will respond and you can proceed to )LOAD 2719067 FISH.
OFF:
1) Type: )OFF
2) Wait for the response of the Computer.
3) Hang up the phone,
4) Turn off the terminal and the acoustic coupler,

- 103 -
APPENDIX D
Terminals supported by the plottinB routines.
Description Identification
Xerox Diablo 1550 Xl550
Xerox Diablo 1620 Xl620
Xerox Diablo 1641 Xl641
Xerox Diablo 1700 Xl700
Trendata 4000 T/~000
Trendata 4000A T4000A
Anderson Jacobsen 832 AJ832
Anderson Jacobsen 832U AJ832U
Tektronix TEK
Hewlett Packard HP
DTC 300 DTC300
DTC 302 DTC302
ASL 3 ASL3
ASL 2 ASL2


![d ] v€¦ · EPSON Easy Photo Print Photo Print ladi stock DOI ladi stock 002 ladi stock stock ladi stock 005 ladi stock DDE ladi stock 007 stock DDB ladi stock DDS ladi stock 010](https://static.fdocuments.us/doc/165x107/5f06f3837e708231d41a8cef/d-v-epson-easy-photo-print-photo-print-ladi-stock-doi-ladi-stock-002-ladi-stock.jpg)