API & Data Visualization A....
13
Department of Engineering Science Lab 5 – API & Data Visualization F. Farahmand 9/30/2016 Ver. 2 1 API & Data Visualization A. Objectives 1. Understand what APIs are and how we can utilizer them 2. Data formats 3. Data storage in a file 4. Accessing and visualizing the data 5. Learning more about JavaScrip B. Time of Completion This laboratory activity is designed for students with some understanding about Raspberry Pi and it is estimated to take about 6 hours to complete. C. Requirements 1. A Raspberry Pi 3 Model 3 2. 32 GByte MicroSD card à Give your MicroSD card to the lab instructor for a copy of Ubuntu. 3. USB adaptor to power up the Pi 4. LED and wires D. Pre-Lab Have a general understanding about HTML and JavaScript. Make sure you review your previous Python programs. Read about URL Query String (https://en.wikipedia.org/wiki/Query_string )
Transcript of API & Data Visualization A....

Department of Engineering Science
Lab 5 – API & Data Visualization
F. Farahmand 9/30/2016
Ver. 2
1
API & Data Visualization
A. Objectives
1. Understand what APIs are and how we can utilizer them 2. Data formats 3. Data storage in a file 4. Accessing and visualizing the data 5. Learning more about JavaScrip
B. Time of Completion This laboratory activity is designed for students with some understanding about Raspberry Pi and it is estimated to take about 6 hours to complete.
C. Requirements 1. A Raspberry Pi 3 Model 3 2. 32 GByte MicroSD card à Give your MicroSD card to the lab instructor for a copy of Ubuntu. 3. USB adaptor to power up the Pi 4. LED and wires
D. Pre-Lab
Have a general understanding about HTML and JavaScript. Make sure you review your previous Python programs.
Read about URL Query String (https://en.wikipedia.org/wiki/Query_string )

Department of Engineering Science
Lab 5 – API & Data Visualization
F. Farahmand 9/30/2016
Ver. 2
2
E. Lab
1. Accessing Weather Underground Web Site In this section of the lab we like to write a simple program to access the data provided by the weather underground (WU) web page. The wunderground.com site provides an amazing set of weather information. For example if you go to the following site:
http://api.wunderground.com/api/fc2c9fe73bb5879e/geolookup/conditions/q/IA/Cedar_Rapids.json
you can see a JSON formatted data related to weather conditions at Cedar Rapids in state of Iowa (IA). The forecasted weather for Cedar Rapids can be obtained from this link:
http://api.wunderground.com/api/fc2c9fe73bb5879e/geolookup/forecast/q/IA/Cedar_Rapids.json
It is possible to write a simple Python program to render an HTTP request and receive the JSON response from the WU web server. Copy the Python, as shown in Figure 1, in a file called wu_condition.py and run the code form your terminal using python wu_condition.py . Observe the returned response. Note that in this program we use JSON module to parse the received data. The data parsing is accomplished by first separating the Location, City, Current_Observation, and finally the temp_f parameter. Pay attention to the hierarchy of the data in the received response.
#!/usr/bin/python # This is accessing wunderground site import requests import json import urllib2 State_City = 'CA/Santa_Rosa.json' key = 'fc2c9fe73bb5879e' f=urllib2.urlopen('http://api.wunderground.com/api/' + key + '/geolookup/conditions/q/'+State_City) json_string = f.read() parsed_json = json.loads(json_string) location = parsed_json['location']['city'] temp_f = parsed_json['current_observation']['temp_f'] print "Current temperature in %s is: %s" % (location, temp_f) f.close()
Figure 1: Simple Python program to access WU server.
Answer the following questions:
1. What is the significance of “pop” in the forecastday record in forecasted weather JSON link?
PROGRAMING EXERCISE: Modify the program to parse the data indicating how the weather “feels like” (in Fahrenheit) in the city of San Francisco in CA. Pay attention to “current_observation” record.
PRACTICE (Optional): It is possible to write a simple program to forecast the weather (pop value) and if the chance of rain is more than, say 60 percent, an LED on the RPi starts flashing reminding us to take the umbrella when we are leaving the house! It is easy to imagine that the same program can be modified such that we don’t water the garden if we are expected to have rain!
Department of Engineering Science
Lab 5 – API & Data Visualization
F. Farahmand 9/30/2016
Ver. 2
3
2. What is API An API (Application Programming Interface) can be thought of as a contract provided by one piece of computer software to another. In other words, an API is an agreement between two machines stating: "If you give me this instruction, I will perform this action, or return this information." For example, in the above WU access example, without using an API, we could only receive the information about the weather, say in San Francisco, by opening wunderground.com and reading the webpage like a human does. However, with an API, we can receive the information about the weather, say in San Francisco, by sending a message to the wunderground.com API (in some structured format). The wunderground.com API then replies with the appropriate structured response (in this case JSON).
Consequently, one can think that accessing an API is the same as accessing any other web page via a URL. The difference is that the data returned by an API is formatted. APIs are not as easy as web pages to read. Therefore, we often need to reformat the data.
Facebook, Twitter, Yahoo, Google, Tumblr, Wikipedia, Flickr, Data.gov, Reddit, IMDb, Rotten Tomatoes, LinkedIn, and many other popular sites offer APIs for programs to use. Some of these sites require registration, which is almost always free. Using APIs, it is possible to write programs that do many different tasks. In the above example, we already saw how we can retrieve data from wunderground.com site and parse the data. In general, accessing APIs is often more convenient than downloading web pages and parsing HTML1.
When using APIs, various data formats can be used to make the data more readable. The most common data format for APIs, as we saw in our WU example, is using JSON. Below we learn more about data formats.
3. Data Formats There are a number of different data formats that a data set can be structured as. Below we present three common data formats, often used within the concept of Internet-of-Things2-3 :
JSON (JavaScript Object Notation): JSON is a data format that is gaining popularity and is used extensively in many asynchronous browser/server communications (AJAX) powering Web 2.0 sites. Many websites that offer APIs, including wunderground.com, can return data in JSON format. JSON is a text-based open standard for data exchange. Because JSON format is text only, it is considered to be it is language independent.
In general, the two primary parts that make up JSON are keys and values. Together they make a key-value (or Name/Value) pair. For example: {“temp”:“65”} is a simple example, where the key is temp and the value is 65. The key-value can also be expressed in a more complex way as follow:
{“temp” : “65”, “humidity” : “6”, “light” : “400”}.
Note that in this case we have an ordered list of values. However, depending on the type of library we use to parse the data, key-value pair may not appear in order:
{“light” : “400” , “humidity” : “6”, “temp” : “65”}.
1 There are many ways to parse the HTML page. One such approach is using Beautiful Soap ?? 2 This is a simple data formatter: http://www.freeformatter.com/xml-formatter.html 3 See this for more information (https://automatetheboringstuff.com/chapter14/ )

Department of Engineering Science
Lab 5 – API & Data Visualization
F. Farahmand 9/30/2016
Ver. 2
4
Figure 2 depicts a more complex example of a JSON data structure. In this case, the data structure is referred to an Object. Each object can have multiple arrays, each containing one or more records. In Figure 2 example, the Sensor object has three arrays of
values. Each array has three sensor records.
Using the tool available in (https://jsonformatter.curiousconcept.com/) it is possible to convert JSON to a Formatted JSON data. It must be noted that in the exercise above, we used an API key that requests JSON data format from wunderground.com server.
{"Sensor":[ {"temp":"12", "humidity":"7"}, {"temp":"22", "humidity":"17"}, {"temp":"42", "humidity":"78"}, ]}
{ "Sensor":[ { "temp":"12", "humidity":"7" }, { "temp":"22", "humidity":"17" }, { "temp":"42", "humidity":"78" }, ] }
JavaScript Data Formatted JavaScript Data Figure 2: Example of a JSON data structure.
We should also note that JSONP (JSON with Padding) is basically a JSON extension. Consider the following examples:
{"Sensor1":"light":12,"temperature":5} //JSON Example:
func({"Sensor1":"light":12,"temperature":5}) //JSONP Example
The main advantage of using JSONP is that if we can set up a function (in the example above called func), then that function can be be called with one argument, which is the JSON data.
XML (Extensible Markup Language): This is a markup language that defines a set of rules for encoding documents in a format, which is both human-readable and machine-readable. It is defined by the W3C's XML 1.0 Specification and by several other related specifications, all of which are open standards. XML is also a software- and hardware-independent tool for storing and transporting data.
<note> <to>Tove</to> <from>Jani</from> <heading>Reminder</heading> <body>Don't forget me this weekend!</body> </note>
<?xml version="1.0" encoding="UTF-8"?> <note> <to>Tove</to> <from>Jani</from> <heading>Reminder</heading> <body>Don't forget me this weekend!</body> </note>
XML Data Formatted XML Data Figure 3: Example of XML data structure.
Object [ ]
Arrays { } Records “I”:”3”

Department of Engineering Science
Lab 5 – API & Data Visualization
F. Farahmand 9/30/2016
Ver. 2
5
CSV (Comma-Separated Values): This is a delimited data format that has fields (or columns) separated by the comma character and records/rows terminal by newlines. CSV file format is also used to store tabular data, such as a spreadsheet or database. Files in the CSV format can be imported to and exported from programs that store data in tables, such as Microsoft Excel or OpenOffice Calc. The CSV file format requires no overhead or metadata 4.
4. Data Collection & Visualization In this section we learn how to use a RPi in order to collect data from different sensors connected to the GPIO ports and store it in a CSV file. Then, we learn how to access the CSV file using a Web server. The web server provides access to the data through data visualization. Hence, remote users can view the data plots. The figure below depicts the idea.
4.1. Data Collection and Timestamp In the previous section we demonstrated how data could be represented in different formats, including CSV. In this section, we use a random function generator to simulate three sets of environmental data, namely, temperature, humidity, and light. Thus, the data will be stored in the following format: temp,humidity,light each separated by a comma.
It is often desired to include timestamp for the recorded data. Time, in general, has many different formats 5. One particular approach is to use Unix timestamp. Such timestamp is based on seconds since standard epoch of 1/1/1970. Thus, 1479925691, for example, refers to Wed, 23 Nov 2016 18:28:11 GMT (refer to http://www.onlineconversion.com/unix_time.htm).
Consequently, we like to modify each data entry to have the following CSV format: timestamp,temp,humidity,light
Figure 4 depicts how a Python code can be used to generate (simulate) a single data set, containing temperature, humidity, and light values. Each data set is appended to an existing CSV file (e.g. sensordata.csv). It must be noted that using Excel we can always create a file with appropriate timestamp and fields and saving the file as:
4 For more information see https://en.wikipedia.org/wiki/Comma-separated_values 5 For various time formats in Python refer to https://docs.python.org/2/library/time.html

Department of Engineering Science
Lab 5 – API & Data Visualization
F. Farahmand 9/30/2016
Ver. 2
6
Windows CommaSeparate (.csv).
Figure 5 shows the basic file structures and how the user can access the data using data visualization. As shown in the figure, first the user requests for the web page (the data plot) by sending a GET command to the web server. Then, the plot.html file renders its embedded JavaScript in order to access the CSV file and create an array of all data points. The data points are then inserted into CanvasJS chart to create data visualization. The chart is then returned to the user.
Figure 4: Details of genRanDatat.py to simulate data sets and storing them in a CSV formatted file.

Department of Engineering Science
Lab 5 – API & Data Visualization
F. Farahmand 9/30/2016
Ver. 2
7
Figure 5: Basic operation to access the data.
4.2. Data Visualization In order to plot the CSV file, an HTML file is required to extract the values from the file and plot it. As shown in Figure 5, this is performed by calling a JavaScript file. In our case the plot.html file calls restoredata.js JavaScript file. The JS file retrieves the data, parses it, renders it, and then reformats it for plotting. Data plotting is performed using standard CanvasJS library (http://canvasjs.com/docs/charts/intro/). CanvasJS is basically an easy to use HTML5 and Javascript Charting library used by users for free to plot data online. The main advantage of this library is that It runs across devices including iPhone, iPad, Android, Windows Phone, Microsoft Surface, Desktops, etc. It is always possible to code and create our own charts using Java programming but why not use available libraries to make our job simpler? There are many different Chart libraries that are freely availble, such as JQuery, Highcharts, and many more. We use CanvasJS Chart library just to demonstrate how we can plot the data online.
4.2.1. Configuring the RPi Before you continue, make sure your web server in the RPi is accessible and you can see your index.html file.
Appendix A and B show the HTML and JavaScript files used for this exercise, as described in Figure 5. Copy the two files in your web directory (var/www/html). Make sure you create your own CSV file using the format below: timestamp,temp,humidity,light. Your file should be very similar to sensordata.csv, depicted in Figure 5. In order to see the plot a user must access the plot.html file using a browser: http://192.168.1.65/plot.html, assuming 192.168.1.65 is your RPi’s IP address. When a request is sent to plot.html file, the file reaches out to all CanvasJS chart libraries:
<script type="text/javascript" src="http://canvasjs.com/assets/script/jquery-1.11.1.min.js"></script> <script type="text/javascript" src="http://canvasjs.com/assets/script/canvasjs.min.js"></script> <script src="../../canvasjs.min.js"></script>
Upon receiving a request, the plot.html file also calls out the restoredata.js script:
<script type="text/javascript" src= "restoredata.js" > </script>
Thus, the JavaScript is activated. The function getDataPointsFromCSV(csv) in restoredata.js is used to parse the CSV file. Note that the function is called using a designated input specifying the CSV file name: ($.get("sensordata.csv", function(data)).
Now that all the data points are known, we can call the CanvasJS libraries and plot the data by creating a new instance of CanvasJS Chart: var chart = new CanvasJS.Chart("chartContainer",…. We refer to this instance as chartContainer. In the plot.html, this instance is displayed:
<div id="chartContainer" style="height: 200px; width: 60%;"></div>
Note that the Chart has a number of properties, including title, data, zooming capability, etc. The Chart’s identification is ChartContainer. Notice that in each case we only retrieve the timestamp column and one other
Department of Engineering Science
Lab 5 – API & Data Visualization
F. Farahmand 9/30/2016
Ver. 2
8
column (temp, humidity, or light). In this case we can only plot one parameter at a time. This is the chart object that is sent to the HTML file so the chart can be depicted. If everything goes well, you should see the following plot:
Figure 6: Data chart returned to the remote user.
Every time a new data set is injected into the CSV file using genRanData.py file, the chart is expanded. Also, note that you can zoom into the chart! Very cool, huh! Carefully, review the files in Appendix A and B and make sure you understand the general concept and how functions are called and how we pass the Chart properties from the JS to HTML file.
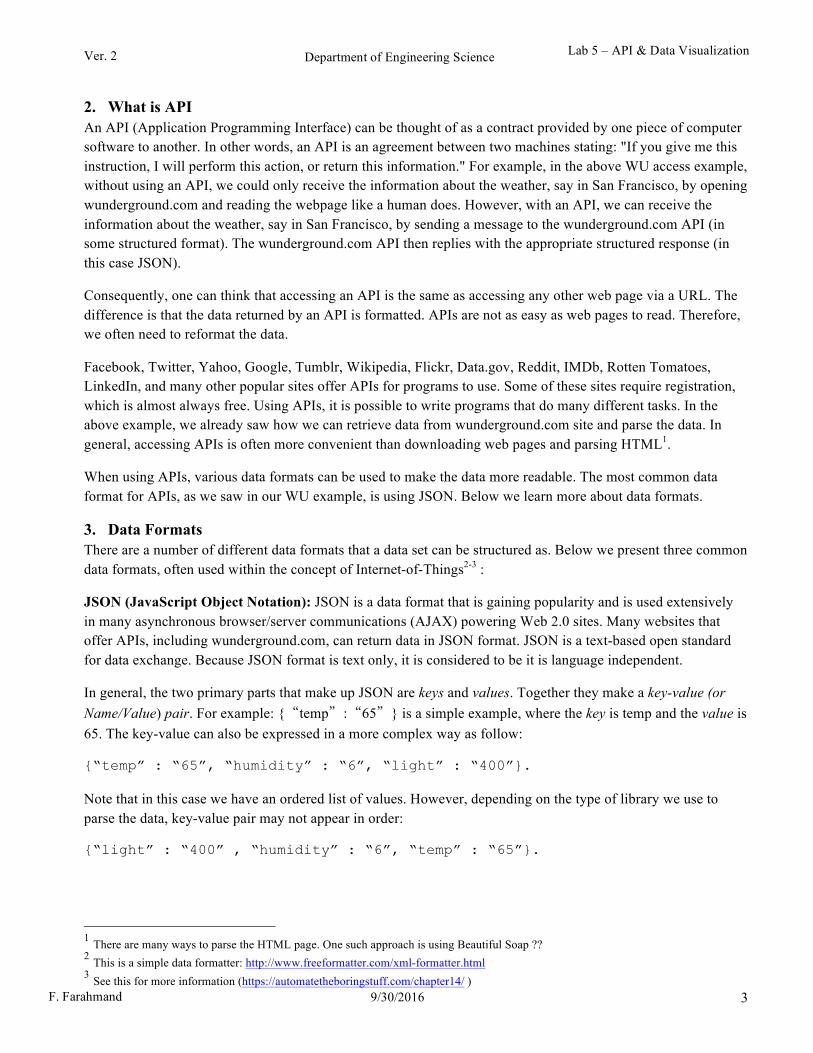
4.2.2. Plotting multiple line charts It is possible to modify our JavaScript file such that we plot multiple parameters on the same chart, as shown here. This can be accomplished by changing the JavaScript such chat multiple data sets are assigned to the data object of the chart, as shown in Appendix C.
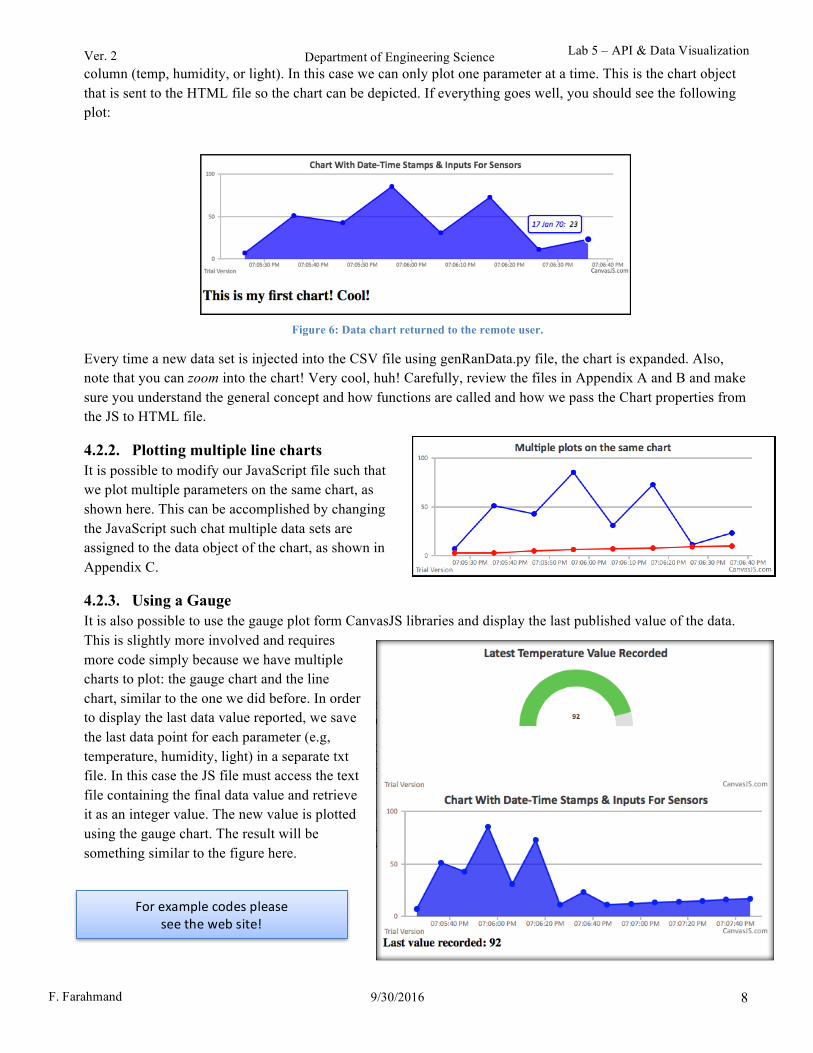
4.2.3. Using a Gauge It is also possible to use the gauge plot form CanvasJS libraries and display the last published value of the data. This is slightly more involved and requires more code simply because we have multiple charts to plot: the gauge chart and the line chart, similar to the one we did before. In order to display the last data value reported, we save the last data point for each parameter (e.g, temperature, humidity, light) in a separate txt file. In this case the JS file must access the text file containing the final data value and retrieve it as an integer value. The new value is plotted using the gauge chart. The result will be something similar to the figure here.
Forexamplecodespleaseseethewebsite!

Department of Engineering Science
Lab 5 – API & Data Visualization
F. Farahmand 9/30/2016
Ver. 2
9
F. Submissions
Answer the following questions to make sure you understand what is happening:
1- How can you modify the JavaScript file such that only the last 5 points in the CSV file are plotted? 2- How do you change the body of the HTML file such that you show your name? 3- What do you have to modify such that the title of the browser tab changes when the plot.html page is
requested? Which tag in the HTML file should change? 4- What happens if we remove the following line from plot.html file?
<script type="text/javascript" src= "restoredata_double_sameplot.js" > </script>
5- What happens if we change the color and type of the data object in the Chart in the JavaScript file? 6- In restoredata.js file, how many data fields can be accessed (each data field is separated by a
comma)? How can we access more data fields? What do we have to change? 7- What happens if zoomEnabled = false in restoredata.js? 8- How would the timestamp value change if the actual time increases by one minute (by how much the
time stamp increases)? Does it make sense?
PROGRAMING EXERCISE: Modify the above files (shown in Figure 5) such that every time you press a button on your RPi a new random set of data is generated and stored in your CSV file. Plot all your values and show a snapshot of your plot.
PROGRAMING EXERCISE (CHALLANGING): Modify the above files such that you plot both temperature and humidity data on the same plot. Show your plot.

Department of Engineering Science
Lab 5 – API & Data Visualization
F. Farahmand 9/30/2016
Ver. 2
10
G. Credits
Special thanks to online resources and all SSU students who assisted putting together this lab.
References
• Learn about JSON data format: http://www.w3schools.com/js/js_json_intro.asp • http://www.onlineconversion.com/unix_time.htm - convert timestamp to real time format • Python time formats: https://pymotw.com/2/datetime/ • CanvasJS Introduction: http://canvasjs.com/docs/charts/intro/

Department of Engineering Science
Lab 5 – API & Data Visualization
F. Farahmand 9/30/2016
Ver. 2
11
AppendixA<!DOCTYPE HTML> <!--Title: Plot.html --> <!--Make sure you have the following files in the same directory: 1- restoredata.js 2- sensordata.cvs --> <html> <head> <!--Comment: These are like library files - don't change! --> <script type="text/javascript" src="http://canvasjs.com/assets/script/jquery-1.11.1.min.js"></script> <script type="text/javascript" src="http://canvasjs.com/assets/script/canvasjs.min.js"></script> <script src="../../canvasjs.min.js"></script> <!--This is JavaScript where we get sensor data --> <script type="text/javascript" src= "restoredata.js" > </script> <!--Comment: This is the title of the TAB --> <title>CanvasJS Plot Example</title> </head> <body> <!--Comment: You can change the size of the chart--> <div id="chartContainer" style="height: 200px; width: 60%;"></div> <!--Comment: You can add more text here--> <h2>This is my first chart! Cool!</h2> </body> </html>

Department of Engineering Science
Lab 5 – API & Data Visualization
F. Farahmand 9/30/2016
Ver. 2
12
AppendixB // Title: restordata.js // This file calls the sensordata.csv file and parses its columns // the assumption is that there are no more that 4 columns in the file // the first column is timestamp [0]; columns [1]-[3] contain sensor data window.onload = function() { var dataPoints = []; mytimeStamp = 0; tempValue = 1; humValue = 2; lightValue = 3; function getDataPointsFromCSV(csv) { var dataPoints = csvLines = points = []; csvLines = csv.split(/[\r?\n|\r|\n|\r|\n|\r|\n]+/); // parse FOUR columns for (var i = 0; i < csvLines.length; i++) if (csvLines[i].length > 0) { points = csvLines[i].split(","); dataPoints.push({ x: parseFloat(points[mytimeStamp]), // Timestamp column y: parseFloat(points[tempValue]) // First data column }); } return dataPoints; } $.get("sensordata.csv", function(data) { // This is when the data is stored var chart = new CanvasJS.Chart("chartContainer", { zoomEnabled: true, // With this you allow the user to zoom in/out title:{ text: "Chart With Date-Time Stamps & Inputs For Sensors" // Chart title }, data: [{ type: "area", // you can change it to "line" or "area" color: "blue", // you can change the color xValueType: "dateTime", dataPoints: getDataPointsFromCSV(data) }] }); chart.render(); }); }
Restoredata.js file

Department of Engineering Science
Lab 5 – API & Data Visualization
F. Farahmand 9/30/2016
Ver. 2
13
AppendixC // S T A R T OF THE S E C O N D PLOT ///////////////// var dataPoints3 = []; function getDataPointsFromCSV3(csv) { var dataPoints3 = csvLines = points = []; csvLines = csv.split(/[\r?\n|\r|\n|\r|\n|\r|\n]+/); // parse FOUR columns for (var i = 0; i < csvLines.length; i++) if (csvLines[i].length > 0) { points = csvLines[i].split(","); dataPoints3.push({ x: parseFloat(points[0]), // Timestamp column y: parseFloat(points[2]) // First data column }); } return dataPoints3; } $.get("sensordata.csv", function(data) { // This is whe the data is stored var chart = new CanvasJS.Chart("chartContainer", { zoomEnabled: true, // With this you allow the user to zoom in/out title:{ text: "Multiple plots on the same chart" // Title of the chart }, data: [ { type: "line", // you can change it to "line" or "area" color: "blue", // you can change the color xValueType: "dateTime", dataPoints: getDataPointsFromCSV2(data) }, { type: "line", // you can change it to "line" or "area" color: "red", // you can change the color xValueType: "dateTime", dataPoints: getDataPointsFromCSV3(data) } ] }); chart.render(); });