APEX report, 13-14 - Houston Independent School … with teachers and the Curriculum Department to...
47
MEMORANDUM June 25, 2015 TO: Board Members FROM: Terry B. Grier, Ed.D. Superintendent of Schools CONTACT: Carla Stevens, 713-556-6700 SUBJECT: APEX LEARNING ONLINE INSTRUCTION, 2013–2014 Apex Learning is the largest provider of secondary online curriculum in Houston Independent School District (HISD). The curriculum is made available to allow students to complete courses for both recovery and original credit to support diverse student needs and high graduation rates. This report continues documentation that was begun at the inception of the program, in January 2010, and provides usage, academic performance, and graduation rates associated with students who completed Apex Learning courses in 2013–2014. Some of the highlights are as follows: In 2013–2014, 12,356 Apex Learning courses were completed by 6,600 students in grades 7–12 at 50 HISD secondary schools. Apex Learning courses comprised 78 percent of all online courses completed by HISD students that year. Ninety-four (94) percent of Apex Learning courses and 92 percent of courses through other online providers resulted in students receiving credit toward graduation. The majority (59 percent) of Apex Learning courses were completed for original credit, and 40 percent were completed for credit recovery. Texas Assessment of Knowledge and Skills (TAKS) re-testers who took a 2013–2014 Apex Learning course in the content tested had significantly higher rates of meeting the TAKS passing standard than did re-testers who did not take an Apex Learning course in the content of the test. On the State of Texas Assessment of Academic Readiness/End of Course (STAAR/EOC) exams, students who had taken a 2013–2014 Apex Learning course in the content of the exam had significantly higher rates of achieving a satisfactory rating in all subjects except U.S. History than did all students who did not take an online course in the content of the test that year. Twenty-eight (28) percent of students who graduated in 2013–2014 had taken an Apex Learning course the same year. Higher rates of Apex Learning graduates earned a diploma through the minimum and IEP programs and lower rates earned their diplomas through the recommended program than did all other HISD graduates.
Transcript of APEX report, 13-14 - Houston Independent School … with teachers and the Curriculum Department to...

MEMORANDUM June 25, 2015 TO: Board Members FROM: Terry B. Grier, Ed.D. Superintendent of Schools CONTACT: Carla Stevens, 713-556-6700 SUBJECT: APEX LEARNING ONLINE INSTRUCTION, 2013–2014 Apex Learning is the largest provider of secondary online curriculum in Houston Independent School District (HISD). The curriculum is made available to allow students to complete courses for both recovery and original credit to support diverse student needs and high graduation rates. This report continues documentation that was begun at the inception of the program, in January 2010, and provides usage, academic performance, and graduation rates associated with students who completed Apex Learning courses in 2013–2014. Some of the highlights are as follows:
In 2013–2014, 12,356 Apex Learning courses were completed by 6,600 students in grades 7–12 at 50 HISD secondary schools. Apex Learning courses comprised 78 percent of all online courses completed by HISD students that year.
Ninety-four (94) percent of Apex Learning courses and 92 percent of courses through other online providers resulted in students receiving credit toward graduation.
The majority (59 percent) of Apex Learning courses were completed for original credit, and 40 percent were completed for credit recovery.
Texas Assessment of Knowledge and Skills (TAKS) re-testers who took a 2013–2014 Apex Learning course in the content tested had significantly higher rates of meeting the TAKS passing standard than did re-testers who did not take an Apex Learning course in the content of the test.
On the State of Texas Assessment of Academic Readiness/End of Course (STAAR/EOC) exams, students who had taken a 2013–2014 Apex Learning course in the content of the exam had significantly higher rates of achieving a satisfactory rating in all subjects except U.S. History than did all students who did not take an online course in the content of the test that year.
Twenty-eight (28) percent of students who graduated in 2013–2014 had taken an Apex Learning course the same year. Higher rates of Apex Learning graduates earned a diploma through the minimum and IEP programs and lower rates earned their diplomas through the recommended program than did all other HISD graduates.

Should you have any further questions, please contact Carla Stevens in Research and Accountability at 713-556-6700.
TBG
Attachment cc: Superintendent’s Direct Reports High School Support Officers Harrison Peters Middle School Support Officers Michael Cordona Annie Wolfe

RESEARCHEducational Program Report
APEX LEARNING ONLINE INSTRUCTION, 2013 – 2014
H o u s t o n I n d e p e n d e n t S c h o o l D i s t r i c t

2014 Board of Education
Juliet StipechePresident
Rhonda Skillern-JonesFirst Vice President
Manuel Rodriguez, Jr.Second Vice President
Anna EastmanSecretary
Wanda AdamsAssistant Secretary
Michael L. LuncefordPaula HarrisGreg MeyersHarvin C. Moore
Terry B. Grier, Ed.D.Superintendent of Schools
Carla StevensAssistant SuperintendentDepartment of Research and Accountability
Lissa Heckelman, Ph.D.Research Specialist
MaryAnn ColemanIntermediate Applications Developer
Harry M. SeligResearch Manager
Houston Independent School DistrictHattie Mae White Educational Support Center4400 West 18th StreetHouston, Texas 77092-8501
www.HoustonISD.org
It is the policy of the Houston Independent School District not to discriminate on the basis of age, color, handicap or disability, ancestry, national origin, marital status, race, religion, sex, veteran status, political affi liation, sexual orientation, gender identity and/or gender expression in its educational or employment programs and activities.

HISD Research and Accountability__________________________________________________________________________ 1
APEX LEARNING ONLINE INSTRUCTION, 2013–2014
Executive Summary Evaluation Description Apex Learning is the largest provider of secondary online curriculum in Houston Independent School District (HISD). Introduced in January 2010 through Graduation Laboratories (Grad Labs) located at each high school, the program has grown from providing seniors with opportunities to recover credits required for graduation to providing students in grades 6–12 with options for completing both recovery and original credit courses in grades 6–12. This report continues the documentation that was begun at the inception of the program in 2010 and includes usage, academic performance, and graduation rates associated with students who completed Apex Learning courses in 2013–2014. It also addresses the completion of online test preparation courses offered by Apex Learning and other providers at schools that elect to fund the services to support students who need to retake state-mandated tests. Finally, this report provides information about online Advanced Placement (AP) course usage and, when sufficient numbers are available, student performance on the associated AP exams compared with the performance of all other students who took the same AP tests in the district. Highlights In 2013–2014, 12,356 Apex Learning courses were completed by 6,600 students in grades 7–12 at 50
HISD secondary schools. Apex Learning courses comprised 78 percent of all online courses completed by HISD students that year. Other online courses, a total of 3,566 courses, were completed through 12 other online course providers, all of which had been used in the district in recent years.
Ninety-four (94) percent of Apex Learning courses and 92 percent of courses through other online providers resulted in students receiving credit toward graduation.
The majority (59 percent) of Apex Learning courses were completed for original credit, and 40 percent were completed for credit recovery.
Texas Assessment of Knowledge and Skills (TAKS) re-testers who took a 2013–2014 Apex Learning
course in the content tested had significantly higher rates of meeting the TAKS passing standard than did re-testers who did not take an Apex Learning course in the content of the test. There were no significant differences between the groups of re-testers on earning the commended rating on the test, with the exception of the TAKS social studies exam, on which students who had taken an Apex Learning course in social studies in 2013–2014 had a significantly higher rate of being commended than did students who had not taken a social studies Apex course that year.
On the State of Texas Assessments of Academic Readiness/End of Course (STAAR/EOC) exams,
students who had taken a 2013–2014 Apex Learning course in the content of the exam had significantly higher rates of achieving a satisfactory rating in all subjects except U.S. History than did all students who did not take an online course in the content of the test that year.

HISD Research and Accountability__________________________________________________________________________ 2
Students who took an Apex Learning course in the content of the test had lower rates of earning the advanced rating on every 2013–2014 STAAR/EOC exam than did all HISD students who did not take an Apex Learning course in the content of the test that year, though the differences between the groups were not significant.
Twenty-eight (28) percent of students who graduated in 2013–2014 had taken an Apex Learning course
the same year. Of the graduates who had taken an Apex Learning course in 2013–2014, 66 percent earned a diploma with the recommended course of study, eight percent earned a diploma through the distinguished program of study, and 26 percent earned the diploma through the minimum or IEP course of study. The distribution of diploma types was significantly different from the distribution of diploma types for HISD graduates who did not complete at least one Apex Learning course that year. Higher rates of Apex Learning graduates earned a diploma through the minimum and IEP programs and lower rates earned their diplomas through the recommended program than did all other HISD graduates.
Fifty-eight (58) AP courses were completed through Apex Learning in 2013–2014. Of the 58 AP
courses, 33 were associated with an AP exam and 16 completers (49 percent of those eligible) took the associated AP test. One of the students (six percent) who took the AP exam following taking an associated Apex Learning AP course earned a score of three or higher (considered passing by many colleges and universities).
Recommendations Apex Learning is prevalent and well established in HISD. The program supports students in credit
recovery and in earning original credit, and offers options that schools can use to meet the needs of diverse students. It is recommended that the program continue to be made available as an option to for differentiating the academic programs for secondary students as they earn their high school diplomas.
It is recommended that academic advisors regularly assess the usefulness of the program in meeting the needs of individual students. In particular, it is recommended that schools experiment with supports for Apex Learning curriculum to assure that the needs of high achieving students, particularly those who choose to complete AP courses, are met.
Administrative Response Our data for the 2013-2014 school year continues to demonstrate that online courses are a much needed resource for our students as they work to complete their graduation requirements. Of the 9,502 graduating seniors for the 2013-2014 school year, 2,660 (28%) completed at least one APEX course in the same year. The expansion of the use of APEX beyond credit recovery has also resulted in a greater proportion of online courses completed for original credit. Our data trends highlight that APEX remains instrumental in supporting our diverse student needs. Apex Learning presents a viable alternative to students that need the flexibility that online courses offer. With the exception of the U.S. History EOC, students retaking TAKS and students taking the STAAR/ EOC exams had significantly higher rates of passing the associated state-mandated exam than did students who had not taken an APEX course in the content. It should be noted that APEX students had lower rates in earning advanced ratings on the STAAR/EOC as compared to other HISD students. This may be attributed
HISD Research and Accountability__________________________________________________________________________ 3
to low reading levels among students who are assigned to Grad Labs. For many of these students, achieving basic mastery of assessment objectives is challenging and requires multiple approaches toward remediation. Additionally, students who took an AP course in APEX scored significantly lower than other HISD students who took the same exam. This may have resulted from a decreased exposure to rigorous course content prior to taking the AP course in APEX. Next steps for improving this program include collaboration with teachers and the Curriculum Department to identify potential gaps in the APEX U.S. History course and collaboration with Advanced Academics to develop a hybrid approach toward using the APEX courseware for AP courses. The total number of online courses completed through online providers has remained stable; however, the slight decline of four percent in the number of courses completed through APEX suggests that schools are seeking other online options to meet student needs. Next steps for improving this program include collaborating with Grad Lab coaches and principals to understand why schools have chosen to seek other online providers and then to engage APEX to make necessary changes if need be. Online learning options will remain an avenue for students to satisfy graduation requirements and meet state-mandated test requirements successfully, be exposed to content not offered on their campuses, and take courses in a manner that is more conducive to their learning styles. For these reasons, it is imperative that departments (Virtual Schools, Curriculum, and Advanced Academics) continue to work collaboratively to ensure the effectiveness of providing APEX learning courses in meeting our diverse student needs.

HISD Research and Accountability__________________________________________________________________________ 4
Introduction The Apex Learning program is a comprehensive set of online courses designed to meet the needs of several groups of secondary students, specifically, those who struggle to meet academic requirements, those who are high-performing but not sufficiently challenged, and those whose circumstances prevent them from attending traditional classes regularly enough to complete them. According to literature from the company, “Apex Learning comprehensive courses enable schools to meet these challenges by making rigorous content accessible and engaging through the use of active learning strategies and opt-in scaffolding delivered at students’ differing levels of academic readiness” (Apex Learning, 2013a, page 4). Houston Independent School District (HISD) began using Apex Learning courses in January 2010 through its newly established Graduation Laboratories (Grad Labs) located at each high school. Courses were available for seniors seeking credit recovery to allow them to graduate from high school. Over time more of the resources available through Apex Learning were made available to HISD students. In the 2013–2014 academic year, students in grades 6–12 were offered access to courses designed for credit recovery and original credit, including Advanced Placement (AP courses). In addition, individual schools had the option to contract for Apex Learning test review courses to support students preparing for state-mandated exams. This report documents the prevalence of Apex Learning courses in HISD and indicators of academic achievement associated with students who completed the courses. Further, it details HISD students’ use of online courses offered through Apex Learning and through other online providers, including the prevalence of completion of online test review courses funded through individual schools. Finally, it provides documentation of students’ completion of AP Apex Learning courses as well as AP courses completed through other providers, and, when possible, completers’ scores on the associated AP exams.
Methods Data Collection and Analysis Online course completions were drawn from Chancery, using a “z” in the special explanations field.
Courses completed during the academic year and the following summer are included in the counts of courses. Houston Instructor Led (HIL) courses and courses completed through schools not associated with HISD were not included. Courses associated with Houston Community College and University of Texas Distance Learning programs that were associated with an HISD school number were included, but those that did not have an HISD school number posted were deleted. Apex Learning courses include those designated as APEX (Apex Learning) and APEXIS (Apex Learning Instructor Supplemented), except in the listing of online courses by provider and school found in Table 6 (pages 24–26) where the distinction is useful for program planning.
Numbers of courses were counted using local course names in order to capture information about original credit, credit recovery and review courses for state-mandated tests. Numbers of AP courses were counted using state numbers that began with “A.”
The Texas Assessment of Knowledge and Skills (TAKS) tests for high school students were replaced by State of Texas Assessments of Academic Readiness/End of Course (STAAR/EOC) exams in 2010–

HISD Research and Accountability__________________________________________________________________________ 5
2011. In 2013–2014, only students who needed to pass the TAKS for graduation and who had previously been unsuccessful on one or more of the tests were still taking them. The results for all re-testers who took the standard version of the test and whose tests were scored were included in the analyses. Chi square test of independence analyses were used to compare the rates of meeting the passing standard and rates of earning the commended standard for students who had taken an Apex Learning course in the tested subject in 2013–2014 with those of all other HISD students who took the same test the same year.
STAAR/EOC results included those for the five tests required for graduation (Adoption and Administration of Instruments, 1995): English I; English II; Algebra I; Biology; and US History. Scored, standard version test results from the December 2013 and Spring 2014 administrations are reported in terms of achieving the phase-in 1 satisfactory and advanced standards. Test files contain both initial test and retest scores; only students’ highest test results in each subject were included in the analyses.
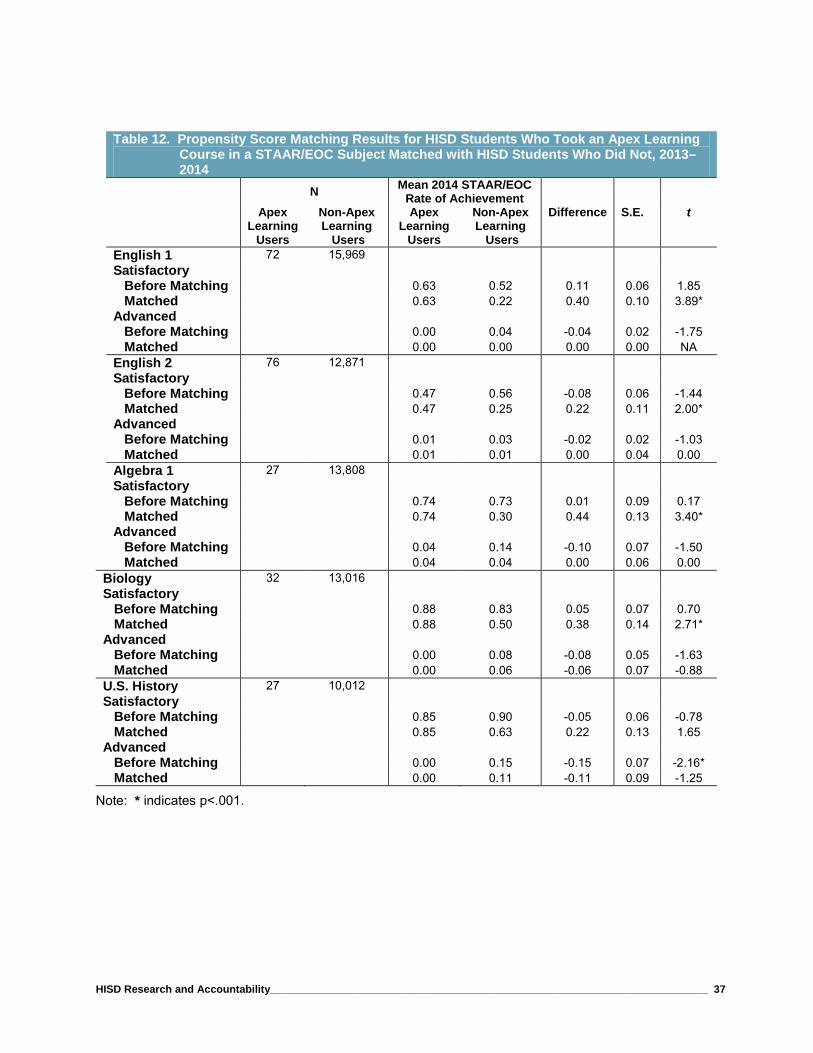
Propensity score, nearest neighbor matching, used to make causal inferences based on observational
data (Cohen, 1988), was used to compare STAAR/EOC rates of earning the satisfactory standard and rates of achieving the advanced standard for Apex Learning students who had completed at least one course in a given subject in 2013–2014 with rates for all other HISD students who took the same test but did not take an online course in the test content that year. Students from the Apex Learning group were matched with students from the other HISD students group on grade level, gender, race/ethnicity, economic disadvantage, English language proficiency status, gifted/talented status, and at-risk status. Initial probit regression analyses indicated significant differences between the groups in terms of the matching variables for all exams except Biology. Not all students who tested were included in the analyses of matched students. Numbers of students in each group who took STAAR/EOC exams are included in Table 11 (page 36) and numbers who were matched for inclusion in the propensity score analysis are listed in Table 12 (page 37). After matching, the groups used in the analyses for the English I, English II, and Biology exams were balanced, i.e., there were no significant differences between the matched groups on any of the matching variables. Balance was not achieved for the Algebra I analysis on the at-risk variable; fewer students in the Apex Learning group than in the other HISD students group were identified as at-risk. Balance was also not achieved for the matched groups on the U.S. History exam; more Asian students were in the Apex Learning group than in the group of other HISD students tested.
Advanced Placement (AP) test scores were provided by the College Board. Descriptions are provided
of the performance of Apex Learning students who had taken a course that was associated with preparation for an Advanced Placement exam (i.e., the second semester of a full year AP course or completion of an AP course normally completed in a single semester). Statistical analyses to compare performance of Apex Learning students’ performance with that of HISD students who took traditional AP courses were not conducted as sample sizes of scores of AP tests taken by Apex Learning students did not meet the minimum established for conducting an analysis.
Graduation rates are a lagging indicator so were provided for students who completed Apex Learning
courses in 2012–2013. Numbers of graduates were all those who graduated from HISD in 2012–2013, including the cohort of students who began high school in 2009–2010 and all others who completed their graduation requirements in 2012–2013. Graduation rates for 2013–2014 were taken from a preliminary list of graduates through Chancery, and the list also includes all students who completed graduation requirements in 2013–2014.

HISD Research and Accountability__________________________________________________________________________ 6
Numbers were rounded to the nearest whole number in the text, and to the nearest tenth in the tables.
Numbers were rounded up if the next digit was five or higher and were not changed if the next digit was lower, so 11.49 was recorded as 11.5 in a table and 11 in the text, while 11.50 was recorded as 11.5 in the table and 12 in the text.
Data Limitations Duplicate course listings were found for 74 students in the list of online course completions. Some of the duplicates were appropriate, as when a student retook a course and earned credit the second time, but some duplicates occurred when the system automatically documented course completions and the completions were also manually entered at the school level. Duplicates that involved registrars manually entering a schedule that was later added again by the system and that could be identified by an incorrect grade level, a total of 19 courses for seven students, were deleted, but duplicates that could not be so identified remained in the file.
Results
What were the 2013–2014 participation rates in the Apex Learning program and in other online curriculum options within HISD, and how did the rates compare with rates from 2012–2013?
In 2013–2014, 8,034 HISD students completed 15,922 courses online, only slightly lower participation
rates than those recorded for 2012–2013, when 8,055 students completed 15,939 online courses.
Shown in Figure 1 (page 7), 12,356 (78 percent) of the online courses completed in 2013–2014 were finished through the Apex Learning program and 3,566 (22 percent) were completed through other online curriculum providers.
Of the providers other than Apex Learning, the University of Texas Distance Learning program
supported the largest number of completed courses, 1,366 (nine percent of all 2013–2014 online courses), followed by Houston Community College with 1,021 courses (six percent) completed (Table 1, page 21).
Though the overall number of courses completed online remained essentially the same between 2012–
2013 and 2013–2014, students completed approximately 500 fewer courses through Apex Learning and they completed about the same number more courses through other providers. The other providers who had the largest increases in numbers of courses completed were Texas Tech Distance Learning Program, University of Texas Distance Learning, and Houston Community College (Table 1, page 21).

HISD Research and Accountability__________________________________________________________________________ 7
Figure 1. Number of online courses by provider, 2011–2012 through 2013–2014
14,07312,872 12,356
7,174
3,067 3,566
0
4,000
8,000
12,000
16,000
2011–2012 2012–2013 2013–2014
Nu
mb
er o
f C
ou
rses
Apex Learning Courses Other Provider Courses
Source: Chancery online courses file
After a large gain between 2011–2012 and 2012–2013, the percentage of online courses completed through Apex Learning declined somewhat, from 81 percent in 2012–2013 to 78 percent in 2013–2014 (Figure 2).
Figure 2. Percentage of online courses by provider, 2011–2012 through 2013–2014
66
81 78
34
19 22
0
20
40
60
80
100
2011–2012 2012–2013 2013–2014
Per
cen
tag
e o
f C
ou
rses
Apex Learning Other Online Providers
Source: Chancery online courses file
Credit recovery was the original purpose for offering Apex Learning online courses in HISD, and in the
first full year of program implementation, 2010–2011, 53 percent of all Apex Learning courses were completed for credit recovery (Department of Research and Accountability, November 2013, page 19). Though students continued completing a large percentage of Apex Learning courses for credit recovery (from 43 percent of Apex Learning courses completed in 2011–2012 to 40 percent in 2013–2014), they

HISD Research and Accountability__________________________________________________________________________ 8
completed a larger percentage of Apex Learning courses for original credit, from 47 percent in 2011–2012 to 59 percent in 2013–2014 (Table 2, page 22).
The difference between the number of Apex Learning courses completed for original credit and the number completed for credit recovery increased each year, with the largest difference, 2,316 more courses for original credit than for credit recovery, in 2013–2014 (Figure 3). For other providers, while the numbers of courses completed for credit recovery and for original credit decreased from 2011–2012 to 2013–2014, a higher number of credit recovery than original credit courses was recorded each year.
Figure 3. Number of credit recovery and original credit courses completed online, by provider, 2011–2012 through 2013–2014
6,106
722
6,118
362
4,961
203
6,648
86
6,678
61
7,277
470
2,000
4,000
6,000
8,000
Apex Learning OtherProviders
Apex Learning OtherProviders
Apex Learning OtherProviders
2011–2012 2012–2013 2013–2014
Nu
mb
er o
f C
ou
rses
Credit Recovery Original Credit
Source: Chancery online courses file
Shown in Figure 4 (page 9) and in Table 2 (page 22), students earned credit for a large percentage of
the online courses they completed. For Apex Learning, the percentage of completed courses for which students earned credit held steady at 94 percent from 2011–2012 through 2013–2014, while the percentage was similarly high, from 92 to 94 percent, for courses completed through other providers.

HISD Research and Accountability__________________________________________________________________________ 9
Figure 4. Number of online courses completed and in which credit was earned, by provider,
2011–2012 through 2013–2014
14,073
7,174
21,247
12,872
3,067
15,939
12,356
3,566
15,922
13,217
6,773
19,990
12,099
2,835
14,934
11,589
3,288
14,877
0
5,000
10,000
15,000
20,000
25,000
Ape
x Le
arni
ng
Oth
er P
rovi
der
s
All
Pro
vide
rs
Ape
x Le
arni
ng
Oth
er P
rovi
der
s
All
Pro
vide
rs
Ape
x Le
arni
ng
Oth
er P
rovi
der
s
All
Pro
vide
rs
2011–2012 2012–2013 2013–2014
Nu
mb
er o
f C
ou
rses
Completed Earned Credit
Source: Chancery online courses file Illustrated in Figure 5 (page 10), the number of Apex Learning courses completed increased as the
grade level of students rose. Between 2012–2013 and 2013–2014, fewer Apex Learning courses were completed at each grade level except in eighth grade. The largest changes in number of courses completed were in ninth grade, in which 311 fewer Apex Learning courses were completed, and in eighth grade, in which 172 additional courses were completed. Shown in Table 3 (page 22), the declines in numbers of courses completed through Apex Learning were associated with increases in numbers of courses completed through other online providers. The number of courses completed through other providers declined only for twelfth graders.

HISD Research and Accountability__________________________________________________________________________ 10
Figure 5. Number of Apex Learning courses, by grade level, 2012–2013 and 2013–2014
0 19 107
1,278
2,147
3,583
5,738
0 7279
967
2,038
3,450
5,615
0
1,000
2,000
3,000
4,000
5,000
6,000
Grade 6 Grade 7 Grade 8 Grade 9 Grade 10 Grade 11 Grade 12
Nu
mb
er o
f C
ou
rses
2012–2013 2013–2014
Source: Chancery online courses file Declines in numbers of courses taken through Apex Learning were paralleled by declines in the
numbers of students taking the courses. Shown in Table 4 (page 23), 6,600 students completed online courses through Apex Learning in 2013–2014, down from 6,730 the year before, while 1,809 students took online courses through other providers in 2013–2014, up from 1,760 the year before. Three hundred seventy-five (375) students took at least one course through Apex Learning and also at least one course through another provider, for a total of 8,034 students who completed online courses in 2013–2014, a number very close to the 8,055 students who completed online courses in 2012–2013.
Illustrated in Figure 6 (page 11), declines in numbers of students completing Apex Learning courses were seen in every grade level except for grade eight. Though online courses were accessible to sixth-graders in HISD, none had completed an online course through 2013–2014.

HISD Research and Accountability__________________________________________________________________________ 11
Figure 6. Number of HISD students completing Apex Learning courses, by grade level,
2012–2013 and 2013–2014
0 15 59
718
1,208
1,809
2,921
0 6194
581
1,133
1,777
2,909
0
500
1,000
1,500
2,000
2,500
3,000
3,500
Grade 6 Grade 7 Grade 8 Grade 9 Grade 10 Grade 11 Grade 12
Nu
mb
er o
f S
tud
ents
2012–2013 2013–2014
Source: Chancery online courses file The average numbers of courses completed by students who were enrolled with online providers is
shown in Table 5 (page 23). In general, students completed an average of two online courses, through Apex Learning, through other providers, and through all providers. The averages were very similar to those reported for 2012–2013.
Fifty-three (53) HISD schools recorded online course completions in 2013–2014, one fewer than documented online courses the previous year. Schools documenting online course completions in 2013–2014 included five middle schools, 42 high schools and six combined level schools. The number of courses completed through each online course provider in 2013–2014, by school, is provided in Table 6 (pages 24–26).
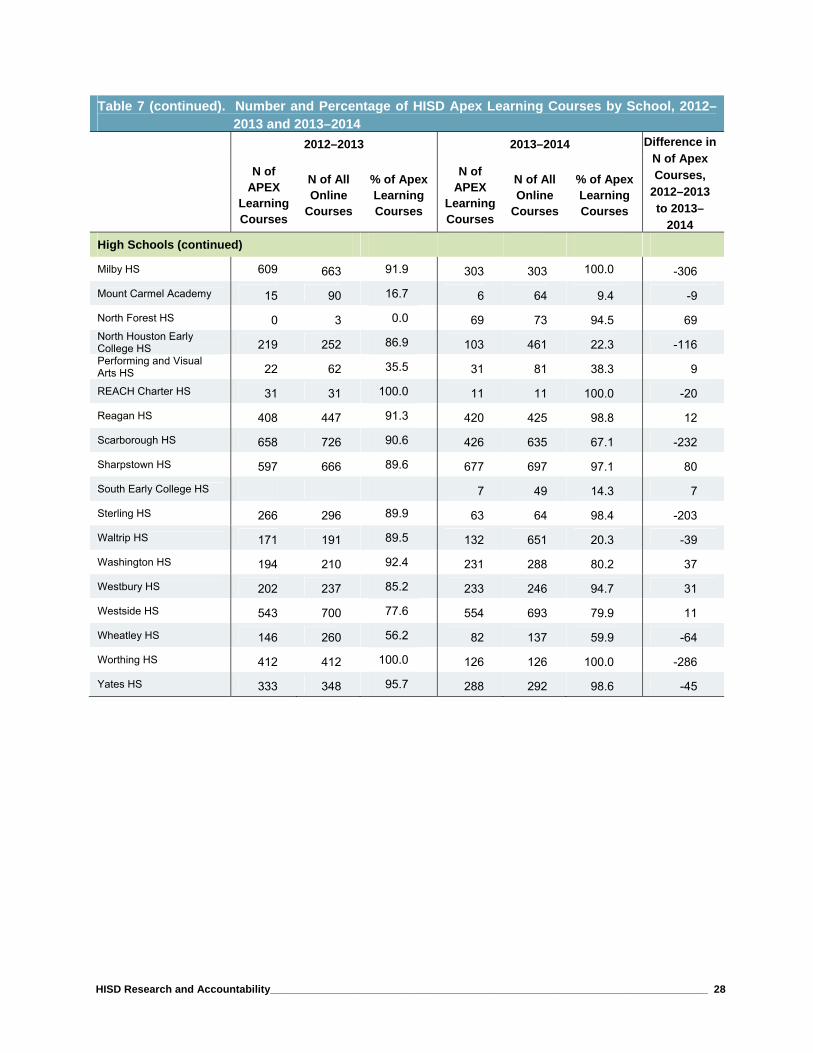
Table 7 (pages 27–29) lists the schools that offered online courses in 2012–2013 and/or 2013–2014,
along with the percentage of the online courses that were completed through Apex Learning. Forty-seven (47) schools reported completion of online courses in both 2012–2013 and 2013–2014. Seven schools used online coursework in 2012–2013 but not in 2013–2014 (Pershing, Pin Oak, and T. H. Rogers middle schools, Kashmere High School, JJAEP, the SOAR Center, and one school that closed in 2013–2014, Empowerment College Preparatory), and six participated in 2013–2014 but not in 2012–2013 (Grady, Lanier, and Ortiz middle schools, plus the Young Men’s College Preparatory Academy, Energy Institute High School, and South Early College High School).
As shown in Table 7 (pages 27–29), of the 53 schools that reported online course completions in 2013–
2014, 50 (94 percent) recorded Apex Learning course completions, up from 48 of 54 schools (89 percent) in 2012–2013. Forty-four (44) of the schools used Apex Learning in both 2012–2013 and 2013–2014; four that used Apex Learning in 2012–2013 did not use it in 2013–2014 (Kashmere High School, JJAEP, the SOAR Center, and Empowerment College Preparatory, the school that closed in 2013–2014); and six that had not used the program in 2012–2013 recorded Apex Learning course

HISD Research and Accountability__________________________________________________________________________ 12
completions in 2013–2014 (Grady and Ortiz middle schools, Beechnut Academy, the Energy Institute, South Early College High School, and North Forest High School, a school new to HISD in the summer of 2013).
Also shown in Table 7 (pages 27–29), though the total number of courses completed through Apex
Learning decreased by 516 courses between 2012–2013 and 2013–2014, a difference of three percentage points overall, some schools had large changes in Apex Learning completion rates between the years. Many individual schools had high percentages of online courses completed through Apex Learning in 2012–2013, leaving little opportunity for substantial increases in percentage of usage, but North Forest High School, the school new to HISD in the summer of 2013, was notable in having both an increase in the number of online courses completed (from three in 2012–2013 to 73 in 2013–2014) and a large increase in the percentage of online courses completed through Apex Learning (from zero percent in 2012–2013 to 95 percent in 2013–2014).
Schools that had the largest decreases in percentage of online courses completed through Apex
Learning between 2012–2013 and 2013–2014 included Waltrip High School (from 90 percent in 2012–2013 to 20 percent in 2013–2014) and North Houston Early College High School (from 87 percent in 2012–2013 to 22 percent in 2013-2014).
Similarly, the difference in the number of Apex Learning courses completed at each school varied widely, ranging from an increase of 440 courses at Lamar High School to a decrease of 306 courses at Milby High School.
The total number of online courses completed in 2012–2013 and in 2013–2014, by subject and provider, is illustrated in Figure 7 (page 13). Apex Learning was the provider for the majority of online course completions in all subjects, including all core content courses as well as courses in other subjects.
In 2013–2014, as in 2012–2013, the largest number of online courses was completed in Spanish, a
non-core content, and the fewest were completed in mathematics.
Between 2012–2013 and 2013–2014, the number of courses completed in each core content area decreased, both for Apex Learning and for all online course providers, while in the same time period the number of courses in non-core content subjects increased.
For all providers, the largest increase in courses completed between 2012–2013 and 2013–2014 was
in Spanish, an increase of 816 courses (a 16 percent increase) for all providers, and 107 courses (a three percent increase) for Apex Learning. For all providers, decreases in number of core subject courses ranged from 197 courses for English to 375 for social studies. The largest percentage decrease, however, was 18 percent, for science courses.
For Apex Learning, the number of courses completed in core content decreased in a range from 161,
for English, to 239, for social studies. The largest percentages in decreases for Apex Learning courses were in science (16 percent) and mathematics (15 percent). Table 8 (pages 30–34) provides further information on the number of courses completed within each core subject area and other subjects, by provider, in 2012–2013 and 2013–2014.

HISD Research and Accountability__________________________________________________________________________ 13
Figure 7. Number of online courses completed, by provider and subject, 2012–2013 and
2013–2014
2,281 1,106 1,321 3,192 3,801 1,171 2,120 939 1,116 2,953 3,908 1,320
282
244224
558
1,184
575
246
212 153
422
1,893
640
0
1,000
2,000
3,000
4,000
5,000
6,000
Eng
lish
Mat
hem
atic
s
Sci
ence
Soc
ial S
tudi
es
Spa
nish
Oth
er
Eng
lish
Mat
hem
atic
s
Sci
ence
Soc
ial S
tudi
es
Spa
nish
Oth
er
2012–2013 2013–2014
Num
ber
of C
ours
es
Apex Learning Other Online Providers
Source: Chancery online courses file What were the 2013–2014 Texas Assessment of Knowledge and Skills (TAKS) and State of Texas Assessments of Academic Readiness/End of Course (STAAR/EOC) results of students utilitizing Apex Learning services compared with the results of all other students in HISD? In 2013–2014, the TAKS tests had been replaced by STAAR/EOC exams, so they were offered only to
students who were retesting to meet graduation requirements. The results of students who took an Apex Learning course in a subject associated with a TAKS test and then took the TAKS test, compared with the results of all other HISD students who took the same TAKS tests are illustrated in Figure 8 (page 14). The results are detailed in Table 9 (page 35) and statistical comparisons of the results are shown in Table 10 (page 35).
The percentage of Apex Learning re-testers who met the passing standard on their respective TAKS tests was significantly higher than the percentage of all other HISD re-testers who met the passing standard on the same tests. For the percentage commended, there were no significant differences between the performance of Apex Learning students and all other HISD students, with the exception of the social studies TAKS exam, on which Apex Learning students had a higher percentage of students earning commended performance. Effect sizes, i.e., the magnitude of differences between the groups, for all of the significant relationships were small.

HISD Research and Accountability__________________________________________________________________________ 14
Figure 8. Percentage of TAKS re-testers meeting the passing standard and percentage commended among students who took an Apex Learning course in the exam subject
and among all other HISD students, 2013–2014
81
68 69
90
4 1 3
20
54*48* 52*
75*
3 2 1
11*
0
20
40
60
80
100R
eadi
ng
Mat
hem
atic
s
Sci
ence
Soc
ial S
tudi
es
Rea
ding
Mat
hem
atic
s
Sci
ence
Soc
ial S
tudi
es
Met Standard Commended
Per
cen
tag
e
Apex Learning HISD (excluding Apex Learning)
Note: * indicates that differences were statistically significant. Source: State of Texas, Texas Assessment of Knowledge and Skills file
2013–2014 STAAR/EOC exam results are shown in Figure 9 (page 15) and detailed in Table 11 (page
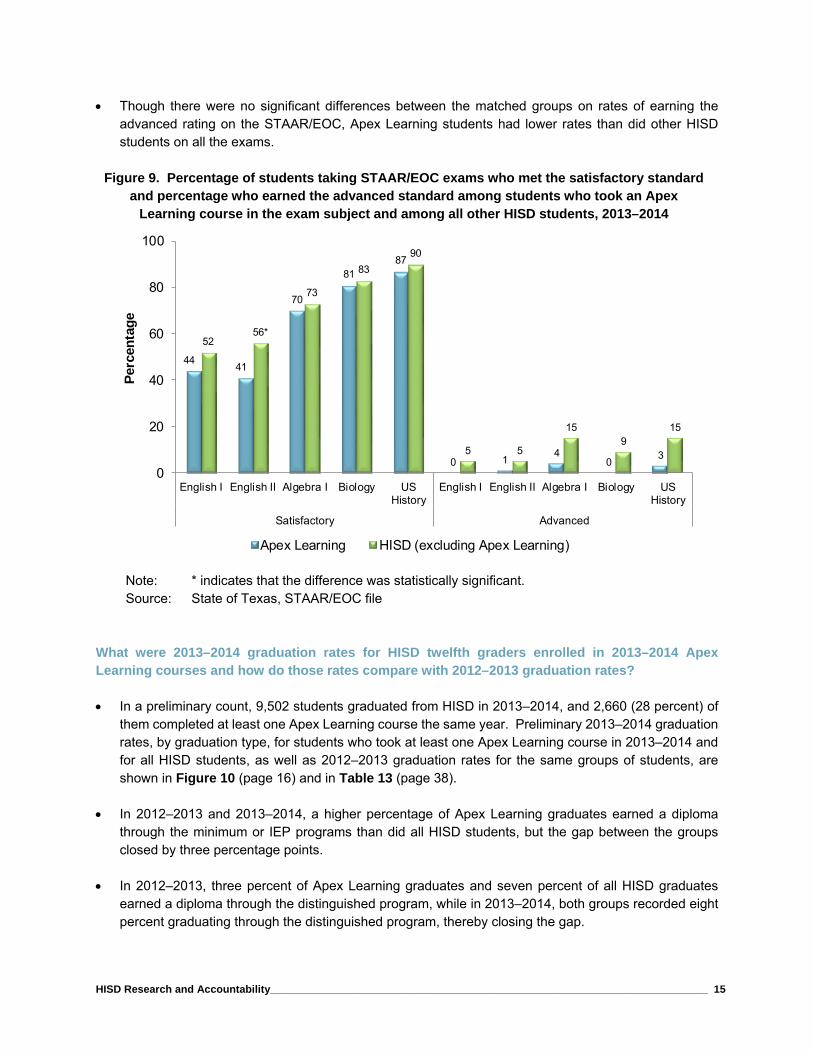
36). A smaller percentage of students who took an Apex Learning course associated with a STAAR/EOC exam in 2013–2014 before taking the 2014 test achieved the satisfactory rating and a smaller percentage achieved the advanced rating than did all other HISD students who took the same exams.
Propensity score, nearest neighbor matching was used to compare STAAR/EOC satisfactory and advanced ratings (using phase-in 1 standards) earned by students who took an Apex Learning course in the given STAAR/EOC subject with ratings earned by students who did not take an online course in the subject. Students who had taken an Apex Learning course in the subject were matched with other HISD students based on grade level, gender, race/ethnicity, economic disadvantage, English language proficiency status, gifted/talented status, and at-risk status.
As shown in Table 12 (page 37), after matching, more students who took a content course through Apex Learning the same year they took a STAAR/EOC in the same subject earned the satisfactory rating on the STAAR/EOC than did HISD students who did not take the content course online. The differences in earning the satisfactory rating between Apex Learning students and other HISD students were significant in all subjects except U.S. History.
HISD Research and Accountability__________________________________________________________________________ 15
Though there were no significant differences between the matched groups on rates of earning the advanced rating on the STAAR/EOC, Apex Learning students had lower rates than did other HISD students on all the exams.
Figure 9. Percentage of students taking STAAR/EOC exams who met the satisfactory standard
and percentage who earned the advanced standard among students who took an Apex Learning course in the exam subject and among all other HISD students, 2013–2014
4441
70
8187
0 14
03
5256*
73
83
90
5 5
159
15
0
20
40
60
80
100
English I English II Algebra I Biology USHistory
English I English II Algebra I Biology USHistory
Satisfactory Advanced
Per
cen
tag
e
Apex Learning HISD (excluding Apex Learning)
Note: * indicates that the difference was statistically significant. Source: State of Texas, STAAR/EOC file
What were 2013–2014 graduation rates for HISD twelfth graders enrolled in 2013–2014 Apex Learning courses and how do those rates compare with 2012–2013 graduation rates? In a preliminary count, 9,502 students graduated from HISD in 2013–2014, and 2,660 (28 percent) of
them completed at least one Apex Learning course the same year. Preliminary 2013–2014 graduation rates, by graduation type, for students who took at least one Apex Learning course in 2013–2014 and for all HISD students, as well as 2012–2013 graduation rates for the same groups of students, are shown in Figure 10 (page 16) and in Table 13 (page 38).
In 2012–2013 and 2013–2014, a higher percentage of Apex Learning graduates earned a diploma through the minimum or IEP programs than did all HISD students, but the gap between the groups closed by three percentage points.
In 2012–2013, three percent of Apex Learning graduates and seven percent of all HISD graduates
earned a diploma through the distinguished program, while in 2013–2014, both groups recorded eight percent graduating through the distinguished program, thereby closing the gap.

HISD Research and Accountability__________________________________________________________________________ 16
Despite the closures in the gaps, Chi square tests of independence indicated that the distribution of
diploma types associated with graduates who completed Apex Learning courses in each of the years, 2012–2013 and 2013–2014, was significantly different from the distribution of diploma types associated with HISD graduates who did not complete an Apex Learning course the same year (Table 14, page 38). The effect size of the differences between the groups were small.
Figure 10. Percentage of each diploma type earned by 2012–2013 HISD graduates who took at least one Apex Learning course compared with percentages earned
by all 2012–2013 HISD graduates
67
3
31
66
8
26
73
7
20
74
818
0
20
40
60
80
100
Rec
omm
ende
d
Dis
tingu
ish
ed
Min
imu
m/IE
P
Rec
omm
ende
d
Dis
tingu
ish
ed
Min
imu
m/IE
P
2012–2013 2013–2014
Per
cen
tag
e
Apex Learning All HISD
Note: Percentages may not total 100 due to rounding. Sources: 2012–2013 Chancery graduates file and 2013–2014 preliminary Chancery
graduates file How many TAKS and STAAR/EOC review courses were completed through licenses purchased by individual HISD campuses in 2013–2014? In 2013–2014, one STAAR/EOC review course in mathematics and one TAKS review course in science
were completed, both through Other Provider. For comparison, in 2012–2013, three STAAR/EOC review courses and six TAKS review courses were completed online (see Table 2, page 22). Test results are not reported for fewer than five students.
Though the number of review courses completed online has shrunk to virtually none, numbers of students who took 2013–2014 Apex Learning content courses associated with TAKS and STAAR/EOC exams and their test scores are included on pages 13–15 of this report.

HISD Research and Accountability__________________________________________________________________________ 17
How many and which Advanced Placement (AP) courses were completed through Apex Learning and through other online providers in HISD in 2013–2014? In 2013–2014, a total of 92 AP courses were completed online, and 58 of them (63 percent) were
completed through Apex Learning. For comparison, in 2012–2013, 115 AP courses were completed online, with 86 of them (75 percent) through Apex Learning (Table 15, page 38).
The numbers of 2013–2014 online AP courses, by content area and provider, are illustrated in Figure 11. The largest number of online AP courses was 40, completed in social studies, followed by 29 completed in science.
Apex Learning provided more AP English, AP science, and AP social studies courses than did all the
other providers together, while non-core AP courses (in Spanish, art history, computer science, and psychology) were supplied primarily by providers other than Apex Learning.
Students from most HISD high schools completed their online AP courses through Apex Learning; the
schools in which students used other providers included Bellaire, Lamar, Lee, and Performing and Visual Arts high schools. A listing of online AP courses completed by school can be found in Table 16 (pages 39–40) and the AP courses completed by provider and school are detailed in Table 17 (pages 41–42).
Figure 11. Number of AP courses by content area and provider, 2013–2014
51
2723
2
2
2
2
17
29
0
10
20
30
40
50
AP English APMathematics
AP Science AP SocialStudies
AP Spanish Other AP
Nu
mb
er o
f C
ou
rses
Apex Learning Other Online Providers
Source: Chancery online courses file

HISD Research and Accountability__________________________________________________________________________ 18
At what rates did HISD students who took an Apex Learning AP class pass the associated AP exam (with a score of three or higher) in 2013–2014, and how did those rates compare with rates of all other HISD students who took the same exam the same year? Apex Learning students were awarded credit for 33 courses associated with an Advanced Placement
exam. Forty-eight (48) percent of the course completions were followed by the student sitting for the associated exam, a total of 16 AP exams. Achievement results are only reported for tests taken by five or more students. The one course for which more than five students tested was Microeconomics. Nine Apex Learning students tested but none earned a three or higher on the test (considered a passing score by many colleges and universities). For comparison, of 219 HISD students who took the Microeconomics AP test, 112 (51 percent) earned a score of three or higher.
Of the 16 AP exams taken by students who had completed an Apex Learning course in the content of the exam, only one (six percent) was awarded a score of three or higher. More detail about AP courses and exams taken by students who took an AP course through Apex Learning can be found in Table 18 (page 43).
The largest number of students completing a single AP course with a provider other than Apex Learning was four students completing the macroeconomics course offered by HVS (Table 17, page 42), too few to allow further reporting of achievement results associated with AP courses completed through other online providers.
Discussion
Apex Learning has been the provider for the majority of courses completed online in HISD since it was made available through high school Grad Labs in 2010. In 2013–2014, it provided 78 percent of the courses completed online. The original purpose for providing Apex Learning courses in all high schools was to support students in recovering credits to allow them to graduate. Over time the program has continued serving that purpose, as can be seen in the number of Apex Learning courses designated as credit recovery and in the percentage of graduates who used the program. In 2013–2014, 28 percent of graduates used the program, down only slightly from the 29 percent who used it in 2012–2013. Further, Apex Learning curriculum has been useful in supporting students in passing state-mandated tests. Students retaking the TAKS and also students taking the STAAR/EOC exams (with the exception of the U.S. History STAAR/EOC) in 2013–2014 who had completed a content course in Apex Learning had significantly higher rates of passing the associated state-mandated exam than did students who had not taken an Apex Learning course in the content. After more Apex Learning services were made available, the program also provided large numbers of courses for original credit, with larger numbers of Apex Learning courses completed for original credit than for credit recovery since 2011–2012. While these general trends have been seen since 2011–2012, there are fluctuations in Apex Learning usage that are worthy of note. The number of online courses being completed in HISD remained relatively stable from 2012–2013 to 2013–2014, from 15,939 courses completed in 2012–2013 to 15,922 courses in 2013–2014, a decline of 17 courses or a tenth of a percent. At the same time, the number of online courses completed through Apex Learning went from 12,872 courses completed in 2012–2013 to 12,356 courses completed in 2013–2014, a decline of four percent. A similar pattern, with more dramatic numbers, was

HISD Research and Accountability__________________________________________________________________________ 19
seen in changes in the number of AP courses completed between the two years. Overall, in HISD there was a 20 percent decline in the number of AP courses completed online, from 115 AP courses in 2012–2013 to 92 in 2013–2014. For Apex Learning, the decline was even steeper, from 86 to 58 courses, a 33 percent decline. The decline in the number of AP courses completed online is associated with low percentages of course completers taking the associated College Board AP tests and with low scores on the associated AP tests that completers took. In 2013–2014, 48 percent of Apex Learning course completions associated with an AP exam were followed by the course completer taking the College Board exam, and of the students who tested, only one, six percent, earned a score of three or higher, considered a passing score by many institutions of higher education. The online Apex Learning courses alone do not appear to provide adequate preparation for students to succeed on the College Board AP exams. Perhaps the AP courses could be supplemented with other forms of instruction to boost performance. In 2013–2014, no AP courses completed through Apex Learning were designated as APEXIS (Apex Learning Instructor Supplemented). An experiment in augmenting an online Apex Learning AP course through the structure provided by an APEXIS course could provide a starting point for providing additional instructional support for students seeking extra challenge in their high school programs. Apex Learning is proving to be a useful tool in providing options for differentiating instruction to meet the needs of diverse secondary students in HISD. Large numbers of courses are completed through the program each year and, in the last two years, nearly 30 percent of graduates have used Apex Learning in their final year of study leading to a diploma. A significant number of 2012–2013 and 2013–2014 graduates who used Apex Learning earned their diplomas through the minimum and IEP programs, indicating the value of the program in supporting students with special needs. Modifications of some courses, most notably those for high performing students, may further enhance the usefulness of the program for students throughout HISD.

HISD Research and Accountability__________________________________________________________________________ 20
References Adoption and Administration of Instruments, Texas Education Code 39.023(c) (1995 & Supp. 2013).
Retrieved from http://www.statutes.legis.state.tx.us/Docs/ED/htm/ED.39.htm#39.023. Apex Learning. (May 2013a). Academic outcomes increase for at-risk and drop-out recovery students:
Apex Learning comprehensive studies. Seattle, WA: Apex Learning Inc. Retrieved from http://marketing.apexlearning.com/acton/attachment/1261/1261:f-020c/0/s-0afd-1305/-/l-9cc6/l-9cc6:15f/?utm_medium=email&utm_source=Act-On+Software&utm_content=email&utm_campaign=Study%20results%3A%20Apex%20Learning%20proven%20to%20increase%20learning%20gains&utm_term=Ohio%20Life%20Skills%20Centers&cm_mmc=Act-On%20Software-_-email-_-Study%20results%3A%20Apex%20Learning%20proven%20to%20increase%20learning%20gains-_-Ohio%20Life%20Skills%20Centers
Apex Learning. (May 2013b). Proven to increase student achievement: Apex Learning comprehensive
courses. Seattle, WA: Apex Learning Inc. Retrieved from http://marketing.apexlearning.com/acton/attachment/1261/1261:f-020b/0/s-0afd-1305/-/l-9cc6/l-9cc6:15f/?utm_medium=email&utm_source=Act-On+Software&utm_content=email&utm_campaign=Study%20results%3A%20Apex%20Learning%20proven%20to%20increase%20learning%20gains&utm_term=Dorchester%20School%20District%20Two&cm_mmc=Act-On%20Software-_-email-_-Study%20results%3A%20Apex%20Learning%20proven%20to%20increase%20learning%20gains-_-Dorchester%20School%20District%20Two
Cohen, J. W. (1988). Statistical power analysis for the behavioral sciences (2nd ed.). Hillsdale, NJ: Lawrence
Erlbaum Associates. Department of Research and Accountability. (November 2013). Apex learning online instruction, 2011–
2012 and 2012–2013. Houston, TX: Houston Independent School District. Department of Research and Accountability. (July 2014). 2014 STAAR End of Course (EOC) results.
Houston, TX: Houston Independent School District. Department of Research and Accountability. (October 2014). Final 2014 Advanced Placement (AP)
results. Houston, TX: Houston Independent School District. Houston Independent School District (October 2013). High School Master Catalog: 2013–2014. Houston,
TX: Houston Independent School District.

HISD Research and Accountability__________________________________________________________________________ 21
Table 1. HISD Online Course Providers and Number and Percentage of Completed Courses, 2011–
2012 to 2013–2014
2011–2012 2012–2013 2013–2014
N % N % N %
APEX Learning Courses 14,073 66.2 12,872 80.8 12,356 77.6
API (American Preparatory Institute) 21 0.1 6 <0.1 22 0.1
Aventa 2 <0.1 4 <0.1 3 <0.1
HCC (Houston Community College) 2,093 9.9 867 5.4 1,021 6.4
HVS 110 0.5 69 0.4 79 0.5
Nova Net 378 1.8 210 1.3 100 0.6
Other Provider 2,285 10.8 516 3.2 302 1.9
Penn Foster 5 <0.1 7 <0.1
Plato 40 0.2 62 0.4 3 <0.1
SSCSP 6 <0.1 1 <0.1 5 <0.1
Texas TechD (Texas Tech Distance
Learning Program) 351 1.7 175 1.1 650 4.1
TxVSN StU (Texas Virtual School Network) 105 0.5 119 0.7 8 0.1
UT DL (University of Texas) 1,778 8.4 1,038 6.5 1,366 8.6
Total HISD Online Course Completions 21,247 100.0 15,939 100.0 15,922 100.0
Note: Percentages may not equal 100 due to rounding. Source: Chancery online courses records, 2011–2012 through 2013–2014

HISD Research and Accountability__________________________________________________________________________ 22
Table 2. Number and Percentage of HISD Online Course Completions, By Purpose and Provider, 2011–
2012 to 2013–2014
2011–2012 2012–2013 2013–2014
N % N % N %
APEX Learning Courses 14,073 66.2 12,872 80.8 12,356 77.6
Credit Recovery 6,106 43.4 6,118 47.5 4,961 40.2
Original Credit 6,648 47.2 6,678 51.9 7,277 58.9
Dual Credit 2 <0.1 0 0.0 2 <0.1
Advanced Placement (AP) 302 2.1 86 1.0 58 0.5
STAAR/EOC Review 0 0.0 0 0.0 0 0.0
TAKS Review 1 <0.1 3 <0.1 0 0.0
Courses for which Credit Was Awarded 13,217 93.9 12,099 94.0 11,589 93.8
Other Online Provider Courses 7,174 33.8 3,067 19.2 3,566 22.4
Credit Recovery 722 10.1 362 11.8 203 5.7
Original Credit 86 1.2 61 2.0 47 1.3
Dual Credit 212 3.0 97 3.2 310 8.7
Advanced Placement (AP) 90 1.3 29 1.0 34 1.0
STAAR/EOC Review 1 <0.1 3 0.1 1 <0.1
TAKS Review 6 0.1 3 0.1 1 <0.1
Courses for which Credit Was Awarded 6,773 94.4 2,835 92.4 3,288 92.2
Total HISD Online Course Completions 21,247 100.0 15,939 100.0 15,922 100.0
Note: Percentages may not equal 100 due to rounding. Source: Chancery online courses records, 2011–2012 through 2013–2014
Table 3. Number of HISD Online Courses Completed, by Grade Level and Provider, 2012–2013 and 2013–2014
Apex Learning Other Providers All Providers
Grade 2012–2013
2013–2014
Differ-ence
2012–2013
2013–2014
Differ-ence
2012–2013
2013–2014
Differ-ence
6 0 0 0 0 0 0 0 0 0
7 19 7 -12 0 0 0 19 7 -12
8 107 279 172 3 12 9 110 291 181
9 1,278 967 -311 671 889 218 1,949 1,856 -93
10 2,147 2,038 -109 647 834 187 2,794 2,872 78
11 3,583 3,450 -133 925 1,084 159 4,508 4,534 26
12 5,738 5,615 -123 821 747 -74 6,559 6,362 -197
Total 12,872 12,356 -516 3,067 3,566 499 15,939 15,922 -17
Source: Chancery online courses records, 2012–2013 and 2013–2014

HISD Research and Accountability__________________________________________________________________________ 23
Table 4. Number of HISD Students Completing Online Courses, by Grade Level and Provider, 2012–2013 and 2013–2014
Apex Learning Other Providers All Providers
Grade 2012–2013
2013–2014
Differ-ence
2012–2013
2013–2014
Differ-ence
2012–2013
2013–2014
Differ-ence
6 0 0 0 0 0 0 0 0 0
7 15 6 -9 0 0 0 15 6 -9
8 59 194 135 3 4 1 62 197 135
9 718 581 -137 328 453 125 1,021 1,003 -18
10 1,208 1,133 -75 324 389 65 1,469 1,465 -4
11 1,809 1,777 -32 512 514 2 2,206 2,178 -28
12 2,921 2,909 -12 593 449 -144 3,282 3,185 -97
Total 6,730 6,600 -130 1,760 1,809 49 8,055 8,034 -21
Note: Some students completed online courses through both Apex Learning and Other Providers. Source: Chancery online courses records, 2012–2013 and 2013–2014
Table 5. Average Number of Online Courses Per HISD Student Who Took at Least One Online Course, by Grade Level and Provider, 2012–2013 and 2013–2014
Apex Learning Other Providers All Providers
Grade 2012–2013
2013–2014
Differ-ence
2012–2013
2013–2014
Differ-ence
2012–2013
2013–2014
Differ-ence
6 NA NA NA NA NA NA NA NA NA
7 1.3 1.2 -0.1 NA NA NA 1.3 1.2 -0.1
8 1.8 1.4 -0.4 1.0 3.0 2.0 1.8 1.5 -0.3
9 1.8 1.7 -0.1 2.2 2.0 -0.2 1.9 1.9 0.0
10 1.8 1.8 0.0 2.4 2.1 -0.3 1.9 2.0 0.1
11 2.0 1.9 -0.1 2.3 2.1 -0.2 2.0 2.1 0.1
12 2.0 1.9 -0.1 2.1 1.7 -0.4 2.0 2.0 0.0
Total 1.9 1.9 0.0 2.2 2.0 -0.2 2.0 2.0 0.0
Note: Some students completed online courses through both Apex Learning and Other Providers. Source: Chancery online courses records, 2012–2013 and 2013–2014

HISD Research and Accountability__________________________________________________________________________ 24
Table 6. Number of HISD Online Courses by School and Provider, 2013–2014
A
pex
Lea
rnin
g
AP
EX
IS
AP
I
Ave
nta
HC
C
HV
S
No
va N
et
Oth
er P
rov.
Pen
n F
ost
er
Pla
to
SS
CS
P
Tex
asT
ech
D
TxV
SN
StU
UT
DL
To
tal
High Schools
Advanced Virtual Academy
691 38 1 730
Austin HS 215 18 1 196 430 Bellaire HS 441 4 28 16 27 3 1 36 24 580 Carnegie Vanguard HS 24 24 Challenge Early College HS
478 40 518
Chavez HS 547 5 552 Davis HS 458 1 1 3 463 DeBakey HSHP 44 3 55 6 108
East Early College HS 53 96 149
Eastwood Academy 28 2 69 99
Energized for STEM HS SE 3 3 Energized for STEM HS SW 42 42 Energy Institute HS 3 3
Furr HS 384 85 7 476 Hope Academy 8 16 24 Houston Academy for International Studies
188 212 5 405
Houston Math/Science/ Technology Center
815 302 24 3 1 708 1,853
Jones HS 147 147 Jordan HS 27 4 4 35 Lamar HS 1,320 5 1 6 59 93 1,484 Law Enforcement and Criminal Justice HS
525 12 1 3 1 542
Lee HS 556 42 1 120 3 57 779 Liberty HS 258 2 7 15 282 Madison HS 215 5 13 1 61 295

HISD Research and Accountability__________________________________________________________________________ 25
Table 6 (continued). Number of HISD Online Courses by School and Provider, 2013–2014
A
pex
Lea
rnin
g
AP
EX
IS
AP
I
Ave
nta
HC
C
HV
S
No
va N
et
Oth
er P
rov.
Pen
n F
ost
er
Pla
to
SS
CS
P
Tex
asT
ech
D
TxV
SN
StU
UT
DL
To
tal
High Schools (continued)
Milby HS 297 6 303 Mount Carmel Academy 3 3 13 45 64 North Forest HS 46 23 2 1 1 73 North Houston Early College HS
103 2 3 353 461
Performing and Visual Arts HS 31 1 13 21 1 1 12 1 81 REACH Charter HS 2 9 11
Reagan HS 417 3 4 1 425 Scarborough HS 385 41 1 208 635
Sharpstown HS 677 19 1 697 South Early College HS 6 1 31 11 49
Sterling HS 63 1 64 Waltrip HS 117 15 14 21 4 2 475 3 651 Washington HS 230 1 20 4 33 288 Westbury HS 215 18 8 1 4 246 Westside HS 543 11 95 16 1 4 4 19 693 Wheatley HS 70 12 55 137 Worthing HS 126 126 Yates HS 287 1 4 292

HISD Research and Accountability__________________________________________________________________________ 26
Table 6 (continued). Number of HISD Online Courses by School and Provider, 2013–2014
A
pex
Lea
rnin
g
AP
EX
IS
AP
I
Ave
nta
HC
C
HV
S
No
va N
et
Oth
er P
rov.
Pen
n F
ost
er
Pla
to
SS
CS
P
Tex
asT
ech
D
TxV
SN
StU
UT
DL
To
tal
Middle Schools
Grady MS 2 1 3 Holland MS 96 96 Lanier MS 1 1 OrtÍz MS 2 2 Project Chrysalis MS 134 134
Combined Level Schools Beechnut Academy 2 1 3 6
Long Academy 202 202 Sharpstown International School
32 32
Texas Connections Academy 1 1 Young Men’s College Prep. 1 1 Young Women’s College Prep. 123 1 1 125
District Total 11,674 682 22 3 1,021 79 100 302 7 3 5 650 8 1,366 15,922
Source: Chancery online courses records, 2013–2014

HISD Research and Accountability__________________________________________________________________________ 27
Table 7. Number and Percentage of HISD Apex Learning Courses by School, 2012–2013 and 2013–2014
2012–2013 2013–2014 Difference in N of Apex
Courses, 2012–2013 to 2013–
2014
N of APEX
Learning Courses
N of All Online
Courses
% of Apex Learning Courses
N of Apex
Learning Courses
N of All Online
Courses
% of Apex Learning Courses
High Schools
Advanced Virtual Academy 979 983 99.6 729 730 99.9 -250
Austin HS 381 454 83.9 233 430 54.2 -148
Bellaire HS 655 964 67.9 445 580 76.7 -210
Carnegie Vanguard HS 21 22 95.5 24 24 100.0 3 Challenge Early College HS 421 509 82.7 478 518 92.3 57
Chavez HS 348 360 96.7 547 552 99.1 199
Davis HS 416 480 86.7 459 463 99.1 43
DeBakey HSHP 81 153 52.9 47 108 43.5 -34
East Early College HS 99 252 39.3 53 149 35.6 -46
Eastwood Academy 74 217 34.1 28 99 28.3 -46 Empowerment College Prep. HS 19 49 38.8 -19 Energized for STEM HS SE 42 42 100.0 3 3 100.0 -39 Energized for STEM HS SW 59 59 100.0 42 42 100.0 -17
Energy Institute HS 3 3 100.0 3
Furr HS 359 359 100.0 469 476 98.5 110
Hope Academy 22 23 95.7 24 24 100.0 2 Houston Academy for International Studies 154 257 59.9 188 405 46.4 34 Houston Math/Science/ Technology Center 1,098 1,883 58.3 1,117 1,853 60.3 19
Jones HS 192 192 100.0 147 147 100.0 -45
Jordan HS 29 41 70.7 31 35 88.6 2
Kashmere HS 45 45 100.0 -45
Lamar HS 885 964 91.8 1,325 1,484 89.3 440 Law Enforcement and Criminal Justice HS 322 338 95.3 537 542 99.1 215
Lee HS 577 739 78.1 598 779 76.8 21
Liberty HS 68 81 84.0 258 282 91.5 190
Madison HS 275 387 71.1 215 295 72.9 -60
HISD Research and Accountability__________________________________________________________________________ 28
Table 7 (continued). Number and Percentage of HISD Apex Learning Courses by School, 2012–2013 and 2013–2014
2012–2013 2013–2014 Difference in N of Apex Courses,
2012–2013 to 2013–
2014
N of APEX
Learning Courses
N of All Online
Courses
% of Apex Learning Courses
N of APEX
Learning Courses
N of All Online
Courses
% of Apex Learning Courses
High Schools (continued)
Milby HS 609 663 91.9 303 303 100.0 -306
Mount Carmel Academy 15 90 16.7 6 64 9.4 -9
North Forest HS 0 3 0.0 69 73 94.5 69 North Houston Early College HS 219 252 86.9 103 461 22.3 -116 Performing and Visual Arts HS 22 62 35.5 31 81 38.3 9
REACH Charter HS 31 31 100.0 11 11 100.0 -20
Reagan HS 408 447 91.3 420 425 98.8 12
Scarborough HS 658 726 90.6 426 635 67.1 -232
Sharpstown HS 597 666 89.6 677 697 97.1 80
South Early College HS 7 49 14.3 7
Sterling HS 266 296 89.9 63 64 98.4 -203
Waltrip HS 171 191 89.5 132 651 20.3 -39
Washington HS 194 210 92.4 231 288 80.2 37
Westbury HS 202 237 85.2 233 246 94.7 31
Westside HS 543 700 77.6 554 693 79.9 11
Wheatley HS 146 260 56.2 82 137 59.9 -64
Worthing HS 412 412 100.0 126 126 100.0 -286
Yates HS 333 348 95.7 288 292 98.6 -45

HISD Research and Accountability__________________________________________________________________________ 29
Table 7 (continued). Number and Percentage of HISD Apex Learning Courses by School, 2012–
2013 and 2013–2014
2012–2013 2013–2014 Difference in N of Apex
Courses, 2012–2013 to 2013–
2014
N of APEX
Learning Courses
N of All Online
Courses
% of Apex Learning Courses
N of APEX
Learning Courses
N of All Online
Courses
% of Apex Learning Courses
Middle Schools
Grady MS 2 3 66.7 2
Holland MS 7 7 100.0 96 96 100.0 89
Lanier MS 0 1 0.0 0
OrtÍz MS 2 2 100.0 2
Pershing MS 0 1 0.0 0
Pin Oak MS 0 1 0.0 0
Project Chrysalis MS 88 88 100.0 134 134 100.0 46
Combined Level Schools
Beechnut Academy 0 19 0.0 3 6 50.0 3
JJAEP 3 34 8.8 -3
Long Academy 96 96 100.0 202 202 100.0 106
Rogers, T. H. 0 1 0.0 0 Sharpstown International School 141 141 100.0 32 32 100.0 -109
Soar Center 7 7 100.0 -7 Texas Connections Academy 0 12 0.0 0 1 0.0 0 Young Men’s College Prep. 0 1 0.0 0 Young Women’s College Prep. 83 85 97.6 123 125 98.4 40
District Total 12,872 15,939 80.8 12,356 15,922 77.6 -516
Note: Percentages may not total 100 due to rounding. Source: Chancery online courses records, 2012–2013 and 2013–2014

HISD Research and Accountability__________________________________________________________________________ 30
Table 8. Number and Percentage of HISD Online Courses Completed, By Provider and Course,
2012–2013 and 2013–2014
Provider Subject 2012–2013 2013–2014
N % N %
Apex Learning
Core Subjects
English 2,281 14.3 2,120 13.3
Mathematics 1,106 6.9 939 5.9
Science 1,321 8.3 1,116 7.0
Social Studies 3,192 20.0 2,953 18.5
Non-Core Subjects
Spanish 3,801 23.8 3,908 24.5
STAAR/EOC Review
TAKS Review 3 <0.1
Other 1,168 7.3 1,320 8.3 Total 12,872 80.8 12,356 77.6
API
Core Subjects
English
Mathematics 1 <0.1
Science
Social Studies 1 <0.1
Non-Core Subjects
Spanish 4 <0.1
STAAR/EOC Review
TAKS Review
Other 2 <0.1 20 0.1
Total 6 <0.1 22 0.1
Aventa
Core Subjects
English
Mathematics 2 <0.1
Science
Social Studies 2 <0.1 1 <0.1
Non-Core Subjects
Spanish 1 <0.1
STAAR/EOC Review
TAKS Review
Other 1 <0.1 Total 4 <0.1 3 <0.1

HISD Research and Accountability__________________________________________________________________________ 31
Table 8 (continued). Number and Percentage of HISD Online Courses Completed, By Provider and Course, 2012–2013 and 2013–2014
Provider Subject 2012–2013 2013–2014
N % N %
HCC
Core Subjects
English 164 1.0 157 1.0
Mathematics 80 0.5 132 0.8
Science 90 0.6 90 0.6
Social Studies 377 2.4 297 1.9
Non-Core Subjects
Spanish 74 0.5
STAAR/EOC Review
TAKS Review
Other 82 0.5 345 2.2 Total 867 5.4 1,021 6.4
HVS
Core Subjects
English 6 <0.1 5 <0.1
Mathematics 17 0.1 10 0.1
Science 8 0.1 1 <0.1
Social Studies 7 <0.1 14 0.1
Non-Core Subjects
Spanish 3 <0.1
STAAR/EOC Review
TAKS Review
Other 31 0.2 46 0.3 Total 69 0.4 79 0.5
Nova Net
Core Subjects
English 43 0.3 37 0.2
Mathematics 39 0.2 6 <0.1
Science 28 0.2 11 0.1
Social Studies 26 0.2 36 0.2
Non-Core Subjects
Spanish
STAAR/EOC Review
TAKS Review
Other 74 0.5 10 0.1 Total 210 1.3 100 0.6

HISD Research and Accountability__________________________________________________________________________ 32
Table 8 (continued). Number and Percentage of HISD Online Courses Completed, By Provider
and Course, 2012–2013 and 2013–2014
Provider Subject 2012–2013 2013–2014
N % N %
Other Provider
Core Subjects
English 51 0.3 35 0.2
Mathematics 70 0.4 31 0.2
Science 58 0.4 33 0.2
Social Studies 75 0.5 36 0.2
Non-Core Subjects
Spanish 79 0.5 68 0.4
STAAR/EOC Review (Mth) 3 <0.1 1 <0.1
TAKS Review (Sci) 1 <0.1
Other 180 1.1 97 0.6 Total 516 3.2 302 1.9
Penn Foster
Core Subjects
English 1 <0.1
Mathematics 1 <0.1
Science 2 <0.1
Social Studies 3 <0.1
Non-Core Subjects
Spanish
STAAR/EOC Review
TAKS Review
Other Total 0 0.0 7 <0.1
Plato
Core Subjects
English 5 <0.1
Mathematics 2 <0.1
Science 19 0.1
Social Studies 8 0.1
Non-Core Subjects
Spanish
STAAR/EOC Review
TAKS Review
Other 28 0.2 3 <0.1 Total 62 0.4 3 <0.1

HISD Research and Accountability__________________________________________________________________________ 33
Table 8 (continued). Number and Percentage of HISD Online Courses Completed, By Provider and Course, 2012–2013 and 2013–2014
Provider Subject 2012–2013 2013–2014
N % N %
SSCSP
Core Subjects
English
Mathematics 1 <0.1
Science 1 <0.1
Social Studies 1 <0.1
Non-Core Subjects
Spanish 3 <0.1
STAAR/EOC Review
TAKS Review
Other Total 1 <0.1 5 <0.1
Texas TechD
Core Subjects
English 5 <0.1 6 <0.1
Mathematics 14 0.1 21 0.1
Science 5 <0.1 8 0.1
Social Studies 46 0.3 30 0.2
Non-Core Subjects
Spanish 4 <0.1 484 3.0
STAAR/EOC Review
TAKS Review
Other 101 0.6 101 0.6 Total 175 1.1 650 4.1
TxVSN StU
Core Subjects
English 4 <0.1
Mathematics 13 0.1
Science 9 0.1
Social Studies 16 0.1
Non-Core Subjects
Spanish 11 0.1 5 <0.1
STAAR/EOC Review
TAKS Review
Other 66 0.4 3 <0.1 Total 119 0.7 8 0.1

HISD Research and Accountability__________________________________________________________________________ 34
Table 8 (continued). Number and Percentage of HISD Online Courses Completed, By Provider and Course, 2012–2013 and 2013–2014
Provider Subject 2012–2013 2013–2014
N % N %
UT DL
Core Subjects
English 4 <0.1 5 <0.1
Mathematics 8 0.1 8 0.1
Science 7 <0.1 7 <0.1
Social Studies 1 <0.1 3 <0.1
Non-Core Subjects
Spanish 1,011 6.3 1,330 8.4
STAAR/EOC Review
TAKS Review
Other 7 <0.1 13 0.1 Total 1,038 6.5 1,366 8.6
All Online Providers except Apex Learning
Core Subjects
English 282 1.8 246 1.5
Mathematics 244 1.5 212 1.3
Science 224 1.4 153 1.0
Social Studies 558 3.5 422 2.7
Non-Core Subjects
Spanish 1,184 7.4 1,893 11.9
STAAR/EOC Review 3 <0.1 1 <0.1
TAKS Review 1 <0.1
Other 572 3.6 638 4.0 Total 3,067 19.3 3,566 22.4
GRAND Total 15,939 100.00 15,922 100.0
Note: Percentages may not equal 100 due to rounding. Source: Chancery online courses records, 2012–2013 and 2013–2014

HISD Research and Accountability__________________________________________________________________________ 35
Table 9. TAKS Retest Performance of HISD Students Who Took a Course through Apex Learning and Performance of All Other HISD Students, 2013–2014
Reading Mathematics Science Social Studies
N % N % N % N %
Apex Learning
Met Standard 174 80.6 76 68.5 59 68.6 169 89.9
Commended 8 3.7 1 0.9 3 3.5 37 19.7
Total Tested 216 100.0 111 100.0 86 100.0 188 100.0
HISD (excl. Apex)
Met Standard 746 53.7 944 47.7 719 52.1 632 75.1
Commended 48 3.5 30 1.5 20 1.4 95 11.3
Total Tested 1,389 100.0 1,981 100.0 1,381 100.0 842 100.0
Note: Percentages may not total 100 due to rounding. Source: State of Texas, Texas Assessment of Knowledge and Skills file, 2013–2014
Table 10. Results for Chi-Square Tests of the Differences in TAKS Performance between HISD Students Who Completed at Least One Apex Learning Course in the Subject of the Test and HISD Students Who Did Not, 2013–2014
TAKS Test Chi-Square p Cramer’s V
Reading/ELA
Met Standard Χ2(1, N=1,605) = 55.08 < .001 .19
Commended Χ2(1, N=1,605) = 0.03 .85 NA
Mathematics
Met Standard Χ2(1, N=2,092) = 18.23 < .001 .09
Commended Χ2(1, N=2,092) = 0.27 .60 NA
Science
Met Standard Χ2(1, N=1,467) = 8.89 .003 .08
Commended Χ2(1, N=1,467) = 2.18 .14 NA
Social Studies
Met Standard Χ2(1, N=1,030) = 19.56 < .001 .14
Commended Χ2(1, N=1,030) = 9.70 .002 .10
Note: Effect size conventions for Cramer’s V are: .10 indicates a small effect, .30 indicates a medium effect, and .50 indicates a large effect.

HISD Research and Accountability__________________________________________________________________________ 36
Table 11. STAAR/EOC Performance of HISD Students Who Took a Course through Apex Learning
and Performance of All Other HISD Students, 2013–2014 English I English II Algebra I Biology US History
N % N % N % N % N %
Apex Learning
Satisfactory 32 43.8 31 40.8 19 70.4 26 81.3 26 86.7
Advanced 0 0.0 1 1.3 1 3.7 0 0.0 1 3.3
Total Tested 73 100.0 76 100.0 27 100.0 32 100.0 30 100.0
HISD (excl. Apex)
Satisfactory 8,733 52.1 7,652 56.4 10,562 73.0 11,364 83.2 9,063 89.7
Advanced 865 5.2 613 4.5 2,177 15.1 1,238 9.1 1,489 14.7
Total Tested 16,771 100.0 13,565 100.0 14,459 100.0 13,661 100.0 10,100 100.0
Note: Percentages may not total 100 due to rounding. Source: State of Texas Assessments of Academic Readiness file, 2013–2014
HISD Research and Accountability__________________________________________________________________________ 37
Table 12. Propensity Score Matching Results for HISD Students Who Took an Apex Learning Course in a STAAR/EOC Subject Matched with HISD Students Who Did Not, 2013–2014
N Mean 2014 STAAR/EOC
Rate of Achievement
Apex Learning
Users
Non-Apex Learning
Users
Apex Learning
Users
Non-Apex Learning
Users
Difference S.E. t
English 1 72 15,969 Satisfactory Before Matching 0.63 0.52 0.11 0.06 1.85 Matched 0.63 0.22 0.40 0.10 3.89* Advanced Before Matching 0.00 0.04 -0.04 0.02 -1.75 Matched 0.00 0.00 0.00 0.00 NA English 2 76 12,871 Satisfactory Before Matching 0.47 0.56 -0.08 0.06 -1.44 Matched 0.47 0.25 0.22 0.11 2.00* Advanced Before Matching 0.01 0.03 -0.02 0.02 -1.03 Matched 0.01 0.01 0.00 0.04 0.00 Algebra 1 27 13,808 Satisfactory Before Matching 0.74 0.73 0.01 0.09 0.17 Matched 0.74 0.30 0.44 0.13 3.40* Advanced Before Matching 0.04 0.14 -0.10 0.07 -1.50 Matched 0.04 0.04 0.00 0.06 0.00
Biology 32 13,016 Satisfactory Before Matching 0.88 0.83 0.05 0.07 0.70 Matched 0.88 0.50 0.38 0.14 2.71* Advanced Before Matching 0.00 0.08 -0.08 0.05 -1.63 Matched 0.00 0.06 -0.06 0.07 -0.88 U.S. History 27 10,012 Satisfactory Before Matching 0.85 0.90 -0.05 0.06 -0.78 Matched 0.85 0.63 0.22 0.13 1.65 Advanced Before Matching 0.00 0.15 -0.15 0.07 -2.16* Matched 0.00 0.11 -0.11 0.09 -1.25
Note: * indicates p<.001.

HISD Research and Accountability__________________________________________________________________________ 38
Table 13. Number and Percentage of HISD Graduates, By Diploma Type,
2012–2013 and 2013–2014
2012–2013 2013–2014
Diploma Type N % N %
Apex Learning Recommended 1,823 66.5 1,746 65.6
Distinguished 77 2.8 222 8.3
Minimum/IEP 841 30.7 692 26.0
Apex Learning Total 2,741 100.0 2,660 100.0
All HISD Recommended 6,927 73.0 6,997 73.6
Distinguished 637 6.7 755 7.9
Minimum/IEP 1,923 20.3 1,750 18.4
All HISD Total 9,487 100.0 9,502 100.0
Note: Percentages may not total 100 due to rounding Source: TEA Standard Reports for 2012–2013 and 2013–2014 preliminary Chancery
graduates file
Table 14. Results for Chi-Square Test of the Difference in Distribution of
Diploma Types between HISD Graduates Who Completed at Least One Apex Learning Course and HISD graduates Who Did Not during the Final Year before Graduation, 2012–2013 and 2013–2014
Year Chi-Square p Cramer’s V
2012–2013 Χ2(2, N=9,487) = 316.09 <.001 .18
2013–2014 Χ2(2, N=9,502) = 148.63 <.001 .13
Note: Effect size conventions for Cramer’s V are: .10 indicates a small effect, .30 indicates a medium effect, and .50 indicates a large effect.
Table 15. HISD Online Course Providers for Advanced Placement (AP) Courses and Number and Percentage of Completed Courses, 2012–2013 and 2013–2014
2012–2013 2013–2014
N % N %
Apex Learning Courses 86 74.8 58 63.0
HVS 9 7.8 15 16.3
Other Provider 16 13.9 15 16.3
Penn Foster 3 3.3
SSCSP 1 1.1
TxVSN StU (Texas Virtual School
Network) 4 3.5
Total HISD Advanced Placement (AP)
Online Course Completions 115 100.0 92 100.0
Note: Percentages may not total 100 due to rounding

HISD Research and Accountability__________________________________________________________________________ 39
Source: Chancery online courses records, 2012–2013 and 2013–2014
Table 16. Number of HISD Advanced Placement (AP) Courses Completed, by School and AP Course, 2013–2014
School Name AP Course N %
Bellaire HS AP COMP SCI 1A 1 1.1
AP ENG LIT B 1 1.1
AP EUROPEAN A 1 1.1
AP MACRO ECO 2 2.2
AP MICRO ECO 1 1.1
AP PHYSICS B A 1 1.1
AP PHYSICS B B 1 1.1
AP PSYCH 1 1.1
AP US HIST A 1 1.1
AP US HIST B 1 1.1
AP WORLD HIST A 2 2.2
AP WORLD HIST B 2 2.2
Carnegie Vanguard HS AP ENG LIT A 2 2.2
AP GOV & POL 4 4.3
AP MICRO ECO 9 9.8
Davis HS AP MACRO ECO 1 1.1
DeBakey HSHP AP BIOL A 5 5.4
AP CHEM A 4 4.3
AP PHYS B A 2 2.2
Energized for STEM HS SW AP CHEM A 4 4.3
AP CHEM B 7 7.6
AP ENG LA A 1 1.1
AP MACRO ECO 1 1.1
AP US HIST B 2 2.2
Furr HS AP ENG LIT A 1 1.1

HISD Research and Accountability__________________________________________________________________________ 40
Table 16 (continued). Number of HISD Advanced Placement (AP), by School and AP Course, 2013–2014
School Name AP Course N %
Houston Math/Science/ Technology Center
AP SPAN LA A 1 1.1
Lamar HS AP CAL AB A 1 1.1
AP CAL AB B 1 1.1
AP US GOVT 1 1.1
Law Enforcement and Criminal Justice HS
AP PHYS B B 1 1.1
Lee HS AP WORLD HIST A 1 1.1
Liberty HS AP SPAN LA A 1 1.1
North Houston Early College HS AP ENG LA A 1 1.1
AP US HIST B 2 2.2
Performing and Visual Arts HS AP ART HIST 3A 1 1.1
AP COMP SCI 1A 3 3.3
AP ENG LIT B 1 1.1
AP MACRO ECO 3 3.3
AP PSYCHOLOGY 3 3.3
AP SPAN LANG A 1 1.1
AP SPAN LANG B 1 1.1
AP US GOVT 2 2.2
Sharpstown International School AP CHEM A 1 1.1
AP CHEM B 1 1.1
Waltrip HS AP US HIST B 1 1.1
Westside HS AP BIOL A 1 1.1
AP BIOL B 1 1.1
AP MACRO ECO 1 1.1
Wheatley HS AP WORLD HIST B 1 1.1
Yates HS AP CAL AB A 1 1.1
AP GOV & POL 1 1.1
Total 92 100.0
Note: Percentages may not total 100 due to rounding. Source: Chancery online courses records, 2013–2014

HISD Research and Accountability__________________________________________________________________________ 41
Table 17. HISD Online AP Courses Completed, by Provider and School, 2013–2014
Provider School Name AP Course N %
APEX
Carnegie Vanguard HS AP ENG LIT A 2 2.2
AP GOV & POL 4 4.3
AP MICRO ECO 9 9.8
Davis HS AP MACRO ECO 1 1.1
DeBakey HSHP AP BIOL A 5 5.4
AP CHEM A 4 4.3
AP PHYS B A 2 2.2
Energized for STEM HS SW AP CHEM A 4 4.3
AP CHEM B 7 7.6
AP ENG LA A 1 1.1
AP MACRO ECO 1 1.1
AP US HIST B 2 2.2
Furr HS AP ENG LIT A 1 1.1
Houston Math/Science/ Technology
Center AP SPAN LA A 1 1.1
Law Enforcement and Criminal Justice HS AP PHYS B B 1 1.1
Liberty HS AP SPAN LA A 1 1.1
North Houston Early College HS AP ENG LA A 1 1.1
AP US HIST B 2 2.2
Sharpstown International School AP CHEM A 1 1.1
AP CHEM B 1 1.1
Waltrip HS AP US HIST B 1 1.1
Westside HS AP BIOL A 1 1.1
AP BIOL B 1 1.1
AP MACRO ECO 1 1.1
Wheatley HS AP WORLD HIST B 1 1.1
Yates HS AP CAL AB A 1 1.1
AP GOV & POL 1 1.1

HISD Research and Accountability__________________________________________________________________________ 42
Table 17 (continued). HISD Online AP Courses Completed, by Provider and School, 2013–2014
Provider School Name AP Course N %
HVS
Bellaire HS AP MACRO ECO 2 2.2
AP PSYCH 1 1.1
AP US HIST A 1 1.1
AP US HIST B 1 1.1
Lamar HS AP CAL AB A 1 1.1
AP CAL AB B 1 1.1
AP US GOV 1 1.1
Performing and Visual Arts HS AP ENG LIT B 1 1.1
AP MACRO ECO 2 2.2
AP PSYCH 2 2.2
AP US GOV 2 2.2
Other Provider
Bellaire HS AP COMP SCI 1A 1 1.1
AP ENG LIT B 1 1.1
AP EUROPEAN A 1 1.1
AP MICRO ECO 1 1.1
AP PHYSICS B A 1 1.1
AP PHYSICS B B 1 1.1
Lee HS AP WORLD HIST A 1 1.1
Performing and Visual Arts HS AP ART HIST 3A 1 1.1
AP COMP SCI 1A 3 3.3
AP MACRO ECO 1 1.1
AP PSYCH 1 1.1
AP SPAN LANG A 1 1.1
AP SPAN LANG B 1 1.1
Penn Foster
Bellaire HS AP WORLD HIST A 2 2.2
AP WORLD HIST B 1 1.1
SSCSP
Bellaire HS AP WoRLD HIS B 1 1.1
Total 92 100
Note: Percentages may not total 100 due to rounding. Source: Chancery online courses records, 2013–2014

HISD Research and Accountability__________________________________________________________________________ 43
Table 18. HISD Apex Learning Students Who Earned Credit in a
Course Associated with an AP Examination and Results on the Associated AP Exams, 2013–2014
Apex Learning
AP Course
Students
Awarded Credit
through Apex
Learning
Apex Learning
Students Who
Took the AP
Exam
Apex
Learning
Students with
AP Score 3 or
Higher
N % N % N %
Biology B 1 3.0 1 100.0 *
Chemistry B 8 24.2 0 0.0 NA
Government & Politics 5 15.2 4 80.0 *
Macroeconomics 3 9.1 0 0.0 NA
Microeconomics 9 27.3 9 100.0 0 0.0
Physics B 1 3.0 1 100.0 *
US History B 5 15.2 0 0.0 NA
World History 1 3.0 1 100.0 *
Total 33 100.0 16 48.5 1 3.0
Notes: Total numbers of students earning credits in courses are duplicated counts; 31 students took Apex Learning AP courses associated with an AP exam.
Percentages may not total 100 due to rounding. * Test scores are not reported for fewer than five students.
Source: College Board 2014 Advanced Placement file