APES Chapter 1 Environmental Problems, Their Causes and Sustainability “At present we are stealing...
59
APES Chapter 1 APES Chapter 1 Environmental Problems, Environmental Problems, Their Causes and Their Causes and Sustainability Sustainability “ “ At present we are stealing the future, selling At present we are stealing the future, selling it in the present, and calling it gross domestic it in the present, and calling it gross domestic product.” product.” Paul Hawken Paul Hawken
-
Upload
cameron-mathews -
Category
Documents
-
view
216 -
download
3
Transcript of APES Chapter 1 Environmental Problems, Their Causes and Sustainability “At present we are stealing...
APES Chapter 1APES Chapter 1Environmental Problems, Environmental Problems,
Their Causes and Their Causes and SustainabilitySustainability
““At present we are stealing the future, At present we are stealing the future, selling it in the present, and calling it selling it in the present, and calling it
gross domestic product.” gross domestic product.” Paul HawkenPaul Hawken
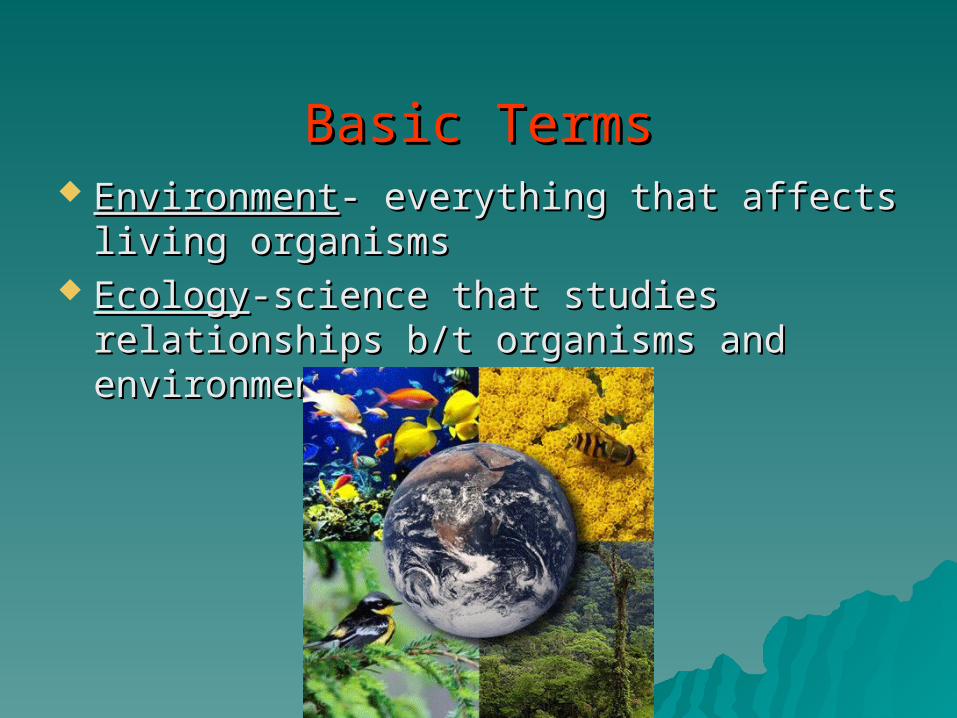
Basic TermsBasic Terms EnvironmentEnvironment- everything that affects living - everything that affects living
organismsorganisms EcologyEcology-science that studies relationships -science that studies relationships
b/t organisms and environmentb/t organisms and environment
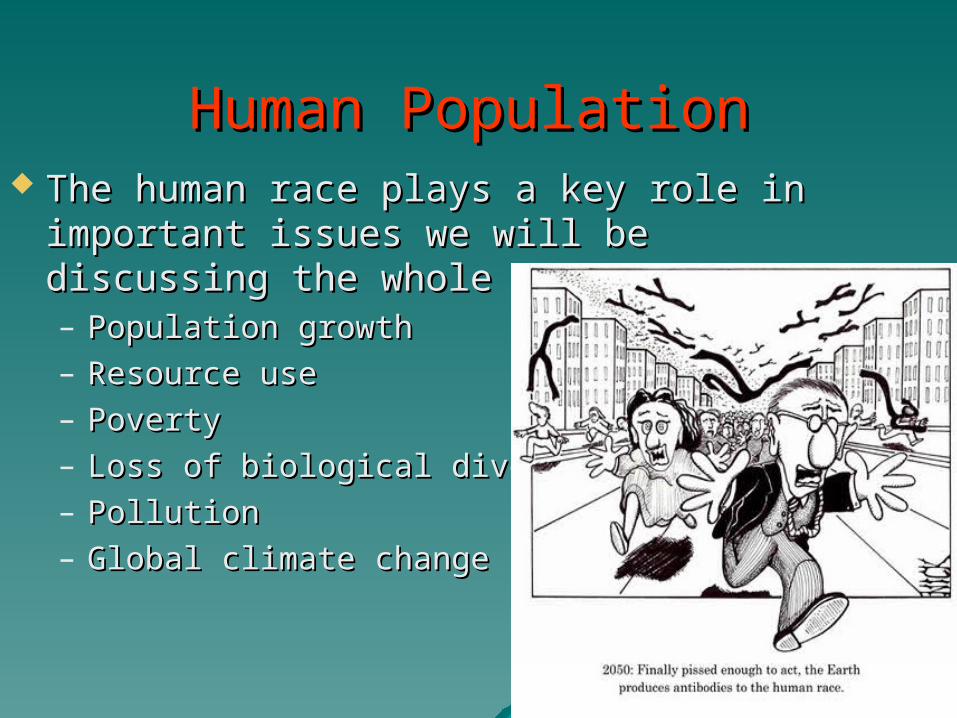
Human Population Human Population The human race plays a key role in The human race plays a key role in
important issues we will be discussing the important issues we will be discussing the whole yearwhole year– Population growthPopulation growth– Resource useResource use– PovertyPoverty– Loss of biological diversityLoss of biological diversity– PollutionPollution– Global climate changeGlobal climate change
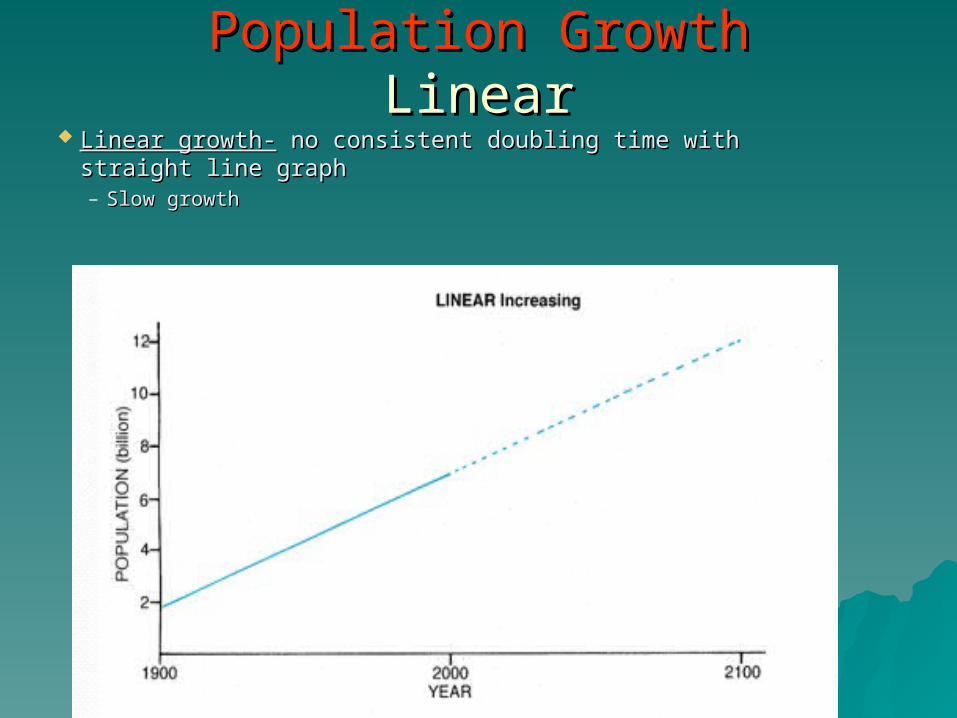
Population GrowthPopulation GrowthLinearLinear
Linear growth-Linear growth- no consistent doubling time with straight line no consistent doubling time with straight line graphgraph– Slow growthSlow growth

Population GrowthPopulation GrowthExponentialExponential
Exponential growth-Exponential growth- quantity quantity increases at a constant rate per increases at a constant rate per unit timeunit time– Starts slowly, but grows Starts slowly, but grows
enormously due to doublingenormously due to doubling– Addition to population Addition to population
proportional to current sizeproportional to current size Larger populations add more Larger populations add more
people than smaller ones people than smaller ones growing at same rate growing at same rate 10% growth of 100,000 10% growth of 100,000 people = 10,000 added/yrpeople = 10,000 added/yr
10% growth of 1,000,000 10% growth of 1,000,000 people = 100,000 added/yrpeople = 100,000 added/yr
These larger populations will These larger populations will then increase their then increase their population considerablypopulation considerably
Population GrowthPopulation GrowthExponentialExponential
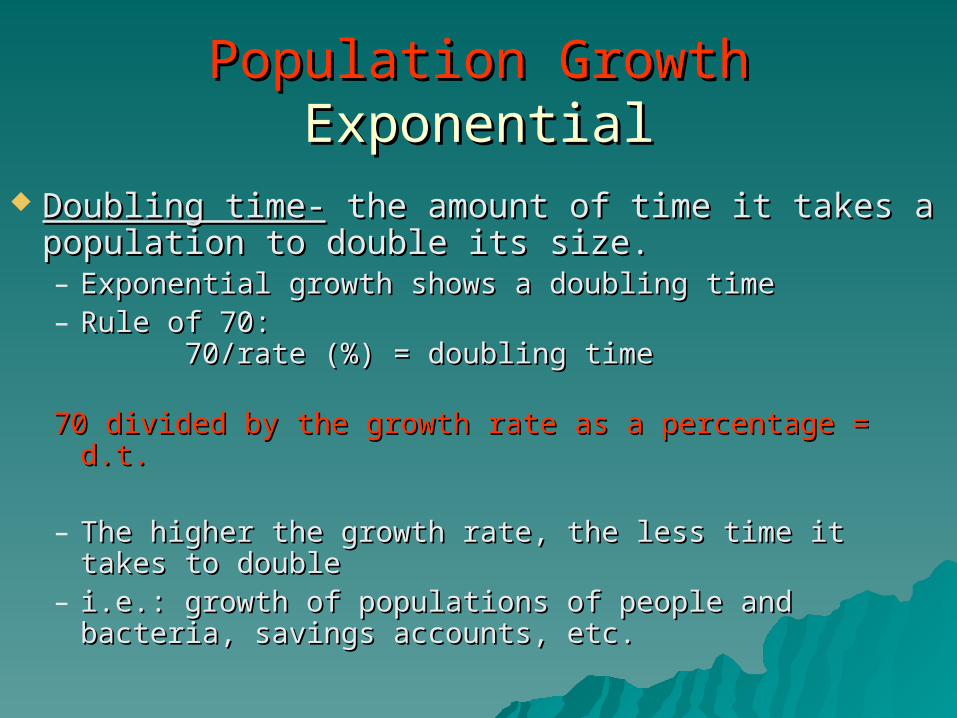
Doubling time-Doubling time- the amount of time it takes a the amount of time it takes a population to double its size.population to double its size.– Exponential growth shows a doubling timeExponential growth shows a doubling time– Rule of 70: Rule of 70:
70/rate (%) = doubling time 70/rate (%) = doubling time
70 divided by the growth rate as a percentage = d.t. 70 divided by the growth rate as a percentage = d.t.
– The higher the growth rate, the less time it takes to The higher the growth rate, the less time it takes to doubledouble
– i.e.: growth of populations of people and bacteria, i.e.: growth of populations of people and bacteria, savings accounts, etc.savings accounts, etc.
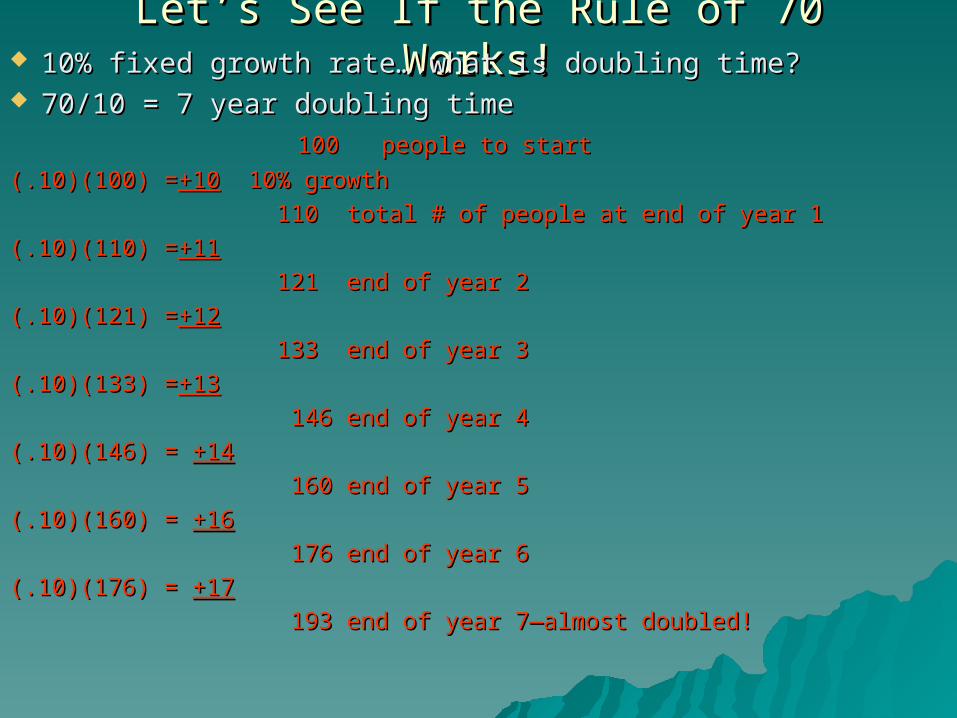
Let’s See If the Rule of 70 Works!Let’s See If the Rule of 70 Works! 10% fixed growth rate….what is doubling time?10% fixed growth rate….what is doubling time? 70/10 = 7 year doubling time70/10 = 7 year doubling time 100 people to start100 people to start
(.10)(100) =(.10)(100) =+10+10 10% growth 10% growth
110 total # of people at end of year 1110 total # of people at end of year 1
(.10)(110) =(.10)(110) =+11+11
121 end of year 2121 end of year 2
(.10)(121) =(.10)(121) =+12+12
133 end of year 3133 end of year 3
(.10)(133) =(.10)(133) =+13+13
146 end of year 4146 end of year 4
(.10)(146) = (.10)(146) = +14+14
160 end of year 5160 end of year 5
(.10)(160) = (.10)(160) = +16+16
176 end of year 6176 end of year 6
(.10)(176) = (.10)(176) = +17+17
193 end of year 7—almost doubled!193 end of year 7—almost doubled!

100
150
200
250
300
350
400
450
year1
year2
year3
year4
year5
year6
year7
year8
year9
year10
year11
year12
year13
year14
year15
100
Population Size vs. TimePopulation Size vs. Time
How wouldwe figure out doubling time from this graph of population growth?

100
150
200
250
300
350
400
450
year1
year2
year3
year4
year5
year6
year7
year8
year9
year10
year11
year12
year13
year14
year15
100
Population Size vs. TimePopulation Size vs. Time
Using the graph you can see that after 7 years population has nearly doubled from 100 to 200
Population GrowthPopulation Growth
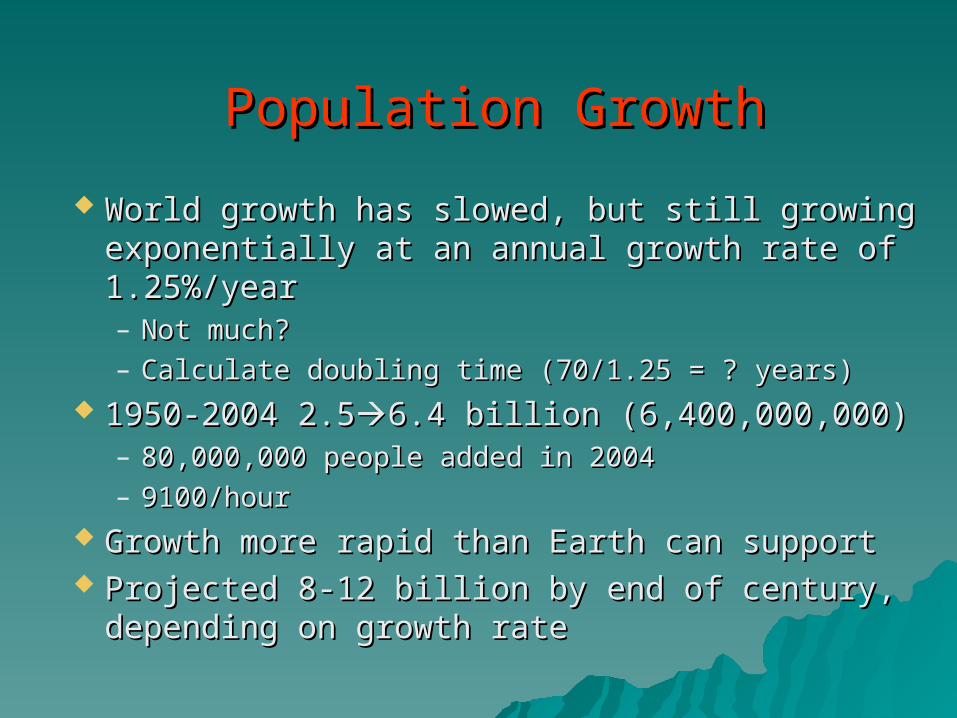
World growth has slowed, but still growing World growth has slowed, but still growing exponentially at an annual growth rate of exponentially at an annual growth rate of 1.25%/year1.25%/year– Not much?Not much?– Calculate doubling time (70/1.25 = ? years)Calculate doubling time (70/1.25 = ? years)
1950-2004 2.51950-2004 2.56.4 billion (6,400,000,000)6.4 billion (6,400,000,000)– 80,000,000 people added in 200480,000,000 people added in 2004– 9100/hour9100/hour
Growth more rapid than Earth can supportGrowth more rapid than Earth can support Projected 8-12 billion by end of century, Projected 8-12 billion by end of century,
depending on growth ratedepending on growth rate
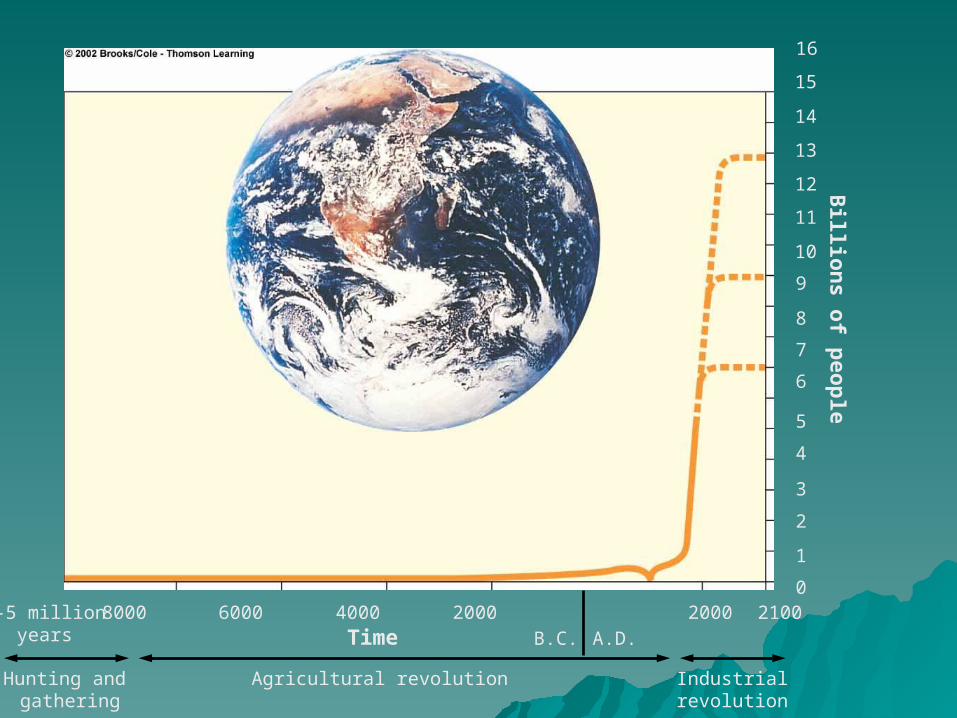
16
15
14
13
12
11 Billio
ns o
f peo
ple
?
?
?
10
9
8
7
6
5
4
3
2
1
02-5 million
years8000 6000 4000 2000 2000 2100
Hunting and gathering
Black Death–the Plague
Time
Industrialrevolution
Agricultural revolution
B.C. A.D.

Resource UseResource Use
Global economic Global economic output is a rough output is a rough measure of human measure of human resource useresource use
More people due to More people due to exponential growth exponential growth and economic and economic growth growth ↑ ↑ resource resource useuse
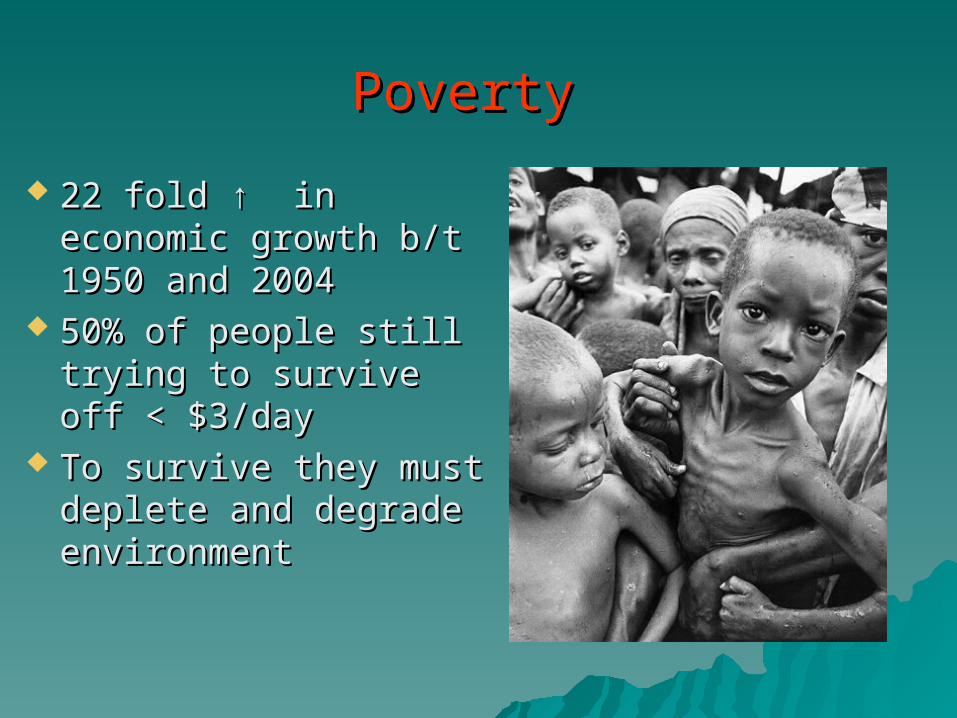
PovertyPoverty
22 fold 22 fold ↑ in ↑ in economic economic growth b/t 1950 and growth b/t 1950 and 20042004
50% of people still 50% of people still trying to survive off < trying to survive off < $3/day$3/day
To survive they must To survive they must deplete and degrade deplete and degrade environmentenvironment
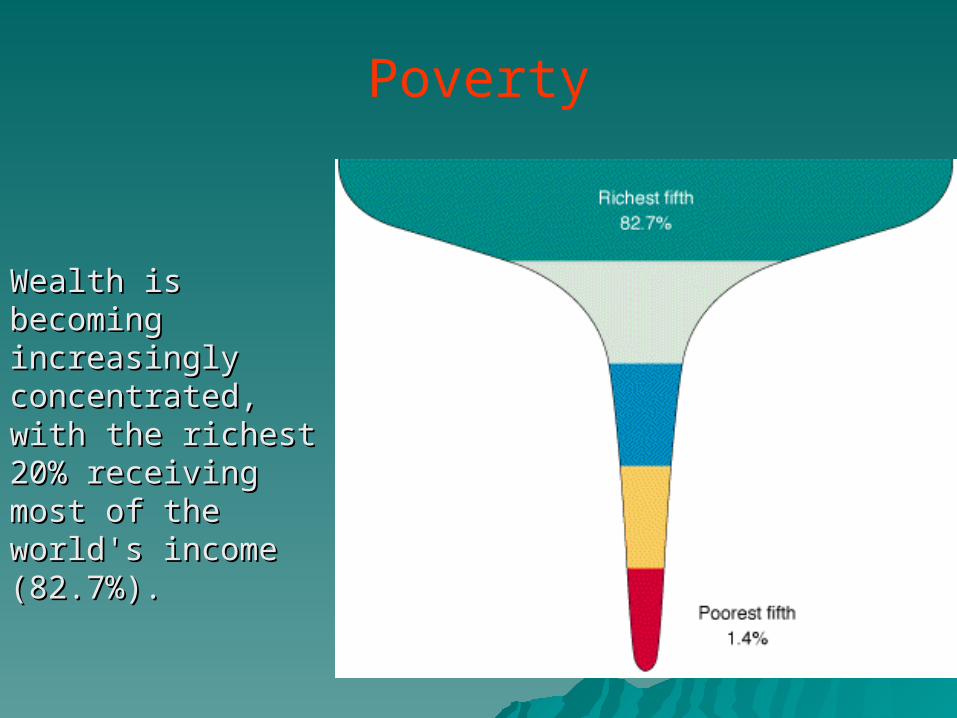
Wealth is becoming Wealth is becoming increasingly increasingly concentrated, with concentrated, with the richest 20% the richest 20% receiving most of receiving most of the world's income the world's income (82.7%).(82.7%).
Poverty

Loss of Biological DiversityLoss of Biological Diversity
Premature extinction of Premature extinction of species due to habitat species due to habitat degradationdegradation
1%/year1%/year IRREVERSIBLE!IRREVERSIBLE! i.e. cutting down forests i.e. cutting down forests
due to farming and due to farming and developmentdevelopment

PollutionPollution
Pollution-Pollution- presence of substances at presence of substances at high enough levels to harm living high enough levels to harm living organisms due to:organisms due to:– Natural occurrences= biogenic Natural occurrences= biogenic
(volcanic eruptions)(volcanic eruptions)– Human activities= anthropogenic Human activities= anthropogenic
(burning fossil fuels, using (burning fossil fuels, using pesticides, etc.)pesticides, etc.)
Disrupt support systems of Disrupt support systems of organismsorganisms

PollutionPollution Occurs more in urban areasOccurs more in urban areas Can contaminate area where Can contaminate area where
produced or be carried away produced or be carried away by wind or waterby wind or water
Factors that determine Factors that determine damage a pollutant can cause:damage a pollutant can cause:– ConcentrationConcentration– PersistencePersistence– Chemical natureChemical nature– Rate of degradationRate of degradation
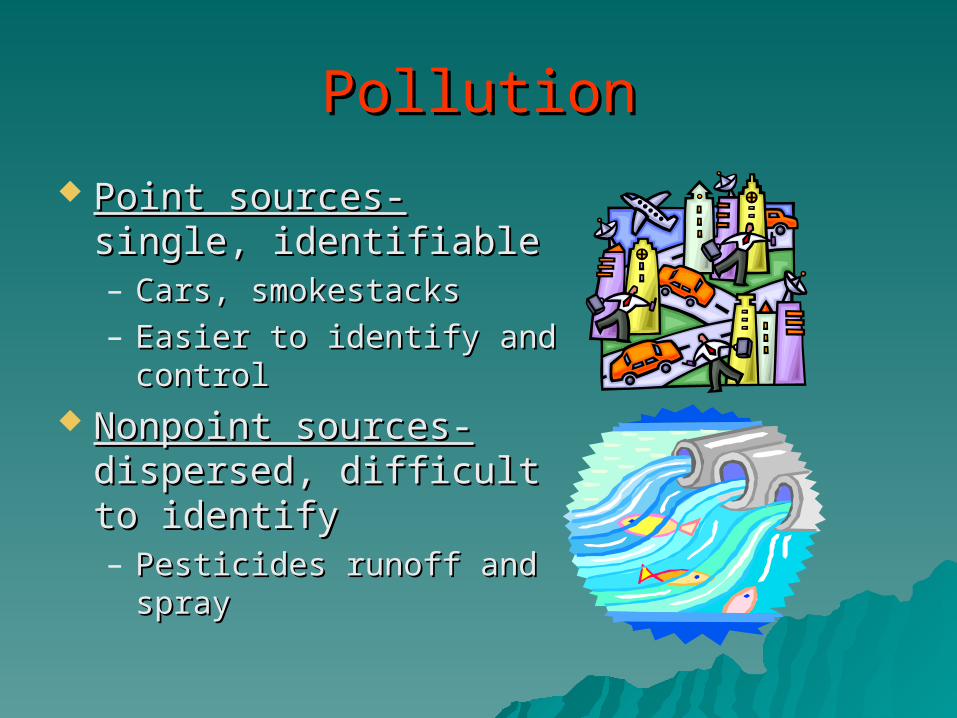
PollutionPollution
Point sources-Point sources- single, single, identifiableidentifiable– Cars, smokestacksCars, smokestacks– Easier to identify and Easier to identify and
controlcontrol Nonpoint sources-Nonpoint sources-
dispersed, difficult to dispersed, difficult to identifyidentify– Pesticides runoff and Pesticides runoff and
sprayspray

PollutionPollution
Prevention (output control)Prevention (output control)– Stop before it startsStop before it starts– Easier to do Easier to do – Less expensive to reduce to Less expensive to reduce to
acceptable levels—regulationacceptable levels—regulation CleanupCleanup
– Temporary bandageTemporary bandage– Only moves pollution to Only moves pollution to
another siteanother site– Expensive Expensive
Climate ChangeClimate Change
Population growth, Population growth, resource use, poverty, resource use, poverty, and loss of biological and loss of biological diversity contribute to diversity contribute to climate changeclimate change– Global warmingGlobal warming– Cycle continuesCycle continues
What the Earth Provides UsWhat the Earth Provides UsSun and Earth’s Natural CapitalSun and Earth’s Natural Capital
CapitalCapital—baseline wealth used —baseline wealth used to to sustainsustain (i.e. a business or (i.e. a business or life)life)
IncomeIncome----output derivedoutput derived from from an investment of capitalan investment of capital
All life and economies depend All life and economies depend on solar and natural capital.on solar and natural capital.
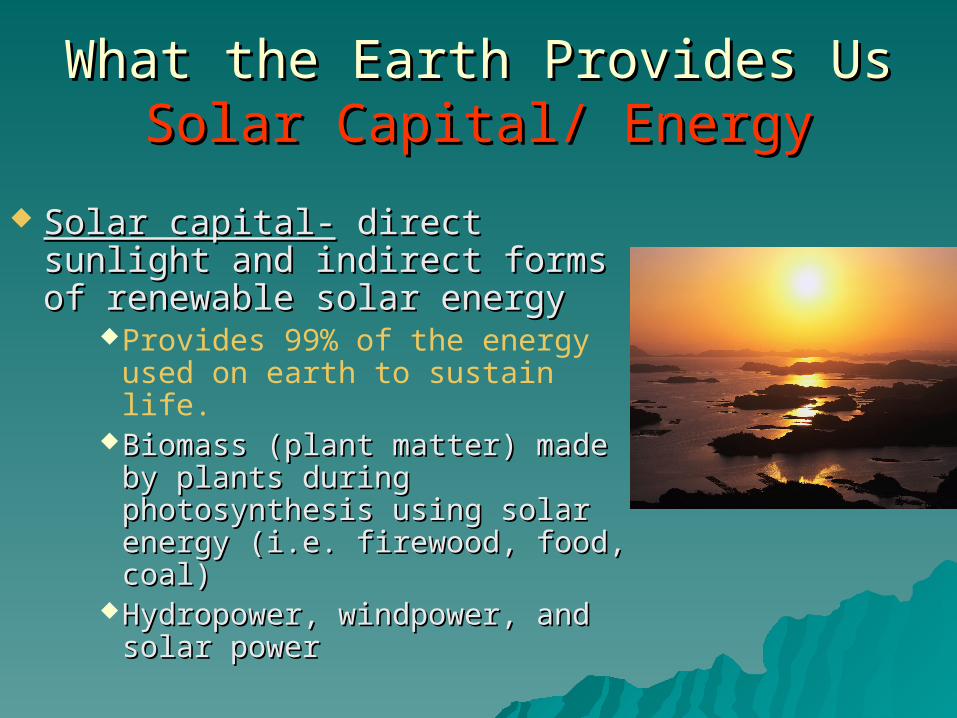
What the Earth Provides UsWhat the Earth Provides UsSolar Capital/ EnergySolar Capital/ Energy
Solar capital-Solar capital- direct sunlight direct sunlight and indirect forms of renewable and indirect forms of renewable solar energysolar energy
Provides 99% of the energy used on earth to sustain life.
Biomass (plant matter) made Biomass (plant matter) made by plants during photosynthesis by plants during photosynthesis using solar energy (i.e. using solar energy (i.e. firewood, food, coal)firewood, food, coal)
Hydropower, windpower, and Hydropower, windpower, and solar powersolar power
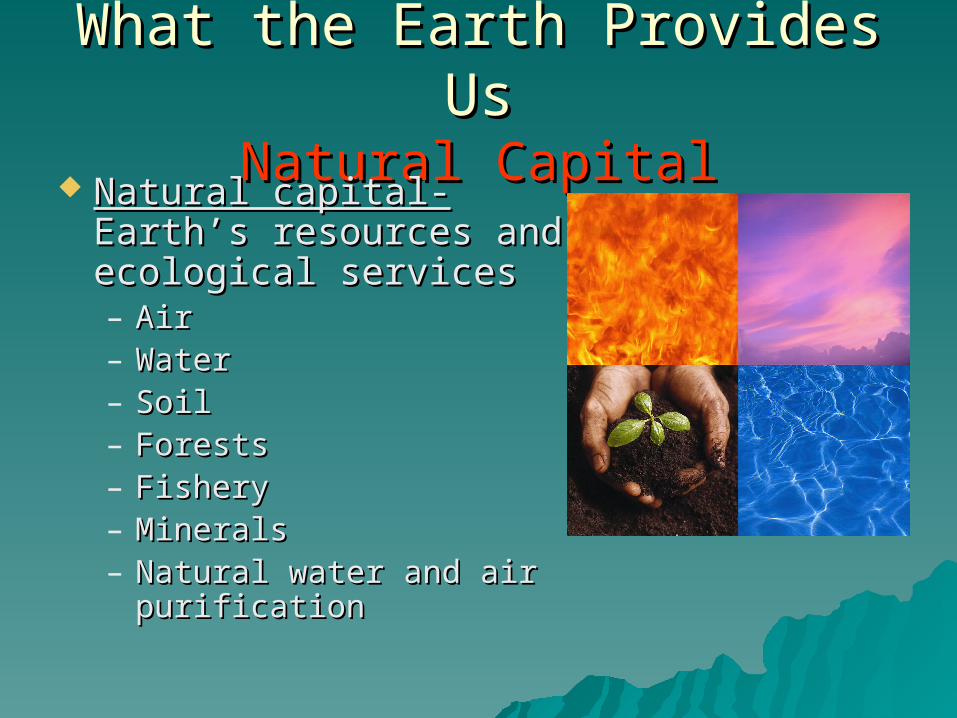
What the Earth Provides UsWhat the Earth Provides UsNatural CapitalNatural Capital
Natural capital-Natural capital- Earth’s Earth’s resources and ecological resources and ecological servicesservices– Air Air – WaterWater– SoilSoil– ForestsForests– Fishery Fishery – MineralsMinerals– Natural water and air Natural water and air
purificationpurification
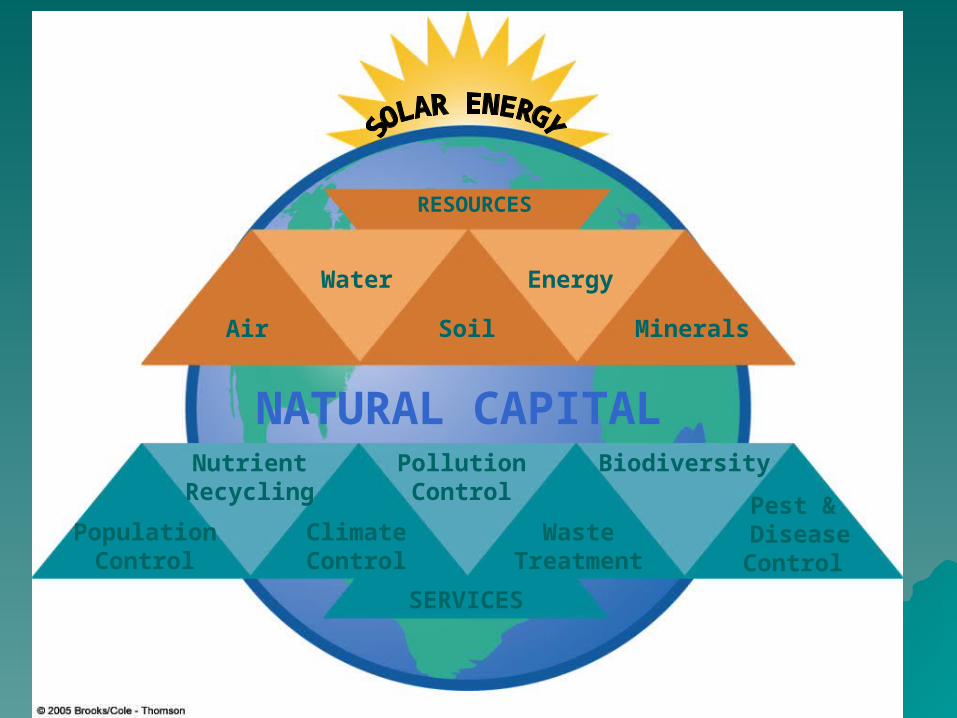
RESOURCES
Air
Water Energy
Soil Minerals
NATURAL CAPITAL
ClimateControl
WasteTreatment
Pest & DiseaseControl
PopulationControl
PollutionControl
BiodiversityNutrientRecycling
SERVICES
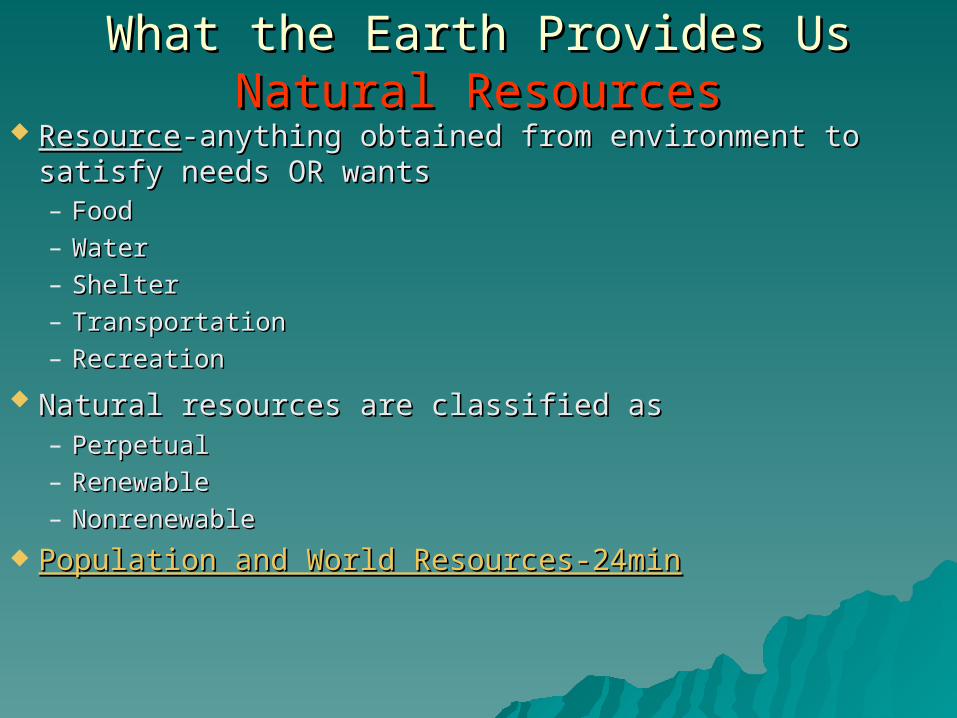
What the Earth Provides UsWhat the Earth Provides UsNatural ResourcesNatural Resources
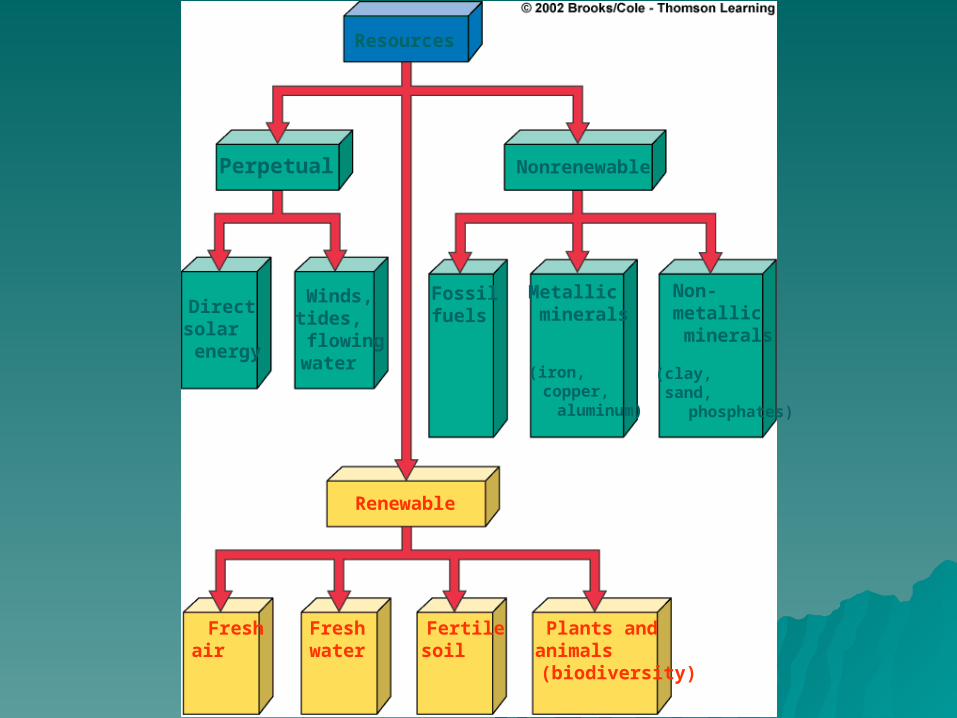
ResourceResource-anything obtained from environment to satisfy -anything obtained from environment to satisfy needs OR wantsneeds OR wants– FoodFood– Water Water – ShelterShelter– TransportationTransportation– RecreationRecreation
Natural resources are classified asNatural resources are classified as – Perpetual Perpetual – RenewableRenewable– NonrenewableNonrenewable
Population and World Resources-24minPopulation and World Resources-24min

Resources
Perpetual Nonrenewable
Renewable
Freshair
Freshwater
Fertilesoil
Plants andanimals
(biodiversity)
Directsolar
energy
Winds, tides,
flowing water
Fossilfuels
Metallic minerals
Non- metallic
minerals
(iron, copper,
aluminum)
(clay, sand,
phosphates)
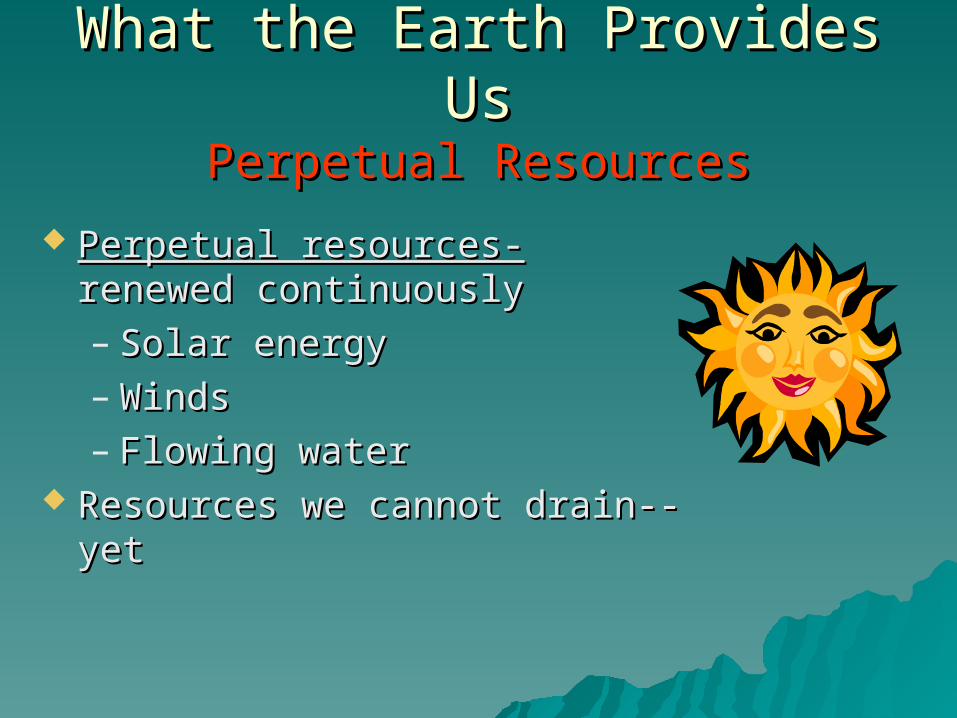
What the Earth Provides UsWhat the Earth Provides UsPerpetual ResourcesPerpetual Resources
Perpetual resources-Perpetual resources- renewed renewed continuouslycontinuously– Solar energySolar energy– WindsWinds– Flowing waterFlowing water
Resources we cannot drain--yetResources we cannot drain--yet
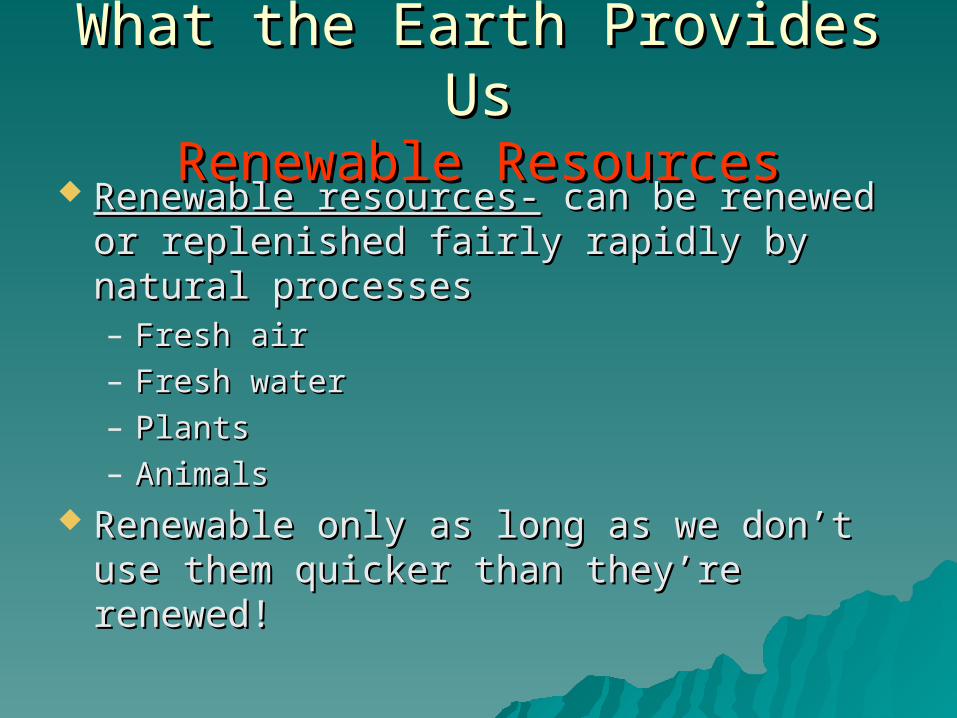
What the Earth Provides UsWhat the Earth Provides UsRenewable ResourcesRenewable Resources
Renewable resources-Renewable resources- can be renewed or can be renewed or replenished fairly rapidly by natural replenished fairly rapidly by natural processesprocesses– Fresh airFresh air– Fresh waterFresh water– PlantsPlants– AnimalsAnimals
Renewable only as long as we don’t use Renewable only as long as we don’t use them quicker than they’re renewed!them quicker than they’re renewed!
What the Earth Provides UsWhat the Earth Provides UsRenewable ResourcesRenewable Resources
Sustainable yieldSustainable yield -highest rate that a -highest rate that a renewable resource can be used renewable resource can be used indefinitelyindefinitely w/o reducing its available supply (capital)w/o reducing its available supply (capital)– LIVE OFF INCOME, NOT CAPITALLIVE OFF INCOME, NOT CAPITAL
Environmental degradationEnvironmental degradation –degrading –degrading environment in any wayenvironment in any way– i.e. using more than sustainable yield i.e. using more than sustainable yield
causing resource capital to shrink causing resource capital to shrink (degrading environment)(degrading environment)
– LIVING OFF INCOME LIVING OFF INCOME ANDAND CAPITAL CAPITAL
What the Earth Provides UsWhat the Earth Provides UsRenewable ResourcesRenewable Resources
““Tragedy of the Commons”Tragedy of the Commons” Garrett Hardin, 1968Garrett Hardin, 1968 Said we are exploiting and Said we are exploiting and
degrading publicly owned, degrading publicly owned, common resources.common resources.
Need to take no more than Need to take no more than sustainable yield.sustainable yield.
What the Earth Provides UsWhat the Earth Provides UsRenewable ResourcesRenewable Resources
Possible solutions to the tragedy? Possible solutions to the tragedy? – Limit accessLimit access– Reduce populationReduce population– Convert free access to privateConvert free access to private
Private owners environmentally Private owners environmentally conscientious?conscientious?
How do you make global resources (oceans How do you make global resources (oceans and air) private?and air) private?
Will restricted access foster lack of Will restricted access foster lack of appreciation for these resources?appreciation for these resources?

What the Earth Provides UsWhat the Earth Provides UsRenewable ResourcesRenewable Resources
Government has laws and treatises Government has laws and treatises that regulate access to commonly that regulate access to commonly owned resourcesowned resources– Hunting licensesHunting licenses– Fishing licensesFishing licenses– National Park rules and regulationsNational Park rules and regulations– IDEM standardsIDEM standards
What the Earth Provides UsWhat the Earth Provides UsRenewable ResourcesRenewable Resources
Ecological footprint-Ecological footprint- amt of biologically amt of biologically productive land and water needed to productive land and water needed to supply us with the renewable resources supply us with the renewable resources we use and absorb or dispose of our we use and absorb or dispose of our wastewaste
How much of Earth’s natural capital and How much of Earth’s natural capital and biological income we use biological income we use
EVERYTHING we do leaves an effect our EVERYTHING we do leaves an effect our environment—our footprintenvironment—our footprint
Renewable resources are being depleted Renewable resources are being depleted and degraded to support our lifestylesand degraded to support our lifestyles
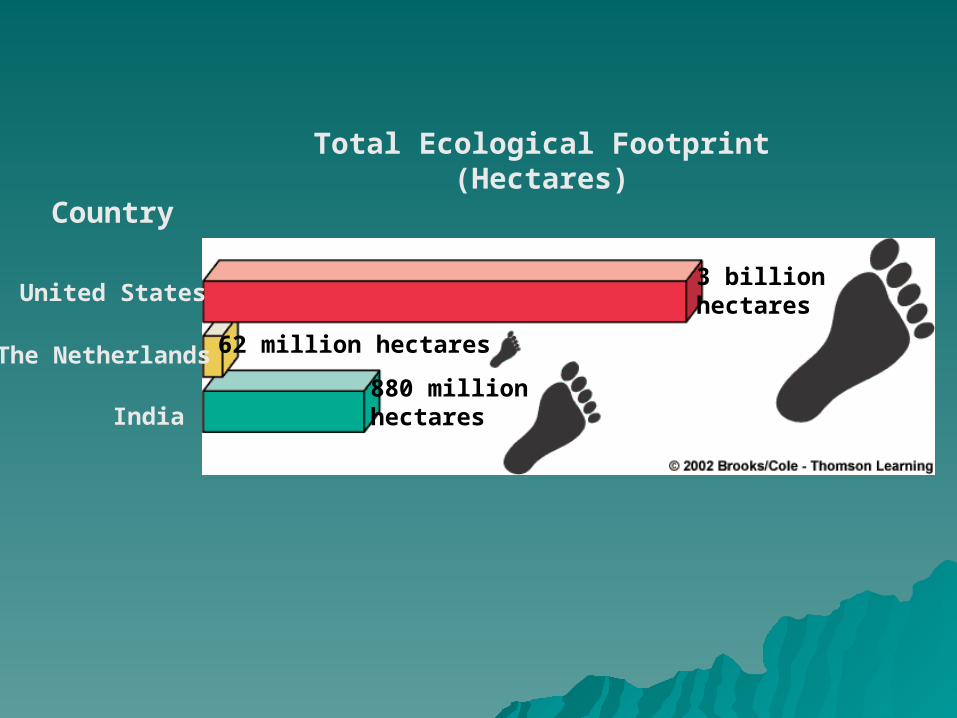
Country
Total Ecological Footprint(Hectares)
United States
The Netherlands
India
3 billionhectares
62 million hectares
880 millionhectares

What the Earth Provides UsWhat the Earth Provides UsRenewable ResourcesRenewable Resources
Per capita-Per capita- per person per person Per capita ecological footprintPer capita ecological footprint==
total footprint/total populationtotal footprint/total population– Humanity’s per capita ecological footprint exceeds Humanity’s per capita ecological footprint exceeds
Earth’s biological capacity by 15%Earth’s biological capacity by 15%– We are exceeding sustainable yield and dipping into We are exceeding sustainable yield and dipping into
our capitalour capital– i.e. country has 1,000,000 hectares of ecological i.e. country has 1,000,000 hectares of ecological
footprint and 100,000 people:footprint and 100,000 people:1,000,000 ha/ 100,000 people = 10 ha/person1,000,000 ha/ 100,000 people = 10 ha/person
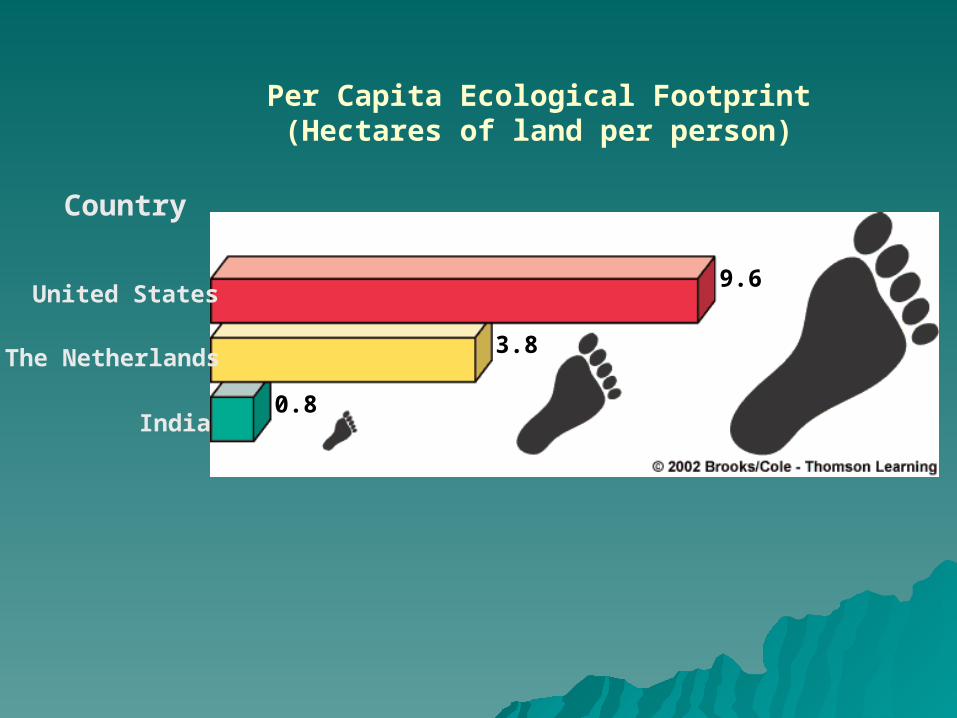
United States
The Netherlands
India
Country
Per Capita Ecological Footprint(Hectares of land per person)
9.6
3.8
0.8

1961 1965 1970 1975 1980 1985 1990 1995 2000
Humanity’s Ecological Footprint
Earth’s Ecological Capacity
Nu
mb
er
of
Ea
rth
’s
0. 2
. 4. 6
. 81.
01.
21.
4
2005

What the Earth Provides UsWhat the Earth Provides UsNonrenewable ResourcesNonrenewable Resources
Nonrenewable resources-Nonrenewable resources- those we can those we can depletedeplete fixed quantity fixed quantity
Energy resourcesEnergy resources– Gas, CoalGas, Coal
Metallic mineral resourcesMetallic mineral resources– Iron, CopperIron, Copper
Nonmetallic mineral resourcesNonmetallic mineral resources– Salt, claySalt, clay
– **These nonrenewables are **These nonrenewables are economically depletedeconomically depleted when it costs too when it costs too much to obtain what is leftmuch to obtain what is left
Resources
Perpetual Nonrenewable
Renewable
Freshair
Freshwater
Fertilesoil
Plants andanimals
(biodiversity)
Directsolar
energy
Winds, tides,
flowing water
Fossilfuels
Metallic minerals
Non- metallic
minerals
(iron, copper,
aluminum)
(clay, sand,
phosphates)

Time
Res
ou
rce
pro
du
ctio
n Area under curveequals the totalamount of the
resource.Economic depletion
(80% used up)
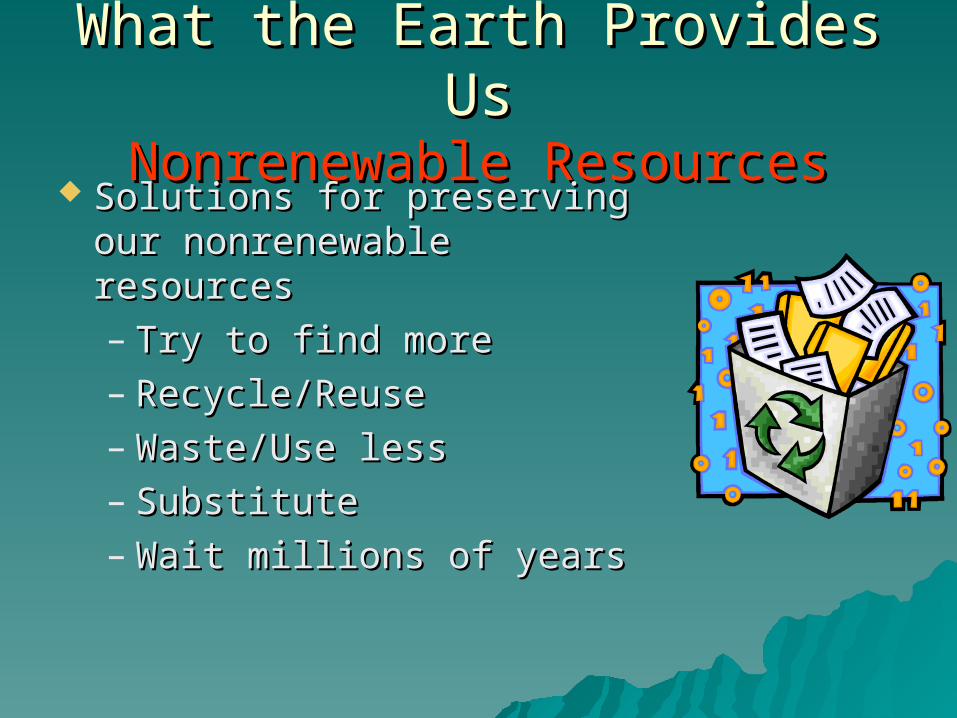
What the Earth Provides UsWhat the Earth Provides UsNonrenewable ResourcesNonrenewable Resources
Solutions for preserving our Solutions for preserving our nonrenewable resourcesnonrenewable resources– Try to find moreTry to find more– Recycle/ReuseRecycle/Reuse– Waste/Use lessWaste/Use less– SubstituteSubstitute– Wait millions of yearsWait millions of years
Economic GrowthEconomic Growth Economic growth-Economic growth- an an ↑↑ in the capacity of a in the capacity of a
country to providecountry to provide people with goods and people with goods and services neededservices needed– Measured by change in country’s: Measured by change in country’s:
GDP (Gross Domestic Product)-GDP (Gross Domestic Product)- annual market annual market value in $ of all goods and services produced value in $ of all goods and services produced WITHIN a countryWITHIN a country
GNP (Gross National Product)-GNP (Gross National Product)- annual market annual market value in $ of all goods and services produced by a value in $ of all goods and services produced by a country’s businesses THROUGHOUT THE WORLDcountry’s businesses THROUGHOUT THE WORLD
Economic GrowthEconomic Growth
Country’s standard (quality) of living Country’s standard (quality) of living gauged by gauged by – Per capita GDPPer capita GDP= GDP/country’s = GDP/country’s
populationpopulation– Per capita GNPPer capita GNP = GNP/country’s = GNP/country’s
populationpopulation Countries with larger populations Countries with larger populations
have to spread the wealth thinnerhave to spread the wealth thinnerLower per capita GDPLower per capita GDP lower lower
standard of livingstandard of livingChinaChina
Economic DevelopmentEconomic Development Economic development-Economic development- improving living improving living
standards by economic growthstandards by economic growth UN classifies countries as economically UN classifies countries as economically
developeddeveloped or or developingdeveloping based on Human based on Human Development Index (HDI):Development Index (HDI):– Standard of living (per capita GDP)Standard of living (per capita GDP)– Life expectancyLife expectancy– LiteracyLiteracy
What country is #1?What country is #1? HDI ListHDI List
Economic DevelopmentEconomic Development
Developed (MDC): US, Canada, Japan, etc.Developed (MDC): US, Canada, Japan, etc.– High life expectancy, literacy, industrialization High life expectancy, literacy, industrialization
and per capita GDPand per capita GDP Developing (LDC): Africa, Asia, Latin Developing (LDC): Africa, Asia, Latin
America, IndiaAmerica, India– Lower life expectancy, literacy, Lower life expectancy, literacy,
industrialization and per capita GDPindustrialization and per capita GDP– 97% of world’s projected 97% of world’s projected ↑↑ in population is in population is
expected to take place in these countriesexpected to take place in these countries
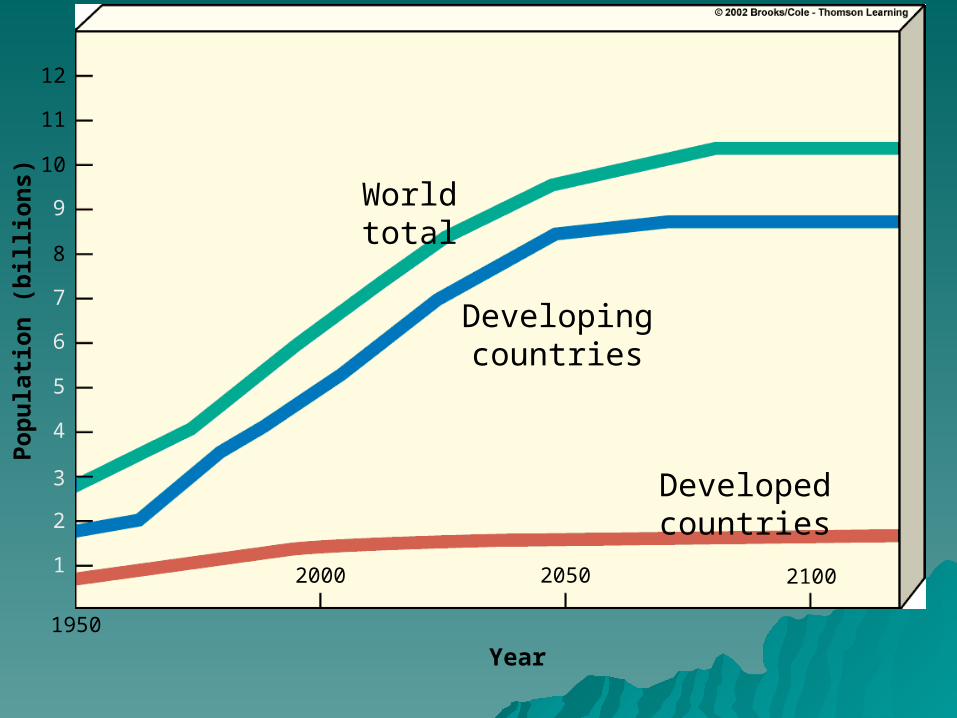
World total
Developingcountries
Developedcountries
Po
pu
lati
on
(b
illi
on
s)
12
11
10
9
8
7
6
5
4
3
2
1
1950
2000 2050 2100
Year
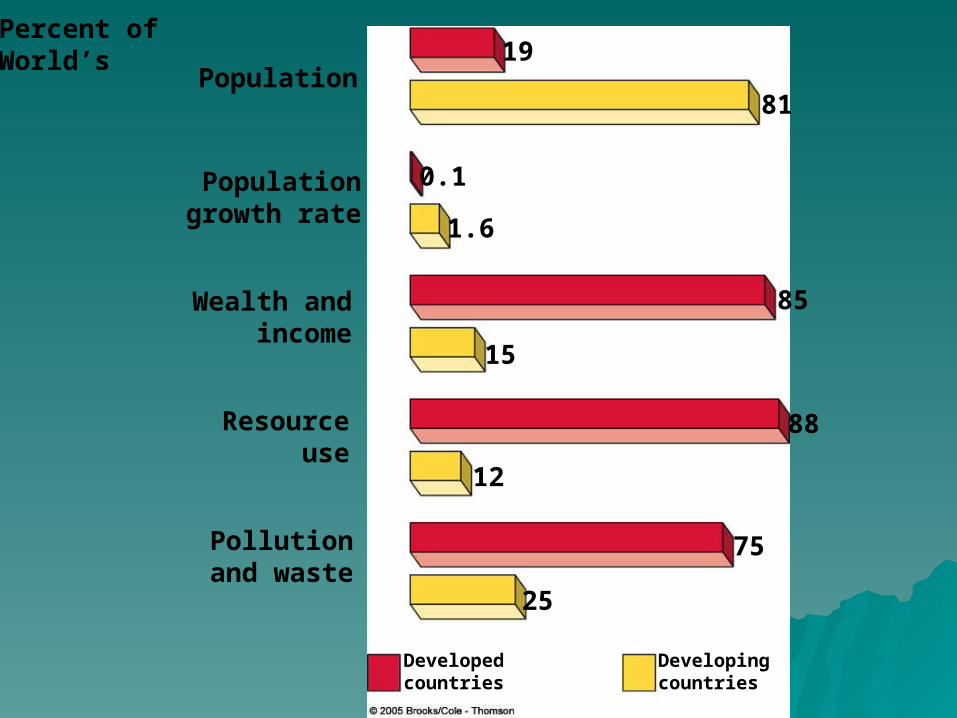
Percent of World’s
Developingcountries
Developedcountries
Population
Populationgrowth rate
Wealth andincome
Resourceuse
Pollutionand waste
19
81
0.1
1.6
85
15
88
12
75
25

Economic Development
Trade-Offs
Good News Bad News
Global life expectancy doubled since 1950
Life expectancy 11 years less in developing countries than in developed countries
Food production ahead of population growth since 1978
Harmful environmental effects of agriculture may limit future food production
Infant mortality cut in half since 1955
Air and water pollution down in most developed countries since 1970
Number of people living in poverty dropped 6% since 1990
Infant mortality rate in developing countries over 8 times higher than in developed countries
Air and water pollution levels in most developing countries too high
Half of world’s people trying to live on less than $3 (U.S.) per day

GlobalizationGlobalization Globalization-Globalization- process of social, process of social,
economic and environmental economic and environmental changes that lead to increasedchanges that lead to increased
interconnectedness throughout interconnectedness throughout worldworld– Information (internet)Information (internet)– International tradingInternational trading– TechnologyTechnology– Human mobilityHuman mobility
**One country can’t be **One country can’t be environmentally sustainable environmentally sustainable without the others!!without the others!!

Environmental and Resource ProblemsEnvironmental and Resource ProblemsThe Big Five CausesThe Big Five Causes
Major causes of problemsMajor causes of problems
1. Population growth1. Population growth
2. Wasteful resource use2. Wasteful resource use
3. Poverty3. Poverty
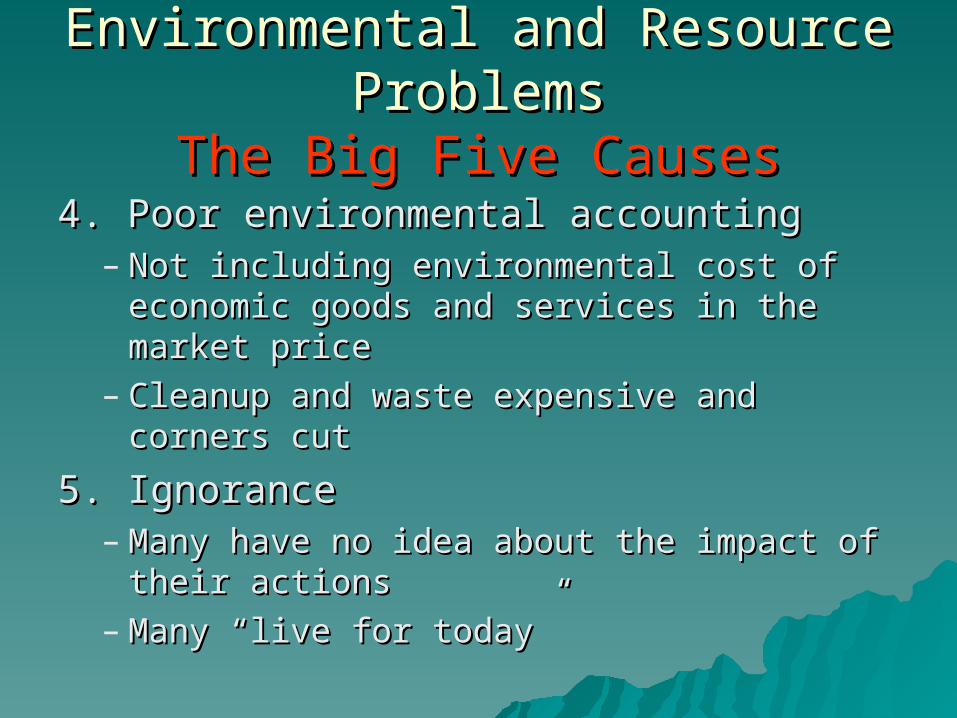
4. Poor environmental 4. Poor environmental accountingaccounting
5. Ecological and 5. Ecological and environmental ignoranceenvironmental ignorance
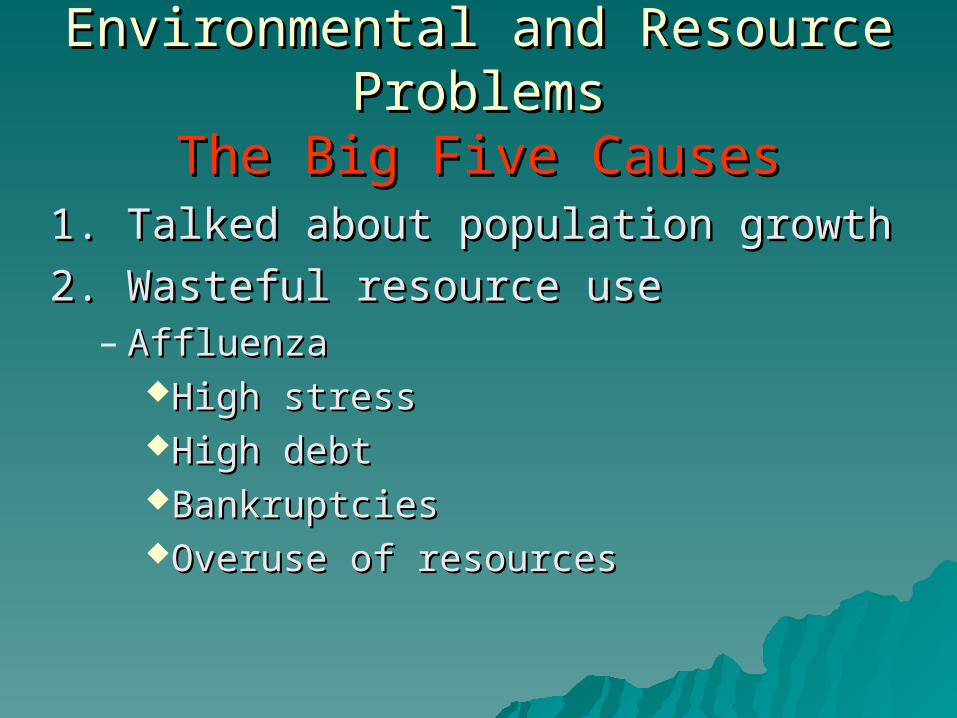
Environmental and Resource ProblemsEnvironmental and Resource ProblemsThe Big Five CausesThe Big Five Causes
1. Talked about population growth 1. Talked about population growth
2. Wasteful resource use2. Wasteful resource use– AffluenzaAffluenza
High stressHigh stressHigh debtHigh debtBankruptciesBankruptciesOveruse of resourcesOveruse of resources
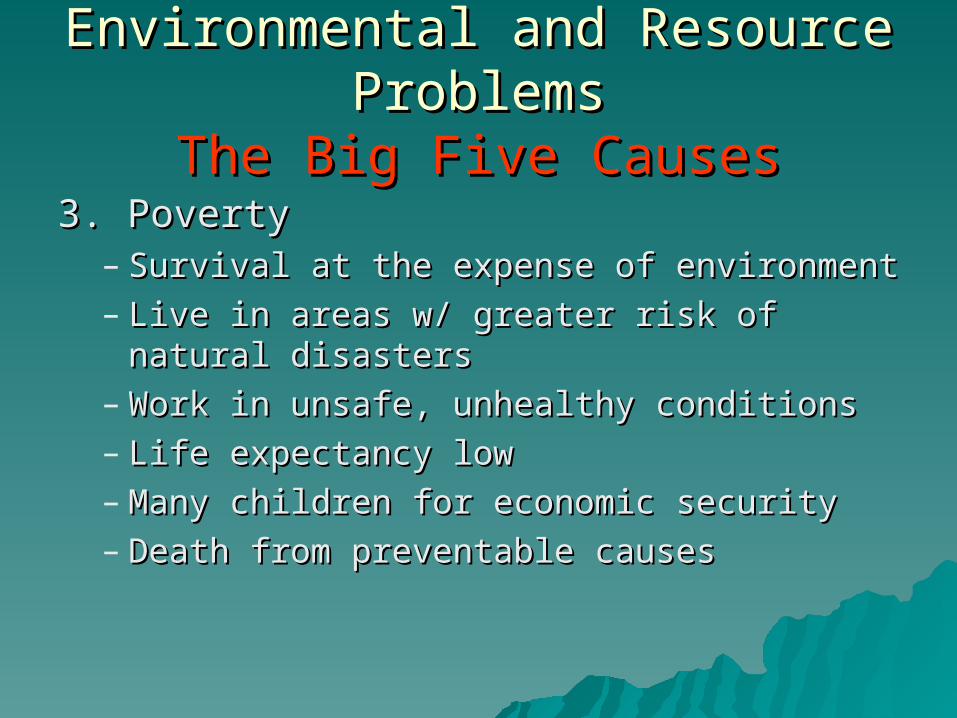
Environmental and Resource ProblemsEnvironmental and Resource ProblemsThe Big Five CausesThe Big Five Causes
3. Poverty3. Poverty– Survival at the expense of environmentSurvival at the expense of environment– Live in areas w/ greater risk of natural Live in areas w/ greater risk of natural
disastersdisasters– Work in unsafe, unhealthy conditionsWork in unsafe, unhealthy conditions– Life expectancy lowLife expectancy low– Many children for economic securityMany children for economic security– Death from preventable causesDeath from preventable causes
Environmental and Resource ProblemsEnvironmental and Resource ProblemsThe Big Five CausesThe Big Five Causes
4. Poor environmental accounting4. Poor environmental accounting– Not including environmental cost of Not including environmental cost of
economic goods and services in the market economic goods and services in the market priceprice
– Cleanup and waste expensive and corners Cleanup and waste expensive and corners cutcut
5. Ignorance5. Ignorance– Many have no idea about the impact of Many have no idea about the impact of
their actionstheir actions– Many “live for today”Many “live for today”
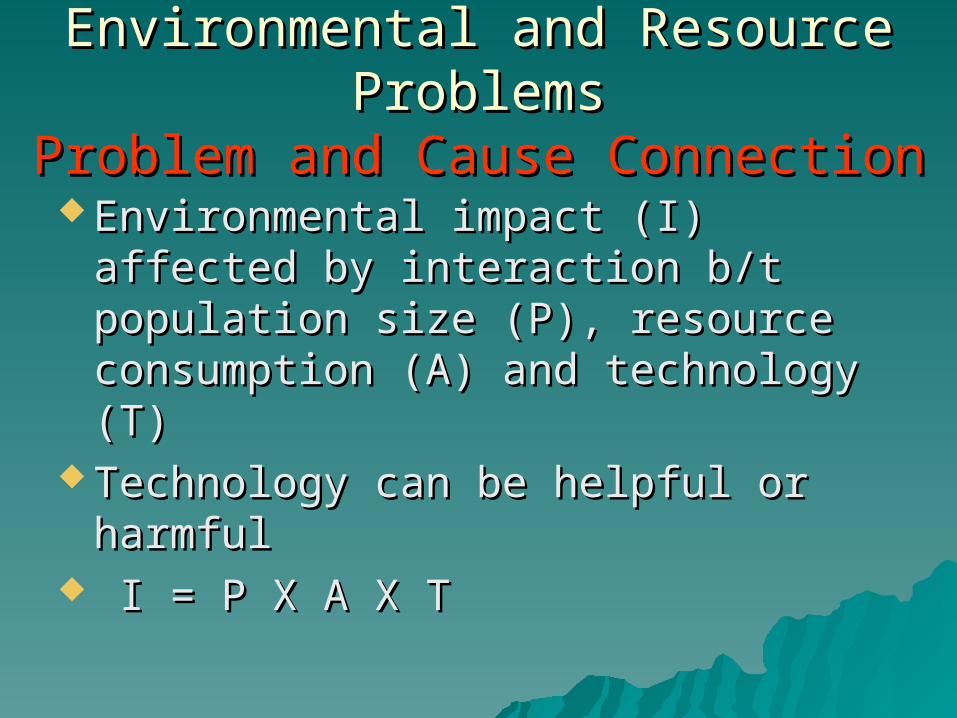
Environmental and Resource ProblemsEnvironmental and Resource ProblemsProblem and Cause ConnectionProblem and Cause Connection
Environmental impact (I) affected by Environmental impact (I) affected by interaction b/t population size (P), interaction b/t population size (P), resource consumption (A) and resource consumption (A) and technology (T)technology (T)
Technology can be helpful or harmfulTechnology can be helpful or harmful I = P X A X TI = P X A X T
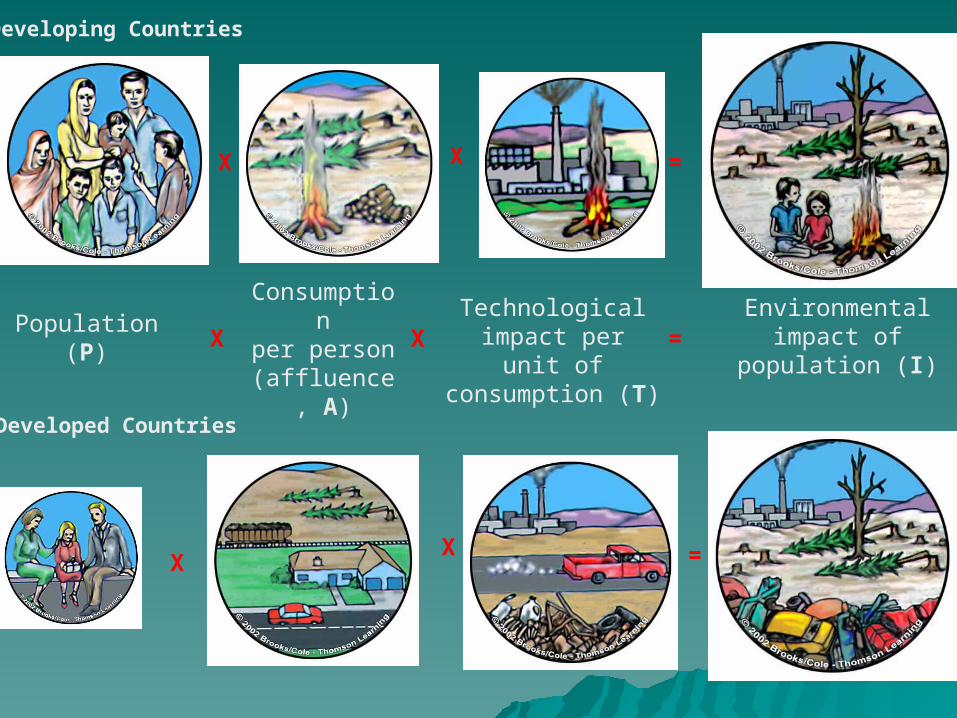
Developing Countries
Population (P)Consumptionper person
(affluence, A)
Technological impact per
unit of consumption (T)
Environmentalimpact of population
(I)
Developed Countries
X
XX
XX
X =
=
=

Living More SustainablyLiving More SustainablyTwo School of Thought on How It’s Two School of Thought on How It’s
DoneDone Environmentalists:Environmentalists:
– Eliminate waste and stop depletion and Eliminate waste and stop depletion and degradation to sustain our capitaldegradation to sustain our capital
Others:Others:– Say environmentalist are exaggerating Say environmentalist are exaggerating
and/or it is a hoaxand/or it is a hoax– Man can overcome problems w/ Man can overcome problems w/
ingenuity, economic growth, and ingenuity, economic growth, and technologytechnology
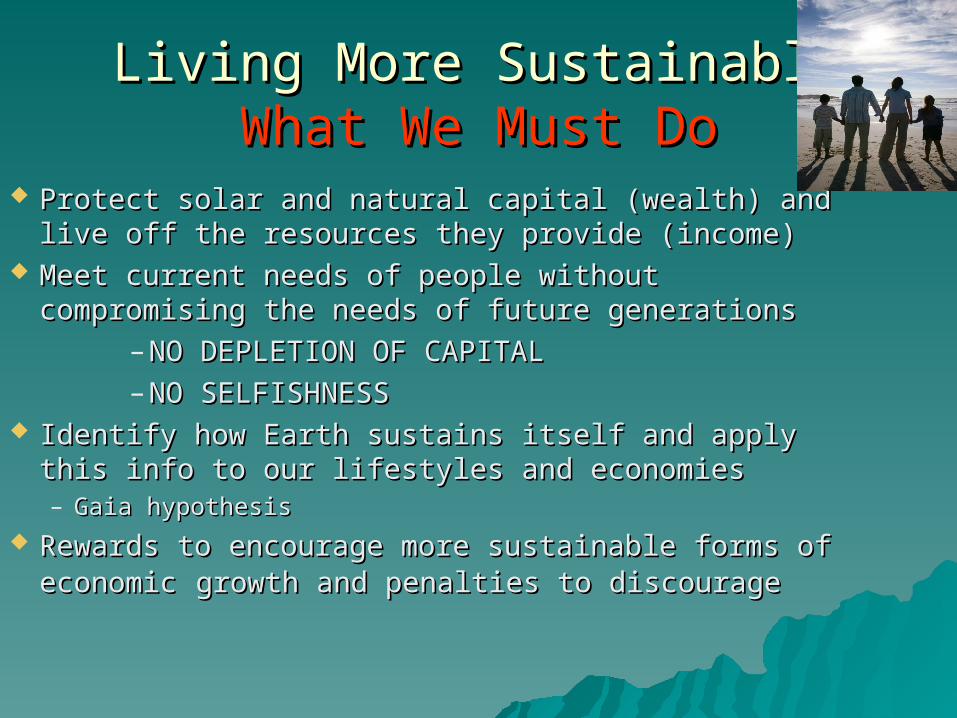
Living More SustainableLiving More SustainableWhat We Must DoWhat We Must Do
Protect solar and natural capital (wealth) and live Protect solar and natural capital (wealth) and live off the resources they provide (income)off the resources they provide (income)
Meet current needs of people without Meet current needs of people without compromising the needs of future generationscompromising the needs of future generations
– NO DEPLETION OF CAPITALNO DEPLETION OF CAPITAL– NO SELFISHNESSNO SELFISHNESS
Identify how Earth sustains itself and apply this Identify how Earth sustains itself and apply this info to our lifestyles and economiesinfo to our lifestyles and economies– Gaia hypothesisGaia hypothesis
Rewards to encourage more sustainable forms of Rewards to encourage more sustainable forms of economiceconomic growth and penalties to discourage growth and penalties to discourage
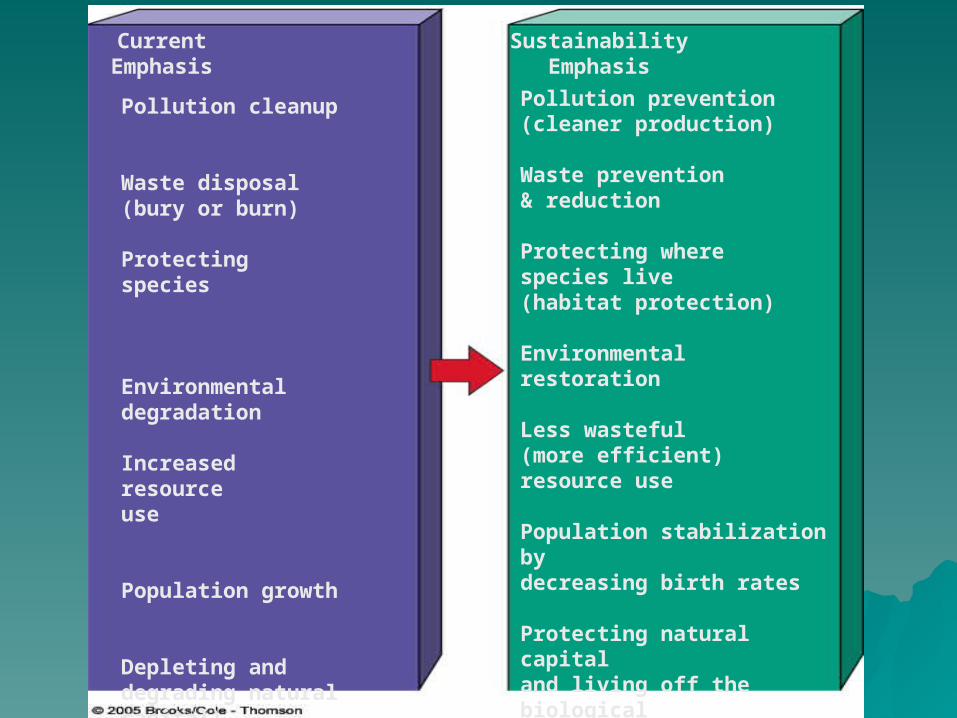
CurrentEmphasis
SustainabilityEmphasis
Pollution cleanup
Waste disposal(bury or burn)
Protecting species
Environmentaldegradation
Increased resourceuse
Population growth
Depleting anddegrading naturalcapital)
Pollution prevention(cleaner production)
Waste prevention& reduction
Protecting wherespecies live(habitat protection)
Environmentalrestoration
Less wasteful (more efficient)resource use
Population stabilization bydecreasing birth rates
Protecting natural capitaland living off the biological interest it provides
Is Our Present Course Is Our Present Course Sustainable?Sustainable?
Guidelines for the EarthGuidelines for the Earth Never leave it worse than you Never leave it worse than you
found itfound it Take only what you needTake only what you need Sustain diverse living organismsSustain diverse living organisms Maintains Earth’s capacity for Maintains Earth’s capacity for
self-repair self-repair Don’t wasteDon’t waste Don’t polluteDon’t pollute Decrease populationDecrease population