APEC Energy Handbook 2017 - EGEDA [Expert Group Energy ...
92
Transcript of APEC Energy Handbook 2017 - EGEDA [Expert Group Energy ...
–––––––––––––––––––––––––––––––––––––– Preface
–––––––––––––––––––––––––––––––––––––– The APEC Energy Handbook 2017 is a handy, pocket-sized summary of key energy data and a supplement to APEC Energy Statistics 2017, which was released in March 2020. This handbook consists of the following sections:
1. Primary Energy Supply2. Transformation3. Final Energy Consumption4. Energy Balances5. Energy Outlook6. Energy Indicators
The supply section contains total primary energy supply by energy while the transformation section shows oil refining and power generation. The consumption section indicates both final energy consumption by sectors and by energy. The energy balances section includes regional energy balance tables while the outlook section shows projected energy demand until year 2050 taken from the APEC Energy Demand and Supply Outlook 7th Edition published by the Asia Pacific Energy Research Centre in May 2019. The energy indicators section contains several energy indicators based on population, GDP and energy consumption. This handbook was derived from the APEC Energy Database, the purpose of which is to establish a comprehensive and consistent energy database within the APEC region. This database aims to assist in the identification of significant trends in energy supply and demand consistent with projects and priorities under the APEC Energy Working Group. It has been prepared in close cooperation with the twenty-one member economies. Inquiries about figures and graphs in this handbook could be addressed to:
Energy Statistics and Training Office Asia Pacific Energy Research Centre Address: 13-1, Kachidoki 1, Chuo-ku, Tokyo 104-0054, Japan Telephone: +81 3 5144 8551; Facsimile: +81 3 5144 8555 Email: [email protected] Website: https://www.egeda.ewg.apec.org/
Prepared by Energy Statistics and Training Office Asia Pacific Energy Research Centre (APERC) Inui bldg., Kachidoki, 1-13-1, Kachidoki, Chuo-ku, Tokyo, 104-0054, Japan Phone: (81) 3 5144 8551 Facsimile: (81) 3 5144 8555 E-mail: [email protected] Website: https://www.egeda.ewg.apec.org/ For Asia-Pacific Economic Cooperation Secretariat 35 Heng Mui Keng Terrace Singapore 119616 Phone: (65) 6891 9600 Facsimile: (65) 6891 9690 E-mail: [email protected] Website: www.apec.org Copyright (c) 2020 APEC Secretariat APEC#220-RE-03.1 ISSN 0219-7634

–––––––––––––––––––––––––––––––––––––– Table of Contents
––––––––––––––––––––––––––––––––––––––
Primary Energy Supply ................................... 2
Transformation .............................................. 24
Final Energy Consumption ........................... 30
Energy Balances ............................................. 54
Energy Outlook .............................................. 76
Energy Indicators .......................................... 78
Glossary .......................................................... 84

APEC ENERGY HANDBOOK 2017 3
Primary Energy Supply
–––––––––––––––––––––––––––––––––––––– Total primary energy supply by region
APEC ––––––––––––––––––––––––––––––––––––––
1 0002 0003 0004 0005 0006 0007 0008 0009 000
1990
1991
1992
1993
1994
1995
1996
1997
1998
1999
2000
2001
2002
2003
2004
2005
2006
2007
2008
2009
2010
2011
2012
2013
2014
2015
2016
2017
Mtoe
Other north-east Asia South East Asia Oceania Other Americas
China Russia United States
Mtoe1990 1995 2000 2005 2010 2017
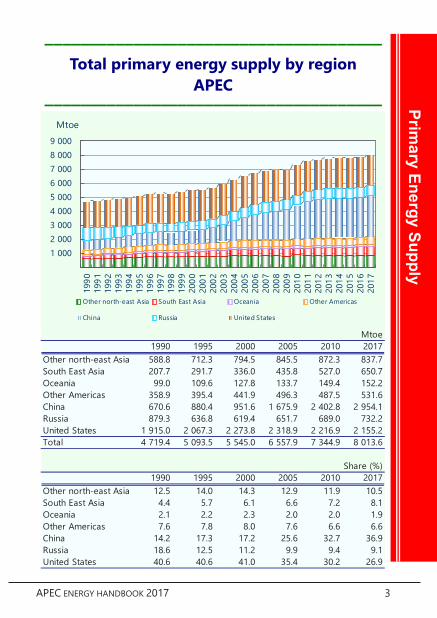
Other north-east Asia 588.8 712.3 794.5 845.5 872.3 837.7South East Asia 207.7 291.7 336.0 435.8 527.0 650.7Oceania 99.0 109.6 127.8 133.7 149.4 152.2Other Americas 358.9 395.4 441.9 496.3 487.5 531.6China 670.6 880.4 951.6 1 675.9 2 402.8 2 954.1Russia 879.3 636.8 619.4 651.7 689.0 732.2United States 1 915.0 2 067.3 2 273.8 2 318.9 2 216.9 2 155.2Total 4 719.4 5 093.5 5 545.0 6 557.9 7 344.9 8 013.6
Share (%)1990 1995 2000 2005 2010 2017
Other north-east Asia 12.5 14.0 14.3 12.9 11.9 10.5South East Asia 4.4 5.7 6.1 6.6 7.2 8.1Oceania 2.1 2.2 2.3 2.0 2.0 1.9Other Americas 7.6 7.8 8.0 7.6 6.6 6.6China 14.2 17.3 17.2 25.6 32.7 36.9Russia 18.6 12.5 11.2 9.9 9.4 9.1United States 40.6 40.6 41.0 35.4 30.2 26.9
APEC ENERGY HANDBOOK 2017 2
Prim
ary
Ener
gy S
uppl
y ––––––––––––––––––––––––––––––––––––––
Total primary energy supply by energy APEC
––––––––––––––––––––––––––––––––––––––
1 0002 0003 0004 0005 0006 0007 0008 0009 000
1990
1991
1992
1993
1994
1995
1996
1997
1998
1999
2000
2001
2002
2003
2004
2005
2006
2007
2008
2009
2010
2011
2012
2013
2014
2015
2016
2017
Mtoe
Coal Oil Gas Nuclear Hydro Others
Mtoe1990 1995 2000 2005 2010 2017
Coal 1 381.4 1 510.9 1 620.3 2 272.0 2 787.0 2 810.0Oil 1 762.3 1 830.3 1 990.2 2 195.0 2 166.3 2 352.5Gas 997.1 1 076.6 1 196.8 1 269.6 1 472.1 1 763.5Nuclear 285.9 345.9 390.1 419.2 432.4 418.8Hydro 92.1 107.3 107.5 124.9 153.1 209.5Others 200.5 222.5 240.0 277.2 334.0 459.4Total 4 719.4 5 093.5 5 545.0 6 557.9 7 344.9 8 013.6
Share (%)1990 1995 2000 2005 2010 2017
Coal 29.3 29.7 29.2 34.6 37.9 35.1Oil 37.3 35.9 35.9 33.5 29.5 29.4Gas 21.1 21.1 21.6 19.4 20.0 22.0Nuclear 6.1 6.8 7.0 6.4 5.9 5.2Hydro 2.0 2.1 1.9 1.9 2.1 2.6Others 4.2 4.4 4.3 4.2 4.5 5.7
APEC ENERGY HANDBOOK 2017 3
Primary Energy Supply
–––––––––––––––––––––––––––––––––––––– Total primary energy supply by region
APEC ––––––––––––––––––––––––––––––––––––––
1 0002 0003 0004 0005 0006 0007 0008 0009 000
1990
1991
1992
1993
1994
1995
1996
1997
1998
1999
2000
2001
2002
2003
2004
2005
2006
2007
2008
2009
2010
2011
2012
2013
2014
2015
2016
2017
Mtoe
Other north-east Asia South East Asia Oceania Other Americas
China Russia United States
Mtoe1990 1995 2000 2005 2010 2017
Other north-east Asia 588.8 712.3 794.5 845.5 872.3 837.7South East Asia 207.7 291.7 336.0 435.8 527.0 650.7Oceania 99.0 109.6 127.8 133.7 149.4 152.2Other Americas 358.9 395.4 441.9 496.3 487.5 531.6China 670.6 880.4 951.6 1 675.9 2 402.8 2 954.1Russia 879.3 636.8 619.4 651.7 689.0 732.2United States 1 915.0 2 067.3 2 273.8 2 318.9 2 216.9 2 155.2Total 4 719.4 5 093.5 5 545.0 6 557.9 7 344.9 8 013.6
Share (%)1990 1995 2000 2005 2010 2017
Other north-east Asia 12.5 14.0 14.3 12.9 11.9 10.5South East Asia 4.4 5.7 6.1 6.6 7.2 8.1Oceania 2.1 2.2 2.3 2.0 2.0 1.9Other Americas 7.6 7.8 8.0 7.6 6.6 6.6China 14.2 17.3 17.2 25.6 32.7 36.9Russia 18.6 12.5 11.2 9.9 9.4 9.1United States 40.6 40.6 41.0 35.4 30.2 26.9
APEC ENERGY HANDBOOK 2017 2
Prim
ary
Ener
gy S
uppl
y
–––––––––––––––––––––––––––––––––––––– Total primary energy supply by energy
APEC ––––––––––––––––––––––––––––––––––––––
1 0002 0003 0004 0005 0006 0007 0008 0009 000
1990
1991
1992
1993
1994
1995
1996
1997
1998
1999
2000
2001
2002
2003
2004
2005
2006
2007
2008
2009
2010
2011
2012
2013
2014
2015
2016
2017
Mtoe
Coal Oil Gas Nuclear Hydro Others
Mtoe1990 1995 2000 2005 2010 2017
Coal 1 381.4 1 510.9 1 620.3 2 272.0 2 787.0 2 810.0Oil 1 762.3 1 830.3 1 990.2 2 195.0 2 166.3 2 352.5Gas 997.1 1 076.6 1 196.8 1 269.6 1 472.1 1 763.5Nuclear 285.9 345.9 390.1 419.2 432.4 418.8Hydro 92.1 107.3 107.5 124.9 153.1 209.5Others 200.5 222.5 240.0 277.2 334.0 459.4Total 4 719.4 5 093.5 5 545.0 6 557.9 7 344.9 8 013.6
Share (%)1990 1995 2000 2005 2010 2017
Coal 29.3 29.7 29.2 34.6 37.9 35.1Oil 37.3 35.9 35.9 33.5 29.5 29.4Gas 21.1 21.1 21.6 19.4 20.0 22.0Nuclear 6.1 6.8 7.0 6.4 5.9 5.2Hydro 2.0 2.1 1.9 1.9 2.1 2.6Others 4.2 4.4 4.3 4.2 4.5 5.7
APEC ENERGY HANDBOOK 2017 5
Primary Energy Supply
–––––––––––––––––––––––––––––––––––––– Total primary energy supply by energy
Japan ––––––––––––––––––––––––––––––––––––––
0
100
200
300
400
500
600
1990
1991
1992
1993
1994
1995
1996
1997
1998
1999
2000
2001
2002
2003
2004
2005
2006
2007
2008
2009
2010
2011
2012
2013
2014
2015
2016
2017
Mtoe
Coal Oil Gas Nuclear Hydro Others
Mtoe1990 1995 2000 2005 2010 2017
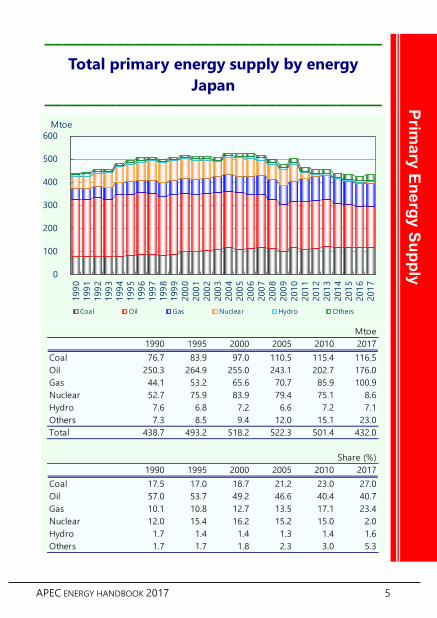
Coal 76.7 83.9 97.0 110.5 115.4 116.5Oil 250.3 264.9 255.0 243.1 202.7 176.0Gas 44.1 53.2 65.6 70.7 85.9 100.9Nuclear 52.7 75.9 83.9 79.4 75.1 8.6Hydro 7.6 6.8 7.2 6.6 7.2 7.1Others 7.3 8.5 9.4 12.0 15.1 23.0Total 438.7 493.2 518.2 522.3 501.4 432.0
Share (%)1990 1995 2000 2005 2010 2017
Coal 17.5 17.0 18.7 21.2 23.0 27.0Oil 57.0 53.7 49.2 46.6 40.4 40.7Gas 10.1 10.8 12.7 13.5 17.1 23.4Nuclear 12.0 15.4 16.2 15.2 15.0 2.0Hydro 1.7 1.4 1.4 1.3 1.4 1.6Others 1.7 1.7 1.8 2.3 3.0 5.3
APEC ENERGY HANDBOOK 2017 4
Prim
ary
Ener
gy S
uppl
y ––––––––––––––––––––––––––––––––––––––
Total primary energy supply by energy China
––––––––––––––––––––––––––––––––––––––
500
1 000
1 500
2 000
2 500
3 000
3 500
1990
1991
1992
1993
1994
1995
1996
1997
1998
1999
2000
2001
2002
2003
2004
2005
2006
2007
2008
2009
2010
2011
2012
2013
2014
2015
2016
2017
Mtoe
Coal Oil Gas Nuclear Hydro Others
Mtoe1990 1995 2000 2005 2010 2017
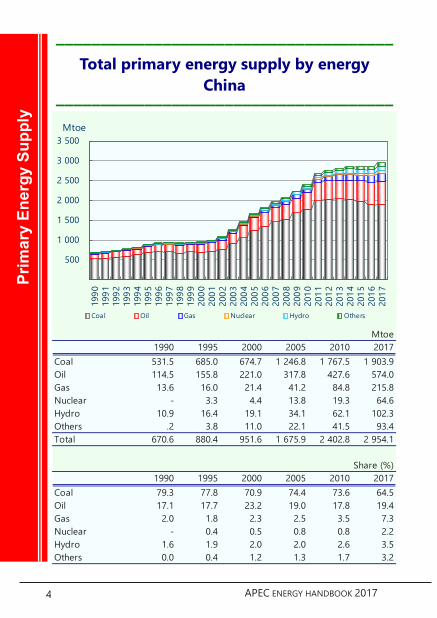
Coal 531.5 685.0 674.7 1 246.8 1 767.5 1 903.9Oil 114.5 155.8 221.0 317.8 427.6 574.0Gas 13.6 16.0 21.4 41.2 84.8 215.8Nuclear - 3.3 4.4 13.8 19.3 64.6Hydro 10.9 16.4 19.1 34.1 62.1 102.3Others .2 3.8 11.0 22.1 41.5 93.4Total 670.6 880.4 951.6 1 675.9 2 402.8 2 954.1
Share (%)1990 1995 2000 2005 2010 2017
Coal 79.3 77.8 70.9 74.4 73.6 64.5Oil 17.1 17.7 23.2 19.0 17.8 19.4Gas 2.0 1.8 2.3 2.5 3.5 7.3Nuclear - 0.4 0.5 0.8 0.8 2.2Hydro 1.6 1.9 2.0 2.0 2.6 3.5Others 0.0 0.4 1.2 1.3 1.7 3.2
APEC ENERGY HANDBOOK 2017 5
Primary Energy Supply
–––––––––––––––––––––––––––––––––––––– Total primary energy supply by energy
Japan ––––––––––––––––––––––––––––––––––––––
0
100
200
300
400
500
600
1990
1991
1992
1993
1994
1995
1996
1997
1998
1999
2000
2001
2002
2003
2004
2005
2006
2007
2008
2009
2010
2011
2012
2013
2014
2015
2016
2017
Mtoe
Coal Oil Gas Nuclear Hydro Others
Mtoe1990 1995 2000 2005 2010 2017
Coal 76.7 83.9 97.0 110.5 115.4 116.5Oil 250.3 264.9 255.0 243.1 202.7 176.0Gas 44.1 53.2 65.6 70.7 85.9 100.9Nuclear 52.7 75.9 83.9 79.4 75.1 8.6Hydro 7.6 6.8 7.2 6.6 7.2 7.1Others 7.3 8.5 9.4 12.0 15.1 23.0Total 438.7 493.2 518.2 522.3 501.4 432.0
Share (%)1990 1995 2000 2005 2010 2017
Coal 17.5 17.0 18.7 21.2 23.0 27.0Oil 57.0 53.7 49.2 46.6 40.4 40.7Gas 10.1 10.8 12.7 13.5 17.1 23.4Nuclear 12.0 15.4 16.2 15.2 15.0 2.0Hydro 1.7 1.4 1.4 1.3 1.4 1.6Others 1.7 1.7 1.8 2.3 3.0 5.3
APEC ENERGY HANDBOOK 2017 4
Prim
ary
Ener
gy S
uppl
y
–––––––––––––––––––––––––––––––––––––– Total primary energy supply by energy
China ––––––––––––––––––––––––––––––––––––––
500
1 000
1 500
2 000
2 500
3 000
3 500
1990
1991
1992
1993
1994
1995
1996
1997
1998
1999
2000
2001
2002
2003
2004
2005
2006
2007
2008
2009
2010
2011
2012
2013
2014
2015
2016
2017
Mtoe
Coal Oil Gas Nuclear Hydro Others
Mtoe1990 1995 2000 2005 2010 2017
Coal 531.5 685.0 674.7 1 246.8 1 767.5 1 903.9Oil 114.5 155.8 221.0 317.8 427.6 574.0Gas 13.6 16.0 21.4 41.2 84.8 215.8Nuclear - 3.3 4.4 13.8 19.3 64.6Hydro 10.9 16.4 19.1 34.1 62.1 102.3Others .2 3.8 11.0 22.1 41.5 93.4Total 670.6 880.4 951.6 1 675.9 2 402.8 2 954.1
Share (%)1990 1995 2000 2005 2010 2017
Coal 79.3 77.8 70.9 74.4 73.6 64.5Oil 17.1 17.7 23.2 19.0 17.8 19.4Gas 2.0 1.8 2.3 2.5 3.5 7.3Nuclear - 0.4 0.5 0.8 0.8 2.2Hydro 1.6 1.9 2.0 2.0 2.6 3.5Others 0.0 0.4 1.2 1.3 1.7 3.2
APEC ENERGY HANDBOOK 2017 7
Primary Energy Supply
–––––––––––––––––––––––––––––––––––––– Total primary energy supply by energy
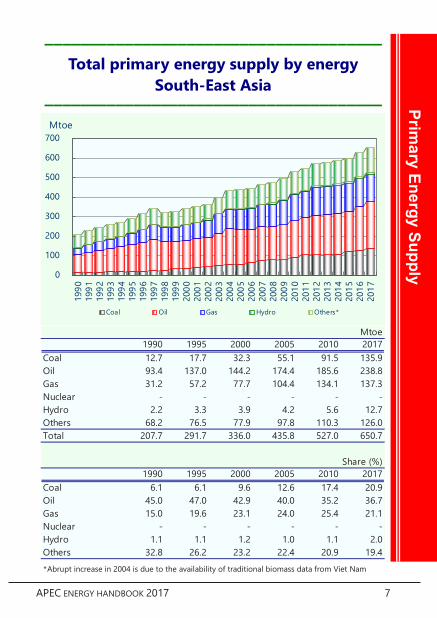
South-East Asia ––––––––––––––––––––––––––––––––––––––
* Abrupt increase in 2004 is due to the availability of traditional biomass data from Viet Nam
0
100
200
300
400
500
600
700
1990
1991
1992
1993
1994
1995
1996
1997
1998
1999
2000
2001
2002
2003
2004
2005
2006
2007
2008
2009
2010
2011
2012
2013
2014
2015
2016
2017
Mtoe
Coal Oil Gas Hydro Others*
Mtoe1990 1995 2000 2005 2010 2017
Coal 12.7 17.7 32.3 55.1 91.5 135.9Oil 93.4 137.0 144.2 174.4 185.6 238.8Gas 31.2 57.2 77.7 104.4 134.1 137.3Nuclear - - - - - -Hydro 2.2 3.3 3.9 4.2 5.6 12.7Others 68.2 76.5 77.9 97.8 110.3 126.0Total 207.7 291.7 336.0 435.8 527.0 650.7
Share (%)1990 1995 2000 2005 2010 2017
Coal 6.1 6.1 9.6 12.6 17.4 20.9Oil 45.0 47.0 42.9 40.0 35.2 36.7Gas 15.0 19.6 23.1 24.0 25.4 21.1Nuclear - - - - - -Hydro 1.1 1.1 1.2 1.0 1.1 2.0Others 32.8 26.2 23.2 22.4 20.9 19.4
APEC ENERGY HANDBOOK 2017 6
Prim
ary
Ener
gy S
uppl
y ––––––––––––––––––––––––––––––––––––––
Total primary energy supply by energy Other north-east Asia*
––––––––––––––––––––––––––––––––––––––
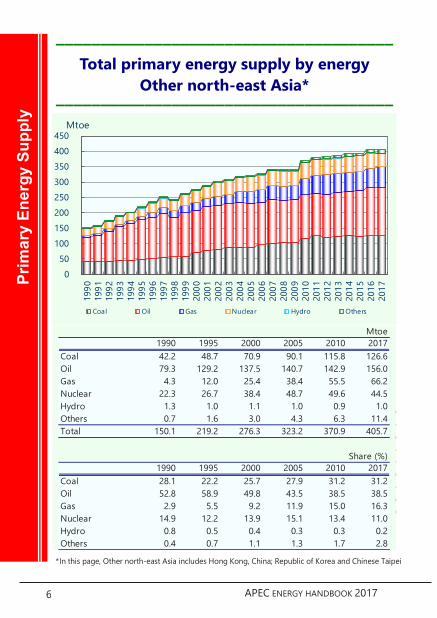
* In this page, Other north-east Asia includes Hong Kong, China; Republic of Korea and Chinese Taipei
050
100150200250300350400450
1990
1991
1992
1993
1994
1995
1996
1997
1998
1999
2000
2001
2002
2003
2004
2005
2006
2007
2008
2009
2010
2011
2012
2013
2014
2015
2016
2017
Mtoe
Coal Oil Gas Nuclear Hydro Others
Mtoe1990 1995 2000 2005 2010 2017
Coal 42.2 48.7 70.9 90.1 115.8 126.6Oil 79.3 129.2 137.5 140.7 142.9 156.0Gas 4.3 12.0 25.4 38.4 55.5 66.2Nuclear 22.3 26.7 38.4 48.7 49.6 44.5Hydro 1.3 1.0 1.1 1.0 0.9 1.0Others 0.7 1.6 3.0 4.3 6.3 11.4Total 150.1 219.2 276.3 323.2 370.9 405.7
Share (%)1990 1995 2000 2005 2010 2017
Coal 28.1 22.2 25.7 27.9 31.2 31.2Oil 52.8 58.9 49.8 43.5 38.5 38.5Gas 2.9 5.5 9.2 11.9 15.0 16.3Nuclear 14.9 12.2 13.9 15.1 13.4 11.0Hydro 0.8 0.5 0.4 0.3 0.3 0.2Others 0.4 0.7 1.1 1.3 1.7 2.8
APEC ENERGY HANDBOOK 2017 7
Primary Energy Supply
–––––––––––––––––––––––––––––––––––––– Total primary energy supply by energy
South-East Asia ––––––––––––––––––––––––––––––––––––––
* Abrupt increase in 2004 is due to the availability of traditional biomass data from Viet Nam
0
100
200
300
400
500
600
700
1990
1991
1992
1993
1994
1995
1996
1997
1998
1999
2000
2001
2002
2003
2004
2005
2006
2007
2008
2009
2010
2011
2012
2013
2014
2015
2016
2017
Mtoe
Coal Oil Gas Hydro Others*
Mtoe1990 1995 2000 2005 2010 2017
Coal 12.7 17.7 32.3 55.1 91.5 135.9Oil 93.4 137.0 144.2 174.4 185.6 238.8Gas 31.2 57.2 77.7 104.4 134.1 137.3Nuclear - - - - - -Hydro 2.2 3.3 3.9 4.2 5.6 12.7Others 68.2 76.5 77.9 97.8 110.3 126.0Total 207.7 291.7 336.0 435.8 527.0 650.7
Share (%)1990 1995 2000 2005 2010 2017
Coal 6.1 6.1 9.6 12.6 17.4 20.9Oil 45.0 47.0 42.9 40.0 35.2 36.7Gas 15.0 19.6 23.1 24.0 25.4 21.1Nuclear - - - - - -Hydro 1.1 1.1 1.2 1.0 1.1 2.0Others 32.8 26.2 23.2 22.4 20.9 19.4
APEC ENERGY HANDBOOK 2017 6
Prim
ary
Ener
gy S
uppl
y
–––––––––––––––––––––––––––––––––––––– Total primary energy supply by energy
Other north-east Asia* ––––––––––––––––––––––––––––––––––––––
* In this page, Other north-east Asia includes Hong Kong, China; Republic of Korea and Chinese Taipei
050
100150200250300350400450
1990
1991
1992
1993
1994
1995
1996
1997
1998
1999
2000
2001
2002
2003
2004
2005
2006
2007
2008
2009
2010
2011
2012
2013
2014
2015
2016
2017
Mtoe
Coal Oil Gas Nuclear Hydro Others
Mtoe1990 1995 2000 2005 2010 2017
Coal 42.2 48.7 70.9 90.1 115.8 126.6Oil 79.3 129.2 137.5 140.7 142.9 156.0Gas 4.3 12.0 25.4 38.4 55.5 66.2Nuclear 22.3 26.7 38.4 48.7 49.6 44.5Hydro 1.3 1.0 1.1 1.0 0.9 1.0Others 0.7 1.6 3.0 4.3 6.3 11.4Total 150.1 219.2 276.3 323.2 370.9 405.7
Share (%)1990 1995 2000 2005 2010 2017
Coal 28.1 22.2 25.7 27.9 31.2 31.2Oil 52.8 58.9 49.8 43.5 38.5 38.5Gas 2.9 5.5 9.2 11.9 15.0 16.3Nuclear 14.9 12.2 13.9 15.1 13.4 11.0Hydro 0.8 0.5 0.4 0.3 0.3 0.2Others 0.4 0.7 1.1 1.3 1.7 2.8
APEC ENERGY HANDBOOK 2017 9
Primary Energy Supply
–––––––––––––––––––––––––––––––––––––– Total primary energy supply by energy
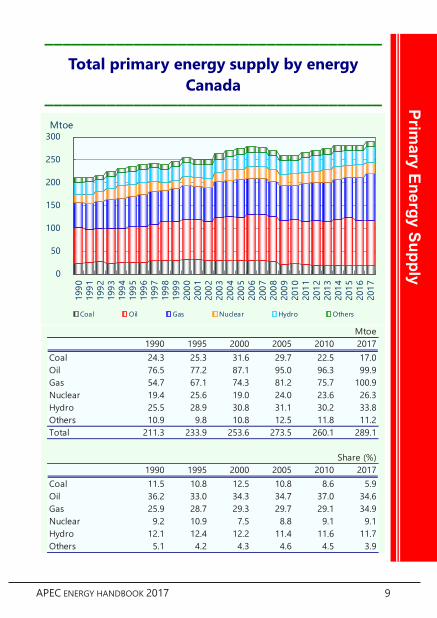
Canada ––––––––––––––––––––––––––––––––––––––
0
50
100
150
200
250
300
1990
1991
1992
1993
1994
1995
1996
1997
1998
1999
2000
2001
2002
2003
2004
2005
2006
2007
2008
2009
2010
2011
2012
2013
2014
2015
2016
2017
Mtoe
Coal Oil Gas Nuclear Hydro Others
Mtoe1990 1995 2000 2005 2010 2017
Coal 24.3 25.3 31.6 29.7 22.5 17.0Oil 76.5 77.2 87.1 95.0 96.3 99.9Gas 54.7 67.1 74.3 81.2 75.7 100.9Nuclear 19.4 25.6 19.0 24.0 23.6 26.3Hydro 25.5 28.9 30.8 31.1 30.2 33.8Others 10.9 9.8 10.8 12.5 11.8 11.2Total 211.3 233.9 253.6 273.5 260.1 289.1
Share (%)1990 1995 2000 2005 2010 2017
Coal 11.5 10.8 12.5 10.8 8.6 5.9Oil 36.2 33.0 34.3 34.7 37.0 34.6Gas 25.9 28.7 29.3 29.7 29.1 34.9Nuclear 9.2 10.9 7.5 8.8 9.1 9.1Hydro 12.1 12.4 12.2 11.4 11.6 11.7Others 5.1 4.2 4.3 4.6 4.5 3.9
APEC ENERGY HANDBOOK 2017 8
Prim
ary
Ener
gy S
uppl
y ––––––––––––––––––––––––––––––––––––––
Total primary energy supply by energy Oceania
––––––––––––––––––––––––––––––––––––––
0
20
40
60
80
100
120
140
160
1990
1991
1992
1993
1994
1995
1996
1997
1998
1999
2000
2001
2002
2003
2004
2005
2006
2007
2008
2009
2010
2011
2012
2013
2014
2015
2016
2017
Mtoe
Coal Oil Gas Hydro Others
Mtoe1990 1995 2000 2005 2010 2017
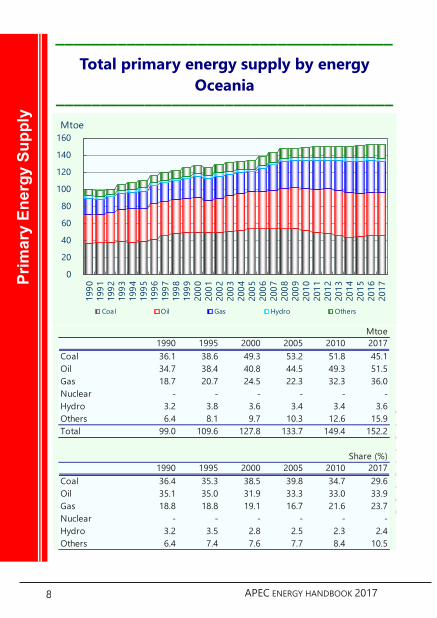
Coal 36.1 38.6 49.3 53.2 51.8 45.1Oil 34.7 38.4 40.8 44.5 49.3 51.5Gas 18.7 20.7 24.5 22.3 32.3 36.0Nuclear - - - - - -Hydro 3.2 3.8 3.6 3.4 3.4 3.6Others 6.4 8.1 9.7 10.3 12.6 15.9Total 99.0 109.6 127.8 133.7 149.4 152.2
Share (%)1990 1995 2000 2005 2010 2017
Coal 36.4 35.3 38.5 39.8 34.7 29.6Oil 35.1 35.0 31.9 33.3 33.0 33.9Gas 18.8 18.8 19.1 16.7 21.6 23.7Nuclear - - - - - -Hydro 3.2 3.5 2.8 2.5 2.3 2.4Others 6.4 7.4 7.6 7.7 8.4 10.5
APEC ENERGY HANDBOOK 2017 9
Primary Energy Supply
–––––––––––––––––––––––––––––––––––––– Total primary energy supply by energy
Canada ––––––––––––––––––––––––––––––––––––––
0
50
100
150
200
250
300
1990
1991
1992
1993
1994
1995
1996
1997
1998
1999
2000
2001
2002
2003
2004
2005
2006
2007
2008
2009
2010
2011
2012
2013
2014
2015
2016
2017
Mtoe
Coal Oil Gas Nuclear Hydro Others
Mtoe1990 1995 2000 2005 2010 2017
Coal 24.3 25.3 31.6 29.7 22.5 17.0Oil 76.5 77.2 87.1 95.0 96.3 99.9Gas 54.7 67.1 74.3 81.2 75.7 100.9Nuclear 19.4 25.6 19.0 24.0 23.6 26.3Hydro 25.5 28.9 30.8 31.1 30.2 33.8Others 10.9 9.8 10.8 12.5 11.8 11.2Total 211.3 233.9 253.6 273.5 260.1 289.1
Share (%)1990 1995 2000 2005 2010 2017
Coal 11.5 10.8 12.5 10.8 8.6 5.9Oil 36.2 33.0 34.3 34.7 37.0 34.6Gas 25.9 28.7 29.3 29.7 29.1 34.9Nuclear 9.2 10.9 7.5 8.8 9.1 9.1Hydro 12.1 12.4 12.2 11.4 11.6 11.7Others 5.1 4.2 4.3 4.6 4.5 3.9
APEC ENERGY HANDBOOK 2017 8
Prim
ary
Ener
gy S
uppl
y
–––––––––––––––––––––––––––––––––––––– Total primary energy supply by energy
Oceania ––––––––––––––––––––––––––––––––––––––
0
20
40
60
80
100
120
140
160
1990
1991
1992
1993
1994
1995
1996
1997
1998
1999
2000
2001
2002
2003
2004
2005
2006
2007
2008
2009
2010
2011
2012
2013
2014
2015
2016
2017
Mtoe
Coal Oil Gas Hydro Others
Mtoe1990 1995 2000 2005 2010 2017
Coal 36.1 38.6 49.3 53.2 51.8 45.1Oil 34.7 38.4 40.8 44.5 49.3 51.5Gas 18.7 20.7 24.5 22.3 32.3 36.0Nuclear - - - - - -Hydro 3.2 3.8 3.6 3.4 3.4 3.6Others 6.4 8.1 9.7 10.3 12.6 15.9Total 99.0 109.6 127.8 133.7 149.4 152.2
Share (%)1990 1995 2000 2005 2010 2017
Coal 36.4 35.3 38.5 39.8 34.7 29.6Oil 35.1 35.0 31.9 33.3 33.0 33.9Gas 18.8 18.8 19.1 16.7 21.6 23.7Nuclear - - - - - -Hydro 3.2 3.5 2.8 2.5 2.3 2.4Others 6.4 7.4 7.6 7.7 8.4 10.5

APEC ENERGY HANDBOOK 2017 11
Primary Energy Supply
–––––––––––––––––––––––––––––––––––––– Total primary energy supply by energy
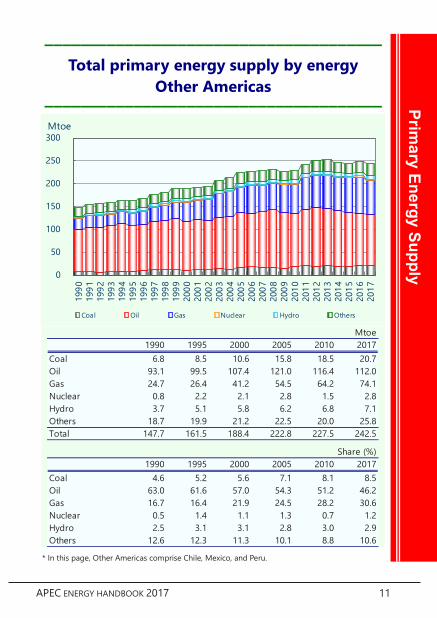
Other Americas ––––––––––––––––––––––––––––––––––––––
* In this page, Other Americas comprise Chile, Mexico, and Peru.
0
50
100
150
200
250
300
1990
1991
1992
1993
1994
1995
1996
1997
1998
1999
2000
2001
2002
2003
2004
2005
2006
2007
2008
2009
2010
2011
2012
2013
2014
2015
2016
2017
Mtoe
Coal Oil Gas Nuclear Hydro Others
Mtoe1990 1995 2000 2005 2010 2017
Coal 6.8 8.5 10.6 15.8 18.5 20.7Oil 93.1 99.5 107.4 121.0 116.4 112.0Gas 24.7 26.4 41.2 54.5 64.2 74.1Nuclear 0.8 2.2 2.1 2.8 1.5 2.8Hydro 3.7 5.1 5.8 6.2 6.8 7.1Others 18.7 19.9 21.2 22.5 20.0 25.8Total 147.7 161.5 188.4 222.8 227.5 242.5
Share (%)1990 1995 2000 2005 2010 2017
Coal 4.6 5.2 5.6 7.1 8.1 8.5Oil 63.0 61.6 57.0 54.3 51.2 46.2Gas 16.7 16.4 21.9 24.5 28.2 30.6Nuclear 0.5 1.4 1.1 1.3 0.7 1.2Hydro 2.5 3.1 3.1 2.8 3.0 2.9Others 12.6 12.3 11.3 10.1 8.8 10.6
APEC ENERGY HANDBOOK 2017 10
Prim
ary
Ener
gy S
uppl
y ––––––––––––––––––––––––––––––––––––––
Total primary energy supply by energy United States
––––––––––––––––––––––––––––––––––––––
500
1 000
1 500
2 000
2 500
1990
1991
1992
1993
1994
1995
1996
1997
1998
1999
2000
2001
2002
2003
2004
2005
2006
2007
2008
2009
2010
2011
2012
2013
2014
2015
2016
2017
Mtoe
Coal Oil Gas Nuclear Hydro Others
Mtoe1990 1995 2000 2005 2010 2017
Coal 460.1 473.9 533.9 558.4 502.6 330.7Oil 756.8 785.6 871.2 929.2 806.5 790.3Gas 438.4 507.4 547.7 507.2 556.1 643.9Nuclear 159.4 186.0 207.9 211.2 218.6 218.6Hydro 23.5 27.0 21.8 23.4 22.6 26.0Others 76.9 87.4 91.3 89.5 110.5 145.7Total 1,915.0 2,067.3 2,273.8 2,318.9 2,216.9 2,155.2
Share (%)1990 1995 2000 2005 2010 2017
Coal 24.0 22.9 23.5 24.1 22.7 15.3Oil 39.5 38.0 38.3 40.1 36.4 36.7Gas 22.9 24.5 24.1 21.9 25.1 29.9Nuclear 8.3 9.0 9.1 9.1 9.9 10.1Hydro 1.2 1.3 1.0 1.0 1.0 1.2Others 4.0 4.2 4.0 3.9 5.0 6.8
APEC ENERGY HANDBOOK 2017 11
Primary Energy Supply
–––––––––––––––––––––––––––––––––––––– Total primary energy supply by energy
Other Americas ––––––––––––––––––––––––––––––––––––––
* In this page, Other Americas comprise Chile, Mexico, and Peru.
0
50
100
150
200
250
300
1990
1991
1992
1993
1994
1995
1996
1997
1998
1999
2000
2001
2002
2003
2004
2005
2006
2007
2008
2009
2010
2011
2012
2013
2014
2015
2016
2017
Mtoe
Coal Oil Gas Nuclear Hydro Others
Mtoe1990 1995 2000 2005 2010 2017
Coal 6.8 8.5 10.6 15.8 18.5 20.7Oil 93.1 99.5 107.4 121.0 116.4 112.0Gas 24.7 26.4 41.2 54.5 64.2 74.1Nuclear 0.8 2.2 2.1 2.8 1.5 2.8Hydro 3.7 5.1 5.8 6.2 6.8 7.1Others 18.7 19.9 21.2 22.5 20.0 25.8Total 147.7 161.5 188.4 222.8 227.5 242.5
Share (%)1990 1995 2000 2005 2010 2017
Coal 4.6 5.2 5.6 7.1 8.1 8.5Oil 63.0 61.6 57.0 54.3 51.2 46.2Gas 16.7 16.4 21.9 24.5 28.2 30.6Nuclear 0.5 1.4 1.1 1.3 0.7 1.2Hydro 2.5 3.1 3.1 2.8 3.0 2.9Others 12.6 12.3 11.3 10.1 8.8 10.6
APEC ENERGY HANDBOOK 2017 10
Prim
ary
Ener
gy S
uppl
y
–––––––––––––––––––––––––––––––––––––– Total primary energy supply by energy
United States ––––––––––––––––––––––––––––––––––––––
500
1 000
1 500
2 000
2 500
1990
1991
1992
1993
1994
1995
1996
1997
1998
1999
2000
2001
2002
2003
2004
2005
2006
2007
2008
2009
2010
2011
2012
2013
2014
2015
2016
2017
Mtoe
Coal Oil Gas Nuclear Hydro Others
Mtoe1990 1995 2000 2005 2010 2017
Coal 460.1 473.9 533.9 558.4 502.6 330.7Oil 756.8 785.6 871.2 929.2 806.5 790.3Gas 438.4 507.4 547.7 507.2 556.1 643.9Nuclear 159.4 186.0 207.9 211.2 218.6 218.6Hydro 23.5 27.0 21.8 23.4 22.6 26.0Others 76.9 87.4 91.3 89.5 110.5 145.7Total 1,915.0 2,067.3 2,273.8 2,318.9 2,216.9 2,155.2
Share (%)1990 1995 2000 2005 2010 2017
Coal 24.0 22.9 23.5 24.1 22.7 15.3Oil 39.5 38.0 38.3 40.1 36.4 36.7Gas 22.9 24.5 24.1 21.9 25.1 29.9Nuclear 8.3 9.0 9.1 9.1 9.9 10.1Hydro 1.2 1.3 1.0 1.0 1.0 1.2Others 4.0 4.2 4.0 3.9 5.0 6.8
APEC ENERGY HANDBOOK 2017 13
Primary Energy Supply
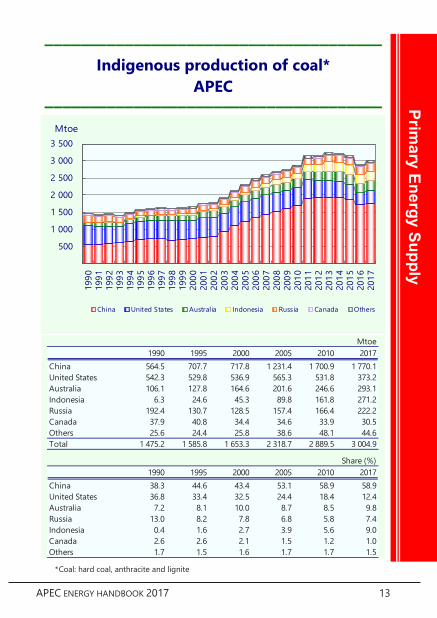
–––––––––––––––––––––––––––––––––––––– Indigenous production of coal*
APEC ––––––––––––––––––––––––––––––––––––––
* Coal: hard coal, anthracite and lignite
500
1 000
1 500
2 000
2 500
3 000
3 500
1990
1991
1992
1993
1994
1995
1996
1997
1998
1999
2000
2001
2002
2003
2004
2005
2006
2007
2008
2009
2010
2011
2012
2013
2014
2015
2016
2017
Mtoe
China United States Australia Indonesia Russia Canada Others
Mtoe1990 1995 2000 2005 2010 2017
China 564.5 707.7 717.8 1 231.4 1 700.9 1 770.1United States 542.3 529.8 536.9 565.3 531.8 373.2Australia 106.1 127.8 164.6 201.6 246.6 293.1Indonesia 6.3 24.6 45.3 89.8 161.8 271.2Russia 192.4 130.7 128.5 157.4 166.4 222.2Canada 37.9 40.8 34.4 34.6 33.9 30.5Others 25.6 24.4 25.8 38.6 48.1 44.6Total 1 475.2 1 585.8 1 653.3 2 318.7 2 889.5 3 004.9
Share (%)1990 1995 2000 2005 2010 2017
China 38.3 44.6 43.4 53.1 58.9 58.9United States 36.8 33.4 32.5 24.4 18.4 12.4Australia 7.2 8.1 10.0 8.7 8.5 9.8Russia 13.0 8.2 7.8 6.8 5.8 7.4Indonesia 0.4 1.6 2.7 3.9 5.6 9.0Canada 2.6 2.6 2.1 1.5 1.2 1.0Others 1.7 1.5 1.6 1.7 1.7 1.5
APEC ENERGY HANDBOOK 2017 12
Prim
ary
Ener
gy S
uppl
y ––––––––––––––––––––––––––––––––––––––
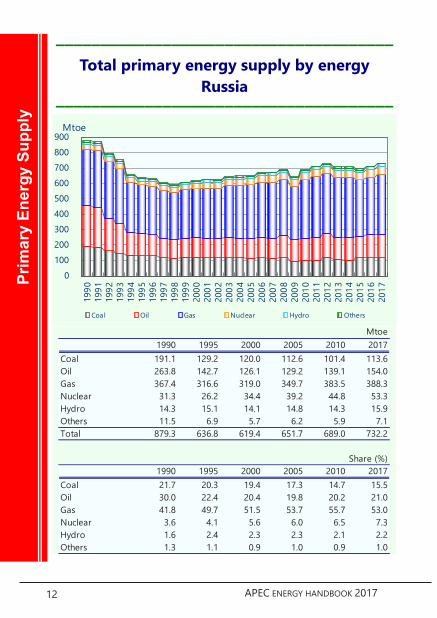
Total primary energy supply by energy Russia
––––––––––––––––––––––––––––––––––––––
0100200300400500600700800900
1990
1991
1992
1993
1994
1995
1996
1997
1998
1999
2000
2001
2002
2003
2004
2005
2006
2007
2008
2009
2010
2011
2012
2013
2014
2015
2016
2017
Mtoe
Coal Oil Gas Nuclear Hydro Others
Mtoe1990 1995 2000 2005 2010 2017
Coal 191.1 129.2 120.0 112.6 101.4 113.6Oil 263.8 142.7 126.1 129.2 139.1 154.0Gas 367.4 316.6 319.0 349.7 383.5 388.3Nuclear 31.3 26.2 34.4 39.2 44.8 53.3Hydro 14.3 15.1 14.1 14.8 14.3 15.9Others 11.5 6.9 5.7 6.2 5.9 7.1Total 879.3 636.8 619.4 651.7 689.0 732.2
Share (%)1990 1995 2000 2005 2010 2017
Coal 21.7 20.3 19.4 17.3 14.7 15.5Oil 30.0 22.4 20.4 19.8 20.2 21.0Gas 41.8 49.7 51.5 53.7 55.7 53.0Nuclear 3.6 4.1 5.6 6.0 6.5 7.3Hydro 1.6 2.4 2.3 2.3 2.1 2.2Others 1.3 1.1 0.9 1.0 0.9 1.0
APEC ENERGY HANDBOOK 2017 13
Primary Energy Supply
–––––––––––––––––––––––––––––––––––––– Indigenous production of coal*
APEC ––––––––––––––––––––––––––––––––––––––
* Coal: hard coal, anthracite and lignite
500
1 000
1 500
2 000
2 500
3 000
3 500
1990
1991
1992
1993
1994
1995
1996
1997
1998
1999
2000
2001
2002
2003
2004
2005
2006
2007
2008
2009
2010
2011
2012
2013
2014
2015
2016
2017
Mtoe
China United States Australia Indonesia Russia Canada Others
Mtoe1990 1995 2000 2005 2010 2017
China 564.5 707.7 717.8 1 231.4 1 700.9 1 770.1United States 542.3 529.8 536.9 565.3 531.8 373.2Australia 106.1 127.8 164.6 201.6 246.6 293.1Indonesia 6.3 24.6 45.3 89.8 161.8 271.2Russia 192.4 130.7 128.5 157.4 166.4 222.2Canada 37.9 40.8 34.4 34.6 33.9 30.5Others 25.6 24.4 25.8 38.6 48.1 44.6Total 1 475.2 1 585.8 1 653.3 2 318.7 2 889.5 3 004.9
Share (%)1990 1995 2000 2005 2010 2017
China 38.3 44.6 43.4 53.1 58.9 58.9United States 36.8 33.4 32.5 24.4 18.4 12.4Australia 7.2 8.1 10.0 8.7 8.5 9.8Russia 13.0 8.2 7.8 6.8 5.8 7.4Indonesia 0.4 1.6 2.7 3.9 5.6 9.0Canada 2.6 2.6 2.1 1.5 1.2 1.0Others 1.7 1.5 1.6 1.7 1.7 1.5
APEC ENERGY HANDBOOK 2017 12
Prim
ary
Ener
gy S
uppl
y
–––––––––––––––––––––––––––––––––––––– Total primary energy supply by energy
Russia ––––––––––––––––––––––––––––––––––––––
0100200300400500600700800900
1990
1991
1992
1993
1994
1995
1996
1997
1998
1999
2000
2001
2002
2003
2004
2005
2006
2007
2008
2009
2010
2011
2012
2013
2014
2015
2016
2017
Mtoe
Coal Oil Gas Nuclear Hydro Others
Mtoe1990 1995 2000 2005 2010 2017
Coal 191.1 129.2 120.0 112.6 101.4 113.6Oil 263.8 142.7 126.1 129.2 139.1 154.0Gas 367.4 316.6 319.0 349.7 383.5 388.3Nuclear 31.3 26.2 34.4 39.2 44.8 53.3Hydro 14.3 15.1 14.1 14.8 14.3 15.9Others 11.5 6.9 5.7 6.2 5.9 7.1Total 879.3 636.8 619.4 651.7 689.0 732.2
Share (%)1990 1995 2000 2005 2010 2017
Coal 21.7 20.3 19.4 17.3 14.7 15.5Oil 30.0 22.4 20.4 19.8 20.2 21.0Gas 41.8 49.7 51.5 53.7 55.7 53.0Nuclear 3.6 4.1 5.6 6.0 6.5 7.3Hydro 1.6 2.4 2.3 2.3 2.1 2.2Others 1.3 1.1 0.9 1.0 0.9 1.0
APEC ENERGY HANDBOOK 2017 15
Primary Energy Supply
–––––––––––––––––––––––––––––––––––––– Indigenous production of natural gas
APEC ––––––––––––––––––––––––––––––––––––––
200 400 600 800
1 0001 2001 4001 6001 8002 000
1990
1991
1992
1993
1994
1995
1996
1997
1998
1999
2000
2001
2002
2003
2004
2005
2006
2007
2008
2009
2010
2011
2012
2013
2014
2015
2016
2017
Mtoe
United States Russia Canada China Indonesia Malaysia Others
Mtoe1990 1995 2000 2005 2010 2017
United States 418.2 434.6 446.9 421.6 494.8 641.7Russia 516.8 480.6 470.7 515.8 540.2 581.0Canada 88.6 130.3 148.4 154.6 129.4 153.4China 13.6 16.0 24.2 43.9 85.2 134.7Indonesia 44.1 60.9 60.5 65.7 74.1 62.3Malaysia 15.5 26.7 44.8 57.4 56.7 65.0Others 60.8 76.0 99.6 114.0 155.9 185.9Total 1 157.6 1 225.0 1 295.1 1 373.0 1 536.4 1 824.0
Share (%)1990 1995 2000 2005 2010 2017
United States 36.1 35.5 34.5 30.7 32.2 35.2Russia 44.6 39.2 36.3 37.6 35.2 31.8Canada 7.7 10.6 11.5 11.3 8.4 8.4China 1.2 1.3 1.9 3.2 5.5 7.4Indonesia 3.8 5.0 4.7 4.8 4.8 3.4Malaysia 1.3 2.2 3.5 4.2 3.7 3.6Others 5.2 6.2 7.7 8.3 10.2 10.2
APEC ENERGY HANDBOOK 2017 14
Prim
ary
Ener
gy S
uppl
y ––––––––––––––––––––––––––––––––––––––
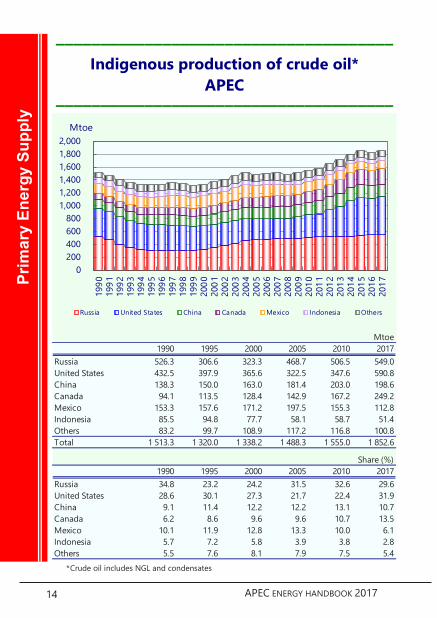
Indigenous production of crude oil* APEC
––––––––––––––––––––––––––––––––––––––
* Crude oil includes NGL and condensates
0200400600800
1,0001,2001,4001,6001,8002,000
1990
1991
1992
1993
1994
1995
1996
1997
1998
1999
2000
2001
2002
2003
2004
2005
2006
2007
2008
2009
2010
2011
2012
2013
2014
2015
2016
2017
Mtoe
Russia United States China Canada Mexico Indonesia Others
Mtoe1990 1995 2000 2005 2010 2017
Russia 526.3 306.6 323.3 468.7 506.5 549.0United States 432.5 397.9 365.6 322.5 347.6 590.8China 138.3 150.0 163.0 181.4 203.0 198.6Canada 94.1 113.5 128.4 142.9 167.2 249.2Mexico 153.3 157.6 171.2 197.5 155.3 112.8Indonesia 85.5 94.8 77.7 58.1 58.7 51.4Others 83.2 99.7 108.9 117.2 116.8 100.8Total 1 513.3 1 320.0 1 338.2 1 488.3 1 555.0 1 852.6
Share (%)1990 1995 2000 2005 2010 2017
Russia 34.8 23.2 24.2 31.5 32.6 29.6United States 28.6 30.1 27.3 21.7 22.4 31.9China 9.1 11.4 12.2 12.2 13.1 10.7Canada 6.2 8.6 9.6 9.6 10.7 13.5Mexico 10.1 11.9 12.8 13.3 10.0 6.1Indonesia 5.7 7.2 5.8 3.9 3.8 2.8Others 5.5 7.6 8.1 7.9 7.5 5.4

APEC ENERGY HANDBOOK 2017 15
Primary Energy Supply
–––––––––––––––––––––––––––––––––––––– Indigenous production of natural gas
APEC ––––––––––––––––––––––––––––––––––––––
200 400 600 800
1 0001 2001 4001 6001 8002 000
1990
1991
1992
1993
1994
1995
1996
1997
1998
1999
2000
2001
2002
2003
2004
2005
2006
2007
2008
2009
2010
2011
2012
2013
2014
2015
2016
2017
Mtoe
United States Russia Canada China Indonesia Malaysia Others
Mtoe1990 1995 2000 2005 2010 2017
United States 418.2 434.6 446.9 421.6 494.8 641.7Russia 516.8 480.6 470.7 515.8 540.2 581.0Canada 88.6 130.3 148.4 154.6 129.4 153.4China 13.6 16.0 24.2 43.9 85.2 134.7Indonesia 44.1 60.9 60.5 65.7 74.1 62.3Malaysia 15.5 26.7 44.8 57.4 56.7 65.0Others 60.8 76.0 99.6 114.0 155.9 185.9Total 1 157.6 1 225.0 1 295.1 1 373.0 1 536.4 1 824.0
Share (%)1990 1995 2000 2005 2010 2017
United States 36.1 35.5 34.5 30.7 32.2 35.2Russia 44.6 39.2 36.3 37.6 35.2 31.8Canada 7.7 10.6 11.5 11.3 8.4 8.4China 1.2 1.3 1.9 3.2 5.5 7.4Indonesia 3.8 5.0 4.7 4.8 4.8 3.4Malaysia 1.3 2.2 3.5 4.2 3.7 3.6Others 5.2 6.2 7.7 8.3 10.2 10.2
APEC ENERGY HANDBOOK 2017 14
Prim
ary
Ener
gy S
uppl
y
–––––––––––––––––––––––––––––––––––––– Indigenous production of crude oil*
APEC ––––––––––––––––––––––––––––––––––––––
* Crude oil includes NGL and condensates
0200400600800
1,0001,2001,4001,6001,8002,000
1990
1991
1992
1993
1994
1995
1996
1997
1998
1999
2000
2001
2002
2003
2004
2005
2006
2007
2008
2009
2010
2011
2012
2013
2014
2015
2016
2017
Mtoe
Russia United States China Canada Mexico Indonesia Others
Mtoe1990 1995 2000 2005 2010 2017
Russia 526.3 306.6 323.3 468.7 506.5 549.0United States 432.5 397.9 365.6 322.5 347.6 590.8China 138.3 150.0 163.0 181.4 203.0 198.6Canada 94.1 113.5 128.4 142.9 167.2 249.2Mexico 153.3 157.6 171.2 197.5 155.3 112.8Indonesia 85.5 94.8 77.7 58.1 58.7 51.4Others 83.2 99.7 108.9 117.2 116.8 100.8Total 1 513.3 1 320.0 1 338.2 1 488.3 1 555.0 1 852.6
Share (%)1990 1995 2000 2005 2010 2017
Russia 34.8 23.2 24.2 31.5 32.6 29.6United States 28.6 30.1 27.3 21.7 22.4 31.9China 9.1 11.4 12.2 12.2 13.1 10.7Canada 6.2 8.6 9.6 9.6 10.7 13.5Mexico 10.1 11.9 12.8 13.3 10.0 6.1Indonesia 5.7 7.2 5.8 3.9 3.8 2.8Others 5.5 7.6 8.1 7.9 7.5 5.4

APEC ENERGY HANDBOOK 2017 17
Primary Energy Supply
–––––––––––––––––––––––––––––––––––––– Indigenous production of nuclear power
APEC ––––––––––––––––––––––––––––––––––––––
200 400 600 800
1 0001 2001 4001 6001 800
1990
1991
1992
1993
1994
1995
1996
1997
1998
1999
2000
2001
2002
2003
2004
2005
2006
2007
2008
2009
2010
2011
2012
2013
2014
2015
2016
2017
TWh
United States Russia Korea China Canada Chinese Taipei Japan Mexico
TWh1990 1995 2000 2005 2010 2017
United States 611.6 713.8 797.7 810.7 838.9 838.9China .0 12.8 16.7 53.1 73.9 248.1Russia 118.3 99.5 130.7 149.4 170.4 203.1Korea 52.9 67.0 109.0 146.8 148.6 148.4Canada 73.0 97.8 72.8 92.0 90.7 101.1Chinese Taipei 32.9 35.3 38.5 40.0 41.6 22.4Japan 202.3 291.3 322.1 304.8 288.2 32.9Mexico 2.9 8.4 8.2 10.8 5.9 10.9Total 1 093.8 1 326.1 1 495.7 1 607.6 1 658.2 1 605.9
Share (%)1990 1995 2000 2005 2010 2017
United States 55.9 53.8 53.3 50.4 50.6 52.2China - 1.0 1.1 3.3 4.5 15.4Russia 10.8 7.5 8.7 9.3 10.3 12.7Korea 4.8 5.1 7.3 9.1 9.0 9.2Canada 6.7 7.4 4.9 5.7 5.5 6.3Chinese Taipei 3.0 2.7 2.6 2.5 2.5 1.4Japan 18.5 22.0 21.5 19.0 17.4 2.0Mexico 0.3 0.6 0.5 0.7 0.4 0.7
APEC ENERGY HANDBOOK 2017 16
Prim
ary
Ener
gy S
uppl
y ––––––––––––––––––––––––––––––––––––––
Indigenous production of hydro power APEC
––––––––––––––––––––––––––––––––––––––
500
1 000
1 500
2 000
2 500
3 000
1990
1991
1992
1993
1994
1995
1996
1997
1998
1999
2000
2001
2002
2003
2004
2005
2006
2007
2008
2009
2010
2011
2012
2013
2014
2015
2016
2017
TWh
China Canada United States Russia Japan Mexico Others
TWh1990 1995 2000 2005 2010 2017
China 126.7 190.6 222.4 397.0 722.2 1 189.8Canada 296.7 335.9 358.4 361.9 351.3 392.5United States 273.1 314.1 253.2 272.4 262.2 302.3Russia 165.9 175.4 164.0 172.7 166.5 185.0Japan 87.9 78.8 84.0 76.9 83.8 82.8Mexico 23.5 27.5 33.1 27.7 37.1 32.0Others 97.3 125.2 134.7 144.0 156.6 252.2Total 1 071.1 1 247.4 1 249.9 1 452.5 1 779.7 2 436.6
Share (%)1990 1995 2000 2005 2010 2017
China 11.8 15.3 17.8 27.3 40.6 48.8Canada 27.7 26.9 28.7 24.9 19.7 16.1United States 25.5 25.2 20.3 18.8 14.7 12.4Russia 15.5 14.1 13.1 11.9 9.4 7.6Japan 8.2 6.3 6.7 5.3 4.7 3.4Mexico 2.2 2.2 2.7 1.9 2.1 1.3Others 9.1 10.0 10.8 9.9 8.8 10.4

APEC ENERGY HANDBOOK 2017 17
Primary Energy Supply
–––––––––––––––––––––––––––––––––––––– Indigenous production of nuclear power
APEC ––––––––––––––––––––––––––––––––––––––
200 400 600 800
1 0001 2001 4001 6001 800
1990
1991
1992
1993
1994
1995
1996
1997
1998
1999
2000
2001
2002
2003
2004
2005
2006
2007
2008
2009
2010
2011
2012
2013
2014
2015
2016
2017
TWh
United States Russia Korea China Canada Chinese Taipei Japan Mexico
TWh1990 1995 2000 2005 2010 2017
United States 611.6 713.8 797.7 810.7 838.9 838.9China .0 12.8 16.7 53.1 73.9 248.1Russia 118.3 99.5 130.7 149.4 170.4 203.1Korea 52.9 67.0 109.0 146.8 148.6 148.4Canada 73.0 97.8 72.8 92.0 90.7 101.1Chinese Taipei 32.9 35.3 38.5 40.0 41.6 22.4Japan 202.3 291.3 322.1 304.8 288.2 32.9Mexico 2.9 8.4 8.2 10.8 5.9 10.9Total 1 093.8 1 326.1 1 495.7 1 607.6 1 658.2 1 605.9
Share (%)1990 1995 2000 2005 2010 2017
United States 55.9 53.8 53.3 50.4 50.6 52.2China - 1.0 1.1 3.3 4.5 15.4Russia 10.8 7.5 8.7 9.3 10.3 12.7Korea 4.8 5.1 7.3 9.1 9.0 9.2Canada 6.7 7.4 4.9 5.7 5.5 6.3Chinese Taipei 3.0 2.7 2.6 2.5 2.5 1.4Japan 18.5 22.0 21.5 19.0 17.4 2.0Mexico 0.3 0.6 0.5 0.7 0.4 0.7
APEC ENERGY HANDBOOK 2017 16
Prim
ary
Ener
gy S
uppl
y
–––––––––––––––––––––––––––––––––––––– Indigenous production of hydro power
APEC ––––––––––––––––––––––––––––––––––––––
500
1 000
1 500
2 000
2 500
3 000
1990
1991
1992
1993
1994
1995
1996
1997
1998
1999
2000
2001
2002
2003
2004
2005
2006
2007
2008
2009
2010
2011
2012
2013
2014
2015
2016
2017
TWh
China Canada United States Russia Japan Mexico Others
TWh1990 1995 2000 2005 2010 2017
China 126.7 190.6 222.4 397.0 722.2 1 189.8Canada 296.7 335.9 358.4 361.9 351.3 392.5United States 273.1 314.1 253.2 272.4 262.2 302.3Russia 165.9 175.4 164.0 172.7 166.5 185.0Japan 87.9 78.8 84.0 76.9 83.8 82.8Mexico 23.5 27.5 33.1 27.7 37.1 32.0Others 97.3 125.2 134.7 144.0 156.6 252.2Total 1 071.1 1 247.4 1 249.9 1 452.5 1 779.7 2 436.6
Share (%)1990 1995 2000 2005 2010 2017
China 11.8 15.3 17.8 27.3 40.6 48.8Canada 27.7 26.9 28.7 24.9 19.7 16.1United States 25.5 25.2 20.3 18.8 14.7 12.4Russia 15.5 14.1 13.1 11.9 9.4 7.6Japan 8.2 6.3 6.7 5.3 4.7 3.4Mexico 2.2 2.2 2.7 1.9 2.1 1.3Others 9.1 10.0 10.8 9.9 8.8 10.4

APEC ENERGY HANDBOOK 2017 19
Primary Energy Supply
–––––––––––––––––––––––––––––––––––––– Total primary energy supply per GDP & capita
APEC ––––––––––––––––––––––––––––––––––––––
0.0
0.5
1.0
1.5
2.0
2.5
3.0
0
50
100
150
200
250
1990
1991
1992
1993
1994
1995
1996
1997
1998
1999
2000
2001
2002
2003
2004
2005
2006
2007
2008
2009
2010
2011
2012
2013
2014
2015
2016
2017
Energy Supply per GDP Energy Supply per Capita
toe/capitatoe/million $ at 2011 PPP
1990 1995 2000 2005 2010 2017Population (million) 2 287 2 429 2 554 2 654 2 750 2 885Primary Energy Supply per Capita (toe)
2.06 2.10 2.17 2.47 2.67 2.78
1990 1995 2000 2005 2010 2017GDP ($ 2011 PPP) 23 481 26 732 32 627 39 883 48 445 63 660Primary Energy Supply per GDP (toe/million $ at 2011 PPP)
201.0 190.5 170.0 164.4 151.6 125.9
APEC ENERGY HANDBOOK 2017 18
Prim
ary
Ener
gy S
uppl
y ––––––––––––––––––––––––––––––––––––––
Net import by region APEC
––––––––––––––––––––––––––––––––––––––
Mtoe1990 1995 2000 2005 2010 2017
Australia -64.5 -89.2 -127.1 -148.8 -185.9 -268.8Brunei Darussalam -14.2 -16.2 -17.8 -19.0 -15.6 -12.9Canada -59.3 -119.7 -127.7 -129.9 -144.0 -217.1Chile 7.0 10.8 17.7 20.5 22.3 26.2China -32.4 -10.3 33.5 137.4 333.0 607.4Hong Kong, China 10.9 14.5 19.4 23.5 31.5 31.8Indonesia -68.9 -89.2 -85.3 -89.2 -148.0 -170.5Japan 377.8 408.3 429.2 435.9 409.8 400.8Korea 70.1 134.8 165.7 175.6 221.1 249.3Malaysia -25.9 -28.3 -27.3 -28.4 -15.5 -8.0Mexico -69.9 -69.3 -72.3 -79.6 -40.4 20.9New Zealand 2.1 3.1 3.4 4.9 2.9 5.8Papua New Guinea - -4.3 -2.7 -1.0 0.7 -1.6Peru -0.6 1.8 3.2 3.0 0.1 -0.3Philippines 11.2 17.9 20.1 17.1 17.7 29.3Russia -412.6 -315.0 -349.6 -539.3 -579.1 -664.1Singapore 24.5 32.4 40.8 49.6 67.2 93.3Chinese Taipei 40.1 57.2 76.2 90.8 97.7 104.5Thailand 18.1 31.1 34.4 48.3 52.9 68.7United States 341.9 433.4 606.4 736.1 533.7 174.1Viet Nam -0.2 -4.7 -9.8 -17.7 -7.9 15.3Total 155.2 399.0 630.2 689.9 654.1 484.1
-1 500
-1 000
- 500
500
1 000
1 500
2 000
1990
1991
1992
1993
1994
1995
1996
1997
1998
1999
2000
2001
2002
2003
2004
2005
2006
2007
2008
2009
2010
2011
2012
2013
2014
2015
2016
2017
Mtoe
Other north-east Asia South East Asia OceaniaOther Americas China United StatesRussia APEC

APEC ENERGY HANDBOOK 2017 19
Primary Energy Supply
–––––––––––––––––––––––––––––––––––––– Total primary energy supply per GDP & capita
APEC ––––––––––––––––––––––––––––––––––––––
0.0
0.5
1.0
1.5
2.0
2.5
3.0
0
50
100
150
200
250
1990
1991
1992
1993
1994
1995
1996
1997
1998
1999
2000
2001
2002
2003
2004
2005
2006
2007
2008
2009
2010
2011
2012
2013
2014
2015
2016
2017
Energy Supply per GDP Energy Supply per Capita
toe/capitatoe/million $ at 2011 PPP
1990 1995 2000 2005 2010 2017Population (million) 2 287 2 429 2 554 2 654 2 750 2 885Primary Energy Supply per Capita (toe)
2.06 2.10 2.17 2.47 2.67 2.78
1990 1995 2000 2005 2010 2017GDP ($ 2011 PPP) 23 481 26 732 32 627 39 883 48 445 63 660Primary Energy Supply per GDP (toe/million $ at 2011 PPP)
201.0 190.5 170.0 164.4 151.6 125.9
APEC ENERGY HANDBOOK 2017 18
Prim
ary
Ener
gy S
uppl
y
–––––––––––––––––––––––––––––––––––––– Net import by region
APEC ––––––––––––––––––––––––––––––––––––––
Mtoe1990 1995 2000 2005 2010 2017
Australia -64.5 -89.2 -127.1 -148.8 -185.9 -268.8Brunei Darussalam -14.2 -16.2 -17.8 -19.0 -15.6 -12.9Canada -59.3 -119.7 -127.7 -129.9 -144.0 -217.1Chile 7.0 10.8 17.7 20.5 22.3 26.2China -32.4 -10.3 33.5 137.4 333.0 607.4Hong Kong, China 10.9 14.5 19.4 23.5 31.5 31.8Indonesia -68.9 -89.2 -85.3 -89.2 -148.0 -170.5Japan 377.8 408.3 429.2 435.9 409.8 400.8Korea 70.1 134.8 165.7 175.6 221.1 249.3Malaysia -25.9 -28.3 -27.3 -28.4 -15.5 -8.0Mexico -69.9 -69.3 -72.3 -79.6 -40.4 20.9New Zealand 2.1 3.1 3.4 4.9 2.9 5.8Papua New Guinea - -4.3 -2.7 -1.0 0.7 -1.6Peru -0.6 1.8 3.2 3.0 0.1 -0.3Philippines 11.2 17.9 20.1 17.1 17.7 29.3Russia -412.6 -315.0 -349.6 -539.3 -579.1 -664.1Singapore 24.5 32.4 40.8 49.6 67.2 93.3Chinese Taipei 40.1 57.2 76.2 90.8 97.7 104.5Thailand 18.1 31.1 34.4 48.3 52.9 68.7United States 341.9 433.4 606.4 736.1 533.7 174.1Viet Nam -0.2 -4.7 -9.8 -17.7 -7.9 15.3Total 155.2 399.0 630.2 689.9 654.1 484.1
-1 500
-1 000
- 500
500
1 000
1 500
2 000
1990
1991
1992
1993
1994
1995
1996
1997
1998
1999
2000
2001
2002
2003
2004
2005
2006
2007
2008
2009
2010
2011
2012
2013
2014
2015
2016
2017
Mtoe
Other north-east Asia South East Asia OceaniaOther Americas China United StatesRussia APEC

APEC ENERGY HANDBOOK 2017 21
Primary Energy Supply
–––––––––––––––––––––––––––––––––––––– Total primary energy supply per GDP
1990 vs 2017 by economy ––––––––––––––––––––––––––––––––––––––
*1994 and 2017 data used for Papua New Guinea
100 200 300 400
Russia
Canada
Republic of Korea
China
Papua New Guinea*
Viet Nam
APEC
Thailand
United States
New Zealand
Australia
Malaysia
Brunei
Chile
Chinese Taipei
Japan
Indonesia
Mexico
Singapore
The Philippines
Peru
Hong Kong, China
1990 2017
toe/Million USD at 2011 PPP
APEC ENERGY HANDBOOK 2017 20
Prim
ary
Ener
gy S
uppl
y ––––––––––––––––––––––––––––––––––––––
Total primary energy supply per capita 1990 vs 2017 by economy
––––––––––––––––––––––––––––––––––––––
*1994 and 2017 data used for Papua New Guinea
0 2 4 6 8 10
Brunei Darussalam
Canada
United States of America
Singapore
Republic of Korea
Australia
Russia
Chinese Taipei
New Zealand
Japan
Malaysia
APEC
China
Chile
Thailand
Hong Kong, China
Mexico
Indonesia
Viet Nam
Peru
Philippines
Papua New Guinea*
1990 2017
toe/capita

APEC ENERGY HANDBOOK 2017 21
Primary Energy Supply
–––––––––––––––––––––––––––––––––––––– Total primary energy supply per GDP
1990 vs 2017 by economy ––––––––––––––––––––––––––––––––––––––
*1994 and 2017 data used for Papua New Guinea
100 200 300 400
Russia
Canada
Republic of Korea
China
Papua New Guinea*
Viet Nam
APEC
Thailand
United States
New Zealand
Australia
Malaysia
Brunei
Chile
Chinese Taipei
Japan
Indonesia
Mexico
Singapore
The Philippines
Peru
Hong Kong, China
1990 2017
toe/Million USD at 2011 PPP
APEC ENERGY HANDBOOK 2017 20
Prim
ary
Ener
gy S
uppl
y
–––––––––––––––––––––––––––––––––––––– Total primary energy supply per capita
1990 vs 2017 by economy ––––––––––––––––––––––––––––––––––––––
*1994 and 2017 data used for Papua New Guinea
0 2 4 6 8 10
Brunei Darussalam
Canada
United States of America
Singapore
Republic of Korea
Australia
Russia
Chinese Taipei
New Zealand
Japan
Malaysia
APEC
China
Chile
Thailand
Hong Kong, China
Mexico
Indonesia
Viet Nam
Peru
Philippines
Papua New Guinea*
1990 2017
toe/capita

APEC ENERGY HANDBOOK 2017 23
Primary Energy Supply
–––––––––––––––––––––––––––––––––––––– Primary energy mix by economy
2017 ––––––––––––––––––––––––––––––––––––––
0% 20% 40% 60% 80% 100%
AustraliaBrunei Darussalam
CanadaChile
ChinaHong Kong, China
IndonesiaJapanKorea
MalaysiaMexico
New ZealandPapua New Guinea
PeruPhilippines
RussiaSingapore
Chinese TaipeiThailand
United StatesViet Nam
APEC
Coal Oil Gas Nuclear Hydro Others
APEC ENERGY HANDBOOK 2017 22
Prim
ary
Ener
gy S
uppl
y ––––––––––––––––––––––––––––––––––––––
Primary energy mix by economy 1990
––––––––––––––––––––––––––––––––––––––
*1994 data used for Papua New Guinea
0% 20% 40% 60% 80% 100%
AustraliaBrunei Darussalam
CanadaChile
ChinaHong Kong, China
IndonesiaJapanKorea
MalaysiaMexico
New Zealand Papua New Guinea*
PeruPhilippines
RussiaSingapore
Chinese Taipei Thailand
United States Viet Nam
APEC
Coal Oil Gas Nuclear Hydro Others

APEC ENERGY HANDBOOK 2017 23
Primary Energy Supply
–––––––––––––––––––––––––––––––––––––– Primary energy mix by economy
2017 ––––––––––––––––––––––––––––––––––––––
0% 20% 40% 60% 80% 100%
AustraliaBrunei Darussalam
CanadaChile
ChinaHong Kong, China
IndonesiaJapanKorea
MalaysiaMexico
New ZealandPapua New Guinea
PeruPhilippines
RussiaSingapore
Chinese TaipeiThailand
United StatesViet Nam
APEC
Coal Oil Gas Nuclear Hydro Others
APEC ENERGY HANDBOOK 2017 22
Prim
ary
Ener
gy S
uppl
y
–––––––––––––––––––––––––––––––––––––– Primary energy mix by economy
1990 ––––––––––––––––––––––––––––––––––––––
*1994 data used for Papua New Guinea
0% 20% 40% 60% 80% 100%
AustraliaBrunei Darussalam
CanadaChile
ChinaHong Kong, China
IndonesiaJapanKorea
MalaysiaMexico
New Zealand Papua New Guinea*
PeruPhilippines
RussiaSingapore
Chinese Taipei Thailand
United States Viet Nam
APEC
Coal Oil Gas Nuclear Hydro Others

APEC ENERGY HANDBOOK 2017 25
Transformation
–––––––––––––––––––––––––––––––––––––– Petroleum refining by region
APEC ––––––––––––––––––––––––––––––––––––––
300 600 900
1 2001 5001 8002 1002 4002 700
1990
1991
1992
1993
1994
1995
1996
1997
1998
1999
2000
2001
2002
2003
2004
2005
2006
2007
2008
2009
2010
2011
2012
2013
2014
2015
2016
2017
Mtoe
China Other north-east Asia South-East AsiaOceania United States Other AmericasRussia
Mtoe1990 1995 2000 2005 2010 2017
China 107.3 140.5 196.3 278.1 395.3 557.2Other north-east Asia 251.0 341.6 379.0 390.2 356.9 368.5South-East Asia 110.6 147.2 157.9 172.6 168.7 189.9Oceania 37.0 41.2 43.5 40.8 38.5 29.0United States 753.8 778.9 843.8 861.4 840.7 860.2Other Americas 168.6 173.2 180.0 193.8 182.5 159.3Russia 269.7 178.9 179.9 208.9 250.0 287.0Total 1 698.1 1 801.5 1 980.4 2 145.7 2 232.7 2 451.1
Share (%)1990 1995 2000 2005 2010 2017
China 6.3 7.8 9.9 13.0 17.7 22.7Other north-east Asia 14.8 19.0 19.1 18.2 16.0 15.0South-East Asia 6.5 8.2 8.0 8.0 7.6 7.7Oceania 2.2 2.3 2.2 1.9 1.7 1.2United States 44.4 43.2 42.6 40.1 37.7 35.1Other Americas 9.9 9.6 9.1 9.0 8.2 6.5Russia 15.9 9.9 9.1 9.7 11.2 11.7
APEC ENERGY HANDBOOK 2017 24
Tran
sfor
mat
ion
–––––––––––––––––––––––––––––––––––––– Petroleum refining by product
APEC ––––––––––––––––––––––––––––––––––––––
300 600 900
1 2001 5001 8002 1002 4002 700
1990
1991
1992
1993
1994
1995
1996
1997
1998
1999
2000
2001
2002
2003
2004
2005
2006
2007
2008
2009
2010
2011
2012
2013
2014
2015
2016
2017
Mtoe
Mogas Naphtha Jet Fuel KeroseneGas/Diesel Oil Fuel Oil LPG Others
Mtoe1990 1995 2000 2005 2010 2017
Mogas 504.2 545.2 592.8 630.5 643.8 734.0Naphtha 55.2 71.7 83.4 106.5 116.7 150.4Jet Fuel 123.5 123.1 146.1 156.4 166.3 218.0Kerosene 40.1 45.1 54.1 44.4 28.8 21.4Gas/Diesel Oil 402.3 442.9 517.9 605.2 661.8 737.6Fuel Oil 320.3 292.6 262.9 250.6 216.6 163.6LPG 43.2 51.1 61.7 67.3 81.9 96.2Others 209.3 229.7 261.5 284.8 316.8 329.9Total 1 698.1 1 801.5 1 980.4 2 145.7 2 232.7 2 451.1
Share (%)1990 1995 2000 2005 2010 2017
Mogas 29.7 30.3 29.9 29.4 28.8 29.9Naphtha 3.3 4.0 4.2 5.0 5.2 6.1Jet Fuel 7.3 6.8 7.4 7.3 7.4 8.9Kerosene 2.4 2.5 2.7 2.1 1.3 0.9Gas/Diesel Oil 23.7 24.6 26.1 28.2 29.6 30.1Fuel Oil 18.9 16.2 13.3 11.7 9.7 6.7LPG 2.5 2.8 3.1 3.1 3.7 3.9Others 12.3 12.8 13.2 13.3 14.2 13.5

APEC ENERGY HANDBOOK 2017 27
Transformation
–––––––––––––––––––––––––––––––––––––– Electricity generation by region
APEC ––––––––––––––––––––––––––––––––––––––
TWh1990 1995 2000 2005 2010 2017
China 621 1 019 1 356 2 500 4 207 6 495Other north-east Asia 1 067 1 296 1 540 1 733 1 925 1 909South-East Asia 227 245 358 505 661 954Oceania 187 210 252 275 301 316United States 3 203 3 558 4 026 4 268 4 351 4 258Other Americas 630 756 871 949 976 1 113Russia 1 082 859 876 951 1 036 1 092Total 7 016 7 944 9 279 11 181 13 457 16 137
Share (%)1990 1995 2000 2005 2010 2017
China 8.9 12.8 14.6 22.4 31.3 40.2Other north-east Asia 15.2 16.3 16.6 15.5 14.3 11.8South-East Asia 3.2 3.1 3.9 4.5 4.9 5.9Oceania 2.7 2.6 2.7 2.5 2.2 2.0United States 45.6 44.8 43.4 38.2 32.3 26.4Other Americas 9.0 9.5 9.4 8.5 7.3 6.9Russia 15.4 10.8 9.4 8.5 7.7 6.8
APEC ENERGY HANDBOOK 2017 26
Tran
sfor
mat
ion
–––––––––––––––––––––––––––––––––––––– Electricity generation by type
APEC ––––––––––––––––––––––––––––––––––––––
Note: Others comprise power generated from other renewable energy sources.
TWh1990 1995 2000 2005 2010 2017
Thermal 4 703 5 234 6 383 7 920 9 614 10 969Hydro 1 079 1 248 1 250 1 452 1 780 2 434Nuclear 1 094 1 326 1 496 1 608 1 658 1 615Geothermal 35 34 41 48 53 59Others 106 103 109 154 353 1 061Total 7 016 7 944 9 279 11 181 13 457 16 137
Share (%)1990 1995 2000 2005 2010 2017
Thermal 67.0 65.9 68.8 70.8 71.4 68.0Hydro 15.4 15.7 13.5 13.0 13.2 15.1Nuclear 15.6 16.7 16.1 14.4 12.3 10.0Geothermal 0.5 0.4 0.4 0.4 0.4 0.4Others 1.5 1.3 1.2 1.4 2.6 6.6

APEC ENERGY HANDBOOK 2017 29
Transformation
–––––––––––––––––––––––––––––––––––––– Electricity generation by economy
2017 ––––––––––––––––––––––––––––––––––––––
APEC ENERGY HANDBOOK 2017 28
Tran
sfor
mat
ion
–––––––––––––––––––––––––––––––––––––– Electricity generation by economy
1990 ––––––––––––––––––––––––––––––––––––––
*1994 data used for Papua New Guinea

APEC ENERGY HANDBOOK 2017 31
Final Energy Consum
ption
–––––––––––––––––––––––––––––––––––––– Total final energy consumption by sector
APEC ––––––––––––––––––––––––––––––––––––––
1 000
2 000
3 000
4 000
5 000
1990
1991
1992
1993
1994
1995
1996
1997
1998
1999
2000
2001
2002
2003
2004
2005
2006
2007
2008
2009
2010
2011
2012
2013
2014
2015
2016
2017
Mtoe
Industry Transport Residential /Commercial
Others
Mtoe1990 1995 2000 2005 2010 2017
Industry 1 115.4 1 079.8 1 147.5 1 368.2 1 661.1 1 802.8Transport 854.3 919.4 1 036.8 1 173.6 1 237.2 1 427.1Residential /
Commercial 850.6 993.6 1 048.9 1 134.6 1 197.5 1 301.3Others 244.2 127.4 112.5 166.5 188.8 238.6Total 3 064.5 3 120.3 3 345.7 3 842.9 4 284.6 4 769.8
Share (%)1990 1995 2000 2005 2010 2017
Industry 36.4 34.6 34.3 35.6 38.8 37.8Transport 27.9 29.5 31.0 30.5 28.9 29.9Residential /
Commercial 27.8 31.8 31.4 29.5 27.9 27.3Others 8.0 4.1 3.4 4.3 4.4 5.0
APEC ENERGY HANDBOOK 2017 30
Fina
l Ene
rgy
Con
sum
ptio
n ––––––––––––––––––––––––––––––––––––––
Total final energy consumption by energy APEC
––––––––––––––––––––––––––––––––––––––
1 000
2 000
3 000
4 000
5 000
1990
1991
1992
1993
1994
1995
1996
1997
1998
1999
2000
2001
2002
2003
2004
2005
2006
2007
2008
2009
2010
2011
2012
2013
2014
2015
2016
2017
Mtoe
Coal Oil Gas Electricity Others
Mtoe1990 1995 2000 2005 2010 2017
Coal 549.9 452.4 351.8 541.0 723.2 672.3Oil 1 177.1 1 243.1 1 399.4 1 536.8 1 540.8 1 695.0Gas 504.7 523.6 587.5 585.5 627.0 749.2Electricity 493.7 567.8 669.3 811.5 977.8 1 177.6Others 339.2 333.5 337.7 368.1 415.9 475.8Total 3 064.5 3 120.3 3 345.7 3 842.9 4 284.6 4 769.8
Share (%)1990 1995 2000 2005 2010 2017
Coal 17.9 14.5 10.5 14.1 16.9 14.1Oil 38.4 39.8 41.8 40.0 36.0 35.5Gas 16.5 16.8 17.6 15.2 14.6 15.7Electricity 16.1 18.2 20.0 21.1 22.8 24.7Others 11.1 10.7 10.1 9.6 9.7 10.0

APEC ENERGY HANDBOOK 2017 31
Final Energy Consum
ption ––––––––––––––––––––––––––––––––––––––
Total final energy consumption by sector APEC
––––––––––––––––––––––––––––––––––––––
1 000
2 000
3 000
4 000
5 000
1990
1991
1992
1993
1994
1995
1996
1997
1998
1999
2000
2001
2002
2003
2004
2005
2006
2007
2008
2009
2010
2011
2012
2013
2014
2015
2016
2017
Mtoe
Industry Transport Residential /Commercial
Others
Mtoe1990 1995 2000 2005 2010 2017
Industry 1 115.4 1 079.8 1 147.5 1 368.2 1 661.1 1 802.8Transport 854.3 919.4 1 036.8 1 173.6 1 237.2 1 427.1Residential /
Commercial 850.6 993.6 1 048.9 1 134.6 1 197.5 1 301.3Others 244.2 127.4 112.5 166.5 188.8 238.6Total 3 064.5 3 120.3 3 345.7 3 842.9 4 284.6 4 769.8
Share (%)1990 1995 2000 2005 2010 2017
Industry 36.4 34.6 34.3 35.6 38.8 37.8Transport 27.9 29.5 31.0 30.5 28.9 29.9Residential /
Commercial 27.8 31.8 31.4 29.5 27.9 27.3Others 8.0 4.1 3.4 4.3 4.4 5.0
APEC ENERGY HANDBOOK 2017 30
Fina
l Ene
rgy
Con
sum
ptio
n
–––––––––––––––––––––––––––––––––––––– Total final energy consumption by energy
APEC ––––––––––––––––––––––––––––––––––––––
1 000
2 000
3 000
4 000
5 000
1990
1991
1992
1993
1994
1995
1996
1997
1998
1999
2000
2001
2002
2003
2004
2005
2006
2007
2008
2009
2010
2011
2012
2013
2014
2015
2016
2017
Mtoe
Coal Oil Gas Electricity Others
Mtoe1990 1995 2000 2005 2010 2017
Coal 549.9 452.4 351.8 541.0 723.2 672.3Oil 1 177.1 1 243.1 1 399.4 1 536.8 1 540.8 1 695.0Gas 504.7 523.6 587.5 585.5 627.0 749.2Electricity 493.7 567.8 669.3 811.5 977.8 1 177.6Others 339.2 333.5 337.7 368.1 415.9 475.8Total 3 064.5 3 120.3 3 345.7 3 842.9 4 284.6 4 769.8
Share (%)1990 1995 2000 2005 2010 2017
Coal 17.9 14.5 10.5 14.1 16.9 14.1Oil 38.4 39.8 41.8 40.0 36.0 35.5Gas 16.5 16.8 17.6 15.2 14.6 15.7Electricity 16.1 18.2 20.0 21.1 22.8 24.7Others 11.1 10.7 10.1 9.6 9.7 10.0

APEC ENERGY HANDBOOK 2017 33
Final Energy Consum
ption
–––––––––––––––––––––––––––––––––––––– Total final energy consumption by sector
China ––––––––––––––––––––––––––––––––––––––
Mtoe1990 1995 2000 2005 2010 2017
Industry 340.2 341.3 324.1 581.1 863.1 970.1Transport 29.7 38.8 70.4 124.3 181.6 287.1Residential /
Commercial 112.5 106.0 99.8 151.5 195.1 295.5Others 46.9 56.4 51.8 83.7 108.1 155.5Total 529.3 542.4 546.1 940.5 1 347.8 1 708.2
Share (%)1990 1995 2000 2005 2010 2017
Industry 64.3 62.9 59.4 61.8 64.0 56.8Transport 5.6 7.1 12.9 13.2 13.5 16.8Residential /
Commercial 21.3 19.5 18.3 16.1 14.5 17.3Others 8.9 10.4 9.5 8.9 8.0 9.1
APEC ENERGY HANDBOOK 2017 32
Fina
l Ene
rgy
Con
sum
ptio
n ––––––––––––––––––––––––––––––––––––––
Total final energy consumption by region APEC
––––––––––––––––––––––––––––––––––––––
1 000
2 000
3 000
4 000
5 000
1990
1991
1992
1993
1994
1995
1996
1997
1998
1999
2000
2001
2002
2003
2004
2005
2006
2007
2008
2009
2010
2011
2012
2013
2014
2015
2016
2017
Mtoe
China Other north-east Asia South-East AsiaOceania United States Other AmericasRussia
Mtoe1990 1995 2000 2005 2010 2017
China 529.3 542.4 546.1 940.5 1 347.8 1 708.2Other north-east Asia 342.6 412.0 448.5 462.0 450.3 443.5South-East Asia 131.6 173.7 209.3 280.3 325.5 393.9Oceania 61.8 70.3 78.8 81.8 87.0 93.4United States 1 174.5 1 237.0 1 393.3 1 406.6 1 377.6 1 375.1Other Americas 239.8 261.1 288.3 303.8 316.1 337.1Russia 584.9 423.7 381.6 367.7 380.3 418.6Total 3 064.5 3 120.3 3 345.7 3 842.9 4 284.6 4 769.8
Share (%)1990 1995 2000 2005 2010 2017
China 17.3 17.4 16.3 24.5 31.5 35.8Other north-east Asia 11.2 13.2 13.4 12.0 10.5 9.3South-East Asia 4.3 5.6 6.3 7.3 7.6 8.3Oceania 2.0 2.3 2.4 2.1 2.0 2.0United States 38.3 39.6 41.6 36.6 32.2 28.8Other Americas 7.8 8.4 8.6 7.9 7.4 7.1Russia 19.1 13.6 11.4 9.6 8.9 8.8

APEC ENERGY HANDBOOK 2017 33
Final Energy Consum
ption ––––––––––––––––––––––––––––––––––––––
Total final energy consumption by sector China
––––––––––––––––––––––––––––––––––––––
Mtoe1990 1995 2000 2005 2010 2017
Industry 340.2 341.3 324.1 581.1 863.1 970.1Transport 29.7 38.8 70.4 124.3 181.6 287.1Residential /
Commercial 112.5 106.0 99.8 151.5 195.1 295.5Others 46.9 56.4 51.8 83.7 108.1 155.5Total 529.3 542.4 546.1 940.5 1 347.8 1 708.2
Share (%)1990 1995 2000 2005 2010 2017
Industry 64.3 62.9 59.4 61.8 64.0 56.8Transport 5.6 7.1 12.9 13.2 13.5 16.8Residential /
Commercial 21.3 19.5 18.3 16.1 14.5 17.3Others 8.9 10.4 9.5 8.9 8.0 9.1
APEC ENERGY HANDBOOK 2017 32
Fina
l Ene
rgy
Con
sum
ptio
n
–––––––––––––––––––––––––––––––––––––– Total final energy consumption by region
APEC ––––––––––––––––––––––––––––––––––––––
1 000
2 000
3 000
4 000
5 000
1990
1991
1992
1993
1994
1995
1996
1997
1998
1999
2000
2001
2002
2003
2004
2005
2006
2007
2008
2009
2010
2011
2012
2013
2014
2015
2016
2017
Mtoe
China Other north-east Asia South-East AsiaOceania United States Other AmericasRussia
Mtoe1990 1995 2000 2005 2010 2017
China 529.3 542.4 546.1 940.5 1 347.8 1 708.2Other north-east Asia 342.6 412.0 448.5 462.0 450.3 443.5South-East Asia 131.6 173.7 209.3 280.3 325.5 393.9Oceania 61.8 70.3 78.8 81.8 87.0 93.4United States 1 174.5 1 237.0 1 393.3 1 406.6 1 377.6 1 375.1Other Americas 239.8 261.1 288.3 303.8 316.1 337.1Russia 584.9 423.7 381.6 367.7 380.3 418.6Total 3 064.5 3 120.3 3 345.7 3 842.9 4 284.6 4 769.8
Share (%)1990 1995 2000 2005 2010 2017
China 17.3 17.4 16.3 24.5 31.5 35.8Other north-east Asia 11.2 13.2 13.4 12.0 10.5 9.3South-East Asia 4.3 5.6 6.3 7.3 7.6 8.3Oceania 2.0 2.3 2.4 2.1 2.0 2.0United States 38.3 39.6 41.6 36.6 32.2 28.8Other Americas 7.8 8.4 8.6 7.9 7.4 7.1Russia 19.1 13.6 11.4 9.6 8.9 8.8

APEC ENERGY HANDBOOK 2017 35
Final Energy Consum
ption
–––––––––––––––––––––––––––––––––––––– Total final energy consumption by sector
Other north-east Asia* ––––––––––––––––––––––––––––––––––––––
* In this page, Other north-east Asia includes Hong Kong, China; Republic of Korea and Chinese Taipei
Mtoe1990 1995 2000 2005 2010 2017
Industry 33.0 46.0 60.0 62.0 69.0 72.4Transport 22.5 36.2 41.2 44.0 44.0 50.1Residential /
Commercial 28.9 38.1 44.7 52.3 55.5 58.3Others 3.8 7.1 6.1 5.3 4.6 4.6Total 88.2 127.4 151.9 163.6 173.1 185.3
Share (%)1990 1995 2000 2005 2010 2017
Industry 37.4 36.1 39.5 37.9 39.9 39.1Transport 25.6 28.5 27.1 26.9 25.4 27.0Residential /
Commercial 32.8 29.9 29.4 32.0 32.1 31.4Others 4.3 5.6 4.0 3.2 2.6 2.5
APEC ENERGY HANDBOOK 2017 34
Fina
l Ene
rgy
Con
sum
ptio
n ––––––––––––––––––––––––––––––––––––––
Total final energy consumption by sector Japan
––––––––––––––––––––––––––––––––––––––
Mtoe1990 1995 2000 2005 2010 2017
Industry 108.3 108.6 103.7 103.4 93.3 86.4Transport 68.4 82.2 85.7 81.2 75.9 70.8Residential /
Commercial 71.1 87.7 100.5 107.0 101.9 95.5Others 6.6 6.2 6.7 7.0 6.0 5.5Total 254.4 284.7 296.6 298.5 277.2 258.2
Share (%)1990 1995 2000 2005 2010 2017
Industry 42.6 38.1 35.0 34.6 33.7 33.5Transport 26.9 28.9 28.9 27.2 27.4 27.4Residential /
Commercial 28.0 30.8 33.9 35.8 36.8 37.0Others 2.6 2.2 2.3 2.3 2.2 2.1

APEC ENERGY HANDBOOK 2017 35
Final Energy Consum
ption ––––––––––––––––––––––––––––––––––––––
Total final energy consumption by sector Other north-east Asia*
––––––––––––––––––––––––––––––––––––––
* In this page, Other north-east Asia includes Hong Kong, China; Republic of Korea and Chinese Taipei
Mtoe1990 1995 2000 2005 2010 2017
Industry 33.0 46.0 60.0 62.0 69.0 72.4Transport 22.5 36.2 41.2 44.0 44.0 50.1Residential /
Commercial 28.9 38.1 44.7 52.3 55.5 58.3Others 3.8 7.1 6.1 5.3 4.6 4.6Total 88.2 127.4 151.9 163.6 173.1 185.3
Share (%)1990 1995 2000 2005 2010 2017
Industry 37.4 36.1 39.5 37.9 39.9 39.1Transport 25.6 28.5 27.1 26.9 25.4 27.0Residential /
Commercial 32.8 29.9 29.4 32.0 32.1 31.4Others 4.3 5.6 4.0 3.2 2.6 2.5
APEC ENERGY HANDBOOK 2017 34
Fina
l Ene
rgy
Con
sum
ptio
n
–––––––––––––––––––––––––––––––––––––– Total final energy consumption by sector
Japan ––––––––––––––––––––––––––––––––––––––
Mtoe1990 1995 2000 2005 2010 2017
Industry 108.3 108.6 103.7 103.4 93.3 86.4Transport 68.4 82.2 85.7 81.2 75.9 70.8Residential /
Commercial 71.1 87.7 100.5 107.0 101.9 95.5Others 6.6 6.2 6.7 7.0 6.0 5.5Total 254.4 284.7 296.6 298.5 277.2 258.2
Share (%)1990 1995 2000 2005 2010 2017
Industry 42.6 38.1 35.0 34.6 33.7 33.5Transport 26.9 28.9 28.9 27.2 27.4 27.4Residential /
Commercial 28.0 30.8 33.9 35.8 36.8 37.0Others 2.6 2.2 2.3 2.3 2.2 2.1

APEC ENERGY HANDBOOK 2017 37
Final Energy Consum
ption
–––––––––––––––––––––––––––––––––––––– Total final energy consumption by sector
Oceania ––––––––––––––––––––––––––––––––––––––
Mtoe1990 1995 2000 2005 2010 2017
Industry 22.9 25.3 28.5 27.0 27.5 27.7Transport 24.1 27.0 30.0 32.0 35.0 39.2Residential /
Commercial 13.0 15.9 17.9 19.7 21.5 23.0Others 1.8 2.1 2.4 3.2 3.1 3.5Total 61.8 70.3 78.8 81.8 87.0 93.4
Share (%)1990 1995 2000 2005 2010 2017
Industry 37.1 35.9 36.2 32.9 31.6 29.7Transport 38.9 38.4 38.1 39.1 40.2 42.0Residential /
Commercial 21.0 22.7 22.7 24.0 24.7 24.6Others 3.0 3.0 3.0 3.9 3.5 3.7
APEC ENERGY HANDBOOK 2017 36
Fina
l Ene
rgy
Con
sum
ptio
n ––––––––––––––––––––––––––––––––––––––
Total final energy consumption by sector South-East Asia
––––––––––––––––––––––––––––––––––––––
* Abrupt increase in 2004 is due to the availability of traditional biomass data from Viet Nam
050
100150200250300350400
1990
1991
1992
1993
1994
1995
1996
1997
1998
1999
2000
2001
2002
2003
2004
2005
2006
2007
2008
2009
2010
2011
2012
2013
2014
2015
2016
2017
Mtoe
Industry Transport Residential /Commercial*
Others
Mtoe1990 1995 2000 2005 2010 2017
Industry 40.2 55.6 78.2 103.0 123.2 136.7Transport 29.2 45.8 49.8 71.9 85.6 128.7Residential /
Commercial* 58.2 67.6 75.3 97.6 108.3 120.7Others 4.0 4.7 5.9 7.8 8.4 7.7Total 131.6 173.7 209.3 280.3 325.5 393.9
Share (%)1990 1995 2000 2005 2010 2017
Industry 30.6 32.0 37.4 36.8 37.9 34.7Transport 22.2 26.4 23.8 25.6 26.3 32.7Residential /
Commercial* 44.2 38.9 36.0 34.8 33.3 30.7Others 3.0 2.7 2.8 2.8 2.6 2.0

APEC ENERGY HANDBOOK 2017 37
Final Energy Consum
ption ––––––––––––––––––––––––––––––––––––––
Total final energy consumption by sector Oceania
––––––––––––––––––––––––––––––––––––––
Mtoe1990 1995 2000 2005 2010 2017
Industry 22.9 25.3 28.5 27.0 27.5 27.7Transport 24.1 27.0 30.0 32.0 35.0 39.2Residential /
Commercial 13.0 15.9 17.9 19.7 21.5 23.0Others 1.8 2.1 2.4 3.2 3.1 3.5Total 61.8 70.3 78.8 81.8 87.0 93.4
Share (%)1990 1995 2000 2005 2010 2017
Industry 37.1 35.9 36.2 32.9 31.6 29.7Transport 38.9 38.4 38.1 39.1 40.2 42.0Residential /
Commercial 21.0 22.7 22.7 24.0 24.7 24.6Others 3.0 3.0 3.0 3.9 3.5 3.7
APEC ENERGY HANDBOOK 2017 36
Fina
l Ene
rgy
Con
sum
ptio
n
–––––––––––––––––––––––––––––––––––––– Total final energy consumption by sector
South-East Asia ––––––––––––––––––––––––––––––––––––––
* Abrupt increase in 2004 is due to the availability of traditional biomass data from Viet Nam
050
100150200250300350400
1990
1991
1992
1993
1994
1995
1996
1997
1998
1999
2000
2001
2002
2003
2004
2005
2006
2007
2008
2009
2010
2011
2012
2013
2014
2015
2016
2017
Mtoe
Industry Transport Residential /Commercial*
Others
Mtoe1990 1995 2000 2005 2010 2017
Industry 40.2 55.6 78.2 103.0 123.2 136.7Transport 29.2 45.8 49.8 71.9 85.6 128.7Residential /
Commercial* 58.2 67.6 75.3 97.6 108.3 120.7Others 4.0 4.7 5.9 7.8 8.4 7.7Total 131.6 173.7 209.3 280.3 325.5 393.9
Share (%)1990 1995 2000 2005 2010 2017
Industry 30.6 32.0 37.4 36.8 37.9 34.7Transport 22.2 26.4 23.8 25.6 26.3 32.7Residential /
Commercial* 44.2 38.9 36.0 34.8 33.3 30.7Others 3.0 2.7 2.8 2.8 2.6 2.0

APEC ENERGY HANDBOOK 2017 39
Final Energy Consum
ption
–––––––––––––––––––––––––––––––––––––– Total final energy consumption by sector
United States ––––––––––––––––––––––––––––––––––––––
Mtoe1990 1995 2000 2005 2010 2017
Industry 283.8 272.8 332.3 276.4 270.4 261.4Transport 487.6 527.6 588.2 622.9 595.8 625.4Residential /
Commercial 369.2 421.0 457.1 472.1 477.5 452.3Others 34.0 15.6 15.6 35.2 34.0 36.0Total 1 174.5 1 237.0 1 393.3 1 406.6 1 377.6 1 375.1
Share (%)1990 1995 2000 2005 2010 2017
Industry 24.2 22.1 23.8 19.7 19.6 19.0Transport 41.5 42.6 42.2 44.3 43.2 45.5Residential /
Commercial 31.4 34.0 32.8 33.6 34.7 32.9Others 2.9 1.3 1.1 2.5 2.5 2.6
APEC ENERGY HANDBOOK 2017 38
Fina
l Ene
rgy
Con
sum
ptio
n ––––––––––––––––––––––––––––––––––––––
Total final energy consumption by sector Canada
––––––––––––––––––––––––––––––––––––––
Mtoe1990 1995 2000 2005 2010 2017
Industry 47.2 51.3 55.2 51.0 42.4 45.6Transport 43.1 47.8 52.1 54.6 58.6 61.3Residential /
Commercial 53.2 56.3 60.0 58.8 56.3 59.0Others 3.2 3.8 4.2 8.7 10.6 9.0Total 146.8 159.1 171.5 173.3 167.9 174.9
Share (%)1990 1995 2000 2005 2010 2017
Industry 32.2 32.2 32.2 29.5 25.3 26.1Transport 29.4 30.0 30.4 31.5 34.9 35.0Residential /
Commercial 36.2 35.4 35.0 34.0 33.5 33.7Others 2.2 2.4 2.4 5.0 6.3 5.2

APEC ENERGY HANDBOOK 2017 39
Final Energy Consum
ption ––––––––––––––––––––––––––––––––––––––
Total final energy consumption by sector United States
––––––––––––––––––––––––––––––––––––––
Mtoe1990 1995 2000 2005 2010 2017
Industry 283.8 272.8 332.3 276.4 270.4 261.4Transport 487.6 527.6 588.2 622.9 595.8 625.4Residential /
Commercial 369.2 421.0 457.1 472.1 477.5 452.3Others 34.0 15.6 15.6 35.2 34.0 36.0Total 1 174.5 1 237.0 1 393.3 1 406.6 1 377.6 1 375.1
Share (%)1990 1995 2000 2005 2010 2017
Industry 24.2 22.1 23.8 19.7 19.6 19.0Transport 41.5 42.6 42.2 44.3 43.2 45.5Residential /
Commercial 31.4 34.0 32.8 33.6 34.7 32.9Others 2.9 1.3 1.1 2.5 2.5 2.6
APEC ENERGY HANDBOOK 2017 38
Fina
l Ene
rgy
Con
sum
ptio
n
–––––––––––––––––––––––––––––––––––––– Total final energy consumption by sector
Canada ––––––––––––––––––––––––––––––––––––––
Mtoe1990 1995 2000 2005 2010 2017
Industry 47.2 51.3 55.2 51.0 42.4 45.6Transport 43.1 47.8 52.1 54.6 58.6 61.3Residential /
Commercial 53.2 56.3 60.0 58.8 56.3 59.0Others 3.2 3.8 4.2 8.7 10.6 9.0Total 146.8 159.1 171.5 173.3 167.9 174.9
Share (%)1990 1995 2000 2005 2010 2017
Industry 32.2 32.2 32.2 29.5 25.3 26.1Transport 29.4 30.0 30.4 31.5 34.9 35.0Residential /
Commercial 36.2 35.4 35.0 34.0 33.5 33.7Others 2.2 2.4 2.4 5.0 6.3 5.2

APEC ENERGY HANDBOOK 2017 41
Final Energy Consum
ption
–––––––––––––––––––––––––––––––––––––– Total final energy consumption by sector
Russia ––––––––––––––––––––––––––––––––––––––
Mtoe1990 1995 2000 2005 2010 2017
Industry 208.7 146.7 127.8 123.0 126.3 149.5Transport 115.9 76.1 74.5 88.6 96.5 95.9Residential /
Commercial 119.8 172.4 162.9 145.3 148.5 163.9Others 140.5 28.4 16.3 10.8 9.0 9.3Total 584.9 423.7 381.6 367.7 380.3 418.6
Share (%)1990 1995 2000 2005 2010 2017
Industry 35.7 34.6 33.5 33.5 33.2 35.7Transport 19.8 18.0 19.5 24.1 25.4 22.9Residential /
Commercial 20.5 40.7 42.7 39.5 39.0 39.2Others 24.0 6.7 4.3 2.9 2.4 2.2
APEC ENERGY HANDBOOK 2017 40
Fina
l Ene
rgy
Con
sum
ptio
n ––––––––––––––––––––––––––––––––––––––
Total final energy consumption by sector Other Americas*
––––––––––––––––––––––––––––––––––––––
* Other Americas include Chile; Mexico and Peru.
Mtoe1990 1995 2000 2005 2010 2017
Industry 31.1 32.4 37.6 41.2 45.8 53.0Transport 33.8 38.0 44.9 54.0 64.3 68.7Residential /
Commercial 24.8 28.6 30.7 30.5 32.9 33.1Others 3.4 3.1 3.4 4.8 5.2 7.5Total 93.1 102.0 116.7 130.6 148.2 162.2
Share (%)1990 1995 2000 2005 2010 2017
Industry 33.4 31.7 32.3 31.6 30.9 32.6Transport 36.4 37.2 38.5 41.4 43.4 42.3Residential /
Commercial 26.6 28.0 26.3 23.3 22.2 20.4Others 3.6 3.0 2.9 3.7 3.5 4.6

APEC ENERGY HANDBOOK 2017 41
Final Energy Consum
ption ––––––––––––––––––––––––––––––––––––––
Total final energy consumption by sector Russia
––––––––––––––––––––––––––––––––––––––
Mtoe1990 1995 2000 2005 2010 2017
Industry 208.7 146.7 127.8 123.0 126.3 149.5Transport 115.9 76.1 74.5 88.6 96.5 95.9Residential /
Commercial 119.8 172.4 162.9 145.3 148.5 163.9Others 140.5 28.4 16.3 10.8 9.0 9.3Total 584.9 423.7 381.6 367.7 380.3 418.6
Share (%)1990 1995 2000 2005 2010 2017
Industry 35.7 34.6 33.5 33.5 33.2 35.7Transport 19.8 18.0 19.5 24.1 25.4 22.9Residential /
Commercial 20.5 40.7 42.7 39.5 39.0 39.2Others 24.0 6.7 4.3 2.9 2.4 2.2
APEC ENERGY HANDBOOK 2017 40
Fina
l Ene
rgy
Con
sum
ptio
n
–––––––––––––––––––––––––––––––––––––– Total final energy consumption by sector
Other Americas* ––––––––––––––––––––––––––––––––––––––
* Other Americas include Chile; Mexico and Peru.
Mtoe1990 1995 2000 2005 2010 2017
Industry 31.1 32.4 37.6 41.2 45.8 53.0Transport 33.8 38.0 44.9 54.0 64.3 68.7Residential /
Commercial 24.8 28.6 30.7 30.5 32.9 33.1Others 3.4 3.1 3.4 4.8 5.2 7.5Total 93.1 102.0 116.7 130.6 148.2 162.2
Share (%)1990 1995 2000 2005 2010 2017
Industry 33.4 31.7 32.3 31.6 30.9 32.6Transport 36.4 37.2 38.5 41.4 43.4 42.3Residential /
Commercial 26.6 28.0 26.3 23.3 22.2 20.4Others 3.6 3.0 2.9 3.7 3.5 4.6

APEC ENERGY HANDBOOK 2017 43
Final Energy Consum
ption
–––––––––––––––––––––––––––––––––––––– Oil demand by sector
APEC ––––––––––––––––––––––––––––––––––––––
200 400 600 800
1 0001 2001 4001 6001 800
1990
1991
1992
1993
1994
1995
1996
1997
1998
1999
2000
2001
2002
2003
2004
2005
2006
2007
2008
2009
2010
2011
2012
2013
2014
2015
2016
2017
Mtoe
Industry Transport Residential /Commercial
Others
Mtoe1990 1995 2000 2005 2010 2017
Industry 195.8 171.7 201.9 209.6 203.6 190.5Transport 778.4 848.8 969.3 1 087.5 1 119.9 1 260.5Residential /
Commercial 132.0 146.5 158.4 156.7 130.8 146.2Others 70.9 76.0 69.8 83.0 86.5 97.9Total 1 177.1 1 243.1 1 399.4 1 536.8 1 540.8 1 695.0
Share (%)1990 1995 2000 2005 2010 2017
Industry 16.6 13.8 14.4 13.6 13.2 11.2Transport 66.1 68.3 69.3 70.8 72.7 74.4Residential /
Commercial 11.2 11.8 11.3 10.2 8.5 8.6Others 6.0 6.1 5.0 5.4 5.6 5.8
APEC ENERGY HANDBOOK 2017 42
Fina
l Ene
rgy
Con
sum
ptio
n ––––––––––––––––––––––––––––––––––––––
Coal* demand by sector APEC
––––––––––––––––––––––––––––––––––––––
* Coal and Coal Products
Mtoe1990 1995 2000 2005 2010 2017
Industry 356.4 323.8 262.7 428.3 613.9 562.6Transport 11.2 6.9 4.7 4.4 3.2 1.8Residential /
Commercial 146.1 96.5 69.1 81.8 76.4 73.7Others 36.3 25.1 15.3 26.4 29.7 34.2Total 549.9 452.4 351.8 541.0 723.2 672.3
Share (%)1990 1995 2000 2005 2010 2017
Industry 64.8 71.6 74.7 79.2 84.9 83.7Transport 2.0 1.5 1.3 0.8 0.4 0.3Residential /
Commercial 26.6 21.3 19.7 15.1 10.6 11.0Others 6.6 5.6 4.3 4.9 4.1 5.1

APEC ENERGY HANDBOOK 2017 43
Final Energy Consum
ption
–––––––––––––––––––––––––––––––––––––– Oil demand by sector
APEC ––––––––––––––––––––––––––––––––––––––
200 400 600 800
1 0001 2001 4001 6001 800
1990
1991
1992
1993
1994
1995
1996
1997
1998
1999
2000
2001
2002
2003
2004
2005
2006
2007
2008
2009
2010
2011
2012
2013
2014
2015
2016
2017
Mtoe
Industry Transport Residential /Commercial
Others
Mtoe1990 1995 2000 2005 2010 2017
Industry 195.8 171.7 201.9 209.6 203.6 190.5Transport 778.4 848.8 969.3 1 087.5 1 119.9 1 260.5Residential /
Commercial 132.0 146.5 158.4 156.7 130.8 146.2Others 70.9 76.0 69.8 83.0 86.5 97.9Total 1 177.1 1 243.1 1 399.4 1 536.8 1 540.8 1 695.0
Share (%)1990 1995 2000 2005 2010 2017
Industry 16.6 13.8 14.4 13.6 13.2 11.2Transport 66.1 68.3 69.3 70.8 72.7 74.4Residential /
Commercial 11.2 11.8 11.3 10.2 8.5 8.6Others 6.0 6.1 5.0 5.4 5.6 5.8
APEC ENERGY HANDBOOK 2017 42
Fina
l Ene
rgy
Con
sum
ptio
n
–––––––––––––––––––––––––––––––––––––– Coal* demand by sector
APEC ––––––––––––––––––––––––––––––––––––––
* Coal and Coal Products
Mtoe1990 1995 2000 2005 2010 2017
Industry 356.4 323.8 262.7 428.3 613.9 562.6Transport 11.2 6.9 4.7 4.4 3.2 1.8Residential /
Commercial 146.1 96.5 69.1 81.8 76.4 73.7Others 36.3 25.1 15.3 26.4 29.7 34.2Total 549.9 452.4 351.8 541.0 723.2 672.3
Share (%)1990 1995 2000 2005 2010 2017
Industry 64.8 71.6 74.7 79.2 84.9 83.7Transport 2.0 1.5 1.3 0.8 0.4 0.3Residential /
Commercial 26.6 21.3 19.7 15.1 10.6 11.0Others 6.6 5.6 4.3 4.9 4.1 5.1

APEC ENERGY HANDBOOK 2017 45
Final Energy Consum
ption
–––––––––––––––––––––––––––––––––––––– Electricity demand by sector
APEC ––––––––––––––––––––––––––––––––––––––
200
400
600
800
1 000
1 200
1990
1991
1992
1993
1994
1995
1996
1997
1998
1999
2000
2001
2002
2003
2004
2005
2006
2007
2008
2009
2010
2011
2012
2013
2014
2015
2016
2017
Mtoe
Industry Transport Residential /Commercial
Others
Mtoe1990 1995 2000 2005 2010 2017
Industry 224.6 251.8 290.3 339.9 427.7 536.6Transport 12.3 9.9 10.6 14.3 17.2 23.5Residential /
Commercial 242.6 291.8 352.8 413.4 476.7 534.9Others 14.2 14.2 15.6 43.9 56.2 82.6Total 493.7 567.8 669.3 811.5 977.8 1 177.6
Share (%)1990 1995 2000 2005 2010 2017
Industry 45.5 44.4 43.4 41.9 43.7 45.6Transport 2.5 1.7 1.6 1.8 1.8 2.0Residential /
Commercial 49.1 51.4 52.7 50.9 48.8 45.4Others 2.9 2.5 2.3 5.4 5.8 7.0
APEC ENERGY HANDBOOK 2017 44
Fina
l Ene
rgy
Con
sum
ptio
n ––––––––––––––––––––––––––––––––––––––
Gas demand by sector APEC
––––––––––––––––––––––––––––––––––––––
0100200300400500600700800
1990
1991
1992
1993
1994
1995
1996
1997
1998
1999
2000
2001
2002
2003
2004
2005
2006
2007
2008
2009
2010
2011
2012
2013
2014
2015
2016
2017
Mtoe
Industry Transport Residential /Commercial
Others
Mtoe1990 1995 2000 2005 2010 2017
Industry 194.2 193.2 245.0 234.1 246.5 316.5Transport 52.5 51.1 47.6 56.0 63.9 80.4Residential /
Commercial 255.7 277.0 292.3 291.2 311.5 343.7Others 2.2 2.2 2.7 4.2 5.0 8.6Total 504.7 523.6 587.5 585.5 627.0 749.2
Share (%)1990 1995 2000 2005 2010 2017
Industry 38.5 36.9 41.7 40.0 39.3 42.2Transport 10.4 9.8 8.1 9.6 10.2 10.7Residential /
Commercial 50.7 52.9 49.8 49.7 49.7 45.9Others 0.4 0.4 0.5 0.7 0.8 1.1

APEC ENERGY HANDBOOK 2017 45
Final Energy Consum
ption ––––––––––––––––––––––––––––––––––––––
Electricity demand by sector APEC
––––––––––––––––––––––––––––––––––––––
200
400
600
800
1 000
1 200
1990
1991
1992
1993
1994
1995
1996
1997
1998
1999
2000
2001
2002
2003
2004
2005
2006
2007
2008
2009
2010
2011
2012
2013
2014
2015
2016
2017
Mtoe
Industry Transport Residential /Commercial
Others
Mtoe1990 1995 2000 2005 2010 2017
Industry 224.6 251.8 290.3 339.9 427.7 536.6Transport 12.3 9.9 10.6 14.3 17.2 23.5Residential /
Commercial 242.6 291.8 352.8 413.4 476.7 534.9Others 14.2 14.2 15.6 43.9 56.2 82.6Total 493.7 567.8 669.3 811.5 977.8 1 177.6
Share (%)1990 1995 2000 2005 2010 2017
Industry 45.5 44.4 43.4 41.9 43.7 45.6Transport 2.5 1.7 1.6 1.8 1.8 2.0Residential /
Commercial 49.1 51.4 52.7 50.9 48.8 45.4Others 2.9 2.5 2.3 5.4 5.8 7.0
APEC ENERGY HANDBOOK 2017 44
Fina
l Ene
rgy
Con
sum
ptio
n
–––––––––––––––––––––––––––––––––––––– Gas demand by sector
APEC ––––––––––––––––––––––––––––––––––––––
0100200300
400500
600
700800
1990
1991
1992
1993
1994
1995
1996
1997
1998
1999
2000
2001
2002
2003
2004
2005
2006
2007
2008
2009
2010
2011
2012
2013
2014
2015
2016
2017
Mtoe
Industry Transport Residential /Commercial
Others
Mtoe1990 1995 2000 2005 2010 2017
Industry 194.2 193.2 245.0 234.1 246.5 316.5Transport 52.5 51.1 47.6 56.0 63.9 80.4Residential /
Commercial 255.7 277.0 292.3 291.2 311.5 343.7Others 2.2 2.2 2.7 4.2 5.0 8.6Total 504.7 523.6 587.5 585.5 627.0 749.2
Share (%)1990 1995 2000 2005 2010 2017
Industry 38.5 36.9 41.7 40.0 39.3 42.2Transport 10.4 9.8 8.1 9.6 10.2 10.7Residential /
Commercial 50.7 52.9 49.8 49.7 49.7 45.9Others 0.4 0.4 0.5 0.7 0.8 1.1

APEC ENERGY HANDBOOK 2017 47
Final Energy Consum
ption
–––––––––––––––––––––––––––––––––––––– Energy consumption in industry: APEC
––––––––––––––––––––––––––––––––––––––
*1994 and 2017 data used for Papua New Guinea
0.0 0.5 1.0 1.5 2.0
Canada
Singapore
Russia
Chinese Taipei
Korea
New Zealand
Australia
United States
China
Japan
APEC
Malaysia
Chile
Thailand
Viet Nam
Brunei Darussalam
Mexico
Peru
Indonesia
Papua New Guinea*
Philippines
Hong Kong, China
19902017
toe/capita
APEC ENERGY HANDBOOK 2017 46
Fina
l Ene
rgy
Con
sum
ptio
n ––––––––––––––––––––––––––––––––––––––
Final consumption per capita and GDP APEC
––––––––––––––––––––––––––––––––––––––
0.00.20.40.60.81.01.21.41.61.8
0
20
40
60
80
100
120
140
1990
1991
1992
1993
1994
1995
1996
1997
1998
1999
2000
2001
2002
2003
2004
2005
2006
2007
2008
2009
2010
2011
2012
2013
2014
2015
2016
2017
Final Consumption per GDP Final Consumption per Capita
toe/capitatoe/million $ at 2011 PPP
1990 1995 2000 2005 2010 2016Population (million) 2 287 2 429 2 554 2 654 2 750 2 885Final Consumption per Capita (toe)
1.34 1.28 1.31 1.45 1.56 1.65
1990 1995 2000 2005 2010 2016GDP (billion $ at 2011 PPP) 23 481 26 732 32 627 39 883 48 445 52 752Final Consumption per GDP (toe/million $ at 2011 PPP)
130.51 116.73 102.54 96.35 88.44 86.29

APEC ENERGY HANDBOOK 2017 47
Final Energy Consum
ption ––––––––––––––––––––––––––––––––––––––
Energy consumption in industry: APEC ––––––––––––––––––––––––––––––––––––––
*1994 and 2017 data used for Papua New Guinea
0.0 0.5 1.0 1.5 2.0
Canada
Singapore
Russia
Chinese Taipei
Korea
New Zealand
Australia
United States
China
Japan
APEC
Malaysia
Chile
Thailand
Viet Nam
Brunei Darussalam
Mexico
Peru
Indonesia
Papua New Guinea*
Philippines
Hong Kong, China
19902017
toe/capita
APEC ENERGY HANDBOOK 2017 46
Fina
l Ene
rgy
Con
sum
ptio
n
–––––––––––––––––––––––––––––––––––––– Final consumption per capita and GDP
APEC ––––––––––––––––––––––––––––––––––––––
0.00.20.40.60.81.01.21.41.61.8
0
20
40
60
80
100
120
140
1990
1991
1992
1993
1994
1995
1996
1997
1998
1999
2000
2001
2002
2003
2004
2005
2006
2007
2008
2009
2010
2011
2012
2013
2014
2015
2016
2017
Final Consumption per GDP Final Consumption per Capita
toe/capitatoe/million $ at 2011 PPP
1990 1995 2000 2005 2010 2016Population (million) 2 287 2 429 2 554 2 654 2 750 2 885Final Consumption per Capita (toe)
1.34 1.28 1.31 1.45 1.56 1.65
1990 1995 2000 2005 2010 2016GDP (billion $ at 2011 PPP) 23 481 26 732 32 627 39 883 48 445 52 752Final Consumption per GDP (toe/million $ at 2011 PPP)
130.51 116.73 102.54 96.35 88.44 86.29

APEC ENERGY HANDBOOK 2017 49
Final Energy Consum
ption
–––––––––––––––––––––––––––––––––––––– Energy consumption in residential/
commercial: APEC ––––––––––––––––––––––––––––––––––––––
*1994 and 2017 data used for Papua New Guinea
0.0 0.5 1.0 1.5 2.0 2.5
Canada
Russia
United States
Australia
Korea
Japan
Brunei Darussalam
New Zealand
APEC
Chinese Taipei
Chile
Indonesia
Hong Kong, China
China
Papua New Guinea*
Thailand
Mexico
Singapore
Viet Nam
Peru
Malaysia
Philippines
19902017
toe/capita
APEC ENERGY HANDBOOK 2017 48
Fina
l Ene
rgy
Con
sum
ptio
n –––––––––––––––––––––––––––––––––––––– Energy consumption in transportation: APEC ––––––––––––––––––––––––––––––––––––––
*1994 and 2017 data used for Papua New Guinea
0.0 0.5 1.0 1.5 2.0 2.5
United States
Canada
Australia
New Zealand
Brunei Darussalam
Korea
Malaysia
Russia
Japan
Chinese Taipei
Chile
APEC
Singapore
Thailand
Mexico
Hong Kong, China
Peru
China
Indonesia
Viet Nam
Philippines
Papua New Guinea*
19902017
toe/capita

APEC ENERGY HANDBOOK 2017 49
Final Energy Consum
ption ––––––––––––––––––––––––––––––––––––––
Energy consumption in residential/ commercial: APEC
––––––––––––––––––––––––––––––––––––––
*1994 and 2017 data used for Papua New Guinea
0.0 0.5 1.0 1.5 2.0 2.5
Canada
Russia
United States
Australia
Korea
Japan
Brunei Darussalam
New Zealand
APEC
Chinese Taipei
Chile
Indonesia
Hong Kong, China
China
Papua New Guinea*
Thailand
Mexico
Singapore
Viet Nam
Peru
Malaysia
Philippines
19902017
toe/capita
APEC ENERGY HANDBOOK 2017 48
Fina
l Ene
rgy
Con
sum
ptio
n
–––––––––––––––––––––––––––––––––––––– Energy consumption in transportation: APEC ––––––––––––––––––––––––––––––––––––––
*1994 and 2017 data used for Papua New Guinea
0.0 0.5 1.0 1.5 2.0 2.5
United States
Canada
Australia
New Zealand
Brunei Darussalam
Korea
Malaysia
Russia
Japan
Chinese Taipei
Chile
APEC
Singapore
Thailand
Mexico
Hong Kong, China
Peru
China
Indonesia
Viet Nam
Philippines
Papua New Guinea*
19902017
toe/capita

APEC ENERGY HANDBOOK 2017 51
Final Energy Consum
ption
–––––––––––––––––––––––––––––––––––––– Final energy consumption by sector
2017 ––––––––––––––––––––––––––––––––––––––
APEC ENERGY HANDBOOK 2017 50
Fina
l Ene
rgy
Con
sum
ptio
n ––––––––––––––––––––––––––––––––––––––
Final energy consumption by sector 1990
––––––––––––––––––––––––––––––––––––––
*1994 data used for Papua New Guinea
0% 20% 40% 60% 80% 100%
AustraliaBrunei Darussalam
CanadaChile
ChinaHong Kong, China
IndonesiaJapanKorea
MalaysiaMexico
New ZealandPapua New Guinea *
PeruPhilippines
RussiaSingapore
Chinese TaipeiThailand
United StatesViet Nam
APEC
Industry Transport Residential / commercial Others

APEC ENERGY HANDBOOK 2017 51
Final Energy Consum
ption ––––––––––––––––––––––––––––––––––––––
Final energy consumption by sector 2017
––––––––––––––––––––––––––––––––––––––
APEC ENERGY HANDBOOK 2017 50
Fina
l Ene
rgy
Con
sum
ptio
n
–––––––––––––––––––––––––––––––––––––– Final energy consumption by sector
1990 ––––––––––––––––––––––––––––––––––––––
*1994 data used for Papua New Guinea
0% 20% 40% 60% 80% 100%
AustraliaBrunei Darussalam
CanadaChile
ChinaHong Kong, China
IndonesiaJapanKorea
MalaysiaMexico
New ZealandPapua New Guinea *
PeruPhilippines
RussiaSingapore
Chinese TaipeiThailand
United StatesViet Nam
APEC
Industry Transport Residential / commercial Others

APEC ENERGY HANDBOOK 2017 53
Final Energy Consum
ption
–––––––––––––––––––––––––––––––––––––– Final energy consumption by energy
2017 ––––––––––––––––––––––––––––––––––––––
APEC ENERGY HANDBOOK 2017 52
Fina
l Ene
rgy
Con
sum
ptio
n ––––––––––––––––––––––––––––––––––––––
Final energy consumption by energy 1990
––––––––––––––––––––––––––––––––––––––
*1994 data used for Papua New Guinea

APEC ENERGY HANDBOOK 2017 53
Final Energy Consum
ption ––––––––––––––––––––––––––––––––––––––
Final energy consumption by energy 2017
––––––––––––––––––––––––––––––––––––––
APEC ENERGY HANDBOOK 2017 52
Fina
l Ene
rgy
Con
sum
ptio
n
–––––––––––––––––––––––––––––––––––––– Final energy consumption by energy
1990 ––––––––––––––––––––––––––––––––––––––
*1994 data used for Papua New Guinea

APEC ENERGY HANDBOOK 2017 55
Energy Balances
–––––––––––––––––––––––––––––––––––––––
Unit: ktoeNatural gas,
LNGHydro Nuclear
Geothermal,solar, etc.
OthersElectricity and
HeatTotal
Total Renewables
1 824 041 209 547 418 781 118 959 338 900 52 7 767 859 641 590 421 436 5 196 11 181 2 915 338 5 196
- 474 402 - 5 120 - 10 667 -2 431 110 - 5 120- 222 - 212 210 - 222
- 7 614 1 094 - 26 237 1 0861 763 460 209 547 418 781 118 959 339 849 566 8 013 638 642 531
10 382- 602 026 - 206 340 - 418 782 - 107 203 - 50 330 1 402 929 -1 516 487 - 350 980- 120 612 - 3 208 - 7 980 - 24 111 239 920 - 195 435 - 29 614
- 3 125 - 3 - 14 403 - 3- 85 392
- 272 481- 10 203 - 6 290 - 4 - 9 439 - 6 290
- 170 605 - 516 - 253 371 - 580 362 - 367- 18 937 1 1 - 2 - 462 1 449 6 204 - 471 837 951 3 774 258 138 1 391 489 5 356 225 254 946 749 156 3 774 258 138 1 391 489 4 769 842 254 946 316 476 133 83 430 649 735 1 802 832 78 286 80 396 60 984 23 452 1 427 119 60 983
352 285 3 641 113 724 718 302 1 539 891 115 677 343 716 3 486 105 846 628 354 1 301 253 108 383
3 852 52 5 788 22 993 101 135 5 786 4 717 103 2 090 66 956 137 503 1 647
88 795 586 383
Unit: ktoeNatural gas,
LNGHydro Nuclear
Geothermal,solar, etc.
OthersElectricity and
HeatTotal
Total Renewables
87 821 1 379 2 152 5 382 405 154 8 823 4 924 50 396
- 61 431 - 319 158- 5 036- 4 319
31 314 1 379 2 152 5 382 127 037 8 823 3 473
- 8 409 - 1 379 - 1 139 - 420 19 723 - 31 171 - 2 938- 3 597 - 639 - 724 2 442 - 3 372 - 1 363
- 1 274- 1 142
- 7 192 - 4 050 - 16 231 821 1 4 525
12 937 375 4 238 18 115 81 845 4 522 12 222 375 4 238 18 115 77 015 4 522 6 975 2 960 6 457 22 482 2 870 372 100 504 33 350 100
4 875 375 1 178 11 154 21 183 1 552 4 851 375 1 178 10 984 18 572 1 552
24 170 2 611
715 4 830
APEC ENERGY HANDBOOK 2017 54
Ener
gy B
alan
ces
APEC, 2017
Australia, 2017
Coal Coal products Crude oil, NGLPetroleum products
1 Indigenous production 3 004 949 1 852 6302 Import 447 979 10 643 1 451 911 566 9923 Export - 624 509 - 9 549 - 643 519 - 663 3434 International marine and aviation bunkers - 211 9885 Stock change - 26 672 7 115 2 327 - 2 4876 Total primary energy supply 2 801 747 8 209 2 663 348 - 310 8277 Transfers - 113 900 124 2828 Main activity producers -1 487 912 - 9 235 - 1 504 - 36 0859 Autoproducers - 212 996 - 42 970 - 542 - 22 93710 Gas processing - 9 779 - 11 - 1 48511 Petroleum refineries -2 536 727 2 451 33512 Coal transformation - 515 612 243 583 - 45113 Other transformation 24 570 - 17 51114 Loss & own-use - 37 130 - 16 685 - 10 125 - 91 93215 Discrepancy 22 272 - 1 118 - 12 953 15 95416 Total final consumption 560 590 181 773 12 168 2 110 34317 Total final energy consumption 510 713 161 599 729 1 694 24518 Industry sector 404 858 157 711 717 189 77219 Transport sector 1 789 41 1 260 45820 Other sector 104 066 3 847 12 244 015 20.1 Residential & Commercial 70 199 3 483 146 169 20.2 Agriculture 14 730 261 11 53 448 20.3 Other 19 137 102 1 44 39821 Non-energy 49 877 20 174 11 438 416 098
Coal Coal products Crude oil, NGLPetroleum products
1 Indigenous production 293 104 15 3162 Import 69 120 16 656 28 6273 Export - 244 465 - 227 - 10 751 - 2 2844 International marine and aviation bunkers - 5 0365 Stock change - 4 697 5 28 3456 Total primary energy supply 44 011 - 102 21 249 21 6527 Transfers - 328 3 8018 Main activity producers - 39 182 - 4 - 3619 Autoproducers - 85410 Gas processing11 Petroleum refineries - 23 368 22 09412 Coal transformation - 2 607 1 46513 Other transformation14 Loss & own-use - 922 - 58 - 4 00915 Discrepancy - 139 3 2 520 1 31916 Total final consumption 2 083 440 15 43 64217 Total final energy consumption 2 083 440 15 39 52718 Industry sector 2 072 439 15 3 56419 Transport sector 32 37420 Other sector 11 1 3 589 20.1 Residential & Commercial 11 1 1 172 20.2 Agriculture 2 417 20.3 Other21 Non-energy 4 115

APEC ENERGY HANDBOOK 2017 57
Energy Balances
–––––––––––––––––––––––––––––––––––––––
Unit: ktoeNatural gas,
LNGHydro Nuclear
Geothermal,solar, etc.
OthersElectricity and
HeatTotal
Total Renewables
10 316.6 0.1 16 277.9 0.1 454.9
- 7 591.6 - 13 332.0- 75.6
0.0 69.0 2 725.0 0.1 3 394.3 0.1
- 1 010.2 - 0.1 320.3 - 703.0 - 0.1- 140.1 37.2 - 102.9 262.1 281.3
- 61.2
- 1 140.0 - 87.6 - 1 227.6- 260.5 0.0 - 245.5 436.4 270.0 1 335.5 18.2 270.0 917.2
13.8 150.9 448.4
18.2 256.1 318.0 18.2 256.1 292.9
25 418.2 418.2
Unit: ktoeNatural gas,
LNGHydro Nuclear
Geothermal,solar, etc.
OthersElectricity and
HeatTotal
Total Renewables
153 431 33 752 26 346 2 826 13 557 509 649 49 928 20 081 1 316 851 84 556 1 316
- 71 045 - 1 186 - 6 199 - 301 675 - 1 186- 1 012
- 1 603 - 2 453 100 864 33 752 26 346 2 826 13 687 - 5 348 289 065 50 058
3 925- 7 883 - 31 148 - 26 346 - 2 598 - 917 52 204 - 31 874 - 34 599- 5 838 - 2 604 - 187 - 998 4 965 - 5 141 - 3 789
- 2 137- 816
- 2 845 37- 31 958 - 2 - 10 597 - 58 691 - 2- 4 745 2 10 3 085 1 557 47 595 43 11 780 44 309 195 925 11 676 44 523 43 11 780 44 309 174 916 11 676 14 683 6 597 15 912 45 617 6 450 3 416 2 166 675 61 306 2 166
26 424 43 3 017 27 722 67 993 3 060 25 590 3 017 24 724 58 959 3 017
834 831 6 824 43 2 167 2 210 43
3 072 21 009
APEC ENERGY HANDBOOK 2017 56
Ener
gy B
alan
ces
Brunei Darussalam, 2017
Canada, 2017
Coal Coal products Crude oil, NGLPetroleum products
1 Indigenous production 5 961.22 Import 0.0 454.93 Export - 5 740.44 International marine and aviation bunkers - 75.65 Stock change 80.7 - 11.66 Total primary energy supply 301.4 367.77 Transfers8 Main activity producers - 13.09 Autoproducers10 Gas processing 19.211 Petroleum refineries - 301.4 240.212 Coal transformation13 Other transformation14 Loss & own-use15 Discrepancy 0.0 14.916 Total final consumption 629.117 Total final energy consumption 629.118 Industry sector 137.019 Transport sector 448.420 Other sector 43.6 20.1 Residential & Commercial 18.6 20.2 Agriculture 20.3 Other 2521 Non-energy 0.0
Coal Coal products Crude oil, NGLPetroleum products
1 Indigenous production 30 529 249 2082 Import 4 642 554 45 605 11 5073 Export - 18 470 - 28 - 180 618 - 24 1294 International marine and aviation bunkers - 1 0125 Stock change - 367 158 - 319 - 3226 Total primary energy supply 16 334 684 113 876 - 13 9567 Transfers - 10 441 14 3668 Main activity producers - 13 777 - 1 4099 Autoproducers - 7 - 47210 Gas processing11 Petroleum refineries - 98 006 95 86912 Coal transformation - 1 949 1 13313 Other transformation 2 88214 Loss & own-use - 16 13415 Discrepancy 429 - 184 - 8 311 11 27116 Total final consumption 1 037 1 626 89 53517 Total final energy consumption 1 001 1 579 71 68118 Industry sector 993 1 579 5 85319 Transport sector 55 04920 Other sector 8 10 779 20.1 Residential & Commercial 8 5 620 20.2 Agriculture 5 159 20.3 Other21 Non-energy 36 47 17 854

APEC ENERGY HANDBOOK 2017 59
Energy Balances
–––––––––––––––––––––––––––––––––––––––
Unit: ktoeNatural gas,
LNGHydro Nuclear
Geothermal,solar, etc.
OthersElectricity and
HeatTotal
Total Renewables
1 030 1 833 745 8 086 12 975 10 664 3 505 27 295- 177 - 3 - 1 085
- 753- 13 11 - 90 11
4 345 1 833 745 8 097 - 3 38 342 10 675 26
- 2 168 - 1 829 - 694 - 697 6 193 - 6 499 - 3 220- 107 - 4 - 3 933 635 - 3 550 - 3 937
- 203- 100
- 24 - 124 - 109 - 124- 230 - 14 - 626 - 1 310 - 14- 120 - 1 133 - 197 115 1 696 50 3 462 6 002 26 712 3 511 1 482 50 3 462 6 002 26 158 3 511 801 1 650 3 578 9 923 1 649 17 83 9 155
664 50 1 812 2 341 7 080 1 862 642 1 801 2 184 6 398 1 801 21 6 144 385 6 1 50 5 13 297 55
214 554
Unit: ktoeNatural gas,
LNGHydro Nuclear
Geothermal,solar, etc.
OthersElectricity and
HeatTotal
Total Renewables
134 691 102 326 64 649 33 690 60 830 2 364 795 190 819 84 229 552 684 662- 3 145 - 1 674 - 77 218
- 19 740 1 585
215 775 102 326 64 649 33 690 60 830 - 1 122 2 954 084 190 819
- 32 722 - 102 326 - 64 649 - 33 690 - 18 135 558 665 - 525 870 - 148 131- 9 786 109 486 - 124 804- 770 - 8 674
- 27 615- 210 123
- 325 - 325 - 325- 24 720 - 145 - 104 749 - 178 824 - 145- 5 362 26 - 1 596 9 092
142 415 42 252 560 683 1 886 941 42 252 138 430 42 252 560 683 1 708 188 42 252 66 554 6 384 364 889 970 053 6 384 23 948 12 916 12 195 287 109 12 916 47 929 22 952 183 600 451 026 22 952 43 116 17 376 126 917 295 484 17 376
101 4 069 10 138 47 430 4 069 4 712 1 508 46 545 108 111 1 508 3 985 178 753
APEC ENERGY HANDBOOK 2017 58
Ener
gy B
alan
ces
Chile, 2017
China, 2017
Coal Coal products Crude oil, NGLPetroleum products
1 Indigenous production 982 2992 Import 6 688 8 911 8 1913 Export - 370 - 36 - 4994 International marine and aviation bunkers - 7535 Stock change 70 2 - 13 - 1476 Total primary energy supply 7 370 - 34 9 197 6 7927 Transfers 810 - 7848 Main activity producers - 6 929 - 3759 Autoproducers - 14110 Gas processing11 Petroleum refineries - 10 115 9 91212 Coal transformation - 337 23713 Other transformation 3914 Loss & own-use - 143 - 29715 Discrepancy 113 11 69 10716 Total final consumption 217 71 15 21417 Total final energy consumption 217 71 14 87418 Industry sector 215 71 3 60819 Transport sector 9 05520 Other sector 2 2 211 20.1 Residential & Commercial 1 771 20.2 Agriculture 214 20.3 Other 2 22621 Non-energy 340
Coal Coal products Crude oil, NGLPetroleum products
1 Indigenous production 1 770 059 198 5502 Import 118 435 12 419 462 61 9713 Export - 4 755 - 5 520 - 4 861 - 57 2614 International marine and aviation bunkers - 19 7405 Stock change 16 323 9 356 - 17 018 - 7 0756 Total primary energy supply 1 900 061 3 847 596 134 - 22 1067 Transfers8 Main activity producers - 828 735 - 1 293 - 142 - 2 8439 Autoproducers - 185 826 - 34 344 - 4 33310 Gas processing - 7 836 - 11 - 5711 Petroleum refineries - 584 773 557 15812 Coal transformation - 379 515 169 39213 Other transformation14 Loss & own-use - 36 123 - 6 212 - 3 442 - 3 43415 Discrepancy 24 108 - 425 - 7 112 - 54716 Total final consumption 486 134 130 954 665 523 83717 Total final energy consumption 436 585 112 141 665 417 43218 Industry sector 336 255 108 872 665 86 43419 Transport sector 1 788 41 236 22220 Other sector 98 541 3 229 94 775 20.1 Residential & Commercial 64 802 2 865 40 409 20.2 Agriculture 14 604 261 18 257 20.3 Other 19 135 102 36 11021 Non-energy 49 550 18 813 106 406

APEC ENERGY HANDBOOK 2017 61
Energy Balances
–––––––––––––––––––––––––––––––––––––––
Unit: ktoeNatural gas,
LNGHydro Nuclear
Geothermal,solar, etc.
OthersElectricity and
HeatTotal
Total Renewables
1 110 111 111 3 017 3 1 081 32 178 3
- 115 - 405- 17 595
50 3 017 1 112 966 14 339 114
- 2 402 3 174 - 5 600- 52 8 - 44 - 53
- 299
- 11 - 11 - 11- 375 - 375
- 1 294 615 1 49 3 773 6 715 50 615 1 49 3 773 6 715 50 26 3 190 300 3
4 75 2 078 4 589 1 43 3 508 4 337 43 589 1 43 3 508 4 337 43
Unit: ktoeNatural gas,
LNGHydro Nuclear
Geothermal,solar, etc.
OthersElectricity and
HeatTotal
Total Renewables
62 326 1 602 10 980 52 939 450 505 65 521 96 52 092
- 30 113 - 182 - 222 635 - 182
637 - 38 659 637 32 213 1 602 10 980 53 395 96 241 302 65 977
- 134- 9 704 - 1 602 - 10 980 - 224 21 897 - 52 489 - 12 806
4 805 5 377- 13 469
- 3- 2 256
- 6 359 - 2 699 - 9 140- 3 070 - 105 - 588 17 885 53 171 19 189 168 601 53 171 14 720 53 171 19 189 158 427 53 171 14 345 6 767 6 212 41 599 6 767
3 766 20 48 748 3 766 375 42 638 12 957 68 080 42 638 375 42 638 12 957 65 449 42 638
2 631 3 165 10 174
APEC ENERGY HANDBOOK 2017 60
Ener
gy B
alan
ces
Hong Kong, China, 2017
Indonesia, 2017
Coal Coal products Crude oil, NGLPetroleum products
1 Indigenous production2 Import 6 615 21 4633 Export - 2904 International marine and aviation bunkers - 17 5955 Stock change - 343 3936 Total primary energy supply 6 272 3 9717 Transfers8 Main activity producers - 6 272 - 1009 Autoproducers10 Gas processing - 29911 Petroleum refineries12 Coal transformation13 Other transformation14 Loss & own-use15 Discrepancy - 1 29316 Total final consumption 2 27817 Total final energy consumption 2 27818 Industry sector 8119 Transport sector 2 00020 Other sector 197 20.1 Residential & Commercial 197 20.2 Agriculture 20.3 Other21 Non-energy
Coal Coal products Crude oil, NGLPetroleum products
1 Indigenous production 271 214 51 4432 Import 2 665 21 032 28 2993 Export - 175 072 - 15 249 - 2 0204 International marine and aviation bunkers5 Stock change - 41 754 - 1 282 3 7396 Total primary energy supply 57 054 55 944 30 0187 Transfers - 949 8158 Main activity producers - 48 804 - 3 0729 Autoproducers10 Gas processing 57311 Petroleum refineries - 55 533 42 06512 Coal transformation - 18 1413 Other transformation - 2 25614 Loss & own-use - 8315 Discrepancy 538 2 04916 Total final consumption 8 232 14 70 10917 Total final energy consumption 8 232 14 63 10018 Industry sector 8 232 6 04219 Transport sector 44 96220 Other sector 14 12 096 20.1 Residential & Commercial 14 9 465 20.2 Agriculture 20.3 Other 2 63121 Non-energy 7 009

APEC ENERGY HANDBOOK 2017 63
Energy Balances
–––––––––––––––––––––––––––––––––––––––
Unit: ktoeNatural gas,
LNGHydro Nuclear
Geothermal,solar, etc.
OthersElectricity and
HeatTotal
Total Renewables
2 562 7 124 8 575 7 765 14 022 41 263 22 791 98 214 1 183 419 350 1 183
- 18 520- 11 317
120 1 256 100 896 7 124 8 575 7 765 15 205 432 032 23 974
- 122- 67 366 - 6 930 - 8 575 - 3 261 - 5 178 78 750 - 88 987 - 12 075- 3 026 - 194 - 4 144 - 3 287 12 883 - 8 113 - 6 840 1 656 - 3 269 - 3
2 135- 19 640
- 12 - 186 - 12- 1 156 - 74 - 7 693 - 17 908 - 74- 1 012 - 1 - 429 - 525 - 6 673 29 992 359 6 222 83 415 292 807 4 671 29 768 359 6 222 83 415 258 185 4 671 11 400 1 3 795 29 784 86 386 2 772
51 420 1 501 70 753 420 18 317 358 2 007 52 130 101 046 1 479 18 315 340 1 437 51 848 95 510 1 437
1 8 246 3 620 8 1 10 570 36 1 916 34
224 34 622
Unit: ktoeNatural gas,
LNGHydro Nuclear
Geothermal,solar, etc.
OthersElectricity and
HeatTotal
Total Renewables
305 242 38 674 1 060 7 315 52 49 090 4 718 43 626 316 167
- 66 823- 15 247
- 717 1 - 938 1 43 214 242 38 674 1 060 7 316 52 282 249 4 719
97- 19 747 - 242 - 38 674 - 764 - 1 352 47 493 - 68 127 - 2 234- 1 661 - 71 - 1 220 6 558 - 4 284 - 449
- 110- 6 106
- 11 889 1 010
- 142 - 5 010 - 14 536 504 - 1 - 3 983 4 840
22 168 224 4 741 50 076 183 144 2 035 22 168 224 4 741 50 076 130 635 2 035 7 482 5 3 222 26 497 48 380 704 1 186 528 246 35 623 528
13 500 219 991 23 333 46 632 803 13 497 191 922 21 959 42 660 706
3 28 69 1 126 1 513 97 248 2 459
52 509
APEC ENERGY HANDBOOK 2017 62
Ener
gy B
alan
ces
Japan, 2017
Korea, 2017
Coal Coal products Crude oil, NGLPetroleum products
1 Indigenous production 774 4412 Import 115 611 897 158 758 44 6873 Export - 2 - 860 - 17 6584 International marine and aviation bunkers - 11 3175 Stock change 56 1 414 - 3346 Total primary energy supply 116 383 93 160 613 15 3787 Transfers - 988 8668 Main activity producers - 61 719 - 5 106 - 1 362 - 8 2409 Autoproducers - 4 085 - 1 502 - 1 - 4 75710 Gas processing - 1 38411 Petroleum refineries - 161 960 164 09512 Coal transformation - 40 665 21 476 - 45113 Other transformation 4 487 - 4 66114 Loss & own-use - 264 - 2 747 - 67 - 5 90715 Discrepancy 390 - 505 - 448 - 4 14316 Total final consumption 10 040 11 709 274 150 79617 Total final energy consumption 10 040 11 268 23 117 09018 Industry sector 10 024 11 164 23 20 19519 Transport sector 1 68 78020 Other sector 15 104 28 115 20.1 Residential & Commercial 15 104 23 451 20.2 Agriculture 3 365 20.3 Other 1 29921 Non-energy 441 251 33 706
Coal Coal products Crude oil, NGLPetroleum products
1 Indigenous production 688 7542 Import 81 437 231 152 837 38 0363 Export - 368 - 66 4554 International marine and aviation bunkers - 15 2475 Stock change 242 - 184 - 2806 Total primary energy supply 82 367 231 153 039 - 43 9467 Transfers - 790 8878 Main activity producers - 51 378 - 2 013 - 1 4509 Autoproducers - 3 872 - 2 299 - 1 71910 Gas processing - 11011 Petroleum refineries - 164 455 158 34912 Coal transformation - 23 628 11 73913 Other transformation 12 014 - 11 00414 Loss & own-use - 2 971 - 6 41315 Discrepancy 505 - 78 192 2 73816 Total final consumption 3 994 4 609 97 33217 Total final energy consumption 3 994 4 096 45 33618 Industry sector 3 994 3 597 3 58319 Transport sector 33 66320 Other sector 499 8 090 20.1 Residential & Commercial 499 5 592 20.2 Agriculture 287 20.3 Other 2 21121 Non-energy 513 51 996

APEC ENERGY HANDBOOK 2017 65
Energy Balances
–––––––––––––––––––––––––––––––––––––––
Unit: ktoeNatural gas,
LNGHydro Nuclear
Geothermal,solar, etc.
OthersElectricity and
HeatTotal
Total Renewables
65 039 2 286 28 702 104 683 3 016 6 993 1 49 609
- 30 859 - 239 - 97 - 57 593 - 239- 2 959
32 - 64 32 41 172 2 286 28 495 - 96 93 675 2 809
- 11 864 - 2 286 - 28 - 92 13 694 - 19 777 - 2 406- 1 038 - 143 452 - 729 - 143
- 10 676 - 10 128- 89
- 769 - 1 056 - 2 565 1 119 - 395 - 509
16 826 379 12 598 59 879 379 6 995 379 12 598 47 370 379 6 823 6 141 17 452 147 379 39 21 454 379 25 6 418 8 464 25 6 368 7 791
50 85 588
9 831 12 509
Unit: ktoeNatural gas,
LNGHydro Nuclear
Geothermal,solar, etc.
OthersElectricity and
HeatTotal
Total Renewables
26 566 2 750 2 836 4 295 9 083 164 881 16 107 35 705 185 94 078
- 14 - 155 - 73 217- 4 771
341 - 869 62 598 2 750 2 836 4 295 9 083 30 180 102 16 107
936- 27 026 - 2 669 - 2 836 - 3 155 22 277 - 29 189 - 5 824- 11 289 - 81 - 879 - 1 916 5 416 - 10 302 - 2 855
34 - 741- 2 001- 712
30- 10 855 - 5 243 - 20 824
1 670 - 2 4 901 5 036 15 132 259 7 171 23 381 122 335 7 430 14 736 259 7 171 23 381 117 102 7 430 13 721 14 1 192 12 680 37 347 1 206
47 93 51 420 968 245 5 979 10 608 28 335 6 224 968 245 5 979 7 121 21 619 6 224
995 4 224 2 492 2 492
396 5 233
APEC ENERGY HANDBOOK 2017 64
Ener
gy B
alan
ces
Malaysia, 2017
Mexico, 2017
Coal Coal products Crude oil, NGLPetroleum products
1 Indigenous production 1 883 34 7452 Import 19 168 10 204 13 2433 Export - 382 - 14 960 - 11 0564 International marine and aviation bunkers - 2 9595 Stock change 58 - 297 1436 Total primary energy supply 20 727 29 692 - 6297 Transfers - 1 960 1 9608 Main activity producers - 18 954 - 2469 Autoproducers10 Gas processing 54811 Petroleum refineries - 27 297 27 20812 Coal transformation13 Other transformation14 Loss & own-use - 219 - 52015 Discrepancy 30 - 216 - 4916 Total final consumption 1 803 28 27217 Total final energy consumption 1 803 25 59418 Industry sector 1 803 2 68519 Transport sector 20 88820 Other sector 2 021 20.1 Residential & Commercial 1 398 20.2 Agriculture 35 20.3 Other 58821 Non-energy 2 678
Coal Coal products Crude oil, NGLPetroleum products
1 Indigenous production 6 581 112 7702 Import 6 059 814 623 50 6923 Export - 2 - 67 - 65 061 - 7 9184 International marine and aviation bunkers - 4 7715 Stock change - 696 - 583 696 Total primary energy supply 11 942 747 47 749 38 0727 Transfers - 5 731 6 6678 Main activity producers - 8 245 - 7 5359 Autoproducers - 87 - 1 46610 Gas processing - 77511 Petroleum refineries - 47 106 45 10512 Coal transformation - 1 197 48513 Other transformation 86 - 5614 Loss & own-use - 385 - 4 34115 Discrepancy 130 23 5 002 - 2 69216 Total final consumption 2 630 783 72 97917 Total final energy consumption 2 630 702 68 22318 Industry sector 2 630 702 6 40819 Transport sector 51 28020 Other sector 10 535 20.1 Residential & Commercial 7 306 20.2 Agriculture 3 229 20.3 Other21 Non-energy 81 4 756

APEC ENERGY HANDBOOK 2017 67
Energy Balances
–––––––––––––––––––––––––––––––––––––––
Unit: ktoeNatural gas,
LNGHydro Nuclear
Geothermal,solar, etc.
OthersElectricity and
HeatTotal
Total Renewables
4 179 2 165 5 076 1 283 16 016 8 500 8 304
- 2 477- 1 522
67 382 4 246 2 165 5 076 1 283 20 703 8 500
8- 1 244 - 2 165 - 4 825 - 45 3 677 - 4 732 - 7 035
- 41 - 47 - 150 145 - 276 - 173
- 111- 176
- 242 - 427 - 1 142 83 1 - 49 377
2 802 205 1 088 3 346 14 651 1 292 1 656 205 1 088 3 346 13 174 1 292 1 310 113 917 1 191 4 446 1 030
3 5 5 235 3 346 92 168 2 150 3 493 259 315 76 168 1 868 2 716 243 31 16 215 654 16
67 123 1 146 1 477
Unit: ktoeNatural gas,
LNGHydro Nuclear
Geothermal,solar, etc.
OthersElectricity and
HeatTotal
Total Renewables
3 011 75 361 1 681 6 167 2 118 2 420
- 2 558 - 4 054
- 92 453 75 361 1 681 4 441 2 118
- 47- 56 - 57 - 35 114 - 35 - 93
- 152 - 18 - 361 - 2 275 - 852 - 381 39 39
- 47
- 13 - 13 - 13- 284 - 47 - 331
- 1 90 1 631 342 3 246 1 631 1 631 342 3 246 1 631
66 253 803 66 639
1 565 89 1 804 1 565 1 565 89 1 703 1 703
101
APEC ENERGY HANDBOOK 2017 66
Ener
gy B
alan
ces
New Zealand, 2017
Papua New Guinea, 2017
Coal Coal products Crude oil, NGLPetroleum products
1 Indigenous production 1 653 1 6602 Import 235 5 489 2 5803 Export - 832 - 1 400 - 2454 International marine and aviation bunkers - 1 5225 Stock change 108 34 1736 Total primary energy supply 1 164 5 783 9867 Transfers - 198 2068 Main activity producers - 129 - 19 Autoproducers - 6 - 17710 Gas processing11 Petroleum refineries - 5 690 5 57912 Coal transformation - 443 26713 Other transformation14 Loss & own-use - 70 - 50 - 35315 Discrepancy 13 - 1 105 22516 Total final consumption 529 39 6 64217 Total final energy consumption 529 39 6 31118 Industry sector 438 39 43819 Transport sector 5 22720 Other sector 91 646 20.1 Residential & Commercial 29 260 20.2 Agriculture 62 330 20.3 Other 5621 Non-energy 331
Coal Coal products Crude oil, NGLPetroleum products
1 Indigenous production 1 0382 Import 1 412 1 0083 Export - 1 038 - 4584 International marine and aviation bunkers5 Stock change - 81 - 116 Total primary energy supply 1 331 5407 Transfers - 478 Main activity producers9 Autoproducers - 59410 Gas processing11 Petroleum refineries - 1 421 1 37412 Coal transformation13 Other transformation14 Loss & own-use15 Discrepancy 90 116 Total final consumption 1 27417 Total final energy consumption 1 27418 Industry sector 48319 Transport sector 63920 Other sector 151 20.1 Residential & Commercial 50 20.2 Agriculture 101 20.3 Other21 Non-energy

APEC ENERGY HANDBOOK 2017 69
Energy Balances
–––––––––––––––––––––––––––––––––––––––
Unit: ktoeNatural gas,
LNGHydro Nuclear
Geothermal,solar, etc.
OthersElectricity and
HeatTotal
Total Renewables
12 498 2 499 153 3 038 23 883 5 690 291 1 11 186 291
- 5 478 - 11 267 4
160 23 281 23 7 180 2 499 153 3 352 1 24 087 6 004
- 909- 3 713 - 2 441 - 117 - 89 4 339 - 2 496 - 2 646- 241 - 59 - 4 - 257 226 - 550 - 319
177
- 157 - 157 - 157- 991 - 541 - 1 693- 96 - 33 808
2 139 33 2 850 3 993 19 266 2 883 2 139 33 2 850 3 993 18 963 2 883 1 336 495 2 406 5 681 495 682 278 5 8 111 278 121 33 2 076 1 583 5 170 2 109 121 33 2 072 1 583 5 066 2 105
2 42 2 3 63 3
304
Unit: ktoeNatural gas,
LNGHydro Nuclear
Geothermal,solar, etc.
OthersElectricity and
HeatTotal
Total Renewables
3 226 827 9 030 10 131 30 132 19 990 131 34 550 131
- 5 276- 1 676
65 805 65 3 226 827 9 030 10 327 58 535 20 186
- 3 080 - 827 - 9 030 - 14 8 116 - 18 115 - 9 873- 388 - 388 - 388
- 521
- 2 155 - 2 155 - 2 155- 93 - 1 426 - 1 681
- 43 - 237 - 43 53 7 728 6 690 35 438 7 728 53 7 728 6 690 33 824 7 728 53 1 193 2 199 7 923 1 193
462 10 11 824 462 6 073 4 481 14 077 6 073 6 067 4 261 13 561 6 067
1 220 280 1 4 236 4
1 613
APEC ENERGY HANDBOOK 2017 68
Ener
gy B
alan
ces
Peru, 2017
Philippines, 2017
Coal Coal products Crude oil, NGLPetroleum products
1 Indigenous production 196 5 4992 Import 306 44 6 326 4 2183 Export - 230 - 79 - 5 4804 International marine and aviation bunkers 45 Stock change 381 9 - 65 - 2276 Total primary energy supply 653 53 11 681 - 1 4857 Transfers - 3 300 2 3918 Main activity producers - 160 - 3169 Autoproducers - 40 - 17810 Gas processing11 Petroleum refineries - 8 513 8 69012 Coal transformation13 Other transformation14 Loss & own-use - 16115 Discrepancy 132 80416 Total final consumption 453 53 9 74517 Total final energy consumption 453 53 9 44118 Industry sector 453 53 93819 Transport sector 7 14620 Other sector 1 357 20.1 Residential & Commercial 1 256 20.2 Agriculture 40 20.3 Other 6121 Non-energy 304
Coal Coal products Crude oil, NGLPetroleum products
1 Indigenous production 6 298 6222 Import 11 753 10 418 12 2473 Export - 3 258 - 598 - 1 4204 International marine and aviation bunkers - 1 6765 Stock change 682 235 - 1776 Total primary energy supply 15 475 10 677 8 9747 Transfers8 Main activity producers - 12 312 - 9699 Autoproducers10 Gas processing11 Petroleum refineries - 10 212 9 69012 Coal transformation13 Other transformation14 Loss & own-use - 16315 Discrepancy - 302 10816 Total final consumption 3 163 17 80417 Total final energy consumption 3 008 16 34618 Industry sector 3 008 1 47019 Transport sector 11 35220 Other sector 3 523 20.1 Residential & Commercial 3 233 20.2 Agriculture 59 20.3 Other 23221 Non-energy 155 1 458

APEC ENERGY HANDBOOK 2017 71
Energy Balances
–––––––––––––––––––––––––––––––––––––––
Unit: ktoeNatural gas,
LNGHydro Nuclear
Geothermal,solar, etc.
OthersElectricity and
HeatTotal
Total Renewables
580 954 15 908 53 279 165 7 712 1 429 252 18 643 7 217 5 551 26 841 5
- 187 555 - 30 - 1 462 - 690 924 - 30- 17 148
- 12 281 154 - 15 856 146 388 335 15 908 53 279 165 7 841 - 911 732 165 18 764
- 4- 130 771 - 15 803 - 53 280 - 165 144 009 - 100 179 - 15 968- 68 441 - 106 - 4 216 76 772 - 18 679 - 653
- 3 460- 18 240
- 2 833 - 84 - 4 - 2 921 - 84- 19 768 - 149 - 48 298 - 88 188- 1 227 1 1 - 6 - 12 552
165 295 3 386 171 568 487 942 2 058 125 638 3 386 171 568 418 583 2 058 38 003 1 229 70 251 149 538 76 30 261 6 671 95 861 57 374 2 157 94 646 173 184 1 982 56 046 2 039 90 377 163 886 1 917 1 327 118 4 229 8 613 65
1 40 685 39 657 69 359
Unit: ktoeNatural gas,
LNGHydro Nuclear
Geothermal,solar, etc.
OthersElectricity and
HeatTotal
Total Renewables
15 638 653 334 8 885 68 194 878 68
- 101 628- 57 066
46 - 181 8 931 15 706 36 656 402
199- 6 680 - 15 - 706 3 972 - 3 738 - 402- 891 533 - 521
- 2 616
- 11 - 236 - 2 427- 54 - 2 878
1 295 4 269 24 675 1 295 4 269 11 910 1 150 1 730 6 840
6 237 2 526 139 2 302 2 544 137 2 278 2 518
2 24 26 12 765
APEC ENERGY HANDBOOK 2017 70
Ener
gy B
alan
ces
Russia, 2017
Singapore, 2017
Coal Coal products Crude oil, NGLPetroleum products
1 Indigenous production 222 235 548 9992 Import 17 146 73 625 1 2243 Export - 118 591 - 2 024 - 254 054 - 127 2084 International marine and aviation bunkers - 17 1485 Stock change - 5 299 43 1 626 - 996 Total primary energy supply 115 491 - 1 908 297 196 - 143 2317 Transfers - 48 Main activity producers - 43 356 - 8139 Autoproducers - 12 950 - 3 288 - 541 - 5 90910 Gas processing11 Petroleum refineries - 290 452 286 99212 Coal transformation - 45 518 27 27813 Other transformation14 Loss & own-use - 642 - 960 - 6 176 - 12 19515 Discrepancy - 7 279 1 - 1 - 4 04216 Total final consumption 5 746 21 123 26 120 79817 Total final energy consumption 5 624 21 123 26 91 21818 Industry sector 3 062 21 123 14 15 85619 Transport sector 58 92920 Other sector 2 562 12 16 433 20.1 Residential & Commercial 2 511 12 913 20.2 Agriculture 51 11 2 877 20.3 Other 1 64321 Non-energy 122 29 580
Coal Coal products Crude oil, NGLPetroleum products
1 Indigenous production2 Import 899 57 954 127 0723 Export - 785 - 100 8434 International marine and aviation bunkers - 57 0665 Stock change 142 - 3696 Total primary energy supply 899 57 311 - 31 2067 Transfers 7 292 - 7 0938 Main activity producers - 298 - 119 Autoproducers - 16310 Gas processing11 Petroleum refineries - 58 451 55 83512 Coal transformation13 Other transformation14 Loss & own-use - 2 18015 Discrepancy - 428 - 6 152 3 75616 Total final consumption 173 18 93817 Total final energy consumption 173 6 17318 Industry sector 173 3 78719 Transport sector 2 28320 Other sector 103 20.1 Residential & Commercial 103 20.2 Agriculture 20.3 Other21 Non-energy 12 765

APEC ENERGY HANDBOOK 2017 73
Energy Balances
–––––––––––––––––––––––––––––––––––––––
Unit: ktoeNatural gas,
LNGHydro Nuclear
Geothermal,solar, etc.
OthersElectricity and
HeatTotal
Total Renewables
213 755 5 849 395 1 460 8 677 3 049 19 776 121 846
- 17 386- 4 059
- 3 29 19 985 755 5 849 395 1 460 109 106 3 049
- 249- 15 962 - 755 - 5 849 - 156 - 31 20 145 - 25 884 - 911
- 70 - 138 - 1 036 3 099 - 4 661 - 1 553 278 278
1 653- 3 064
- 311 - 2 215 - 5 839- 357 - 3 - 260 - 445 3 564 102 390 20 769 70 896 574 3 564 102 390 20 769 47 937 574 2 476 390 12 135 23 708 472
122 12 380 1 088 102 8 511 11 848 102 1 084 102 8 250 11 263 102
3 175 182 86 402
22 960
Unit: ktoeNatural gas,
LNGHydro Nuclear
Geothermal,solar, etc.
OthersElectricity and
HeatTotal
Total Renewables
26 384 372 497 25 091 75 973 25 960 14 859 68 2 101 80 625 68
- 16 - 95 - 11 935 - 16- 4 034
- 18 47 - 2 427 47 41 225 372 497 25 191 2 006 138 201 26 060
2- 26 217 - 372 - 487 - 7 082 15 954 - 25 967 - 7 942
- 6 972
- 3 410 - 2 945 - 3 410- 6 488 - 1 398 - 10 029- 772 - 428 - 4 119 - 428 7 748 9 14 271 16 561 88 172 14 280 5 821 9 14 271 16 561 76 832 14 280 3 657 6 974 6 949 27 993 6 974 2 161 1 928 18 28 680 1 928
3 9 5 369 9 594 20 159 5 378 3 9 5 369 9 568 17 482 5 378
26 2 677
1 927 11 340
APEC ENERGY HANDBOOK 2017 72
Ener
gy B
alan
ces
Chinese Taipei, 2017
Thailand, 2017
Coal Coal products Crude oil, NGL Petroleum products
1 Indigenous production 5 2 Import 37 649 182 44 783 19 4573 Export - 1 - 30 - 401 - 16 9554 Internat ional marine and aviat ion bunkers - 4 0595 Stock change - 119 5 - 1 1456 Total primary energy supply 37 530 157 44 386 - 1 4127 Transfers 265 - 5158 M ain act ivity producers - 20 584 - 2 6919 Autoproducers - 4 810 - 971 - 73610 Gas processing 11 Petroleum ref ineries - 44 375 46 02812 Coal transformation - 6 644 3 580 13 Other transformation 14 Loss & own-use - 1 194 - 2 11915 Discrepancy 97 37 - 277 31816 Total f inal consumption 5 588 1 610 38 87417 Total f inal energy consumption 5 574 1 331 16 20718 Industry sector 5 574 1 331 1 80219 Transport sector 12 25820 Other sector 2 147 20.1 Residential & Commercial 1 827 20.2 Agriculture 4 20.3 Other 31621 Non-energy 14 279 22 667
Coal Coal products Crude oil, NGL Petroleum products
1 Indigenous production 4 065 19 563 2 Import 6 343 7 679 46 686 2 8883 Export - 34 - 1 - 1 746 - 10 0444 Internat ional marine and aviat ion bunkers - 4 0345 Stock change - 2 520 - 2 532 6 203 - 3 6076 Total primary energy supply 7 854 5 146 70 707 - 14 7977 Transfers - 6 553 6 5558 M ain act ivity producers - 7 102 - 595 - 659 Autoproducers 10 Gas processing 11 Petroleum ref ineries - 55 509 48 53712 Coal transformation 13 Other transformation 46614 Loss & own-use - 2 14215 Discrepancy - 1 887 - 1 03216 Total f inal consumption 752 4 551 6 757 37 52217 Total f inal energy consumption 752 4 551 34 86718 Industry sector 752 4 551 5 11019 Transport sector 24 57320 Other sector 5 185 20.1 Residential & Commercial 2 533 20.2 Agriculture 2 652 20.3 Other 21 Non-energy 6 757 2 655

APEC ENERGY HANDBOOK 2017 75
Energy Balances
–––––––––––––––––––––––––––––––––––––––
Unit: ktoeNatural gas,
LNGHydro Nuclear
Geothermal,solar, etc.
OthersElectricity and
HeatTotal
Total Renewables
641 678 25 998 218 573 39 696 102 596 1 992 570 163 883 70 405 2 131 5 648 598 648 2 131
- 74 435 - 3 467 - 806 - 424 576 - 3 467- 222 - 48 203 - 222
6 286 124 36 790 124 643 934 25 998 218 573 39 696 101 162 4 842 2 155 229 162 449
3 179- 217 233 - 25 856 - 218 573 - 36 071 - 15 281 361 378 - 463 812 - 74 165- 14 295 - 142 - 1 510 - 5 790 15 988 - 9 066 - 6 718
1 247 - 696- 22 795- 6 576
- 4 501 561- 57 896 - 132 - 54 926 - 145 729 - 132- 4 941 - 1 157 - 2 10 162
346 315 2 114 80 116 327 280 1 520 457 81 591 322 270 2 114 80 116 327 280 1 375 131 81 591 124 643 30 298 71 563 261 423 29 877 18 097 38 034 953 625 379 38 033
179 530 2 114 11 784 254 764 488 329 13 681 178 023 2 114 10 576 235 473 452 345 12 474
1 507 1 208 4 053 20 746 1 207 15 238 15 238
24 045 145 326
Unit: ktoeNatural gas,
LNGHydro Nuclear
Geothermal,solar, etc.
OthersElectricity and
HeatTotal
Total Renewables
7 811 7 652 28 13 245 65 152 20 925 114 25 202- 61 - 9 925
- 1 536 7 811 7 652 28 13 245 53 78 893 20 925
2- 6 768 - 7 652 - 28 - 32 16 834 - 11 244 - 7 712
119
- 1 671 - 1 671- 357 - 858
1 043 13 214 14 859 65 242 13 214 1 043 13 214 14 859 64 614 13 214 1 039 9 299 8 704 34 788 9 299
4 15 038 3 915 6 155 14 788 3 915 3 600 5 780 13 640 3 600 315 375 1 147 315
628
APEC ENERGY HANDBOOK 2017 74
Ener
gy B
alan
ces
United States, 2017
Viet Nam, 2017
Coal Coal products Crude oil, NGL Petroleum products
1 Indigenous production 373 180 590 849 2 Import 4 040 37 442 925 73 4623 Export - 56 797 - 756 - 78 868 - 209 4474 Internat ional marine and aviat ion bunkers - 47 9815 Stock change 11 029 13 14 265 5 0736 Total primary energy supply 331 452 - 706 969 171 - 178 8937 Transfers - 89 951 93 1308 M ain act ivity producers - 306 554 - 224 - 5 3989 Autoproducers - 1 407 - 295 - 1 61510 Gas processing - 1 943 11 Petroleum ref ineries - 882 957 860 16212 Coal transformation - 13 092 6 516 13 Other transformation 5 062 14 Loss & own-use - 31 - 1 101 - 31 64315 Discrepancy 4 399 3 105 7 44516 Total f inal consumption 12 824 4 190 4 430 743 18817 Total f inal energy consumption 12 824 4 190 626 33718 Industry sector 12 353 4 190 18 37619 Transport sector 568 29520 Other sector 471 39 666 20.1 Residential & Commercial 471 25 688 20.2 Agriculture 13 978 20.3 Other 21 Non-energy 4 430 116 851
Coal Coal products Crude oil, NGL Petroleum products
1 Indigenous production 21 509 14 906 2 Import 8 219 1 205 15 6653 Export - 1 248 - 6 942 - 1 6744 Internat ional marine and aviat ion bunkers 5 Stock change 230 - 1 858 936 Total primary energy supply 28 710 7 310 14 0837 Transfers - 1 078 1 0818 M ain act ivity producers - 13 422 - 1779 Autoproducers 10 Gas processing 11 Petroleum ref ineries - 6 232 6 35112 Coal transformation 13 Other transformation 14 Loss & own-use 15 Discrepancy - 96 - 40516 Total f inal consumption 15 192 20 93417 Total f inal energy consumption 15 192 20 30618 Industry sector 12 827 2 91919 Transport sector 15 03420 Other sector 2 365 2 352 20.1 Residential & Commercial 2 352 1 908 20.2 Agriculture 13 445 20.3 Other 21 Non-energy 628

APEC ENERGY HANDBOOK 2017 77
Energy Outlook
–––––––––––––––––––––––––––––––––––––– Primary energy supply outlook by region
––––––––––––––––––––––––––––––––––––––
Other north-east Asia includes Hong Kong, China; Japan; Republic of Korea and Chinese Taipei. Other Americas includes Canada; Chile; Mexico and Peru.
2 000
4 000
6 000
8 000
10 000
12 000
1990 2000 2010 2020 2030 2040 2050
Mtoe
China Other north-east Asia South-East AsiaOceania United States Other AmericasRussia
Mtoe1990 2000 2010 2020 2030 2040 2050
China 871 1 136 2 544 3 095 3 273 3 426 3 556Other north-east Asia 589 817 888 870 867 843 820South-East Asia 223 358 517 693 862 1 045 1 222Oceania 100 130 150 168 181 184 188United States 1 915 2 330 2 282 2 240 2 299 2 329 2 377Other Americas 355 454 499 558 602 645 690Russia 879 619 691 746 805 845 861APEC 21 4 931 5 844 7 570 8 369 8 888 9 316 9 714
Share (%)1990 2000 2010 2020 2030 2040 2050
China 17.7 19.4 33.6 37.0 36.8 36.8 36.6Other north-east Asia 11.9 14.0 11.7 10.4 9.8 9.0 8.4South-East Asia 4.5 6.1 6.8 8.3 9.7 11.2 12.6Oceania 2.0 2.2 2.0 2.0 2.0 2.0 1.9United States 38.8 39.9 30.1 26.8 25.9 25.0 24.5Other Americas 7.2 7.8 6.6 6.7 6.8 6.9 7.1Russia 17.8 10.6 9.1 8.9 9.1 9.1 8.9
APEC ENERGY HANDBOOK 2017 76
Ener
gy O
utlo
ok
–––––––––––––––––––––––––––––––––––––– Primary energy supply outlook by energy
––––––––––––––––––––––––––––––––––––––
Source: Asia Pacific Energy Research Centre, May 2019.
2 000
4 000
6 000
8 000
10 000
12 000
1990 2000 2010 2020 2030 2040 2050
Mtoe
Coal Oil Gas Nuclear Hydro Others
Mtoe1990 2000 2010 2020 2030 2040 2050
Coal 1 377 1 612 2 807 2 742 2 569 2 506 2 414Oil 1 761 2 099 2 277 2 441 2 576 2 657 2 738Gas 994 1 180 1 455 1 889 2 196 2 434 2 663Nuclear 286 390 432 460 535 566 595Hydro 92 107 152 214 239 256 268Others 421 456 447 622 772 898 1 036Total 4 931 5 844 7 570 8 369 8 888 9 316 9 714
Share (%)1990 2000 2010 2020 2030 2040 2050
Coal 27.9 27.6 37.1 32.8 28.9 26.9 24.9Oil 35.7 35.9 30.1 29.2 29.0 28.5 28.2Gas 20.2 20.2 19.2 22.6 24.7 26.1 27.4Nuclear 5.8 6.7 5.7 5.5 6.0 6.1 6.1Hydro 1.9 1.8 2.0 2.6 2.7 2.7 2.8Others 8.5 7.8 5.9 7.4 8.7 9.6 10.7

APEC ENERGY HANDBOOK 2017 79
Energy Indicators
2017 1990 2005 2017 1990 2005 2017 1990 2005 201763 693 4 725 6 002 7 768 155 690 484 4 719 6 558 8 014
8 324 108 158 99 499 726 786 589 845 838 414.6 0.0 0.0 0.1 11 23 32 8.9 14 14 HKC4 933 74 102 41 378 436 401 439 522 432 JPN1 850 23 43 49 70 176 249 93 210 282 ROK1 127 11 13 9 40 91 104 48 99 109 CT
6 839 285 514 743 - 55 - 39 15 208 436 65130.8 15 22 16.3 - 14 - 19 - 12.9 1.2 2.6 3.4 BD
2 954 175 264 451 - 69 - 89 - 171 102 173 241 INA 848 46 96 105 - 26 - 28 - 8 20 66 94 MAS 797 16 21 30 11 17 29 26 38 59 RP
492.5 0.1 0.4 0.7 25 50 93.3 12 21 37 SIN1 127 26 51 76 18 48 69 41 95 138 THA 590 5.8 59 65 - 0.2 - 18 15 5.4 40 79 VN
1 310 169 282 427 - 62 - 145 - 265 99 134 1521 104 158 265 405 - 65 - 149 - 269 86 113 127 AUS 172.8 12 13 16.0 2.1 4.9 5.8 13 17 20.7 NZ 32.7 N.A. 4.3 6.2 N.A. - 1.0 - 1.6 N.A. 3.3 4.4 PNG
4 648 491 686 711 - 123 - 186 - 170 359 496 5321 603 276 402 510 - 59 - 130 - 217 211 273 289 CDA 412 7.9 9.3 13 7.0 20 26 14 28 38 CHL
2 240 196 264 165 - 70 - 80 21 124 181 180 MEX 394 11 10.8 24 - 0.6 3.0 - 0.3 10 14 24 PE
21 224 727 1 527 2 365 - 32 137 607 671 1 676 2 954 PRC3 637 1 293 1 203 1 429 - 413 - 539 - 664 879 652 732 RUS
17 711 1 653 1 631 1 993 342 736 174 1 915 2 319 2 155 USA
Energy Indigenous Production
Net ImportTotal Primary Energy
Supply
Mtoe MtoeMtoe
APEC ENERGY HANDBOOK 2017 78
Ener
gy In
dica
tors
––––––––––––––––––––––––––––––––––––––
Selected energy indicators APEC region
––––––––––––––––––––––––––––––––––––––
1990 2005 2017 1990 2005 2017 1990 2005APEC 2 286 2 654 2 887 19 838 31 761 45 419 23 452 39 878
Other north-east Asia 192 206 209 5 326 7 117 8 298 4 765 6 793 Hong Kong, China 5.7 6.8 7.4 104 189 280.5 154 279 Japan 124 128 127 4 704 5 672 6 141 3 778 4 556 Korea 43 48 51 363 895 1 346 499 1 230 Chinese Taipei 20 23 24 155 362 530 335 728
South-East Asia 389 492 571 736 1 488 2 690 1 882 3 775 Brunei Darussalam 0.3 0.4 0.4 10 13 13.5 22 30 Indonesia 181 226 265 310 571 1 090 839 1 547 Malaysia 18 26 31 82 205 365 190 477 Philippines 62 86 105 95 157 303 248 412 Singapore 3.0 4.3 5.6 69 173 318.4 106 267 Thailand 57 65 69 142 284 424 376 754 Viet Nam 68 84 95 29 85 175 99 287
Oceania 25 31 38 728 1 185 1 642 580 944 Australia 17 20 25 638 1 037 1 441 489 795 New Zealand 3.3 4.1 4.8 84 138 180.6 80 132 Papua New Guinea 4.6 6.5 8.4 6.4 11 20.6 10 17
Other americas 147 182 211 1 804 2 794 3 625 2 243 3 504 Canada 28 32 37 1 012 1 524 1 869 868 1 307 Chile 13 16 18 79 182 272 119 275 Mexico 84 106 125 654 983 1 285 1 140 1 713 Peru 22 28 31 58 106 199 116 210
China 1 135 1 304 1 386 828 3 562 10 132 1 733 7 457Russia 148 144 147 1 416 1 282 1 684 3 061 2 774United States 250 296 325 9 001 14 332 17 349 9 189 14 632
Real GDP
Billion, PPP atconstant 2011USD
Billion (constant 2010 USD)
Population
Millions
Real GDP

APEC ENERGY HANDBOOK 2017 79
Energy Indicators
2017 1990 2005 2017 1990 2005 2017 1990 2005 201763 693 4 725 6 002 7 768 155 690 484 4 719 6 558 8 014
8 324 108 158 99 499 726 786 589 845 838 414.6 0.0 0.0 0.1 11 23 32 8.9 14 14 HKC4 933 74 102 41 378 436 401 439 522 432 JPN1 850 23 43 49 70 176 249 93 210 282 ROK1 127 11 13 9 40 91 104 48 99 109 CT
6 839 285 514 743 - 55 - 39 15 208 436 65130.8 15 22 16.3 - 14 - 19 - 12.9 1.2 2.6 3.4 BD
2 954 175 264 451 - 69 - 89 - 171 102 173 241 INA 848 46 96 105 - 26 - 28 - 8 20 66 94 MAS 797 16 21 30 11 17 29 26 38 59 RP
492.5 0.1 0.4 0.7 25 50 93.3 12 21 37 SIN1 127 26 51 76 18 48 69 41 95 138 THA 590 5.8 59 65 - 0.2 - 18 15 5.4 40 79 VN
1 310 169 282 427 - 62 - 145 - 265 99 134 1521 104 158 265 405 - 65 - 149 - 269 86 113 127 AUS 172.8 12 13 16.0 2.1 4.9 5.8 13 17 20.7 NZ 32.7 N.A. 4.3 6.2 N.A. - 1.0 - 1.6 N.A. 3.3 4.4 PNG
4 648 491 686 711 - 123 - 186 - 170 359 496 5321 603 276 402 510 - 59 - 130 - 217 211 273 289 CDA 412 7.9 9.3 13 7.0 20 26 14 28 38 CHL
2 240 196 264 165 - 70 - 80 21 124 181 180 MEX 394 11 10.8 24 - 0.6 3.0 - 0.3 10 14 24 PE
21 224 727 1 527 2 365 - 32 137 607 671 1 676 2 954 PRC3 637 1 293 1 203 1 429 - 413 - 539 - 664 879 652 732 RUS
17 711 1 653 1 631 1 993 342 736 174 1 915 2 319 2 155 USA
Energy Indigenous Production
Net ImportTotal Primary Energy
Supply
Mtoe MtoeMtoe
APEC ENERGY HANDBOOK 2017 78
Ener
gy In
dica
tors
–––––––––––––––––––––––––––––––––––––– Selected energy indicators
APEC region ––––––––––––––––––––––––––––––––––––––
1990 2005 2017 1990 2005 2017 1990 2005APEC 2 286 2 654 2 887 19 838 31 761 45 419 23 452 39 878
Other north-east Asia 192 206 209 5 326 7 117 8 298 4 765 6 793 Hong Kong, China 5.7 6.8 7.4 104 189 280.5 154 279 Japan 124 128 127 4 704 5 672 6 141 3 778 4 556 Korea 43 48 51 363 895 1 346 499 1 230 Chinese Taipei 20 23 24 155 362 530 335 728
South-East Asia 389 492 571 736 1 488 2 690 1 882 3 775 Brunei Darussalam 0.3 0.4 0.4 10 13 13.5 22 30 Indonesia 181 226 265 310 571 1 090 839 1 547 Malaysia 18 26 31 82 205 365 190 477 Philippines 62 86 105 95 157 303 248 412 Singapore 3.0 4.3 5.6 69 173 318.4 106 267 Thailand 57 65 69 142 284 424 376 754 Viet Nam 68 84 95 29 85 175 99 287
Oceania 25 31 38 728 1 185 1 642 580 944 Australia 17 20 25 638 1 037 1 441 489 795 New Zealand 3.3 4.1 4.8 84 138 180.6 80 132 Papua New Guinea 4.6 6.5 8.4 6.4 11 20.6 10 17
Other americas 147 182 211 1 804 2 794 3 625 2 243 3 504 Canada 28 32 37 1 012 1 524 1 869 868 1 307 Chile 13 16 18 79 182 272 119 275 Mexico 84 106 125 654 983 1 285 1 140 1 713 Peru 22 28 31 58 106 199 116 210
China 1 135 1 304 1 386 828 3 562 10 132 1 733 7 457Russia 148 144 147 1 416 1 282 1 684 3 061 2 774United States 250 296 325 9 001 14 332 17 349 9 189 14 632
Real GDP
Billion, PPP atconstant 2011USD
Billion (constant 2010 USD)
Population
Millions
Real GDP

APEC ENERGY HANDBOOK 2017 81
Energy Indicators
2017 1990 2005 2017 1990 2005 2017 1990 2005 20172.78 238 206 176 201 164 126 1.34 1.45 1.65
4.00 111 119 101 124 124 101 1.78 2.25 2.121.94 86 75 51 58 50 35 0.86 0.98 0.91 HKC3.41 93 92 70 116 115 88 2.06 2.34 2.04 JPN5.48 256 235 210 186 171 153 1.36 2.28 2.54 ROK4.63 311 273 206 144 136 97 1.24 2.06 2.03 CT
1.14 282 293 242 110 115 95 0.34 0.57 0.698.00 124 195 252 54 85 110 1.46 1.80 2.16 BD0.91 328 303 221 121 112 82 0.36 0.53 0.60 INA3.01 244 322 257 105 138 110 0.65 1.34 1.52 MAS0.56 280 242 193 107 92 73 0.30 0.26 0.32 RP6.53 168 122 115 108 79 74 1.02 1.67 2.12 SIN2.00 293 336 326 110 126 123 0.51 0.93 1.11 THA0.83 184 467 450 55 139 134 0.06 0.42 0.68 VN
4.02 136 113 93 171 142 116 2.47 2.64 2.475.16 135 109 88 176 143 115 3.09 3.30 3.13 AUS4.32 154 123 115 161 128 120 2.75 2.90 2.75 NZ0.53 N.A. 309 216 N.A. 194 136 N.A. 0.40 0.38 PNG
2.52 199 178 147 160 142 114 1.63 1.67 1.607.91 209 179 155 243 209 180 5.30 5.37 4.79 CDA2.08 178 156 141 118 103 93 0.77 1.20 1.42 CHL1.44 189 184 140 109 105 80 0.88 0.94 0.94 MEX0.77 170 131 121 86 66 61 0.39 0.40 0.60 PE
2.13 810 470 292 387 225 139 0.47 0.72 1.23 PRC4.99 621 509 435 287 235 201 3.95 2.56 2.85 RUS6.63 213 162 124 208 158 122 4.71 4.76 4.23 USA
toe / Million USDat constant 2010 values
toe / Million USD at 2011 PPP
toe / Person
Total Primary Energy Supply per Real GDP
Total Primary Energy Supply per Real GDP
Total Final Energy Consumption per Capita
APEC ENERGY HANDBOOK 2017 80
Ener
gy In
dica
tors
1990 2005 2017 1990 2005 2017 1990 2005APEC 3 064 3 843 4 770 5 741 9 436 13 693 2.06 2.47
Other north-east Asia 343 462 443 960 1 621 1 772 3.06 4.11 Hong Kong, China 4.9 6.7 6.7 24 40 44 1.56 2.06 Japan 254 298 258 765 1 025 964 3.55 4.09 Korea 58 110 131 94 358 523 2.17 4.36 Chinese Taipei 25 47 48 77 199 242 2.38 4.35
South-East Asia 132 280 394 128 438 866 0.53 0.89 Brunei Darussalam 0.4 0.7 0.9 1.2 2.6 3.1 4.60 7.08 Indonesia 65 119 158 28 107 223 0.56 0.77 Malaysia 12 34 47 20 81 146 1.11 2.57 Philippines 19 22 34 21 45 78 0.43 0.44 Singapore 3.1 7 12 13 35 50 3.78 4.93 Thailand 29 61 77 38 121 193 0.73 1.46 Viet Nam 3.9 35.4 65 6.2 46 173 0.08 0.48
Oceania 62 82 93 158 230 254 3.96 4.31 Australia 53 67 77 129 189 211 5.05 5.56 New Zealand 9 12 13 29 38 39 3.86 4.10 Papua New Guinea N.A. 2.6 3.2 N.A. 3.0 4.0 N.A. 0.51
Other americas 240 304 337 545 774 897 2.44 2.72 Canada 147 173 175 418 513 509 7.63 8.48 Chile 10 19 26 15 48 70 1.06 1.75 Mexico 74 100 117 100 190 272 1.47 1.70 Peru 8.7 11 19 12 23 46 0.45 0.50
China 529 941 1 708 491 1 992 5 406 0.59 1.29Russia 585 368 419 826 650 761 5.94 4.54United States 1 175 1 407 1 375 2 633 3 731 3 737 7.67 7.85
Total Primary Energy Supply
toe / Person
Final Consumption of Electricity
Mtoe TWh
Total Final Energy Consumption

APEC ENERGY HANDBOOK 2017 83
Energy Indicators
1990 2005 2017 1990 2005 2017 1990 2005 2017631.8 524.8 449.5 534.4 418.0 320.6 2.66 2.54 2.55
264.3 267.2 242.6 295.4 280.0 241.9 2.39 2.25 2.40312.4 198.3 127.3 211.4 134.1 86.1 3.65 2.66 2.49 HKC221.5 204.2 183.9 275.8 254.2 228.9 2.38 2.22 2.61 JPN616.4 511.6 429.8 448.6 372.3 312.8 2.41 2.18 2.05 ROK705.6 687.5 509.0 327.2 341.4 239.6 2.27 2.52 2.47 CT
444.6 572.5 489.3 173.8 225.7 192.4 1.57 1.95 2.02373.3 493.0 544.9 163.5 215.9 238.6 3.01 2.53 2.16 BD330.5 563.0 453.6 122.0 207.9 167.4 1.01 1.86 2.05 INA676.7 675.1 578.6 290.8 290.1 248.7 2.77 2.10 2.25 MAS401.9 437.3 401.8 152.9 166.4 152.9 1.43 1.81 2.08 RP423.1 220.3 145.0 273.5 142.4 93.8 2.52 1.81 1.26 SIN580.3 710.4 561.2 218.4 267.3 211.2 1.98 2.12 1.72 THA557.9 904.9 1,124.5 165.8 269.0 334.3 3.04 1.94 2.50 VN
377.1 330.9 257.9 473.9 415.6 323.2 2.77 2.93 2.78394.4 341.1 266.6 514.5 445.0 347.8 2.92 3.12 3.02 AUS274.4 245.1 178.8 286.8 256.2 186.9 1.78 1.99 1.56 NZN.A. 449.9 338.8 N.A. 282.6 212.8 N.A. 1.46 1.57 PNG
401.9 352.5 302.7 323.1 281.0 236.0 2.02 1.98 2.06411.1 340.3 275.2 479.3 396.8 320.9 1.97 1.90 1.78 CDA399.0 302.4 317.0 263.9 200.0 209.7 2.24 1.94 2.25 CHL394.0 389.3 348.5 226.1 223.4 199.9 2.08 2.12 2.49 MEX334.7 271.9 245.2 168.8 137.2 123.7 1.96 2.08 2.02 PE
3,016.0 1,461.3 877.2 1,440.7 698.1 418.8 3.72 3.11 3.01 PRC1,598.7 1,046.2 913.2 739.7 483.4 422.9 2.57 2.06 2.10 RUS
559.7 418.0 296.4 548.3 409.5 290.3 2.63 2.58 2.39 USA
t-CO2 /Million USD at 2011 PPP
t-CO2 / toe
CO2 Emissionper Real GDP
t-CO2 /Million USD at constant
2010 values
CO2 Emissionper Real GDP
CO2 Emission per Total Primary Energy Supply
APEC ENERGY HANDBOOK 2017 82
Ener
gy In
dica
tors
1990 2005 2017 1990 2005 2017APEC 12,533 16,669 20,418 5.48 6.28 7.07
Other north-east Asia 1,408 1,902 2,013 7.32 9.25 9.62 Hong Kong, China 33 37 36 5.70 5.49 4.83 Japan 1,042 1,158 1,129 8.44 9.06 8.91 Korea 224 458 578 5.22 9.50 11.24 Chinese Taipei 109 249 270 5.40 10.94 11.45
South-East Asia 327 852 1,316 0.84 1.73 2.31 Brunei Darussalam 4 7 7 13.84 17.91 17.30 Indonesia 102 322 495 0.56 1.42 1.87 Malaysia 55 138 211 3.07 5.38 6.78 Philippines 38 69 122 0.61 0.79 1.16 Singapore 29 38 46 9.55 8.92 8.23 Thailand 82 202 238 1.45 3.08 3.44 Viet Nam 16 77 197 0.24 0.92 2.08
Oceania 275 392 423 10.98 12.64 11.19 Australia 252 354 384 14.75 17.34 15.61 New Zealand 23 34 32 6.89 8.18 6.74 Papua New Guinea N.A. 5 7 N.A. 0.74 0.83
Other americas 725 985 1,097 4.93 5.40 5.19 Canada 416 519 514 15.03 16.08 14.08 Chile 31 55 86 2.37 3.39 4.68 Mexico 258 383 448 3.07 3.61 3.59 Peru 20 29 49 0.89 1.03 1.55
China 2,496 5,205 8,888 2.20 3.99 6.41Russia 2,264 1,341 1,538 15.30 9.34 10.5United States 5,038 5,992 5,142 20.18 20.28 15.82
t-CO2 / PersonMt-CO2
Energy RelatedCO2 Emission
CO2 Emissionper Capita

APEC ENERGY HANDBOOK 2017 85
Glossary
Kerosene type: A blend of kerosenes suited to flight conditions with particular specifications, such as freezing points.
Kerosene Mixtures of hydrocarbons in the range C9 to C16 and distilling over the temperature interval 145 °C to 300 °C, but not usually above 250 °C and with a flash point above 38 °C.
Diesel oil Diesel oil includes heavy gas oils. Gas oils are obtained from the lowest fraction from atmospheric distillation of crude oil, while heavy gas oils obtained by vacuum re-distillation of the residual from atmospheric distillation.
Fuel oil Comprises residual fuel oil and heavy fuel oil. Residual fuel oils have a distillation range of 350 °C to 650 °C and a kinematic viscosity in the range 6 to 55 centistokes (cSt) at 100 °C. Their flash point is always above 60 °C and their specific gravity is above 0.95. Heavy fuel oil is a general term describing a blended product based on the residues from various refinery processes.
LPG LPG refers to liquefied propane (C3H8) and butane (C4H10) or mixtures of both. Commercial grades are usually mixtures of the gases with small amounts of propylene, butylene, isobutene and isobutylene stored under pressure in containers.
Others The category, "Other oil products", groups together white spirit and SBP, lubricants, bitumen, paraffin waxes, refining gas and others (tar, sulfur and grease).
Gas A mixture of gaseous hydrocarbons, primarily methane, but generally also including ethane, propane and higher hydrocarbons in much smaller amounts and some non-combustible gases such as nitrogen and carbon dioxide. The separation process produces natural gas by removing or reducing the hydrocarbons other than methane to levels which are acceptable in the marketable gas. Natural gas also includes methane recovered from coal mines (colliery gas) or from coal seams and shale formation. When distributed it may contain methane from anaerobic fermentation or the methanation of biomass. Natural gas may be liquefied (LNG) by reducing its temperature in order to simplify storage and transportation when production sites are remote from
APEC ENERGY HANDBOOK 2017 84
Glo
ssar
y ––––––––––––––––––––––––––––––––––––––
Glossary ––––––––––––––––––––––––––––––––––––––
General note The definitions for some items are different from the APEC Energy Statistics publication in order to match with the aggregated product categories. In the energy balance, the definitions of all items are the same as those in the APEC Energy Statistics publication.
Energy products Coal
Includes coal, i.e. solid fossil fuel consisting of carbonized vegetal matter, and coal products derived directly or indirectly from various classes of coal by carbonization or pyrolysis processes, by the aggregation of finely divided coal or by chemical reactions with oxidizing agents, including water.
Oil Liquid hydrocarbons of fossil origins comprising (i) crude oil; (ii) liquids extracted from natural gas (NGL); (iii) fully or partly processed products from the refining of crude oil, and (iv) functionally similar liquid hydrocarbons and organic chemicals from vegetal or animal origins.
Petroleum products Products obtained from crude oil, non-conventional oils or gases from oil and gas fields. They may be produced through refining of conventional crude and non-conventional oils or during the separation of natural gas from gases extracted from oil or gas fields.
Mogas (Motor gasoline) A mixture of some aromatics (e.g., benzene and toluene) and aliphatic hydrocarbons in the C5 to C12 range. The distillation range is 25 °C to 220 °C.
Naphtha Light or medium oils distilling between 30 °C and 210 °C which do not meet the specification for motor gasoline.
Jet fuel Jet fuel comprises both gasoline and kerosene type jet fuels meeting specifications for use in aviation turbine power units. Gasoline type: Light hydrocarbon for use in aviation turbine power units, distilling between 100 °C and 250 °C. They are obtained by blending kerosene and gasoline or naphtha in such a way that the aromatic content does not exceed 25 per cent in volume, and the vapour pressure is between 13.7 kPa and 20.6 kPa.

APEC ENERGY HANDBOOK 2017 85
Glossary
Kerosene type: A blend of kerosenes suited to flight conditions with particular specifications, such as freezing points.
Kerosene Mixtures of hydrocarbons in the range C9 to C16 and distilling over the temperature interval 145 °C to 300 °C, but not usually above 250 °C and with a flash point above 38 °C.
Diesel oil Diesel oil includes heavy gas oils. Gas oils are obtained from the lowest fraction from atmospheric distillation of crude oil, while heavy gas oils obtained by vacuum re-distillation of the residual from atmospheric distillation.
Fuel oil Comprises residual fuel oil and heavy fuel oil. Residual fuel oils have a distillation range of 350 °C to 650 °C and a kinematic viscosity in the range 6 to 55 centistokes (cSt) at 100 °C. Their flash point is always above 60 °C and their specific gravity is above 0.95. Heavy fuel oil is a general term describing a blended product based on the residues from various refinery processes.
LPG LPG refers to liquefied propane (C3H8) and butane (C4H10) or mixtures of both. Commercial grades are usually mixtures of the gases with small amounts of propylene, butylene, isobutene and isobutylene stored under pressure in containers.
Others The category, "Other oil products", groups together white spirit and SBP, lubricants, bitumen, paraffin waxes, refining gas and others (tar, sulfur and grease).
Gas A mixture of gaseous hydrocarbons, primarily methane, but generally also including ethane, propane and higher hydrocarbons in much smaller amounts and some non-combustible gases such as nitrogen and carbon dioxide. The separation process produces natural gas by removing or reducing the hydrocarbons other than methane to levels which are acceptable in the marketable gas. Natural gas also includes methane recovered from coal mines (colliery gas) or from coal seams and shale formation. When distributed it may contain methane from anaerobic fermentation or the methanation of biomass. Natural gas may be liquefied (LNG) by reducing its temperature in order to simplify storage and transportation when production sites are remote from
APEC ENERGY HANDBOOK 2017 84
Glo
ssar
y
–––––––––––––––––––––––––––––––––––––– Glossary
––––––––––––––––––––––––––––––––––––––General note
The definitions for some items are different from the APEC Energy Statistics publication in order to match with the aggregated product categories. In the energy balance, the definitions of all items are the same as those in the APEC Energy Statistics publication.
Energy products Coal
Includes coal, i.e. solid fossil fuel consisting of carbonized vegetal matter, and coal products derived directly or indirectly from various classes of coal by carbonization or pyrolysis processes, by the aggregation of finely divided coal or by chemical reactions with oxidizing agents, including water.
Oil Liquid hydrocarbons of fossil origins comprising (i) crude oil; (ii) liquids extracted from natural gas (NGL); (iii) fully or partly processed products from the refining of crude oil, and (iv) functionally similar liquid hydrocarbons and organic chemicals from vegetal or animal origins.
Petroleum products Products obtained from crude oil, non-conventional oils or gases from oil and gas fields. They may be produced through refining of conventional crude and non-conventional oils or during the separation of natural gas from gases extracted from oil or gas fields.
Mogas (Motor gasoline) A mixture of some aromatics (e.g., benzene and toluene) and aliphatic hydrocarbons in the C5 to C12 range. The distillation range is 25 °C to 220 °C.
Naphtha Light or medium oils distilling between 30 °C and 210 °C which do not meet the specification for motor gasoline.
Jet fuel Jet fuel comprises both gasoline and kerosene type jet fuels meeting specifications for use in aviation turbine power units. Gasoline type: Light hydrocarbon for use in aviation turbine power units, distilling between 100 °C and 250 °C. They are obtained by blending kerosene and gasoline or naphtha in such a way that the aromatic content does not exceed 25 per cent in volume, and the vapour pressure is between 13.7 kPa and 20.6 kPa.

APEC ENERGY HANDBOOK 2017 87
Glossary
- Non-ferrous metals basic industries- Non-metallic mineral products such as glass, ceramic, cement, etc.- Transport equipment- Machinery. Fabricated metal products, machinery and equipment other
than transport equipment - Mining (excluding fuels) and quarrying- Food processing, beverages and tobacco- Pulp, paper and printing- Wood and wood products (other than pulp and paper)- Construction- Textiles and leather- Collection, purification and distribution of water- Non-specified (any manufacturing industry not included above)
Transport The transportation sector is disaggregated into the following sub-sectors: - Domestic air transport- Road transport- Railways- Internal navigation - Pipeline transport- Other transport
Residential and commercial Residential shows all consumption by households Commercial shows consumption of the commercial and public sectors.
Others Agriculture, fishing and others.
Non-energy Non-energy use in industry, transport and other sectors. Examples of these are the feedstocks in the production of chemicals, lubricants used in equipment, bitumen used for paving of roads, etc.
APEC ENERGY HANDBOOK 2017 86
Glo
ssar
y centres of consumption and pipeline transportation is not economically practicable.
Hydro The primary equivalent of electricity generated from hydroelectric power plants.
Nuclear The primary equivalent of electricity and heat generated from nuclear fuels.
Others Others is the sum of geothermal power, wind, tide, photovoltaic power, biomass, etc.
Total renewables Total renewables is the sum of hydro and others minus non-renewable parts of industrial wastes and municipal solid wastes.
Sectors Indigenous production
Quantities of fuels extracted within the economy. Net imports
Defined as imports minus exports. Total primary energy supply (TPES)
Calculated from indigenous production plus imports minus exports minus international marine and aviation bunkers plus or minus stock change.
Refining The transformation of crude oil, NGL and condensate to petroleum products.
Power generation Production of electricity from thermal, hydro, nuclear, geothermal and other power plants of public utilities and auto-producers. An auto-producer is an establishment which, in addition to its main activities, generates electricity wholly or partially for its own use, such as industries, railways, refineries, etc.
Total final consumption This is the sum of total final energy consumption and non-energy use.
Total final energy consumption (TFEC) Total energy consumption of industry, transport, residential, commercial and other sectors. This excludes non-energy use.
Industry These sectors include the following branches: - Iron and steel industry- Chemical industry

APEC ENERGY HANDBOOK 2017 87
Glossary
- Non-ferrous metals basic industries- Non-metallic mineral products such as glass, ceramic, cement, etc.- Transport equipment- Machinery. Fabricated metal products, machinery and equipment other
than transport equipment - Mining (excluding fuels) and quarrying- Food processing, beverages and tobacco- Pulp, paper and printing- Wood and wood products (other than pulp and paper)- Construction- Textiles and leather- Collection, purification and distribution of water- Non-specified (any manufacturing industry not included above)
Transport The transportation sector is disaggregated into the following sub-sectors: - Domestic air transport- Road transport- Railways- Internal navigation - Pipeline transport- Other transport
Residential and commercial Residential shows all consumption by households Commercial shows consumption of the commercial and public sectors.
Others Agriculture, fishing and others.
Non-energy Non-energy use in industry, transport and other sectors. Examples of these are the feedstocks in the production of chemicals, lubricants used in equipment, bitumen used for paving of roads, etc.
APEC ENERGY HANDBOOK 2017 86
Glo
ssar
y
centres of consumption and pipeline transportation is not economically practicable.
Hydro The primary equivalent of electricity generated from hydroelectric power plants.
Nuclear The primary equivalent of electricity and heat generated from nuclear fuels.
Others Others is the sum of geothermal power, wind, tide, photovoltaic power, biomass, etc.
Total renewables Total renewables is the sum of hydro and others minus non-renewable parts of industrial wastes and municipal solid wastes.
Sectors Indigenous production
Quantities of fuels extracted within the economy. Net imports
Defined as imports minus exports. Total primary energy supply (TPES)
Calculated from indigenous production plus imports minus exports minus international marine and aviation bunkers plus or minus stock change.
Refining The transformation of crude oil, NGL and condensate to petroleum products.
Power generation Production of electricity from thermal, hydro, nuclear, geothermal and other power plants of public utilities and auto-producers. An auto-producer is an establishment which, in addition to its main activities, generates electricity wholly or partially for its own use, such as industries, railways, refineries, etc.
Total final consumption This is the sum of total final energy consumption and non-energy use.
Total final energy consumption (TFEC) Total energy consumption of industry, transport, residential, commercial and other sectors. This excludes non-energy use.
Industry These sectors include the following branches: - Iron and steel industry- Chemical industry