APAC Ecommerce Report
38
Pattern’s view on which markets and online marketplaces offer consumer brands the best growth opportunities in Asia Pacific May 2021 APAC Ecommerce Report
Transcript of APAC Ecommerce Report

1
01 EXECUTIVE SUMMARY
Europe’s new normal
Pattern’s view on which markets and online marketplaces offer consumer brands the best growth opportunities in Asia Pacific
May 2021
APAC Ecommerce Report

Talk to us about growing your APAC ecommerce sales nowChina, Japan & South East Asia: [email protected]: [email protected]
Our global footprint
GUANGZHOU MELBOURNEDUBAI
SALT LAKE CITY LONDON MUNICHTEGELEN HONG KONG SHANGHAI
SYDNEY
PATTERN OFFICES
/2

/3
INTRODUCTION
About this report
Thanks for downloading our latest piece of content on ecommerce in the Asia Pacific region. We have had a presence in APAC for nearly a decade; first landing in Australia, then Hong Kong and mainland China, and more recently Japan and South East Asia.
Each of these markets is very different in a number of ways, however the data we present on the following pages shows that they have two things in common; strong ecommerce sales growth and marketplaces being a key online sales channel for Western consumer brands.
While we’ve bought them together in this report, brands who want to enter these markets online or grow their ecommerce sales should be aware of these differences and focus on the ones that are the best fit for their brand. One marketplace won’t give you coverage of the entire region.
Pattern runs a market ranking exercise for the brands we partner with, to determine which APAC markets and marketplaces are the best fit for their brand and provide the most opportunity. Factors we consider include, product suitability, existing cross-border sales, brand awareness, local competition and the cost of acquisition marketing to drive sales.
During 2021 we will launch Western brands on Tmall and JD.com in China, Amazon in Japan and Australia, and Lazada across South East Asia. In addition, we partner with brands already selling on those marketplaces to improve their presence and drive profitable sales growth.
2021 is a year of recovery. Now is the perfect time to revisit APAC expansion plans that may have been put on hold during the pandemic and ensure your brand is benefiting from this fast-growth region.
Contents
4EXECUTIVE SUMMARY
5KEY COUNTRIESProfiling Australia, China, Indonesia, Japan, Malaysia, Philippines, Singapore, South Korea, Thailand & Vietnam.
25MARKETPLACESKey APAC marketplaces profiled: Amazon, Coupang, JD, Lazada, Rakuten, Shopee and Tmall.
35THE POWER OF SOCIAL SELLING
36SELLING CROSS-BORDER IN APAC
37THE ROLE OF D2C SITES
38ABOUT PATTERNOur marketplace trade partner and consulting proposition explained.

/4
EXECUTIVE SUMMARY
Executive summaryThis diverse region benefits from ecommerce growth opportunities in both its mature and emerging markets. Capitalising on them requires local knowledge and a willingness to invest to reach scale.
On the face if it, markets such as China, Australia, South Korea and Indonesia couldn’t seem more different. Each is culturally unique, at a different stage of ecommerce development; and they vary hugely in the number and spending power of their online shoppers.
Yet they have some clear factors in common that means the region, and individual markets should definitely be on the radar of Western brands who feel that they’ve maximised their growth potential in their home markets.
These include:l Economies that are bouncing
back relatively quickly from the COVID-19 pandemic;
l Relatively high ecommerce growth rates and further ecommerce penetration potential;
l Marketplaces being a key online route to market.
In particular, China’s scale and willingness to embrace online shopping makes it attractive, South Korea has some of the most tech-savvy citizens on earth, and Australians speak English; making it a natural market to expand to for USA and UK brands.
While all this is true, there can also be reasons why these markets may be difficult to crack. Entering China requires significant investment in brand awareness and acquisition marketing, as well as a willingness to take a longer-term view on breaking even.
Executing a marketplace-first strategy for South Korea means listing on local player Coupang, which few Westerners have experience of. And when selling through marketplaces in Australia you’ll face fierce competition from the country’s established omnichannel retailers.
We’ve set out some of the most important datapoints that you need to understand when you are first exploring whether any of these markets could be right for your brand.
When creating an ecommerce strategy for markets in this region you must also think about the models and partners to use. For the majority of these markets we recommend cross-border selling as a starting point; and many of the marketplaces profiled in this report are great for enabling this.
Not only do they allow cross-border selling, but they are developing infrastructure to make it quicker and easier for Western brands to ship orders into the region too – Coupang and Tmall have both invested in Western warehouses.
Lazada, Shopee and Amazon all serve multiple markets. For this reason, you must think strategically about the APAC trade partner or trade partners you work with to ensure that they have the experience and scale to support you in all of the countries that these marketplaces supply.
We’ve set out some of the most important datapoints that you need to understand when you are first exploring whether any of these markets could be right for your brand

AustraliaPOPULATION
25.5MURBANISATION
86%MEDIAN AGE
38
/5
KEY COUNTRIES
Sources:United Nations, World Bank, Statista, Global Web Index, Hootsuite, We Are Social, SimilarWeb, Internet Retailing, Australian Broadcasting Corporation, Sydney Morning Herald
Australia’s economic record in 2020 was a game of two halves. The economy shrank by 1.1% overall, but after the steepest quarterly GDP fall in history, the rebound in the second half of the year was equally as impressive. Australia is expected to be back to pre-COVID GDP levels by the middle of 2021.
One of the drivers of the bounce back has been consumer spending, particularly online spending. Online shopping volumes grew by 44% according to AusPost, based on the difference in number of parcels it delivered in January 2021 and the same month in 2020.
Though stores were able to open in the final quarter of 2020, part of the shift in behaviour to shop online has stuck. Online sales in December 2020 were up 55% year on year, according to the Australian Bureau of Statistics, and more than 5.6 million Australian households shopped online that month; 21% more than in December 2019.
The competition among the key ecommerce sites in Australia is quite different to other markets in the region. First, the share of traffic and sales is split among a much larger group of retailers and marketplaces than in other markets, as offline retailers developed sophisticated ecommerce sites. eBay has been very successful in the market and Amazon was a relatively late entrant.
Amazon.com also appears in the list of top shopping sites alongside the local version. It can still be cheaper for Australian shoppers to buy products from the US site than the local version, and the product selection is also still considerably larger.
Amazon opened a local operation in late 2017 and has not been as quick to grow its sales as some commentators had anticipated. However, 2020 was a turning point.
Data from our own research in the Australian market shows that Amazon benefited from the restrictions on physical retail in 2020. When we polled Australian online shoppers in August 2020, 47% reported that they had bought something from Amazon.com.au in the past year, up from 30% who had done so a year previously.
While Australia is a relatively small market by population size, the wealth of its inhabitants and the fact the majority live in metro areas makes it a great target market for selling online. The population is not fast-growing, but the percentage of total retail sales that are online is still relatively small, and so double-digit ecommerce sales growth is predicted for at least the next three years.
Though stores were able to open in the final quarter of 2020, part of the shift in behaviour to shop online has stuck
/6
KEY COUNTRIES
B2C ECOMMERCE SPEND AS A PERCENTAGE OF TOTAL B2C RETAIL SPEND
7%
PERCENTAGE OF INTERNET USERS THAT USE SHOPPING APPS
57%
VALUE OF MARKET FOR ONLINE CONSUMER GOODS PURCHASES (USD)
$20BN
PERCENTAGE OF INTERNET USERS THAT PURCHASED A PRODUCT ONLINE
70%
AVERAGE ANNUAL REVENUE PER ONLINE CONSUMER (USD)
$1527TOP 4 SHOPPING SITES BY TRAFFIC SHARE
INTERNET PENETRATION
86%
AustraliaPOPULATION
25.5MURBANISATION
86%MEDIAN AGE
3812%6%4%3%Sources:
United Nations, World Bank, Statista, Global Web Index, Hootsuite, We Are Social, SimilarWeb

ChinaPOPULATION
1.4BNURBANISATION
61%MEDIAN AGE
38
/7
KEY COUNTRIES
Bouncing back relatively quickly from the pandemic compared to Western countries, China still managed to achieve 2.3% growth in its economy in 2020, with the final quarter back up to 6.5% growth compared to the prior year.
Retail sales contracted slightly for the whole of 2020, but in the final quarter of the year grew 4.6%. And online sales of consumer goods rose by 14.8% according to official figures, now making up about one-quarter of total retail sales.
The Chinese government is targeting further GDP growth of more than 6% in 2021; but notes that there are some impediments to consumer spending.
Ecommerce has come a long way in China in a decade, and Chinese online shoppers should be considered amongst the most sophisticated in the world. The online spend per customer average of US$1276 makes Chinese customers as valuable as those in the West.
However, unlike Western economies, there are still several hundred million consumers who are yet to gain internet access. For this reason, we expect significant further online sales growth as the rest of the population comes online, in addition to those that already shop online buying more.
Chinese ecommerce is dominated by three big players Alibaba – which runs Tmall, Tmall Global and Taobao – JD.com and newer entrant Pinduoduo. In addition to this, smaller specialist marketplaces have emerged to become expert in particular product categories and larger brands tend to have a Chinese direct-to-consumer site too.
Western brands focus their marketplace presence on Tmall and JD.com, while Pinduoduo has taken market share by selling cheaper items to consumers who are newer to ecommerce in China’s smaller cities.
Pinduoduo is believed to have slightly more active users than Alibaba but has not yet had the same success at attracting Western premium and luxury brands to join the platform.. It recorded a GMV of US$256 billion in 2020, and its users tend to make lower value purchases on the platform.
Many Chinese consumers primarily or only access the internet on mobile devices. Both Tmall and JD.com report high usage of their mobile apps. Pinduoduo has taken this a step further – the marketplace is mobile-app only.
Marketing strategies for China also need to take into account the bias towards mobile apps – and should include WeChat, Douyin (the Chinese version of Tiktok) and, for premium brands selling cross-border, social shopping site RED. We also discuss the importance of livestreaming in more detail on p35.
Sources:United Nations, World Bank, Statista, Global Web Index, Hootsuite, We Are Social, SimilarWeb, CNBC, Pinduoduo
Ecommerce has come a long way in China in a decade, and Chinese online shoppers should be considered amongst the most sophisticated in the world

/8
KEY COUNTRIES
B2C ECOMMERCE SPEND AS A PERCENTAGE OF TOTAL B2C RETAIL SPEND
23%
PERCENTAGE OF INTERNET USERS THAT USE SHOPPING APPS
82%
VALUE OF MARKET FOR ONLINE CONSUMER GOODS PURCHASES (USD)
$877BN
PERCENTAGE OF INTERNET USERS THAT PURCHASED A PRODUCT ONLINE
78%
AVERAGE ANNUAL REVENUE PER ONLINE CONSUMER (USD)
$1276TOP 4 SHOPPING SITES BY TRAFFIC SHARE
INTERNET PENETRATION
67%
ChinaPOPULATION
1.4BNURBANISATION
61%MEDIAN AGE
38
Sources:United Nations, World Bank, Statista, Global Web Index, Hootsuite, We Are Social, SimilarWeb

/9
KEY COUNTRIES
IndonesiaPOPULATION
273.5MURBANISATION
56%MEDIAN AGE
30
An economic growth engine of Southeast Asia, 2020 was the first time that the Indonesian economy had shrunk in more than 20 years after experiencing the highest COVID-19 caseload and death toll in the region. Down by 2.1% in 2020, the good news is that GDP is forecast to bounce back at circa 5% growth in 2021.
The Indonesian government is hoping to inoculate more than 180 million of its 273 million population, to get ahead of further waves of the virus and boost both consumer sentiment and spending.
The statistics for Indonesia show huge growth potential. Between 2015 and 2019 the Indonesian ecommerce market grew at a compound annual growth rate of 88%, with the value of products sold online worth US$18 billion.
While the majority of the population is online, and the majority of those have purchased something on the web, online’s share of total retail sales is still very low at 3%. As an emerging economy, Indonesian average online spend is also low at US$241 per person each year.
However, as with several other markets in the region there will be two drivers of growth – more of the current population coming online and those already shopping online buying more. Though the country is made up of more than 17,000 islands, more than half of the population lives on the largest island Java, and the capital Jakarta has more than 30 million citizens within the metropolitan area.
Indonesia is said to be online marketplace Shopee’s biggest contributor to its overall web traffic, but there are two other local Indonesian marketplaces also present – Tokopedia and Bukalapak. Lazada is the other international marketplace with a presence in the country. Shopee and Lazada are the platforms probably best suited to Western brands who want to grow their online sales in the market.
Despite Alibaba owning Lazada, it has also invested in Tokopedia, which has more than 100 million customers and 10 million merchants, the majority of whom are Indonesian and new entrepreneurs. Tokopedia claims to reach 99% of districts in the country.
Meanwhile Bukalapak has formed a partnership with Microsoft. As well as adopting the tech giant’s platform for cloud computing, Microsoft has made a strategic investment in the marketplace. It has six million online merchants, another six million offline merchants and 100 million customers.
Sources:United Nations, World Bank, Statista, Global Web Index, Hootsuite, We Are Social, SimilarWeb, Reuters, Statista, Tamebay, Web Retailer, Tokopedia, The Jakarta Post
Between 2015 and 2019 the Indonesian ecommerce market grew at a compound annual growth rate of 88%, with the value of products sold online worth US$18 billion

/10
KEY COUNTRIES
B2C ECOMMERCE SPEND AS A PERCENTAGE OF TOTAL B2C RETAIL SPEND
3%
PERCENTAGE OF INTERNET USERS THAT USE SHOPPING APPS
55%
VALUE OF MARKET FOR ONLINE CONSUMER GOODS PURCHASES (USD)
$18BN
PERCENTAGE OF INTERNET USERS THAT PURCHASED A PRODUCT ONLINE
88%
AVERAGE ANNUAL REVENUE PER ONLINE CONSUMER (USD)
$241INTERNET PENETRATION
73% TOP 4 SHOPPING SITES BY TRAFFIC SHARE
23%21%6.5%6.5%
IndonesiaPOPULATION
273.5MURBANISATION
56%MEDIAN AGE
30
Sources:United Nations, World Bank, Statista, Global Web Index, Hootsuite, We Are Social, SimilarWeb

/11
KEY COUNTRIES
JapanPOPULATION
126MURBANISATION
92%MEDIAN AGE
48
While Japan managed to contain its COVID-19 outbreak better than many other developed nations, its economy paid the price, with GDP shrinking by 4.8% in 2020.
After the worst quarterly contraction in the Japanese economy since the Second World War in the second quarter, a bounce back in the second half of the year was driven by private consumption.
A large economic stimulus package announced in December 2020 include subsidy programmes to drive domestic travel and consumer spending, and $9.6 billion to accelerate digital transformation.
It is one of the paradoxes of the Japanese market, that despite seeming to be very technologically advanced in many ways, online shopping penetration has lagged that of less economically developed Asian markets, standing at only 8%.
While the internet penetration rate is high, and the majority of those with internet access buy something online, Japanese consumers are conservative and so much consumer spending remains offline.
Even at the height of the pandemic, when the Japanese government asked the population to practice restraint about leaving their homes, only 37% said they spent more online.
The research conducted in May 2020, by Rakuten Insight, saw 56% of respondents saying that the pandemic had no impact on their online shopping behaviour.
Despite this, Japan is still an attractive market for brands to sell to consumers online, and there are three online marketplaces that between them provide good coverage of the market.
Rakuten Ichiba is a domestic Japanese marketplace which provides a platform for third-party sellers only. Amazon is the second important player; and sells goods directly as well as allowing third-party sellers.
The third is a newer entrant PayPay Mall, which was launched by Yahoo Japan in 2019 and has taken its lead from Alibaba in combining a mobile payments app and online shopping destination. It has quickly bought a new dynamic to the market, which was previously dominated by the other two players.
PayPay Mall allows retailers and brands to create a store in the online mall; and was launched to complement the PayPay smartphone payment app, which has had 35 million Japanese users since its launch in October 2018. Some 2.8 million stores and merchants accept PayPay, and the business also launched PayPay Flea, for consumer-to-consumer transactions.
Cross-border shopping is not as popular in Japan as other Asian markets, and so a local entity or marketplace seller partner is ideal for brands who want to list and sell their products on any of these three marketplaces.
Sources:United Nations, World Bank, Statista, Global Web Index, Hootsuite, We Are Social, SimilarWeb, Nikkei, Tamebay, Web Retailer, BBC, Statista

/12
KEY COUNTRIES
B2C ECOMMERCE SPEND AS A PERCENTAGE OF TOTAL B2C RETAIL SPEND
8%
PERCENTAGE OF INTERNET USERS THAT USE SHOPPING APPS
45%
VALUE OF MARKET FOR ONLINE CONSUMER GOODS PURCHASES (USD)
$91BN
PERCENTAGE OF INTERNET USERS THAT PURCHASED A PRODUCT ONLINE
69%
AVERAGE ANNUAL REVENUE PER ONLINE CONSUMER (USD)
$1119INTERNET PENETRATION
86% TOP 4 SHOPPING SITES BY TRAFFIC SHARE
21%21%4.5%3%
JapanPOPULATION
126MURBANISATION
92%MEDIAN AGE
48
Sources:United Nations, World Bank, Statista, Global Web Index, Hootsuite, We Are Social, SimilarWeb

/13
KEY COUNTRIES
Malaysia has a lot of positive characteristics as an ecommerce market, and we expect the shift to online shopping seen during the pandemic will only make it a more attractive place for Western brands to sell their goods online.
A connected population, increasing middle classes and a government commitment to support the growth of ecommerce explain why it’s predicted to be the next market in the region that Amazon would want to enter.
Malaysian GDP did drop by 5.6% in 2020, and unlike other markets, the decline was still accelerating in the fourth quarter of 2020. However, prior to this the economy was growing well, up 4.3% in 2019.
Ecommerce sales grew significantly in 2020 – up by an estimated 24.7% – and ecommerce is one of the pillars of the Malaysian government’s post-COVID recovery plan.
The data on the following page shows that while internet penetration is high, and the majority of Malaysians do some shopping online, the amount they spend is still relatively low.
Ecommerce only makes up a very small percentage of total consumer goods sales. These conditions mean that the ecommerce market has yet to reach maturity, with a compound annual growth rate of 14.3% between 2020 and 2024 forecast.
Malaysians can already buy products available for global shipping from Amazon.com, and this will have allowed the marketplace to assess the likely demand for an entry into the market. With an instance already live in Singapore, it has infrastructure in place on Malaysia’s doorstep.
If Amazon does enter the market it will have stiff competition from Shopee and Lazada. Shopee is by far the leader in terms of share of online traffic, and provides next-day delivery to the majority of the country through a tie-up with DHL.
Lazada’s owner Alibaba has also backed a Digital Free Trade Zone that has been designed to encourage online trade between Malaysia and China. One of the stated goals of the zone is to make Malaysia an attractive destination as a regional fulfilment hub for brands who want to reach Southeast Asian customers.
Malaysia could be one of the most competitive ecommerce markets in the region in the next few years, with Shopee trying to defend its market-leading position, and Lazada and potentially Amazon both trying to provide competing platforms that will target Western brands who want to reach Malaysian consumers.
MalaysiaPOPULATION
32.4MURBANISATION
78%MEDIAN AGE
30
Sources:United Nations, World Bank, Statista, Global Web Index, Hootsuite, We Are Social, SimilarWeb, Global Data, JP Morgan, Tamebay, The Straits Times, MATRADE
Ecommerce sales grew significantly in 2020 – up by an estimated 24.7%

/14
KEY COUNTRIES
B2C ECOMMERCE SPEND AS A PERCENTAGE OF TOTAL B2C RETAIL SPEND
1%
PERCENTAGE OF INTERNET USERS THAT USE SHOPPING APPS
61%
VALUE OF MARKET FOR ONLINE CONSUMER GOODS PURCHASES (USD)
$3BN
PERCENTAGE OF INTERNET USERS THAT PURCHASED A PRODUCT ONLINE
82%
AVERAGE ANNUAL REVENUE PER ONLINE CONSUMER (USD)
$384INTERNET PENETRATION
98% TOP 4 SHOPPING SITES BY TRAFFIC SHARE
41%12%4%3%
MalaysiaPOPULATION
32.4MURBANISATION
78%MEDIAN AGE
30
Sources:United Nations, World Bank, Statista, Global Web Index, Hootsuite, We Are Social, SimilarWeb

/15
KEY COUNTRIES
The value of the ecommerce market in the Philippines looks very small compared to some other countries in the region, but it is growing and can be a good add-on market for brands who are choosing to sell on platforms where it is possible to ship cross-border.
The economy contracted by 9.5% in 2020, in what was its worst performance since 1947. However, a quick recovery is also predicted, with a GDP rise of at least 6.5% predicted in 2021 and a return to pre-COVID levels by mid 2022.
Online marketplace visits and usage are reported to have grown quickly through the pandemic, and online sales may have doubled during 2020. Estimates for the annual value of ecommerce sales by 2025 go as high as US$12 billion.
A survey conducted by Global Web revealed that 48% of Filipinos plan to shop online more once the pandemic is over. It is felt that there is substantial pent-up demand for products in categories including fashion, consumer electronics and home accessories.
The demographics of the country also support longer-term ecommerce growth, with a large population that is young and already well connected to the internet. Social media use is very strong in the Philippines and SME sellers have already sprung up to sell goods on social platforms such as Facebook and Instagram.
None of the main ecommerce sites in the country are local. Shopee has the most traffic, but has a smaller traffic share advantage over its competitors than in other markets, such as Malaysia. It’s also interesting to note that Amazon and Alibaba both feature in the top shopping sites list, due to cross-border ecommerce activity.
As well as these international players, regional online fashion site Zalora also does well in the Philippines and provides a sales channel for many large Western fashion brands.
PhilippinesPOPULATION
109.6MURBANISATION
47%MEDIAN AGE
26
Sources:United Nations, World Bank, Statista, Global Web Index, Hootsuite, We Are Social, SimilarWeb/ ING, Inside Retail Asia, Global Data, Business World
Online marketplace visits and usage are reported to have grown quickly through the pandemic, and online sales may have doubled during 2020

/16
KEY COUNTRIES
B2C ECOMMERCE SPEND AS A PERCENTAGE OF TOTAL B2C RETAIL SPEND
1%
PERCENTAGE OF INTERNET USERS THAT USE SHOPPING APPS
59%
VALUE OF MARKET FOR ONLINE CONSUMER GOODS PURCHASES (USD)
$952M
PERCENTAGE OF INTERNET USERS THAT PURCHASED A PRODUCT ONLINE
76%
AVERAGE ANNUAL REVENUE PER ONLINE CONSUMER (USD)
$102INTERNET PENETRATION
74% TOP 4 SHOPPING SITES BY TRAFFIC SHARE
38%29%6%1%
PhilippinesPOPULATION
109.6MURBANISATION
47%MEDIAN AGE
26
Sources:United Nations, World Bank, Statista, Global Web Index, Hootsuite, We Are Social, SimilarWeb

/17
KEY COUNTRIES
SingaporePOPULATION
5.85MURBANISATION
100%MEDIAN AGE
42
Singapore was one of the first countries outside of China to suffer with cases of COVID-19, but has bounced back relatively quickly. GDP was down by 5.8% in 2020, but beat the official forecasts of a fall of between 6% and 6.5%.
Though the smallest country of those we have profiled, it is strategically important for brands who want to sell online in the region. Its six million citizens live in a relatively small urban area, and the majority of its inhabitants are middle class with a very high per capita income.
It has a well-functioning postal infrastructure and an address and postcode system that makes home delivery relatively easy. However, its high population density and excellent public transport means that it is easy to shop in stores, and many Western brands have a physical retail presence. In addition, it has the third oldest population in the region.
This explains why the average amount spent on buying consumer goods online is lower than in some less developed markets, and why the percentage of total retail spend that is online is also low.
Prior to the pandemic, online sales were growing at a steady double-digit rate and the estimates for future growth have been reduced slightly by the pandemic, but still come in at a compound annual growth rate of 7.7% to 2023.
Singapore-headquartered Shopee is the biggest online shopping site by traffic. It launched in 2015 and has used this base to expand to the other Southeast Asian markets it serves. The thinking is that Amazon may also use its base in Singapore to try to expand into other markets in the region, with Malaysia the most likely.
Lazada and Amazon are next on the list of marketplaces by traffic share, and Singapore is the only Southeast Asian market where Alibaba – which owns Lazada – and Amazon are directly competing.
In Singapore, it is interesting to note that there is still slightly more traffic to the US version of Amazon, than the local .sg site. Given that around 30% of the population are expats – either working or studying in Singapore – it’s no surprise that cross-border ecommerce traffic is relatively high.
73% of online consumers in Singapore have shopped with overseas sellers, and 35% of total online sales are cross-border.
Singapore has followed China’s lead with an enthusiastic uptake of livestreaming, and both Shopee and Lazada offer platforms that allow merchants to create livestreaming content.
Sources:United Nations, World Bank, Statista, Global Web Index, Hootsuite, We Are Social, SimilarWeb, JP Morgan, CNBC, The Straits Times
73% of online consumers in Singapore have shopped with overseas sellers, and 35% of total online sales are cross-border

/18
KEY COUNTRIES
B2C ECOMMERCE SPEND AS A PERCENTAGE OF TOTAL B2C RETAIL SPEND
3%
PERCENTAGE OF INTERNET USERS THAT USE SHOPPING APPS
68%
VALUE OF MARKET FOR ONLINE CONSUMER GOODS PURCHASES (USD)
$2BN
PERCENTAGE OF INTERNET USERS THAT PURCHASED A PRODUCT ONLINE
74%
AVERAGE ANNUAL REVENUE PER ONLINE CONSUMER (USD)
$847INTERNET PENETRATION
90% TOP 4 SHOPPING SITES BY TRAFFIC SHARE
14%9%6%5%
SingaporePOPULATION
5.85MURBANISATION
100%MEDIAN AGE
42
Sources:United Nations, World Bank, Statista, Global Web Index, Hootsuite, We Are Social, SimilarWeb

/19
KEY COUNTRIES
South KoreaPOPULATION
51.3MURBANISATION
82%MEDIAN AGE
44
South Korea’s economy has fared relatively well through 2020, with its GDP contracting by only 1%, mainly driven by a growth in exports of computing products to parts of the world where demand increased as more people needed to work from home.
The country did well to contain its COVID-19 outbreak, and restrictions have been less strict than in other markets. The South Korean ecommerce market is estimated to have grown by 22.3% in 2020; and could be worth as much as US$142 billion by 2024.
South Korean online shoppers are extremely well connected; and spend the most online per person of all shoppers in the region. For this reason, the percentage of retail sales that are online is already at 16%. An investment push by the government is designed to increase this further.
In March 2021, plans were announced to invest US$267 million to speed up the growth of the country’s online retail industry. In particular, 4000 robots will be deployed to support ecommerce logistics and delivery robots will be allowed to operate on sidewalks. Drone delivery services are also expected to be tested in 2022.
The most interesting ecommerce site in South Korea is Coupang, which is considered to be South Korea’s answer to Amazon.
Launched in the market in 2010, it was founded by a Harvard Business School dropout who saw a gap in the market to bring convenience to the nation’s shoppers.
Coupang’s focus on convenience, by building out its own logistics and fulfilment infrastructure, has paid off. 70% of the South Korean population live within seven miles of a Coupang logistics centre and it has built AI technology to help it forecast demand; so the right products are in the right place to be delivered as quickly as possible.
Its delivery options – including a next-day delivery before dawn service – particularly appealed to shoppers during the pandemic. Coupang is said to have grown its share of the South Korean ecommerce market from 18.1% in 2019 to 24.6% in 2020.
Coupang recently completed an IPO in the USA, following in the footsteps of Alibaba. The sale of shares has raised a considerable amount of money, and the company will be able to invest in trying to further dominate the market.
Sources:United Nations, World Bank, Statista, Global Web Index, Hootsuite, We Are Social, SimilarWeb, Inside Retail Asia, Global Data, CNBC, The Independent
The South Korean ecommerce market is estimated to have grown by 22.3% in 2020; and could be worth as much as US$142 billion by 2024

/20
KEY COUNTRIES
B2C ECOMMERCE SPEND AS A PERCENTAGE OF TOTAL B2C RETAIL SPEND
16%
PERCENTAGE OF INTERNET USERS THAT USE SHOPPING APPS
59%
VALUE OF MARKET FOR ONLINE CONSUMER GOODS PURCHASES (USD)
$65BN
PERCENTAGE OF INTERNET USERS THAT PURCHASED A PRODUCT ONLINE
80%
AVERAGE ANNUAL REVENUE PER ONLINE CONSUMER (USD)
$2118INTERNET PENETRATION
92% TOP 4 SHOPPING SITES BY TRAFFIC SHARE
South KoreaPOPULATION
51.3MURBANISATION
82%MEDIAN AGE
44
Sources:United Nations / World Bank / Statista / Global Web Index / Hootsuite / We Are Social / SimilarWeb

/21
KEY COUNTRIES
The Thai economy contracted by 6.1% in 2020, mainly due to a reduction in tourism and exports. However, private consumption fell by only half that figure, and GDP is expected to return to growth of 3.2% in 2021.
Thailand is a mobile-first ecommerce market, and internet penetration is relatively high, largely driven through access via mobile devices. Like many other developing markets in the region, high internet penetration rates don’t yet translate into high ecommerce sales.
However, there were positive growth signs prior to the pandemic, with a compound annual growth rate for ecommerce of 12.5% between 2019 and 2021.
Back in 2019, JP Morgan estimated that 50% of Thailand’s total ecommerce spend was cross-border, indicating that demand was running ahead of supply in the market.
The top three countries that product was being purchased from were Japan, China and the USA. This explains why Amazon.com makes the list of the top shopping sites by traffic, though there is no local instance of the marketplace available.
The Thai government entered into a strategic partnership with Alibaba in 2018 to develop the country’s ecommerce capabilities, and recruit Thai brands to sell on its marketplaces elsewhere in the world.
Included within this deal was the creation of a Smart Digital Hub, utilising Alibaba’s data and logistics technologies to optimise the flow of goods across Thailand’s borders.
Global logistics businesses including UPS and FedEx have also established operations in the market, supporting home delivery services.
Mobile is hugely important to the success of ecommerce in Thailand. As you can see on the following page, 82% of shoppers with access to the internet use mobile shopping apps, likely one of the reasons that the mobile-only marketplace Shopee has gained traction in the market.
Thailand leads the region in Southeast Asia for the roll-out of 5G services, and this will make shopping on mobile even quicker and easier. At least one mobile network operator has already launched 5G services in 77 provinces across the country.
Tied to the high use of mobile apps is social media penetration in general; the majority of Thai online shoppers have researched products on social media before making purchases. Facebook already had 48 million users in 2019, and there are now estimated to be 55 million social media users in the country in total.
ThailandPOPULATION
70MURBANISATION
51%MEDIAN AGE
40
Sources:United Nations, World Bank, Statista, Global Web Index, Hootsuite, We Are Social, SimilarWeb, Statista, Alibaba, Nikkei, JP Morgan
Mobile is hugely important to the success of ecommerce in Thailand

/22
KEY COUNTRIES
B2C ECOMMERCE SPEND AS A PERCENTAGE OF TOTAL B2C RETAIL SPEND
1%
PERCENTAGE OF INTERNET USERS THAT USE SHOPPING APPS
58%
VALUE OF MARKET FOR ONLINE CONSUMER GOODS PURCHASES (USD)
$4BN
PERCENTAGE OF INTERNET USERS THAT PURCHASED A PRODUCT ONLINE
82%
AVERAGE ANNUAL REVENUE PER ONLINE CONSUMER (USD)
$243INTERNET PENETRATION
79% TOP 4 SHOPPING SITES BY TRAFFIC SHARE
31%24%5%2%
ThailandPOPULATION
70MURBANISATION
51%MEDIAN AGE
40
Sources:United Nations / World Bank / Statista / Global Web Index / Hootsuite / We Are Social / SimilarWeb

/23
KEY COUNTRIES
Vietnam stands alone among countries in Asia Pacific in not reporting a single quarter of economic contraction during 2020. Its economy continued to grow throughout the COVID-19 pandemic as the Government took quick actions to control the spread of the disease.
Vietnamese GDP is estimated to have grown by 2.9% during 2020, driven by strong manufacturing output and resilient exports; which more than compensated for the decline in tourism Vietnam faced from closing its borders.
The numbers for 2021 look even more promising, with a GDP growth forecast of 10%. The sales of consumer goods and services shrank year-on-year in March and April 2020, but then returned to growth for the rest of the year.
Vietnam has a large population, and good internet penetration, but the amount each consumer spends on consumer goods online is still relatively low, hence the low overall value of goods sold online. This is expected to ramp up in the coming years.
Research from Google and its partners estimates that the value of the Vietnamese internet economy (which includes goods and services sold online) grew by 16% between 2019 and 2020. This measure is expected to have a compound annual growth rate of 29% between 2020 and 2025.
There is competition in the market between the two largest regional Southeast Asian ecommerce platforms – Shopee and Lazada – and a couple of local competitors, Tiki and Sendo.
Tiki claims to be the biggest ecommerce site in the country. Much like Amazon, it was founded as a bookselling platform, before evolving into an online marketplace with fulfilment centres and its own logistics network.
In 2017 it received financial backing from Chinese online retailer JD. Third parties can sell on Tiki, and it also has a cross-border selling programme for international brands.
Meanwhile the other local competitor, Sendo, has both a general platform for third-party sellers (many of whom are individuals) and SenMall which sells guaranteed authentic branded goods.
Sendo has differentiated itself from the competition by focusing on enabling ecommerce for citizens outside of Vietnam’s two largest cities Hanoi and Ho Chi Minh City.
In May 2020 it was reported that Tiki and Sendo had agreed to a merger, although this deal had fallen through by July of that year.
VietnamPOPULATION
97.3MURBANISATION
38%MEDIAN AGE
32
Sources:United Nations, World Bank, Statista, Global Web Index, Hootsuite, We Are Social, SimilarWeb, Sendo, CNBC, DealStreetAsia, Web Retailer
Vietnamese GDP is estimated to have grown by 2.9% during 2020, driven by strong manufacturing output and resilient exports

/24
KEY COUNTRIES
B2C ECOMMERCE SPEND AS A PERCENTAGE OF TOTAL B2C RETAIL SPEND
1%
PERCENTAGE OF INTERNET USERS THAT USE SHOPPING APPS
55%
VALUE OF MARKET FOR ONLINE CONSUMER GOODS PURCHASES (USD)
$3BN
PERCENTAGE OF INTERNET USERS THAT PURCHASED A PRODUCT ONLINE
75%
AVERAGE ANNUAL REVENUE PER ONLINE CONSUMER (USD)
$135INTERNET PENETRATION
74% TOP 4 SHOPPING SITES BY TRAFFIC SHARE
29%9.5%9%4%
VietnamPOPULATION
97.3MURBANISATION
38%MEDIAN AGE
32
Sources:United Nations / World Bank / Statista / Global Web Index / Hootsuite / We Are Social / SimilarWeb

/25
KEY MARKETPLACES
Amazon
Amazon’s presence across the APAC region is diverse, from Japan (the marketplace’s second largest instance after the US site) to Singapore, where it’s serving a population of less than six million. In between is Australia which, while also a relatively small market by Amazon’s standards, has grown quickly in the past year as Australia saw an online sales boom during its particularly strict COVID lockdown.
The marketplace operates in basically the same way in every Asian market, with a mixture of a wholesale model – where Amazon buys stock from brands to sell directly to consumers – and allowing third-parties to sell on the sites too.
Prime is available in all markets alongside market-leading delivery timeframes. In Singapore, part of its selection is sold cross-border from the US through its International Store and Amazon also offers two-hour delivery on grocery items.
In each APAC market, Amazon faces competition from other local and international competitors. In Japan, it has fought hard against local player Rakuten to at least equal its market share. In Australia, it competes against increasingly strong omnichannel retailers in addition to eBay and other local marketplaces. However, it doubled annual sales in Australia in 2020, with encouraging indicators for both product sales and subscription revenues (including Prime).
The big question now is whether Amazon will try to push further into Asia or leave the region’s ecommerce markets to be further developed by local players. With its base in Singapore, a push into Malaysia would make sense, but it’s likely to be cautious in entering other markets.
Amazon’s push into China with a local marketplace failed, as it could not compete with the fast growth and business model developments of Alibaba and JD.com. In 2019, Amazon announced the closure of its Chinese marketplace and refocus on cross-border selling to Chinese consumers.
It’s much more likely to adopt a cross-border model for further Asian expansion, at least as it sizes markets up to assess their potential for a local site with the large investment in logistics and fulfilment infrastructure that such a move entails.
Sources:Australian Financial Review, CNBC, Amazon
MARKETS Australia, China, India, Japan, Singapore
TOP PRODUCT CATEGORIES Video Games, Electronics, Home & Kitchen, Health & Beauty, PC Software

/26
Amazon
AVERAGE MONTHLY TRAFFIC
AVERAGE TRAFFIC GROWTH
AVERAGE MONTHLY UNIQUE VISITORS
DEVICE DISTRIBUTION (MOBILE VS DESKTOP)
AUSTRALIA 32M 55% 8M M: 39% D: 61% CHINA 15M -41% 5M M: 46% D: 54% INDIA 285M -8% 92M M: 35% D: 65% JAPAN 579M 8% 59M M: 46% D: 54% SINGAPORE 5M 95% 2M M: 49% D: 51%
KEY MARKETPLACES
Sources:Similar Web Dec 2019 – Dec 2020,
Statista
/27
KEY MARKETPLACES
Coupang
AVERAGE MONTHLY TRAFFIC
AVERAGE TRAFFIC GROWTH
AVERAGE MONTHLY UNIQUE VISITORS
DEVICE DISTRIBUTION (MOBILE VS DESKTOP)
SOUTH KOREA 70M -20% 10M M: 34% D: 66%
Coupang has firmly established itself in the lives of many Koreans; becoming the biggest online marketplace in the country and its third-largest employer since it was founded in 2010. It delivers more than 2 million shipments each day, and added 25,000 to its workforce in 2020.
While 70% of Coupang merchants are small businesses, with revenues of $3 million a year or less, the marketplace is also a channel to market for larger international brands, including LEGO, Gap and Nature’s Way. It has both its own inventory as well as allowing third parties to sell on the platform.
Coupang’s profile has increased significantly outside of South Korea in the last couple of years. In late 2019, it launched a global partner programme to help international brands enter South Korea using the platform; this included the opening of international warehouses, such as one in California where US brands can store goods to be sold cross-border.
More recently, Coupang had a highly successful IPO in the USA, raising $4.6 billion. Its growth strategy for the next few years includes attracting more customers, increasing customer engagement and growing its product selection.
It grew quickly in 2020, with 14.8 active customers reported in the final quarter of 2020, up from 11.8 million in the same quarter of 2019. Net revenue per customer also increased in this time, up by 59% to $256 for Q4 2020. Much like Amazon, Coupang is focuses on offering a broad selection at the lowest prices available in the market. It has built its own end-to-end infrastructure including logistics and technology, which has
allowed it to differentiate its offer and maximise efficiencies.
To stay one step ahead of competitors, Coupang has also invested heavily in convenience, particularly around speed of delivery and ease of returns. Its delivery service, Rocket, provides same-day, next-day and next-day before dawn delivery options. The before dawn option is designed to ensure items are delivered to customers before they leave for work or school.
Customers can also return items with a simple system to request a return on an app; they then just leave the package outside to be picked up. No repackaging or returns labels are required.
Sources:SimilarWeb Mar 2019-Mar 2020, Coupang & Statista
MARKETS South Korea
TOP PRODUCT CATEGORIES Baby, Vitamins & Supplements, Toys & Games, Beauty & Consumer Electronics

/28
JD.com
AVERAGE MONTHLY TRAFFIC
AVERAGE TRAFFIC GROWTH
AVERAGE MONTHLY UNIQUE VISITORS
DEVICE DISTRIBUTION (MOBILE VS DESKTOP)
CHINA 236M -30% 57M M: 51% D: 49%
JD.com is the second largest ecommerce site in China by market share, and after a few bumpy years where it faced stiff competition from both Tmall and newer entrant Pinduoduo, it has bounced back and achieved outstanding results in 2020.
With a 30.3% jump in annual active customers in 2020 – to 472 million at the end of 2020 –
its full year GMV rose by 25% to US$402 billion.
It sells everything from grocery through to high end fashion online, and operates the offline supermarket chain SEVEN FRESH. In addition to its domestic operations, it also operates JD Worldwide, a cross-border marketplace for brands and sellers based outside of China.
Unlike Tmall, JD has a mixed business model, buying stock from brands to sell directly – more than seven million SKUs – as well as allowing sellers to open their own stores on its marketplace.
JD has built an immensely impressive logistics and delivery
infrastructure. With more than 900 warehouses across China, more than 90% of orders are delivered the same-day or next-day. JD.com has also enabled luxury brands to deliver omnichannel services, including click-and-collect from their Chinese stores.
In 2020, JD extended its main shopping event 618 festival to last 18 days, and saw sales rise 33.6% year on year. JD Worldwide saw sales up 50% year on year for the 11 days of its 11.11 promotion.
JD has invested in training for brands running stores on the JD Worldwide platform to help them maximise their sales, and in 2020 also launched a tool that helps to analyse problems with their
store operation and provides customised suggestions for improvements.
JD Live – the company’s livestreaming platform – was used with great effect through the pandemic to allow brands to grow awareness and sales of their products. During 618 Festival, JD hosted more than 300,000 livestreaming sessions, and 167 brands achieved livestreaming sales of more than US$1.5 million off the back of livestreaming.
Brands to have launched flagship stores on JD.com so far in 2021 range from luxury British shoe brand John Lobb, to French sporting goods retailer Decathlon and also Starbucks.
Sources:SimilarWeb Dec 2019 – Dec 2020, Statista & JD.com
KEY MARKETPLACES
GROSS MERCHANDISE VALUE
$402BN
MARKETS China
TOP PRODUCT CATEGORIES Consumer Electronics, Automotive, Food & Beverages, Fashion & Apparel, Cosmetics & Personal Care

/29
Lazada
Alibaba-backed Lazada operates in six APAC markets, and offers a route to market for both local small and medium-sized sellers as well as global brands. It has more than 100 million monthly active users, and saw order volumes double in 2020 compared to the previous year.
It believes it can continue on a sharp growth trajectory as while 70% of South East Asia’s consumers have internet access, online sales penetration is still low, and spending power is rising as the middle class population doubles in size by 2030.
During Alibaba’s 11.11 shopping festival in November 2020, Lazada broke its own records, with 400,000 brands and sellers serving 40 million customers in one day.
Much like its Alibaba stablemate Tmall, Lazada has been quick to adapt to new ways of selling, with its livestreaming platform LazLive. During 11.11 in 2020, 11 million livestreaming views were recorded and Lazada suggests a strong uptick in sales from this activity. It also offers games on the platform as part of its “shoppertainment” strategy to engage the region’s online population, many of whom are relatively new to the internet.
Though the majority of brands and sellers are smaller local SMEs, Lazada is very actively courting large international brands looking for a route to market.
Its premium platform for brand owners, retailers and authorised distributors to sell on – LazMall – is actively recruiting brands already selling on Tmall and Tmall Global to list their products on the site
LazMall reportedly has 70 million unique users buying from 18,000 brands; and regularly innovates to ensure that the customer experience keeps them engaged and buying. LazMall offers customers a 15-day returns policy and guarantees the authenticity of product – which is crucial in a region where counterfeit products are common.
Nike is one such brand to launch a LazMall flagship store in 2020, which it sees as complementary to its direct-to-consumer website and local retail partners. Nike has made its range available in five markets and is using Lazada’s delivery infrastructure to fulfil orders.
Sources:Lazada
KEY MARKETPLACES
MARKETS Indonesia, Malaysia, Philippines, Singapore, Thailand, Vietnam
TOP PRODUCT CATEGORIES Baby, Consumer Electronics, Fashion, Beauty, Home Appliances

/30
Lazada
Sources: Similar Web Dec 2019 – Dec 2020,
Statista
AVERAGE MONTHLY TRAFFIC
AVERAGE TRAFFIC GROWTH
AVERAGE MONTHLY UNIQUE VISITORS
DEVICE DISTRIBUTION (MOBILE VS DESKTOP)
INDONESIA 31M 19% 12M M: 81% D: 19% MALAYSIA 14M -22% 4M M: 42% D: 58% PHILIPPINES 36M 4% 10M M: 57% D: 43% SINGAPORE 8M -18% 2M M: 39% D: 61% THAILAND 36M 1% 8M M: 48% D: 52% VIETNAM 20M -24% 7M M: 60% D: 40%
KEY MARKETPLACES

/31
Rakuten
Sources:Similar Web Sept 2019 – Sept 2020, Rakuten, Statista
AVERAGE MONTHLY TRAFFIC
AVERAGE TRAFFIC GROWTH
AVERAGE MONTHLY UNIQUE VISITORS
DEVICE DISTRIBUTION (MOBILE VS DESKTOP)
JAPAN 542M 19.5% 58M M: 68% D: 32% TAIWAN 7M 2% 3M M: 55% D: 45%
Japan’s home-grown marketplace Rakuten Ichiba is a third-party only marketplace, and does not directly sell any product itself. Its parent company has a strong grip on Japanese consumers, providing everything from banking to communications services.
In 2020, Ichiba reported an annual GMV of more than 3 trillion Yen (US$28 billion). It has more than 100 million users and 50,000 sellers on the platform, and claims a 27% share of total Japanese ecommerce sales.
The marketplace achieved strong sales through 2020, after several years when its growth had slowed, through both new and returning customers. They shopped there when physical retail was closed in Japan, and kept on coming back even when it had reopened. Rakuten reported a GMV that was up by 48% year on year between April and June 2020.
Rakuten believes that this shift – and further strong ecommerce growth – is possible as Japan still has a relatively small percentage of retail sales online compared to China and other Western countries.
One of the hurdles to growth that Rakuten has had to overcome is logistics capacity in Japan. For this reason, the business has invested in its own logistics infrastructure – particularly for last mile – and it recently announced a partnership with Japan Post.
It has also simplified shipping costs for consumers by encouraging merchants to
opt-in to its uniform shipping programme; previously merchants set their own shipping costs and they were not transparent for consumers.
Brands need either a business entity in Japan or to work with a trade partner to create a store on the marketplace. Rakuten describes itself as shop-centric, and gives more flexibility to brands over customer experience, including how their store and product pages look and feel.
A monthly membership fee is charged in addition to the sales commission, and digital marketing on the platform is also possible.
KEY MARKETPLACES
GROSS MERCHANDISE VALUE
$28BN
MARKETS Japan, Taiwan
TOP PRODUCT CATEGORIES Electronics, Home & Outdoor, Fashion & Apparel, Beauty & Personal Care, Sports & Fitness

/32
KEY MARKETPLACES
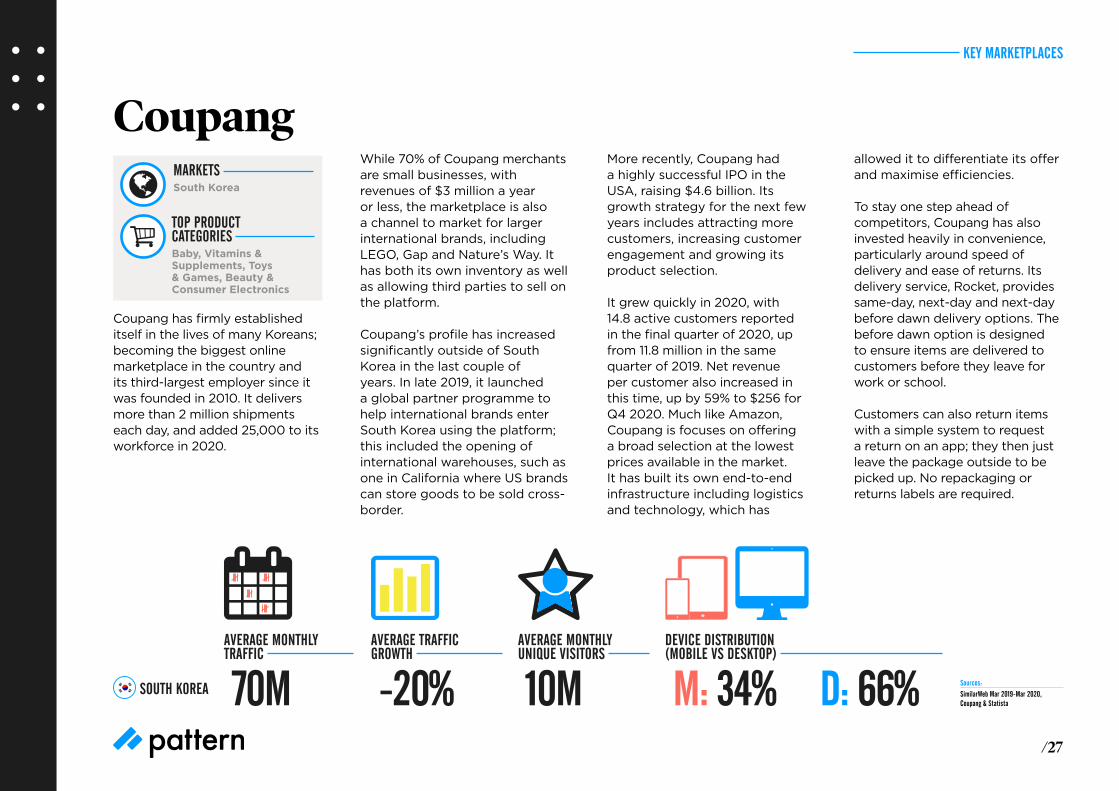
Shopee
South East Asian marketplace Shopee offers commission-free selling for small traders who want to sell on the marketplace.
For brand owners and their authorised distributors there is a premium option – Shopee Mall Seller – where your authenticity is validated by Shopee and commission fees of between 2% and 5% depending on the product category.
It claims to be the fastest growing online marketplace in South East Asia and is the number one shopping app in the region based on app downloads and users. Launched in 2015 in Singapore, it now also services Malaysia, Thailand, Indonesia, Vietnam, the Philippines and Taiwan.
Mall Sellers can also use the platform’s premium marketing tools and have access to Mall campaigns and vouchers which the platform uses to drive demand. Sellers are asked to maintain good account health which is based on four factors: shipping orders on time and in good condition, customer service standards, customer reviews and following all guidelines on listings.
Much like Tmall, Shopee offers multiple ad types to help drive traffic to your listings, keyword ads, discovery ads and Shop ads; the last of which promote your store rather than specific products at the top of search results pages. A marketing messaging tool – Chat Broadcast – allows brands to bulk message customised recipient groups within the app and communicate with them if they respond.
The platform also encourages social selling through the Shopee social feed and Shopee LIVE. Brands can create a Story (similar to an Instagram story) to share with their followers that is visible on their feed for 24 hours and should be designed to encourage viewer interaction.
Shopee LIVE is an in-app livestreaming platform that allows brands to broadcast to their customers, who can make purchases and ask questions of the brand in real-time.
Current and future scheduled livestreams are accessible to customers via a Shopee LIVE tab on the brand’s store page. Livestreams can also be made available for replay on this tab so that the content can be shared with a wider audience.
Sources:Shopee
MARKETS Indonesia, Malaysia, Philippines, Singapore, Taiwan, Thailand, Vietnam
TOP PRODUCT CATEGORIES Home Appliances, Baby, Mobile Phone & accessories, Health & Beauty
Shopee claims to be the fastest growing online marketplace in South East Asia and is the number one shopping app in the region based on app downloads and users
/33
Shopee
AVERAGE MONTHLY TRAFFIC
AVERAGE TRAFFIC GROWTH
AVERAGE MONTHLY UNIQUE VISITORS
DEVICE DISTRIBUTION (MOBILE VS DESKTOP)
INDONESIA 103M 69% 32M M: 74% D: 26% MALAYSIA 37M 67% 7M M: 38% D: 62% PHILIPPINES 37M 107% 11M M: 54% D: 46% SINGAPORE 10M 144% 3M M: 50% D: 50% TAIWAN 56M 53% 9M M: 37% D: 63% THAILAND 43M 82% 7M M: 42% D: 58% VIETNAM 55M 79% 12M M: 46% D: 54%
GROSS MERCHANDISE VALUE
$35.4BN
KEY MARKETPLACES
Sources:
Statista , Similar Web Sept 2019 – Sept 2020

/34
Tmall & Tmall Global
Sources:Similar Web Sept 2019 – Sept 2020, Alibaba, Statista, Tmall
ACTIVE ANNUAL CONSUMERS
CHINA 779MTmall’s parent company Alibaba has been able to retain the top position for share of Chinese ecommerce sales with its constant focus on innovation and improvement. Tmall achieved GMV growth of 19% year-on-year in its most important financial quarter of October to December, which includes 11.11 (Singles’ Day).
The domestic and cross-border versions of Tmall are both available to Western brands. Those with a business entity in China can use the domestic version of the marketplace.
Those without a local entity are encouraged to use Tmall Global and trade cross-border.
With 779 million active annual consumers in China in 2020, Alibaba has substantially more reach than its nearest competitor JD.com.
Only a subset of users shop on Tmall Global, but it attracts more affluent consumers who are most interested in buying Western products.
Tmall has worked hard to add brands and merchants to the cross-border platform as a pull for more users, and during 2020 the number trading on the platform increased by 60%.
Alibaba has created warehousing in Western markets so brands trading cross-border can store their product there – Tmall exports the product to China when the order is placed. Delivery timeframes should be shorter than if the brand is shipping orders from its home market to Chinese consumers itself.
Brands who create a store on either platform are encouraged to invest in Tmall’s on-platform marketing as well as off-platform marketing to drive their sales.
Livestreaming became particularly important through lockdown, for brands to reach customers when physical retail was closed, and its popularity has maintained as restrictions were lifted. Alibaba’s Taobao Live livestreaming platform generated US$61.5 billion in sales in 2020.
To ensure its best ever result, Alibaba’s flagship promotional event – 11.11, – was extended to 11 days in 2020. Spreading out the promotional event put less strain on logistics functions to get the orders sent out. More than 250,000 brands participated generating a GMV of US$74 billion across the 11 days, up 26% on the same days in 2019.
GROSS MERCHANDISE VALUE
$945BN
MARKETS China
TOP PRODUCT CATEGORIES Fashion & Apparel, Baby, Beauty & Personal Care, Consumer Electronics, Vitamins & Supplements
KEY MARKETPLACES

/35
ANALYSIS
We’ve successfully used livestreaming platforms to engage and convert customers in China, and the same techniques can work in South East Asia too.
Customer acquisition marketing costs can be high when you first enter a new market. For China in particular, we always recommend using social channels to maximise a brand’s discoverability, as well as advertising on marketplaces such as Tmall. Livestreaming is one way to achieve this.
Chinese and South East Asian consumers are among the world’s most prolific viewers of livestreamed content, and this includes ecommerce livestreams. Forbes cites figures suggesting that 9% of all Chinese ecommerce sales were the result of livestreaming in 2020, more than double the 2019 figure; with 265 million consumers watching ecommerce livestreams in March 2020.
Livestreaming has been adopted by marketplaces across the region. Tmall, JD.com, Lazada and Shopee have all developed
livestreaming platforms and reported uplifts in usage during 2020; particularly during lockdowns when stores were closed. Other social platforms are also allowing shoppable livestreams – including Douyin (Tiktok), WeChat and RED.
Below we outline how livestreaming works to help your brand to engage and retain customers.
Going liveYou can use livestreaming content to promote your products in several ways; both to engage those who are already aware of your brand, and also to help consumers discover your brand and products for the first time.
Firstly, your trade partner should have their own presenters on staff, who can present your products on livestream shows
that are dedicated to your brand. This can help you to educate and convert consumers who already have awareness of your brand.
You may also work with influencers (called KOLs or key opinion leaders) to showcase your products to their followers and extend your reach.
While the most well-known KOLs can have millions of followers they are also extremely expensive. If you are prepared to pay for their involvement, then you can work with more widely known KOLs to feature your products on a livestream and
drive thousands of purchases during the stream.
Meanwhile, micro-influencers – with expertise in your category – can be an effective way of engaging smaller audiences who are most likely to buy your products. They may feature your products alongside other brands’ items on a session, or create a session that is dedicated to your products.
While the production values of the content may not seem high compared to Western standards of “tv shopping”, the results speak for themselves.
The importance of social selling in APAC

/36
Selling cross-border into South East Asia
ANALYSIS
Cross-Border SellingMany of the marketplaces operating in the region encourage brands to sell cross-border, to give their customers access to a wider range of products. There are several benefits for brands, particularly when they are first testing and building demand for their products in a new market.
Below we outline some of the benefits and challenges of cross-border selling.
No local entity required Setting up a business in markets such as Japan or China can take months, requires much paperwork and may also necessitate having a national of the country as one of the local company’s directors. Cross-border selling removes this barrier to entry. As long as you can receive payment for orders in the currency of the country you are selling to then you will be able to create a store on the cross-border platform of marketplaces such as Tmall, JD.com, Rakuten or Lazada.
However, be aware that you will still need a local trade partner, who will deal with the marketplace and act as your representative, as well as taking care of aspects of the operation that need to be conduced in the local language, such as product listings and customer service.
No local labellingAs the product is being sold from a different market as a cross-border purchase then there is no requirement to re-label goods in the local language. This can also allow you to side-step local product standards – for example, make-up must be tested on animals in China, and so many cosmetics brands have chosen to sell cross-border to avoid this.
While local labels aren’t required, we would still recommend that product descriptions are properly translated in listings and information on sizes, weights and volumes made clear.
Stock pool decisionsYou must decide where you are going to locate your stock
pool for cross-border orders. This could be nearshore, such as in Hong Kong for orders to China, to minimise delivery times. Or you could fulfil cross-border orders from your main stock pool in the West. There are benefits of not ring-fencing stock, but the main downside is that orders could take one to two weeks to be received.
Alibaba has tried to solve this problem, allowing brands to store their goods in its Western warehouses and then using its sophisticated logistics
infrastructure to get products to China quickly once orders are placed.
Pricing There are additional costs for selling cross-border, such as higher delivery costs, and potentially sales tax or duties on personal imports that will determine your pricing strategy. Consumers expect higher prices than the West in markets such as Japan. Pricing analysis by market is crucial to optimise your pricing strategy for the region.

/37
Do you need D2C in APAC?
ANALYSIS
Though marketplaces are the biggest online sales channels in some of the region’s markets, D2C still has a role if you want to expand sales.
Marketplaces can help you to get a foot in the door of a country you’ve not sold to direct before, particularly if you want to start out by selling cross-border. However, a D2C website can help you to fully exploit the opportunities in a market.
The business case will differ by market, and below we outline the argument for some key countries in the region.
AustraliaThis is the one market in the region where a marketplace-first approach may not be the best option.
Omnichannel retail is extremely sophisticated, and marketplaces do not have a commanding share of online sales (though their penetration is growing).
Creating a D2C site for Australia is relatively easy as it will be in English but, if you want it to be fully localised, then you will still need to account for local language, trends and the difference in seasons compared to the Northern hemisphere.
ChinaIf you are a premium or luxury brand with limited distribution in the market, then we would recommend considering a Chinese language web presence to complement your marketplace stores. This will deliver a halo effect to your total sales in the market.
A D2C site will both give confidence to Chinese customers buying your goods for the first time (even if they end up buying on a marketplace) and be a place where your most loyal brand fans prefer to transact.
A D2C site also allows you to offer additional value add services and omnichannel features, such as click-and-collect if you have stores in China.
A Chinese D2C site should be thought of as a marketing channel as much as a sales channel, and may not be profitable in its own right.
JapanJapan is one of the markets in Asia where brands have been willing to invest in a localised D2C website for a combination of reasons.
It has a relatively large population, who are digital savvy and are interested in purchasing Western brands. However, there is relatively low proficiency in English, and so a Japanese website has been necessary rather than expecting that consumers will make cross-border purchases from brands’ American, UK or Australian websites in English.
Japan still has a relatively low ecommerce penetration rate, and so a D2C site is a good idea to inform and engage consumers if you also have offline sales channels in the market.

Pattern is the ecommerce partner to a growing number of global consumer brands. We are a Tmall four-star Trade Partner, as well as being one of the biggest Amazon sellers in the world.
In addition to our thriving businesses in North America and EMEA, we provide online routes to market and trade partner services for Western brands in China, Japan, Australia and across South East Asia.
Whether you want to enter new Asia Pacific markets online or grow your existing business there, we can support you in achieving your goals.
Our strategy consultants can help your brand to identify ecommerce opportunities and build a market entry strategy. or audit your current presence and create a roadmap for growth. Then we help you deliver on those plans.
This can include becoming your authorised partner for marketplaces such as Tmall, JD.com, Amazon and Lazada.
Unlike other trade partners in the region, we offer both a service and stock-buy model. In both cases we will work closely with you to build demand for your products and simplify marketplace selling.
Contact us now to discuss how we could help to grow your Asia Pacific online sales.
For assistance with selling online in China, Japan and South East Asia: [email protected]
For assistance with selling online in Australia: [email protected]
For assistance with selling online anywhere else in the World: [email protected]
About Pattern
/38