AP1000 Response to Request for Additional …AP1000 TECHNICAL REPORT REVIEW Response to Request For...
45
*Westinghouse U.S. Nuclear Regulatory Commission ATTENTION: Document Control Desk Washington, D.C. 20555 Westinghouse Electric Company Nuclear Power Plants P.O. Box 355 Pittsburgh, Pennsylvania 15230-0355 USA Direct tel: 412-374-6206 Direct fax: 412-374-5005 e-mail: [email protected] Your ref: Docket No. 52-006 Our ref: DCP/NRC2479 May 15, 2009 Subject: AP1000 Response to Request for Additional Information (TR03) Westinghouse is submitting a response to the NRC request for additional information (RAI) on Technical Report 03. This RAI response is submitted in support of the AP1000 Design Certification Amendment Application (Docket No. 52-006). The information included in this response is generic and is expected to apply to all COL applications referencing the AP1000 Design Certification and the AP1000 Design Certification Amendment Application. Enclosure 1 provides the response for the following RAI(s): RAI-TR03-010 R4 RAI-TR03-015 R4 RAI-TR03-016 R2 RAI-TR03-017 R4 RAI-TR03-024 R1 RAI-TR03-025 RI RAI-TR03-026 R2 RAI-TR03-027 R2 RAI-TR03-028 R2 RAI-TR03-029 R2 RAI-TR03-030 R2 RAI-TR03-031 R2 After further review, Westinghouse found it was not necessary to modify RAI-TR03-14 and -19. Questions or requests for additional information related to the content and preparation of this response should be directed to Westinghouse. Please send copies of such questions or requests to the prospective applicants for combined licenses referencing the AP1000 Design Certification. A representative for each applicant is included on the cc: list of this letter. Very truly yours, Robert Sisk, Manager Licensing and Customer Interface Regulatory Affairs and Standardization /Enclosure 1. Response to Request for Additional Information on Technical Report 03 01401jb.doc
Transcript of AP1000 Response to Request for Additional …AP1000 TECHNICAL REPORT REVIEW Response to Request For...

*Westinghouse
U.S. Nuclear Regulatory CommissionATTENTION: Document Control DeskWashington, D.C. 20555
Westinghouse Electric CompanyNuclear Power PlantsP.O. Box 355Pittsburgh, Pennsylvania 15230-0355USA
Direct tel: 412-374-6206Direct fax: 412-374-5005
e-mail: [email protected]
Your ref: Docket No. 52-006Our ref: DCP/NRC2479
May 15, 2009
Subject: AP1000 Response to Request for Additional Information (TR03)
Westinghouse is submitting a response to the NRC request for additional information (RAI) on TechnicalReport 03. This RAI response is submitted in support of the AP1000 Design Certification AmendmentApplication (Docket No. 52-006). The information included in this response is generic and is expected toapply to all COL applications referencing the AP1000 Design Certification and the AP1000 DesignCertification Amendment Application.
Enclosure 1 provides the response for the following RAI(s):
RAI-TR03-010 R4RAI-TR03-015 R4RAI-TR03-016 R2RAI-TR03-017 R4RAI-TR03-024 R1RAI-TR03-025 RI
RAI-TR03-026 R2RAI-TR03-027 R2RAI-TR03-028 R2RAI-TR03-029 R2RAI-TR03-030 R2RAI-TR03-031 R2
After further review, Westinghouse found it was not necessary to modify RAI-TR03-14 and -19.
Questions or requests for additional information related to the content and preparation of this responseshould be directed to Westinghouse. Please send copies of such questions or requests to the prospectiveapplicants for combined licenses referencing the AP1000 Design Certification. A representative for eachapplicant is included on the cc: list of this letter.
Very truly yours,
Robert Sisk, ManagerLicensing and Customer InterfaceRegulatory Affairs and Standardization
/Enclosure
1. Response to Request for Additional Information on Technical Report 03
01401jb.doc
DCP/NRC2479May 15, 2009
Page 2 of 2
cc: D. JaffeE. McKennaB. GleavesT. SpinkP. HastingsR. KitchenA. MonroeP. JacobsC. PierceE. SchmiechG. ZinkeR. GrumbirD. Lindgren
U.S. NRCU.S. NRCU.S. NRCTVADuke PowerProgress EnergySCANAFlorida Power & LightSouthern CompanyWestinghouseNuStart/EntergyNuStartWestinghouse
1E1E1E1E1E1E1E1EIEIE1E1E1E
0140Ojb.doe
DCP/NRC2479May 15, 2009
ENCLOSURE 1
Response to Request for Additional Information on Technical Report 03
0140jb.doc
AP1000 TECHNICAL REPORT REVIEW
Response to Request For Additional Information (RAI)
RAI Response Number: RAI-TR03-010Revision: 4
Question:
The staffs review of Tables 4.4.1-1A and 4.4.1-11B found that Westinghouse used three soil/rockdegradation models in its parametric studies for selecting site conditions: Seed and Idriss 1970soil/rock degradation curves, Idriss 1990 soil degradation curves, and EPRI 1993 soildegradation curves. For example, Westinghouse used Seed and Idriss 1970 model for twohorizontal motions and EPRI 1993 soil degradation model for two rocking motions when theparametric studies were performed for the AP1 000 site selection. Westinghouse is requested toprovide reasons and bases for using different soil degradation models for its parametric studies.
Westinghouse Response:
Soil structure interaction analyses on rock sites for both AP600 and AP1000 use the rockdegradation curve recommended by Seed and Idriss in Reference 1. This was applied in SSIanalyses for the hard rock, firm rock and soft rock sites.
Soil structure interaction analyses on soil sites for the AP1 000 used the latest soil degradationcurve recommended by EPRI in Reference 2. This was applied in SSI analyses for the upperbound soft to medium, soft to medium and soft soil sites. Two sets of degradation curves wereused in the AP600 studies. The early analyses used the degradation recommended by Seedand Idriss in Reference 1. Later AP600 analyses performed to address NRC questions used thelater soil degradation curve recommended by Idriss in Reference 3.
Westinghouse used one degradation model for soil and one for rock for the AP1000 parametricstudies consistent with the latest models recommended for soil and rock sites. The soil profilesused in the generic analyses are added in DCD subsection 3.7.1.4, see APP-GW-GLR-1 34,Technical Report 134 (TR1 34).
In the meeting of April 16- 20, 2007, NRC Staff requested additional clarification of how toconfirm that a specific site is enveloped by the generic seismic design basis. This clarification isprovided in revisions to DCD subsection 2.5.2. These revisions are provided in RAI-SRP-2.5-RGS1-01 to RAI-SRP-2.5-RGS1-6, as well as TR1 34.
In the NRC meeting of May 19 - 23, 2008 it was agreed to remove DCD Chapter 2 from Section5.0 of TR03. Reference to DCD Chapter 2.0 for AP1 000 site requirements is made in Section5.0. Further, the following was agreed that shear wave velocity should be based on low-strainminimum measured values, and a criterion should be given to define acceptable variation inshear wave velocity that show inversion characteristics. These items are addressed in RAI-SRP 2.5-RGS1-15.
)WRAI-TR03-01h R4Page 1 of 2
AP1000 TECHNICAL REPORT REVIEW
Response to Request For Additional Information (RAI)
During the NRC audit the week of May 12, 2009, it was requested that Westinghouse provideclarification in the DCD concerning limitations on the use of 2D SASSI analyses to address site-specific deviations from the certified desiqn site parameter envelope. Section 2.5.2.3 will bemodified to provide this clarification in the next revision to the DCD. See Design ControlDocument (DCD) Revision section given below.
References:
1. Seed, H.B. and I.M. Idriss, "Soil Moduli and Damping Factors for Dynamic ResponseAnalysis," Report No. EERC 70-14, Earthquake Engineering Center, University of California,Berkeley, CA., 1970.
2. EPRI TR-102293, "Guidelines for Determining Design Basis Ground Motions, 1993.3. Idriss, I.M., "Response of Soft Soil Sites during Earthquakes," H. Bolton Seed Memorial
Symposium Proceedings, May 1990.
Design Control Document (DCD) Revision:
NGe Revise Section 2.5.2.3 in Revision 18 as follows:
The Combined License applicant may identify site-specific features and parameters thatare not clearly within the guidance provided in subsection 2.5.2.1. These features andparameters may be demonstrated to be acceptable by performing site-specific seismicanalyses. If the site-specific spectra at foundation level at a hard rock site or at grade forother sites exceed the certified seismic design response spectra in Figures 3.7.1-1 and3.7.1-2 at any frequency (or Figures 31.1-1 and 31.1-2 for a hard rock site), or if soilconditions are outside the range evaluated for AP1 000 design certification, a site-specific evaluation can be performed. Those analysos m.ay be either 2D o 3,D-. Where2D or 3D analyses apply are as follows:
" The 3D SASSI analyses will be used to quantify the effects of exceedances of site-specific GMRS compared to the CSDRS, or the HRHF GMRS at a hard rock site(DCD Figures 31.1-1 and 31.1-2), or in cases where the site specific velocity soilprofiles do not fall within the ran-ge evaluated for the standard design.
" The 2D analyses are preformed for parameter studies.
Results will be compared to the corresponding 2D or 3D generic analyses.
PRA Revision: None
Technical Report (TR) Revision:No change to TR03 except that DCD Chapter 2 is removed from TR03 Section 5.0. Referenceis made to DCD Chapter 2 in this section.
RAI-TR03-010 R4Page 2 of 2

AP1000 TECHNICAL REPORT REVIEW
Response to Request For Additional Information (RAI)
RAI Response Number: RAI-TR03-015Revision: 4
Question:
In Page 48 of 154, Westinghouse illustrated that some effects (water table, soil layering, soildegradation model, etc.) are not significant to the seismic response of the nuclear island (NI)structures. Because these results are applied for the AP1000 design, the staff requestsWestinghouse provide technical basis for making these conclusions. In addition, Westinghouseneeds to demonstrate the combination of these effects is also insignificant to the seismicresponse of the NI structures.
Westinghouse Response:
Section 4.4.1.1 is amplified as shown below to provide additional technical basis for theselection of the soil parameters used in the AP1000 3D SASSI design cases. The soil casesselected for the AP1000 utilize the same parameters on depth to bedrock, depth to water tableand variation of shear wave velocity with depth as those used in the AP600 design analyses.The selection of these parameters for the AP1 000 is based on the results and conclusions fromthe AP600 soil studies summarized in Table 4.4.1-1A. These AP600 soil studies consideredvariations of the parameters and combinations thereof in establishing the design soil profiles.The conclusions of the AP600 soil studies are applicable to the AP1000 due to the identicalfootprint to the AP600 and the similarity in overall mass. The height of the shield building isincreased by about 20'. The total weight of the nuclear island increases by about 10%.
Parametric analyses of the AP1000 were performed for six soil cases as described in Section4.4.1.2. These analyses used the same assumptions for depth to bedrock, depth to water tableand variation of shear wave velocity with depth as were used in the AP600 and AP1000 3DSASSI design analyses. These analyses confirm that the response of the AP1000 is similar tothat of the AP600 for these soil cases with the AP1000 fundamental response occurring at lowerfrequencies due to the increased height and mass of the nuclear island. Based on the similarresponse in these analyses, it is concluded that the governing parameters obtained for theAP600 soil studies are also applicable to the AP1000.
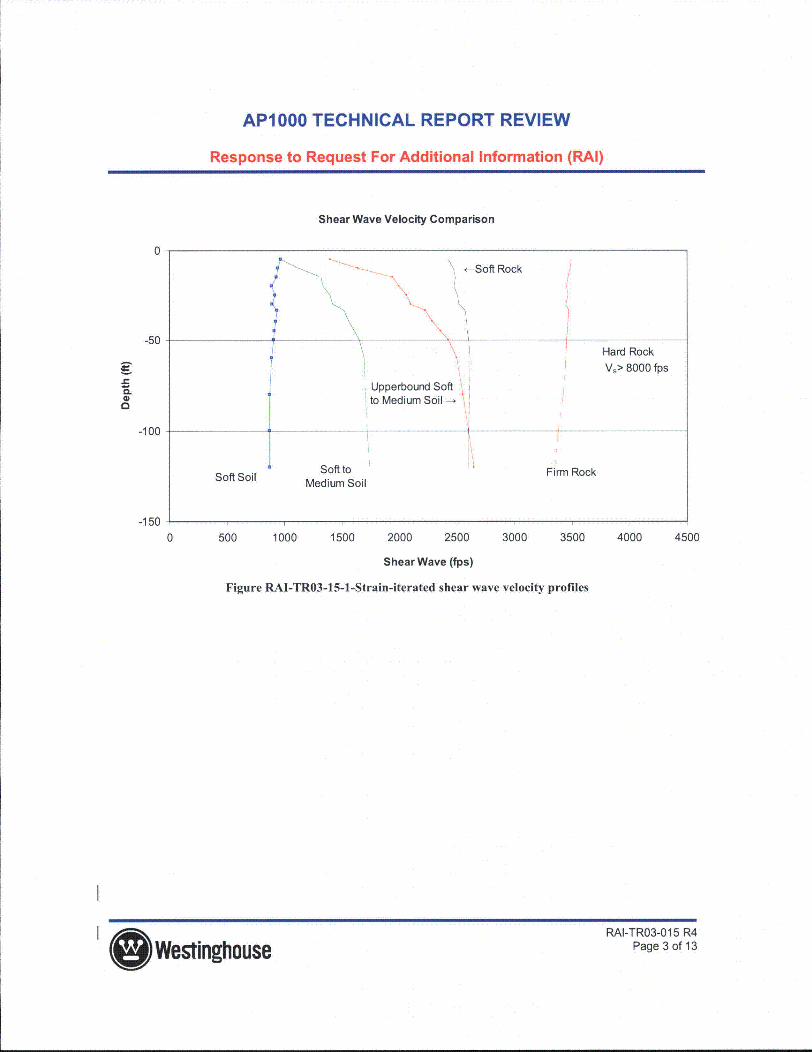
Westinghouse has addressed soil degradation in RAI-TR03-1 0. Tables of strain-iterated shearwave velocity used in the generic analyses are shown in Table 4.4.1-3 of Technical Report 03.Figure RAI-TR03-15-1 shows the bounds of these strain-iterated shear wave velocity profiles.The combination of effects of the different soil parameters is reflected in these bounds. FigureRAI-TR03-15-2 shows how a COL applicant could demonstrate that the site is enveloped bygeneric seismic design basis. The applicant would define its site geotechnical parameters asdefined in DCD Section 2.5 and would justify why the site is within the bounds of the AP1000generic analyses that have been considered in this technical report. These parameters wouldinclude the soil profiles used in the PSHA (probabilistic seismic hazard analysis) analyses,
RAI-TR03-015 R4
Wetstinghouse Page 1 of 13

AP1000 TECHNICAL REPORT REVIEW
Response to Request For Additional Information (RAI)
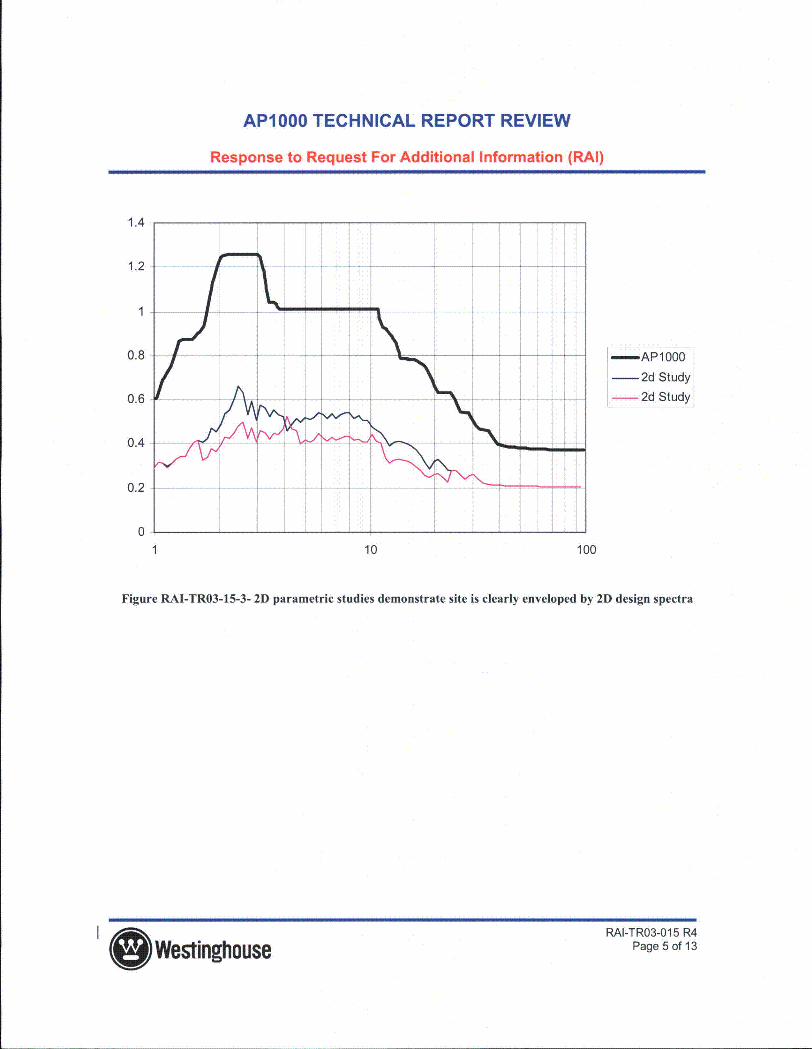
which could then be compared to Figure RAI-TR03-15-1. Subsequent discussions between theCOL applicant and the NRC may uncover a parameter for which more justification is required toshow that the impact of this parameter on the response is small. This justification could be donewith the AP1000 2D model (See RAI-TR03-010, Rev. 4 for clarification of the use of 2Danalyses). An example of how a 2D parametric study would be used is shown in Figure RAI-TR03-15-3 and RAI-TR03-15-4. If the parametric 2D SASSI studies show that the effect couldbe significant (e.g., 90% of the design spectrum, see Figure RAI-TR03-15-4) when compared tothe 2D design spectra, a 3D SASSI study would then be performed. If the 3D SASSI analysesshow some exceedances at the critical locations, the applicant would then proceed to show thatsufficient margin exists in the design to accommodate these exceedances.
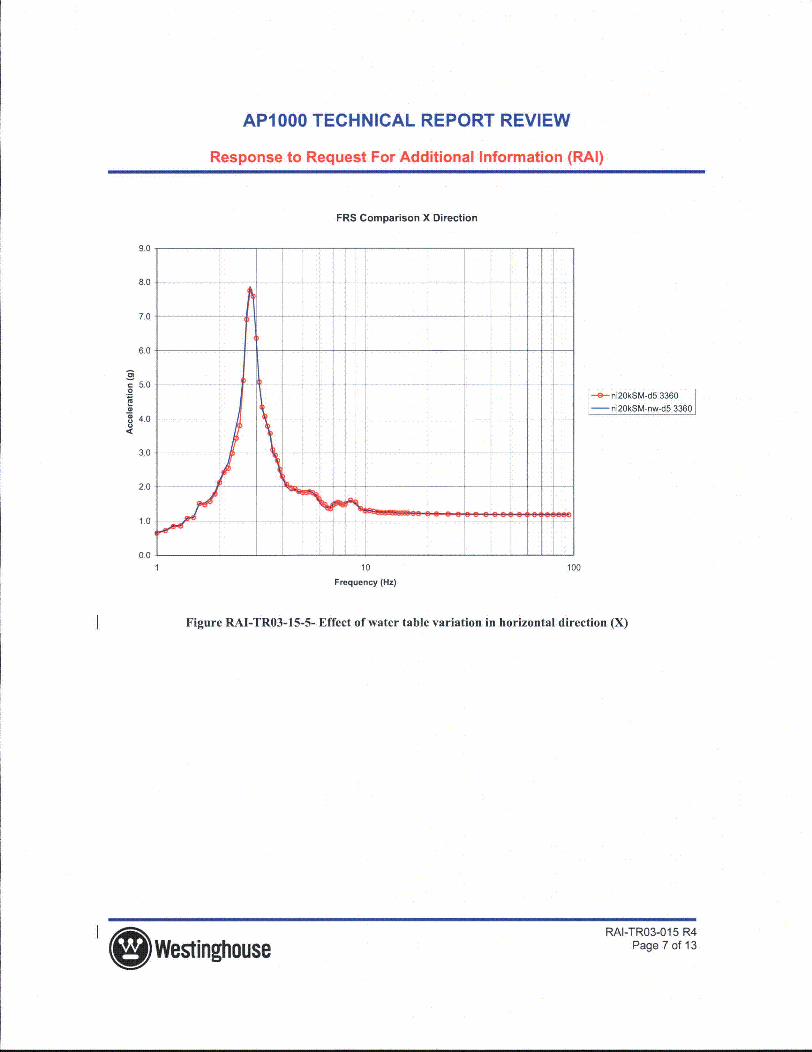
The effect of water table on the seismic response of the nuclear island structures is shown infigures RAI-TR03-15-5 through RAI-TR03-15-7. Case 1 (SM) shows the results for the soft-to-medium generic case profile which assumes water table at grade. Case 2 (SM-NW) results arefor the same soil condition except the water table is below the bottom of the soil profile at 120'below grade. As can be seen there is negligible difference between the two cases for thehorizontal response. The vertical response due to the design profile with the water table atgrade (Case 1) is more conservative than that for the dry soil profile (Case 2). This result issimilar to the results in the AP600 study which are summarized in section 4.4.1.1 which states:
"These studies showed that the change of water table elevations had insignificant effecton the horizontal results. Comparison of the vertical responses showed that the watertable at the grade level controlled the responses in the frequency range of 2 to 8 hertz."
Thus, the generic analyses are conservative for sites with a lower water table.
The arrow in Figure RAI-TR03-15-2 related to COL Application was reversed.
I )Westinghouse RAI-TR03-015 R4Page 2 of 13
AP1000 TECHNICAL REPORT REVIEW
Response to Request For Additional Information (RAI)
Shear Wave Velocity Comparison
0
-50
a.
.- Soft Rock
\N
Hard Rock
Vs> 8000 fps
Upperbound Softto Medium Soil -Soil
SfSolSoft to ';Firm Rock
Medium Soil
-100
-1500 500 1000 1500 2000 2500 3000 3500
Shear Wave (fps)
Figure RAI-TRO3-15-1-Strain-iterated shear wave velocity profiles
4000 4500
I ( Westinghouse RAI-TR03-015 R4Page 3 of 13

AP1000 TECHNICAL REPORT REVIEW
Response to Request For Additional Information (RAI)
COL Applicant Westinghouse
Yes
Applicability ofAP1000 at <COL Site
Figure RAI-TR03-15-2-COL Application process for generic design
( WestinghouseRAI-TR03-015 R4
Page 4 of 13
AP1000 TECHNICAL REPORT REVIEW
Response to Request For Additional Information (RAI)
1.4
1.2
1
0.8
0.6
0.4
0.2
0
- AP1000-2d Study
_ 2d Study
1 10 100
Figure RAI-TR03-15-3- 2D parametric studies demonstrate site is clearly enveloped by 2D design spectra
I 9We stinghouseRAI-TR03-015 R4
Page 5 of 13

AP1000 TECHNICAL REPORT REVIEW
Response to Request For Additional Information (RAI)
1.4
1.2
1
0.8
0.6
0.4
0.2
0
-AP1000
-2d Study
-2d Study
1 10 100
Figure RAI-TR03-15-4- 2D parametric study demonstrate that further studies may be required
I WestinghouseRAI-TR03-015 R4
Page 6 of 13
AP1000 TECHNICAL REPORT REVIEW
Response to Request For Additional Information (RAI)
FRS Comparison X Direction
S
r
.2
9.0
8.0
7.0
6.0
5.0
4.0
3.0
2.0
1.0
0.0
--. ni20kSM-d5 3360 1
- ni20kSM-nw-d5 3360 1
10
Frequency (Hz)
100
Figure RAI-TR03-15-5- Effect of water table variation in horizontal direction (X)
I 9 Westinghouse RAI-TR03-015 R4Page 7 of 13

AP1000 TECHNICAL REPORT REVIEW
Response to Request For Additional Information (RAI)
FRS Comparison Y Direction
8.0
7.0
6.0
5.0
r
! 4.0
3.0
2.0
1.0
0.0
-- ni20kSM-d5 3360- ni20kSM-nw-d5 33601
10 100
Frequency (Hz)
Figure RAI-TR03-15-6-Effect of water table variation in horizontal direction (Y)
I )Westinghouse RAI-TR03-015 R4Page 8 of 13

AP1000 TECHNICAL REPORT REVIEW
Response to Request For Additional Information (RAI)
FRS Comparison Z Direction
5.0
4.5 -4.0 - -
0.25 . 8. 0 ni20kSM-d5 3360- ni20kSM-nw-d5 3360
~2.0
1.5
0.5 - ___
0.0 -_ _ _ _ _
1 10 100
Frequency (Hz)
Figure RAI-TR03-15-7- Effect of water table variation in horizontal direction (Z)
Design Control Document (DCD) Revision:I None
PRA Revision:None
I ( Westinghouse RAI-TR03-015 R4Page 9 of 13
AP1000 TECHNICAL REPORT REVIEW
Response to Request For Additional Information (RAI)
Technical Report (TR) Revision:
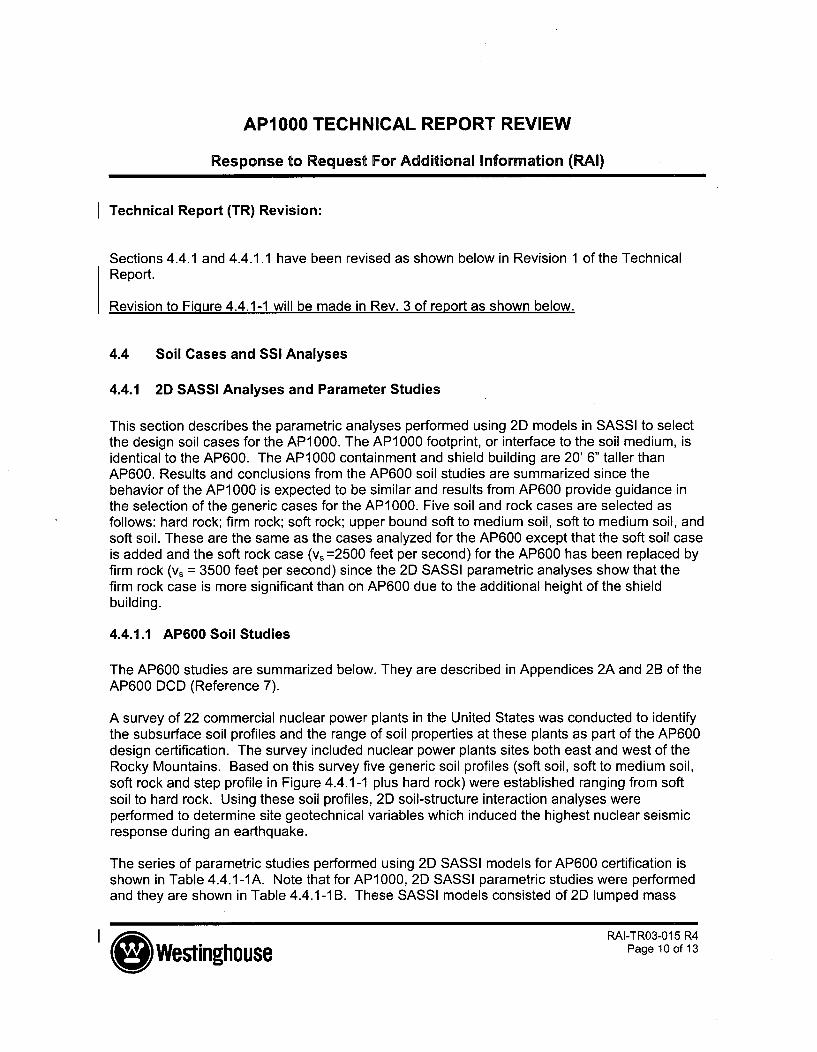
Sections 4.4.1 and 4.4.1.1 have been revised as shown below in Revision 1 of the TechnicalReport.
Revision to Figure 4.4.1-1 will be made in Rev. 3 of report as shown below.
4.4 Soil Cases and SSI Analyses
4.4.1 2D SASSI Analyses and Parameter Studies
This section describes the parametric analyses performed using 2D models in SASSI to selectthe design soil cases for the AP1 000. The AP1 000 footprint, or interface to the soil medium, isidentical to the AP600. The AP1000 containment and shield building are 20' 6" taller thanAP600. Results and conclusions from the AP600 soil studies are summarized since thebehavior of the AP1 000 is expected to be similar and results from AP600 provide guidance inthe selection of the generic cases for the AP1000. Five soil and rock cases are selected asfollows: hard rock; firm rock; soft rock; upper bound soft to medium soil, soft to medium soil, andsoft soil. These are the same as the cases analyzed for the AP600 except that the soft soil caseis added and the soft rock case (vs =2500 feet per second) for the AP600 has been replaced byfirm rock (vs = 3500 feet per second) since the 2D SASSI parametric analyses show that thefirm rock case is more significant than on AP600 due to the additional height of the shieldbuilding.
4.4.1.1 AP600 Soil Studies
The AP600 studies are summarized below. They are described in Appendices 2A and 2B of theAP600 DCD (Reference 7).
A survey of 22 commercial nuclear power plants in the United States was conducted to identifythe subsurface soil profiles and the range of soil properties at these plants as part of the AP600design certification. The survey included nuclear power plants sites both east and west of theRocky Mountains. Based on this survey five generic soil profiles (soft soil, soft to medium soil,soft rock and step profile in Figure 4.4.1-1 plus hard rock) were established ranging from softsoil to hard rock. Using these soil profiles, 2D soil-structure interaction analyses wereperformed to determine site geotechnical variables which induced the highest nuclear seismicresponse during an earthquake.
The series of parametric studies performed using 2D SASSI models for AP600 certification isshown in Table 4.4.1-1A. Note that for AP1000, 2D SASSI parametric studies were performedand they are shown in Table 4.4.1-1B. These SASSI models consisted of 2D lumped mass
RAI-TR03-015 R4
le Westinghouse Page 10oaf 13

AP1000 TECHNICAL REPORT REVIEW
Response to Request For Additional Information (RAI)
stick models coupled with a 2D model of the foundation. The conclusions made based on theseparametric studies for the AP600 configuration are given below.
Soil properties were specified to a depth of 240 feet below grade. Analyses were performed forvarious depths to base rock. In each case, the soil properties above the base rock were those ofthe soil and the base rock was assumed to have shear wave velocity of 8000 feet per second.The analyses performed for a depth to base rock of 240 feet are described in Table 4.4.1-1A asa deep soil site and results would also be representative of deeper soil sites. Soil sites werefound to control the AP600 nuclear island response at frequencies below about 4 hertz forhorizontal response and 8 hertz for vertical response while the hard rock site controls theresponse at higher frequencies. The studies of depth to base rock showed that the responsewas not very sensitive to the depth. The depth-to-base rock of 120 ft generally gave the higherresponse for each of the soil profiles and was therefore specified for the 3D SASSI designcases. The shallower depth models gave a higher building response at high frequencies, butthese responses were lower than those for hard rock. The deeper models had greater radiationdamping reducing the overall response. The dominant AP1000 building mode shapes aresimilar to the AP600 and the frequencies are lower. Since the response of the AP600 wasrelatively insensitive to depth and the dominant modes of the AP600 and AP1000 are similar,using a depth-to-base rock of 120 ft is also appropriate for the AP1000.
The soil properties associated with the lower and upper bound sandy soils (soft-to-medium soilprofile) bound the range of properties associated with clays with plasticity indices from 10 to 70as shown in Figure 2B-13 of the AP600 DCD. SSI analyses were performed for clay profilesand concluded that the responses for clay profiles were bounded by those for the design soilprofiles.
The effect of depth to water table was studied for the soft-to-medium soil case with the depth tobase rock of 120 feet. Cases were analyzed for water table at grade, for water table at thefoundation level (40 foot depth) and for a dry site. For cases where the water table was belowgrade, the Poisson's ratio for soil above the water table was also varied from 0.25 to 0.35.These studies showed that the change of water table elevations had insignificant effect on thehorizontal results. Comparison of the vertical responses showed that the water table at thegrade level controlled the responses in the frequency range of 2 to 8 hertz. The increase inresponse was mainly due to an increase in foundation effective motion, which results from anincrease in the P-wave velocity in conjunction with the SSI frequency for this case. Thus, thewater table was specified at grade for the 3D SASSI design cases. Since the mass of theAP1 000 is similar to that of the AP600 the vertical SSI frequency and response are similar.Thus, the specification of the water table at grade is also appropriate for the AP1 000 soil sites.
The change in degradation curves between the 1970 Idriss and Seed and 1990 Seeddegradation curves was not significant. The AP1 000 uses the EPRI 93 degradation curves.These degradation curves have been used in AP1000 2D SASSI parametric analyses and do
RAI-TR3-015 R
Westinghouse Page 11 of 13

AP1000 TECHNICAL REPORT REVIEW
Response to Request For Additional Information (RAI)
not significantly affect the SSI response, and thus should not result in a change in the selectionof the generic soil profiles.
Analyses were also performed for a layered soil profile with step-wise change in shear wavevelocity. The step-wise layered soil profile had a layered profile with shear wave velocity of 1000feet per second to a 40-foot depth, 1800 feet per second between 40-foot and 80-foot depth,and 4300 feet per second for depth greater than 80 feet. The response for this profile isenveloped by the soft rock, soft-to-medium, and rigid base response. In addition the casespreviously described in the depth to base rock studies showed that the sharp contrast in shearwave velocity (layering) was enveloped by the design cases with depth to base rock at 120 feet.Based on this study and the studies of depth to base rock, the step-wise layered soil profile wasnot included as a design case for AP600 nor need it be included for AP1 000.
Analyses including adjacent buildings showed that the effect of the adjacent buildings on thenuclear island response was small. Based on this, the 3D SASSI analysis of the nuclear islandcan be performed without adjacent buildings. The nuclear island does affect the response of theadjacent buildings and the results of the 2D SASSI analyses are used for design of the adjacentbuildings for both the AP600 and AP1 000.
SASSI analyses for hard rock sites were compared to fixed base results. A fixed base analysisis adequate for sites in excess of 8000 fps.
( WestinghouseRAI-TR03-015 R4
Page 12 of 13
AP1000 TECHNICAL REPORT REVIEW
Response to Request For Additional Information (RAI)
Shear Wave Velocity Comparison
.500
-100
-150
0 500 1000 1500
-FR
. . .SR-- SMS+UBs
- SMS
. . .SS
-250
-250
2000 2500 3000 3500 400
Sheer Wave (fp.)
Initial Properties
Shear Wave Velocity Comparison
-50Hard Rock
V. >8000
FRon Rook
-100
-150
Soft Soil
0 500 1000 1500 2000 2500 3000 3500 4000
Shear Wove (fp.)
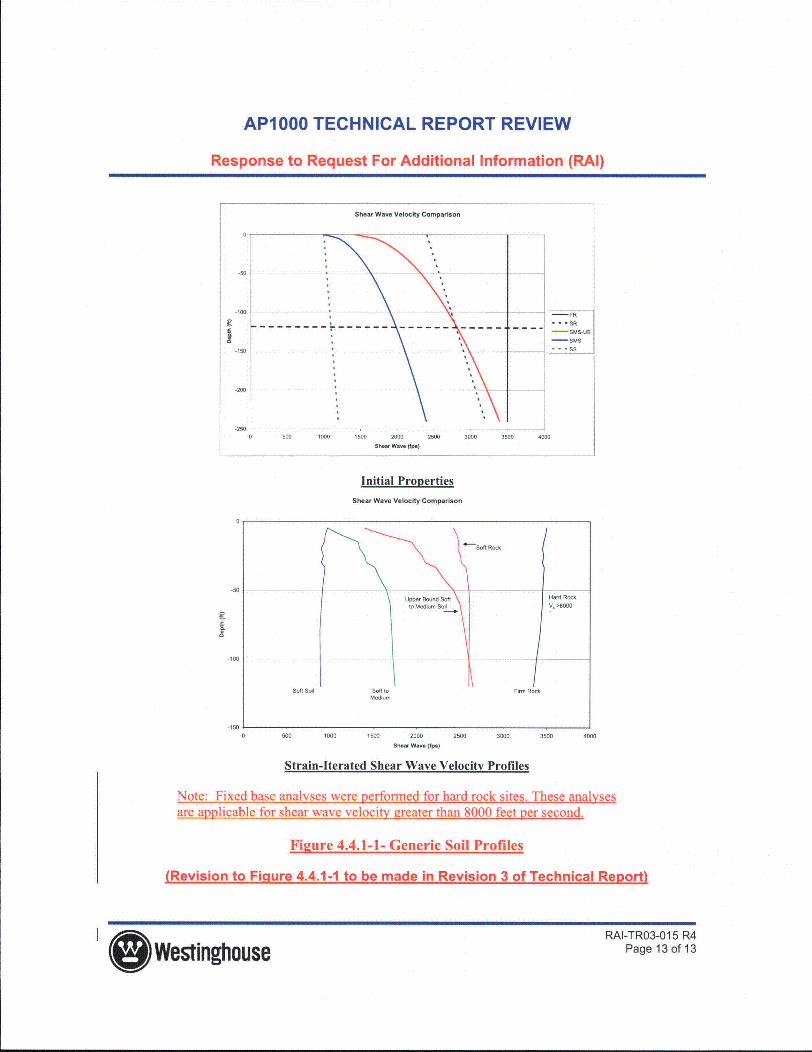
Strain-Iterated Shear Wave Velocity Profiles
Note: Fixed base analyses were performed for hard rock sites. These analysesare applicable for shear wave velocity greater than 8000 feet per second.
Figure 4.4.1-1- Generic Soil Profiles
(Revision to Figure 4.4.1-1 to be made in Revision 3 of Technical Report)
I ( Westinghouse RAI-TR03-015 R4Page 13 of 13

AP1000 TECHNICAL REPORT REVIEW
Response to Request For Additional Information (RAI)
RAI Response Number: RAI-TR03-016Revision: 2
Question:
The first sentence of the fourth paragraph in Page 50 of 154 states that maximum memberforces are shown in Figures 4.4.1-2 through 4.4.1-5. These figures indicate that the equivalentstatic analysis always results in highest member forces when compared with SASS[ resultsbased on other site conditions. The staff requests Westinghouse to identify which site conditionwas selected to develop the equivalent static acceleration profile used to perform the equivalentstatic analysis.
In addition, the staff's review of the report APP-GW-GLR-009, "Containment Vessel designAdjacent to Large Penetrations," found that the containment vessel was designed for seismicloads by applying equivalent static accelerations at each elevation based on the maximumacceleration from the fixed-base NI stick models tabulated in DCD Table 3.7.2-6. Based on theZPAs shown in Table 4.4.1-2 and seismic loads shown in Figures 4.4.1-2 through 4.4.1-7,Westinghouse should demonstrate that the seismic loads used for the containment vesseldesign are the worst loading condition.
Additional Request (Revision 2):
Westinghouse should demonstrate that the adequacy of using results from equivalent staticacceleration analyses for the SSE response in the evaluation of the large penetrations.
Westinghouse Response:
The equivalent static acceleration profile used in the parametric studies described in subsection4.4.1.2 with member force results designated as EQ in Figures 4.4.1-2 to 4.4.1-5 is based onthe maximum acceleration values obtained from the 2D ANSYS time history modal analyses ofthe same stick model on hard rock described in Section 7.1 of the report. These ANSYSanalyses used the same model as the 2D SASSI analyses. The accelerations in Table 4.4.1-2,the member forces shown in Figures 4.4.1-2 to 4.4.1-5, and the floor response spectra in,Appendix D are all from the 2D parametric analyses and are evaluated in the selection of thedesign soil cases as described in the fourth paragraph on page 50 of 154.
The equivalent static acceleration profiles specified for the design of the nuclear islandstructures are described in subsection 6.2 of the technical report. The accelerations given inTable 6.2-4 for the containment vessel are the envelope of the maximum accelerations obtainedfrom the updated nuclear island analyses for the four design soil cases described in thetechnical report. The design analyses of the containment vessel were initially performed duringthe hard rock design certification using equivalent static accelerations tabulated in DCD Table3.7.2-6 (based on fixed base stick models). The reconciliation of the design of the containment
RAI-TR03-016 R2
lo Westinghouse Page 1 of 6

AP1000 TECHNICAL REPORT REVIEW
Response to Request For Additional Information (RAI)
vessel for seismic input for soil sites is described in report APP-GW-GLR-005, "ContainmentVessel Design Adjacent to Large Penetrations," (Reference 1). As discussed in the April 16-20meeting, this reconciliation should be considered as part of the review of Reference 1.
Reference:
1. APP-GW-GLR-005, "Containment Vessel Design Adjacent to Large Penetrations,"Rev. 1.
Westinghouse Response (Revision 2):
The equivalent static acceleration analyses of the containment vessel are described inReference 1. These analyses use a finite element shell model with a refined mesh in the areaadjacent to the large penetrations (Figure 2-6 of Reference 1). A re-analysis has beenperformed using the same methodology on the coarse-mesh model of the steel containmentvessel.
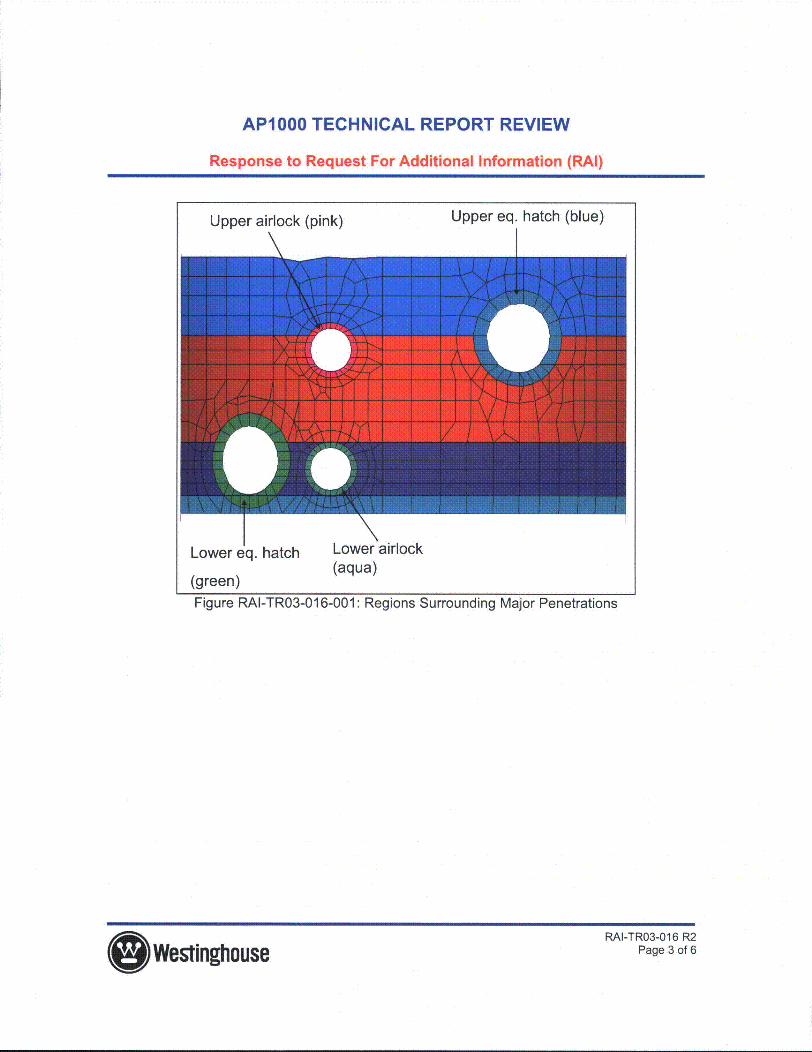
Additionally, a time history analysis has been performed selecting information for the regionsimmediately surrounding the large penetrations as shown in Figure RAI-TR03-016-001. Thepurpose of this analysis is to verify that the loads from equivalent static analysis areconservative to time history using a representative study. The effects of the missing mass in thetime history analysis have been incorporated by an algebraic sum of the stress intensities froma run with the left out mass accelerated at ZPA and the modal superposition time historyanalysis.
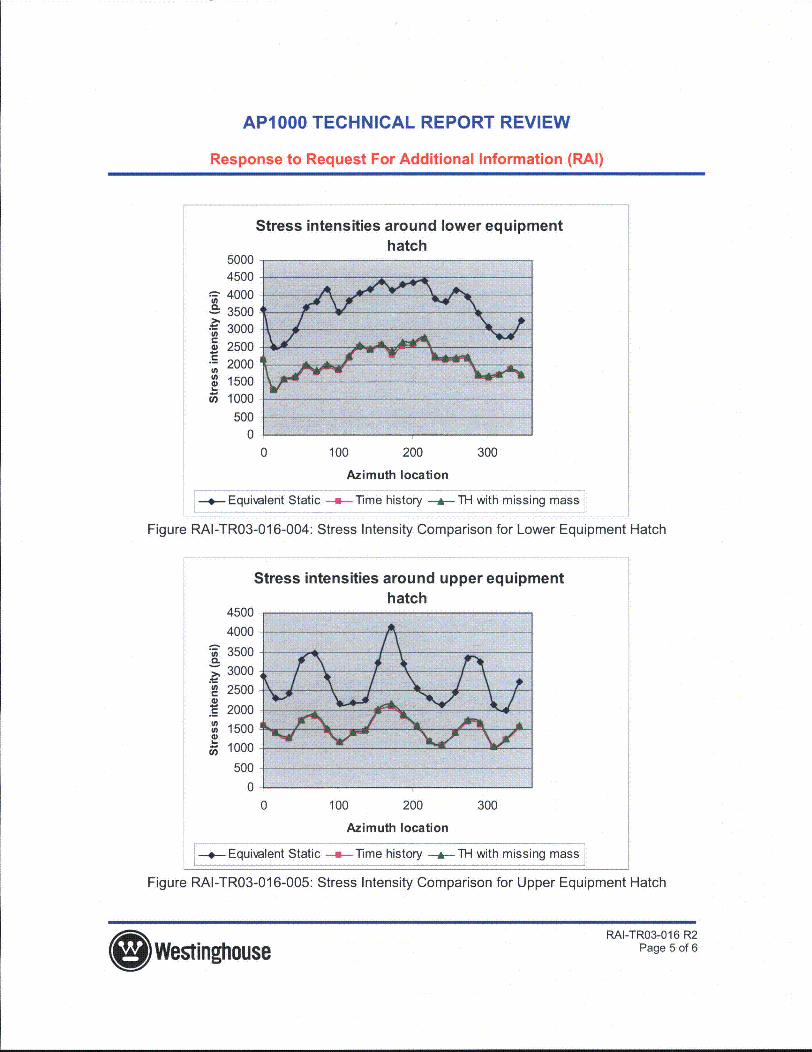
Figures RAI-TR03-016-002 through RAI-TR03-016-005 compares the stress intensity forindividual elements surrounding the major penetrations. These results show that equivalentstatic analysis consistently produces higher stresses than the generally accepted time historyresults.
O WestinghouseRAI-TR03-016 R2
Page 2 of 6
AP1000 TECHNICAL REPORT REVIEW
Response to Request For Additional Information (RAI)
Upper airlock (pink) Upper eq. hatch (blue)
Lower eq. hatch Lower airlock
(green) (aqua)
Figure RAI-TR03-016-001: Regions Surrounding Major Penetrations
O WestinghouseRAI-TR03-016 R2
Page 3 of 6

AP1000 TECHNICAL REPORT REVIEW
Response to Request For Additional Information (RAI)
Stress intensities around lower airlock
0._
U.,
50004500
4000
3500
3000
2500
2000
1500
1000
500
0
0 100 200 300
Azimuth location
--- Equivalent Static ---- Time history --- TH with missing mass
Figure RAI-TR03-016-002: Stress Intensity Comparison for Lower Airlock
Stress intensities around upper airlock
U,
0.
4500
4000
3500
3000
2500
2000
1500
1000
500
0
ji, -A
0 100 200 300
Azimuth location
I .- * Equivalent Static --- lTime history -ATH with missing mass LAFigure RAI-TR03-016-003: Stress Intensity Comparison for Upper Airlock
* WestinghouseRAI-TR03-016 R2
Page 4 of 6
AP1000 TECHNICAL REPORT REVIEW
Response to Request For Additional Information (RAI)
Stress intensities around lower equipmenthatch
50004500
T 40003500
U3000
2500200015001000
5000
0 100 200 300
Azimuth location
---- Equivalent Static - T---ime history -- TH with missing mass
Figure RAI-TR03-016-004: Stress Intensity Comparison for Lower Equipment Hatch
Stress intensities around upper equipmenthatch
4500
4000
" 3500
3000
' 2500
2000
,A 1500- 1000
5000
0 100 200 300
Azimuth location
--- Equivalent Static --=-lime history A TH with missing mass
Figure RAI-TR03-016-005: Stress Intensity Comparison for Upper Equipment Hatch
* WestinghouseRAI-TR03-016 R2
Page 5 of 6

AP1000 TECHNICAL REPORT REVIEW
Response to Request For Additional Information (RAI)
Design Control Document (DCD) Revision:None
PRA Revision:None
Technical Report (TR) Revision:
The revisions shown in Revision 1 of this response were included in the revised TR03.
O WestinghouseRAI-TR03-016 R2
Page 6 of 6

AP1000 TECHNICAL REPORT REVIEW
Response to Request For Additional Information (RAI)
RAI Response Number: RAI-TR03-017Revision: 4
Question:
Wording in DCD Table 2-1 "Site Parameters". indicates that best estimate low-strain shear wavevelocity shall be greater than 1,000 fps and that variability across the site shall be less than 100fps (10%). It is presumed that this DCD commitment is based on SASSI results for a uniformhalf-space below the plant basemat. Westinghouse is requested to a include statement onmaximum acceptable change in velocity profile within a depth equal to the width of the basematin the definition of "Site Parameters."
Westinghouse Response:
The variability in shear wave velocity of 10% across the site was established to limit variability inthe soil pressures used in design of the basemat. This was based on AP600 basemat analyses.The analyses for the AP1000 are described in the "Nuclear Island Basemat and Foundation"report (Reference 1) submitted in October 2006. The variability specified for the AP600 isretained for the AP1 000. Section 5 of Reference 1 shows proposed revisions to DCD Chapter 2.Subsection 2.5.4.5.3, Site Foundation Material Evaluation Criteria, describes the evaluation ofthe variability in each layer. If the shear wave velocity at the foundation level varies in plan, theminimum value must satisfy the requirement that the best estimate low-strain shear wavevelocity shall be greater than 1,000 fps.
The maximum acceptable change in velocity profile within a depth equal to the width of thebasemat is evaluated by the comparison against the AP1000 generic soil profiles as required byitem 6 of DCD subsection 2.5.2.1 (see RAI-TR03-010, Rev 24). It is noted that if there is aproperty inversion (i.e. stiff soil above soft soil) at a specific site, then a site specific analysis willbe performed for this case. Six design soil profiles are analyzed. Four of these are the sameprofiles as were analyzed for the AP600. For the AP600 a number of soil profiles were includedin parametric studies including soil with various depths to rock and a "stepped" profile.Responses on the nuclear island for these cases were bounded by the four AP600 design soilprofiles. Further discussion is given related to the applicability of these studies to the AP1000plant in the responses to RAI-TR03-014 and RAI-TR03-015.
See RAI-TR03-010, Rev. -34.
Reference:
1. APP-GW-GLR-044 Revision 0, "Nuclear Island Basemat and Foundation", October, 2006.
RAI-TR03-017 R4
I Westinghouse Page 1 of 2

AP1000 TECHNICAL REPORT REVIEW
Response to Request For Additional Information (RAI)
Design Control Document (DCD) Revision:
None
PRA Revision:
None
Technical Report (TR) Revision:
None
I)WestinghouseRAI-TR03-017 R4
Page 2 of 2
AP1000 TECHNICAL REPORT REVIEW
Response to Request For Additional Information (RAI)
RAI Response Number: RAI-TR03-024
Revision: 1
Question:
The description of Section 7.1 does not indicate whether the vertical spring/damper values werebased on the rocking site stiffness value or the vertical site stiffness value and whether thehorizontal/vertical parameters were determined from an assumed uniform half-space.Westinghouse should explain what are the differences in these parameters and how significantare these parameters on the computed results.
Westinghouse Response:
The material in Section 7.1 is a summary of material submitted and accepted during the hardrock design certification.
The spring and damping values were calculated for an equivalent rectangular foundation on auniform half space having a shear wave velocity of 8000 feet per second. The vertical stiffnesswas based on vertical loading rather than rocking.
The value of the assumed soil spring was not significant in the lift off analyses on hard rock.This was shown by varying the stiffness (minus 50% and plus 50%). Use of soil springs basedon the rocking site stiffness and damping values rather than the vertical values would not affectthe conclusions of the analysis.
Additional results on liftoff and subgrade pressure from the hard rock analyses described inSection 7.1 are provided in the nuclear island basemat and foundation report (Reference 1).
In the NRC meeting of May 19 - 23, 2008, it was agreed to remove the discussion of nonlinearliftoff analyses from Section 7.0 of TR03. This material was moved to APP-GW-GLR-044(TR85), "Nuclear Island Basemat and Foundation." As agreed in the AP1 000 NRC Audit of April13-16, 2009, a reference is given to the location of the TR03 Section 7 information in TR85,Rev. 1. The information for this RAI is in Sections 2.4.1 and 2.4.2. It was a-greed in a telecomwith the NRC on May 11, 2009 that the seismic response spectra associated with uplift andReview Level Earthquake be documented since it does not appear in TR85. For documentationpurposes it is placed in this response below.
Nuclear Island Liftoff Analyses
Hard rock site
The effect of liftoff durinq the safe shutdown earthquake of 0.3q on a hard rock site wasdescribed in the response to DSER Open Item 3.7.2.3-1 (Reference 2). The effect of liftoff
RAI-TRO3-024, Rev. 1
Westinghouse Page 1 of 904/1512009
AP1000 TECHNICAL REPORT REVIEW
Response to Request For Additional Information (RAI)
during the review level earthauake of 0.5q on a hard rock site was described in the response toDSER Open Item 19A.2-8 (Reference 3).
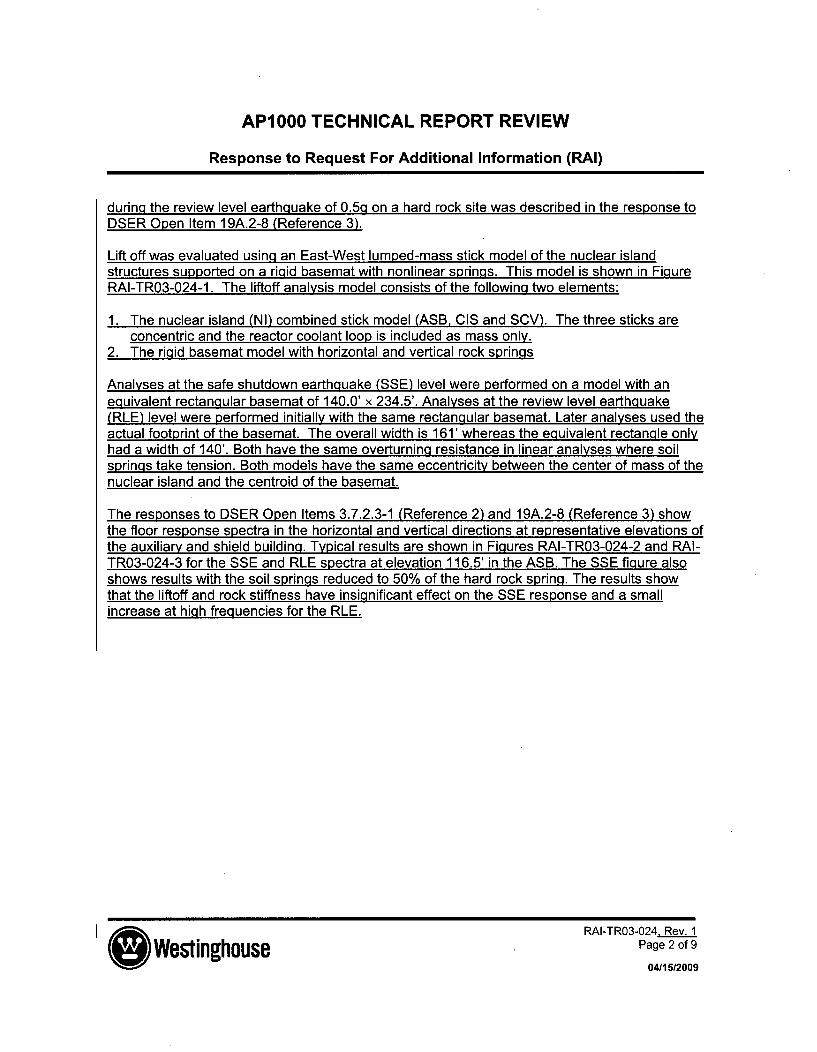
Lift off was evaluated using an East-West lumped-mass stick model of the nuclear islandstructures supported on a rigid basemat with nonlinear springs. This model is shown in FigureRAI-TR03-024-1. The liftoff analysis model consists of the following two elements:
1. The nuclear island (NI) combined stick model (ASB, CIS and SCV). The three sticks areconcentric and the reactor coolant loop is included as mass only.
2. The rigid basemat model with horizontal and vertical rock springs
Analyses at the safe shutdown earthquake (SSE) level were performed on a model with anequivalent rectanqular basemat of 140.0' x 234.5'. Analyses at the review level earthquake(RLE) level were performed initially with the same rectangular basemat. Later analyses used theactual footprint of the basemat. The overall width is 161' whereas the equivalent rectanqle onlyhad a width of 140'. Both have the same overturning resistance in linear analyses where soilsprings take tension. Both models have the same eccentricity between the center of mass of thenuclear island and the centroid of the basemat.
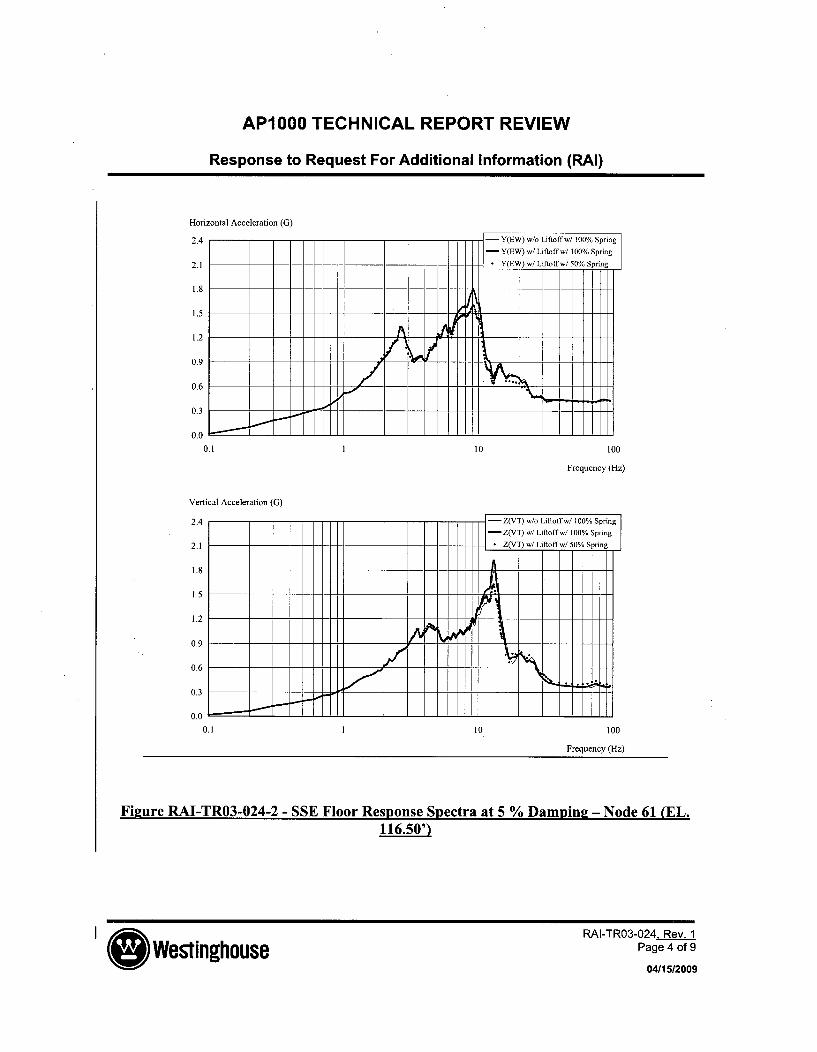
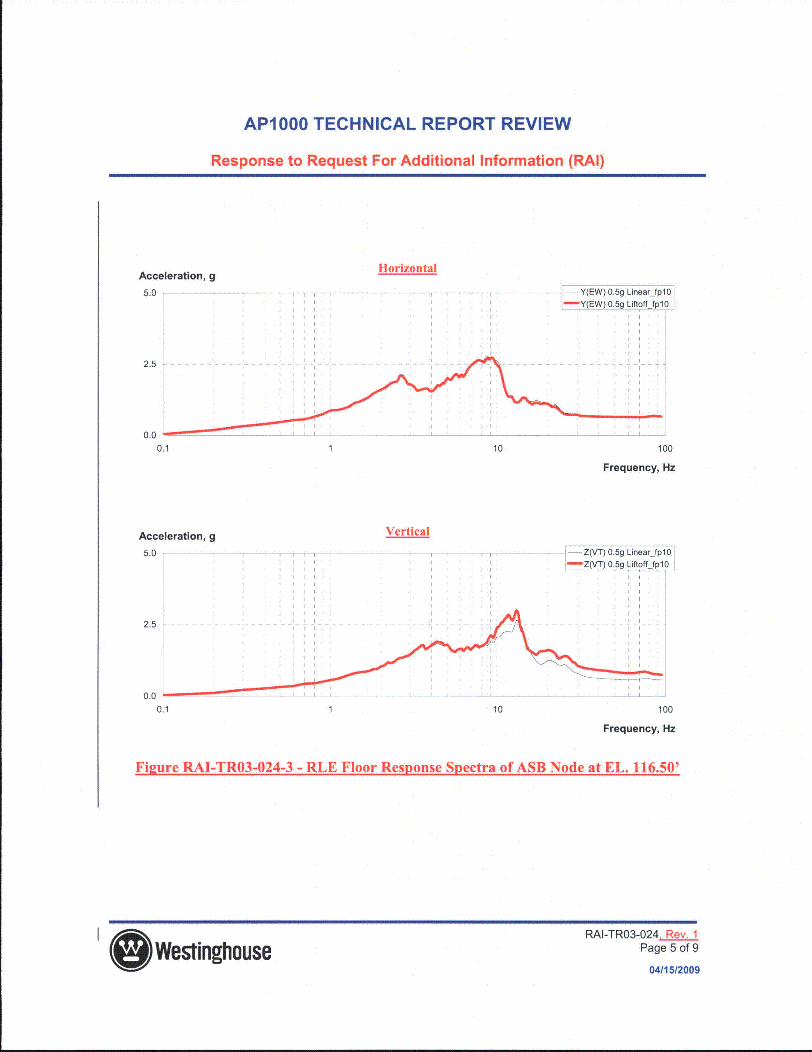
The responses to DSER Open Items 3.7.2.3-1 (Reference 2) and 19A.2-8 (Reference 3) showthe floor response spectra in the horizontal and vertical directions at representative elevations ofthe auxiliary and shield building. Typical results are shown in Figures RAI-TR03-024-2 and RAI-TR03-024-3 for the SSE and RLE spectra at elevation 116.5' in the ASB. The SSE figure alsoshows results with the soil springs reduced to 50% of the hard rock spring. The results showthat the liftoff and rock stiffness have insigqnificant effect on the SSE response and a smallincrease at hiah freauencies for the RLE.......... ..... 17 ..... 7 ........ ....... .....
RAI-TRO3-024 Rev 1
I G Westinghouse RAI-TR03-024 Rev. 1Page 2 of 9
04/15/2009

AP1000 TECHNICAL REPORT REVIEW
Response to Request For Additional Information (RAI)
Elevation
333.13'
296.77'2M. 214,
265.00'
242.50'
220.00'
200.00'
179.56'
164.51'
i__53_qfL145.37'
-A134BZL.
116 5 n,
106.17'99.00'9! .50'Al .9n,
66.50'An 0n'
309 4
160 4
38
4 320
302301 RMgt
38
37
36
35
150 4310: Node Number303: Element Number
140 4
130 4
120
110
1009080
6151413121
114
34
33132
31
76
543
2Rigid Beam
/9"", "/,X/x "Xxxx x7,-,rx /""X/ Vzxx zx"'// zx, "//
Fiwure RAI-TR03-024-1 - ASB Stick Portion of NI Combined Model
I 9 Westinghouse RAI-TR03-024 RevI.Page 3 of 9
04/1512009
AP1000 TECHNICAL REPORT REVIEW
Response to Request For Additional Information (RAI)
Horizontal Acceleration (G)
2.4
2.1
1.8
F Y(EW) w/o Liftoff w/ 100% Spring
- Y(EW) w/Liftoffw/ 100% Spring. Y(EW) w/ Liftoff w/ 50% Spring
I1.5
1.2
0.9
0.6
0.3
0.0 5K LtE0.1 I 10 100
Frequency (Hz)
Vertical Acceleration (G)
2.4
2.1
1.8
1.5
1.2
0.9
0.6
0.3
0.0
-Z(VT) w/o Liftoffw/ 100% Spring
-Z(VT) w/ Liftoffw/ 100% Spring
Z(VT) w/ Liftoffw/ 50% Spring
A [II
Ti0.1 10 100
Frequency (Hz)
Figure RAI-TR03-024-2 - SSE Floor Response Spectra at 5 % Damping - Node 61 (EL.116.50')
RAI-TRO3-024 Rev 1
I Wes'tinghouse RAI-TR03-024 _Rev. 1Page 4 of 9
04/15/2009
AP1000 TECHNICAL REPORT REVIEW
Response to Request For Additional Information (RAI)
HorizontalAcceleration, g
5.0 Y(EW) 0.5g Linear fplO0-Y(EW) 0.5g Liftoff fplO
2.5
0.0
0.1 1 10 100
Frequency, Hz
Acceleration, g
5.0 ,-
Vertical
-- Z(VT) 0.5g Linear fplO0Z(VT) 0.5g Liftoff fpiO0
2.5
0.1 1 10 100
Frequency, Hz
Figure RAI-TR03-024-3 - RLE Floor Response Spectra of ASB Node at EL. 116.50'
RAI-TRO3-024 Rev 1
I )sWestinghouse RAI-TR03-024 -Rev. 1Page 5 of 9
04/1512009

AP1000 TECHNICAL REPORT REVIEW
Response to Request For Additional Information (RAI)
Soil Sites
The effect of liftoff during the safe shutdown earthquake of 0.3q and the review level earthquakeof 0.5q was evaluated using the same approach described for the hard rock site. The analysesused the East-West lumped-mass stick model of the nuclear island structures supported on arigid basemat with nonlinear springs. The H2 (East-West direction) and vertical components ofthe time histories were used to generate liftoff response in the 2D analyses. They were appliedsimultaneously. The actual footprint of the basemat was used in the analyses of the East-Westmodel.
Linear analyses of the ANSYS models showed that the soft-to-medium soil case gave themaximum base shear force and overturning moment. Hence, a non-linear lift off analysis wasperformed for the soft-to-medium soil case. Linear and non-linear (liftoff) analyses wereperformed for the SSE input of 0.3Q and the RLE (review level earthquake) input of 0.5g. Thelinear analysis uses linear soil springs, and the non-linear (liftoff) analysis uses non-linear soilsprings that are inactive when a basemat node is higher than its initial location without loads.
Figure RAI-TR03-024-4 compares the SSE FRS between linear and non-linear (liftoff) analyses.The lift off effect on FRS is similar with those for the hard rock case; it is visible but insignificant.Figure RAI-TR03-024-5 compares RLE FRS between linear and non-linear (liftoff) analyses.The liftoff effect on FRS is similar with those for the hard rock case; it is insignificant in thehorizontal direction and visible in the vertical direction at hiah freauencv ranae.
RAI-TRO3-024 Rev I
I Westinghouse RAI-TR03-024 _Rey. 1Page 6 of 9
04/15/2009

AP1000 TECHNICAL REPORT REVIEW
Response to Request For Additional Information (RAI)
Liftoff: kvlOOO sse liftoh'Linear: kvl000 sse linear
ASB N310, EL 333', 5% Damping
12. 12.I • • I I I I ! J •I I 1 1 1I 1 1 1 I I I 1 1 I1 l
18. L.. 8..---.-.-----. ...I.L.. -1-1 - i ler
26. -- ---- - --- ----------- T T 6.--- - -- - - ---- -- - - -
4 . l4 - - - -- - -l
1 10 100 1 10 100
ASB N120, EL 180', 5% Damping
0 LiftoffII I I I tI I I II
c 2.0 --------- II l . lll---- I L - - -2 -Linear
I 11 1 I I ,i I III I I I 11111i
0.0 0.01 10 100 1 10 100
ASB N21, EL 82', 5% Damping
2 .0 2.. . . . . . . . . . . . 1 .0 . . . . . . . . . . . . . . .
0.0
1.•20 1 ... ..IIIIII. . ........I I , 20 • -------- - , l ••---I...
1 10 100 1 10 100
Horizontal (Y) Vertical (Z)Frequency, Hz
Figure RAI-TR03-024-4 - ANSYS Liftoff Effects on FRS (SSE) Soft to Medium Soil
RAI-TR3-024 -Rev 1
Westinghouse AaB 7 of 9
lie 04/15/2009

AP1000 TECHNICAL REPORT REVIEW
Response to Request For Additional Information (RAI)
Liftoff: kvlO00 He liftoffLinear: kvlO00 He linear
ASB N310, EL 333', 5% Damping
16. 16.....I r I I
O 12.-- - - - - - - - r-> r rr- - - - - - 12. --- - - - - - - - - - - -
o 10. - - -r - - I -- I-----I--I-- 10. -- I I
8 --- ---- --,- ------- .--.- ,------fl--
- 6. --- I--v--------- 6. -------•---- --- - - - --- - I----T- -I-I-TI- 4. - ---vI -- r- - - - - ---
0. 0.1 10 100 1 10 100
ASB N120, EL 180', 5% Damping-5 --,-, -- --- 2.0 -,- -. - - - - - - - • - ,
0
I.I I III I I 1 I
0.0 0.01 10 100 1 10 100
ASB N21, EL 82', 5% Damping
3 .0-. . . . . . . . . . . . . . . . 3 .0 -. . . . . . . . .. . . . . . .
3U .0---------- --- ------- n 2 .0 -- - - -r - -r -I- ----- -I-I
1 1.0 1.--------- ------- 1.0 ---- --- -- -- I
I ] I I I I I I I I
0.0 0.01 10 100 1 10 100
Horizontal (Y) Vertical (Z)
Frequency, Hz
Fii~ure RAI-TR03-024-5 - ANSYS Liftoff Effects on FRS (RLE) Soft to Medium Soil
RAI-TR03-024 Rev-
WestinhousePage 8 of 9
19 04/1512009

AP1000 TECHNICAL REPORT REVIEW
Response to Request For Additional Information (RAI)
Reference:
(1) APP-GW-GLR-044, Nuclear Island Basemat and Foundation, Rev 0, October, 2006.(2) DSER Open Item 3.7.2.3-1, Rev. 1, Transmitted in DCP/NRC 1625, September 11,
2003.(3) DSER Open Item 19A.2-8, Transmitted in DCP/NRC 1599, June 24, 2003.
Design Control Document (DCD) Revision:
DCD revisions are not shown for each RAI. A single set of proposed revisions is given in theresponse to RAI-TR03-013. The revisions are based on the material in the technical report aswell as in the RAI responses. The revisions include changes to Section 3.7 and the addition of anew Appendix 3G providing a summary of the seismic analyses.
PRA Revision:
None
Technical Report (TR) Revision:
None
RAI-TRO3-024 Rev I
l WestinghouseRAI-TR03-024 Rey. 1
Page 9 of 9
04/15/2009

AP1000 TECHNICAL REPORT REVIEW
Response to Request For Additional Information (RAI)
RAI Response Number: RAI-TR03-025
Revision: 1
Question:
It is not obvious from the description provided in Section 7.1 if the nonlinear (zero tension)cases were run with the basemat width of 140 ft or 161 ft and if the runs were 2D or 3D cases.
Westinghouse Response:
This has been clarified in. Reference 1. The second paragraph in Section 2.4.2 describes theSSE analyses as follows:
Section 7.0 of Reference 3 (APP-1000-S2R-010, Rev 0) describes analyses toinvestigate the effect of liftoff during the safe shutdown earthquake of 0.3g on a hardrock and a soft to medium soil site using an East-West lumped-mass stick model of thenuclear island structures supported on a rigid basemat with nonlinear springs. Analysesfor the hard rock site were performed on a model with an equivalent rectangularbasemat of 140.0' x 234.5'. Analyses for the soft to medium soil site were performed ona model with the actual footprint of the basemat. The overall width is 161' whereas theequivalent rectangle only had a width of 140'. Both have the same overturningresistance in linear analyses where soil springs take tension. Both models have thesame eccentricity between the center of mass of the nuclear island and the centroid ofthe basemat.
Analyses were also performed for the review level earthquake of 0.5g on both hard rock andsoft to medium soil. These analyses used the actual footprint with width of 161'.
Reference:1. APP-GW-GLR-044 Revision 0, "Nuclear Island Basemat and Foundation", October, 2006.
In the NRC meeting of May 19 - 23, 2008, it was agreed to remove the discussion of nonlinearliftoff analyses from Section 7.0 of TR03. This material was moved to APP-GW-GLR-044(TR85), "Nuclear Island Basemat and Foundation." As agreed in the AP1000 NRC Audit of April13-16, 2009, a reference is given to the location of the TR03 Section 7 information in TR85,Rev. 1. The information for this RAI is in Section 2.4.2.
Design Control Document (DCD) Revision: None
PRA Revision: None
Technical Report (TR) Revision: None
RAI-TR03-025 R1
Westinghouse Page 1 of I

AP1000 TECHNICAL REPORT REVIEW
Response to Request For Additional Information (RAI)
RAI Response Number: RAI-TR03-026Revision: 2
Question:
The description provided in Section 7.2 indicates that spring/dashpot values were selectedbased on parameters for a uniform half-space. However, for a soil site with hard rock located ata depth of 120 ft below the basemat, the resulting SSI radiation damping value would beexpected to be significantly lower than that for a uniform half-space solution. Westinghouseshould evaluate what is the impact of this difference on the computed seismic response?
Westinghouse Response:
The vertical springs were not selected based on a uniform half space. As stated in the secondparagraph of Section 7.2 the springs were calculated for elastic layers of finite depth by meansof the Steinbrenner approximation. The soil properties were those used in the SASSI analysesdescribed in Section 4.4.1.2 of the report with hard rock located at a depth of 120 feet belowgrade.
The horizontal springs were calculated from the vertical springs assuming the ratio of horizontalto vertical springs was equal to that for a uniform half space.
For a soil site with hard rock located at a depth of 120 ft below the basemat, the resulting SSIradiation damping value would be lower than that for a uniform half-space solution. Soil springstiffness was calculated using the Steinbrenner approximation, which does not provide adamping value. Preliminary time history analyses were performed with the identified soil springstiffness with zero soil spring damping. Comparison of these preliminary time history analysisresults to those from the 2D SASSI analyses confirmed the soil spring stiffness. Memberforces/moments in these preliminary analyses were higher than the 2D SASSI results due to theneglect of soil damping. Since the SASSI analyses account for the soil damping including theeffect of embedment and the hard rock at elevation 120', damping in the soil springs in theANSYS analyses was selected by iterative modal analyses to match the overturning memberforces in the SASSI analyses. The resulting damping values are shown in Table 7-1 of thereport. The 30% value for damping for soft soil was the value obtained to match the 2D SASSIresults. This value was not used in any subsequent analyses since the overall response on asoft soil site is significantly lower than on the soft to medium soil case selected for the non-linearliftoff analyses.
The soft to medium soil case analyzed for the AP1000 assumes bedrock at a depth of 120 feet.This depth was established based on the parametric studies described in section 4.4.1.1 of thetechnical report and in the response to TR03-RAI-015.
In the NRC meeting of May 19 - 23, 2008, it was agreed to remove the discussion of nonlinearliftoff analyses from Section 7.0 of TR03. This material was moved to APP-GW-GLR-044
RAI-TR03-026 R2Westinghouse Page 1 of 4

AP1000 TECHNICAL REPORT REVIEW
Response to Request For Additional Information (RAI)
(TR85), "Nuclear Island Basemat and Foundation." As agreed in the AP1000 NRC Audit of April13-16, 2009, a reference is given to the location of the TR03 Section 7 information in TR85,Rev. 1. The information for this RAI is in Sections 2.4.2, 2.6.1.1, 2.7.2 and Table 2.4-4.
Design Control Document (DCD) Revision:None
PRA Revision:None
Technical Report (TR) Revision:
Revision 1
Revise section 7.2 as shown below.
7.2 Soil sites
The effect of liftoff during the safe shutdown earthquake of 0.3g and the review level earthquakeof 0.5g was evaluated using the same approach described in section 7.1 for the hard rock site.The analyses used the East-West lumped-mass stick model of the nuclear island structuressupported on a rigid basemat with nonlinear springs. The actual footprint of the basemat wasused in the analyses of the East-West model (see Figure 7.2-3).
Table 7-1 summarizes the properties of soil springs and dampers used in this calculation. Thestiffness of the soil springs in the vertical direction in the ANSYS models were calculated forelastic layers of finite depth by means of the Steinbrenner approximation. This same approachwas used for calculation of the soil springs in the AP600 nuclear island basemat analyses. Thedepth to bedrock was 120 feet. The stiffness of soil springs in the horizontal direction wascalculated from that in the vertical direction assuming that the ratio of horizontal and verticalstiffness for the layered site has the same relationship as for a semi-infinite medium.
Damping was modeled in the ANSYS analyses using Rayleigh damping to match modaldamping at 3 and 25 hertz. The value of modal damping shown in Table 7.1 was selected tomatch member forces from the corresponding 2D SASSI analyses described in section 4.4.1.The soil damping is 5% for the soft to medium soil.
FRS comparisons of the ASB stick were performed to check the adequacy of the calculated soilspring properties. The peaks match reasonably for all cases. However, the 2D ANSYS resultsare significantly higher in the high frequency range compared with the 2D SASSI results. Thecalculated soil spring stiffness and damping are considered adequate because the results of the2D ANSYS analyses match the peaks of FRS and member forces/moments reasonably to the2D SASSI analyses.
RAI-TR03-026 R2Page 2 of 4
AP1000 TECHNICAL REPORT REVIEW
Response to Request For Additional Information (RAI)
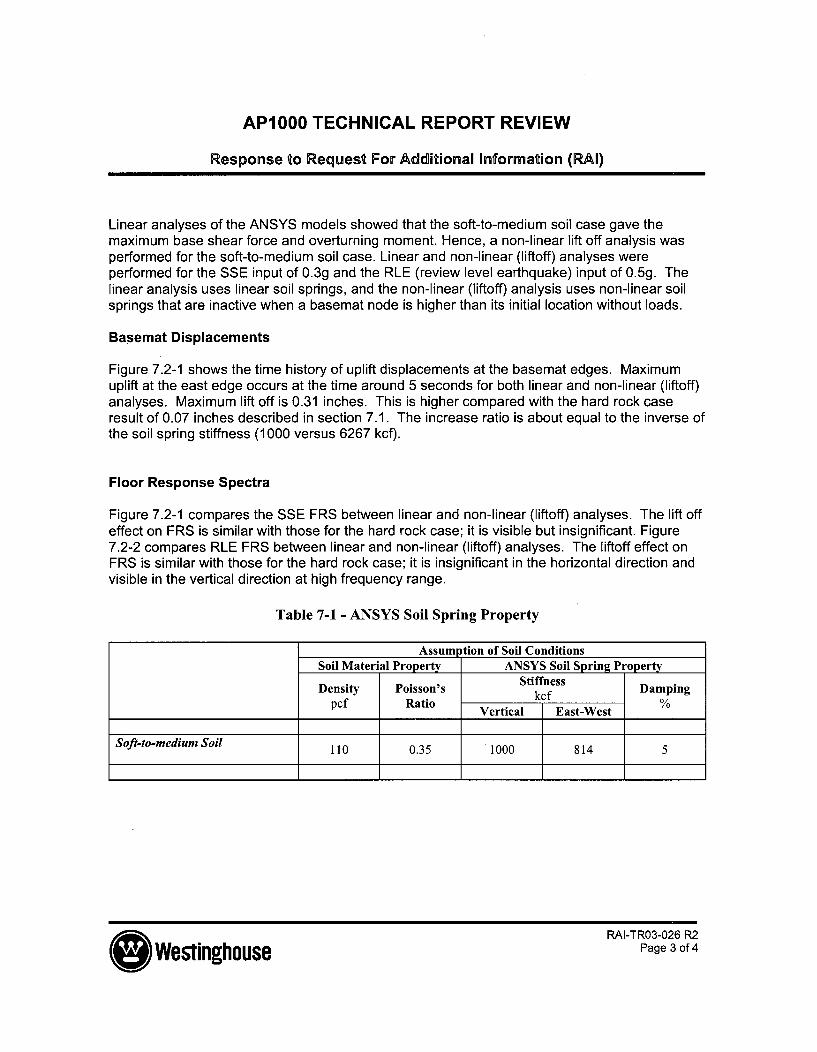
Linear analyses of the ANSYS models showed that the soft-to-medium soil case gave themaximum base shear force and overturning moment. Hence, a non-linear lift off analysis wasperformed for the soft-to-medium soil case. Linear and non-linear (liftoff) analyses wereperformed for the SSE input of 0.3g and the RLE (review level earthquake) input of 0.5g. Thelinear analysis uses linear soil springs, and the non-linear (liftoff) analysis uses non-linear soilsprings that are inactive when a basemat node is higher than its initial location without loads.
Basemat Displacements
Figure 7.2-1 shows the time history of uplift displacements at the basemat edges. Maximumuplift at the east edge occurs at the time around 5 seconds for both linear and non-linear (liftoff)analyses. Maximum lift off is 0.31 inches. This is higher compared with the hard rock caseresult of 0.07 inches described in section 7.1. The increase ratio is about equal to the inverse ofthe soil spring stiffness (1000 versus 6267 kcf).
Floor Response Spectra
Figure 7.2-1 compares the SSE FRS between linear and non-linear (liftoff) analyses. The lift offeffect on FRS is similar with those for the hard rock case; it is visible but insignificant. Figure7.2-2 compares RLE FRS between linear and non-linear (liftoff) analyses. The liftoff effect onFRS is similar with those for the hard rock case; it is insignificant in the horizontal direction andvisible in the vertical direction at high frequency range.
Table 7-1 - ANSYS Soil Spring Property
Assumption of Soil ConditionsSoil Material Property ANSYS Soil Spring Property
Density Poisson's Stiffness Dampingpcf Ratio Vertical East-West %
Soft-to-medium Soil 110 0.35 1000 814 5
O WestinghouseRAI-TR03-026 R2
Page 3 of 4

AP1000 TECHNICAL REPORT REVIEW
Response to Request For Additional Information (RAI)
.r =2 7T)
NUCLEAR ZMLAND
A 2 7W.
1,
19
"ObE y Y4t) ARA()
6/8 B'66. 3
166 1-24.4
4.4 ýF .69t
4.4103..4
ZAY REA
EAYI-r -A '77
E,2'A1- W/in-I FVUWlAL.CNr
RACTA,44ULAAl CEN7E9., 4K
Figure 7.2-3 Modelinq of Actual Footprint in East-West Model
O Westinghouse
RAI-TR03-026 R2Page 4 of 4

AP1000 TECHNICAL REPORT REVIEW
Response to Request For Additional Information (RAI)
RAI Response Number:Revision: 2
RAI-TR03-027
Question:
Section 7.1 indicates that direct integration was used to obtain computed results. Section 7.2indicates that modal analysis was used to obtain solutions requiring the computation ofequivalent modal damping accounting for both element and SSI damping. Westinghouseshould describe how was the modal analysis method used to account for lift-off? Do theresulting modal damping values satisfy the limitations recommended in ASCE 4-98?
Westinghouse Response:
Non-linear lift-off analyses were performed in ANSYS using direct integration. Linear (no lift-off)time history modal analyses were performed to compare the ANSYS model on soil springs tothe SASSI model on layered soil. These ANSYS analyses were also used to select a soildamping to match the ANSYS overturning member forces to the SASSI results. These dampingvalues are shown in Table 7-1 of the report.
The basis for selection of the damping values is described in the response to RAI-TR03-026.
In the NRC meeting of May 19 - 23, 2008, it was agreed to remove the discussion of nonlinearliftoff analyses from Section 7.0 of TR03. This material was moved to APP-GW-GLR-044(TR85), "Nuclear Island Basemat and Foundation." As agreed in the AP1000 NRC Audit of April13-16, 2009, a reference is given to the location of the TR03 Section 7 information in TR85,Rev. 1. The information for this RAI is in Sections 2.4.2. 2.6 and 2.7.
Design Control Document (DCD) Revision:I None
PRA Revision:None
Technical Report (TR) Revision:I None
(=)WestinghouseRAI-TR03-027 R2
Page 1 of 1
AP1000 TECHNICAL REPORT REVIEW
Response to Request For Additional Information (RAI)
RAI Response Number:Revision: 2
RAI-TR03-028
Question:
Westinghouse is requested to describe in Section 7 of this report that were the three directionsof motion (H1, H2 and V) used to generate liftoff responses in all cases analyzed?
Westinghouse Response:
The H2 component (east west direction) and the vertical component of the time histories wereused to generate liftoff response in the 2D analyses of the East-West lumped mass stick model.They were applied simultaneously.
Reference:None
In the NRC meetinq of May 19 - 23, 2008, it was a-greed to remove the discussion of nonlinearliftoff analyses from Section 7.0 of TR03. This material was moved to APP-GW-GLR-044(TR85), "Nuclear Island Basemat and Foundation." As agreed in the AP1 000 NRC Audit of April13-16, 2009, a reference is given to the location of the TR03 Section 7 information in TR85,Rev. 1. The information for this RAI is in Section 2.4.2.
Design Control Document (DCD) Revision:None
PRA Revision:None
Technical Report (TR) Revision:The first paragraph in Section 7.2 is modified as follows:
The effect of liftoff during the safe shutdown earthquake of 0.3g and the review level earthquakeof 0.5g was evaluated using the same approach described in section 7.1 for the hard rock site.The analyses used the East-West lumped-mass stick model of the nuclear island structuressupported on a rigid basemat with nonlinear springs. The H2 and vertical components of thetime histories were used to generate liftoff response in the 2D analyses. They were appliedsimultaneously. The actual footprint of the basemat was used in these analyses.
O WestinghouseRAI-TR03-028 R2
Page 1 of 1

AP1000 TECHNICAL REPORT REVIEW
Response to Request For Additional Information (RAI)
RAI Response Number:Revision: 2
RAI-TR03-029
Question:
In section 7.1, Westinghouse should explain why are comparisons of 2D SASSI-ANSYS resultsused to judge adequacy of the liftoff analyses?
Westinghouse Response:
Comparisons of 2D SASSI-ANSYS results are used to judge adequacy of the soil springs anddamping in the ANSYS model. As discussed in RAI-TR03-024, the damping values aresensitive to the depth to base rock. The depth to base rock is addressed directly in the 2DSASSI model. Soil damping is selected in the ANSYS linear analyses to match the maximumoverturning member forces in SASSI. These modal damping values are shown in Table 7-1 ofthe report. This soil modal damping is then converted to Rayleigh damping in the non-lineardirect integration analyses.
In the NRC meetinq of May 19 -23, 2008, it was agreed to remove the discussion of nonlinearliftoff analyses from Section 7.0 of TR03. This material was moved to APP-GW-GLR-044(TR85), "Nuclear Island Basemat and Foundation." As agreed in the AP1000 NRC Audit of April13-16, 2009, a reference is given to the location of the TR03 Section 7 information in TR85,Rev. 1. The information for this RAI is in Section 2.4.2.
Design Control Document (DCD) Revision:
None
PRA Revision:
None
Technical Report (TR) Revision:
None
RAI-TRO3-029 R2
* WestinghouseRAI-TR03-029 R2
Page 1 of 1
04/15/2009
AP1000 TECHNICAL REPORT REVIEW
Response to Request For Additional Information (RAI)
RAI Response Number:Revision: 2
RAI-TR03-030
Question:
Table 7.1 indicates that a damping of 30% was selected for the soft soil site. Westinghouse isrequested to explain what is the basis for this selection? How does the viscous damping valuesshown in this table compare with the hysteretic material damping values typically found foriterated soils based on site responses?
Westinghouse Response:
Table 7.1 has been revised to remove the soft soil case as described in the response to TR03-RAI-026, Rev 1.
In the NRC meeting of May 19 - 23, 2008, it was agreed to remove the discussion of nonlinearliftoff analyses from Section 7.0 of TR03. This material was moved to APP-GW-GLR-044(TR85), "Nuclear Island Basemat and Foundation." As agreed in the AP1000 NRC Audit of April13-16, 2009, a reference is given to the location of the TR03 Section 7 information in TR85,Rev. 1. The information for this RAI is in Table 2.4-3 (soft soil case not used for non-linearanalysis, see Section 2.4.2).
Design Control Document (DCD) Revision:None
PRA Revision:None
Technical Report (TR) Revision:None
O WestinghouseRAI-TR03-030 R2
Page 1 of 1
APonse TECHNICAL REPORT REVIEW
Response to Request For Additional Information (RAI)
RAI Response Number:Revision: 2
RAI-TR03-031
Question:
As described in Section 7, if a soft/hard impedance mismatch occurs within the zone ofinfluence of the basemat, the effective radiation damping may be severely reduced.Westinghouse should explain how would this impact computed responses?
Westinghouse Response:
A soft/hard impedance mismatch is considered in the soil cases with hard rock assumed below120 feet. This depth to bed rock was established in the parametric studies performed for theAP600.
The soft to medium soil case analyzed for the AP1000 assumes bedrock at a depth of 120 feet.This depth was established based on the parametric studies described in section 4.4.1.1 of thetechnical report and in the response to TR03-RAI-015.
Comparisons of 2D SASSI-ANSYS results are used to judge adequacy of the soil springs anddamping in the ANSYS model. As discussed in RAI-TR03-024, the damping values aresensitive to the depth to base rock. The depth to base rock is addressed directly in the 2DSASSI model. Soil damping is selected in the ANSYS linear analyses to match the maximumoverturning member forces in SASSI. This damping includes both the material damping and theradiation damping. These modal damping values are shown in Table 7-1 of the report.
In the NRC meeting of May 19 - 23, 2008, it was agreed to remove the discussion of nonlinearliftoff analyses from Section 7.0 of TR03. This material was moved to APP-GW-GLR-044(TR85), "Nuclear Island Basemat and Foundation." As agreed in the AP1000 NRC Audit of April13-16, 2009, a reference is given to the location of the TR03 Section 7 information in TR85,Rev. 1. The information for this RAI is in Sections 2.4.1 and 2.4.2.
Design Control Document (DCD) Revision:
None.
PRA Revision:
None
Technical Report (TR) Revision:
None.
* )WestinghouseRAI-TR03-031 R2
Page 1 of 1