The Presidency Chapters 13 & 14 Starting with Ch. 13 Section 1…
AP Statistics Name __________________
Review Ch. 10,11 & 12 (New Chapters 8 & 9)
Ch. 8
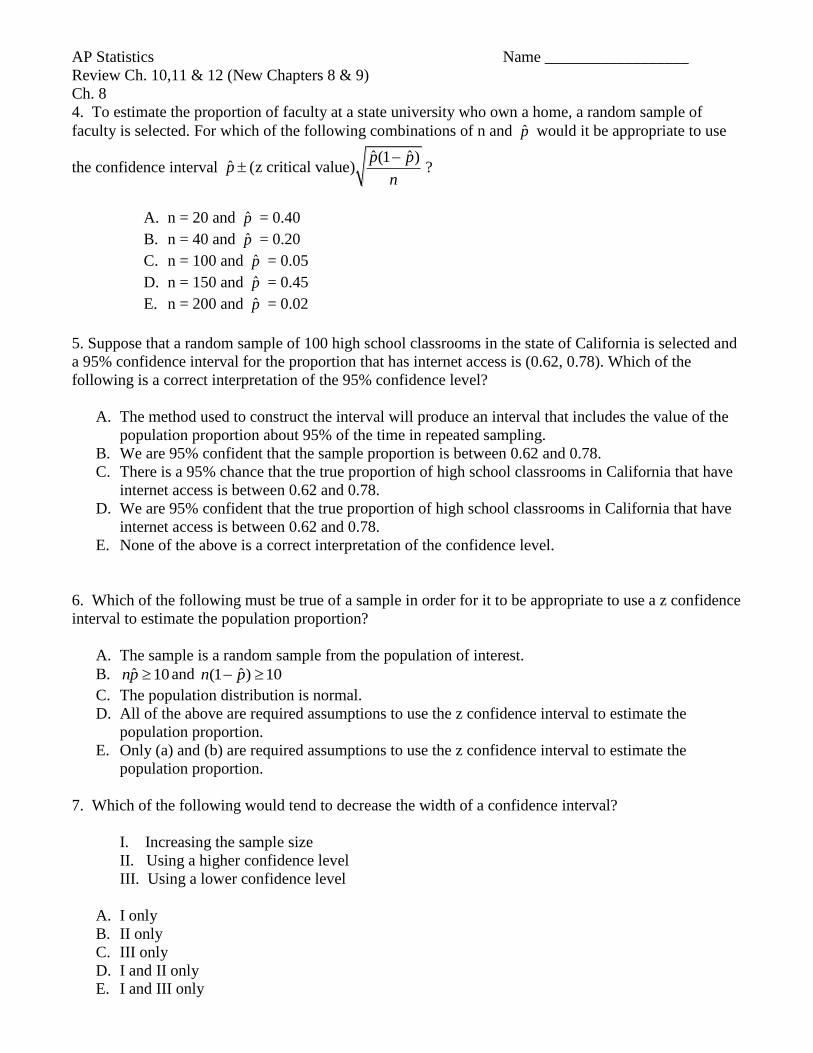
4. To estimate the proportion of faculty at a state university who own a home, a random sample of
faculty is selected. For which of the following combinations of n and p̂ would it be appropriate to use
the confidence interval ˆ ˆ(1 )
ˆ (z critical value)p p
pn
?
A. n = 20 and p̂ = 0.40
B. n = 40 and p̂ = 0.20
C. n = 100 and p̂ = 0.05
D. n = 150 and p̂ = 0.45
E. n = 200 and p̂ = 0.02
5. Suppose that a random sample of 100 high school classrooms in the state of California is selected and
a 95% confidence interval for the proportion that has internet access is (0.62, 0.78). Which of the
following is a correct interpretation of the 95% confidence level?
A. The method used to construct the interval will produce an interval that includes the value of the
population proportion about 95% of the time in repeated sampling.
B. We are 95% confident that the sample proportion is between 0.62 and 0.78.
C. There is a 95% chance that the true proportion of high school classrooms in California that have
internet access is between 0.62 and 0.78.
D. We are 95% confident that the true proportion of high school classrooms in California that have
internet access is between 0.62 and 0.78.
E. None of the above is a correct interpretation of the confidence level.
6. Which of the following must be true of a sample in order for it to be appropriate to use a z confidence
interval to estimate the population proportion?
A. The sample is a random sample from the population of interest.
B. ˆ 10np and ˆ(1 ) 10n p
C. The population distribution is normal.
D. All of the above are required assumptions to use the z confidence interval to estimate the
population proportion.
E. Only (a) and (b) are required assumptions to use the z confidence interval to estimate the
population proportion.
7. Which of the following would tend to decrease the width of a confidence interval?
I. Increasing the sample size
II. Using a higher confidence level
III. Using a lower confidence level
A. I only
B. II only
C. III only
D. I and II only
E. I and III only
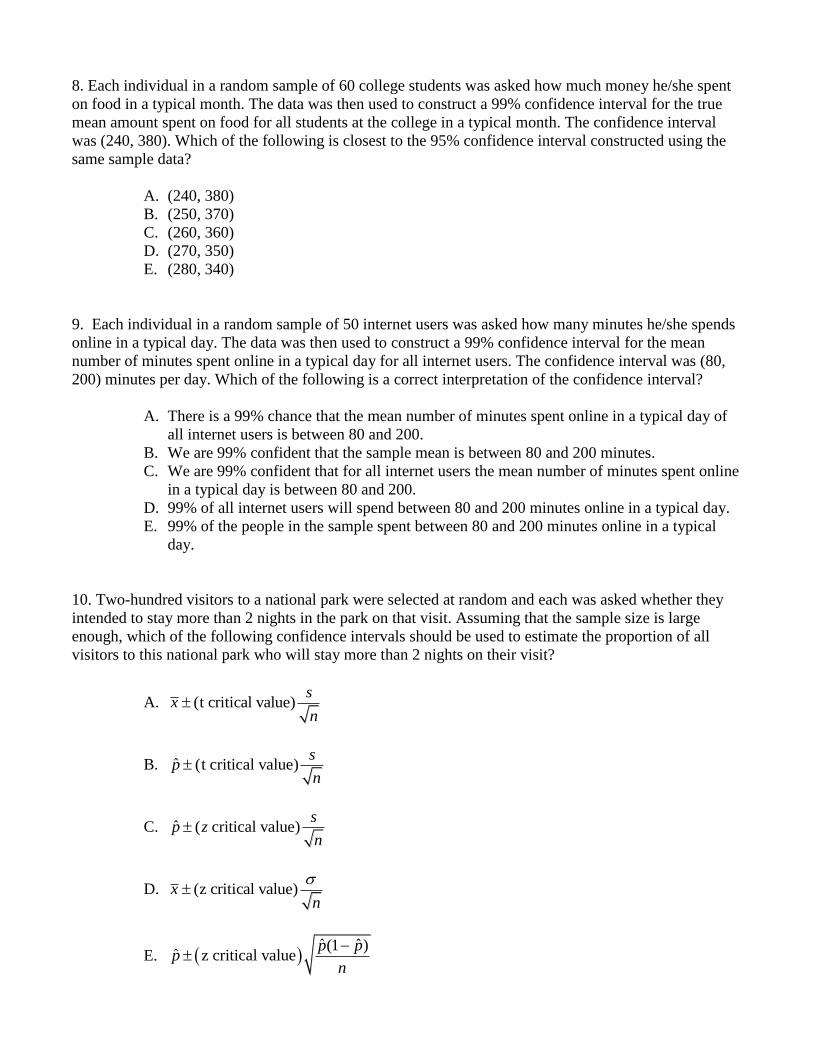
8. Each individual in a random sample of 60 college students was asked how much money he/she spent
on food in a typical month. The data was then used to construct a 99% confidence interval for the true
mean amount spent on food for all students at the college in a typical month. The confidence interval
was (240, 380). Which of the following is closest to the 95% confidence interval constructed using the
same sample data?
A. (240, 380)
B. (250, 370)
C. (260, 360)
D. (270, 350)
E. (280, 340)
9. Each individual in a random sample of 50 internet users was asked how many minutes he/she spends
online in a typical day. The data was then used to construct a 99% confidence interval for the mean
number of minutes spent online in a typical day for all internet users. The confidence interval was (80,
200) minutes per day. Which of the following is a correct interpretation of the confidence interval?
A. There is a 99% chance that the mean number of minutes spent online in a typical day of
all internet users is between 80 and 200.
B. We are 99% confident that the sample mean is between 80 and 200 minutes.
C. We are 99% confident that for all internet users the mean number of minutes spent online
in a typical day is between 80 and 200.
D. 99% of all internet users will spend between 80 and 200 minutes online in a typical day.
E. 99% of the people in the sample spent between 80 and 200 minutes online in a typical
day.
10. Two-hundred visitors to a national park were selected at random and each was asked whether they
intended to stay more than 2 nights in the park on that visit. Assuming that the sample size is large
enough, which of the following confidence intervals should be used to estimate the proportion of all
visitors to this national park who will stay more than 2 nights on their visit?
A. (t critical value)s
xn
B. ˆ (t critical value)s
pn
C. ˆ ( critical value)s
p zn
D. (z critical value)xn
E. ˆ ˆ(1 )
ˆ z critical valuep p
pn
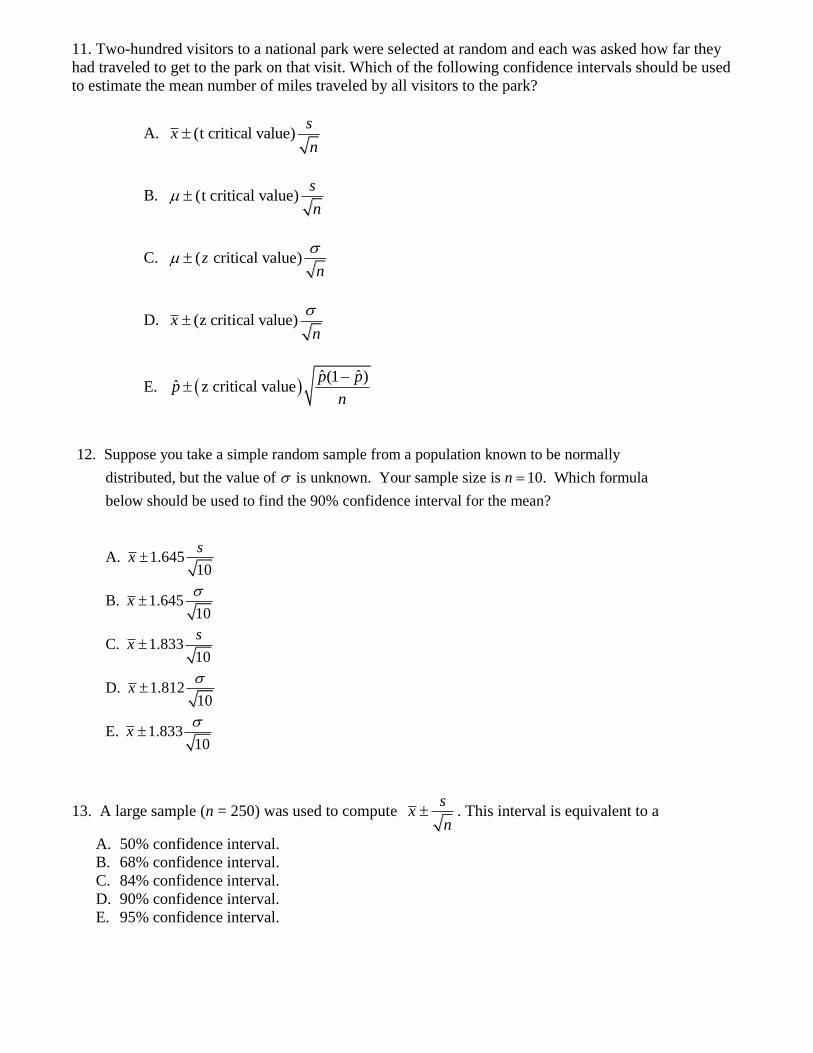
11. Two-hundred visitors to a national park were selected at random and each was asked how far they
had traveled to get to the park on that visit. Which of the following confidence intervals should be used
to estimate the mean number of miles traveled by all visitors to the park?
A. (t critical value)s
xn
B. (t critical value)s
n
C. ( critical value)zn
D. (z critical value)xn
E. ˆ ˆ(1 )
ˆ z critical valuep p
pn
12. Suppose you take a simple random sample from a population known to be normally
distributed, but the value of is unknown. Your sample size is 10. Which formula
below should be us
n
ed to find the 90% confidence interval for the mean?
A. 1.64510
B. 1.64510
C. 1.83310
D. 1.81210
E. 1.83310
sx
x
sx
x
x
13. A large sample (n = 250) was used to compute s
xn
. This interval is equivalent to a
A. 50% confidence interval.
B. 68% confidence interval.
C. 84% confidence interval.
D. 90% confidence interval.
E. 95% confidence interval.

14. Which of the following is certain to reduce the width of a confidence interval?
A. larger sample size and higher confidence level
B. larger sample size and lower confidence level
C. smaller sample size and higher confidence level
D. smaller sample size and lower confidence level
E. None of the above.
15. The critical value for a 99% confidence interval for p =
A. 2.33 B. 2.58 C. 2.97 D. 3.09 E. 3.29
16. What is the difference between a t-interval and z-interval?
A. z-intervals are used if you know the population’s standard deviation and t-intervals are used when
you do not know the population’s standard deviation.
B. t-intervals are used if you know the population’s standard deviation and z-intervals are used when
you do not know the population’s standard deviation.
C. t-intervals are used when the sample size is much larger than in z-intervals
D. z-intervals are used when the data are not normally distributed
E. t-intervals use the sample size where z-intervals use n-1 degrees of freedom
17. Assuming that the data came from a random sample, what other conditions must be met in order to
perform a z-interval on a single proportion?
A. The sample size is greater than 30 or the data are roughly normal.
B. The population of interest is greater than the sample size.
C. The population is greater than 10 times the sample size.
D. The probability of success times sample size is greater than 10 as well as the probability of failure
times the sample size is greater than 10.
E. Both C and D must be true for a proportion interval to be constructed.
18. A researcher wants to find a reasonable interval of the mean time it takes to complete an order over
the phone at a call center for a large retail company. He has selected a sample of 18 calls and recorded
the time to completion on the phone to be 4.27 minutes with a standard deviation of 0.78 minutes. What
is the appropriate interval if he wants to use a 98% confidence level?
A.
4.27 2.3260.78
18
B.
4.27 2.0540.78
17
C.
4.27 2.5520.78
18
D.
4.27 2.5670.78
18
E.
4.27 2.5670.78
17
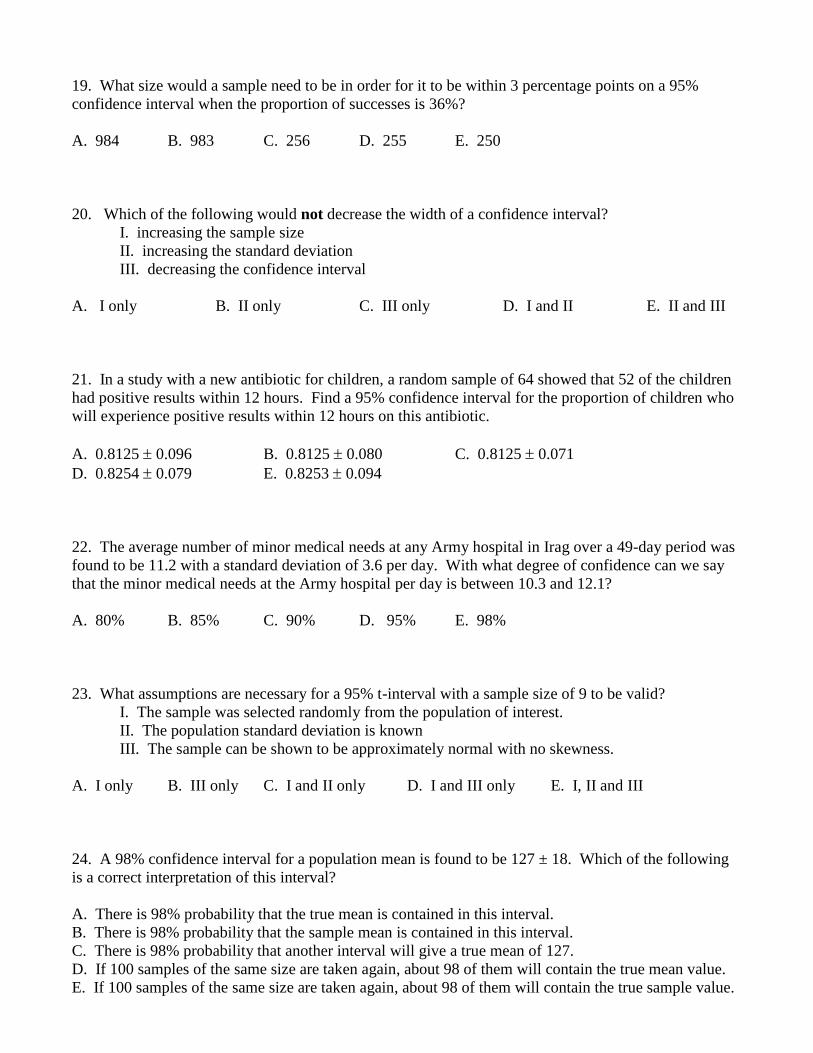
19. What size would a sample need to be in order for it to be within 3 percentage points on a 95%
confidence interval when the proportion of successes is 36%?
A. 984 B. 983 C. 256 D. 255 E. 250
20. Which of the following would not decrease the width of a confidence interval?
I. increasing the sample size
II. increasing the standard deviation
III. decreasing the confidence interval
A. I only B. II only C. III only D. I and II E. II and III
21. In a study with a new antibiotic for children, a random sample of 64 showed that 52 of the children
had positive results within 12 hours. Find a 95% confidence interval for the proportion of children who
will experience positive results within 12 hours on this antibiotic.
A. 0.8125 0.096 B. 0.8125 0.080 C. 0.8125 0.071
D. 0.8254 0.079 E. 0.8253 0.094
22. The average number of minor medical needs at any Army hospital in Irag over a 49-day period was
found to be 11.2 with a standard deviation of 3.6 per day. With what degree of confidence can we say
that the minor medical needs at the Army hospital per day is between 10.3 and 12.1?
A. 80% B. 85% C. 90% D. 95% E. 98%
23. What assumptions are necessary for a 95% t-interval with a sample size of 9 to be valid?
I. The sample was selected randomly from the population of interest.
II. The population standard deviation is known
III. The sample can be shown to be approximately normal with no skewness.
A. I only B. III only C. I and II only D. I and III only E. I, II and III
24. A 98% confidence interval for a population mean is found to be 127 ± 18. Which of the following
is a correct interpretation of this interval?
A. There is 98% probability that the true mean is contained in this interval.
B. There is 98% probability that the sample mean is contained in this interval.
C. There is 98% probability that another interval will give a true mean of 127.
D. If 100 samples of the same size are taken again, about 98 of them will contain the true mean value.
E. If 100 samples of the same size are taken again, about 98 of them will contain the true sample value.
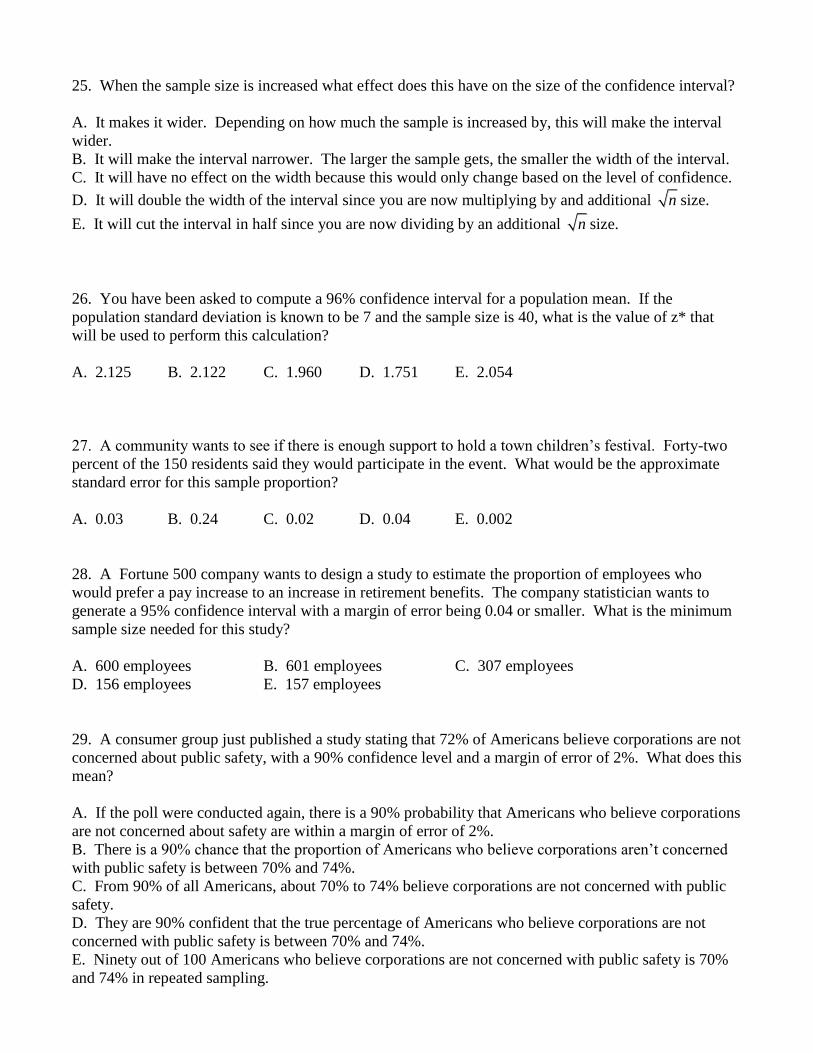
25. When the sample size is increased what effect does this have on the size of the confidence interval?
A. It makes it wider. Depending on how much the sample is increased by, this will make the interval
wider.
B. It will make the interval narrower. The larger the sample gets, the smaller the width of the interval.
C. It will have no effect on the width because this would only change based on the level of confidence.
D. It will double the width of the interval since you are now multiplying by and additional n size.
E. It will cut the interval in half since you are now dividing by an additional n size.
26. You have been asked to compute a 96% confidence interval for a population mean. If the
population standard deviation is known to be 7 and the sample size is 40, what is the value of z* that
will be used to perform this calculation?
A. 2.125 B. 2.122 C. 1.960 D. 1.751 E. 2.054
27. A community wants to see if there is enough support to hold a town children’s festival. Forty-two
percent of the 150 residents said they would participate in the event. What would be the approximate
standard error for this sample proportion?
A. 0.03 B. 0.24 C. 0.02 D. 0.04 E. 0.002
28. A Fortune 500 company wants to design a study to estimate the proportion of employees who
would prefer a pay increase to an increase in retirement benefits. The company statistician wants to
generate a 95% confidence interval with a margin of error being 0.04 or smaller. What is the minimum
sample size needed for this study?
A. 600 employees B. 601 employees C. 307 employees
D. 156 employees E. 157 employees
29. A consumer group just published a study stating that 72% of Americans believe corporations are not
concerned about public safety, with a 90% confidence level and a margin of error of 2%. What does this
mean?
A. If the poll were conducted again, there is a 90% probability that Americans who believe corporations
are not concerned about safety are within a margin of error of 2%.
B. There is a 90% chance that the proportion of Americans who believe corporations aren’t concerned
with public safety is between 70% and 74%.
C. From 90% of all Americans, about 70% to 74% believe corporations are not concerned with public
safety.
D. They are 90% confident that the true percentage of Americans who believe corporations are not
concerned with public safety is between 70% and 74%.
E. Ninety out of 100 Americans who believe corporations are not concerned with public safety is 70%
and 74% in repeated sampling.

Ch. 9
1. A university administrator in charge of computing facilities will close a computer lab if there is
convincing evidence that the proportion of students at the university who have access to a computer at
home is greater than .6. What hypotheses should the administrator test?
A. H0: μ < .6 Ha: μ = .6
B. H0: μ = .6 Ha: μ >.6
C. H0: p = .6 Ha: p > .6
D. H0: p > .6 Ha: p = .6
E. H0: p > .6 Ha: p < .6
2. The manager of a large hotel must decide whether to hire additional front desk staff. He has decided
to hire more staff if there is evidence that the average time customers must wait in line before being
assisted with check-in is greater than 3 minutes. He decides to test H0: μ = 3 versus Ha: μ > 3. Which of
the following would be a consequence of making a Type II error?
A. Deciding not to hire additional staff when the wait time really is greater than 3 minutes.
B. Deciding not to hire additional staff when the wait time really is not greater than 3 minutes.
C. Deciding to hire additional staff when the wait time really is greater than 3 minutes.
D. Deciding to hire additional staff when the wait time really is not greater than 3 minutes.
E. Deciding that a wait time of greater than 3 minutes is acceptable.
3. The principal at a large high school will implement a proposed after-school tutoring program if there
is evidence that the proportion of students at the school who would take advantage of such a program is
greater than .10. She decides to collect data in order to test H0: p = .1 versus Ha: p > .1. In this setting,
which of the following would be a consequence of making a Type I error?
A. Implementing the program when the proportion of students who would take advantage of the
program is greater than .10.
B. Not implementing the program when the proportion of students who would take advantage of the
program is greater than .10.
C. Implementing the program when the proportion of students who would take advantage of the
program is not greater than .10.
D. Not implementing the program when the proportion of students who would take advantage of the
program is not greater than .10.
E. Deciding that it is acceptable to implement the program as long as 5% of the students would
participate.
4. The marketing department of a national department store chain designs its advertising to target 18 –
24 year-olds. The marketing manager worries that the average age of the chain’s customers is greater
than 24, in which case the marketing plan should be reconsidered. He decides to survey a random
sample of 100 customers and will use the resulting data to test H0: μ = 24 versus Ha: μ > 24, where μ is
the mean customer age. Suppose that the P-value from this test was .03. Which of the following is a
correct interpretation of this P-value?
A. The probability that the null hypothesis is true is .03.
B. The probability that the null hypothesis is false is .03.
C. When the null hypothesis is true, the probability of seeing results as or more extreme than what
was observed in the sample is .03.
D. When the null hypothesis is false, the probability of seeing results as extreme as what was
observed in the sample is .03.
E. Approximately 3% of the chain’s customers are older than 24.
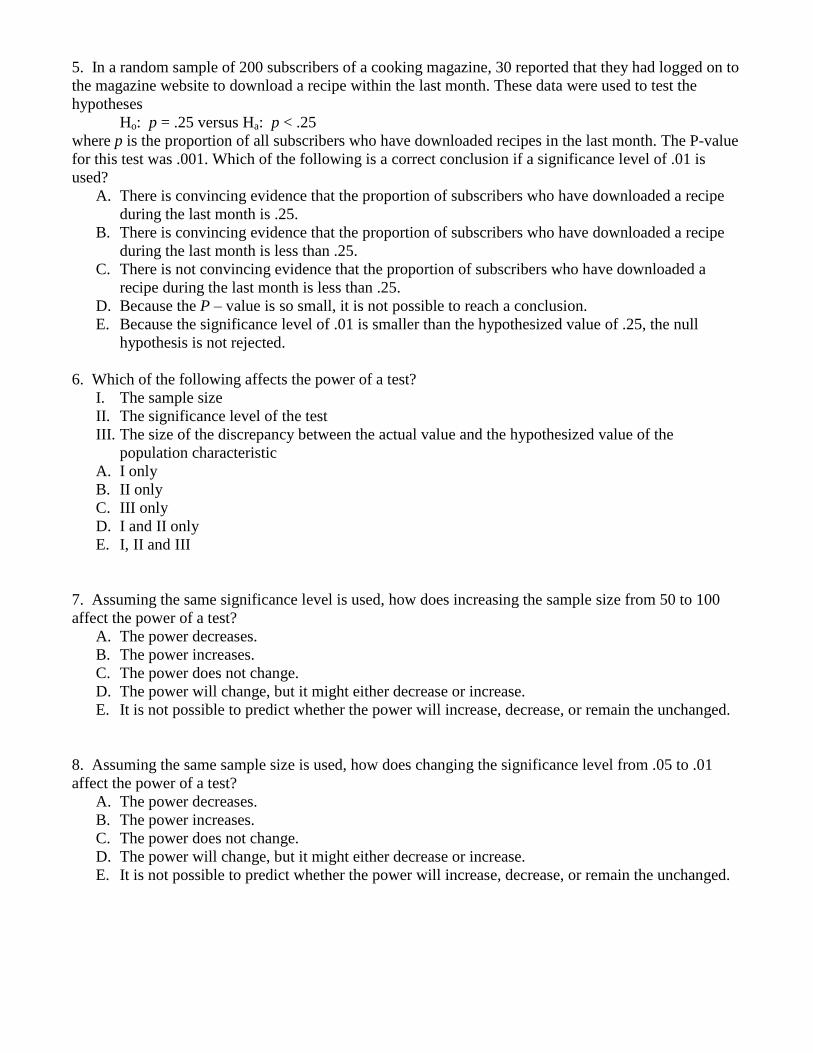
5. In a random sample of 200 subscribers of a cooking magazine, 30 reported that they had logged on to
the magazine website to download a recipe within the last month. These data were used to test the
hypotheses
Ho: p = .25 versus Ha: p < .25
where p is the proportion of all subscribers who have downloaded recipes in the last month. The P-value
for this test was .001. Which of the following is a correct conclusion if a significance level of .01 is
used?
A. There is convincing evidence that the proportion of subscribers who have downloaded a recipe
during the last month is .25.
B. There is convincing evidence that the proportion of subscribers who have downloaded a recipe
during the last month is less than .25.
C. There is not convincing evidence that the proportion of subscribers who have downloaded a
recipe during the last month is less than .25.
D. Because the P – value is so small, it is not possible to reach a conclusion.
E. Because the significance level of .01 is smaller than the hypothesized value of .25, the null
hypothesis is not rejected.
6. Which of the following affects the power of a test?
I. The sample size
II. The significance level of the test
III. The size of the discrepancy between the actual value and the hypothesized value of the
population characteristic
A. I only
B. II only
C. III only
D. I and II only
E. I, II and III
7. Assuming the same significance level is used, how does increasing the sample size from 50 to 100
affect the power of a test?
A. The power decreases.
B. The power increases.
C. The power does not change.
D. The power will change, but it might either decrease or increase.
E. It is not possible to predict whether the power will increase, decrease, or remain the unchanged.
8. Assuming the same sample size is used, how does changing the significance level from .05 to .01
affect the power of a test?
A. The power decreases.
B. The power increases.
C. The power does not change.
D. The power will change, but it might either decrease or increase.
E. It is not possible to predict whether the power will increase, decrease, or remain the unchanged.

9. In a test of H0: μ = 100 versus Ha: μ > 100, the power of the test will be lowest when the true value
of the population mean is
A. 101
B. 110
C. 120
D. 200
E. The power will be the same for any value greater than 100.
10. The value of the test statistic in a one-sample z test is z = -2.36. What is the P – value for this test if
the alternative hypothesis is : 50aH ?
A. ( 2.36)P z
B. ( 2.36)P z
C. 2 ( 2.36)P z
D. 2 ( 2.36)P z
E. ( 2.36) ( 2.36)P z P z
11. For which sample size and choice of significance level will the power of a test be greatest?
A. n = 10, α = .1
B. n = 10, α = .01
C. n = 100, α = .1
D. n = 100, α = .05
E. n = 100, α = .01
12. A psychologist runs a study and reports her results were statistically significant at the 0.05 level.
This result means which of the following?
A. The P-value calculated was smaller than the level of 0.05.
B. The P-value calculated was larger than the level of 0.05.
C. The level calculated was larger than 0.05.
D. The level calculated was smaller than 0.05.
E. There is insufficient information to make a decision.
13. A Type I error occurs in which of the following?
A. The
Ha is rejected when it should not be rejected.
B. The
H0 is not rejected when it should be rejected.
C. The
H0 is rejected when it should not be rejected.
D. The P-value is too small to reject the
H0 .
E. The level is too small to reject
H0 .
14. A Type II error occurs in which of the following?
A. The
H0 is rejected when it should not be rejected.
B. The
H0 is not rejected when it should be rejected.
C. The
Ha is not rejected when it should be rejected.
D. The P-value is too small to reject the
H0 .
E. The level is too small to reject
H0 .
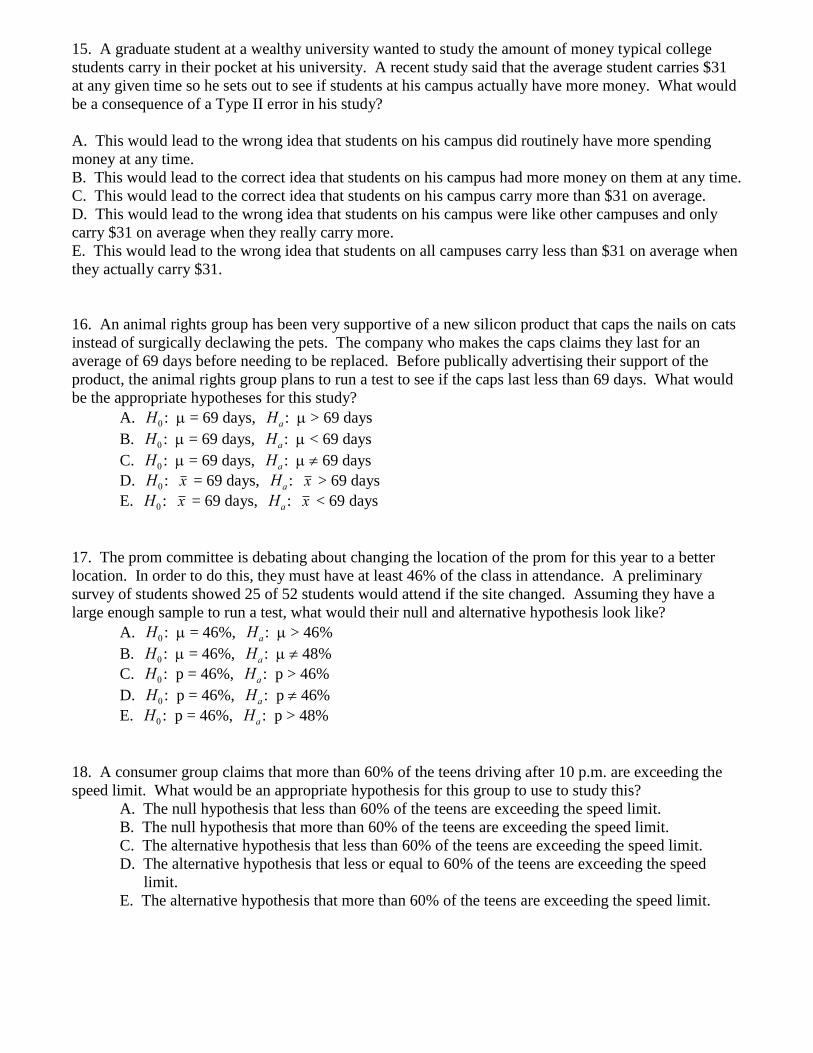
15. A graduate student at a wealthy university wanted to study the amount of money typical college
students carry in their pocket at his university. A recent study said that the average student carries $31
at any given time so he sets out to see if students at his campus actually have more money. What would
be a consequence of a Type II error in his study?
A. This would lead to the wrong idea that students on his campus did routinely have more spending
money at any time.
B. This would lead to the correct idea that students on his campus had more money on them at any time.
C. This would lead to the correct idea that students on his campus carry more than $31 on average.
D. This would lead to the wrong idea that students on his campus were like other campuses and only
carry $31 on average when they really carry more.
E. This would lead to the wrong idea that students on all campuses carry less than $31 on average when
they actually carry $31.
16. An animal rights group has been very supportive of a new silicon product that caps the nails on cats
instead of surgically declawing the pets. The company who makes the caps claims they last for an
average of 69 days before needing to be replaced. Before publically advertising their support of the
product, the animal rights group plans to run a test to see if the caps last less than 69 days. What would
be the appropriate hypotheses for this study?
A.
H0 : = 69 days,
Ha : > 69 days
B.
H0 : = 69 days,
Ha : < 69 days
C.
H0 : = 69 days,
Ha : 69 days
D.
H0 :
x = 69 days,
Ha :
x > 69 days
E.
H0 :
x = 69 days,
Ha :
x < 69 days
17. The prom committee is debating about changing the location of the prom for this year to a better
location. In order to do this, they must have at least 46% of the class in attendance. A preliminary
survey of students showed 25 of 52 students would attend if the site changed. Assuming they have a
large enough sample to run a test, what would their null and alternative hypothesis look like?
A.
H0 : = 46%,
Ha : > 46%
B.
H0 : = 46%,
Ha : 48%
C.
H0 : p = 46%,
Ha : p > 46%
D.
H0 : p = 46%,
Ha : p 46%
E.
H0 : p = 46%,
Ha : p > 48%
18. A consumer group claims that more than 60% of the teens driving after 10 p.m. are exceeding the
speed limit. What would be an appropriate hypothesis for this group to use to study this?
A. The null hypothesis that less than 60% of the teens are exceeding the speed limit.
B. The null hypothesis that more than 60% of the teens are exceeding the speed limit.
C. The alternative hypothesis that less than 60% of the teens are exceeding the speed limit.
D. The alternative hypothesis that less or equal to 60% of the teens are exceeding the speed
limit.
E. The alternative hypothesis that more than 60% of the teens are exceeding the speed limit.

19. A study by a geological research team said that a new piece of equipment designed for early
earthquake detection is not effective based on their recent study of 40 pieces of equipment they have
stationed near earthquake active zones with = 0.05. However, the manufacturer of the equipment
claims this study was flawed and their equipment is good. The research team is considering rerunning
the study with the intention of increasing the power of this test. If the equipment really does detect
earthquakes early which of the following would ensure an increase in the power of this test?
A. Move the equipment to three randomly chosen new locations.
B. Change = 0.05 to = 0.01.
C. Run a two-sided test instead of a one-sided test.
D. Increase the sample size to 60 pieces of equipment being tested.
E. Decrease the sample size to 20 pieces of equipment being tested.
20. True or False. If the null hypothesis is not rejected, there is strong statistical evidence that the null
hypothesis is true.
21. Because t procedures are robust, the most important condition for their use is
(a) the population standard deviation is known
(b) the population distribution is exactly Normal
(c) the data can be regarded as an SRS from the population
(d) np and n(1 – p) are both at least 10
(e) there are no outliers in the sample data
22. After once again losing a football game to the archrival, a college’s alumni association conducted
a survey to see if alumni were in favor of firing the coach. An SRS of 100 alumni from the
population of all living alumni was taken. 64 of the alumni in the sample were in favor of firing the
coach. Suppose you wish to see if a majority of living alumni are in favor of firing the coach. The
appropriate test statistic is
(a) (0.64 0.5) (0.64)(0.36) 100z
(b) (0.64 0.5) (0.5)(0.5) 100z
(c) (0.64 0.5) (0.64)(0.36) 64z
(d) (0.64 0.5) (0.5)(0.5) 64z
(e) (0.64 0.5) (0.5)(0.64) 100t
23. Looking online (for example, at espn.go.com) you find the salaries of all 22 players for the
Chicago Cubs as of opening day of the 2005 baseball season. The club total was $87 million, eighth
in the major leagues. Which inference procedure would you use to estimate the average salary of the
Cubs players?
(a) one-sample z interval for
(b) one-sample t interval for
(c) one-sample t test
(d) one-sample z test
(e) none of these
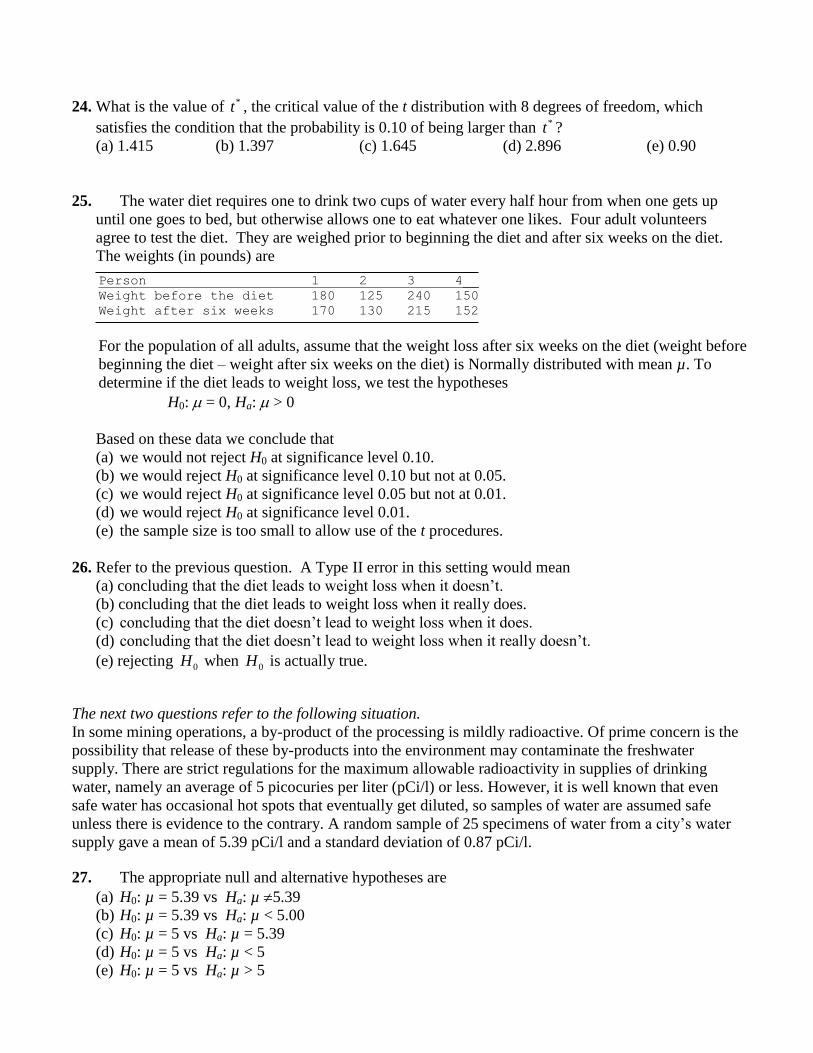
24. What is the value of *t , the critical value of the t distribution with 8 degrees of freedom, which
satisfies the condition that the probability is 0.10 of being larger than *t ?
(a) 1.415 (b) 1.397 (c) 1.645 (d) 2.896 (e) 0.90
25. The water diet requires one to drink two cups of water every half hour from when one gets up
until one goes to bed, but otherwise allows one to eat whatever one likes. Four adult volunteers
agree to test the diet. They are weighed prior to beginning the diet and after six weeks on the diet.
The weights (in pounds) are
Person 1 2 3 4__
Weight before the diet 180 125 240 150
Weight after six weeks 170 130 215 152
For the population of all adults, assume that the weight loss after six weeks on the diet (weight before
beginning the diet – weight after six weeks on the diet) is Normally distributed with mean µ. To
determine if the diet leads to weight loss, we test the hypotheses
H0: = 0, Ha: > 0
Based on these data we conclude that
(a) we would not reject H0 at significance level 0.10.
(b) we would reject H0 at significance level 0.10 but not at 0.05.
(c) we would reject H0 at significance level 0.05 but not at 0.01.
(d) we would reject H0 at significance level 0.01.
(e) the sample size is too small to allow use of the t procedures.
26. Refer to the previous question. A Type II error in this setting would mean
(a) concluding that the diet leads to weight loss when it doesn’t.
(b) concluding that the diet leads to weight loss when it really does.
(c) concluding that the diet doesn’t lead to weight loss when it does.
(d) concluding that the diet doesn’t lead to weight loss when it really doesn’t.
(e) rejecting 0H when 0H is actually true.
The next two questions refer to the following situation.
In some mining operations, a by-product of the processing is mildly radioactive. Of prime concern is the
possibility that release of these by-products into the environment may contaminate the freshwater
supply. There are strict regulations for the maximum allowable radioactivity in supplies of drinking
water, namely an average of 5 picocuries per liter (pCi/l) or less. However, it is well known that even
safe water has occasional hot spots that eventually get diluted, so samples of water are assumed safe
unless there is evidence to the contrary. A random sample of 25 specimens of water from a city’s water
supply gave a mean of 5.39 pCi/l and a standard deviation of 0.87 pCi/l.
27. The appropriate null and alternative hypotheses are
(a) H0: µ = 5.39 vs Ha: µ 5.39
(b) H0: µ = 5.39 vs Ha: µ < 5.00
(c) H0: µ = 5 vs Ha: µ = 5.39
(d) H0: µ = 5 vs Ha: µ < 5
(e) H0: µ = 5 vs Ha: µ > 5
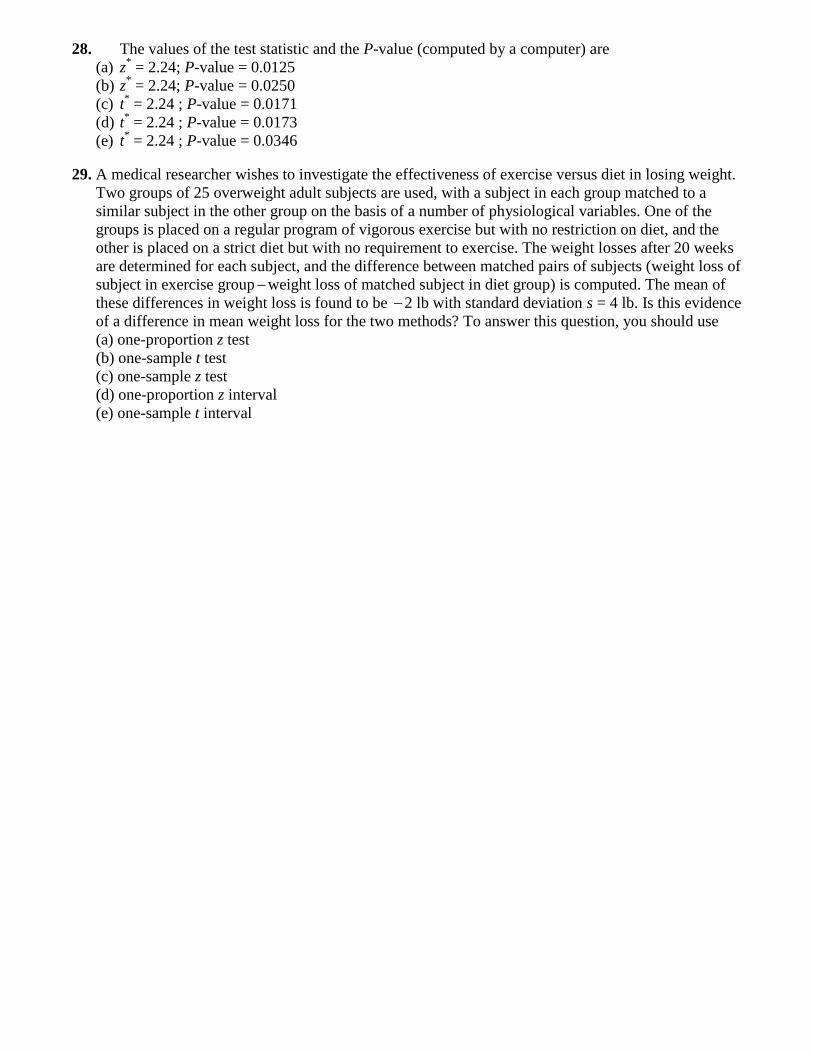
28. The values of the test statistic and the P-value (computed by a computer) are
(a) z* = 2.24; P-value = 0.0125
(b) z* = 2.24; P-value = 0.0250
(c) t* = 2.24 ; P-value = 0.0171
(d) t* = 2.24 ; P-value = 0.0173
(e) t* = 2.24 ; P-value = 0.0346
29. A medical researcher wishes to investigate the effectiveness of exercise versus diet in losing weight.
Two groups of 25 overweight adult subjects are used, with a subject in each group matched to a
similar subject in the other group on the basis of a number of physiological variables. One of the
groups is placed on a regular program of vigorous exercise but with no restriction on diet, and the
other is placed on a strict diet but with no requirement to exercise. The weight losses after 20 weeks
are determined for each subject, and the difference between matched pairs of subjects (weight loss of
subject in exercise groupweight loss of matched subject in diet group) is computed. The mean of
these differences in weight loss is found to be 2 lb with standard deviation s = 4 lb. Is this evidence
of a difference in mean weight loss for the two methods? To answer this question, you should use
(a) one-proportion z test
(b) one-sample t test
(c) one-sample z test
(d) one-proportion z interval
(e) one-sample t interval

Free Response
30. A large Midwestern forest planted by the CCC at the end of the depression is now too thick for safe
tree growth and many sections are beginning to die. The state forestry commission has hired a lumber
company to begin cutting down enough trees to allow the healthier trees to continue to grow. A sample
of 204 trees found that 28% of the trees must be removed to allow further growth.
a. What conditions need to be checked in order to calculate a confidence interval?
b. If the forestry commission wants to estimate the proportion of the total forest population that will
need to be removed, calculate a 95% confidence interval to predict the amount of cutting that will occur.
c. Interpret this interval and explain why this is reasonable.
31. An AP coordinator in an urban school district mandates that AP students take a practice exam,
called a Mock Exam, in the spring to help identify student potential scores on the upcoming exam in
May. A random sample of AP students’ Mock Exam was taken and the scores recorded. The results for
28 of the students were found to be:
AP Mock Exam Scores
58 76 74 80 88 74 65
97 66 95 77 63 83 73
64 71 60 68 70 63 71
57 75 74 52 71 81 82
a. Construct a 90% confidence interval for the mean score on the AP Mock Exams given in this district.
Justify your answer.
b. Explain why the answer is reasonable
c. The district has found in previous years that their students tend to score a passing score on the
national exam (that is 3-5) if the Mock scores are at least a 70. Can the AP coordinator feel confident in
this year’s results? Explain how you arrived at this conclusion.
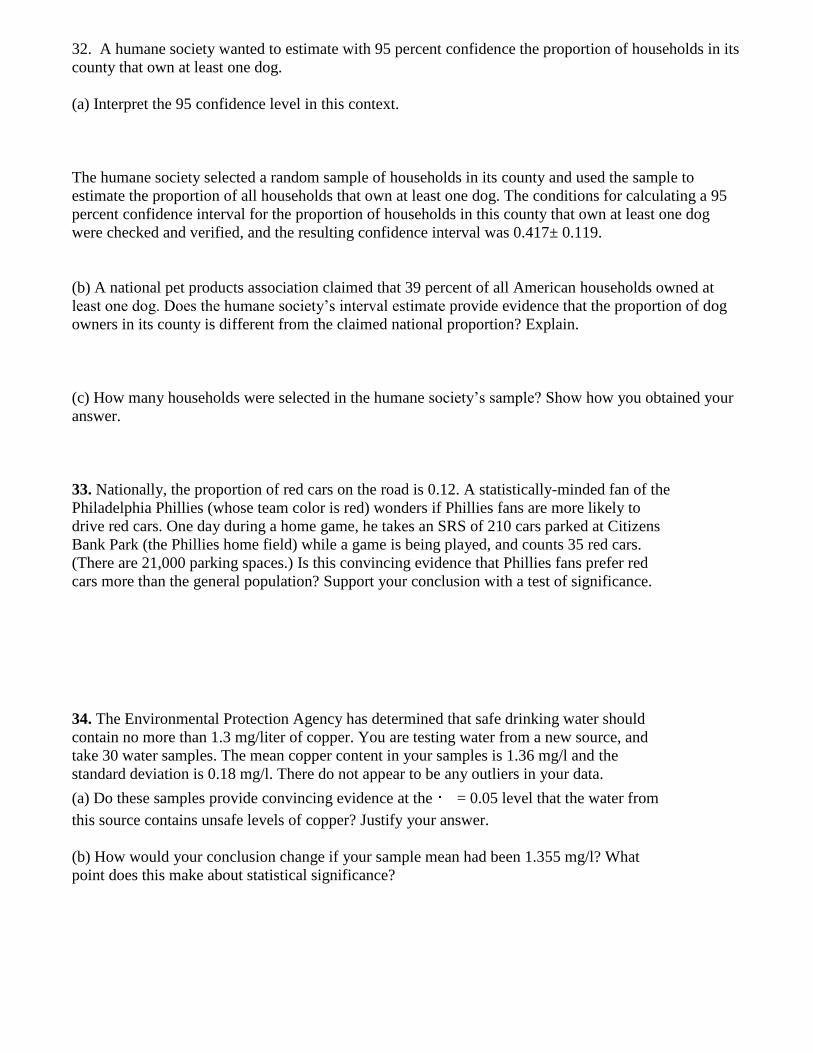
32. A humane society wanted to estimate with 95 percent confidence the proportion of households in its
county that own at least one dog.
(a) Interpret the 95 confidence level in this context.
The humane society selected a random sample of households in its county and used the sample to
estimate the proportion of all households that own at least one dog. The conditions for calculating a 95
percent confidence interval for the proportion of households in this county that own at least one dog
were checked and verified, and the resulting confidence interval was 0.417± 0.119.
(b) A national pet products association claimed that 39 percent of all American households owned at
least one dog. Does the humane society’s interval estimate provide evidence that the proportion of dog
owners in its county is different from the claimed national proportion? Explain.
(c) How many households were selected in the humane society’s sample? Show how you obtained your
answer.
33. Nationally, the proportion of red cars on the road is 0.12. A statistically-minded fan of the
Philadelphia Phillies (whose team color is red) wonders if Phillies fans are more likely to
drive red cars. One day during a home game, he takes an SRS of 210 cars parked at Citizens
Bank Park (the Phillies home field) while a game is being played, and counts 35 red cars.
(There are 21,000 parking spaces.) Is this convincing evidence that Phillies fans prefer red
cars more than the general population? Support your conclusion with a test of significance.
34. The Environmental Protection Agency has determined that safe drinking water should
contain no more than 1.3 mg/liter of copper. You are testing water from a new source, and
take 30 water samples. The mean copper content in your samples is 1.36 mg/l and the
standard deviation is 0.18 mg/l. There do not appear to be any outliers in your data.
(a) Do these samples provide convincing evidence at the = 0.05 level that the water from
this source contains unsafe levels of copper? Justify your answer.
(b) How would your conclusion change if your sample mean had been 1.355 mg/l? What
point does this make about statistical significance?
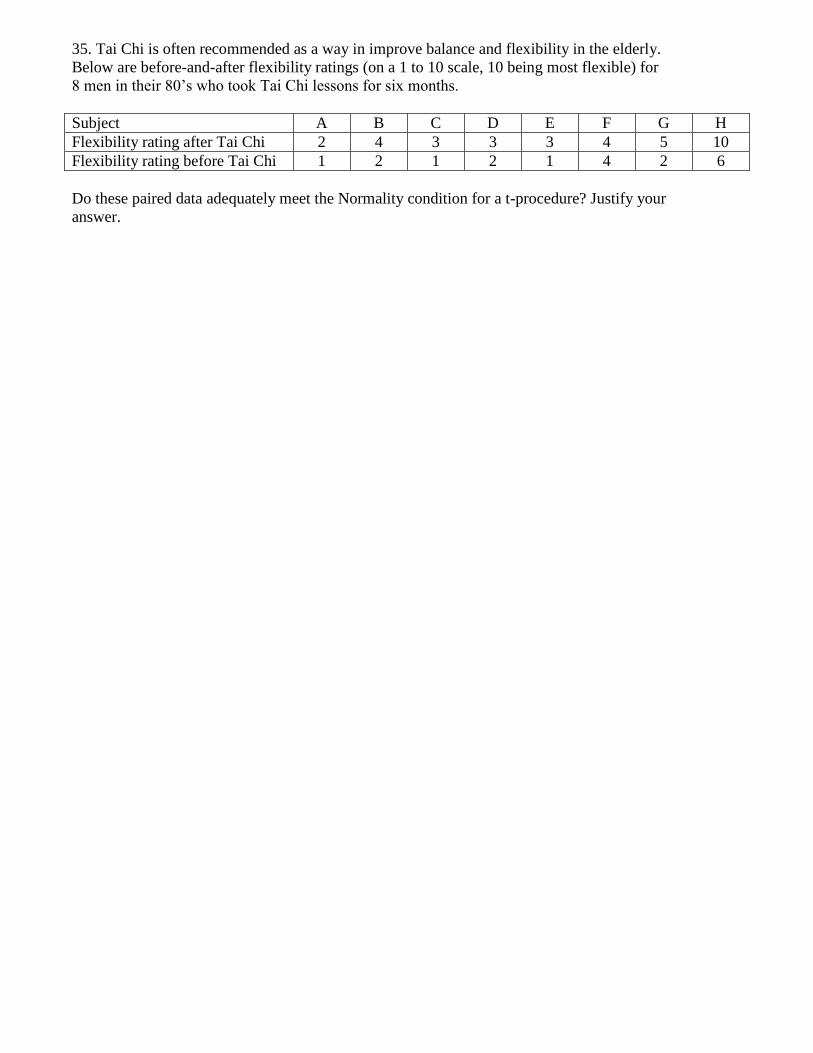
35. Tai Chi is often recommended as a way in improve balance and flexibility in the elderly.
Below are before-and-after flexibility ratings (on a 1 to 10 scale, 10 being most flexible) for
8 men in their 80’s who took Tai Chi lessons for six months.
Subject A B C D E F G H
Flexibility rating after Tai Chi 2 4 3 3 3 4 5 10
Flexibility rating before Tai Chi 1 2 1 2 1 4 2 6
Do these paired data adequately meet the Normality condition for a t-procedure? Justify your
answer.
Answer Key:
Ch 8
4. D 5. A 6. E 7. E 8. C 9. C 10. E 11. A 12. C 13. B 14. B
15. B 16. A 17. E 18. D 19. A 20. B 21. A 22. C 23. D 24. D
25. B 26. E 27. D 28. B 29. D
Ch 9
1. C 2. A 3. C 4. C 5. B 6. E 7. B 8. A 9. A 10. B 11. C 12. A 13. C
14. B 15. D 16. B 17. C 18. E 19. D 20. False 21. C 22. B 23. E
24. B 25. A 26. C 27. E 28. D 29. B
30. a. Since this is a proportions case, the following four conditions must be met to run this interval.
We need to assume the sample came from a simple random sample of trees.
204(0.28) = 57.12 ≥ 10, this is ok and 204(0.72) = 146.88 ≥ 10, this is ok
10(204) = 2040, as long as the forest had more than 2040 trees, then you can proceed with a confidence
interval.
b. Based on a 95% confidence level, the proportion of trees from the forest needing to be removed
would reasonably be within (0.218, 0.341)
c. I am 95% confident that the true proportion of trees needing to be removed from the forest is between
21.8% and 34.1%. I am confident in this because the method used will capture the true proportion of
trees needing to be removed 95 out of 100 times in repeated sampling.
31. a. Since this is means data and we do not know the populations standard deviation, a t-interval
needs to be used. The justification is found in checking the conditions needed for a t-interval. The
problem stated it was a random sample so we will assume this is sufficient. Since the sample size is
slightly under 30, we will still check for the data being roughly normal. Either a boxplot or normal
probability plot would suffice. In both cases there is no reason to doubt the sample data are roughly
normally distributed so we can proceed to the calculations.
The interval would be (69, 76)
b. This is a reasonable solution because the method used for generating a t-interval will capture the true
test average 90 out of 100 times in repeated sampling.
c. Since the interval is from 69 to 76, I am 90% confident that is the true mean AP Mock score is
contained in this interval. Further, since the district is looking for students to score 70 and 70 is
contained in the interval found; it is a reasonable conclusion that the district coordinator can be
confident in the students’ results this year.
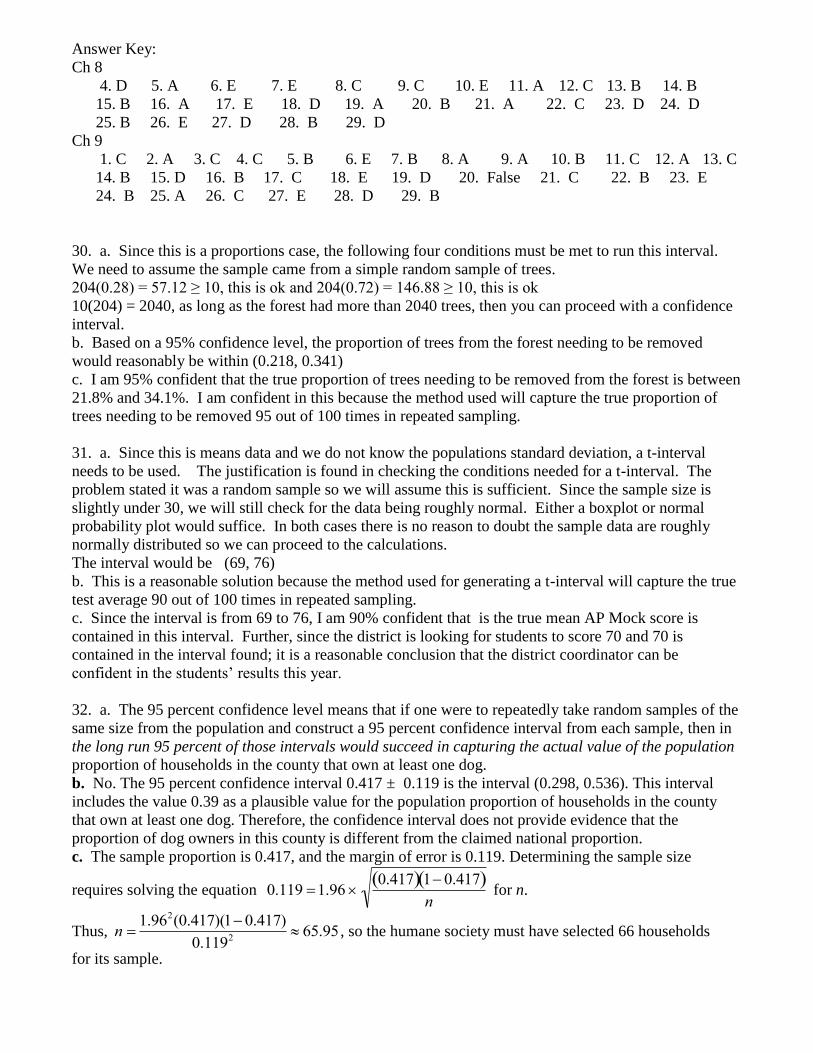
32. a. The 95 percent confidence level means that if one were to repeatedly take random samples of the
same size from the population and construct a 95 percent confidence interval from each sample, then in
the long run 95 percent of those intervals would succeed in capturing the actual value of the population
proportion of households in the county that own at least one dog.
b. No. The 95 percent confidence interval 0.417 ± 0.119 is the interval (0.298, 0.536). This interval
includes the value 0.39 as a plausible value for the population proportion of households in the county
that own at least one dog. Therefore, the confidence interval does not provide evidence that the
proportion of dog owners in this county is different from the claimed national proportion.
c. The sample proportion is 0.417, and the margin of error is 0.119. Determining the sample size
requires solving the equation
0.119 1.96 0.417 10.417
n for n.
Thus,
n 1.962(0.417)(10.417)
0.1192 65.95 , so the humane society must have selected 66 households
for its sample.

33. State: Do Phillies fans prefer red cars more than the general public?
Let be the true proportion of Phillies fans who prefer red cars.
Test at significance level (or any significance level of your choice.)
Plan:
We can use a 1-proportion z test to answer this question, if conditions are met.
Random: It is given that an SRS of cars is used
10%: Since we are sampling without replacement, we must assume that there are more than
10(35) = 350 Phillies fans. Since the parking lot holds 21,000 cars, this is clearly a reasonable
assumption.
Large Counts: In order for the sampling distribution of ̂ to be approximately Normal, the
counts of red cars and non-red cars must both be at least 10. There are 35 red cars in the sample
and 175 non-red cars, so these large count conditions are met.
Our conditions for inference on are satisfied.
Do:
We calculate the sample statistic ̂
We calculate the test statistic
√
We sketch the z-distribution, plot the test-statistic, shade in the direction of the alternative
(greater than), and then find the P-value of the test.
Here is Minitab output of the graph that you should make a quick sketch of here.
0.4
0.3
0.2
0.1
0.0
z
De
nsit
y
2.0816
0.01869
0
Distribution PlotNormal, Mean=0, StDev=1
The P-value of the test is 0.0187.
Conclude:
Since , we reject . At the 0.05 level of significance, there is sufficient
evidence to conclude that Phillies fans prefer red cars more than the general public.
(Note that there are many other choices for alpha that we would still find the results statistically
significant. We always conclude using the level that we set at the beginning. We can also say,
however, that the p-value is very small and our findings would be significant at smaller levels of
alpha as well.)
34. . State: Does the water from this source contain unsafe levels of copper?
Let be the true mean level of copper in the water from this source.
Test at significance level

Plan:
Because is unknown, we will use a test to answer this question, if conditions are met.
Random: We have to be willing to consider these 30 water samples as a random sample from this
source. This is reasonable, but must be verified if we were to take action on our findings.
10%: Since we are sampling without replacement, we must assume our 30 water samples are not
more than 10% of the entire population. This is reasonable. The water source may in fact
represent an infinite population, so we can safely use the formula for standard deviation of ̅.
Large Counts: In order for the sampling distribution of ̅ to be approximately Normal, not
knowing the population distribution, we need to invoke the Central Limit Theorem. The sample
size of 30 is large enough for us to safely assume that the sampling distribution of ̅ is
approximately Normal.
Our conditions for inference on are (conditionally) satisfied. We will proceed with caution.
Do:
We are given that the sample statistic ̅
We calculate the test statistic
√
We sketch the t-distribution for t with 29 degrees of freedom, plot the test-statistic, shade in the
direction of the alternative (greater than), and then find the P-value of the test.
Here is Minitab output of the graph that you should make a quick sketch of here.
0.4
0.3
0.2
0.1
0.0
t
De
nsit
y
1.82574
0.03910
0
Distribution PlotT, df=29
The P-value of the test is 0.03910.
Conclude:
Since , we reject . At the 0.05 level of significance, there is sufficient
evidence to conclude that water from this source contains unsafe levels of copper.
b) With this new sample statistic, the P-value of the test would be 0.0525 which is greater than
alpha and we would fail to reject the null. At the 0.05 level of significance there is not sufficient
evidence to conclude that the water from this source contains unsafe levels of copper. The point
this makes about statistical significance is that tiny changes in a sample statistic can result in
different conclusions.
35. Plotting the 8 differences (paired data, so each subject has one rating of after-before) we do not see
any obvious departure from normality. The histogram is fairly symmetric and the normal probability
plot is fairly linear. There is no strong skew and no clear outliers. It is safe to assume that the statistic
of these differences is Normally distributed.