AP Statistics Chapter 4 - Weebly
18
1 AP Statistics Chapter 4 Ch3 Describing Relationships Ch4 Designing Studies 10 11 B Day 12 A Day 13 B Day 14 A Day Columbus Day - No School Chapter 3 Test 4.1 Sampling and Surveys Page 229 (1, 3, 6, 7, 9, 10, 11, 13, 15, 19) 4.1 (Day 2) Page 231 (23, 25, 27, 30, 31, 33, 35, 37-42) Ch4 Designing Studies 17 B Day 18 A Day 19 B Day 20 A Day 21 B Day 4.1 (Day 2) Page 231 (23, 25, 27, 30, 31, 33, 35, 37-42) 4.2 Experiments Page 260 (47, 48, 51, 55, 57, 59, 61, 63, 67, 68, 69, 71,73) 4.3 Using Studies Wisely Page 262 (75, 77, 79, 81, 83, 85, 87-94, 101) Ch4 Designing Studies 24 A Day 25 B Day 26 A Day 27 B Day 28 A Day Ch. 4 Review/Catch-up Day FRAPPY! and extra quizzes HW: Chapter Review Exercises (page 278) Chapter 4 Practice Test (page 279) Chapter 4 Test 4.1 Sampling and Surveys Vocabulary population census sample convenience sample bias voluntary response sample random sampling SRS stratified random sample strata cluster sample clusters undercoverage nonresponse Learning Objectives IDENTIFY the population and sample in a statistical study. IDENTIFY voluntary response samples and convenience samples. Explain how these sampling methods can lead to bias. DESCRIBE how to obtain a random sample using slips of paper, technology, or a table of random digits. DISTINGUISH a simple random sample from a stratified random sample or cluster sample. Give the advantages and disadvantages of each sampling method. EXPLAIN how undercoverage, nonresponse, question wording, and other aspects of a sample survey can lead to bias. 4.2 Experiments Vocabulary observational study experiment confounding treatment experimental units subjects factors levels random assignment completely randomized design control group placebo effect double-blind statistically significant block randomized block design matched pairs design Learning Objectives DISTINGUISH BETWEEN an observational study and an experiment. EXPLAIN the concept of confounding and how it limits the ability to make cause-and-effect conclusions. IDENTIFY the experimental units, explanatory and response variables, and treatments. EXPLAIN the purpose of comparison, random assignment, control, and replication in an experiment. DESCROBE a completely randomized design for an experiment, including how to randomly assign treatments using slips of paper, technology, or a table of random digits. DESCRIBE the placebo effect and the purpose of blinding in an experiment. INTERPRET the meaning of statistically significant in the context of an experiment. EXPLAIN the purpose of blocking in an experiment. Describe a ransomized block design or a matched pairs design for an experiment. 4.3 Using Studies Wisely Vocabulary inference about a population inference about cause and effect lack of realism institutional review board informed consent confidential Learning Objectives DESCRIBE the scope of inference that is appropriate in a statistical study. EVALUATE whether a statistical study has been carried out in an ethical manner.
Transcript of AP Statistics Chapter 4 - Weebly

1
AP Statistics Chapter 4 Ch3 Describing Relationships Ch4 Designing Studies
10 11 B Day 12 A Day 13 B Day 14 A Day
Columbus Day -
No School
Chapter 3 Test
4.1 Sampling and Surveys Page 229 (1, 3, 6, 7, 9, 10, 11, 13, 15, 19)
4.1 (Day 2) Page 231 (23, 25, 27, 30, 31, 33, 35, 37-42)
Ch4 Designing Studies
17 B Day 18 A Day 19 B Day 20 A Day 21 B Day
4.1 (Day 2) Page 231 (23, 25, 27, 30, 31, 33, 35, 37-42)
4.2 Experiments Page 260 (47, 48, 51, 55, 57, 59, 61, 63, 67, 68, 69, 71,73)
4.3 Using Studies Wisely Page 262 (75, 77, 79, 81, 83, 85, 87-94, 101)
Ch4 Designing Studies
24 A Day 25 B Day 26 A Day 27 B Day 28 A Day
Ch. 4 Review/Catch-up Day FRAPPY! and extra quizzes HW: Chapter Review Exercises (page 278)
Chapter 4 Practice Test (page 279)
Chapter 4 Test
4.1 Sampling and Surveys Vocabulary population census sample convenience sample bias voluntary response
sample random sampling SRS
stratified random
sample strata cluster sample clusters undercoverage nonresponse
Learning Objectives IDENTIFY the population and sample in a statistical study. IDENTIFY voluntary response samples and convenience samples. Explain how these sampling methods can
lead to bias. DESCRIBE how to obtain a random sample using slips of paper, technology, or a table of random digits. DISTINGUISH a simple random sample from a stratified random sample or cluster sample. Give the
advantages and disadvantages of each sampling method. EXPLAIN how undercoverage, nonresponse, question wording, and other aspects of a sample survey can
lead to bias.
4.2 Experiments Vocabulary observational study experiment confounding treatment experimental units subjects factors levels random assignment completely
randomized design
control group placebo effect double-blind statistically
significant block randomized block
design matched pairs design
Learning Objectives DISTINGUISH BETWEEN an observational study and an experiment. EXPLAIN the concept of confounding and how it limits the ability to make cause-and-effect conclusions. IDENTIFY the experimental units, explanatory and response variables, and treatments. EXPLAIN the purpose of comparison, random assignment, control, and replication in an experiment. DESCROBE a completely randomized design for an experiment, including how to randomly assign
treatments using slips of paper, technology, or a table of random digits. DESCRIBE the placebo effect and the purpose of blinding in an experiment. INTERPRET the meaning of statistically significant in the context of an experiment. EXPLAIN the purpose of blocking in an experiment. Describe a ransomized block design or a matched pairs
design for an experiment.
4.3 Using Studies Wisely Vocabulary inference about a
population inference about
cause and effect lack of realism
institutional review
board informed consent confidential
Learning Objectives DESCRIBE the scope of inference that is appropriate in a statistical study. EVALUATE whether a statistical study has been carried out in an ethical manner.

2
Ch4 Notes – Designing Studies 4.1 Sampling and Surveys Review Learning Objectives on p209 Vocabulary: population, census, sample What’s the difference between a population and a sample? What is a census? The Idea of a Sample Survey (p210-211) How to Sample Badly (p211-213) Vocabulary: convenience sample, bias, voluntary response sample
What’s the problem with convenience samples? What is bias? What’s a voluntary response sample? Is this a good method for obtaining a sample? Check Your Understanding (p213) Alternate Example: To estimate the proportion of families that oppose budget cuts to the athletic department, the principal surveys families as they enter the football stadium on Friday night. Explain how this plan will result in bias and how the bias will affect the estimated proportion.
3
HW #4.1A: page 229 (1, 3, 6, 7, 9, 10) How to Sample Well: Simple Random Sampling (p213-218) Vocabulary: random sampling, simple random sample (SRS) What’s a simple random sample (SRS)? How can you choose a SRS? What’s the difference between sampling with replacement and sampling without replacement? How should
you account for this difference when using a table of random digits or other random number generator? Choosing an SRS with Technology (p215-216) Choosing an SRS using Table D (p216) Alternate Example: Mall Hours The management company of a local mall plans to survey a random sample of 3 stores to determine the hours they would like to stay open during the holiday season. Use Table D at line 101 to select an SRS of size 3 stores.
Aeropostale Forever 21 Old Navy All American Burger GameStop Pac Sun Arby’s Gymboree Panda Express Barnes & Noble Haggar Payless Shoes Carter’s for Kids Just Sports Star Jewelers Destination Tan Mrs. Fields Vitamin World Famous Footwear Nike Factory Store Zales Diamond Store
4
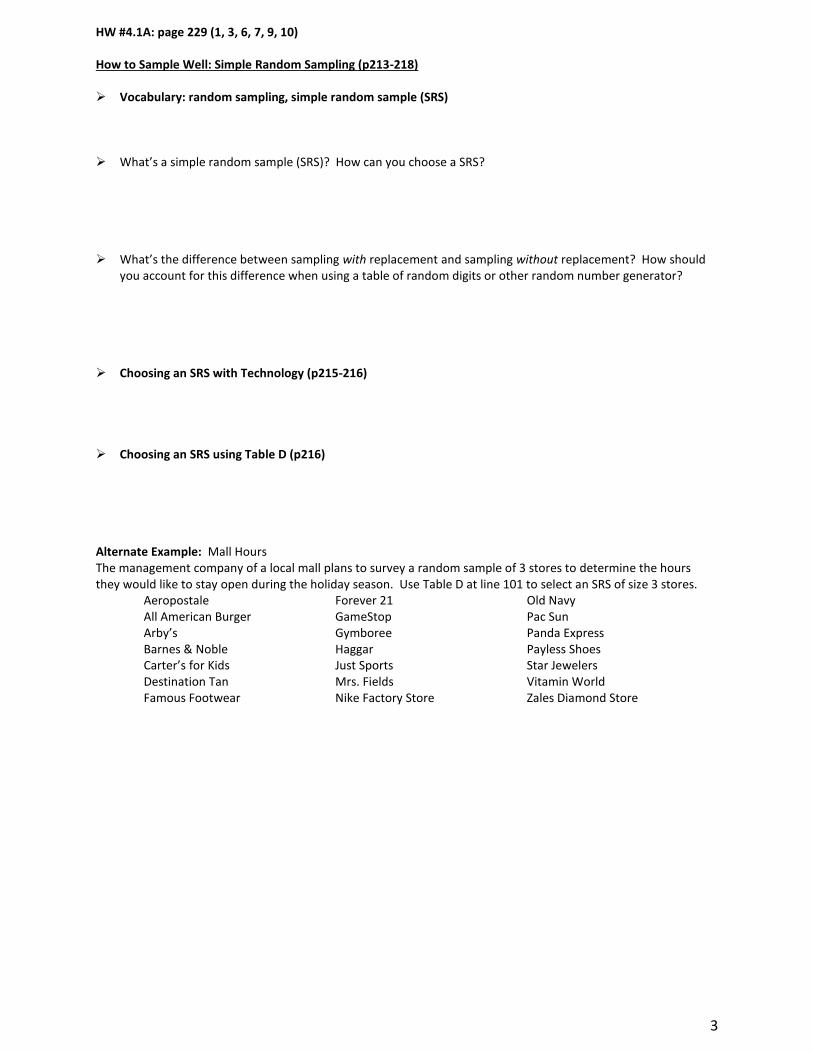
Activity: Sampling from The Federalist Papers (p218) The Federalist Papers are a series of 85 essays supporting the ratification of the U.S. Constitution. At the time they were published, the identity of the authors was a secret known to just a few people. Over time, however, the authors were identified as Alexander Hamilton, James Madison, and John Jay. The authorship of 73 of the essays is fairly certain, leaving 12 in dispute. However, thanks in some part to statistical analysis
1, most scholars now
believe that the 12 disputed essays were written by Madison alone or in collaboration with Hamilton2.
There are several ways to use statistics to help determine the authorship of a disputed text. One example is to estimate the average word length in a disputed text and compare it to the average word lengths of works where the authorship is not in dispute. Directions: The following passage is the opening paragraph of Federalist Paper #51
3, one of the disputed essays.
The theme of this essay is the separation of powers between the three branches of government. Choose 5 words from this passage, count the number of letters in each of the words you selected and find the average word length. Share your estimate with the class and create a class dotplot.
To what expedient, then, shall we finally resort, for maintaining in practice the necessary partition of power among the several departments, as laid down in the Constitution? The only answer that can be given is, that as all these exterior provisions are found to be inadequate, the defect must be supplied, by so contriving the interior structure of the government as that its several constituent parts may, by their mutual relations, be the means of keeping each other in their proper places. Without presuming to undertake a full development of this important idea, I will hazard a few general observations, which may perhaps place it in a clearer light, and enable us to form a more correct judgment of the principles and structure of the government planned by the convention.
1 Frederick Mosteller and David L. Wallace. Inference and Disputed Authorship: The Federalist.
Addison-Wesley, Reading, Mass., 1964. 2 http://en.wikipedia.org/wiki/Federalist_papers
3 http://www.constitution.org/fed/federa51.htm
5
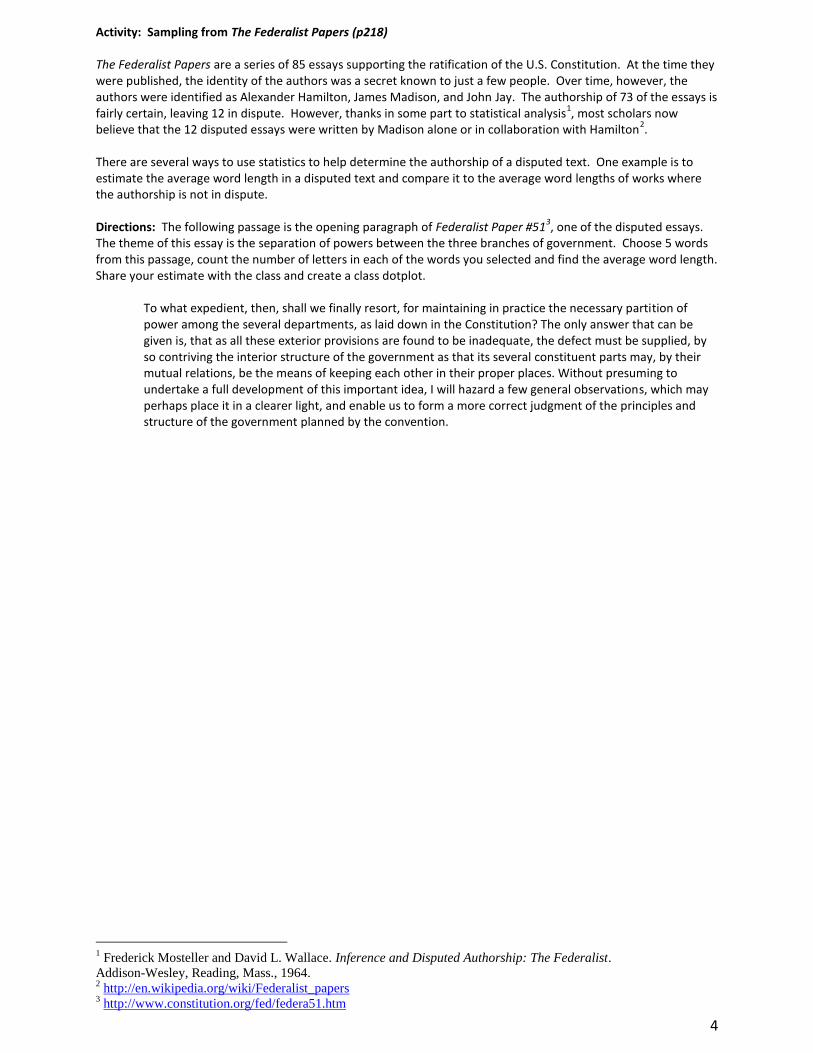
Directions: Use a table of random digits or a random number generator to select a simple random sample (SRS) of 5 words from the opening passage to the Federalist Paper #51. Once you have chosen the words, count the number of letters in each of the words you selected and find the average word length. Share your estimate with the class and create a class dotplot. How does this dotplot compare to the first one? Can you think of any reasons why they might be different?
Number Word Number Word Number Word
1 To 44 To 87 A
2 What 45 Be 88 Full
3 Expedient 46 Inadequate 89 Development
4 Then 47 The 90 Of
5 Shall 48 Defect 91 This
6 We 49 Must 92 Important
7 Finally 50 Be 93 Idea
8 Resort 51 Supplied 94 I
9 For 52 By 95 Will
10 Maintaining 53 So 96 Hazard
11 In 54 Contriving 97 A
12 Practice 55 The 98 Few
13 The 56 Interior 99 General
14 Necessary 57 Structure 100 Observations
15 Partition 58 Of 101 Which
16 Of 59 The 102 May
17 Power 60 Government 103 Perhaps
18 Among 61 As 104 Place
19 The 62 That 105 It
20 Several 63 Its 106 In
21 Departments 64 Several 107 A
22 As 65 Constituent 108 Clearer
23 Laid 66 Parts 109 Light
24 Down 67 May 110 And
25 In 68 By 111 Enable
26 The 69 Their 112 Us
27 Constitution 70 Mutual 113 To
28 The 71 Relations 114 Form
29 Only 72 Be 115 A
30 Answer 73 The 116 More
31 That 74 Means 117 Correct
32 Can 75 Of 118 Judgment
33 Be 76 Keeping 119 Of
34 Given 77 Each 120 The
35 Is 78 Other 121 Principles
36 That 79 In 122 And
37 As 80 Their 123 Structure
38 All 81 Proper 124 Of
39 These 82 Places 125 The
40 Exterior 83 Without 126 Government
41 Provisions 84 Presuming 127 Planned
42 Are 85 To 128 By
43 Found 86 Undertake 129 The
130 Convention
Statistics was also used to identify JK Rowling as the author of The Cuckoo’s Calling. http://phenomena.nationalgeographic.com/2013/07/19/how-forensic-linguistics-outed-j-k-rowling-not-to-mention-james-madison-barack-obama-and-the-rest-of-us/

6
Other Random Sampling Methods (p219-223) Vocabulary: stratified random sample, strata, cluster sample, clusters Example: Suppose we wanted to estimate the yield of our corn field. The field is square and divided into 16 equally sized plots (4 rows x 4 columns). A river runs along the eastern edge of the field. We want to take a sample of 4 plots. Using a random number generator, pick a simple random sample (SRS) of 4 plots. Place an X in the 4 plots that you choose.
river
Now, randomly choose one plot from each horizontal row. This is called a stratified random sample.
river
Finally, randomly choose one plot from each vertical column. This is also a stratified random sample.
river
Which method do you think will work the best? Explain.
1 2 3 4
5 6 7 8
9 10 11 12
13 14 15 16
1 2 3 4
1 2 3 4
1 2 3 4
1 2 3 4
1 1 1 1
2 2 2 2
3 3 3 3
4 4 4 4

7
Now, it’s time for the harvest! The numbers below are the yield for each of the 16 plots. For each of your three samples above, calculate the average yield. Graphing the results: Simple Random Sample:
10 70 130 average yield Stratified by Row:
10 70 130 average yield Stratified by Column:
10 70 130 average yield What is a stratified random sample? How is it different than a simple random sample? When is it beneficial to use a stratified random sample? What is the benefit? How do you choose a variable to stratify by? HW #4.1B page 230 (11–19 odd)
4 29 94 150
7 31 98 153
6 27 92 148
5 32 97 147

8
What is a cluster sample? Why do we use a cluster sample? How is it different than a stratified sample? Are
there any drawbacks? Alternate Example: A Good Read A school librarian wants to know the average number of pages in all the books in the library. The library has 20,000 books, arranged by type (fiction, biography, history, and so on) in shelves that hold about 50 books each. (a) Explain how to select a simple random sample of 500 books (b) Explain how to select a stratified random sample of 500 books. Explain your choice of strata and one reason why this method might be chosen. (c) Explain how to select a cluster sample of 500 books. Explain your choice of cluster and one reason why this method might be chosen. (d) Discuss a potential drawback with each of the methods described above. Check Your Understanding (p223)
9
Inference for Sampling (p223–225) What is inference? What is a margin of error? What is the benefit of increasing the sample size? Sample Surveys: What Can Go Wrong? (p225–228) Vocabulary: undercoverage, nonresponse What is a sampling frame? What is undercoverage and what problems might undercoverage cause? What is nonresponse and what problems might nonresponse cause? How is it different than voluntary
response? What is response bias and what problems might response bias cause? Article from Nate Silver: http://fivethirtyeight.com/features/is-the-polling-industry-in-stasis-or-in-crisis/ HW #4.1C: page 231 (21, 23, 25, 27, 30, 31, 33, 35)
10
4.2- Experiments Review Learning Objectives (p234) Observational Study versus Experiment (p235-237) Vocabulary: observational study, experiment, confounding Example: ADHD Linked to Lead and Mom’s Smoking, by Karen Barrow (February 1, 2007)
A mother’s smoking during pregnancy and exposure to lead significantly increases her child’s risk for developing attention deficit hyperactivity disorder (ADHD), say researchers. In fact, as many as one third of cases of ADHD in children are linked to exposure to tobacco smoke and lead before birth, giving moms yet another reason to quit smoking during pregnancy. For the study, researchers from Cincinnati Children’s Hospital Medical Center surveyed over 4,700 children between the ages of 4 and 15 and their parents. Over 4 percent of the children included had ADHD. The researchers found that those children whose mother smoked during pregnancy were over twice as likely to develop ADHD than a child whose mother had not smoked.
Based on this study, should we conclude that smoking during pregnancy causes an increase in the likelihood that a child develops ADHD? Explain. Explain the concept of confounding in the context of this study. Is there any way to prove that smoking causes ADHD?
Read 234–236 Read word-for-word What are some differences between an observational study and an experiment? What’s the difference between an explanatory variable and a response variable? Page 237: Check Your Understanding

11
The Language of Experiments (p237-239) Vocabulary: treatment, experimental units, subjects Example: Suppose we wanted to design an experiment to see if caffeine affects pulse rate. Here is an initial plan:
measure initial pulse rate
give each student some caffeine
wait for a specified time
measure final pulse rate
compare final and initial rates What are some problems with this plan? What other variables are most likely to be sources of variability in pulse rates? There are several steps we should take to solve these problems. 1. The first step is to include a ____________________________ that does not receive caffeine so we have something to compare to. Otherwise, any pulse-raising (or lowering) event that occurs during the experiment would be confounded with the caffeine. For example, an amazing stats lecture during the waiting period would certainly raise pulse rates, making it hard to know how much of the pulse increase was due to the caffeine. Briefly define the following terms in terms of the caffeine experiment:
Treatment
Experimental units
Subjects
Factor
Level Watch video on How to Buy Happiness for an example of a multi-factor experiment. HW #4.1D: page 233 (37–42) HW #4.2A: page 259 (45–55 odd) *Directions for 51–56 are the same

12
How to Experiment Badly/Well/Completely Randomized Designs/Experiments: What Can Go Wrong (p239-249) Vocabulary: random assignment, completely randomized design, double-blind Principles of Experimental Design (p242) The caffeine experiment, continued… 2. The second step is to make sure that the two groups (caffeine and non-caffeine) are as similar as possible and are treated in exactly the same way, with the exception of the treatments. To make this happen, we use randomization, replication, and control. 2a. We _____________________ subjects to treatments to create groups that are roughly equivalent at the beginning of the experiment. Random assignment ensures that the effects of uncontrolled variables are balanced among the treatments groups. We must ALWAYS randomize since there will always be other variables we cannot control or that we do not consider. Randomizing guards against what we don’t know and prevents people from asking “But what about this variable?” How do we randomize? What is a completely randomized design? 2b. __________________ means ensuring that there are an adequate number of units in each treatment group so that the two groups are as equivalent as possible. Then, differences in the effects of the treatments can be distinguished from chance differences between the groups.
Note: Replication can also refer to repeating the experiment with different subjects. This can help us feel more confident applying the results of our experiment to a _________________ .
2c. ____________________ means holding other variables constant for each member of both treatment groups. This prevents these other variables from becoming confounded with caffeine and from adding additional variability to the distribution of the response variable.
Prevents confounding: For example, sugar is an important variable to consider because it may affect pulse rates. If one treatment group was given regular Coke (which has sugar) and the other treatment group was given caffeine free Diet Coke (which has no sugar), then sugar and caffeine would be confounded. If there was a difference in the average change in pulse rates of the two groups after receiving the treatments, we wouldn’t know which variable caused the change, and to what extent. To prevent sugar from becoming confounded with caffeine, we need to make sure that members of both treatment groups get the same amount of sugar.
Reduces variability: For example, the amount of soda consumed is important to consider because it may affect pulse rates. If we let subjects in both groups drink any amount of soda they want, the changes in pulse rates will be more variable than if we made sure each subject drank the same amount of soda. This will make it harder to identify the effect of the caffeine (i.e., our study will have less power). For example, the first set of dotplots show the results of a well-done experiment. The second set of dotplots show the results of an experiment where students were allowed to drink as much (or as little) soda as they pleased. The additional variability in pulse rate changes makes the evidence for caffeine less convincing.

13
Will weight will be a confounding variable in this experiment? It is also important that all subjects in both groups are _________ so that the expectations are the same for
the subjects in both groups. Otherwise, members of the caffeine group might suffer from the ____________________. If the people measuring the response are also blind, the experiment is ____________________.
Note: Not all experiments have a control group or use a placebo as long as there is comparison. For example,
if you are testing a new drug, it is usually compared to the currently used drug, not a placebo. Also, you can do an experiment to compare four brands of paint without using a placebo.
SUMMARY: With randomization, replication, and control, each treatment group should be nearly identical,
and the effects of other variables should be about the same in each group. Now, if changes in the explanatory variable are associated with changes in the response variable, we can attribute the changes to the explanatory variable or the chance variation in the random assignment.
Read 239–249 How do the concepts in this section relate to the caffeine experiment? Alternate Example: Multitasking Researchers in Canada performed an experiment with university students to examine the effects of in-class laptop use on student learning. All participants in the study were asked to attend a university style lecture and take notes with their laptops. Half of the participants were assigned to complete other non-lecture related online tasks during the lecture. These tasks were meant to imitate typical student Web browsing during classes. The remaining students simply took notes with their laptops. To assign the treatments, the researchers printed 40 papers with instructions (20 with multitasking and 20 without), shuffled them, and handed them out at random to students in the classroom. At the end of the lecture, all participants took a comprehension test to measure how much they learned from it. The results: students who were assigned to multitask did significantly worse (11%) than students who were not assigned to multitask. Explain how each of the principles of experimental design was used in this study.

14
Check Your Understanding p247 Check Your Understanding p249 HW #4.2B: page 260 (57, 59, 61, 63, 67, 69, 71) Inference for Experiments (p249-251) Vocabulary: statistically significant Read 249
The results of an experiment are called ______________________________ if they are unlikely to occur by random chance. That is, if it is unlikely that the results are due to the possible imbalances created the random assignment. For example, if caffeine really has no effect on pulse rates, then the average change in pulse rate of the two groups should be exactly the same. However, because the results will vary depending on which subjects are assigned to which group, the average change in the two groups will probably differ slightly. Thus, whenever we do an experiment and find a difference between two groups, we need to determine if this difference could be attributed to the chance variation in random assignment or because there really is a difference in effect of the treatments. How can we determine if the results of our experiment are statistically significant? HW #4.2C: page 259 (48, 58, 64, 71, 73)
15
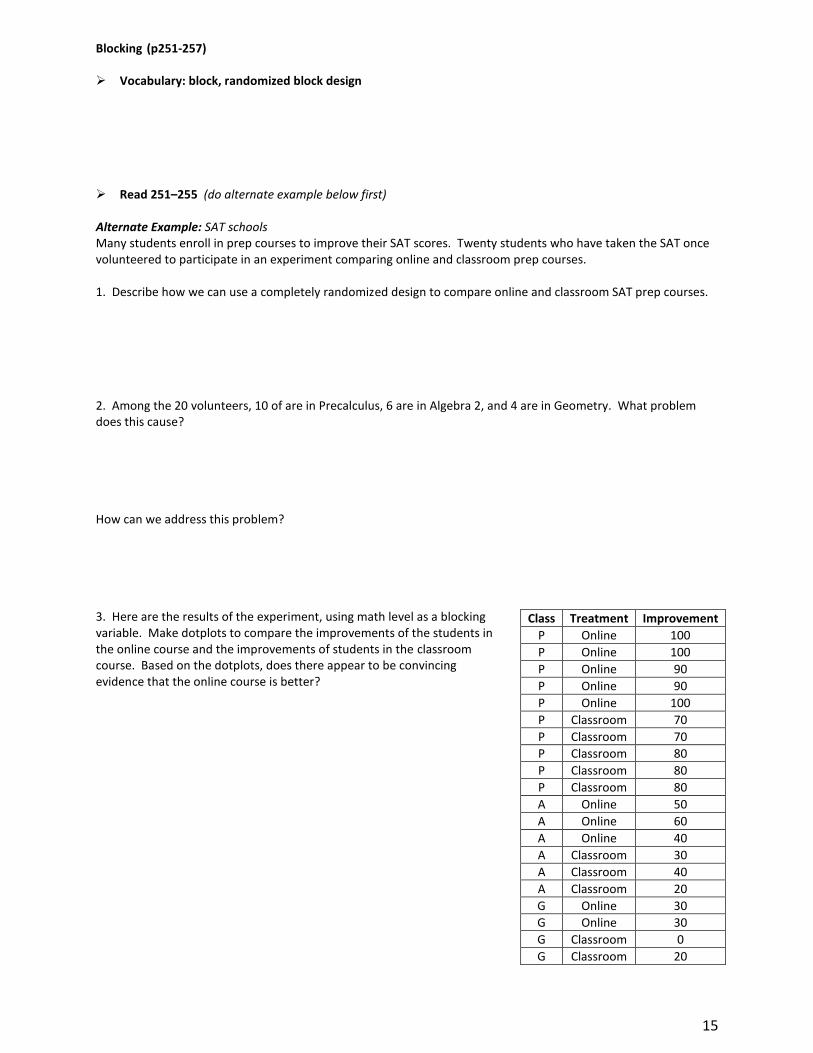
Blocking (p251-257) Vocabulary: block, randomized block design Read 251–255 (do alternate example below first) Alternate Example: SAT schools Many students enroll in prep courses to improve their SAT scores. Twenty students who have taken the SAT once volunteered to participate in an experiment comparing online and classroom prep courses. 1. Describe how we can use a completely randomized design to compare online and classroom SAT prep courses. 2. Among the 20 volunteers, 10 of are in Precalculus, 6 are in Algebra 2, and 4 are in Geometry. What problem does this cause? How can we address this problem? 3. Here are the results of the experiment, using math level as a blocking variable. Make dotplots to compare the improvements of the students in the online course and the improvements of students in the classroom course. Based on the dotplots, does there appear to be convincing evidence that the online course is better?
Class Treatment Improvement
P Online 100
P Online 100
P Online 90
P Online 90
P Online 100
P Classroom 70
P Classroom 70
P Classroom 80
P Classroom 80
P Classroom 80
A Online 50
A Online 60
A Online 40
A Classroom 30
A Classroom 40
A Classroom 20
G Online 30
G Online 30
G Classroom 0
G Classroom 20

16
4. The dotplots in #3 ignored the fact that we blocked by math level. Here is the dotplot again, using different symbols for students in each math level.
Notice that within each math level, the online students clearly did better. We couldn’t see this difference when we ignored the blocks. The average improvement for students
in Precalculus was Px = 86, the average improvement for
students in Algebra 2 was Ax = 40, and the average
improvement for students in Geometry was Gx = 20. How
can we use this information to account for the variability created by differences in class level? Blocking in experiments is similar to stratification in sampling.
Blocking accounts for a source of variability, just like stratifying. This means that blocking is a good way to increase your chances of finding convincing evidence.
Blocks should be chosen like strata: the units within the block should be similar, but different than the units in the other blocks. You should only block when you expect that the blocking variable is associated with the response variable.
Blocks, like strata, are not formed at random! What are some variables that we can block for in the caffeine experiment? In general, how can we determine which variables might be best for blocking?
Class Treatment Improvement
P Online 100
P Online 100
P Online 90
P Online 90
P Online 100
P Classroom 70
P Classroom 70
P Classroom 80
P Classroom 80
P Classroom 80
A Online 50
A Online 60
A Online 40
A Classroom 30
A Classroom 40
A Classroom 20
G Online 30
G Online 30
G Classroom 0
G Classroom 20
17
Alternate Example: Microwave Popcorn A popcorn lover wants to know if it is better to use the “popcorn button” on her microwave oven or use the amount of time recommended on the bag of popcorn. To measure how well each method works, she will count the number of unpopped kernels remaining after popping. She goes to the store and buys 10 bags each of 4 different varieties of microwave popcorn (movie butter, light butter, natural, and kettle corn), for a total of 40 bags. Explain why a randomized block design might be preferable to a completely randomized design for this experiment. Outline a randomized block design for this experiment.
What is a matched pairs design? Could we use a matched pairs design for the caffeine experiment?
HW #4.2D: page 262 (75, 77, 83, 85)

18
4.3 Using Studies Wisely Scope of Inference (Read p266-268) The scope of inference refers to the type of inferences (conclusions) that can be drawn from a study. The types of inferences we can make (inferences about the population and inferences about cause-and-effect) are determined by two factors in the design of the study:
Were individuals randomly assigned to groups?
Yes No
Were individuals randomly
selected from a population?
Yes Inferences about the population: ___ Inferences about cause and effect: ___
Inferences about the population: ___ Inferences about cause and effect: ___ (Some observational studies)
No Inferences about the population: ___ Inferences about cause and effect: ___ (Most experiments)
Inferences about the population: ___ Inferences about cause and effect: ___ (Some observational studies)
Alternate Example: Silence is golden? Many students insist that they study better when listening to music. A teacher doubts this claim and suspects that listening to music actually hurts academic performance. Here are four possible study designs to address this question at your school. In each case, the response variable will be the students’ GPA at the end of the semester.
1. Get all the students in your AP Statistics class to participate in a study. Ask them whether or not they study with music on and divide them into two groups based on their answer to this question.
2. Select a random sample of students from your school to participate in a study. Ask them whether or not they study with music on and divide them into two groups based on their answer to this question.
3. Get all the students in your AP Statistics class to participate in a study. Randomly assign half of the students to listen to music while studying for the entire semester and have the remaining half abstain from listening to music while studying.
4. Select a random sample of students from your school to participate in a study. Randomly assign half of the students to listen to music while studying for the entire semester and have the remaining half abstain from listening to music while studying.
For each design, suppose that the mean GPA for students who listen to music while studying was significantly lower than the mean GPA of students who didn’t listen to music while studying. What can we conclude for each design? The Challenges of Establishing Causation (p268-270) Data Ethics (p270-271)