AP STATISTICS 2010 SCORING GUIDELINES - College Board · AP® STATISTICS 2010 SCORING GUIDELINES ©...
18
AP ® STATISTICS 2010 SCORING GUIDELINES © 2010 The College Board. Visit the College Board on the Web: www.collegeboard.com. Question 6 Intent of Question The primary goals of this investigative task were to assess students’ ability to (1) produce and comment on a graphical display; (2) calculate a test statistic based on rank data; (3) use simulation results to draw an appropriate conclusion. Solution Part (a): Distance in Miles Location 1 0 - 2 0 5 - 1 0 2 - 5 1 - 2 < 1 A t l a n t i c F l o r i d a G u l f At l a n t i c F l o r i d a G u l f At l a n t i c F l o r i d a G u l f A t l a n t i c F l o r i d a Gu l f A t l a n t i c F l o r i d a Gu l f 40 30 20 10 0 Damages in Millions of Dollars per Acre Part (b): In all three regions (Gulf Coast, Florida, Lower Atlantic) the hurricane damage amounts tend to decrease as distance from the coast increases. For almost all given distances from the coast, the Florida region has the largest damage amounts. Also, for any given distance, the Gulf Coast and Lower Atlantic regions have similar damage amounts but with the Lower Atlantic damage amounts generally smaller. Part (c): For the “10 to 20 miles” distance category: The Florida region has the most damage (3.0 million dollars per acre) and so has rank 1. The region with the second-most damage is the Gulf Coast (1.7 million dollars), obtaining rank 2. The Lower Atlantic region has the least damage (0.3 million dollars) and so has rank 3. The last columns of the table should be filled in as follows:
Transcript of AP STATISTICS 2010 SCORING GUIDELINES - College Board · AP® STATISTICS 2010 SCORING GUIDELINES ©...

AP® STATISTICS 2010 SCORING GUIDELINES
© 2010 The College Board. Visit the College Board on the Web: www.collegeboard.com.
Question 6 Intent of Question The primary goals of this investigative task were to assess students’ ability to (1) produce and comment on a graphical display; (2) calculate a test statistic based on rank data; (3) use simulation results to draw an appropriate conclusion. Solution Part (a):
Dist ance in M ile s
Lo cat io n
10 -205 -1 02 -51 -2< 1
A t lan t ic
Florid
aG u lf
At lan t ic
F lo rida
G u lf
At lan tic
F lo rida
G u lf
A tlan tic
Florid
aGu lf
A tlan tic
Florid
aGu lf
40
30
20
10
0
Dam
ages
in M
illio
ns o
f D
olla
rs p
er A
cre
Part (b):
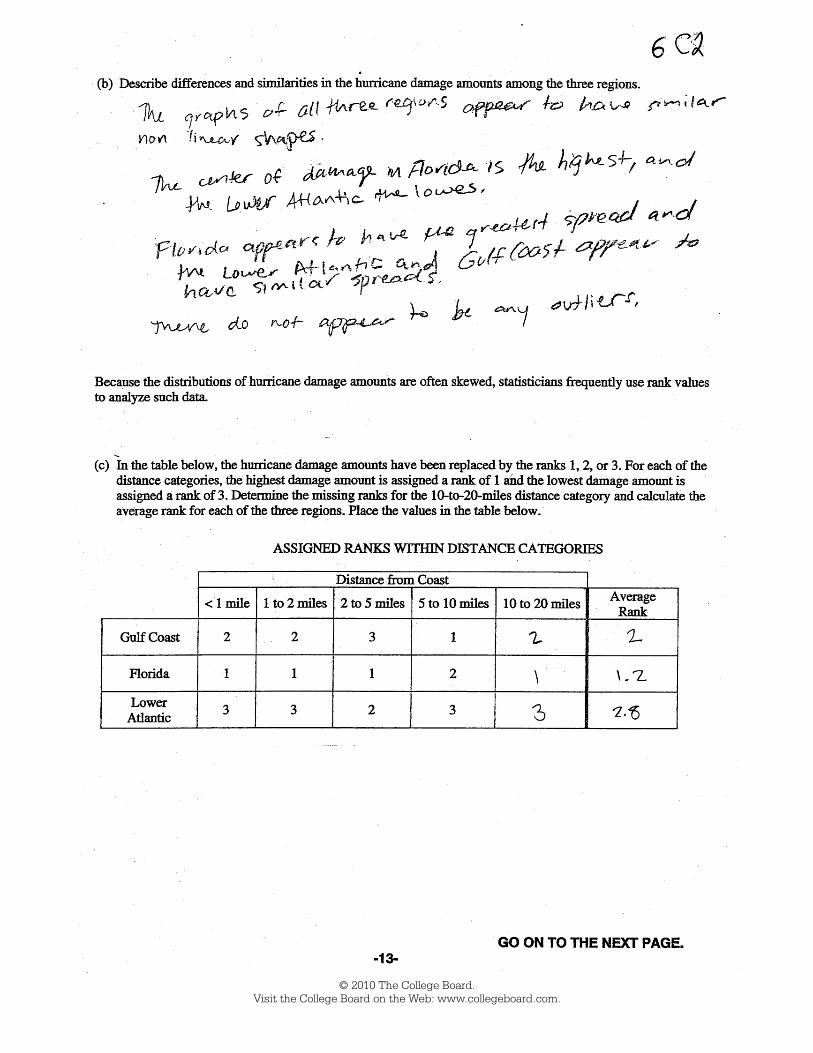
In all three regions (Gulf Coast, Florida, Lower Atlantic) the hurricane damage amounts tend to decrease as distance from the coast increases. For almost all given distances from the coast, the Florida region has the largest damage amounts. Also, for any given distance, the Gulf Coast and Lower Atlantic regions have similar damage amounts but with the Lower Atlantic damage amounts generally smaller.
Part (c):
For the “10 to 20 miles” distance category: The Florida region has the most damage (3.0 million dollars per acre) and so has rank 1. The region with the second-most damage is the Gulf Coast (1.7 million dollars), obtaining rank 2. The Lower Atlantic region has the least damage (0.3 million dollars) and so has rank 3. The last columns of the table should be filled in as follows:

AP® STATISTICS 2010 SCORING GUIDELINES
© 2010 The College Board. Visit the College Board on the Web: www.collegeboard.com.
Question 6 (continued)
10 to 20 miles Average Rank Gulf Coast 2 2.0 Florida 1 1.2 Lower Atlantic 3 2.8
The average ranks are computed 2 2 3 1 2 2.0
5+ + + + = for the five Gulf Coast damage ranks,
1 1 1 2 1 1.25
+ + + + = for the five Florida damage ranks and 3 3 2 3 3 2.8
5+ + + + = for the five Lower Atlantic
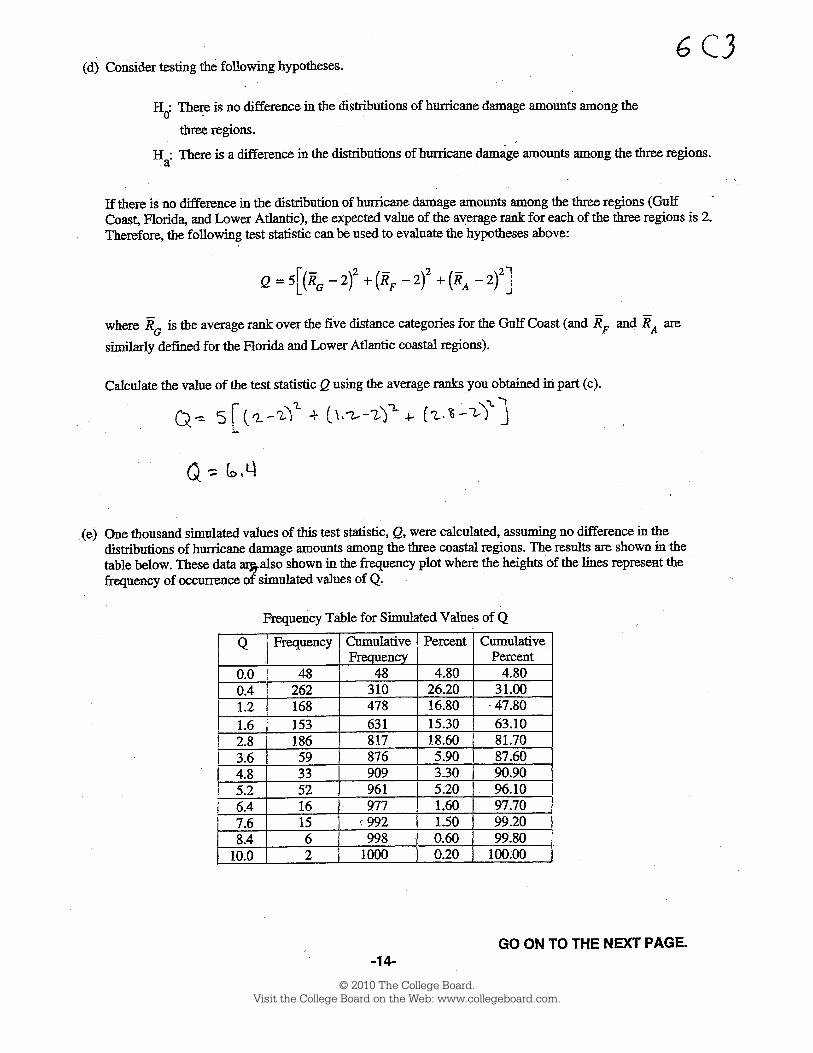
damage ranks. Part (d):
The calculated value of the test statistic Q is
( ) ( ) ( ) [ ]2 2 25 2.0 2 1.2 2 2.8 2 5 0 0.64 0.64 6.4.⎡ ⎤= − + − + − = + + =⎢ ⎥⎣ ⎦Q
Part (e):
A Q value of 6.4 or larger occurred in 39 0.039
1,000= (or 3.9 percent) of the 1,000 repetitions. All 1,000
repetitions of the simulation assumed there was no difference in the distribution of damage amounts among the three regions. This is a fairly small (approximate) p-value (less than 0.05), indicating that a test statistic as large or larger than the observed test statistic of 6.4=Q would be fairly unlikely to occur by chance alone if there really was no difference among the regions for each distance category. The sample data therefore provide reasonably strong evidence that there is a difference in the distributions of hurricane damage amounts among these three regions.
Scoring This question is scored in four sections. Section 1 consists of part (a); section 2 consists of part (b); section 3 consists of parts (c) and (d); section 4 consists of part (e). Each of the four sections is scored as essentially correct (E), partially correct (P) or incorrect (I). Section 1 is scored as follows:
Essentially correct (E) if the response includes a well-labeled, statistically valid graph that allows for comparing damage amounts both across regions AND at varying distances from the coast. Partially correct (P) if the response includes a well-labeled, statistically valid graph that allows for comparing damage amounts across regions or at varying distances from the coast but not both OR if it includes a statistically valid graph that allows for both comparisons but lacks labels for either the regions or the distances (or both). Incorrect (I) if the graph does not allow for either comparison OR if it is poorly labeled and allows for only one comparison.

AP® STATISTICS 2010 SCORING GUIDELINES
© 2010 The College Board. Visit the College Board on the Web: www.collegeboard.com.
Question 6 (continued)
Section 2 is scored as follows:
Essentially correct (E) if the response includes BOTH of the following: • Mention of a difference — a contrast among the three regions across distance categories (e.g.,
“Florida has greater damage than the other two regions at most distances”) • Mention of a similarity — a statement that in all regions hurricane damage decreases with
greater distance from the coast Partially correct (P) if the response includes a valid statement about only a difference or about only a similarity. Incorrect (I) if the response has neither a valid statement about the difference nor a valid statement about the similarity. Note: A statement that “Florida has more damage” is not sufficient to describe a difference if “at most distances” is not specified. Phrases that imply comparisons across distances such as “generally” or “for the most part” are acceptable for the “at most distances” specification.
Section 3 is scored as follows:
Essentially correct (E) if the response includes the correct ranks in part (c) AND the correct test statistic calculation in part (d). Partially correct (P) if the response includes either of the following:
• The correct ranks in part (c) but not the correct test statistic calculation in part (d) • Incorrect ranks in part (c) but the test statistic calculated correctly in part (d), using those
incorrect ranks Incorrect (I) otherwise.
Notes • Calculation of the average ranks need not be shown to receive credit for correctly calculating Q. • A miscalculation of Q results in no credit for part (d), but the severity of the miscalculation may be
considered later in holistic scoring. Section 4 is scored as follows:
Essentially correct (E) if the response includes BOTH of the following components:
• A valid quantification of the tail probability of the test statistic Q based on the simulated Q values
• A conclusion, in context, consistent with the rarity (or likelihood) of the calculated test statistic Q relative to the simulated Q values
Partially correct (P) if the response includes only one of these two components. Incorrect (I) if the response does not include either of these two components.

AP® STATISTICS 2010 SCORING GUIDELINES
© 2010 The College Board. Visit the College Board on the Web: www.collegeboard.com.
Question 6 (continued)
Each essentially correct (E) section counts as 1 point. Each partially correct (P) section counts as ½ point. 4 Complete Response 3 Substantial Response 2 Developing Response 1 Minimal Response
If a response is between two scores (for example, 2½ points), use a holistic approach to determine whether to score up or down, depending on the overall strength of the response and communication.

© 2010 The College Board. Visit the College Board on the Web: www.collegeboard.com.

© 2010 The College Board. Visit the College Board on the Web: www.collegeboard.com.

© 2010 The College Board. Visit the College Board on the Web: www.collegeboard.com.

© 2010 The College Board. Visit the College Board on the Web: www.collegeboard.com.
© 2010 The College Board. Visit the College Board on the Web: www.collegeboard.com.

© 2010 The College Board. Visit the College Board on the Web: www.collegeboard.com.

© 2010 The College Board. Visit the College Board on the Web: www.collegeboard.com.

© 2010 The College Board. Visit the College Board on the Web: www.collegeboard.com.
© 2010 The College Board. Visit the College Board on the Web: www.collegeboard.com.
© 2010 The College Board. Visit the College Board on the Web: www.collegeboard.com.
© 2010 The College Board. Visit the College Board on the Web: www.collegeboard.com.

© 2010 The College Board. Visit the College Board on the Web: www.collegeboard.com.
AP® STATISTICS 2010 SCORING COMMENTARY
© 2010 The College Board. Visit the College Board on the Web: www.collegeboard.com.
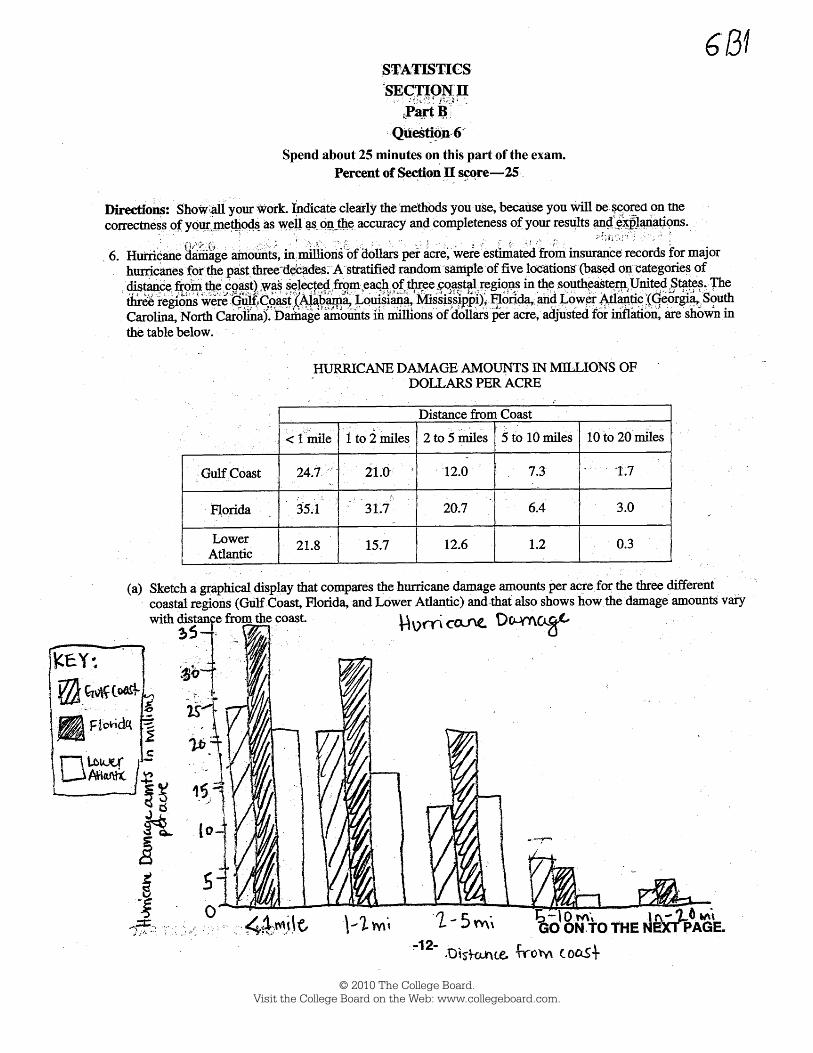
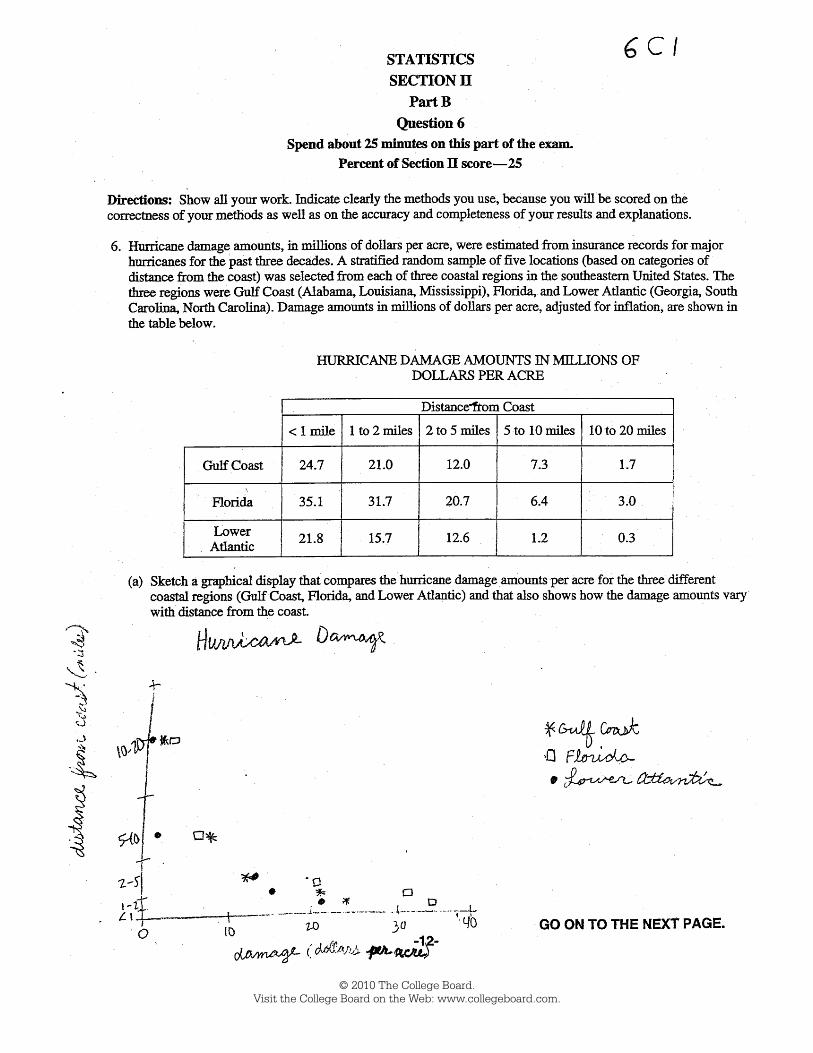
Question 6 Overview The primary goals of this investigative task were to assess students’ ability to (1) produce and comment on a graphical display; (2) calculate a test statistic based on rank data; (3) use simulation results to draw an appropriate conclusion. Sample: 6A Score: 4 In part (a) the student draws a well-labeled bar graph in which the bars are grouped by the distance categories, and a key is provided for ease in identifying the three regions. Section 1, consisting of part (a), was scored as essentially correct. In part (b) Florida’s having “the most hurricane damage in 4 of the 5 strata” is correctly identified as a significant difference. Although it was not necessary to describe the categorical distances as strata (as provided in the stem of the question), this is a nice detail. Also, the fact that damage decreases as the distance from the coast increases is correctly identified as a major similarity among the regions. Section 2, consisting of part (b), was scored as essentially correct. In parts (c) and (d) the ranks, average ranks and test statistic, Q, are correctly calculated, so section 3, consisting of parts (c) and (d), was scored as essentially correct. In part (e) a simulated p-value of 0.039 is correctly identified for the test statistic value of Q = 6.4 and is used to provide an appropriate conclusion in context. Section 4, consisting of part (e), was scored as essentially correct. With all four sections essentially correct, the response earned a score of 4. Sample: 6B Score: 3 In part (a) the student draws a well-labeled bar graph, grouping the bars by distance, and a key is provided for ease in identifying the three regions. Section 1, consisting of part (a), was scored as essentially correct. In part (b), although the term “right skewed” is troublesome because of the categorical nature of the distances, the major similarity among the regions is correctly identified by indicating that damages increase closer to each of the coasts. The differences among the three regions are not completely specified for all five distance categories, so section 2, consisting of part (b), was scored as partially correct. In parts (c) and (d) the ranks, average ranks and test statistic, Q, were correctly calculated, and section 3, consisting of parts (c) and (d), was scored as essentially correct. In part (e) no p-value for the test statistic is explicitly identified, but instead 0.016, the simulated probability of getting Q = 6.4, is used to provide a conclusion in context. Section 4, consisting of part (e), was scored as partially correct. With two sections essentially correct and two sections partially correct, the response earned a score of 3. Sample: 6C Score: 2 In part (a) the graph is a well-labeled plot of the categorical distances on the vertical axis and damage amounts on the horizontal axis, and a key is provided for ease in identifying the three regions. Section 1, consisting of part (a), was scored as essentially correct. In part (b), although the phrase “similar non linear shapes” is correct for the graphs, the response does not convey the nature of relationship (decreasing damages as distance from the coast increases), and none of the statements provides a complete response for differences among the regions for all distances. Section 2, consisting of part (b), was scored as incorrect. In parts (c) and (d) the ranks, average ranks and test statistic, Q, were correctly calculated. Section 3, consisting of parts (c) and (d), was scored as essentially correct. In part (e) the simulated Q values are described, but an

AP® STATISTICS 2010 SCORING COMMENTARY
© 2010 The College Board. Visit the College Board on the Web: www.collegeboard.com.
Question 6 (continued) approximate p-value is not identified, and the test statistic Q = 6.4 is determined to be “not that uncommon.” Hence, section 4, consisting of part (e), was scored as incorrect. With two sections essentially correct and two sections incorrect, the response earned a score of 2.