AP Research Academic Paper - College Board · AP Research Academic Paper ... research question, ......
25
2017 AP Research Academic Paper Sample Student Responses and Scoring Commentary © 2017 The College Board. College Board, Advanced Placement Program, AP, AP Central, and the acorn logo are registered trademarks of the College Board. Visit the College Board on the Web: www.collegeboard.org. AP Central is the official online home for the AP Program: apcentral.collegeboard.org Inside: R Sample E R Scoring Guideline R Student Samples R Scoring Commentary
Transcript of AP Research Academic Paper - College Board · AP Research Academic Paper ... research question, ......
2017
AP Research Academic PaperSample Student Responses and Scoring Commentary
© 2017 The College Board. College Board, Advanced Placement Program, AP, AP Central, and the acorn logo are registered trademarks of the College Board. Visit the College Board on the Web: www.collegeboard.org.
AP Central is the official online home for the AP Program: apcentral.collegeboard.org
Inside:
R Sample E
R Scoring Guideline
R Student Samples
R Scoring Commentary

AP® RESEARCH 2017 SCORING GUIDELINES Performance Task Rubric: Academic Paper
© 2017 The College Board. Visit the College Board on the Web: www.collegeboard.org.
Page 1 of 2
Content Area Performance Levels 1 Understand and Analyze Context
The paper identifies a broad topic of inquiry and/or a purpose.
2
The paper identifies a focused topic of inquiry and describes the purpose.
4
The paper explains the topic, purpose, and focus of the inquiry and why further investigation of the topic is needed by connecting it to the larger discipline, field, and/or scholarly community.
6 2 Understand and Analyze Argument
The paper identifies or cites previous scholarly works and/or summarizes a single perspective on the student’s topic of inquiry.
2
The paper summarizes, individually, previous scholarly works representing multiple perspectives about the student’s topic of inquiry.
4
The paper explains the relationships among multiple scholarly works representing multiple perspectives, describing the connection to the student’s topic of inquiry. 6
3 Evaluate Sources and Evidence
The paper uses sources/evidence that are unsubstantiated as relevant and/or credible for the purpose of the inquiry.
2
The paper uses credible and relevant sources/evidence suited to the purpose of the inquiry.
4
The paper explains the relevance and significance of the used sources/cited evidence by connecting them to the student’s topic of inquiry.
6 4 Research Design
The paper presents a summary of the approach, method, or process, but the summary is oversimplified.
3
The paper describes in detail a replicable approach, method, or process.
5
The paper provides a logical rationale for the research design by explaining the alignment between the chosen approach, method, or process and the research question/project goal. 7
5 Establish Argument
The paper presents an understanding, argument, or conclusion, but it is simplistic or inconsistent, and/or it provides unsupported or illogical links between the evidence and the claim(s).
3
The paper presents a new understanding, argument, or conclusion that the paper justifies by explaining the links between evidence and claims derived from the student’s research.
5
The paper presents a new understanding, argument, or conclusion that acknowledges and explains the limitations and implications in context.
7 6 Select and Use Evidence
Evidence is presented, but it is insufficient or sometimes inconsistent in supporting the paper’s conclusion or understanding.
2
The paper supports its conclusion by compiling relevant and sufficient evidence generated by the student’s research.
4
The paper demonstrates an effective argument through interpretation and synthesis of the evidence generated by the student’s research, while describing its relevance and significance.
6 7 Engage Audience
Organizational and design elements are present, but sometimes distract from communication or are superfluous.
1
Organizational and design elements convey the paper’s message.
2
Organizational and design elements engage the audience, effectively emphasize the paper’s message and demonstrate the credibility of the writer.
3 8 Apply Conventions
The paper cites and attributes the work of others, but does so inconsistently and/or incorrectly.
2
The paper consistently and accurately cites and attributes the work of others.
4
The paper effectively integrates the knowledge and ideas of others and consistently distinguishes between the student’s voice and that of others.
6 9 Apply Conventions
The paper’s use of grammar, style and mechanics convey the student’s ideas; however, errors interfere with communication.
1
The paper’s word choice and syntax adheres to established conventions of grammar, usage and mechanics. There may be some errors, but they do not interfere with the author’s meaning.
2
The paper’s word choice and syntax enhances communication through variety, emphasis, and precision.
3

AP® RESEARCH 2017 SCORING GUIDELINES Performance Task Rubric: Academic Paper
© 2017 The College Board. Visit the College Board on the Web: www.collegeboard.org.
Page 2 of 2
NOTE: To receive the highest performance level presumes that the student also achieved the preceding performance levels in that row.
ADDITIONAL SCORES: In addition to the scores represented on the rubric, readers can also assign scores of 0 (zero). - A score of 0 is assigned to a single row of the rubric when the paper displays a below-minimum level of quality as identified in that row of the rubric.
AP® RESEARCH
2017 SCORING COMMENTARY
Academic Paper
© 2017 The College Board.
Visit the College Board on the Web: www.collegeboard.org.
Overview
This performance task was intended to assess students’ ability to conduct scholarly and responsible research and articulate an evidence-based argument that clearly communicates the conclusion, solution, or answer to their stated research question. More specifically, this performance task was intended to assess students’ ability to:
• Generate a focused research question that is situated within or connected to a larger scholarly context or community;
• Explore relationships between and among multiple works representing multiple perspectives within the scholarly literature related to the topic of inquiry;
• Articulate what approach, method, or process they have chosen to use to address their research question, why they have chosen that approach to answering their question, and how they employed it;
• Develop and present their own argument, conclusion, or new understanding while acknowledging its limitations and discussing implications;
• Support their conclusion through the compilation, use, and synthesis of relevant and significant evidence generated by their research;
• Use organizational and design elements to effectively convey the paper’s message;
• Consistently and accurately cite, attribute, and integrate the knowledge and work of others, while distinguishing between the student’s voice and that of others;
• Generate a paper in which word choice and syntax enhance communication by adhering to established conventions of grammar, usage, and mechanics.

Adolescent Self Esteem and Optimism
through The Rosenberg Self Esteem Scale and Life Orientation Test
Word Count: 4027
Sample E 1 of 19
© 2017 The College Board. Visit the College Board on the Web: www.collegeboard.org.
XX
XX
AP Research (0)
31 March 2017
Adolescent Self Esteem and Optimism
Introduction
Socioeconomic status is an economic and sociological measure of an individual’s
economic and social position focusing on income, education and occupation (National Center for
Educational Statistics). The family’s socioeconomic status has a lasting impact on adolescent’s
physiological and psychological well being. Most researchers measured the correlation between
socioeconomic status and physiological health, however, this research paper will focus on the
correlation between socioeconomic status and psychological health. I focused on psychological
health in order to report on a new topic that has not been widely studied in the past. Also, in
order to share the the importance of adolescents in any living circumstances to receive the
opportunity to reach their highest potential and not be limited by any socioeconomic barriers.
Future researchers will also note the importance of perceived socioeconomic status and the
lasting impact of the perception on self esteem and optimism. The question I will be researching
is: “What different factors affect adolescent’s self esteem and optimism seen through the
Rosenberg Self Esteem Scale and Life Orientation Test?”
Literature Review
Researching socioeconomic status impacts on adolescents, the factor that I focused on
was nutrition. There lies a huge gap on the nutrition intake between low socioeconomic status
Sample E 2 of 19
© 2017 The College Board. Visit the College Board on the Web: www.collegeboard.org.
adolescents and high socioeconomic status adolescents. This can be simply because of the
neighborhood and community that the family’s income allows for. The academic papers I have
analyzed mostly focus on the physiological aspect of adolescent socioeconomic status impact on
nutrition and what that implies for their future. However, the gap in my research and the
published papers will be that I focus heavily on the emotional and mental well being of the
participants. Mental and emotional well being will be factors such as self-esteem and optimism.
Luckily, some studies narrowed its focus to self esteem, optimism, hostility, control and
discrimination. The research paper, Neighborhood, Family, and Subjective Socioeconomic
Status: How Do They Relate to Adolescent Health?, was written by Edith Chen and Laurel Q.
Paterson. Chen, the co-director of the Foundation of Health Research Center and Director of
Graduate Studies at Northwestern University (Northwestern), explores the psychological
relationship between the reasoning behind socioeconomic and poor health mentally and
physically.
They have studied and surveyed from as little as 100 to as much as 300 students from St.
Louis, MO an area with a wide range of socioeconomic status. There were three sample groups
all differing in demographics. The first sample consisted of 100 students ranging from the age 15
to 19 year olds, 64% were females, 53% were Caucasian and 47% were African American. The
second sample consisted of 115 students ranging from the ages 16 to 19 year olds, 61% were
females, 42% were Caucasian, 57% were African American, and 1% were Native American. The
last sample, the third sample consisted of 100 students ranging from 14 to 18 year olds, 53%
were female, 75% were Caucasian, 21% were African American, and 4% were Asian. However,
a limitation in her study was that the participants were gathered through school flyers and
Sample E 3 of 19
© 2017 The College Board. Visit the College Board on the Web: www.collegeboard.org.
announcements, the interested participants contacted the lab. If only interested participants had to
personally get involved then the study would be excluding a huge pool of students. In addition,
as shown in the student demographic majority of the participants were female, who
stereotypically are more vulnerable and sensitive to self-esteem levels. Also, majority of the
students are Caucasian and/or African American, Asians and Native Americans are barely
represented and Hispanics are not represented at all. In relation to socioeconomic status the
median family income of the student sample had a range of $50,000 to $74,999, 61% of parents
had a college degree and 87% of the families owned homes.
The methods used to measure the adolescent’s self esteem and optimism were surveys,
Rosenberg’s Self- Esteem Scale and Life Orientation Test- Revised. The Rosenberg’s Self
Esteem Scale consists of 10 statements which you rate to be true to you on a 4 point scale. The
higher scores indicated greater self esteem. The data from the study was gathered by student
sample 3 (Rosenberg). The Life Orientation Test- Revised which measured student sample 2 and
3’s optimism level. The test was composed of 10 statements that had expectancies of positive
and negative outcomes, the surveyor would rate on their agreement with the statement on a 5
point scale. The higher scores indicated greater optimism (Scheier).
The results from the Rosenberg’s Self Esteem Test and Life Orientation Tests shows that
adolescent’s self esteem and optimism is more affected by a subjective perception of family
status then the logistical family status. Oddly the correlation for family income and optimism
was .09 but the subjective family status had a correlation of .33. Similarly, the results from the
Rosenberg’s Self Esteem test showed weak negative correlation of -.03, but subjective family
Sample E 4 of 19
© 2017 The College Board. Visit the College Board on the Web: www.collegeboard.org.

status showed positive correlation of .22 (Chen, Paterson). The study refuted the expectations of
high correlations between logistical socioeconomic status and optimism/self esteem levels.
Aside from psychological well being, I also studied how socioeconomic status affects
physiological well being as well. A study that focused on the correlation between family income
and health issues such as chronic diseases, Economic status and health in childhood: the origins
of the gradient, was written by Anne Case, Darren Lubotsky, and Christina Paxson. Case, the
Director in Research Program in Developmental Studies at Princeton University, introduces the
research paper with a bold claim that wealthy people live longer and have less health people than
poor people. There was an underlying assumption that income only affects health in the lower
socioeconomic status, however, that is not the case-- it affects both ends of the spectrum (Adler).
In order to gather their research Case, Lubotsky and Paxson closely analyzed all components and
details in the National Health Interview Surveys, the Panel Study of Income Dynamics, and the
National Health and Nutrition Examination Survey. The studies consisted of children between
the ages 0-17.
As Case assumed the strong relationship between family income and children’s health
status for children of all ages and social class is prevalent. Children from lower socioeconomic
status have poorer health than children of high socioeconomic status. The bigger problem is that
the relationship does not only exist for adolescents, but as adolescents grow older their health
deteriorates even more and they enter adulthood in poor health and low socioeconomic status.
The studies show the steeping of the gradients exists till the age of 65. The data from NHIS finds
that family income plays a huge role in adolescents, especially as the child becomes older the
correlation becomes stronger. A figure showing the relationship between health and income
Sample E 5 of 19
© 2017 The College Board. Visit the College Board on the Web: www.collegeboard.org.
shows the gradient of health rating, 1 being excellent health to 5 being poor health, that lower
income adolescents from ages to 0-17 reach levels above 2-2.5 while high income adolescents do
not even precede 1.5. In addition, as the age grows the gap becomes larger and health
deterioration becomes worse as they begin to proceed levels of 3.5. This physiological impact is
due to the fact that wealthier parents are able to afford medicare, nutritious food and provide a
safer environment for their children and it impact of these privileges becomes more powerful
with time (Case).
The information gathered from this research paper still has methods and findings that are
still present, and prevalent. Also, the consensus from the surveys are being updated annually.
In relation to Case, Healthy, Wealthy, and Wise: Socioeconomic Status, Poor Health in
Childhood, and Human Capital Development, was written by Janet Currie who is a peer of Case.
Currie is a Professor of Economic and Public Affairs and the Director of the Center for Health
and Wellbeing at Princeton University. Interestingly, Currie refers to Case who is also a director
at Princeton University multiple times in her paper stating her assumptions and findings. Currie
studies the relationship between parent’s income, education level and child health in great depth.
Currie was troubled by the fact that children who come from wealthier families have able to
receive better education ultimately leading to higher wages, and the cycle repeats.
Currie presents many mathematical models, each variable representing an aspect of a
children’s life such as the discount rate, child care, leisure, income and so forth. She inputs the
model in many different ways and explains why socioeconomic status impacts child health.
Some inputs include better quality medical care and food, as well as safer toys, housing, and
neighborhoods. Currie also focuses on the implication that education heavily influences
Sample E 6 of 19
© 2017 The College Board. Visit the College Board on the Web: www.collegeboard.org.
socioeconomic status and decision about health behaviors (Cutler and Lleras-Muney). One
limitation from the factors is the data collected regarding health issues. Since there is no set
standard of reporting illness, parents of different backgrounds perceive and report illness, or do
not report certain illnesses. Currie concludes her study by attempting to sum up, aimed at
determining whether we have enough information to say whether poor health is likely to be a
major cause of intergenerational persistence in economic status. She shows that there is strong
evidence of links between parental socioeconomic status and child health and between child
health and future outcomes, but that it is difficult to say on the basis of the existing evidence how
large the overall effect of health might be or whether it explains a significant amount of
intergenerational transmission.
In addition, an extremely unique and narrow study, Low Childhood Socioeconomic Status
Promotes Eating in the Absence of Energy Need , is written by Sarah E. Hill, Marjorie L.
Prokosch, Danielle J. DelPriore, Vladas Griskevicius, and Andrew Kramer. However, the author
I will be focusing on is Marjorie L. Prokosch who was a student at Texas Christian University
that focused on experimental, evolutionary and social psychology. She also received a Master's
degree in experimental psychology. The research team conducted three studies to observe the
relationship between energy need and opportunity to eat. In studies one, they measured
participants’ energy need and gave them the opportunity to eat provided snacks. In studies two
and three, they manipulated the variables. The assumptions before their experiment was
conducted was that adolescents in high socioeconomic status would regulate their food intake
based on their immediate physiological need, consuming more calories when the need was high.
On the other hand, they assumed that physiological need would be irrelevant to adolescents in
Sample E 7 of 19
© 2017 The College Board. Visit the College Board on the Web: www.collegeboard.org.
low socioeconomic status, predicting that their calorie intake would be high when their energy is
high as well.
Study One consisted of 31 female students at North American University ranging from
the age 18-22, the students participated in this study in order to receive partial course credit. The
limitations within study one is that the sample is all female and that fact that the students can
receive credit shows it is not diverse nor random. The students were first assigned to complete a
survey focusing on how many hours since they have last eaten and how hungry they felt. The
students were then presented with cookies and pretzels and had to evaluate the food answering
how much they liked the food on a seven point scale. Then they were presented to rate their
agreement on socioeconomic status questions on a seven point scale as well.
Study Two consisted of 60 female students at a North American University ranging from
the ages 18-24. Study Two manipulated participants’ energy need by abstaining from eating or
drinking for at least 5 hours prior to the study then they were randomly assigned to drink either a
beverage containing high calories or a beverage devoid of calories. Once again a limitation of
this study would be its lack of male sample. However, study three which was meant to replicate
and extend Study Two did include men in their sample to test whether the results will remain or
differ. For Study Three they used 83 students ranging from the age 18-27, 21 men and 62
women. The women still remain majority of the sample.
The results from the three studies concluded that low socioeconomic status was a
predictor of future obesity. Individuals who grew up in high socioeconomic environments, food
intake varied according to immediate physiological energy need. These individuals consumed
more calories when their current energy need was high than when it was low. For individuals
Sample E 8 of 19
© 2017 The College Board. Visit the College Board on the Web: www.collegeboard.org.

who grew up in low socioeconomic environments, however, the relationship between
physiological need and food intake was decoupled. Their food intake appeared to be guided
primarily by opportunity.
Overall, the research papers I will be using to its fullest potential were all written by
well-knowledge and driven individuals. Although there were a couple limitations especially
regarding demographics, they all provided a wonderful example and guideline of the procedures
that must be met in order to be successful. They all had a specific focus and purpose of their
study mostly to raise awareness of the correlation between socioeconomic status, nutrition and
physiological and psychological well being.
Methods
Purpose
The intended use of the study was to align with Neighborhood, Family, and Subjective
Socioeconomic Status: How Do They Relate to Adolescent Health? prepared by Edith Chen and
Laurel Q. Paterson.
Participants
The study was conducted on the campus of
. is a large public high
school in a typical suburban setting. The student body makeup is roughly 50 percent male and 50
percent female, and the total minority enrollment is 72 percent. The AP participation rate at this
suburban high school is 52 percent. Another 52 percent of the school is economically
disadvantaged. The student demographics consist of 39% Hispanic, 28% Asian, 26% White, 4%
Sample E 9 of 19
© 2017 The College Board. Visit the College Board on the Web: www.collegeboard.org.
African American, <1% American Indian or Alaska Native, <1% Pacific Islander, <1% declined
to state (2015-2016).
For our stratified random sample, we counted how many students arrive at each of our
gate locations between 7:00 am and 8:20 am. Our percentages are as follows: 3.0% J gate, 23.0%
Zelzah Parking Lot, 6.0% Hiawatha, 4.0% Service Road East, 12% Service Road West, 28.5%
Main Gate, and 23.5% Kingsbury.
Measures
The sample consisted of 100 students randomly selected from each of these gates every
morning from the time span, 7:00-8:20 am PST, from the dates, January 20, 2016- January 31,
2016. The demographics of the students ranged from the ages 14-19 modeled from Chen’s study.
The participants were gathered, myself, by randomly selecting students walking in from the
seven different gates. After receiving their student identification number, I was able to email the
survey to the participants through chromebooks which were distributed to every student
attending the suburban high school. Through the use of chromebooks the participants were able
to take the survey on google forms and the information provided from the participants were
completely anonymous. The survey was divided into three sections; first being demographics,
second being the Rosenberg Self Esteem Scale and third being the Life Orientation Test.
In the demographics section, the study required the annual income, the neighborhood
they live in, their parents highest education level and information of any health issues, if any.
The neighborhood the participants live or grew up in poses as a huge influence in their
physiological and psychological health. The living region affects physiological health for the
community establishes the resources available in their living standards such as health care and it
Sample E 10 of 19
© 2017 The College Board. Visit the College Board on the Web: www.collegeboard.org.

predetermines the air quality, and pollution levels the participants live in (Evans, 2004;
MacIntyre, Maciver, & Sooman, 1993). Psychologically, the neighborhood determines the social
capital, which is defined as the level of trust and norms of cooperation and behavior (Jencks &
Mayer, 1990; Kawachi, Kennedy, & Glass, 1999; Kawachi, Kennedy, Lochner, &
Prothrow-Stith, 1997).
For the question regarding their family income, the participants were also given the
choice of “Prefer not to answer” and “Not sure”. After answering questions of their
demographics, the participants engaged in the Rosenberg’s Self Esteem Scale which is a global
measure of both positive and negative feelings about oneself (Rosenberg). Then, the participants
were presented with the Life Orientation Test which is a measure of optimism versus pessimism
(Scheier).
Both the Rosenberg’s Self Esteem Scale and Life Orientation Test is a 10 question test
based on a 4 point Likert Scale. The tests were both exercised by Chen in her study of the
correlation between Socioeconomic Status and Physiological Health. The Rosenberg Self Esteem
scale posed interesting, contradicting statements such as “I am able to do things as well as most
other people.” then the follow question stating “I feel I do not have much to be proud
of”(Rosenberg). Likewise, The Life Orientation Test followed similar methods of inputting
counter statements: “It’s easy for me to relax” followed by “If something can go wrong for me, it
will” (Scheier). Both surveys consisted of equal numbers of positive and negative statements,
and as for the scoring, the negative statements were reverse scored.
Findings
Demographics
Sample E 11 of 19
© 2017 The College Board. Visit the College Board on the Web: www.collegeboard.org.

From the suburban high school, 100 students have complied and completed the survey
over the two week period. The age of the students ranged from 14-19 years old, 56% were male
and 44% were female. The neighborhood from which the participants reside from very dispersed
all over Los Angeles--
. Most participants are living in . Another important
aspect of an individual’s socioeconomic status is highest level of education retained by their
parents or guardian. My study focused on participants whose parents’ highest education level did
not exceed high school education in order to align with Chen’s study. From my study 65% of
parents attained a college degree compared to Chen’s study 61% of parents received a college
degree (Chen).
Another vital information from the participants was their family annual income which
ranged from thirty thousand dollars or lower to over one hundred thousand dollars. The
participants were also given the option of “Not Sure” (16% of participants) and “Prefer not to
answer” (11% of participants). In Chen’s study, Chen observed tremendous differences varying
on the subjective perception of the individual socioeconomic status. Higher subjective perception
of family status was associated with higher levels of adolescent optimism, higher self-esteem,
and higher perceived control (Chen).
Psychological Results
The scores from the Rosenberg Self Esteem Scale and Life Orientation Test were
calculated by retaining the sum of the scores 1-5 (Likert Scale), minding the questions that need
to be scored reversely.
Sample E 12 of 19
© 2017 The College Board. Visit the College Board on the Web: www.collegeboard.org.
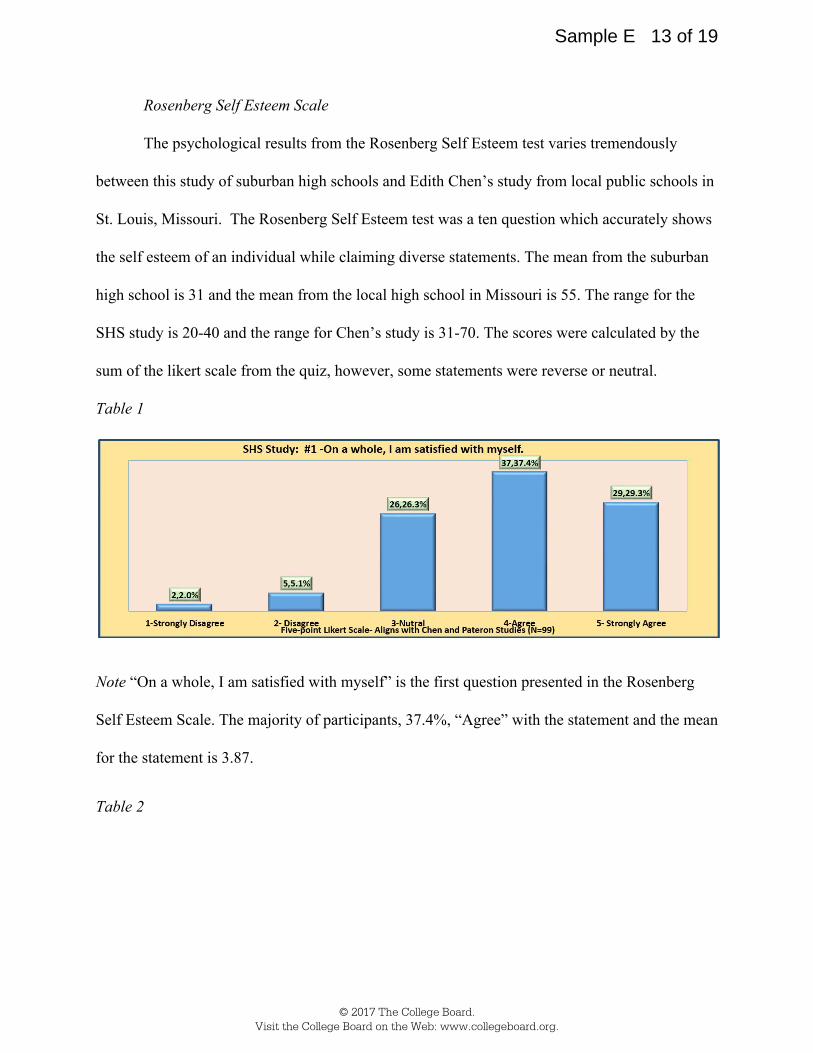
Rosenberg Self Esteem Scale
The psychological results from the Rosenberg Self Esteem test varies tremendously
between this study of suburban high schools and Edith Chen’s study from local public schools in
St. Louis, Missouri. The Rosenberg Self Esteem test was a ten question which accurately shows
the self esteem of an individual while claiming diverse statements. The mean from the suburban
high school is 31 and the mean from the local high school in Missouri is 55. The range for the
SHS study is 20-40 and the range for Chen’s study is 31-70. The scores were calculated by the
sum of the likert scale from the quiz, however, some statements were reverse or neutral.
Table 1
Note “On a whole, I am satisfied with myself” is the first question presented in the Rosenberg
Self Esteem Scale. The majority of participants, 37.4%, “Agree” with the statement and the mean
for the statement is 3.87.
Table 2
Sample E 13 of 19
© 2017 The College Board. Visit the College Board on the Web: www.collegeboard.org.

Note “On a whole, I am satisfied with myself” “I feel that I have a number of good qualities” are
examples of confidence questions. As seen in Table 1 the majority is Agree and Table 2 showing
the majority to be “Strongly Agree”(38.4%). The statement in Table 2 received the mean of 4.00.
The Rosenberg test projects illustrates negatively, or lack of self esteem as well.
Table 3
Table 4
Sample E 14 of 19
© 2017 The College Board. Visit the College Board on the Web: www.collegeboard.org.

Note Table 3 and Table 4 show the findings from a couple of the reverse, “negative” statements
represented in the Rosenberg Self Esteem Scale. The reverse questions are calculated in reverse
order such as receiving the score “1” if “strongly agreed”. Table 3 shows that 17.2% of
participants either “Agree” or “Strongly Agree” with the statement “At times I think I am no
good at all.”. The mean for the statement in Table 3 is 2.39. Table 4 shows that only 14.1% of
participants either “Agree” or “Strongly Agree” with the statement “I feel I do not have much to
be proud of” with only 3.0% of participants who “Strongly Agreed”. The mean for the statement
in Table 4 is 2.25.
Life Orientation Test
The Life Orientation Test is a measure of optimism versus pessimism, there are three
statements based on optimism, three statements based on pessimism and four statements that
pose as fillers (Scheier). Higher scores measured higher levels of optimism (Chen).
Socioeconomic status is a vital influence to optimism and pessimism levels for socioeconomic
status can determine the trails that are faced, an individual's beliefs, and can limit growth. During
Chen’s study, she observed that higher levels of perceived socioeconomic status lead to higher
levels of optimism and self esteem (Chen). The mean from the suburban high school is 34.55
Sample E 15 of 19
© 2017 The College Board. Visit the College Board on the Web: www.collegeboard.org.

and the mean from the local high school in Missouri is 15.2. The range for the SHS study is 5-40
and the range for Chen’s study is 2-24.
Table 5
Note Table 4 is an illustration of one of the pessimistic statements in the Life Orientation Test-
“If something can go wrong for me, it will.”. The mostly voted agreement for the statement is
“Neutral”, 37.4%. Then shockingly the next agreement is “Strongly Agree”, 19.2%,
voluminating that almost 20% of the participants highly almost deem certain their life will not
flow as wanted, ever.
Conclusion
Throughout the intense research process, the biggest internal motivation was the anxious
excitement I would receive analyzing the responses and findings; the eagerness to find a
correlation. However, the SHS study was a lot more than a fuzzy feeling, the research paper
helped to shine a new light on a topic not widely touched upon. The research process allowed the
correlation between socioeconomic status, and physiological or psychological to been spoken
Sample E 16 of 19
© 2017 The College Board. Visit the College Board on the Web: www.collegeboard.org.

about. The gap between the SHS study and most researchers is the fact that most researchers
study to correlation of socioeconomic status and physiological health most commonly diabetes,
asthma. However, the SHS study focuses on the correlation between socioeconomic status and
psychological health. Through this opportunity, the paper speaks for the importance of allowing
all adolescents from every living circumstance to the awareness that they are capable of
achieving bigger and better to their fullest potential. Although I briefly discussed the influence of
perceived socioeconomic status having a profound impact on the adolescent’s self esteem and
optimism, I hope future researchers will study the importance of perceived socioeconomic status
and the objective socioeconomic status. Higher perceived socioeconomic status concludes higher
self esteem and optimism levels. If their perception is a huge influence in their mentality for
success then that expectation illustrates the adolescent’s knowledge on influence of money,
family status, and parent’s education level on our psychological needs.
Works Cited
Adler, Nancy E., Thomas Boyce, Margaret A. Chesney, Sheldon Cohen, Susan Folkman, Robert
L. Kahn, and S.Leonard Syme, 1994. “Socioeconomic Status and Health, The Challenge
of the Gradient,” American Psychologist, 15-24.
Brooks-Gunn, J., Duncan, G., Klebanov, P. K., & Sealand, N. (1993). Do neighborhoods
influence child and adolescent development? American Journal of Sociology, 99,
353–395.
Case, Anne. Economic status and health in childhood: the origins of the gradient (2002)
Chen, E. (2004). Why socioeconomic status affects the health of children: A psychosocial
Sample E 17 of 19
© 2017 The College Board. Visit the College Board on the Web: www.collegeboard.org.
Perspective. Current Directions in Psychological Science, 13, 112–115.
Chen, Edith. Neighborhood, Family, and Subjective Socioeconomic Status: How Do They Relate
to Adolescent Health? (2006)
Cohen, S., Kaplan, G. A., & Salonen, J. T. (1999). The role of psychological characteristics in
the relation between socioeconomic status and perceived health. Journal of Applied
Social Psychology, 29, 445– 468.
Cutler, David and Adriana Lleras-Muney. “Education and Health: Evaluating Theories
and Evidence,” NBER Working Paper # 12352, June 2006.
Currie, Janet. Healthy, Wealthy, and Wise: Socioeconomic Status, Poor Health in Childhood,
and
Human Capital Development
Evans, G. W., Gonnella, C., Marcynyszyn, L. A., Gentile, L., & Salpekar, N. (2005). The role of
chaos
in poverty and children’s socioemotional adjustment. Psychological Science, 16,
560–565.
Fox, A.J., P.O. Goldblatt & D.R. Jones. 1985. Social class mortality differentials: artefact,
selection, or life circumstance. J. Epidemiol. Commun. Health 39: 1–8.
Kaufman, J.S., R.S. Cooper & D.L. Mcgee. 1997. Socioeconomic status and health in blacks
and whites: the problem of residual confounding and the resiliency of race. Epidemiology
8:
621–628.
Krieger, N., Williams, D. R., & Moss, N. E. (1997). Measuring social class in U.S. public health
Sample E 18 of 19
© 2017 The College Board. Visit the College Board on the Web: www.collegeboard.org.

research: Concepts, methodologies, and guidelines. Annual Review of Public Health, 18,
341–378.
Leventhal, T., & Brooks-Gunn, J. (2000). The neighborhoods they live in: The effects of
neighborhood residence on child and adolescent outcomes. Psychological Bulletin, 126,
309 –337.
National Center for Educational Statistics. 31 March 2008.
Prokosch, Marjorie L. Low Childhood Socioeconomic Status Promotes Eating in the Absence of
Energy Need (2016)
Rosenberg, M. (1965). Society and the adolescent self-image. Princeton, NJ: Princeton
University Press.
Seeman, T., & McEwen, B. S. (1996). Impact of social environment characteristics on
neuroendocrine
regulation. Psychosomatic Medicine, 58, 459 – 471.
Scheier, M. F., Carver, C. S., & Bridges, M. W. (1994). Distinguishing optimism from
neuroticism (and trait anxiety, self-mastery, and self-esteem): A re-evaluation of the Life
Orientation Test. Journal of Personality and Social Psychology, 67, 1063-1078.
Wells, N. M., Evans, G. W., Beavis, A., & Ong, A. D. (2010). Early childhood poverty,
cumulative
risk exposure, and body mass index trajectories through young adulthood. American
Journal of
Public Health, 100, 2507–2512. doi:10.2105/Ajph.2009.184291
Sample E 19 of 19
© 2017 The College Board. Visit the College Board on the Web: www.collegeboard.org.

AP® RESEARCH
2017 SCORING COMMENTARY
Academic Paper
© 2017 The College Board.
Visit the College Board on the Web: www.collegeboard.org.
Sample: E 1 Understand and Analyze Context Score: 6 2 Understand and Analyze Argument Score: 4 3 Evaluate Sources and Evidence Score: 6 4 Research Design Score: 5 5 Establish Argument Score: 3 6 Select and Use Evidence Score: 2 7 Engage Audience Score: 1 8 Apply Conventions Score: 2 9 Apply Conventions Score: 1 MEDIUM SAMPLE RESPONSE
Adolescent Self Esteem and Optimism through The Rosenberg Self Esteem Scale and Life Orientation Test
Content Area: Understand and Analyze Context — Row 1 The response earned 6 points for this row because the paper presents a focused topic of inquiry and purpose on page 1, paragraph 1: "The question I will be researching is: ‘What different factors affect adolescent's self esteem and optimism seen through the Rosenberg Self Esteem Scale and Life Orientation Test?'". Immediately below this, the paper presents a potential gap on the top of page 2: "However, the gap in my research and the published papers will be that I focus heavily on the emotional and mental well being of the participants". Content Area: Understand and Analyze Argument — Row 2 The response earned 4 points for this row because the paper provides evidence of multiple factors affecting self-esteem, including gender, socioeconomic status, food availability, physiological and psychological factors. The response did not earn 2 points because the paper does present a survey of perspectives on the topic. The response did not earn 6 points because the student presents a possible conversation between the sources Currie and Case on page 6, but does not engage the two sources with each other: "Interestingly, Currie refers to Case who is also a director at Princeton University multiple times in her paper stating her assumptions and findings". Content Area: Evaluate Sources and Evidence — Row 3 The response earned 6 points for this row because the paper makes an effort to qualify the studies used, such as shown on the bottom of page 3, where limitations are presented: "However, a limitation in her study was that the participants were gathered through school flyers and announcements" and on page 9, paragraph 2: "Overall, the research papers I will be using to its fullest potential were all written by well-knowledge and driven individuals. Although there were a couple limitations especially regarding demographics, they all provided a wonderful example and guideline of the procedures that must be met in order to be successful".

AP® RESEARCH
2017 SCORING COMMENTARY
Academic Paper
© 2017 The College Board.
Visit the College Board on the Web: www.collegeboard.org.
Content Area: Research Design — Row 4 The response earned 5 points for this row because the paper clearly outlines its method on pages 9 to 11, particularly with respect to repeating Chen's study in a new context, making it replicable. The response did not earn 3 points because the paper's description of method is clear and detailed. The response did not earn 7 points because the rationale is not clearly provided as to why Chen's method is the correct one; instead, this must be inferred by the reader. Content Area: Establish Argument — Row 5 The response earned 3 points for this row because the paper provides an argument leading to a stated conclusion (bottom of page 17: "Higher perceived socioeconomic status concludes higher self esteem and optimism levels"). The response did not earn 5 points because this is not a new understanding and reports the same findings as the Chen study without describing any contextual differences. Content Area: Select and Use Evidence — Row 6 The response earned 2 points for this row because the paper does provide minimal evidence (e.g. Tables on pages 13 to 16). The response did not earn 4 points because there is no interpretation of the data/evidence by the student related to the topic of inquiry: readers are left to infer the meaning of the tables. Content Area: Engage Audience — Row 7 The response earned 1 point for this row because the paper contains the "Required Elements" of the performance task. The response did not earn 2 points because the complexity of the material demanded a sophisticated organization of the paper and the inclusion of helpful graphics; here, rather, Tables present in the paper may lead to confusion for the reader. Content Area: Apply Conventions — Row 8 The response earned 2 points for this row because the paper does include citations. The response did not earn 4 points because, within the citations, there is a consistent pattern of stylistic errors - that is, some citations include dates, while others do not. Content Area: Apply Conventions — Row 9 The response earned 1 point for this row because the paper largely communicates the student's ideas. The response did not earn 2 points because the writing features numerous grammatical errors and incorrect uses of language which repeatedly distract the reader's focus and attention.