
AP® InvestIgAtIon #4 - · PDF fileWard’s to adapt to the specifications outlined in...
30
AP® INVESTIGATION #4 DIFFUSION & OSMOSIS – TEACHER’S GUIDE ©2012, Ward’s Natural Science All Rights Reserved, Printed in the U.S.A. US: www.wardsci.com Canada: www.wardsci.ca Call “Us” at 1.800.962.2660 for Technical Assistance 250-7454 v.1/12 Kit # 3674-04 ABSTRACT 1 GENERAL OVERVIEW 1 RECORDING DATA 2 MATERIAL REQUIREMENTS/CHECKLIST 4 NATIONAL SCIENCE EDUCATION CONTENT STANDARDS 5 CORRELATION TO AP CONTENT STANDARDS 5 TIME REQUIREMENTS 5 LEARNING OBJECTIVES 6 SAFETY PRECAUTIONS 7 PRE-LAB PREPARATIONS 8 NOTES TO THE INSTRUCTOR 10 BEFORE CLASS 10 BACKGROUND 11 PART 1: CELL SIZE & DIFFUSION 13 PART 2: MODELING OSMOSIS IN LIVING CELLS 17 PART 3: OSMOSIS IN LIVING PLANT CELLS 21 ADDITIONAL QUESTIONS (OPTIONAL) 24 FURTHER INQUIRY INVESTIGATIONS 23 TEACHER’S ANSWER KEY 24 VOCABULARY GUIDE 26 MSD SHEETS LIVE MATERIAL CARE SHEETS Table of Contents **AP ® and the Advanced Placement Program are registered trademarks of the College Entrance Examination Board. The activity and materials in this kit were developed and prepared by WARD’S Natural Science Establishment, which bears sole responsibility for their contents.. WILL FIX ALL PAGE #’S ONCE EVERYTHING ELSE IS FINALIZED.
Transcript of AP® InvestIgAtIon #4 - · PDF fileWard’s to adapt to the specifications outlined in...
AP® InvestIgAtIon #4 Diffusion & osmosis – Teacher’s GuiDe
©2012, Ward’s Natural Science
All Rights Reserved, Printed in the U.S.A.
US: www.wardsci.com
Canada: www.wardsci.ca
Call “Us” at 1.800.962.2660 for Technical Assistance
250-7454 v.1/12
Kit # 3674-04
absTracT 1
General overview 1
recorDinG DaTa 2
maTerial requiremenTs/checklisT 4
naTional science eDucaTion conTenT sTanDarDs 5
correlaTion To aP conTenT sTanDarDs 5
Time requiremenTs 5
learninG objecTives 6
safeTy PrecauTions 7
Pre-lab PreParaTions 8
noTes To The insTrucTor 10
before class 10
backGrounD 11
ParT 1: cell size & Diffusion 13
ParT 2: moDelinG osmosis in livinG cells 17
ParT 3: osmosis in livinG PlanT cells 21
aDDiTional quesTions (oPTional) 24
furTher inquiry invesTiGaTions 23
Teacher’s answer key 24
vocabulary GuiDe 26
msD sheeTs
live maTerial care sheeTs
table of Contents
**AP® and the Advanced Placement Program are registered trademarks of the College Entrance Examination Board. The activity and materials in this kit were developed and prepared by WARD’S Natural Science Establishment, which bears sole responsibility for their contents..
WILL FIX ALL PAGE #’S ONCE EVERYTHING ELSE IS FINALIZED.

©2012, Ward’s Natural Science
All Rights Reserved, Printed in the U.S.A.
US: www.wardsci.com
Canada: www.wardsci.ca
250-7454 v.1/12
Page 1
Diffusion & osmosis: Teacher’s GuiDe Kit # 3674-04
AbstrACtThis lab addresses the properties of osmosis and diffusion and their function in maintaining homeostasis in the cell. Students use two phospholipid bilayer models to simulate the movement of water and nutrients across a cell membrane and observe osmosis in living tissue. In Part 1, students calculate the surface area-to-volume ratios of differently-sized cuboidal cell models. In Part 2, the movement of molecules across a membrane is simulated using dialysis tubing and solutions of varying composition. In Part 3, students directly observe osmosis in a living specimen. In all parts of this lab, after performing a guided activity, students are then directed to design their own experiments, to further develop their understanding of the topics explored. The students’ understanding of these exercises will allow them to explain how cell size and shape affect rates of diffusion, as well as pose scientific questions about the selective permeability properties of cell membranes.
©2012, Ward’s Natural Science
All Rights Reserved, Printed in the U.S.A.
US: www.wardsci.com
Canada: www.wardsci.ca
250-7454 v.1/12
Page 2
Diffusion & osmosis: Teacher’s GuiDe Kit # 3674-04
generAl overvIewThe College Board has revised the AP Biology curriculum to begin implementation in the fall of 2012. Advanced Placement (AP) is a registered trademark of the College Entrance Examination Board. The revisions were designed to reduce the range of topics covered, to allow more depth of study and increased conceptual understanding for students. There is a shift in laboratory emphasis from instructor-designed demonstrations to student-designed investigations. While students may be introduced to concepts and methods as before, it is expected that they will develop more independent inquiry skills. Lab investigations now incorporate more student-questioning and experimental design. To accomplish this, the College Board has decreased the minimum number of required labs from 12 to 8 while keeping the same time requirement (25% of instruction time devoted to laboratory study). The College Board has defined seven science practices that students must learn to apply over the course of laboratory study. In brief, students must:
1. Use models
2. Use mathematics (quantitative skills)
3. Formulate questions
4. Plan and execute data collection strategies
5. Analyze and evaluate data
6. Explain results
7. Generalize data across domains
The College Board published 13 recommended laboratories in the spring of 2011. They can be found at: http://advancesinap.collegeboard.org/science/biology/lab
Many of these laboratories are extensions of those described in the 12 classic labs that the College Board has used in the past. The materials provided in this lab activity have been prepared by Ward’s to adapt to the specifications outlined in AP Biology Investigative Labs: An Inquiry-Based Approach (2012, The College Board). Ward’s has provided instructions and materials in the AP Biology Investigation series that complement the descriptions in this College Board publication. We recommend that all teachers review the College Board material as well as the instructions here to get the best understanding of what the learning goals are. Ward’s has structured each new AP investigation to have at least three parts: Structured, Guided, and Open Inquiry. Depending on a teacher’s syllabus, s/he may choose to do all or only parts of the investigations in scheduled lab periods.
The College Board requires that a syllabus describe how students communicate their experimental designs and results. It is up to the teacher to define how this requirement will be met. Having students keep a laboratory notebook is one straightforward way to do this.

©2012, Ward’s Natural Science
All Rights Reserved, Printed in the U.S.A.
US: www.wardsci.com
Canada: www.wardsci.ca
250-7454 v.1/12
Page 3
Diffusion & osmosis: Teacher’s GuiDe Kit # 3674-04
reCordIng dAtA In A lAborAtory notebook
All of the Ward’s Investigations assume that students will keep a laboratory notebook for student-directed investigations. A brief outline of recommended practices to set up a notebook and one possible format is provided below.
1. A composition book with bound pages is highly recommended. These can be found in most stationary stores. Ward’s offers several options with pre-numbered pages (for instance, item numbers 32-8040 and 15-8332). This prevents pages from being lost or mixed up over the course of an experiment.
2. The title page should contain, at the minimum, the student’s name. Pages should be numbered in succession.
3. After the title page, two to six pages should be reserved for a table of contents to be updated as experiments are done so they are easily found.
4. All entries should be made in permanent ink. Mistakes should be crossed out with a single line and should be initialed and dated. This clearly documents the actual sequence of events and methods of calculation. When in doubt, over-explain. In research labs, clear documentation may be required to audit and repeat results or obtain a patent.
5. It is good practice to permanently adhere a laboratory safety contract to the front cover of the notebook as a constant reminder to be safe.
6. It is professional lab practice to sign and date the bottom of every page. The instructor or lab partner can also sign and date as a witness to the veracity of the recording.
7. Any photos, data print-outs, or other type of documentation should be firmly adhered in the notebook. It is professional practice to draw a line from the notebook page over the inserted material to indicate that there has been no tampering with the records.
For student-directed investigations, it is expected that the student will provide an experimental plan for the teacher to approve before beginning any experiment. The general plan format follows that of writing a grant to fund a research project.
1. Define the question or testable hypothesis.
2. Describe the background information. Include previous experiments.
3. Describe the experimental design with controls, variables, and observations.
4. Describe the possible results and how they would be interpreted.
5. List the materials and methods to be used.
6. Note potential safety issues.
(continued on next page)
©2012, Ward’s Natural Science
All Rights Reserved, Printed in the U.S.A.
US: www.wardsci.com
Canada: www.wardsci.ca
250-7454 v.1/12
Page 4
Diffusion & osmosis: Teacher’s GuiDe Kit # 3674-04
reCordIng dAtA In A lAborAtory notebook (continued)
After the plan is approved: 7. The step by step procedure should be documented in the lab notebook. This includes recording
the calculations of concentrations, etc., as well as the weights and volumes used.
8. The results should be recorded (including drawings, photos, data print outs).
9. The analysis of results should be recorded.
10. Draw conclusions based on how the results compared to the predictions.
11. Limitations of the conclusions should be discussed, including thoughts about improving the experimental design, statistical significance and uncontrolled variables.
12. Further study direction should be considered.
The College Board encourages peer review of student investigations through both formal and informal presentation with feedback and discussion. Assessment questions similar to those on the AP exam might resemble the following questions, which also might arise in peer review:
• Explain the purpose of a procedural step.
• Identify the independent variables and the dependent variables in an experiment.
• What results would you expect to see in the control group? The experimental group?
• How does XXXX concept account for YYYY findings?
• Describe a method to determine XXXX.
©2012, Ward’s Natural Science
All Rights Reserved, Printed in the U.S.A.
US: www.wardsci.com
Canada: www.wardsci.ca
250-7454 v.1/12
Page 5
Diffusion & osmosis: Teacher’s GuiDe Kit # 3674-04
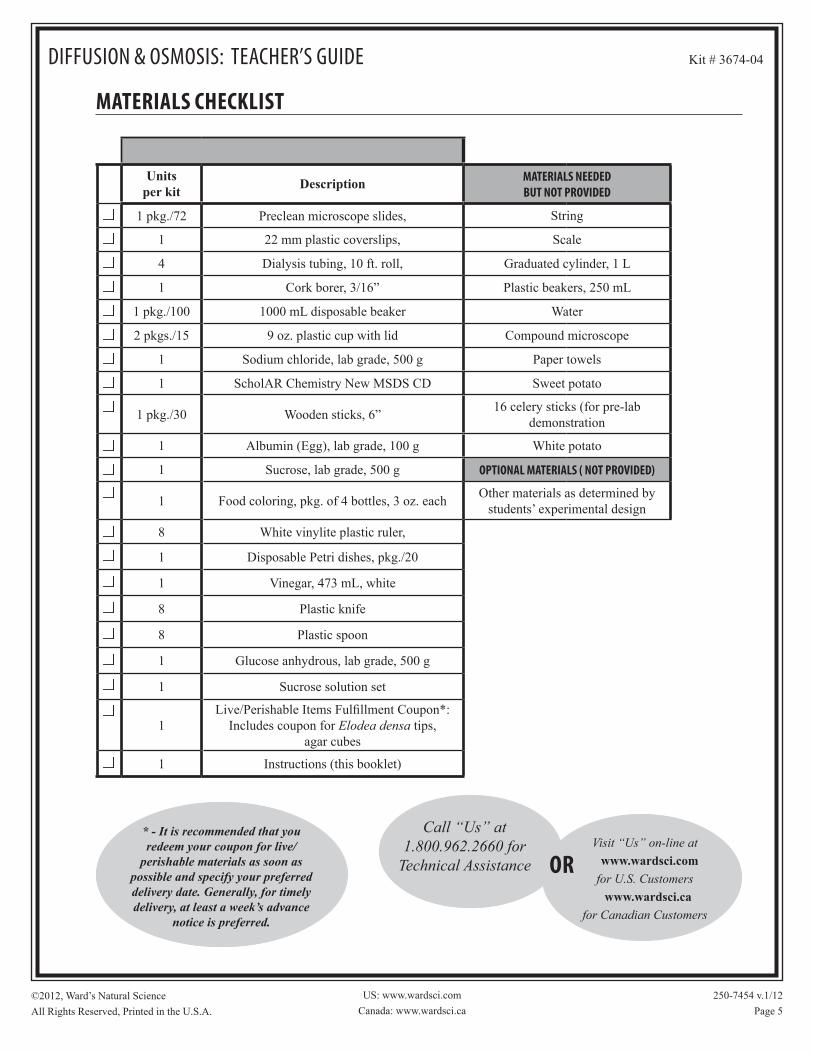
Units per kit
Description MAterIAls needed bUt not ProvIded
1 pkg./72 Preclean microscope slides, String
1 22 mm plastic coverslips, Scale
4 Dialysis tubing, 10 ft. roll, Graduated cylinder, 1 L
1 Cork borer, 3/16” Plastic beakers, 250 mL
1 pkg./100 1000 mL disposable beaker Water
2 pkgs./15 9 oz. plastic cup with lid Compound microscope
1 Sodium chloride, lab grade, 500 g Paper towels
1 ScholAR Chemistry New MSDS CD Sweet potato
1 pkg./30 Wooden sticks, 6”16 celery sticks (for pre-lab
demonstration
1 Albumin (Egg), lab grade, 100 g White potato
1 Sucrose, lab grade, 500 g oPtIonAl MAterIAls ( not ProvIded)
1 Food coloring, pkg. of 4 bottles, 3 oz. eachOther materials as determined by
students’ experimental design
8 White vinylite plastic ruler,
1 Disposable Petri dishes, pkg./20
1 Vinegar, 473 mL, white
8 Plastic knife
8 Plastic spoon
1 Glucose anhydrous, lab grade, 500 g
1 Sucrose solution set
1Live/Perishable Items Fulfillment Coupon*:
Includes coupon for Elodea densa tips, agar cubes
1 Instructions (this booklet)
MAterIAls CheCklIst
Call “Us” at 1.800.962.2660 for
Technical Assistance
Visit “Us” on-line at
www.wardsci.com
for U.S. Customers
www.wardsci.ca
for Canadian Customers
or* - It is recommended that you redeem your coupon for live/
perishable materials as soon as possible and specify your preferred delivery date. Generally, for timely delivery, at least a week’s advance
notice is preferred.
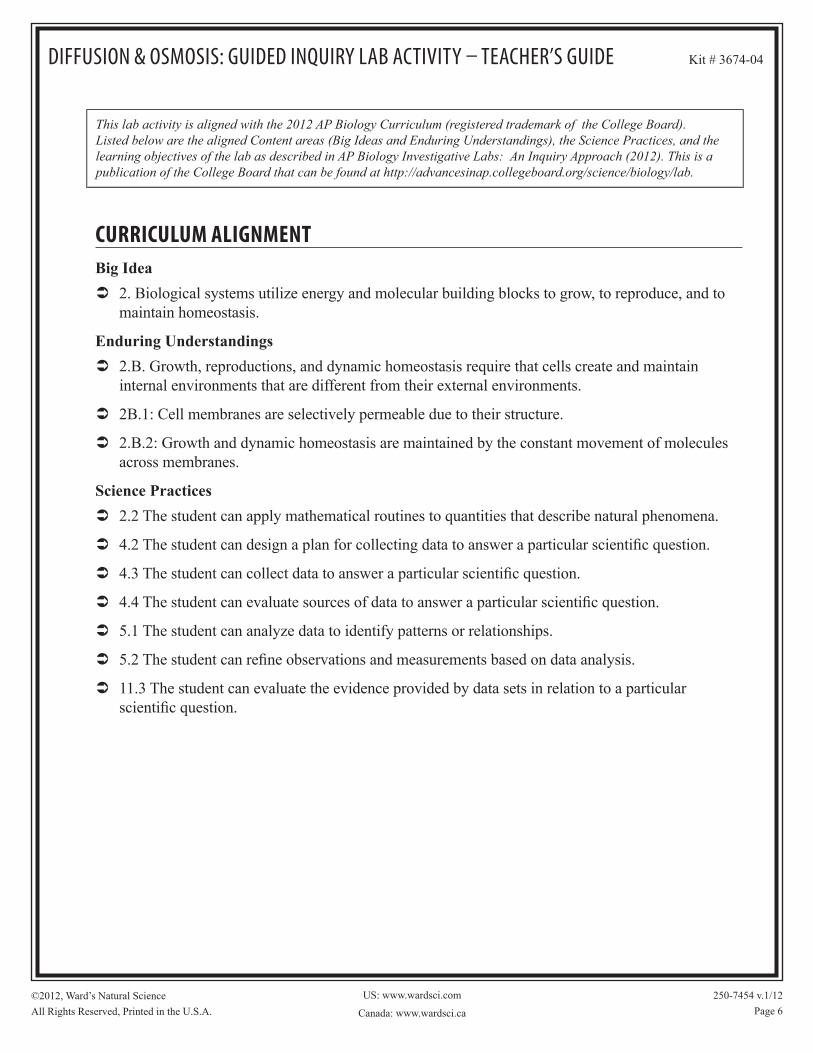
CUrrICUlUM AlIgnMentBig Idea
2. Biological systems utilize energy and molecular building blocks to grow, to reproduce, and to maintain homeostasis.
Enduring Understandings
2.B. Growth, reproductions, and dynamic homeostasis require that cells create and maintain internal environments that are different from their external environments.
2B.1: Cell membranes are selectively permeable due to their structure.
2.B.2: Growth and dynamic homeostasis are maintained by the constant movement of molecules across membranes.
Science Practices
2.2 The student can apply mathematical routines to quantities that describe natural phenomena.
4.2 The student can design a plan for collecting data to answer a particular scientific question.
4.3 The student can collect data to answer a particular scientific question.
4.4 The student can evaluate sources of data to answer a particular scientific question.
5.1 The student can analyze data to identify patterns or relationships.
5.2 The student can refine observations and measurements based on data analysis.
11.3 The student can evaluate the evidence provided by data sets in relation to a particular scientific question.
‹
‹
‹
‹
‹
‹
‹
‹
‹
‹
‹
©2012, Ward’s Natural Science
All Rights Reserved, Printed in the U.S.A.
US: www.wardsci.com
Canada: www.wardsci.ca 250-7454 v.1/12
Page 6
Diffusion & osmosis: GuiDeD inquiry lab acTiviTy – Teacher’s GuiDe Kit # 3674-04
This lab activity is aligned with the 2012 AP Biology Curriculum (registered trademark of the College Board). Listed below are the aligned Content areas (Big Ideas and Enduring Understandings), the Science Practices, and the learning objectives of the lab as described in AP Biology Investigative Labs: An Inquiry Approach (2012). This is a publication of the College Board that can be found at http://advancesinap.collegeboard.org/science/biology/lab.

©2012, Ward’s Natural Science
All Rights Reserved, Printed in the U.S.A.
US: www.wardsci.com
Canada: www.wardsci.ca
250-7454 v.1/12
Page 7
Diffusion & osmosis: Teacher’s GuiDe Kit # 3674-04
leArnIng objeCtIvesThe student is able to use calculated surface area-to-volume ratios to predict which cell(s) might eliminate wastes or procure nutrients faster by diffusion (2A3 & SP 2.2).
The student is able to explain how cell size and shape affect the overall rate of nutrient intake and the rate of waste elimination (2A3 & SP 2.2).
The student is able to use representations and models to pose scientific questions about the properties of cell membranes and selective permeability based on molecular structure (2B1 & SP 4.2, SP 4.3, SP 4.4).
tIMe reqUIreMents
Part 1: Diffusion and Osmosis
Structured Inquiry: 5 minutes
Guided Inquiry: 45 minutes
Open Inquiry: Will vary, depending on students’ experimental designs
Part 2: Modeling Osmosis
Structured Inquiry: 45 minutes
Guided Inquiry: 45 minutes
Open Inquiry: Will vary, depending on students’ experimental designs
Part 3: Osmosis in Living Plant Cells
Structured Inquiry: 45 minutes
Guided Inquiry: 45 minutes
Open Inquiry: Will vary, depending on students’ experimental designs
Analyzing Results and Class Discussion 45 minutes
‹
‹
‹

©2012, Ward’s Natural Science
All Rights Reserved, Printed in the U.S.A.
US: www.wardsci.com
Canada: www.wardsci.ca
250-7454 v.1/12
Page 8
Diffusion & osmosis: Teacher’s GuiDe Kit # 3674-04
sAfety PreCAUtIons Lab-Specific Safety
White vinegar and phenolphthalein agar are used in this kit. Both are irritants to the skin and eyes. Use with caution. Review the Material Safety Data Sheets (MSDSs) for additional safety precautions, handling procedures, storage, and other information. MSDSs are provided at the end of this booklet. Addtionally, visit : www.scholarchemistry.com for the latest and most up-to-date MSDSs.
General Safety
The teacher should be familiar with safety practices and regulations in their school (district and state). Know what needs to be treated as hazardous waste and how to properly dispose of non-hazardous chemicals or biological material.
Consider establishing a safety contract that students and their parents must read and sign off on. This is a good way to identify students with allergies to things like latex so that you (and they) will be reminded of what particular things may be risks to individuals. A good practice is to include a copy of this contract in the student lab book (glued to the inside cover).
Students should know where all emergency equipment (safety shower, eyewash station, fire extinguisher, fire blanket, first aid kit etc.) is located.
Make sure students remove all dangling jewelry and tie back long hair before they begin.
Remind students to read all instructions, MSDSs, and live care sheets before starting the lab activities, and to ask questions about safety and safe laboratory procedures. Appropriate MSDSs and live care sheets can be found on the last pages of this booklet. Additionally, the most updated versions of these resources can be found at www.wardsci.com, under Living Materials http://wardsci.com/article.asp?ai=1346.
In student directed investigations, make sure that collecting safety information (like MSDSs) is part of the experimental proposal.
As general laboratory practice, it is recommended that students wear proper protective equipment, such as gloves, safety goggles, and a lab apron.
At end of lab:
All laboratory bench tops should be wiped down with a 20% bleach solution or disinfectant to ensure cleanliness.
Remind students to wash their hands thoroughly with soap and water before leaving the laboratory.
‹
‹
‹
‹
‹
‹
‹
‹
‹
‹
©2012, Ward’s Natural Science
All Rights Reserved, Printed in the U.S.A.
US: www.wardsci.com
Canada: www.wardsci.ca
250-7454 v.1/12
Page 9
Diffusion & osmosis: Teacher’s GuiDe Kit # 3674-04
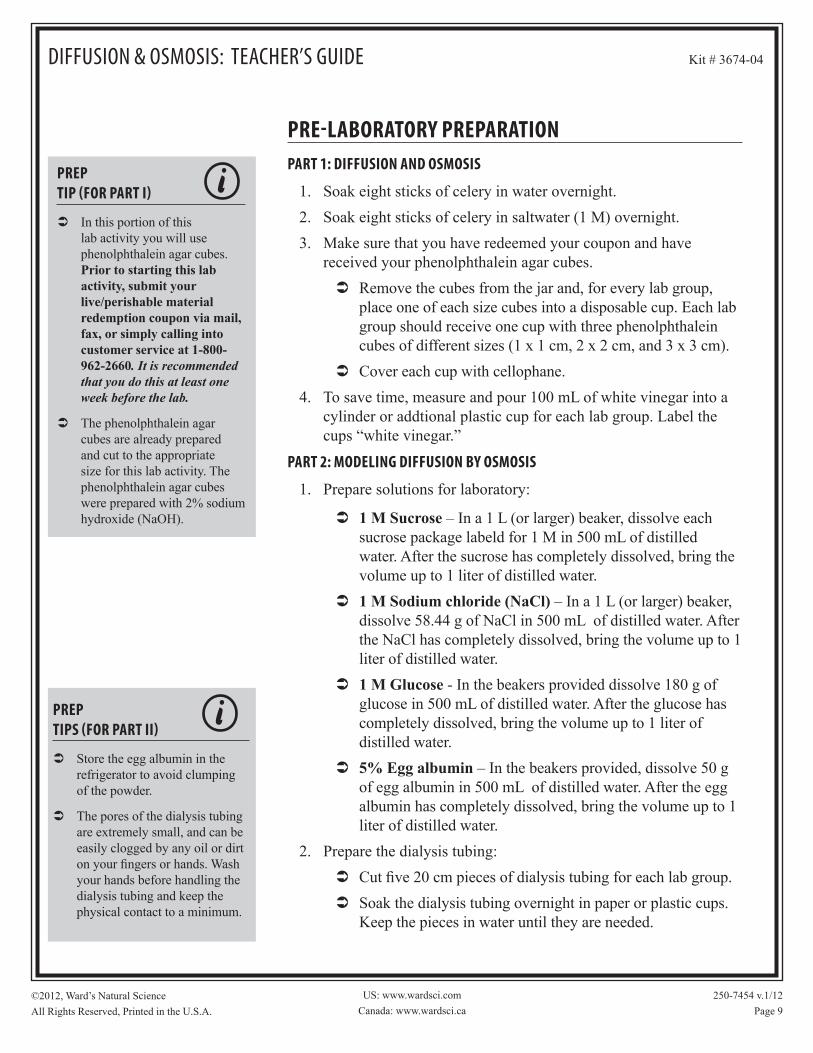
PreP tIPs (for PArt II)
Store the egg albumin in the refrigerator to avoid clumping of the powder.
The pores of the dialysis tubing are extremely small, and can be easily clogged by any oil or dirt on your fingers or hands. Wash your hands before handling the dialysis tubing and keep the physical contact to a minimum.
‹
‹
PreP tIP (for PArt I)
In this portion of this lab activity you will use phenolphthalein agar cubes. Prior to starting this lab activity, submit your live/perishable material redemption coupon via mail, fax, or simply calling into customer service at 1-800-962-2660. It is recommended that you do this at least one week before the lab.
The phenolphthalein agar cubes are already prepared and cut to the appropriate size for this lab activity. The phenolphthalein agar cubes were prepared with 2% sodium hydroxide (NaOH).
‹
‹
Pre-lAborAtory PrePArAtIonPArt 1: dIffUsIon And osMosIs
Soak eight sticks of celery in water overnight.
Soak eight sticks of celery in saltwater (1 M) overnight.
Make sure that you have redeemed your coupon and have received your phenolphthalein agar cubes.
Remove the cubes from the jar and, for every lab group, place one of each size cubes into a disposable cup. Each lab group should receive one cup with three phenolphthalein cubes of different sizes (1 x 1 cm, 2 x 2 cm, and 3 x 3 cm).
Cover each cup with cellophane.
4. To save time, measure and pour 100 mL of white vinegar into a cylinder or addtional plastic cup for each lab group. Label the cups “white vinegar.”
PArt 2: ModelIng dIffUsIon by osMosIs
1. Prepare solutions for laboratory:
1 M Sucrose – In a 1 L (or larger) beaker, dissolve each sucrose package labeld for 1 M in 500 mL of distilled water. After the sucrose has completely dissolved, bring the volume up to 1 liter of distilled water.
1 M Sodium chloride (NaCl) – In a 1 L (or larger) beaker, dissolve 58.44 g of NaCl in 500 mL of distilled water. After the NaCl has completely dissolved, bring the volume up to 1 liter of distilled water.
1 M Glucose - In the beakers provided dissolve 180 g of glucose in 500 mL of distilled water. After the glucose has completely dissolved, bring the volume up to 1 liter of distilled water.
5% Egg albumin – In the beakers provided, dissolve 50 g of egg albumin in 500 mL of distilled water. After the egg albumin has completely dissolved, bring the volume up to 1 liter of distilled water.
2. Prepare the dialysis tubing:
Cut five 20 cm pieces of dialysis tubing for each lab group.
Soak the dialysis tubing overnight in paper or plastic cups. Keep the pieces in water until they are needed.
1.
2.
3.
‹
‹
‹
‹
‹
‹
‹
‹
©2012, Ward’s Natural Science
All Rights Reserved, Printed in the U.S.A.
US: www.wardsci.com
Canada: www.wardsci.ca
250-7454 v.1/12
Page 10
Diffusion & osmosis: Teacher’s GuiDe Kit # 3674-04
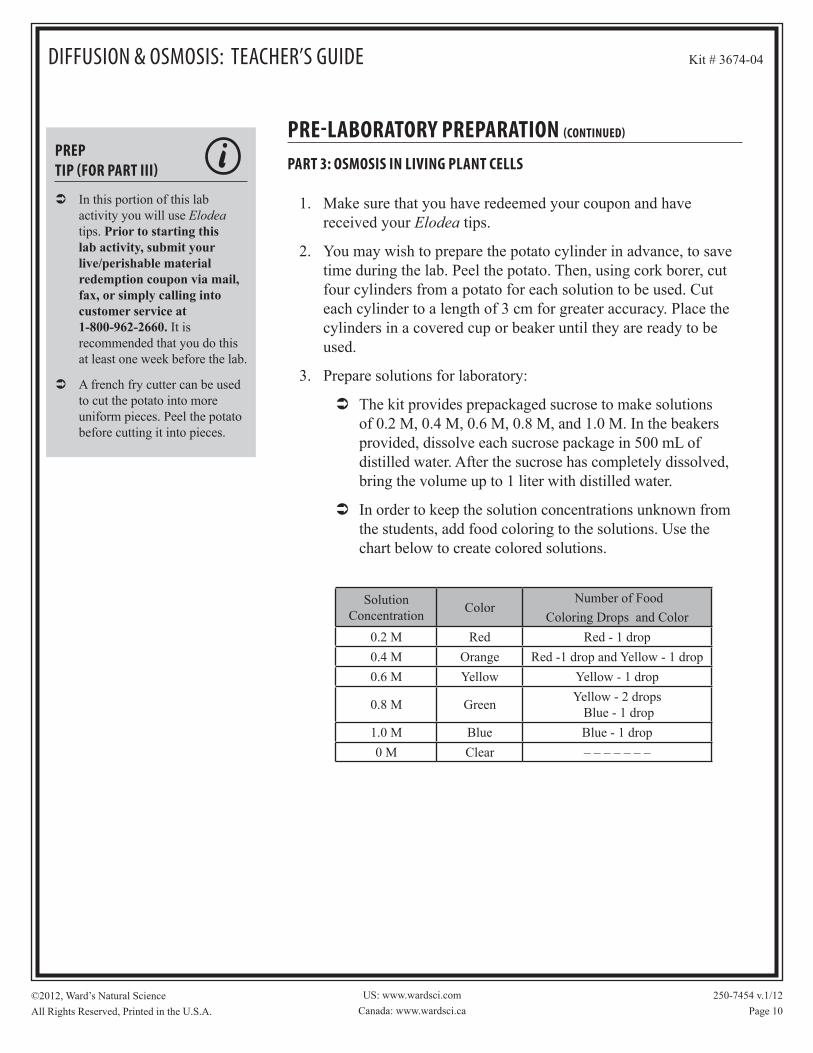
PrePtIP (for PArt III)
In this portion of this lab activity you will use Elodea tips. Prior to starting this lab activity, submit your live/perishable material redemption coupon via mail, fax, or simply calling into customer service at 1-800-962-2660. It is recommended that you do this at least one week before the lab.
A french fry cutter can be used to cut the potato into more uniform pieces. Peel the potato before cutting it into pieces.
‹
‹
Pre-lAborAtory PrePArAtIon (ContInUed)
PArt 3: osMosIs In lIvIng PlAnt Cells
Make sure that you have redeemed your coupon and have received your Elodea tips.
You may wish to prepare the potato cylinder in advance, to save time during the lab. Peel the potato. Then, using cork borer, cut four cylinders from a potato for each solution to be used. Cut each cylinder to a length of 3 cm for greater accuracy. Place the cylinders in a covered cup or beaker until they are ready to be used.
Prepare solutions for laboratory:
The kit provides prepackaged sucrose to make solutions of 0.2 M, 0.4 M, 0.6 M, 0.8 M, and 1.0 M. In the beakers provided, dissolve each sucrose package in 500 mL of distilled water. After the sucrose has completely dissolved, bring the volume up to 1 liter with distilled water.
In order to keep the solution concentrations unknown from the students, add food coloring to the solutions. Use the chart below to create colored solutions.
Solution Concentration
Color Number of Food
Coloring Drops and Color
0.2 M Red Red - 1 drop
0.4 M Orange Red -1 drop and Yellow - 1 drop
0.6 M Yellow Yellow - 1 drop
0.8 M GreenYellow - 2 drops
Blue - 1 drop
1.0 M Blue Blue - 1 drop
0 M Clear – – – – – – –
1.
2.
3.
‹
‹

©2012, Ward’s Natural Science
All Rights Reserved, Printed in the U.S.A.
US: www.wardsci.com
Canada: www.wardsci.ca
250-7454 v.1/12
Page 11
Diffusion & osmosis: Teacher’s GuiDe Kit # 3674-04
bACkgroUndWhy are cells so small? Most cells grow, but upon reaching a certain size, a cell will divide becoming two smaller cells. This is how multicellular organisms, like humans, grow. But why do cells stop growing once they reach a certain size? Why does a cell divide and multiply rather than simply growing bigger? One possible answer can be found in the relationship between cell size and the diffusion of substances across the cell membrane.
The absorption of nutrients, excretion of cellular wastes, and the exchange of respiratory gases are life processes which depend upon efficient transport of substances into, out of, and throughout living cells. Diffusion is one of the most common and efficient means by which substances are passively transported between cells and their aqueous environment. Diffusion is the movement of a substance (liquid or gas) along a concentration gradient from high to low concentration. Diffusion is vital to many life functions of a cell. Diffusion allows the transport of vital nutrients and compounds without the expenditure of energy.
The cell membrane is the selectively permeable barrier whose total surface area is important to regulating the substances that diffuse into or out of the cell. Small, neutrally charged molecules such as oxygen, carbon dioxide, and glucose can pass freely through the membrane, while the diffusion of other materials is restricted. Materials that cannot diffuse across the membrane or need to be transported against a diffusion gradient can be actively transported across the membrane with the expenditure of energy. Osmosis is a special kind of diffusion that occurs as water is separated by a selectively permeable membrane with different solute concentrations on either side of the membrane. During osmosis, water moves from regions of low solute concentration to regions of high solute concentration without the expenditure of energy.
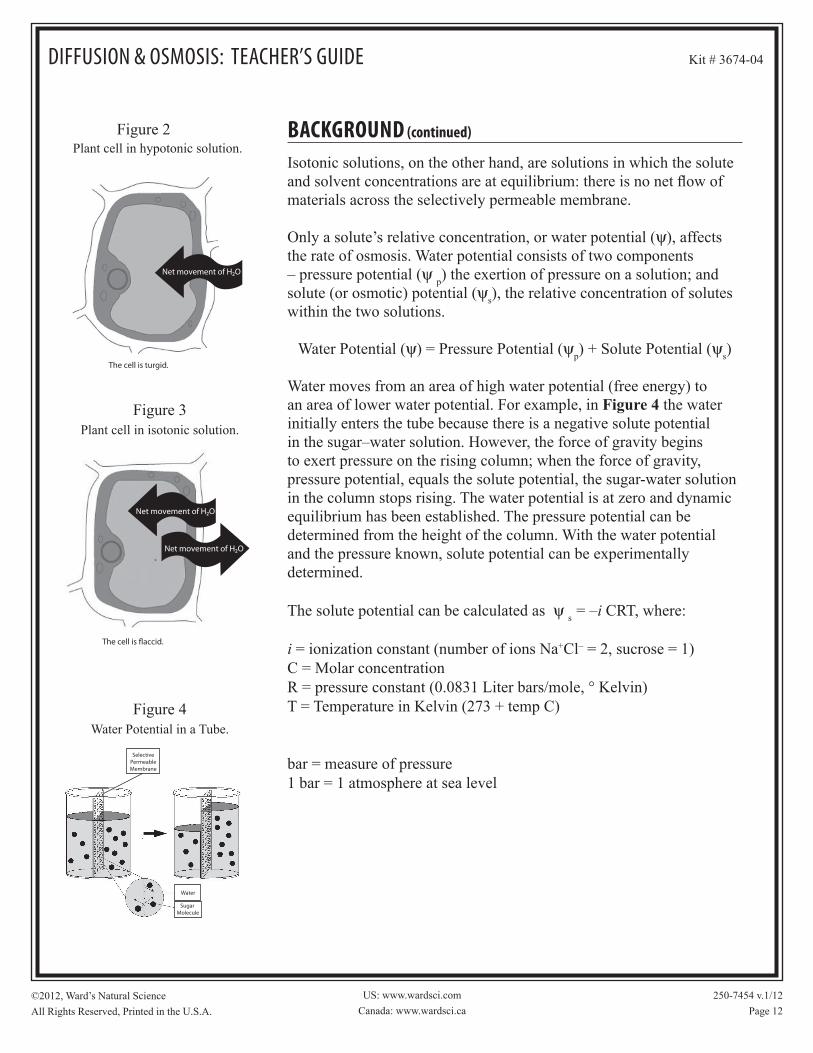
Organisms rarely exist in environments with solute concentrations that match their cytoplasm; there are usually more or fewer dissolved particles in one of two compared solutions separated by a membrane, such as a cell and the media in which it exists. A hypertonic solution is a solution in which the solute concentration is higher outside of the cell; therefore, water will flow to the external environment, causing the cell to shrink. Hypotonic solutions consist of a low concentration of solutes outside the cell; therefore, water will flow into the cell, causing cellular expansion. In the case of plant cells with cell walls , expansion is restricted, so pressure builds. This pressure is called turgor pressure.
Figure 1:Plant cell in hypertonic solution.
(continued on next page)
objeCtIves
Use calculated surface area-to-volume ratios to predict which cell(s) might eliminate wastes or procure nutrients faster by diffusion.
Explain how cell size and shape affect the overall rate of nutrient intake and the rate of waste elimination.
Use representations and models to pose scientific questions about the properties of cell membranes and selective permeability based on molecular structure.
‹
‹
‹
The cell is plasmolyzed.
Net movement of H O
©2012, Ward’s Natural Science
All Rights Reserved, Printed in the U.S.A.
US: www.wardsci.com
Canada: www.wardsci.ca
250-7454 v.1/12
Page 12
Diffusion & osmosis: Teacher’s GuiDe Kit # 3674-04
Isotonic solutions, on the other hand, are solutions in which the solute and solvent concentrations are at equilibrium: there is no net flow of materials across the selectively permeable membrane.
Only a solute’s relative concentration, or water potential (y), affects the rate of osmosis. Water potential consists of two components – pressure potential (y
p) the exertion of pressure on a solution; and
solute (or osmotic) potential (ys), the relative concentration of solutes
within the two solutions.
Water Potential (y) = Pressure Potential (yp) + Solute Potential (y
s)
Water moves from an area of high water potential (free energy) to an area of lower water potential. For example, in Figure 4 the water initially enters the tube because there is a negative solute potential in the sugar–water solution. However, the force of gravity begins to exert pressure on the rising column; when the force of gravity, pressure potential, equals the solute potential, the sugar-water solution in the column stops rising. The water potential is at zero and dynamic equilibrium has been established. The pressure potential can be determined from the height of the column. With the water potential and the pressure known, solute potential can be experimentally determined.
The solute potential can be calculated as yys
= –i CRT, where:
i = ionization constant (number of ions Na+Cl– = 2, sucrose = 1)C = Molar concentrationR = pressure constant (0.0831 Liter bars/mole, ° Kelvin)T = Temperature in Kelvin (273 + temp C)
bar = measure of pressure 1 bar = 1 atmosphere at sea level
Figure 3 Plant cell in isotonic solution.
Plant cell in hypotonic solution.Figure 2 bACkgroUnd (continued)
Figure 4 Water Potential in a Tube.
The cell is turgid.
Net movement of H O
Net movement of H O
Net movement of H O
SugarMolecule
Water
SelectivePermeable Membrane

©2012, Ward’s Natural Science
All Rights Reserved, Printed in the U.S.A.
US: www.wardsci.com
Canada: www.wardsci.ca
250-7454 v.1/12
Page 13
Diffusion & osmosis: Teacher’s GuiDe Kit # 3674-04
notessAfety PreCAUtIons
As general safe laboratory practice, it is recommended that you wear proper protective equipment, such as gloves, safety goggles, and a lab apron.
As general lab practice, read the lab through completely before starting, including any Materials Safety Data Sheets (MSDSs) and live materials care sheets at the end of this booklet as well as any appropriate MSDSs for any additional substances you would like to test. One of the best sources is the vendor for the material. For example, for chemicals purchased at Ward’s, searching for the chemicals on the Ward’s website will direct you to a link for the appropriate MSDSs.
At the end of the labs:
All laboratory bench tops should be wiped down with a 20% bleach solution or disinfectant to ensure cleanliness.
Wash your hands thoroughly with soap and water before leaving the laboratory.
‹
‹
‹
‹

©2012, Ward’s Natural Science
All Rights Reserved, Printed in the U.S.A.
US: www.wardsci.com
Canada: www.wardsci.ca
250-7454 v.1/12
Page 14
Diffusion & osmosis: Teacher’s GuiDe Kit # 3674-04
PArt 1: osMosIs & dIffUsIonMAterIAls lIst
Celery stick soaked in water\Celery stick soaked in saltwater3 Phenolphthalein agar cubes: 3 x 3 cm, 2 x 2 cm, and 1 x 1 cm1 Plastic knife1 Plastic spoon1 Plastic cup1 Vinylite white plastic ruler, 6” metric system1 White vinegar, 100 mL1 Timer
PArt 1A – strUCtUred InqUIry: osMosIs & dIffUsIon
1. Observe the celery stick that was soaked in water. Record your observations.
2. Break the celery stick that was soaked in water. Record your observations.
3. Observe the celery stick that was soaked in saltwater. Record your observations.
4. Break the celery stick that was soaked in saltwater. Record your observations.
PArt 1A – gUIded InqUIry: osMosIs & dIffUsIonThe agar cubes have been prepared with 1% phenolphthalein, which is a pH indicator. The chart below indicates a color scale of pH for phenolphthalein. The blocks are pink because the agar blocks were soaked in 0.01 % sodium hydroxide.
Phenolphthalein Color IndicatorColor pH Acid or Base
Colorless 0 - 8.2 Acidic or slightly neutral
Pink to Red 8.2 – 12.0 Basic
1. Obtain agar cubes in a plastic cup from your teacher.
Be careful not to scratch any surface of the cubes.
qqqqqqqqq
‹
notes
(continued on next page)
©2012, Ward’s Natural Science
All Rights Reserved, Printed in the U.S.A.
US: www.wardsci.com
Canada: www.wardsci.ca
250-7454 v.1/12
Page 15
Diffusion & osmosis: Teacher’s GuiDe Kit # 3674-04
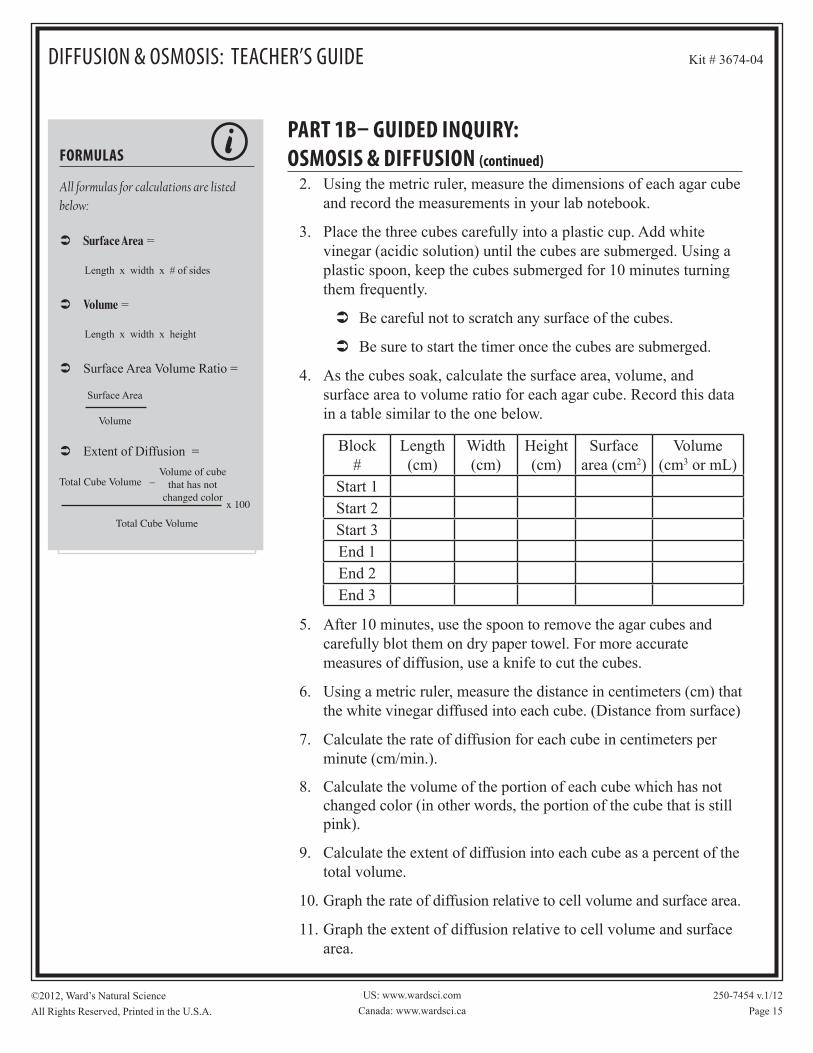
2. Using the metric ruler, measure the dimensions of each agar cube and record the measurements in your lab notebook.
3. Place the three cubes carefully into a plastic cup. Add white vinegar (acidic solution) until the cubes are submerged. Using a plastic spoon, keep the cubes submerged for 10 minutes turning them frequently.
Be careful not to scratch any surface of the cubes.
Be sure to start the timer once the cubes are submerged.
4. As the cubes soak, calculate the surface area, volume, and surface area to volume ratio for each agar cube. Record this data in a table similar to the one below.
Block #
Length (cm)
Width (cm)
Height (cm)
Surface area (cm2)
Volume (cm3 or mL)
Start 1Start 2Start 3End 1End 2End 3
5. After 10 minutes, use the spoon to remove the agar cubes and carefully blot them on dry paper towel. For more accurate measures of diffusion, use a knife to cut the cubes.
6. Using a metric ruler, measure the distance in centimeters (cm) that the white vinegar diffused into each cube. (Distance from surface)
7. Calculate the rate of diffusion for each cube in centimeters per minute (cm/min.).
8. Calculate the volume of the portion of each cube which has not changed color (in other words, the portion of the cube that is still pink).
9. Calculate the extent of diffusion into each cube as a percent of the total volume.
10. Graph the rate of diffusion relative to cell volume and surface area.
11. Graph the extent of diffusion relative to cell volume and surface area.
‹
‹
forMUlAs
All formulas for calculations are listed below:
Surface Area =
Length x width x # of sides
Volume =
Length x width x height
Surface Area Volume Ratio = Surface Area
Volume
Extent of Diffusion =
Total Cube Volume – Volume of cube
that has not changed color
Total Cube Volume
‹
‹
‹
‹
PArt 1b– gUIded InqUIry: osMosIs & dIffUsIon (continued)
x 100

©2012, Ward’s Natural Science
All Rights Reserved, Printed in the U.S.A.
US: www.wardsci.com
Canada: www.wardsci.ca
250-7454 v.1/12
Page 16
Diffusion & osmosis: Teacher’s GuiDe Kit # 3674-04
PArt 1: osMosIs & dIffUsIon AssessMent qUestIons
1. Why are celery sticks soaked in saltwater more flexible than those soaked in plain water?
Plain water is hypotonic to the inside of the cells, so water flows into the cell and expands, increasing turgor pressure. Salt is hypertonic to the inside of the cells, so cells become shrunken relative to the cell wall, and turgor pressure is decreased.
2. Examine your data from Part 1A: Guided Inquiry. What dimensions supported the fastest diffusion rate? Why?
The diffusion rate in this experiment is constant because the concentration of solute is constant.
3. What dimensions supported the greatest diffusion percent total volume? Why?
The greatest surface to volume ration causes he biggest change in g total volume.
4. Construct a useful graph of the relationship between cell dimension to the extent of diffusion.
See graph at right.
5. Why can’t humans drink seawater for hydration? Explain.
Seawater is hypertonic to digestive system cells. Therefore, water will be drawn out of the cells to be excreted.
6. The size of some human cells is 0.01 mm. Using the formulas in this activity, calculate the surface to volume ratio of such a cell (assume 0.01 mm cube). Describe the extent of diffusion into this living cell as compared to the smallest agar cube. Explain.
The ratio is 600:1. The extent of diffusion will be considerably greater due to the much larger surface area to volume ratio. The cell will reach complete equilibrium before the agar cube does.
Ext
ent d
iffu
sion
or
%
tota
l vol
ume
chan
ge
Surface area/volume
©2012, Ward’s Natural Science
All Rights Reserved, Printed in the U.S.A.
US: www.wardsci.com
Canada: www.wardsci.ca
250-7454 v.1/12
Page 17
Diffusion & osmosis: Teacher’s GuiDe Kit # 3674-04
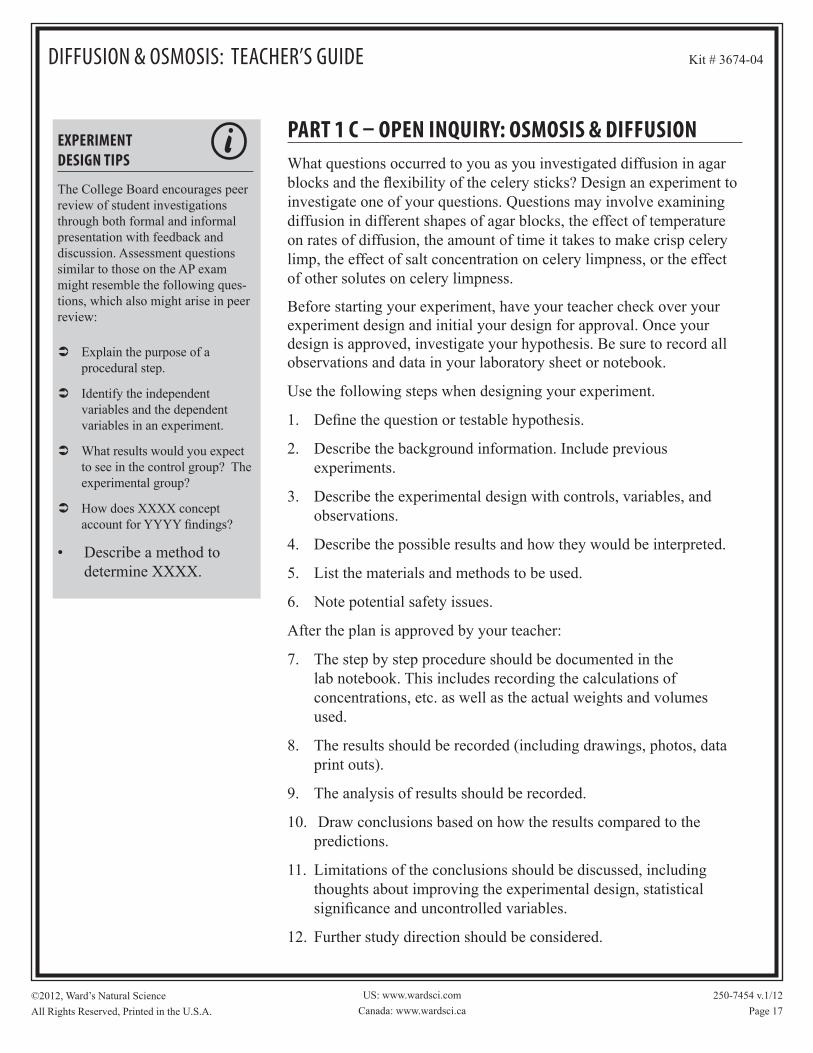
PArt 1 C – oPen InqUIry: osMosIs & dIffUsIonWhat questions occurred to you as you investigated diffusion in agar blocks and the flexibility of the celery sticks? Design an experiment to investigate one of your questions. Questions may involve examining diffusion in different shapes of agar blocks, the effect of temperature on rates of diffusion, the amount of time it takes to make crisp celery limp, the effect of salt concentration on celery limpness, or the effect of other solutes on celery limpness.
Before starting your experiment, have your teacher check over your experiment design and initial your design for approval. Once your design is approved, investigate your hypothesis. Be sure to record all observations and data in your laboratory sheet or notebook.
Use the following steps when designing your experiment.
1. Define the question or testable hypothesis.
2. Describe the background information. Include previous experiments.
3. Describe the experimental design with controls, variables, and observations.
4. Describe the possible results and how they would be interpreted.
5. List the materials and methods to be used.
6. Note potential safety issues.
After the plan is approved by your teacher:
7. The step by step procedure should be documented in the lab notebook. This includes recording the calculations of concentrations, etc. as well as the actual weights and volumes used.
8. The results should be recorded (including drawings, photos, data print outs).
9. The analysis of results should be recorded.
10. Draw conclusions based on how the results compared to the predictions.
11. Limitations of the conclusions should be discussed, including thoughts about improving the experimental design, statistical significance and uncontrolled variables.
12. Further study direction should be considered.
eXPerIMent desIgn tIPs
The College Board encourages peer review of student investigations through both formal and informal presentation with feedback and discussion. Assessment questions similar to those on the AP exam might resemble the following ques-tions, which also might arise in peer review:
Explain the purpose of a procedural step.
Identify the independent variables and the dependent variables in an experiment.
What results would you expect to see in the control group? The experimental group?
How does XXXX concept account for YYYY findings?
• Describe a method to determine XXXX.
‹
‹
‹
‹

©2012, Ward’s Natural Science
All Rights Reserved, Printed in the U.S.A.
US: www.wardsci.com
Canada: www.wardsci.ca
250-7454 v.1/12
Page 18
Diffusion & osmosis: Teacher’s GuiDe Kit # 3674-04
PArt 2: ModelIng osMosIsIntrodUCtIonIn this lab activity, you will construct and simulate model cells in an external environment, to relate solutes passing through a semi-permeable membrane in hypertonic, hypotonic, and isotonic solutions.
MAterIAls lIst Per lAb groUP1 Roll of String1 Balance1 Graduated Cylinder5 Disposable beaker, 1000 mL7 ft. Piece of Dialysis Tubing, 20 cm250 mL 1M Sucrose Solution 250 mL 1M Sodium Chloride (Salt)250 mL 1M Glucose Solution250 mL 5% Albumin Solution (Protein)500 mL Distilled OR Tap Water
PArt 2A – ProCedUre: strUCtUred InqUIryThe pores in dialysis tubing allow some molecules to freely diffuse across the membrane and some to be restricted. In this lab, you will use dialysis tubing as a model cell membrane.
1. Obtain five pieces of pre-soaked dialysis tubing from the beaker of water. Tie a tight knot in one end of each piece of tubing, or use a piece of string to tie off the end.
2. Measure and pour 10 mL of each of the four prepared solutions into a separate graduated cylinder. The solutions are salt, glucose, sucrose, and protein.
3. Open the tubing by rubbing the untied end between your fingers. Pour 10 mL of prepared solution into the tubing. Carefully tie a knot in the open end to form a closed cell membrane (similar to a bag). Be sure to leave enough space in the bag for expansion. Minimize air enclosed in the tubing.
qqqqqqqqqq
ProCedUre tIPs
Record all data IMMEDIATELY
in your laboratory notebook.
Wash your hands before
handling the dialysis tubing,
and keep physical contact with
the tubing to a minimum.
Remember to label your model
cells. Record the pairs in your
laboratory notebook in their
respective order of your lab
set-up.
If you choose to tie off the
end of the dialysis tubing with
string, tie two knots, about 1/4”
apart, to prevent leaking.
‹
‹
‹
‹
(continued on next page)

©2012, Ward’s Natural Science
All Rights Reserved, Printed in the U.S.A.
US: www.wardsci.com
Canada: www.wardsci.ca
250-7454 v.1/12
Page 19
Diffusion & osmosis: Teacher’s GuiDe Kit # 3674-04
4. Fill a beaker about 100 mL of the solutions to be paired with your model cell. Use either water or salt. (See sample data table below for parings.)
5. Repeat Steps 3 and 4 for the remaining four cells.
Remember to clean the graduated cylinder between solutions.
6. Determine the initial weight of each cell and record in a table similar to the one shown below.
7. Completely immerse the model cells in their pairing solutions in the beaker or cup. Start your timer.
8. Given what you know about solute concentration, predict whether each “cell” volume will grow, shrink, or remain constant. Record your predictions in your laboratory notebook.
9. Allow the “cells” to soak for 30 minutes. Record any observations in your laboratory notebook.
10. When 30 minutes has passed, remove the model cells from the solution, pat dry, and determine the final weight of each of the model cells. Record the final weights and any additional observations.
11. Calculate the percent change in weight and record your results in your laboratory notebook.
Do not discard any of your solutions from this part of the lab activity as they will also be used in Parts 2B, 2C, and Part 3 of this investigation.
‹
‹
PArt 2A – ProCedUre (continued)
Paired Extra-Cellular
Solution (in cup)
Cell Weight (g) % ChangeStart time
0After 30 minutes
Cell 1 (protein) Salt
Cell 2 (sucrose) Water
Cell 3 (water) Water
Cell 4 (glucose) Salt
Cell 5 (salt) Water
x 100Final Mass - Initial Mass
Initial Mass
notes
©2012, Ward’s Natural Science
All Rights Reserved, Printed in the U.S.A.
US: www.wardsci.com
Canada: www.wardsci.ca
250-7454 v.1/12
Page 20
Diffusion & osmosis: Teacher’s GuiDe Kit # 3674-04
PArt 2b – ModelIng osMosIs ProCedUre: gUIded InqUIry
1. Repeat Part 2A of this lab, but pair intracellular and extracellular solutions as you like, and make predictions about how the “cells” will behave.
PArt 2b – ModelIng osMosIs: AssessMent1. Examine the initial and final weights of the model cells. What
cause the mass of the dialysis bags to change? Was there more or less water in the dialysis bags at the conclusion of the experiment? Explain.
Answers will vary, but the students should account for the change in mass to the water entering and leaving the model cell. Students should conclude which solutions have the greatest and least water potential inside and outside of the model cell.
2. From your results, which solutes, if any, diffused across the membrane and which, if any, were restricted? Why do you think this occurred?
Protein is restricted since its concentration does not drive water either way. Protein is much larger than simple molecules, and will not pass through the pores of the membrane.
3. How is dialysis tubing different from a cell membrane?
Answers will vary. They may include:
Dialysis tubing is much less complex; it is not a lipid bilayer; it does not use energy to pump materials against a concentration gradient.
notes

©2012, Ward’s Natural Science
All Rights Reserved, Printed in the U.S.A.
US: www.wardsci.com
Canada: www.wardsci.ca
250-7454 v.1/12
Page 21
Diffusion & osmosis: Teacher’s GuiDe Kit # 3674-04
PArt 2C – oPen InqUIry: ModelIng osMosIsWhat questions occurred to you as you investigated osmosis through a permeable membrane? Design an experiment to investigate one of your questions. Questions may involve examining different types of solutes that do not cross the membrane, effects of variation in pressure, effects of different types of ions in solutions, or the behavior of different types of solutes. Before starting your experiment, have your teacher check over your experiment design and initial your design for approval. Once your design is approved, investigate your hypothesis. Be sure to record all observations and data in your laboratory sheet or notebook.
Use the following steps when designing your experiment.
1. Define the question or testable hypothesis.
2. Describe the background information. Include previous experiments.
3. Describe the experimental design with controls, variables, and observations.
4. Describe the possible results and how they would be interpreted.
5. List the materials and methods to be used.
6. Note potential safety issues.
After the plan is approved by your teacher:
7. The step by step procedure should be documented in the lab notebook. This includes recording the calculations of concentrations, etc. as well as the actual weights and volumes used.
8. The results should be recorded (including drawings, photos, data print outs).
9. The analysis of results should be recorded.
10. Draw conclusions based on how the results compared to the predictions.
11. Limitations of the conclusions should be discussed, including thoughts about improving the experimental design, statistical significance and uncontrolled variables.
12. Further study direction should be considered.
eXPerIMent desIgn tIPs
The College Board encourages peer review of student investigations through both formal and informal presentation with feedback and discussion. Assessment questions similar to those on the AP exam might resemble the following ques-tions, which also might arise in peer review:
Explain the purpose of a procedural step.
Identify the independent variables and the dependent variables in an experiment.
What results would you expect to see in the control group? The experimental group?
How does XXXX concept account for YYYY findings?
• Describe a method to determine XXXX.
‹
‹
‹
‹
©2012, Ward’s Natural Science
All Rights Reserved, Printed in the U.S.A.
US: www.wardsci.com
Canada: www.wardsci.ca
250-7454 v.1/12
Page 22
Diffusion & osmosis: Teacher’s GuiDe Kit # 3674-04
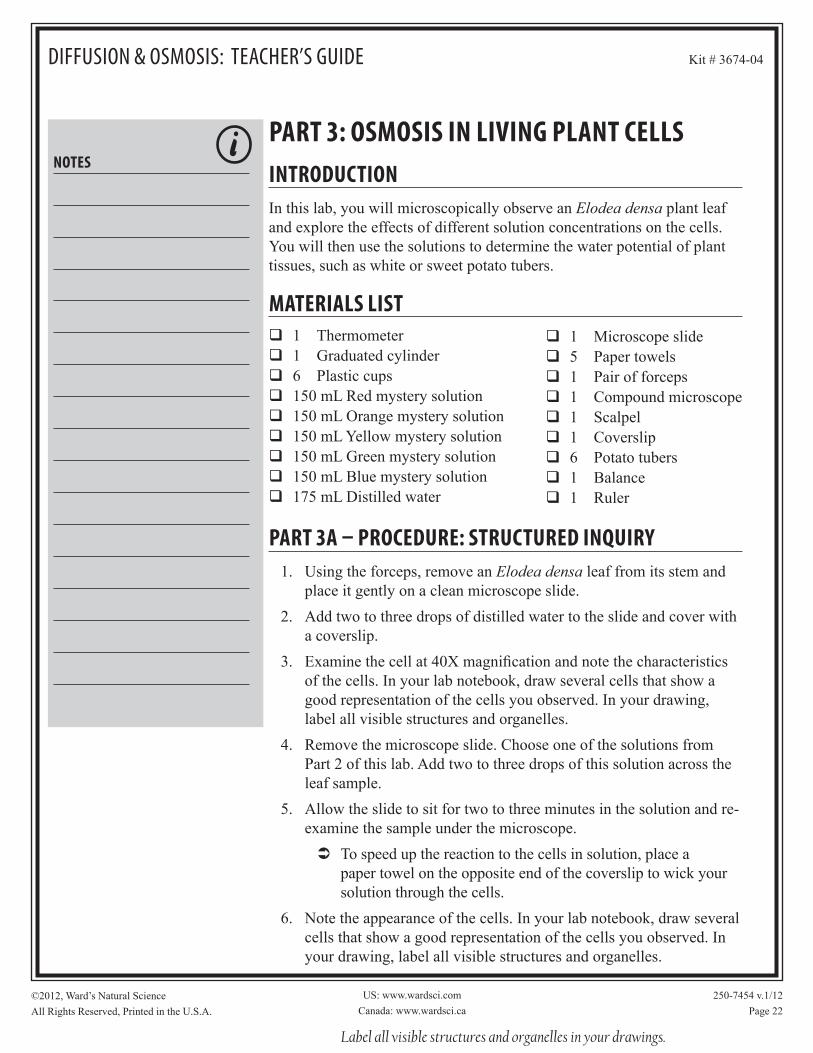
PArt 3: osMosIs In lIvIng PlAnt CellsIntrodUCtIonIn this lab, you will microscopically observe an Elodea densa plant leaf and explore the effects of different solution concentrations on the cells. You will then use the solutions to determine the water potential of plant tissues, such as white or sweet potato tubers.
MAterIAls lIst1 Thermometer1 Graduated cylinder6 Plastic cups 150 mL Red mystery solution150 mL Orange mystery solution 150 mL Yellow mystery solution150 mL Green mystery solution150 mL Blue mystery solution175 mL Distilled water
PArt 3A – ProCedUre: strUCtUred InqUIry1. Using the forceps, remove an Elodea densa leaf from its stem and
place it gently on a clean microscope slide.
2. Add two to three drops of distilled water to the slide and cover with a coverslip.
3. Examine the cell at 40X magnification and note the characteristics of the cells. In your lab notebook, draw several cells that show a good representation of the cells you observed. In your drawing, label all visible structures and organelles.
4. Remove the microscope slide. Choose one of the solutions from Part 2 of this lab. Add two to three drops of this solution across the leaf sample.
5. Allow the slide to sit for two to three minutes in the solution and re-examine the sample under the microscope.
To speed up the reaction to the cells in solution, place a paper towel on the opposite end of the coverslip to wick your solution through the cells.
6. Note the appearance of the cells. In your lab notebook, draw several cells that show a good representation of the cells you observed. In your drawing, label all visible structures and organelles.
Label all visible structures and organelles in your drawings.
qqqqqqqqq
‹
1 Microscope slide 5 Paper towels1 Pair of forceps1 Compound microscope1 Scalpel1 Coverslip6 Potato tubers1 Balance1 Ruler
qqqqqqqqq
notes

©2012, Ward’s Natural Science
All Rights Reserved, Printed in the U.S.A.
US: www.wardsci.com
Canada: www.wardsci.ca
250-7454 v.1/12
Page 23
Diffusion & osmosis: Teacher’s GuiDe Kit # 3674-04
PArt 3b – ProCedUre: gUIded InqUIry1. Make potato cores with a borer or use pre-made potato bores.
2. Weigh each core and measure the length of each core. Record your data in your laboratory notebook.
3. Place one or more potato cores in each of the mystery sucrose solutions.
4. Record your observations.
5. Wait 30 minutes.
6. After 30 minutes, re-weigh the cores, and calculate the changes in their weight. Record your data in your laboratory notebook.
PArt 3b – AssessMent1. Which color mystery solution had the highest concentration of
sucrose? How do you know this?
The blue mystery solution had the highest concentration of sucrose, since the core weighed the least at the end of the 30 minutes.
2. Knowing that the mystery solutions were sucrose at concentrations of 0.2 M, 0.4 M, 0.6 M, 0.8 M , and 1.0 M, calculate the water potential of the potato core. Show your calculations and explain your reasoning.
See graph above. Assuming 0.3 M, water potential = 1 bar + (–7.3 bars) = –8.3 bars
3. If you looked at your potato cores under the microscope, describe what you think you would see.
Expanded cells in 100% water; shrunken cells in the blue dyed, sucrose solutions.
notes
0%
assume 0.3
0 0.2 0.4 0.6 0.8 1.0
©2012, Ward’s Natural Science
All Rights Reserved, Printed in the U.S.A.
US: www.wardsci.com
Canada: www.wardsci.ca
250-7454 v.1/12
Page 24
Diffusion & osmosis: Teacher’s GuiDe Kit # 3674-04
PArt 3C – oPen InqUIry: ModelIng osMosIsWhat questions occurred to you as you investigated osmosis in living plant cells? Design an experiment to investigate one of your questions. Questions may involve differences in water potential in cells from different plants, from different parts of plants, or from single celled organisms. Before starting your experiment, have your teacher check over your experiment design and initial your design for approval. Once your design is approved, investigate your hypothesis. Be sure to record all observations and data in your laboratory sheet or notebook.
Use the following steps when designing your experiment.
1. Define the question or testable hypothesis.
2. Describe the background information. Include previous experiments.
3. Describe the experimental design with controls, variables, and observations.
4. Describe the possible results and how they would be interpreted.
5. List the materials and methods to be used.
6. Note potential safety issues.
After the plan is approved by your teacher:
7. The step by step procedure should be documented in the lab notebook. This includes recording the calculations of concentrations, etc. as well as the actual weights and volumes used.
8. The results should be recorded (including drawings, photos, data print outs).
9. The analysis of results should be recorded.
10. Draw conclusions based on how the results compared to the predictions.
11. Limitations of the conclusions should be discussed, including thoughts about improving the experimental design, statistical significance and uncontrolled variables.
12. Further study direction should be considered.
eXPerIMent desIgn tIPs
The College Board encourages peer review of student investigations through both formal and informal presentation with feedback and discussion. Assessment questions similar to those on the AP exam might resemble the following ques-tions, which also might arise in peer review:
Explain the purpose of a procedural step.
Identify the independent variables and the dependent variables in an experiment.
What results would you expect to see in the control group? The experimental group?
How does XXXX concept account for YYYY findings?
Describe a method to determine XXXX.
‹
‹
‹
‹
‹
©2012, Ward’s Natural Science
All Rights Reserved, Printed in the U.S.A.
US: www.wardsci.com
Canada: www.wardsci.ca
250-7454 v.1/12
Page 25
Diffusion & osmosis: Teacher’s GuiDe Kit # 3674-04
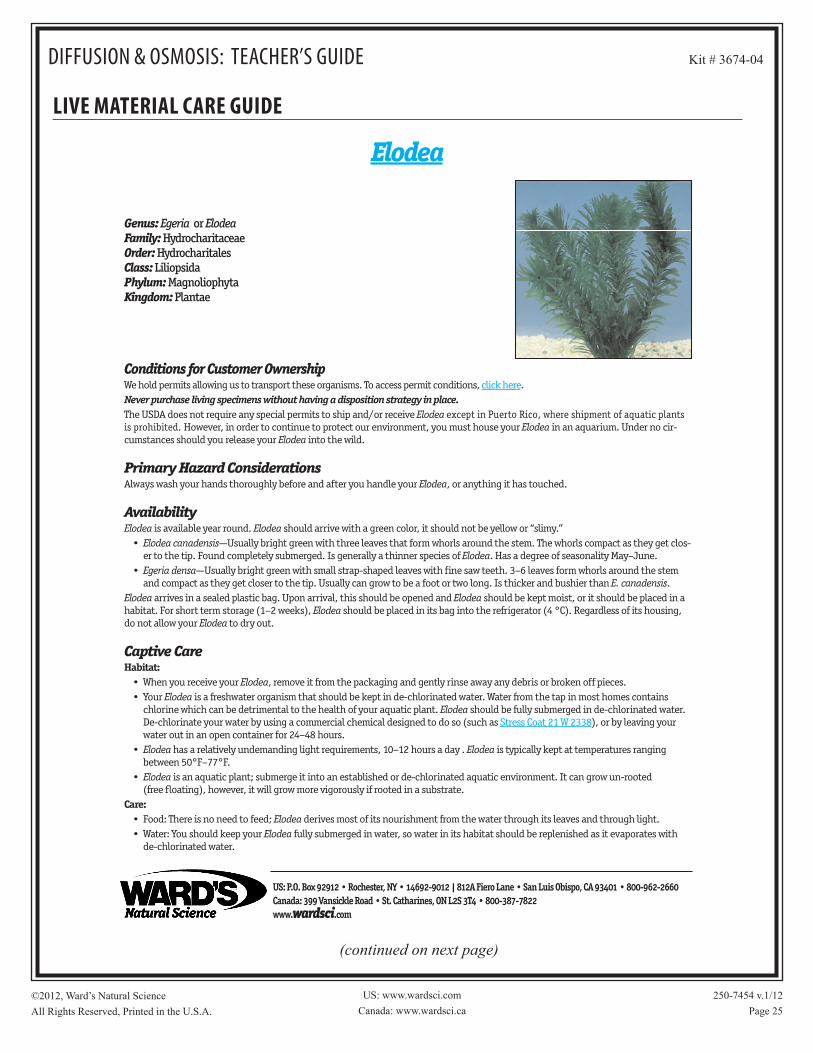
lIve MAterIAl CAre gUIde
US: P.O. Box 92912 • Rochester, NY • 14692-9012 | 812A Fiero Lane • San Luis Obispo, CA 93401 • 800-962-2660Canada: 399 Vansickle Road • St. Catharines, ON L2S 3T4 • 800-387-7822www.wardsci.com
Conditions for Customer Ownership We hold permits allowing us to transport these organisms. To access permit conditions, click here.Never purchase living specimens without having a disposition strategy in place. The USDA does not require any special permits to ship and/or receive Elodea except in Puerto Rico, where shipment of aquatic plantsis prohibited. However, in order to continue to protect our environment, you must house your Elodea in an aquarium. Under no cir-cumstances should you release your Elodea into the wild.
Primary Hazard ConsiderationsAlways wash your hands thoroughly before and after you handle your Elodea, or anything it has touched.
AvailabilityElodea is available year round. Elodea should arrive with a green color, it should not be yellow or “slimy.”
• Elodea canadensis—Usually bright green with three leaves that form whorls around the stem. The whorls compact as they get clos-er to the tip. Found completely submerged. Is generally a thinner species of Elodea. Has a degree of seasonality May–June.
• Egeria densa—Usually bright green with small strap-shaped leaves with fine saw teeth. 3–6 leaves form whorls around the stemand compact as they get closer to the tip. Usually can grow to be a foot or two long. Is thicker and bushier than E. canadensis.
Elodea arrives in a sealed plastic bag. Upon arrival, this should be opened and Elodea should be kept moist, or it should be placed in ahabitat. For short term storage (1–2 weeks), Elodea should be placed in its bag into the refrigerator (4 °C). Regardless of its housing,do not allow your Elodea to dry out.
Captive CareHabitat:
• When you receive your Elodea, remove it from the packaging and gently rinse away any debris or broken off pieces. • Your Elodea is a freshwater organism that should be kept in de-chlorinated water. Water from the tap in most homes contains
chlorine which can be detrimental to the health of your aquatic plant. Elodea should be fully submerged in de-chlorinated water.De-chlorinate your water by using a commercial chemical designed to do so (such as Stress Coat 21 W 2338), or by leaving yourwater out in an open container for 24–48 hours.
• Elodea has a relatively undemanding light requirements, 10–12 hours a day . Elodea is typically kept at temperatures rangingbetween 50°F–77°F.
• Elodea is an aquatic plant; submerge it into an established or de-chlorinated aquatic environment. It can grow un-rooted (free floating), however, it will grow more vigorously if rooted in a substrate.
Care:• Food: There is no need to feed; Elodea derives most of its nourishment from the water through its leaves and through light. • Water: You should keep your Elodea fully submerged in water, so water in its habitat should be replenished as it evaporates with
de-chlorinated water.
Genus: Egeria or ElodeaFamily: HydrocharitaceaeOrder: HydrocharitalesClass: LiliopsidaPhylum: MagnoliophytaKingdom: Plantae
Elodea
(continued on next page)

©2012, Ward’s Natural Science
All Rights Reserved, Printed in the U.S.A.
US: www.wardsci.com
Canada: www.wardsci.ca
250-7454 v.1/12
Page 26
Diffusion & osmosis: Teacher’s GuiDe Kit # 3674-04
lIve MAterIAl CAre gUIde
US: P.O. Box 92912 • Rochester, NY • 14692-9012 | 812A Fiero Lane • San Luis Obispo, CA 93401 • 800-962-2660Canada: 399 Vansickle Road • St. Catharines, ON L2S 3T4 • 800-387-7822www.wardsci.com
© 2008 Ward’s Natural Science Establishment. All rights reserved. Rev. 9/08, 12/09
To Root Elodea:• Place 2–3 inches of gravel on the bottom of the tank.• Work the plants down into the gravel.• Keep the plants secured in place by using small weights (they can be purchased at local pet stores) or stones or other heavy inert
material until they can be secured with their own roots.• The habitat should be cleaned once a month to ensure addition of fresh water into the habitat, and removal of any waste material
that has fallen off the plant.
Information• Method of Reproduction: Elodea does not reproduce sexually (there are no flowers or seeds); instead, there are specialized nodal
regions described as double nodes that occur at intervals along the sprig. Double nodes produce lateral buds, branches, andsprout roots. Only those shoot fragments can develop into new plants.
Wild HabitatElodea is a submerged, freshwater perennial, generally rooted on the bottom in depths of up to 20 feet or drifting. It is found in bothstill and flowing waters, in lakes, ponds, pools, ditches, and quiet streams.
Aquarium Hobbyiest UseElodea works well in many fish tanks. Elodea acts to increase the levels of oxygen in the water. It can also be a food source for differentfish and aquatic snails. The leaves also absorb nutrients from the water that are normally considered a nuisance to other organisms inan aquarium (such as nitrogen).
DispositionDo one of the following:
• Place Elodea in a freezer for 48 hours. • Allow Elodea to “dry out” for 72 hours.• Incinerate Elodea.

aP invesTiGaTion #4: Diffusion & osmosis Teacher’s GuiDe – answer key Kit # 36-7404
©2012, Ward’s Natural Science Establishment All Rights Reserved, Printed in the U.S.A.
250-7454 v.1/12
Page A
dAtA tAblesThis table includes actual data from this lab. Your students’ data will vary somewhat.
ParT 1: cell size & Diffusion
data table 1: Agar CubesCube Size
(cm)Surface Area
(cm2)Volume(cm3)
Surface Area/Volume Ratio
3 54 27 2:12 24 8 3:11 6 1 6:1
data table 2: rate of diffusionCube Size
(cm)Depth of
Diffusion (cm)Time(min.)
Rate of Diffusion(cm/min.)
3 0.4 10 0.042 0.4 10 0.041 0.4 10 0.04
data table 3: extent of diffusion
Total Volume of Cube (cm3)
Volume of Cube which has NOT
Changed Color
Extent of Diffusion(%)
27 10.648 608 1.728 781 0.008 99
ParT 2: moDel cells & osmosis
SolutionDialysis Bag Initial Mass
(g)
Dialysis Bag Final Mass
(g)
Change in Mass (g)
% Change in Mass (g)
Water
1 M Sucrose
1 M Sodium Chloride
1 M Glucose
1 M Egg Albumin
JANET, SHOULD WE KEEP ANY OF THESE TABLES?

aP invesTiGaTion #4: Diffusion & osmosis Teacher’s GuiDe – answer key Kit # 36-7404
©2012, Ward’s Natural Science Establishment All Rights Reserved, Printed in the U.S.A.
250-7454 v.1/12
Page A
dAtA tAbles (continued)
This table includes actual data from this lab. Your students’ data will vary somewhat.
ParT 3: osmosis in livinG PlanT cells
Potato Cylinders
SolutionInitial
Mass (g)Final
Mass (g)Change inMass (g)
% Changein Mass
Water 1.5 2.1 +0.6 +28.6
Mystery Red 1.5 1.6 +0.1 +6.3
Mystery Orange 1.5 1.3 -0.2 -15.4
Mystery Yellow 1.5 1.2 -0.3 -25.0
Mystery Green 1.6 1.1 -0.5 -45.5
Mystery Blue 1.5 0.9 -0.6 -66.7