AP Alternative Assets, L.P. Q2 Results Presentation...
12
AP Alternative Assets, L.P. Q2 Results Presentation – August 8, 2013 It should not be assumed that investments made in the future will be profitable or will equal the performance of investments in this document .
Transcript of AP Alternative Assets, L.P. Q2 Results Presentation...

AP Alternative Assets, L.P. Q2 Results Presentation – August 8, 2013
It should not be assumed that investments made in the future will be profitable or will equal the performance of investments in this document .

1. Summary of Q2 2013 Financial Results
2. Investment Overview
3. Athene Overview
Agenda
1

AP Alternative Assets, L.P. – Q2 2013 Highlights
Note: The past performance of Apollo’s funds is intended to be illustrative of Apollo’s investing experience and not indicative of future results.
NAV per unit at June 30, 2013 was $21.67, up from $21.59 at March 31, 2013
The Investment Partnership had $15.4 million of cash and cash equivalents
at June 30, 2013 and a note receivable from Athene of $51.3 million
Net unrealized gain from investments was $10.6 million and $62.0 million for the three and six months ended June 30, 2013, respectively
2

$0
$500
$1,000
$1,500
$2,000
($ in millions)
Note: The past performance of Apollo’s funds is intended to be illustrative of Apollo’s investing experience and not indicative of future results
$1,681 $(74) $1,654
Private Equity Co-investments: $49
Opportunistic Investment –Athene: $1,617
Cash: $15
Other: $(4)
Net Asset Value as of June 30, 2013
Assets OtherAssets & Liabilities
GP Interest NAVJune 30, 2013
6/30 - Market Cap $1,607 million
(3% discount to NAV)
12/31 - Market Cap $1,187 million
(29% discount to NAV)
3
Note receivable: $51
$47
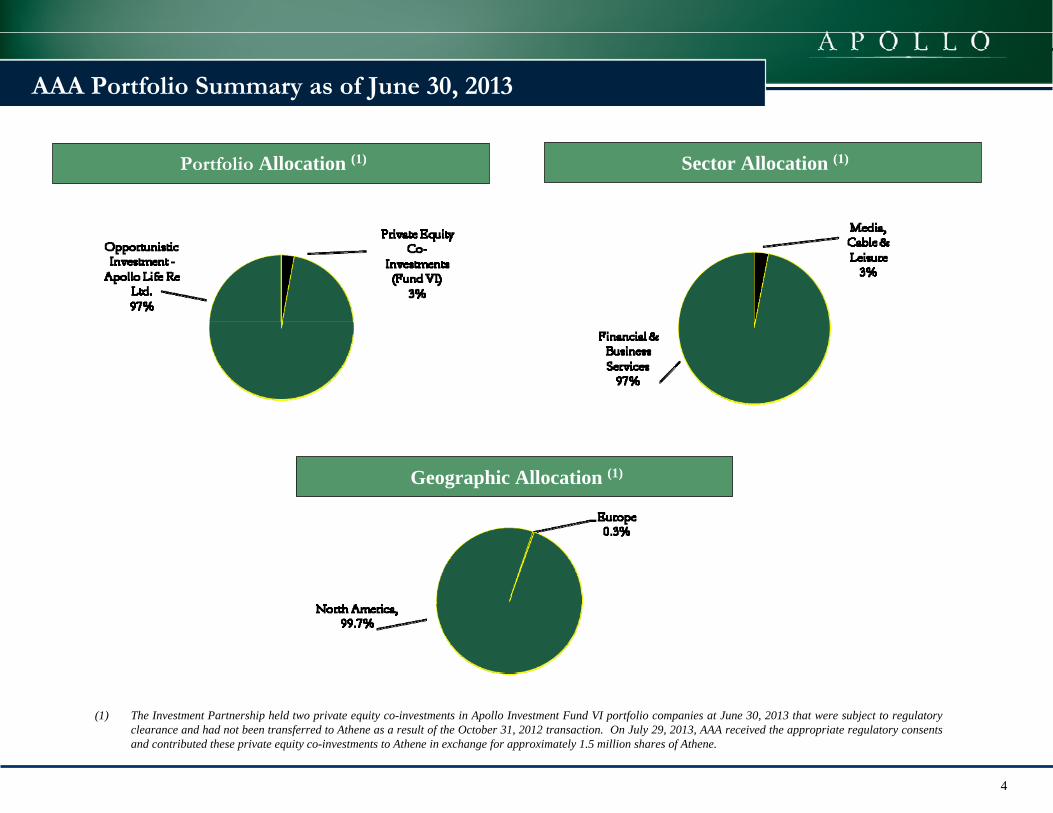
Portfolio Allocation (1)
(1) The Investment Partnership held two private equity co-investments in Apollo Investment Fund VI portfolio companies at June 30, 2013 that were subject to regulatory clearance and had not been transferred to Athene as a result of the October 31, 2012 transaction. On July 29, 2013, AAA received the appropriate regulatory consents and contributed these private equity co-investments to Athene in exchange for approximately 1.5 million shares of Athene.
AAA Portfolio Summary as of June 30, 2013
4
Sector Allocation (1)
Geographic Allocation (1)

AAA: Share Price History
$21.67
$21.05
AAA trades at $21.05 or 0.97x P / NAV as of June 30, 2013
Average DiscountCurrent(1) 6-Month 1-Year 3-Year Life
AAA 0% 13% 22% 38% 39%
While AAA has traded at a discount to NAV since mid-2007, its unit price movements generally track NAV
AAA is currently trading at $21.60 as of July 23, 2013, up by $0.55 from June 30, 2013
(1) As of July 23, 2013.NOTE: Graph reflects daily market price as of June 30, 2013 while NAV is only determined on a monthly basis.
5

$1,648 $0 $(3) $0 $9 $0 $1,654
$0
$300
$600
$900
$1,200
$1,500
$1,800
Q2 2013 NAV Performance
Note: The past performance of Apollo’s funds is intended to be illustrative of Apollo’s investing experience and not indicative of future results.
($ in millions)
Opportunistic Investments – Athene $16
Private Equity Co-Investments (5)
Interest (includes carry) (2)
NAVMarch 31, 2013
Investment income Expenses Net realized gains fromsales/dispositions
Net change in unrealizeddepreciation of
investment in AAAInvestments
Partner Cap.Cont./(Dist.)/Purchase
of AAA Units
NAVJune 30, 2013
NAV per unit at June 30, 2013 was $21.67, up from $21.59 at March 31, 2013
$21.59 NAV/Unit $21.67 NAV/Unit
6

1. Summary of Q2 2013 Financial Results
2. Investment Overview
3. Athene Overview
Agenda
7
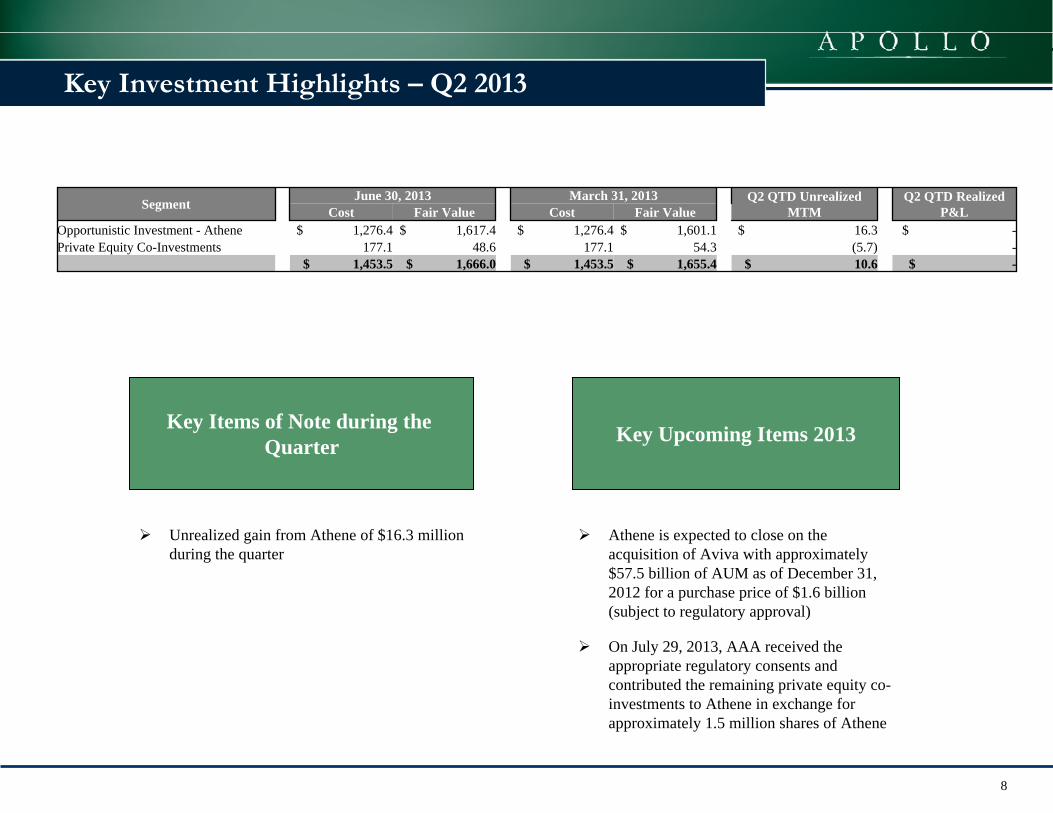
Key Investment Highlights – Q2 2013
Unrealized gain from Athene of $16.3 million during the quarter
Athene is expected to close on the acquisition of Aviva with approximately $57.5 billion of AUM as of December 31, 2012 for a purchase price of $1.6 billion (subject to regulatory approval)
On July 29, 2013, AAA received the appropriate regulatory consents and contributed the remaining private equity co-investments to Athene in exchange for approximately 1.5 million shares of Athene
Key Items of Note during the Quarter Key Upcoming Items 2013
8
$ -$ 10.6 $ 1,655.4 $ 1,453.5 $ 1,666.0 $ 1,453.5 -(5.7)54.3177.148.6177.1Private Equity Co-Investments
$ -$ 16.3 $ 1,601.1 $ 1,276.4 $ 1,617.4 $ 1,276.4 Opportunistic Investment - AtheneFair ValueCostFair ValueCost
Q2 QTD Realized P&L
Q2 QTD Unrealized MTM
March 31, 2013June 30, 2013Segment
1. Summary of Q2 2013 Financial Results
2. Investment Overview
3. Athene Overview
Agenda
9

Athene Overview
Note: The past performance of Apollo’s funds is intended to be illustrative of Apollo’s investing experience and not indicative of future results. 10
ATHENE OVERVIEW

11
For additional information, please visit our website: http://www.apolloalternativeassets.com