AP-50 AUTOMATED PERIMETER - ftpuso.com
118
1434 AP-50 AUTOMATED PERIMETER OPERATION MANUAL (89-90006.02) September 2018 All specifications are subject to changes without notice. FREY S.J. 05-502 Piaseczno ul. Wołodyjowskiego 38 Poland Tel: +48 (22) 397-86-09 E-mail : [email protected] www.freymedical.eu
Transcript of AP-50 AUTOMATED PERIMETER - ftpuso.com

1434
AP-50 AUTOMATED PERIMETER
OPERATION MANUAL
(89-90006.02) September 2018
All specifications are subject to changes without notice.
FREY S.J. 05-502 Piaseczno
ul. Wołodyjowskiego 38 Poland
Tel: +48 (22) 397-86-09 E-mail : [email protected] www.freymedical.eu


AP-50 Automated Perimeter 3
Operation Manual 89-90006.02
TABLE OF CONTENTS 1. INTRODUCTION ........................................................................................ 6 2. SYMBOLS ................................................................................................ 7 3. SYSTEM DESCRIPTION .............................................................................. 8 4. SAFETY PRECAUTIONS ............................................................................. 9 5. TECHNICAL DATA ................................................................................... 12 6. INSTALLATION AND USE .......................................................................... 14
6.1. Package Contents............................................................................... 14 6.2. Configuration ..................................................................................... 14 6.3. System Description ............................................................................. 14
7. TOUCHSCREEN KEYBOARD ..................................................................... 19 8. SYSTEM START-UP AND USER LOGON ...................................................... 20 9. THE MAIN SCREEN OF THE SOFTWARE ..................................................... 22
9.1. Table with Patients’ Data ...................................................................... 23 9.2. Test Results Table .............................................................................. 24 9.3. Test Result Miniature ........................................................................... 25 9.4. Tool Bar ........................................................................................... 26 9.5. Pull-down Menu ................................................................................. 27
10. RECEPTION OF A NEW PATIENT .............................................................. 29 11. EDITING PATIENTS’ DATA ....................................................................... 31 12. ADJUSTING TEST PARAMETERS.............................................................. 32 13. TESTING A PATIENT – STATIC PERIMETRY ................................................ 35
13.1. Use ............................................................................................... 35 13.2. Quick Start of a Test .......................................................................... 35 13.3. Test Screen ..................................................................................... 36 13.4. Patient Data..................................................................................... 36 13.5. Test Course Control ........................................................................... 37 13.6. Eye Preview .................................................................................... 37 13.7. Pupil Measurement ............................................................................ 39 13.8. Information Tabs ............................................................................... 40
13.8.1. Register Parameters .................................................................... 40 13.8.1.1. Box Credibility .......................................................................... 42 13.8.2. Register Test data ....................................................................... 43 13.8.3. Register Description ..................................................................... 44
13.9. Box Progress ................................................................................... 44 13.10. Box Fixation Bar .............................................................................. 44 12.11. Box Blind Spot ................................................................................ 45
14. FIXATION CONTROL .............................................................................. 46 14.1. Fixation Control by Heijl-Krakau Method .................................................. 46 14.2. Digital Fixation Control ........................................................................ 48
15. TEST COURSE ...................................................................................... 49
AP-50 Automated Perimeter 4
Operation Manual 89-90006.02
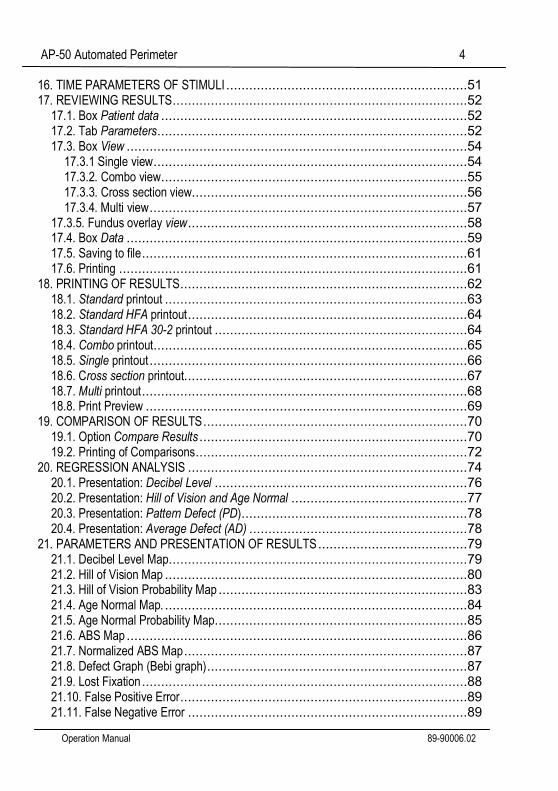
16. TIME PARAMETERS OF STIMULI ...............................................................51 17. REVIEWING RESULTS .............................................................................52
17.1. Box Patient data ................................................................................52 17.2. Tab Parameters .................................................................................52 17.3. Box View .........................................................................................54
17.3.1 Single view ..................................................................................54 17.3.2. Combo view ................................................................................55 17.3.3. Cross section view........................................................................56 17.3.4. Multi view ...................................................................................57
17.3.5. Fundus overlay view .........................................................................58 17.4. Box Data .........................................................................................59 17.5. Saving to file .....................................................................................61 17.6. Printing ...........................................................................................61
18. PRINTING OF RESULTS ...........................................................................62 18.1. Standard printout ...............................................................................63 18.2. Standard HFA printout .........................................................................64 18.3. Standard HFA 30-2 printout ..................................................................64 18.4. Combo printout ..................................................................................65 18.5. Single printout ...................................................................................66 18.6. Cross section printout..........................................................................67 18.7. Multi printout .....................................................................................68 18.8. Print Preview ....................................................................................69
19. COMPARISON OF RESULTS .....................................................................70 19.1. Option Compare Results ......................................................................70 19.2. Printing of Comparisons .......................................................................72
20. REGRESSION ANALYSIS .........................................................................74 20.1. Presentation: Decibel Level ..................................................................76 20.2. Presentation: Hill of Vision and Age Normal ..............................................77 20.3. Presentation: Pattern Defect (PD) ...........................................................78 20.4. Presentation: Average Defect (AD) .........................................................78
21. PARAMETERS AND PRESENTATION OF RESULTS .......................................79 21.1. Decibel Level Map ..............................................................................79 21.2. Hill of Vision Map ...............................................................................80 21.3. Hill of Vision Probability Map .................................................................83 21.4. Age Normal Map. ...............................................................................84 21.5. Age Normal Probability Map ..................................................................85 21.6. ABS Map .........................................................................................86 21.7. Normalized ABS Map ..........................................................................87 21.8. Defect Graph (Bebi graph) ....................................................................87 21.9. Lost Fixation .....................................................................................88 21.10. False Positive Error ...........................................................................89 21.11. False Negative Error .........................................................................89

AP-50 Automated Perimeter 5
Operation Manual 89-90006.02
21.12. Fluctuation ..................................................................................... 90 21.13. Tested – Number of Tested Points ....................................................... 91 21.14. 3 deg. Level ................................................................................... 91 21.15. Slope – Theoretical Slope of a Hill of Vision ............................................ 91 21.16. Zero Level ..................................................................................... 92 21.17. Average ........................................................................................ 92 21.18. Pattern Defect (PD) .......................................................................... 92 21.19. Average Defect (AD) ........................................................................ 93 21.20. GHT – Glaucoma Region Comparison................................................... 93
22. STRATEGIES ........................................................................................ 95 22.1. Screening Strategy ............................................................................ 95 22.2. Fast Threshold Strategy ...................................................................... 96 22.3. Threshold Strategy ............................................................................ 97 22.4. Bi-Driving Strategy............................................................................. 97 22.5. Industrial Medicine Strategy ................................................................. 98 22.6. Industrial Medicine Extended Strategy .................................................... 98
23. STANDARD TESTS................................................................................. 99 23.1. Central 22˚ .................................................................................... 100 23.2. Central 30˚ .................................................................................... 100 23.3. Full .............................................................................................. 100 23.4. Glaucoma ..................................................................................... 100 23.5. Macula ......................................................................................... 100
24. DATA EXPORT / IMPORT ....................................................................... 101 25. SOFTWARE CONFIGURATION AND SETTINGS ......................................... 103
25.1. Register User management ............................................................... 104 25.2. Register Backup service.................................................................... 106 25.3. Register Sounds ............................................................................. 107 25.4. Register Settings............................................................................. 108 25.5. Register Print layout ......................................................................... 110 25.6. Register Simple Menu ...................................................................... 111 24.7. Register Service ............................................................................. 112 25.8. Register Local ................................................................................ 113 25.9. Register Export/Import settings ........................................................... 114
26. MAINTENANCE ................................................................................... 115 26.1. Cleaning ....................................................................................... 115 26.2. Repairs ........................................................................................ 116 26.3. Annual maintenance ........................................................................ 116 25.4. Disposal ....................................................................................... 116
27. WARRANTY ........................................................................................ 117 28. SPARE PARTS .................................................................................... 118

AP-50 Automated Perimeter 6
Operation Manual 89-90006.02
1. INTRODUCTION
This OPERATION MANUAL describes the purpose, overall view and user maintenance of the Automated Perimeters. This manual is intended for medical personnel and engineers who will perform test on patients, and also for qualified people that will use perimeter software to view and examine test results. This instruction provides information concerning cleaning and basic user maintenance that should be very precisely presented to the cleaning and technical personnel of the clinic in order to decrease the probability to harm the equipment. If you have encountered problems when using your Automated Perimeter which you cannot solve, or the Automated Perimeter parameters are changed, please, in all these cases contact the Manufacturer or his authorized representative.
MEDICAL RESPONSIBILITY – The manual does not provide guidance or interpretation of clinical results. The operator must ensure that he or she has received an appropriate medical training in such interpretation. For the same reason, FREY cannot be held responsible for misdiagnosis of results.
The right to repair or set up the Automated Perimeter or to carry out periodical part replacements is reserved only to the Manufacturer or to persons authorized by the Manufacturer.
The Automated Perimeter is to be used only in accordance with this Operation Manual.

AP-50 Automated Perimeter 7
Operation Manual 89-90006.02
2. SYMBOLS
Manufacturer
Date manufacture
Follow Instructions for Use
The CE mark - indicates conformity with the provisions of 93/42/EEC Medical Device Directive
Separate collection of Waste Electrical and Electronic Equipment - Indicates that this device should be disposed of for EU member countries in accordance with Directive 2002/96/EC (WEEE).
Type B Applied Part
Temeperature limit during transportation and storage.
Humidity limitation during transportation and storage.
Atmospheric pressure limitation during transportation and storage.
Warnings – Observe these prescriptions in order to ensure safe operation of the the device and safety of Patients and Operators.
Notes and hints - Useful functions to know. Paying attention to these will prevent the noted problems..

AP-50 Automated Perimeter 8
Operation Manual 89-90006.02
3. SYSTEM DESCRIPTION
The Automated Perimeter AP-50 is a modern diagnostic device for fast and precise testing of a patient's visual field utilizing one of many available test strategies. It enables to define the sensitivity threshold of the retina in a given area, as well as to make a fast screening test. Perimeter software has built-in many internal mechanisms that increase the reliability of the test results. Testing of a patient is performed automatically, and detailed information about the test progress is continuously presented to the operator on the screen. The friendly and easy user interface allows intuitive movement over available options. The user can view and analyse test results in many different presentation methods including regression analysis.
The subject's fixation performance is monitored by one of two possible techniques: One is the Heijl-Krakau technique, with random stimulus presentation in the blind spot region. The second one is based on the built-in digital camera allowing eye-detection during examination and during adjusting the patient's position. Due to auto-detection of the pupil position, it allows a continuous automatic control of the fixation. The patient’s fixation performance is continuously presented to the operator in both cases.
In order to avoid the possibility of uneven ambient lighting falling onto the bowl surface, all overhead lighting must be switched off and field testing be carried out in a dimly lit or completely darkened environment.
Conducting a test in improper lighting conditions may cause systematic errors of the test results due to a lower contrast of the stimulus over the stimulator bowl surface. This will decrease the overall sensitivity of the retina as acquired in the test result.

AP-50 Automated Perimeter 9
Operation Manual 89-90006.02
4. SAFETY PRECAUTIONS
Preparation for transport
Before transport of AP-50 perimeter please remove the chinrest attached magnetically to the perimeter. Leaving this part for transport can cause perimeter damage!
Power connections
Before connecting the power cord to the mains outlet, check that the local voltage and frequency ratings correspond with the ratings of the Automated Perimeter.
Connect the perimeter to a three-wire, grounded receptacle. Do not remove the grounding prong from the power plug.
Use an intact power cord. Replace the cord if it is cracked, frayed, broken or otherwise damaged.
Do not apply tension to the power cord. The cord may get broken.
Do not use extension cords or adapters of any type.
External connection
Do not connect any other external devices to the Automated Perimeter than those specified by manufacturer.
Any external device connected to the Automated Perimeter must comply with relevant safety standards for electrical medical devices, as required by applicable national and/or regional regulations.
Fuses replacement
Replace the fuse with a fuse of the same type and with the same rating.
When replacing fuses, the Automated Perimeter should be disconnected from the mains.
Patient Safety
Do not perform any testing or maintenance of the perimeter while it is being used on a patient.

AP-50 Automated Perimeter 10
Operation Manual 89-90006.02
Cleaning
Switch the power off and unplug the power cord before cleaning or servicing. Get rid of moisture completely before reconnecting to the mains outlet.
Do not use ammonia-, phenol-, or acetone-based cleaners. These cleaners may damage the perimeter surface.
Do not immerse Automated Perimeter in any liquid. Do not allow liquid to enter the perimeter.
Do not sterilize or autoclave the Automated Perimeter.
Installation
Do not put any objects on top of the Automated Perimeter.
Fix the Automated Perimeter securely. If the Automated Perimeter falls down, do not use it because the absence of external damages does not mean there is no damage inside.
Do not expose the Automated Perimeter to direct sunlight.
Do not place near heat source.
Exercise care to locate the Automated Perimeter away from any hazardous sources.
Radiation
This Automated Perimeter emits a certain level of electromagnetic radiation that is within the levels specified by IEC 60601-1-2.
This instrument has been tested against the effects of external interference including high energy frequency emission, magnetic fields and electrostatic discharge (for example large motors, portable radios, cellular phones, etc.).
Excessive interference may affect the Automated Perimeter operation. If it occurs the failure cause shall be removed.

AP-50 Automated Perimeter 11
Operation Manual 89-90006.02
The Manufacturer is responsible for the safety, reliability and performance of the Automated Perimeter only if:
All operations of assembly extensions, adjustment, modification or repairs have been carried out by personel authorized by the Manufacturer.
The electric setting of the room complies with the electric standards.
The instrument is used in compliance with Operation Manual.
The Manufacturer accepts no responsibility for any modifications made to the Automated Perimeter outside the factory!

AP-50 Automated Perimeter 12
Operation Manual 89-90006.02
5. TECHNICAL DATA
Stimulator Bowl Type Part hemispherical Radius 300mm. Integrating diffusing surface.
Visual Field Extent 100˚
Standard Test Fields Field name No. of measurement points
Full 155 points
Glaucoma 22˚/50 ̊ 125 points
Central 30˚ 95 points
Central 22˚ 71 points
Macula 10 ̊ 36 points
Stimulus Source Rear projection LED
Stimulus Color White
Stimulus Size Goldmann size III ( 0,43˚ )
Stimulus Intensity 0.03 asb to 1000 asb in 15 3dB or 45 1dB steps
Exposure Time Adjustable : 0.1 to 9.9s
Response Time Adjustable : 0.1 to 9.9s
Inter Test Delay Adjustable : 0.1 to 9.9s
Background illumination 32asb (10 Cd/m2), automatic level control
Fixation control method Heijl-Krakau – blind spot method
and CCD camera
Fixation Monitor Green 565 nm
Test Lens Diameter 38 mm
Operating Conditions
Ambient Temperature
Relative Humidity
Atmospheric Pressure
+10˚ to +40˚ C
30 to 85 %
700 to 1060 hPa

AP-50 Automated Perimeter 13
Operation Manual 89-90006.02
Transport and Storage
Ambient Temperature
Relative Humidity
Atmospheric Pressure
-10˚ to +40˚ C
30 to 85 %
500 to 1060 hPa
ISM Classification I B
Compliances CE – mark
Expected Lifetime 10 Years
Stimulator Unit Dimensions
W/H/D
548 x 382 x 450 mm
Weight 9 kg
Voltage 115-230 VAC 50/60 Hz
Power consumption Max 35 VA
Fuse Rating 2 x T 630mA
Application Part Patient Chin Rest,
Patient response button

AP-50 Automated Perimeter 14
Operation Manual 89-90006.02
6. INSTALLATION AND USE
6.1. Package Contents
AP-50 Automated Perimeter
Patient response button
Patient response button holder
Power cord
USB cable
Eye cover – 2 pcs.
Spare fuses – 2 pcs.
Operation Manual
Dust cover
6.2. Configuration The AP-50 Automated Perimeter consists of three basic components:
1. Stimulator bowl. 2. PC computer, which controls the stimulator bowl and all test function. 3. PC compatible color printer.
PC compatible computer and printer are not supplied with the AP-50 Automated Perimeter. The Operation Manual does not include information how to prepare or configure PC computer. This information, together with software installation guide is described in separate document called Installation Guide. This document is intended for qualified personnel trained.
6.3. System Description
Stimulator bowl – this is the main component of the device. It should be situated on a motorized table, allowing for fast and easy access and adjustment for patient’s height. The principle for a fast and reliable performance of the examination is a correct and comfortable positioning of a patient. The Stimulator Bowl is equipped with a video camera used for automatic fixation monitoring
Computer PC – this is a device used for controlling the operation of the AP-50 Automated Perimeter and storing test results. The computer must be compatible with the standard PC operating system Windows 7/8/10

AP-50 Automated Perimeter 15
Operation Manual 89-90006.02
PC computer connected to the perimeter must comply with safety standards for electrical medical devices (IEC 60601-1), as required by applicable local or regional regulations.
Printer – required for printing the test results. A high quality color ink jet or laser printer is recommended.
The patient’s response unit (joystick) is connected to the stimulator unit. Always ensure the connector has been plugged firmly.
Communication USB cable is connected to the USB port of the PC Computer. Ensure a proper connection between the stimulator bowl and the computer. The communication cable provided with the AP-50 Automated Perimeter is a standard USB cable.

AP-50 Automated Perimeter 16
Operation Manual 89-90006.02
Front view
Patient’s
response
unit
holder
Lens
holder
Chinrest
Headrest

AP-50 Automated Perimeter 17
Operation Manual 89-90006.02
Rear view

AP-50 Automated Perimeter 18
Operation Manual 89-90006.02
Removable elements: patient chinrests (top: chinrest for binocular tests,
bottom: chinrest for standard tests)

AP-50 Automated Perimeter 19
Operation Manual 89-90006.02
7. TOUCHSCREEN KEYBOARD
The AP-50 software can be used with a mouse, keyboard and conventional monitor or with a touchscreen monitor only. In such case entering data is possible by a touchscreen keyboard (pic. 1)
Pic. 1. Touchscreen keyboard
Touchscreen keyboard appears when any edit control in the software is pressed. Entered data can be accepted by pressing a green acceptance sign or rejected by pressing a red cross.
The buttons << and >> are to move a cursor backward and forward respectively.
Button Del = ‘Delete’ button on a conventional keyboard.
Button Back = ‘Backspace’ button on a conventional keyboard (sometimes denoted as left arrow).
The national letters are available after pressing Alt button.

AP-50 Automated Perimeter 20
Operation Manual 89-90006.02
8. SYSTEM START-UP AND USER LOGON
System start-up:
Turn on the perimeter. The main switch is built into the power entry module located at the rear of perimeter housing. Both the central fixation LED and the bowl illumination light will appear after the unit is turned on.
Turn on monitor and printer.
Wait while the Windows operating system is starting.
If Perimeter.exe shortcut is added to the automatic startup directory, the application will run automatically. Otherwise start the AP-50 program by clicking on the icon located on the desktop.
Your working place is ready to use. A user logon window is displayed on the screen after AP-50 software was launched. When only one user exists in the database, the logon window will not be displayed and the logon process will be skipped. A standard user with administrator rights is created during installation of AP-50 software (user name: ADMIN, password: ADMIN).
Pic. 2. User logon window.
AP-50 Automated Perimeter 21
Operation Manual 89-90006.02
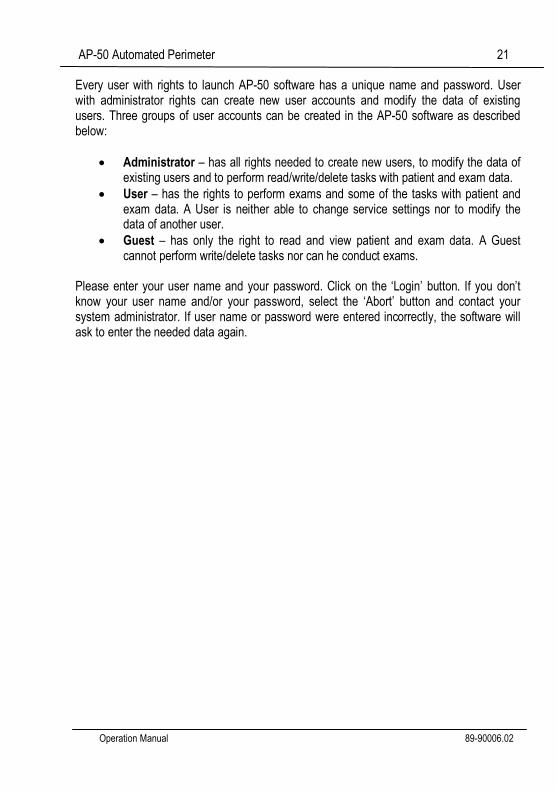
Every user with rights to launch AP-50 software has a unique name and password. User with administrator rights can create new user accounts and modify the data of existing users. Three groups of user accounts can be created in the AP-50 software as described below:
Administrator – has all rights needed to create new users, to modify the data of existing users and to perform read/write/delete tasks with patient and exam data.
User – has the rights to perform exams and some of the tasks with patient and exam data. A User is neither able to change service settings nor to modify the data of another user.
Guest – has only the right to read and view patient and exam data. A Guest cannot perform write/delete tasks nor can he conduct exams.
Please enter your user name and your password. Click on the ‘Login’ button. If you don’t know your user name and/or your password, select the ‘Abort’ button and contact your system administrator. If user name or password were entered incorrectly, the software will ask to enter the needed data again.

AP-50 Automated Perimeter 22
Operation Manual 89-90006.02
9. THE MAIN SCREEN OF THE SOFTWARE
The standard main screen of the AP-50 software is divided into four functional parts: On the right side there is a vertical toolbar with buttons enabling an easy access to available options of the software. Below the toolbar there is a minature of the currently active test results. On the left side of the screen there are two tables. The table in the top part contains patients’ data. The bottom table contains the test results of the active patient. Additionally, in the left top part of the window there are a pull-down menues with access to maintenance and installation options.
a)
Pic. 3. The main screen of the software – a) standard mode, b) simple menu mode.
AP-50 Automated Perimeter 23
Operation Manual 89-90006.02
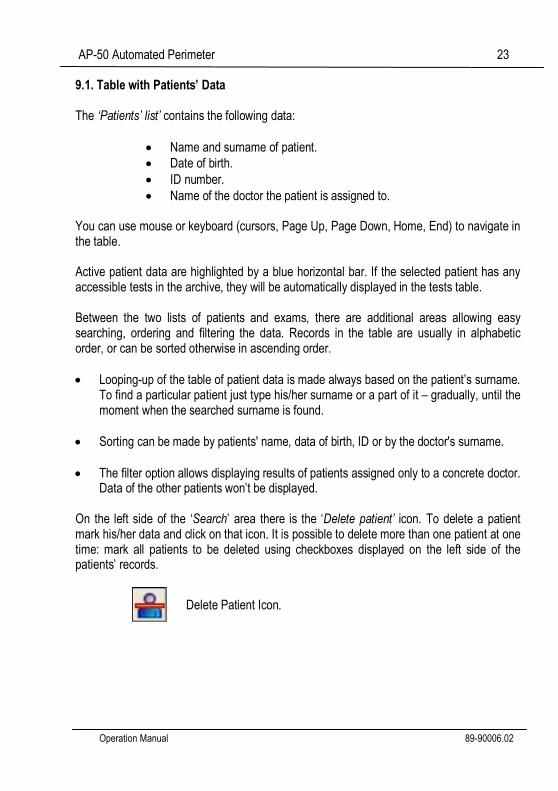
9.1. Table with Patients’ Data The ‘Patients’ list’ contains the following data:
Name and surname of patient.
Date of birth.
ID number.
Name of the doctor the patient is assigned to.
You can use mouse or keyboard (cursors, Page Up, Page Down, Home, End) to navigate in the table. Active patient data are highlighted by a blue horizontal bar. If the selected patient has any accessible tests in the archive, they will be automatically displayed in the tests table. Between the two lists of patients and exams, there are additional areas allowing easy searching, ordering and filtering the data. Records in the table are usually in alphabetic order, or can be sorted otherwise in ascending order.
Looping-up of the table of patient data is made always based on the patient’s surname. To find a particular patient just type his/her surname or a part of it – gradually, until the moment when the searched surname is found.
Sorting can be made by patients' name, data of birth, ID or by the doctor's surname.
The filter option allows displaying results of patients assigned only to a concrete doctor. Data of the other patients won’t be displayed.
On the left side of the ‘Search’ area there is the ‘Delete patient’ icon. To delete a patient mark his/her data and click on that icon. It is possible to delete more than one patient at one time: mark all patients to be deleted using checkboxes displayed on the left side of the patients’ records.
Delete Patient Icon.

AP-50 Automated Perimeter 24
Operation Manual 89-90006.02
On the right side of the ‘Filter’ area there is ‘Refresh database icon’. This option is imporatant when working in a computer network. If patients’ data is modified on another computer, the USER can refresh database to see the changes immediately.
Refresh database icon.
The software will not delete a patient if there is any test available for him/her. Before deleting such a patient you have to delete his/her test results.
9.2. Test Results Table The ‘List of patient’s exams’ contains the following data:
Test date.
Test hour.
Test name.
Name of used test strategy.
Tested eye.
Name of the doctor the patient was assigned to.
Navigation in the tests table is the same as in the patients’ data table. Additionally, clicking on a test result with the right mouse button opens an option allowing to copy the test result to a different place – e.g. to data of another patient. Below the Results Table there is the ‘Delete result’ icon. To remove test results you mark them and click on the icon. In order to reduce the possibility of accidentally deleting of tests results or patient data, the software always asks to confirm data deleting operations. There is no possibility of recovering deleted data if there was no backup performed earlier!
Delete result icon.
User or Administrator rights are required to delete patient results data.

AP-50 Automated Perimeter 25
Operation Manual 89-90006.02
9.3. Test Result Miniature In the right bottom corner of the screen there is a miniature representing a graphic result of the currently active test. There is a possibility of changing the mode of miniature displaying. There are four displaying ways available:
Points scale
Gray scale
Colour scale
3D image
In default settings the grey scale is set. To change the displaying mode, right-click on the miniature zone to open a pop-up menu and then select an option via left mouse-click. While working in the 3D mode, it is possible to turn the picture by simultaneously pressing the left mouse button and moving the cursor on the 3D zone. In other modes, if you move the mouse cursor over the miniature pressing simultaneously the left mouse button, the local decibel value for the displayed zone will be displayed.
Pic. 4. Result miniature

AP-50 Automated Perimeter 26
Operation Manual 89-90006.02
9.4. Tool Bar There are 9 buttons on the Toolbar; each of them is defined with a text description, and an icon represents a symbolic drawing of the performed function. The first button represents the logo of the equipment provider and does not have any function assigned to it. New patient It opens a form to enter data for a new patient. Edit Patient data It opens a form where you can change data of the actually selected patient. The button remains inactive when there are no patients in database. New test Herewith you start a new test. A form opens with parameters for to setting the test scenario. Before selecting this option, you have to make sure that the right patient from the relevant list has been chosen. This option remains inactive if there are no patients in the database.
This option remains inactive if there is no communication between the perimeter and the PC.
Results A window opens to list tests results. There is detailed information about this function in Chapter 15. Compare result The according form enables you to compare two marked results.
The marked results must belong to the same patient; the comparison has to be made for the same eye and field. Tests made with strategies 2 Zone, 3 Zone, Quantify defect, Binocular, Constant and Bi-Driving cannot be compared.
Use checkboxes displayed on the left side of the test result records to mark more than one result. All the marked tests will be highlighted with the light blue horizontal stripe.

AP-50 Automated Perimeter 27
Operation Manual 89-90006.02
Regression analysis It opens a form to list the progress of changes in a patient’s field of view. To be able to make a regression analysis, it is necessary to have at least two results for one eye, both made with the same test. There are more details concerning the regression analysis in Chapter 19.
A regression analysis cannot be made on the base of results of two tests performed on the same day.
Export and Import This button allows to import and export single results, patients’ data or a whole database to an external file. There is detailed information concerning the export and import process in Chapter 23.
9.5. Pull-down Menu
In the left top corner there is a 4 columns pull-down menu.
Pic. 5. Pull-down menu. In the ‘Tools’ menu there are three options to select from:
Service mode – displays tabs for setting many parameters concerning the software.
Advanced service mode – displays tabs for setting hardware parameters of the AP-50 perimeter. Available only after entering service password.

AP-50 Automated Perimeter 28
Operation Manual 89-90006.02
Database info – shows the total number of patients in the database, the total number of exams and the number of exams of a currently selected patient.
There are detailed descriptions of these options in respective chapters (except Advanced service mode described in a service manual). ‘Log-in’ allows to login as a different user. Exit allows to quit the software.
Login of a new user will automatically logout previously logged-in person.
‘Simple menu >>’ switches the screen to the simple menu mode (pic. 3b). Instead of standard main screen the six buttons are displayed on the screen. These buttons allow user to start preselected exam with a predefined settings. For the details please check chapter 24.6. To switch to a standard mode please press ‘Full menu >>’ button.

AP-50 Automated Perimeter 29
Operation Manual 89-90006.02
10. RECEPTION OF A NEW PATIENT
The function allows adding a new patient to the database. After clicking on the ‘New Patient’ button the form of patient reception is displayed.
Boxes marked in green containing patient number and date of reception are filled automatically by the software.
Last name, First name, and Date of birth are mandatory to be inserted, so that the software of perimeter works correctly.
The ‘ID’ box is filled optionally and can remain empty. This box can be used in clinics which use their own internal patients marking system.
The patient's age is calculated automatically according to the Date of birth.
You can set the date format in the Service window (see section 24.8).
Pic. 6. Window of new patient reception.
Entries into the box with the patient’s date of birth have to be the according to the box ‘Entry date’. Otherwise the software will display information about wrongly entered data.

AP-50 Automated Perimeter 30
Operation Manual 89-90006.02
The last three boxes also do not need to be filled. The user can define what kind of information will be stored in them and if they are supposed to be displayed at all. The description of these boxes can be edited through the menu ‘Tools’, option ‘Settings’, group ‘Others’. Information stored in this area can regard i.e.: phone number of patient, his/her address etc. The standard marking of these boxes are three numbers – respectively: 1, 2 and 3. The two lowest text boxes ‘Left eye – description’ and ‘Right eye - description’ allow inserting put medical information – respectively regarding the left and the right eye of the patient. There could be doctor’s remarks or to the medical history of the illness course. Information stored in these boxes is optional and it is not necessary for the correct functioning of the program. Information input in the boxes of this form is saved in the database by clicking on the button ‘Add patient’ which is placed in the bottom part of the screen. The‘Doctor’ box contains name and surname of the doctor whom the patient is assigned to or who sent him/her for the test. This data is placed then on the blueprint in the reading next to the name and surname of person running the test. If data of a doctor we are looking for are absent in the pull-down menu, we can add his/her data by clicking on the doctor icon which will open a menu to add a new user (see Chapter 24.1. Pic. 60).

AP-50 Automated Perimeter 31
Operation Manual 89-90006.02
11. EDITING PATIENTS’ DATA
This function allows editing of data of patients that already exist in the database. Changes can be made for a patient that has been marked as active in the ‘Patients’ table of the main screen of the program. All the data put in earlier are displayed in their boxes of reference. Once information has been changed, it can be stored into the database by clicking on the ‘Apply changes’ button which is in the bottom part of the dialog window. A click on ‘Close’ will end editing of patient data. Clicking on the ‘Close’ button without having clicked on the‘Apply changes’ button before will lead to the main screen of the software without saving any changes.
Pic. 7. Dialog window of patient data editing.

AP-50 Automated Perimeter 32
Operation Manual 89-90006.02
12. ADJUSTING TEST PARAMETERS
A window is opened automatically after choosing the button ‘New test’ on the main screen of the software. The window cannot be opened if there is no communication between PC and the perimeter bowl.
Pic. 8. Window of test parameters choice.
Eye – allows choosing between the left and the right eye.
Test – defines the type of field that will be used during the test.
Strategy –defines with which particular strategy the test process will be running. Details of accessible strategies are described in Chapter 21.

AP-50 Automated Perimeter 33
Operation Manual 89-90006.02
Pupil – box to type in the pupil diameter of the tested eye. There is a possibility of making an automatic measurement of the pupil diameter using the image of the eye as shot by digital camera. Correction – this box accommodates information about correction lenses used by patient, e.g. +3.5 cylinder.
The correction box must be filled if the field used in the test process is larger than 22˚ and the patient is wearing glasses or any other type of correction lenses during the test. In such case the test course is divided in two phases: During the first one, any two points in the scope of 22˚ from the centre are tested and then the software asks to remove the correction lens or glasses in order to test the points which are on the circumference. If you don't fill in the information about correction, the software will test the whole field in one phase and the framed glasses or the correction lens will overcast part of the tested visual field, and it will introduce a significant error into the results of the test.
Fixation control – allows choosing between the automatic fixation control with the camera and the standard method Heijl-Krakau. Fixation control details are described in Chapter 12.
Flicker – defines if the stimulus is supposed to shine constantly or if it is supposed to flicker with a set frequency. If the option Custom selected, the frequency of the flicker is dependend on a position of the stimulus according to the settings in Service Menu.
The option box contains additional five parameters that can be chosen. These are: False positive, False negative, Wide fixation, Fluctuation, Use selected pattern. These options are activated by marking the corresponding box.
Fluctuation option can be activated only if the chosen strategy is Threshold or Fast threshold.

AP-50 Automated Perimeter 34
Operation Manual 89-90006.02
Use selected pattern – is based on the use of previous tests results of the same patient as a model for a new test. Then the software does not make any initial calibration. All the cells of the box have assigned initial brightness levels based on the levels resulting from the test used as the model. If you choose this strategy the test duration is significantly reduced, especially in case of patients with much worse eyesight.
Use selected pattern option is not available in strategies: 2 Zone, 3 Zone, Quantify Defect, Binocular, Contant and Bi-Driving.
Fovea – an option to test a selected cell in the initial stage of an exam. The cell is surrounded by four fixation cells (so called ‘diamond’). The result is used then to calculate the initial dB values of the cells instead of testing the calibration cells.
Fovea option is not available in the strategies where an initial calibration is not necessary.

AP-50 Automated Perimeter 35
Operation Manual 89-90006.02
13. TESTING A PATIENT – STATIC PERIMETRY
13.1. Use This chapter describes the process of testing a patient. 13.2. Quick Start of a Test This chapter is designated to users who are familiar with the Windows system and basic rules of perimeter tests.
1. Start the AP-50 application. 2. Add a new patient with ‘New patient’ or – if the patient has been already added to
the database – select him/her from the patients table.
3. Select ‘New test’ and set test parameters. 4. Make sure the patient is in the correct position.
5. Run the demonstration program in order to get the patient ready for the test and
check operation of the automatic fixation.
6. Start the test.
Automatic fixation measurement can work incorrectly in case of a certain number of patients (about. 5% of total population). In such a case set the standard control of fixation according to the Heijl-Krakau method.

AP-50 Automated Perimeter 36
Operation Manual 89-90006.02
13.3. Test Screen The test screen is divided into many functional blocks. The main part of the form placed on the right side of the screen shows the graphic image of the tested field. It contains many cells and each of them corresponds to a single test point. Four cells marked in yellow, placed on the 10˚ circle, are the calibration points. They are used to define the initial sensibility of the retina for the remaining zones. The cell marked as ‘BS’ represents the blind spot. During the test each of the test points can be checked again, and you can manually assign the brightness level used during the next stimulation of this point. This option is recommended to be used only by advanced users.
Pic. 9. Test screen.
13.4. Patient Data This tab contains information about name, surname and date of birth of the patient. It also informs if the eye which is being tested is the right or the left one.

AP-50 Automated Perimeter 37
Operation Manual 89-90006.02
13.5. Test Course Control In the left bottom part of the window there are buttons which control the test course, Pause, Start, Start/Stop Demo, Remap, End.
Pic. 10. Test course control buttons
– buttons to move the electric chinrest. Start – starts the test. Close – finishes the test at any moment and returns to the main window of the software. If this option is selected before the planned end of the test, the software will display a question if you are sure to close the testing process and if the incomplete results should be saved in database. Pause – clicking on this button will stop the test for a moment. The test will be continued after clicking on ‘Continue’.
The patient can stop the test at any time by pressing continuously the response button. Information about this will be displayed on the screen.
Demo – activates the demonstration working mode. It shows to the patient rules and course of the test. Additionally, the DEMO mode allows checking the correctness of the automatic eye fixation control. Remap – remapping of blind spot placement. It concerns only the working mode according to the Heijl-Krakau method. See more details about this option in Chapter 12. 13.6. Eye Preview

AP-50 Automated Perimeter 38
Operation Manual 89-90006.02
Pic. 11. Eye preview.
The white cross of the camera image indicates the center point on the image. Before the exam is started, patient should be positioned that his/her eye is in the center of the image. If the automatic method of fixation monitoring is used, the software will detect a current position of the eye. There is no need to keep the eye in the center of the image during the test – it is rather important that patient is looking into the fixation point all the time. The perimeter software performs calculations based on the analysis of the two white dots (infrared reflections).

AP-50 Automated Perimeter 39
Operation Manual 89-90006.02
13.7. Pupil Measurement The icon representing schematically an eye (Pic.12) is for measuring the pupil size.
Pic. 12. Manual pupil measurement.
Clicking the blue arrows will change the red circle so that you can adapt it to the pupil size. The red circle is moved with the cursor keys on the keyboard. It is also possible to indicate the pupil centre by moving the white cross with pressed left mouse button. Selecting ‘Finish’, the software saves the measurement results and closes this tab. The result of measurement is presented in millimiters. The value of the bowl illumination is displayed in the brackets (in candelas).

AP-50 Automated Perimeter 40
Operation Manual 89-90006.02
13.8. Information Tabs There are three registers presenting parameters and test course: Parameters, Credibility and Description. 13.8.1. Register Parameters On the tab there are functions that require a constant and quick access all along the test duration. It allows changing the time parameters of stimuli and tracking the test indicators which are critical for the test credibility.
Pic. 13. Parameters tab

AP-50 Automated Perimeter 41
Operation Manual 89-90006.02
The buttons ‘Slow’, ‘Normal’, ‘Fast’ are to be used for a quick change of all the time parameters of the test. The following times are assigned to them:
Slow Duration Time 0.2 s
Response Time 1.1 s
Wait Time 0.6 s
Fluctuation Time 0.6 s Normal Duration Time 0.2 s
Response Time 1.1 s
Wait Time 0.4 s
Fluctuation Time 0.4 s
Fast Duration Time 0.2 s
Response Time 0.8 s
Wait Time 0.4 s
Fluctuation Time 0.3 s
You can modify the time parameters manually by pulling one of the horizontal time bars via mouse. Adaptive – It activates the automatic control of the time parameters. The software will estimate the times of the patient’s reaction speed and it will change the times in such a way as to reduce the test duration, thus making sure that the result credibility does not suffer. Exposition Time – Time of stimulus shining. Response Time – Time during which the perimeter waits for the patient reaction after the stimulus is switched off.
Wait Time – Parameter defining the time flow between two succeeding test cycles. It is counted from the end of the Response Time. After that time the next test cycle will start which means that the next point will light up. Fluctuation time – Random time in the scope between 0 to the set value, by which the Wait Time will be extended.
If the patient presses the button during the delay time, the software will display a message ‘Reaction out of time’. This answer will not be taken into account – it will be omitted. It is a sign for the test operator that it is necessary to extend slightly the time parameters.

AP-50 Automated Perimeter 42
Operation Manual 89-90006.02
Total time – total maximum duration of a single cycle. It takes into account the maximum time of the fluctuation duration. Fixation method - It defines the mode of fixation control. Any change can be implemented only before the test. Any attempt to change the fixation method during the test will make it restart right from the beginning. 13.8.1.1. Box Credibility It contains information concerning measured parameters defining the credibility of the test result. False + Parameter defining the number of false positive errors. False – Parameter defining the number of false negative errors. Fixation loss – Counter of fixation losses by the patient. The information is displayed in the form (number of erroneous reactions) / (number of tries) and is defined in percent with additional text description.
If the parameter Fixation loss goes above 30%, the test must be considered as not reliable.
More detailed information concerning the credibility of tests is described in Chapter 21. Duration – time flow since the beginning of the test.

AP-50 Automated Perimeter 43
Operation Manual 89-90006.02
13.8.2. Register Test data It contains basic information concerning the test which is currently selected.
Pic. 14. Parameters tab.
Test – informs on the type of test field which has been used for test purposes. Strategy – tells the chosen strategy according to which points will be tested. Wide fixation – tells the type of the fixation point – wide or central. Fluctuation – informs if a fluctuation measurement will be made during the test.

AP-50 Automated Perimeter 44
Operation Manual 89-90006.02
Correction – states the type of correction that is used during the test. The correction should be always entered into the test parameters before starting the test with the ‘Start’ button. Otherwise it will not have any influence on the test course. Pupil – Pupil diameter expressed in millimetres. In case of an automatic or manual measurement this box will be filled automatically. If this box was filled manually the software will change the entered value.
Flicker – informs on the flickering frequency of the stimulus. 13.8.3. Register Description It contains a form which allows adding any commentary to the test in running. This form can be filled in also once the test has been finished, e.g. giving a results review. The test description can be printed – see Chapter 17.
13.9. Box Progress A graphic representation of the test progress. Thanks to it a person running the test can estimate how much time is left before the test finishes. 13.10. Box Fixation Bar This tab remains inactive if the fixation control method is the one of Heijl-Krakau. It shows the graph of fixation in time. On the right side of the fixation bar there is a momentary fixation indicator. It changes its height and colour according to the fixation state. Details concerning fixation control are described in Chapter 12.
Pic. 15. Fixation bar box.

AP-50 Automated Perimeter 45
Operation Manual 89-90006.02
12.11. Box Blind Spot It is a graphic representation of the blind spot and it shows which points have been seen by the patient and which ones were used for the fixation control. The ‘-‘ symbol defines the zones that were seen, the ‘X’ the ones that have not been tested yet, the ‘V’ symbols defines the ones that were not seen.
Pic. 16. Blind spot.

AP-50 Automated Perimeter 46
Operation Manual 89-90006.02
14. FIXATION CONTROL
AP Automated Perimeter has two mechanisms of fixation control:
Heijl-Krakau method based on blind spot position control,
method of eye position analysis by means of a video camera image. 14.1. Fixation Control by Heijl-Krakau Method It is a classic fixation control method used in most of the perimeters. It is based on verifying the blind spot position by random stimulation of each of eleven points belonging to it with high brightness during the test. Diodes assigned to the blind spot are respectively in the field from 11˚ to 19˚ from the bowl centre and between parallels 0˚ and the line defining a 15˚ deviation from it. It results from the eye anatomy and from the location of the blind spot on the retina surface. A scheme representing the 11 points of the blind spot is represented in the diagram 17.
Pic. 17. Blind spot.
The blind spot is described with the following symbols: X A point that has not been tested yet. - A point where the answer of the patient was positive. This point is eliminated from
the group of points for the fixation control. V A point with a negative answer by the patient. It will be used again for the fixation
control. During the first phase of the test the placement of the blind spot is checked alternately with four yellow calibration points. In case of a test to define the sensibility of calibration points, the test starts with a check of a total of 11 blind spot points. The software will use only those among the 11 points which were not seen during the first checking phase.

AP-50 Automated Perimeter 47
Operation Manual 89-90006.02
If during the checking phase the patient sees more than 6 of 11 points, the software will display a message about a probably wrong setting of the patient’s position. If this number will grow up to 8 visible points, the software will inform us that the patient’s position has been set wrongly. In both of these cases the ‘Remap’ option will be activated which will re-check the placement of the blind spot after a correction of the patient’s position. The ‘Remap’ option will also remain active during the test if the number of invisible points in the blind spot will drop down below 3. Invisible points of the blind spot are checked during the test alternately with other stimulation points. The frequency of testing blind spot points is defined by the parameter ‘Test expositions per BS exp.’ in the maintenance tab. The standard setting of this parameter is 15. It means that the blind spot will be tested on average once per every 15 standard measurement cycles. When the patient’s position is set correctly the blind spot should contain at least five invisible points, placed in its centre. See field a) on the diagram 18. If this number is lower or the positions of invisible points are moved in the direction of blind spot limits, it means that the patient’s position is incorrect.
a) b) c) d)
Pic. 18. Examples of blind spot (BS) position. Diagram b) represents the BS field image when the patient is positioned too high. Diagrams c) and d) show an extended movement to the left or to the right. The presented examples do not disqualify the test results. It is possible to achieve a high probability of the results even in cases when there is only one invisible point on the BS field. Nevertheless it is important that this point remains invisible during the entire test. The brightness of blind spot stimuli can be set. The recommended level is 3 or 6 dB – see “Tools Service Mode-Settings-BS Brightness”. The test should be repeated if the parameter Fixation loss is bigger than 30% and has a value ‘Bad’.

AP-50 Automated Perimeter 48
Operation Manual 89-90006.02
14.2. Digital Fixation Control It is based on the analysis of a video camera image. The pupil is found in the image, and its centre is marked due to complex algorithms. Then the pupil position is constantly monitored during the test. When this fixation method is used, the blind spot region is not tested at all. The advantage of digital analysis is the possibility of rejecting patient’s answers given while there is no fixation. Besides, the fixation is checked during the exposure of all the test points, and not only randomly.
Pic. 19. Eye preview.
In the bottom part of the test screen there is a tab of the fixation toolbar. The graph of the fixation level in the time flow is drawn on it. On the left side of the toolbar there is an indicator of the momentary fixation factor. This bar can appear in three possible colours:
Black, if it is not possible to define the fixation level (eye closed etc.)
Red, if the fixation loss is high
Green, when the fixation level is correct
The height of the bar shows the actual fixation level. If the program is not able to find the pupil in the image (closed eye, blink, wrong lighting), the momentary fixation bar goes up towards the maximum height. On the fixation graph it will be marked by a black line going from the bottom to the centre of the graph.Colour and height of the momentary bar are moved on the horizontal fixation graph after the end of each measurement cycle. Points with which the fixation has been set are drawn from the centre to the top up to the height resulting from the fixation level.
Digital fixation does not work if the room is not dark enough.

AP-50 Automated Perimeter 49
Operation Manual 89-90006.02
15. TEST COURSE
According to the type of the test’s initial settings, its first phase can have different courses. If the strategy chosen is Industrial Medicine, Bi-Driving or User-selected pattern the software will not make an initial calibration of four yellow points. If one of the three first mentioned strategies is applied the program assumes the initial values for all the points of the zone being on the level resulting from the age norm. Using a pattern, the initial values for the points are taken from the pattern field. In such a case the first phase of the test will be composed of blind spot control, if the chosen fixation method was the one according to Heijl-Krakau. In case of digital fixation the BS point will not be tested, the software will go automatically to the second phase of the test. In all other cases the first phase of the test will be the definition of the calibration points’ sensitivity level. It will be done alternately with blind spot testing in case of choosing the fixation method of Heijl-Krakau. In case of digital fixation, the BS point will not be tested. After testing the calibration points the zone will be filled with respective values and the test will go to the second phase.
If the test is made with the ‘Screening’ strategy, and the defined level of sensitivity for four calibration points will be too low in reference to the age norm, the software will display a message about calibration error. The user will have to select manually a new calibration level for calibration cells or to continue with the measured values.
The second phase of the test goes according to the strategy and the chosen parameters for the test credibility. The points are tested in a random order. The cell corresponding to the point being tested is highlighted in green during the exposition time. The points which were not tested yet are marked with a light brown text. The initial dB value of a point being tested is equal to a value shown in a corresponding cell. If there is no answer to the stimulus the cell description changes its colour to red. The positive answer is green. The point already tested is marked by a text in blue.

AP-50 Automated Perimeter 50
Operation Manual 89-90006.02
Between the standard exposures of test points the software makes special cycles. It includes the control of false positive and false negative errors, fluctuations and control of the blind spot (in case of Heijl-Krakau fixation). Information about making a special cycle is displayed in the left top corner of the tested field. You can manually change the dB level of the point which will be tested during the test. It is also possible to verify once again already tested points.
Pic. 20. Retest options.
A right mouse click on any cell of the field opens a list of available options. The function ‘Retest’ activates a retest of the selected cell. Testing will be started from the level assigned to the cell at the beginning of the test. A left mouse click on one of the dB values of the pop-up menu assigns the level to the marked cell on which it will be tested by the next exposition. The function ‘Show full field’ shows all cells that do not count into the field being currently tested. Right clicking on an inactive (gray) cell and selecting then Add to field option allows user to activate it.
In case of working with a correction lens when the test is divided in two phases or in case of Driving Test, you can modify only the cells of the part of the field that is being tested currently.
Changing the brightness levels in an unreasonable way can result in errors of the test results. It is recommended that this option is used only by advanced users.

AP-50 Automated Perimeter 51
Operation Manual 89-90006.02
16. TIME PARAMETERS OF STIMULI
Each test cycle can be considered as a summation of four time segments:
Exposition time
Response time
Wait time
Fluctuation time
Stimulus presented Waiting for an
answer
Delay between stimuli
Cycle duration
Pic. 21. Scheme of a single test cycle.
Exposition time – duration of a presented stimulus. The duration range can be set from 0.1 s to 9.9 s with 0.1 s accuracy. Response time –time until the response from a patient after the stimulus is turned off. The response time range can be set from 0.1 s to 9.9 s with 0.1 s accuracy. Wait time – time between stimuli are visible. Wait time is defined as the time between the end of one cycle (when the patient’s button is released or the response time is over) and the beginning of the next cycle.
Fluctuation time – this parameter introduces a random delay between consecutive test cycles. So, Wait time can vary as presented below: min: Wait time + 0 s to max: Wait time + Fluctuation time.
Fluctuation parameters decrease the monotony of a test by introducing a random factor.

AP-50 Automated Perimeter 52
Operation Manual 89-90006.02
17. REVIEWING RESULTS
The ‘Results’ screen is divided into functional group boxes. The detailed descriptions of the group boxes are provided in the present section.
Pic. 22. Results screen.
17.1. Box Patient data ‘Patient data’ box is located in the left top part of the screen. The patient’s name and age are listed in this box. 17.2. Tab Parameters ‘Parameters’ tab contains all input parameters of the conducted test.
Test type – name of the test
Strategy – strategy of the test
Correction – details of the applied correction
Eye – tested eye (left or right).
Wide fix. – so called wide fixation points were used or not.
Pupil – diameter of the patient’s pupil (measured or entered manually). This field can be empty if the pupil diameter was not measured.

AP-50 Automated Perimeter 53
Operation Manual 89-90006.02
Flicker – a flickering stimulus was used or not.
Stimulus – color and size of stimulus
Background – intensity of background illumination in cd/m²
Fovea – dB value of a fovea point (if tested)
Date – date of exam
Start – start time of exam
Duration – total time of exam
False + - number of false positive responses.
False – - number of false negative responses.
Tested – ratio of number of tested points to number of expositions.
Fluctuation – fluctuation of patient’s responses during test
Fixation lost – number of lost fixation during test.
Slope – calculated slope of patient’s hill of vision.
3 deg. lev – level of hill of vision up to 3 deg. from the centre.
Zero level – most common value in the field
Average – dB average value of the field
PD – pattern defect.
AD – average defect.
GHT – zone comparison. Detailed information about the parameters mentioned above can be found in section 21. A description of the finished exam is placed at the left bottom of the screen. This description can be modified at will and the changes will be saved in the database even after the test is finished. If Heijl-Krakau fixation control was used during the test, a blind-spot scheme with 11 fields will be drawn in the right bottom of the presentation. When the test was conducted using digital fixation control, then the fixation data will be visible at the bottom of the screen. The fixation bar is drawn also on the printout. Red lines indicate a bad fixation, green lines a good fixation. Black lines indicate the moments when it was impossible to detect a fixation level, for example due to closed eyes or not proper illumination of the room etc.

AP-50 Automated Perimeter 54
Operation Manual 89-90006.02
17.3. Box View 17.3.1 Single view A single graphical map of the current exam is displayed on the screen.
Pic. 23. Single view.
If the exam results are drawn in 2D scale (pict. b, c, d), an appropriate scale is drawn on the left part of the presentation. The scale is not present when working with a numerical map. Horizontal and vertical axes are drawn on the graphical map with a degree ruler. Axes are not visible when a dB numerical map is displayed.
AP-50 Automated Perimeter 55
Operation Manual 89-90006.02
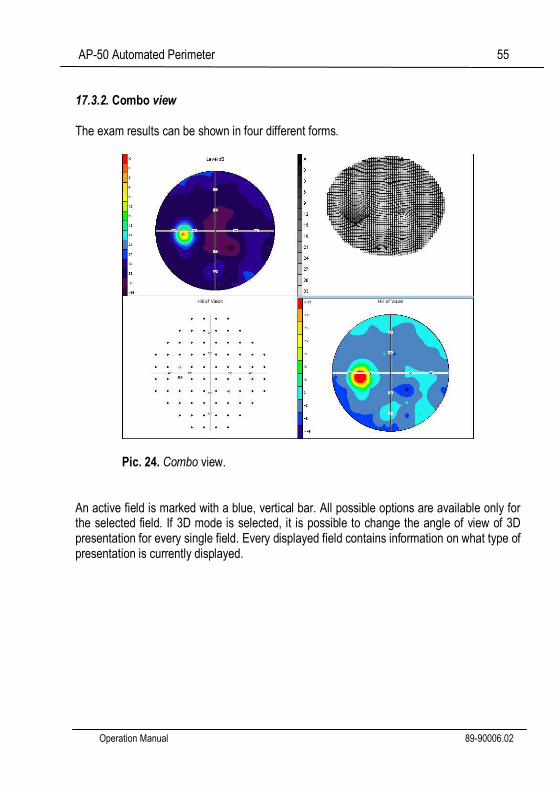
17.3.2. Combo view The exam results can be shown in four different forms.
Pic. 24. Combo view.
An active field is marked with a blue, vertical bar. All possible options are available only for the selected field. If 3D mode is selected, it is possible to change the angle of view of 3D presentation for every single field. Every displayed field contains information on what type of presentation is currently displayed.

AP-50 Automated Perimeter 56
Operation Manual 89-90006.02
17.3.3. Cross section view A ‘Cross section view’ displays a graphical map in one of the selected modes. Additionally, a cross-section by the selected angle through the field is shown at the bottom.
Pic. 25. Cross section view.
The cross section angle can be modified using the buttons located on the left top of the screen. The section angle value is displayed on the image. The cross section line as well as the cross section graph below is drawn using two different colours (red and blue) to distinguish between two different parts of the field. The following presentations cannot be displayed when “Cross section view” is selected: HoV probability, AN probability, ABS, Normalized, Bebi graph. The exams conducted using Industrial Medicine and Bi-Driving strategies cannot be displayed in the cross section view, too.

AP-50 Automated Perimeter 57
Operation Manual 89-90006.02
17.3.4. Multi view ‘Multi view’ allows displaying up to four different exams of the same patient. All exam results are presented in the same format (Mode and Data settings are applicable to all four exams). The presentation design is like in ‘Combo view’. All parameters displayed on the right part of the screen correspond to the selected exam which is marked with a blue vertical bar.
Pic. 26. Multi view.
‘Multi view’ is an appropriate option to see patient’s results gathered by using different test fields and strategies.

AP-50 Automated Perimeter 58
Operation Manual 89-90006.02
17.3.5. Fundus overlay view The Automated Perimeter software allows user to overlay the exam results with the fundus images taken by a fundus camera. To get the overlay, after selection the option Fundus Overlay, load the fundus image from file or select the image on the already saved images. Next step is a selection of two orientation points which are used for calculation of positions of the exam results. These points are a fovea and a blind spot. Press the button Mark fovea and click the fovea position on the fundus image. Next, press the button Mark blind spot and click the blind spot position on the fundus image. The exam results are now displayed on the fundus image. Overlay can be saved using option Save overlay.

AP-50 Automated Perimeter 59
Operation Manual 89-90006.02
17.4. Box Data ‘Data group box’ allows selecting data which will be presented on the screen. The following options are available:
Decibel level
HoV – Hill of vision
AN – Age normal deviation
HoV pro – Hill of vision probability
AN pro – Age normal probability
ABS – so called absolute map, generated by dividing of all field values (in dB) by 3
Normalized – normalized map.
Defect curve (Bebi graph)
Age Normal Standard Level [dB] – the retina sensitivity is presented in the form of dB values. All dB values represent the brightness of the stimuli when the patient’s responses were detected. The higher the dB value, the lower the brightness of the stimulus when the patient’s reaction was detected. All points not seen by patient are denoted as ‘X’ mark. The level map can display the values from 0dB to 45dB in 1dB steps which is dependent on the test strategy. HoV [dB] – presents differences (in dB) between test results and the theoretical hill of vision as calculated by the program. The method of calculating the theoretical hill of vision is described in section 21. The values presented by the HoV display can be positive or negative since this kind of presentation is a differential map. The positive values indicate better results than those obtained from a theoretical hill of vision; the negative ones indicate worse results. All negative values as well as points not seen by the patient are displayed using red colour.
HoV (Probability) – displays the probabilities of defects in the field of view. Probability is obtained from dB HoV values. The HoV probability map is a different type of presentation of the HoV dB map.
Age normal – a map presenting differences in dB between exam results and so called age normal values for patients of a certain age range. Age normal (Probability) – displays the probabilities of defects in the field of view. Probability is obtained from dB Age normal values.
ABS – a map displaying so called absolute values in numerical format only, generated by division of all field values (in dB) by 3

AP-50 Automated Perimeter 60
Operation Manual 89-90006.02
Normalized – a map obtained by subtracting Zero level values from ABS values for the corresponding points. All negative values are displayed in red, all positive ones in black. Defect curve (Bebi graph) – a general graph presenting summarized amounts of defects in a field. The defect curve is calculated from the age normal values. Age Normal Standard – a numerical map presenting an age norm dB values appropriate for patient’s age The exam results are presented on the right part of the screen according to the current settings which can be changed using two groups of buttons. The first group of buttons titled ‘View’ is to select a style of presentation as follows:
Single – single map
Combo – four different presentations of the same field
Cross section – single field with an additional cross section
Multi view – simultaneous view of four different exams of the same patient
Exam results can be presented using one of the following settings available by pressing button > on the right of the Level, HoV and Age Norm buttons (pic. 27):
Level in dB a)
Gray scale b)
Color scale c)
Pattern scale d)
Color 3D e)
Gray scale 3D f)

AP-50 Automated Perimeter 61
Operation Manual 89-90006.02
a)
b)
c)
d)
e)
f)
Pic. 27. Available presentations.
When Industrial Medicine or Bi-Driving is reviewed only Level view can be selected.
If the exam results are drawn in 2D scales (Pic. b), c), d), an appropriate scale is drawn on the left part of the presentation. The scale is not present when working with a numerical map.
Horizontal and vertical axes are drawn on the graphical map with a degree ruler. Axes are not visible when a dB numerical map is displayed.
In case of 3D presentation the field height is proportional to the value of the point in dB. The bigger the dB value, the higher the elevation of the point on Z axis.
17.5. Saving to file The software allows saving a map being currently displayed on the screen to an external file (in ‘.BMP’ or ‘.JPG’ format). Click the ‘Save as image’ button and enter the name of the file when the file dialog box is open. 17.6. Printing All details are described in section 18.

AP-50 Automated Perimeter 62
Operation Manual 89-90006.02
18. PRINTING OF RESULTS
In order to print the results of an exam, select an appropriate exam and click on the ‘Results’ button. A form will be shown containing detailed exam data. Click on the ‘Print’ button at the bottom of the form to open a window with print settings.
Pic.28. Print settings.
It is highly recommended to use high quality colour inkjet or colour laser printers.
Type of print - to select which type of exam presentation will be printed. Five types of printouts are available (Standard, Combo, Single, Cross section and Multiview). Print preview – to open a window to display the page which is to be printed. Print setup – to open a window with advanced printer settings. Print – to print results in one of the selected print types. Print description – to print an additional page with a description of the exam.

AP-50 Automated Perimeter 63
Operation Manual 89-90006.02
18.1. Standard printout The most common used type of print. It contains six graphic maps and all information needed to analyse exam data. The following information is presented in the top-left part of print: manufacturer logo and software version. Name of clinic, date of print, examiner data and doctor’s name are located on the right.
Pic. 29. Standard printout.
They grey bar on top contains patient data: name, date of birth and age when exam was performed.

AP-50 Automated Perimeter 64
Operation Manual 89-90006.02
Below the bar the following exam parameters are printed:
Date and time of exam.
Test type: name of field being tested
Strategy used to perform exam.
Correction (if used).
Diameter of pupil (if measured).
If wide fixation was in use.
If flicker stimulus was in use.
Value of fovea in dB (if tested)
Stimulus color and size
Intenisity of background illumination The result of an examination is presented in different graphical forms. The program allows configuring all details of the standard print. You can set the type of six graphical maps representing exam results. The configuration of print is described in section 24.6. The standard print contains the following maps by default:
dB Level (values).
dB Level (pattern scale).
Hill of Vision (dB values).
Age Normal Deviation (dB values).
Hill of Vision – probability.
Age Normal Deviation – probability. Additionally, Bebi graph and Blind Spot image are shown on the right part of the page.
All exam parameters calculated by the program after testing is finished are located on the bottom of the page.
If you select the option ‘Print description’ two pages will be printed. The second page will contain a description of performed as you previously had entered.
18.2. Standard HFA printout It contains six maps according to a HFA standard printout for threshold strategies. 18.3. Standard HFA 30-2 printout It contains six maps according to a HFA standard printout for threshold strategies. Points of the original test field are extrapolated to the HFA 30-2 field.

AP-50 Automated Perimeter 65
Operation Manual 89-90006.02
18.4. Combo printout Four different graphical maps representing exam result are printed. Header and foot data is identical as in Standard print. The advantage of this type of print is to get bigger and more readable graphical maps. You can configure ‘Combo printout’ according to personal preferences.
Pic. 30. Combo printout.

AP-50 Automated Perimeter 66
Operation Manual 89-90006.02
18.5. Single printout The simplest form of print which contains one big graphical map representing the exam results. These will be printed in the same form as chosen on the ‘Results’ screen in ‘Single mode’. When ‘Single mode’ is not selected, the dB level map in grey scale will be printed by default. The advantage of the ‘Single printout’ option is a very high readability of the print.
Pic. 31. Single printout.

AP-50 Automated Perimeter 67
Operation Manual 89-90006.02
18.6. Cross section printout
A ‘Cross section’ printout contains one big graphical map and its section. The section line as well as the section graph below is drawn in red and blue colour. This helps to refer certain parts of the section to a corresponding part of the graph. Graphical map and section angle are always presented in the same form as selected by the user on the ‘Results’ screen in ‘Cross-section mode’.
Pic. 32. Cross section printout.
By default, the dB level map is printed in grey scale with cross section angle at 0˚ (section along the vertical axis Y).

AP-50 Automated Perimeter 68
Operation Manual 89-90006.02
18.7. Multi printout A ‘Multi printout’ can contain up to four different exams of the same patient. Every exam is presented in four different forms. Therefore, a ‘Multi print’ can contain 16 graphical maps maximally. The program allows configuring ‘Multi print’ as described in section 24.6.
Pic. 33. Multi printout
Due to the limited print area, the sizes of the graphical maps are as small as possible. However, ‘Multi printout’ shows most of the parameters (input, calculated and referring to reliability) needed to analyse every exam result.

AP-50 Automated Perimeter 69
Operation Manual 89-90006.02
18.8. Print Preview The ’Print preview’ option allows seeing a printout on the screen before being actually printed.
Pic. 34. Print preview – available options. Preview images can be exported to external files in JPG or BMP format. It is recommended to use high magnification (150%) in order to obtain a good quality of the exported image.

AP-50 Automated Perimeter 70
Operation Manual 89-90006.02
19. COMPARISON OF RESULTS
This section describes how to compare different exam results and how to print a comparison of results. 19.1. Option Compare Results This option allows showing a graphical map representing a comparison of results of two different exams. In order to obtain comparison, select two appropriate exam results in the table ‘Exams’ on the main screen and click on the button ‘Compare Results’. A window containing the comparison of those results will be shown as presented below.
Pic.35. Comparison of results screen.
The name of the patient whose results are being compared is listed at the top of the screen as well as test type and eye.
A comparison can be shown only for two exams of the same patient. The following parameters of exams must be identical: Test type, Strategy, Eye.

AP-50 Automated Perimeter 71
Operation Manual 89-90006.02
Two graphical maps are shown at the top of the screen and they refer to exams taken for comparison. The left map is denoted as A, the right one as B. On the left, parameters referring to the selected exams are listed (date of exam, patient’s age when test was performed, reliability parameters and calculated parameters like PD and AD). A big graphical map with the comparison of results is located on the bottom. The comparison is a difference between decibel values of the corresponding points of the two exams. If the option A-B in the group box ‘Settings’ is selected, the result will be the difference between exams A and B, otherwise the result will be the difference between exams B and A. You can also change the parameter ‘Visible difference threshold’ which sets a level from which the difference can be seen on the comparison map. This parameter can be changed from 0dB up to 12dB in 3dB steps. For example, if ‘Visible difference threshold’ = 3dB, then differences between two exams within the range from -3dB to 3dB will be presented as 0dB difference on the comparison map, so they will not be visible. Four buttons located under the graphical map are to select an appropriate displaying mode as follows:
Decibel scale
Grey scale
Colour scale
Pattern scale All three graphical maps (exams and comparison) are drawn in the same mode. In case of using ‘Decibel scale’, a comparison map can contain fields with blue dots (), black (+NdB) and red (-NdB) numerical values. A blue dot denotes that there is no difference between two fields in this point. Red values indicate that a result of exam A in a certain point is worse than the result of exam B in the same point. Values given in dB describe a numerical difference between two results. Respectively, black values indicate that a result of exam A in some point is better than that of exam B.
Please note that setting a relatively high value of the parameter ‘Visible difference threshold’ can lead to a situation when some points with a big dB difference will be seen as points with 0dB difference. This option should be used by advanced users only.
The differences are shown using an appropriate scale which is drawn also on the right part of the comparison when selecting the grey, colour or pattern scale option.
The buttons for print preview, print and saving images are located at the bottom of the screen.

AP-50 Automated Perimeter 72
Operation Manual 89-90006.02
19.2. Printing of Comparisons Print preview – to display the page which is to be printed out. Two graphical maps corresponding to exam A and exam B and a comparison map are drawn using the same style as the maps drawn on the screen.
Pic.36. Print preview – comparison.

AP-50 Automated Perimeter 73
Operation Manual 89-90006.02
A bar with additional options is located at the bottom of the print preview window.
Pic 37. Print preview – options. Print – to print out the comparison on a printer Print setup – to configure advanced printer settings Scale – to scale the print preview on the screen (does not affect the layout of a printout). If the print preview is saved as a JPG or BMP, it is recommended to use high magnification (150%) in order to obtain a good quality of the exported image (see paragraph below). Please note: the higher the magnification, the bigger the file to be saved. Save as Image – the preview image can be exported to an external file in JPG or BMP format. These options are very convenient for users who have to send the result of an exam via Internet for consultation. The recipient can print such file on a printer or display it on a screen.

AP-50 Automated Perimeter 74
Operation Manual 89-90006.02
20. REGRESSION ANALYSIS
AP-50 software is equipped with a set of options to observe changes of a patient’s vision in many different ways. A first possibility is the simple comparison of results which was described in the previous section. A second possibility, much more advanced, is regression analysis which helps to observe regression or progression of patient’s vision in time.
At least two patient’s exam results are needed to perform regression analysis. The exams should be conducted using the same strategy, but on different days.
The patient’s name, age and tested eye are listed on the left top part of the screen. A combo box located on the middle top part of the screen lets choose one of five parameters that will be used to calculate and to display the regression graph. The following parameters can be selected:
Decibel level
Hill of Vision decibel level
Age Normal Deviation decibel level
Pattern defect (PD)
Average defect (AD) The combo box is available when ‘Single mode’ is selected (on the right bottom of the screen). ‘Combo mode’ displays all five modes of regression graphs together.
Rys.38. Regression analysis - ‘Single’ graph and ‘Combo’ graph

AP-50 Automated Perimeter 75
Operation Manual 89-90006.02
The buttons located on the right top part of the screen are to define which region of a tested field will be taken for analysis. The following regions can be used to calculate regressions:
Full Depended on field type
Macula 1˚ -10 ˚
Central 1˚-22˚
Peripheral 30˚-50˚
Right top quadrant Depended on field type
Right bottom quadrant Depended on field type
Left top quadrant Depended on field type
Left bottom quadrant Depended on field type
Regression analysis is always calculated for a full field in case of PD and AD parameters.
‘Combo’ mode contains two graphs representing decibel levels. The first one is always calculated for a full field, the second one for a region of the field selected as described above. Three buttons are located at the bottom of the screen and their functions are as follows: print of regression presentation, print preview, save as image. Save as image – to save a current presentation to an external file in ‘.JPG’ or ‘.BMP’ graphic format. Print – to print a presentation by a printer. Before printing is executed, a window to configure print parameters appears. Print modes (Combo or Single) correspond to the mode of presentation on the screen. Print preview – to preview a printout on the screen. You can also save a preview as an external image file JPG, BMP or in HTML format.

AP-50 Automated Perimeter 76
Operation Manual 89-90006.02
20.1. Presentation: Decibel Level The horizontal axis represents a time scale. Every single graph on the presentation is marked with a corresponding date of exam. Graphs are drawn in chronological order from left to right. The vertical axis has a dB ruler. The width of graph for a certain dB elevation refers to a number of points (in the patient’s field of view) with this dB value. All points not seen by the patient (‘X’) are denoted as red areas on the graph. Blue areas correspond to the points seen by the patient. Yellow lines denote average dB field values. Example: The first graph taken from picture 40 shows that the patient’s field of view contains the biggest number of the points not seen by the patient (‘X’). There are no values 0dB and 3dB in the field, but there are points with values between 3dB and 24dB. An average value for the field is 6dB. The third graph contains a small number of points not seen by the patient. Most of the values are between 6dB and 21dB and therefore an average for this field is 15dB.
Pic.39. Regression presentation – dB level. A green sloping line going across all graphs indicates a trend of average dB values of the fields taken into consideration. A line going up from left to right suggests that the patient’s vision progressed in time. Respectively, a line going down from left to right suggests a regression of the patient’s field of view.

AP-50 Automated Perimeter 77
Operation Manual 89-90006.02
In case of threshold tests results are gathered with 1dB steps. When regression is displayed, all points with decibel values not being divisible by 3 will be grouped with points divisible by 3. For example, 1dB point will be grouped with all 0dB points and points with 2dB and 4dB values will be grouped with 3dB points. 20.2. Presentation: Hill of Vision and Age Normal The presentations are very similar in form to ‘Decibel level’ presentations described in the previous section. Graphs’ Widths don’t correspond to the number of points with a dB value, but to the calculated ‘Hill of Vision’ or ‘Age Normal Deviation’ values respectively. The vertical dB scale ranges from –25dB to 5dB, because Hill of Vision and Age Normal results can reach both minus and plus values. All points with values below –25dB and over 5dB are regarded as points –25dB and 5dB. Pic. 41 shows Hill of Vision regression presentation.
Pic.40. Regression presentation – Hill of Vision.
A green sloping line going across all graphs indicates a trend of average dB values of the fields taken into consideration. A line going up from left to right suggests that the patient’s vision progressed in time. Respectively, a line going down from left to right suggests a regression of the patient’s field of view.

AP-50 Automated Perimeter 78
Operation Manual 89-90006.02
20.3. Presentation: Pattern Defect (PD) A pattern defect regression graph is a set of points with different elevations drawn along the time axis. Every point of the graph represents Pattern Defect parameters of a corresponding exam. The elevation of a point is depending on Pattern Defect values. A blue horizontal line indicates the 95% probability level of PD parameters. In other word, less than 5% of fields of view (in a population) will have PD parameter lying above this level. To illustrate a trend of PD parameter in time, a green sloping line is drawn between all points of the graph. Note: that line is drawn to come as close as possible to every point of the graph, so a trend can be displayed with the highest possible reliability. The slope angle of the trend line is taken to calculate average PD changes in dB per year. If local defects are present which do not change in time, the trend line will be parallel to the time axis. If the defects progress in time, the trend line will be going up from left to right. 20.4. Presentation: Average Defect (AD) Average defect (AD) parameters can reach both minus and plus values. Minus values correspond to a global loss of sensitivity referred to a normal field. Plus values indicate that the sensitivity is better than expected. AD parameters can be increased or decreased by global defects. Local defects do not affect AD parameters. The AD regression graph is a set of points with different elevations drawn along the time axis. Every point of the graph represents AD parameters of a corresponding exam. The elevation of a point is depending on Average Defect values. If a trend line is parallel to the time axis, a global profile of hill of vision does not change with time. Note: the AD graph is not affected by local defects. If a trend line is rising from left to right, the patient’s vision progressed with time. Otherwise, the patient’s vision regressed.

AP-50 Automated Perimeter 79
Operation Manual 89-90006.02
21. PARAMETERS AND PRESENTATION OF RESULTS
This section explains the methods used to calculate all field parameters as well as gives a review on how the exam results can be presented on the screen and printed on a printer. The information gathered in this section should help analysing the obtained results. 21.1. Decibel Level Map A decibel level map is a classical presentation of the exam results. Every point of a tested field is denoted with a corresponding value measured during the test. The decibel map refers to the sensitivity of the retina. The bigger the dB value, the better the retina’s sensitivity. A decibel level map can contain the values in the range 0-45dB and can be drawn in the following formats: numerical, grey scale, colour scale, pattern scale and 3D graph.
Pic. 41. Available formats of Decibel level map (numerical – top, grey scale, pattern scale, colour scale, 3D graph).
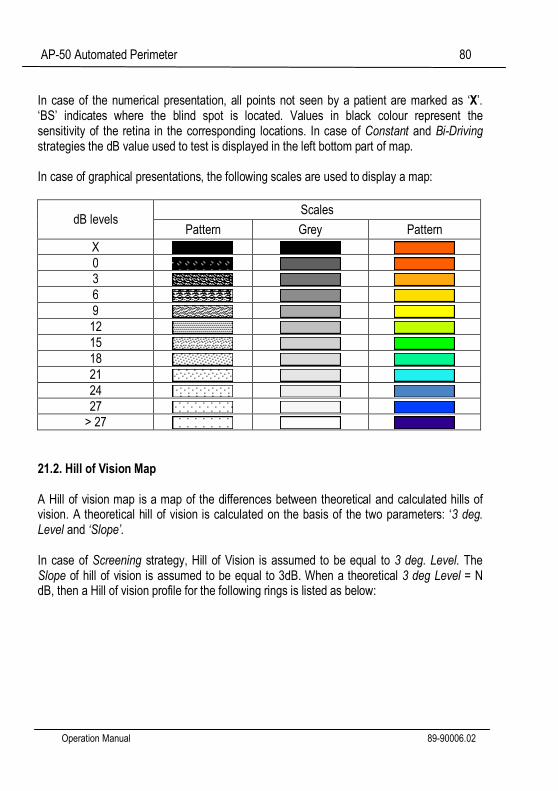
AP-50 Automated Perimeter 80
Operation Manual 89-90006.02
In case of the numerical presentation, all points not seen by a patient are marked as ‘X’. ‘BS’ indicates where the blind spot is located. Values in black colour represent the sensitivity of the retina in the corresponding locations. In case of Constant and Bi-Driving strategies the dB value used to test is displayed in the left bottom part of map. In case of graphical presentations, the following scales are used to display a map:
dB levels Scales
Pattern Grey Pattern
X 0 3 6 9 12 15 18 21 24 27
> 27 21.2. Hill of Vision Map A Hill of vision map is a map of the differences between theoretical and calculated hills of vision. A theoretical hill of vision is calculated on the basis of the two parameters: ‘3 deg. Level and ‘Slope’. In case of Screening strategy, Hill of Vision is assumed to be equal to 3 deg. Level. The Slope of hill of vision is assumed to be equal to 3dB. When a theoretical 3 deg Level = N dB, then a Hill of vision profile for the following rings is listed as below:

AP-50 Automated Perimeter 81
Operation Manual 89-90006.02
Ring Theoretical value
of hill of vision
1˚ N
3˚ N
6˚ N
10˚ N-3
22˚ N-6
30˚ N-9
40˚ N-12
50˚ N-15
In case of threshold strategies (Threshold and Fast threshold), the hill of vision is also assumed to be equal to 3 deg. Level. However, Slope parameter is calculated from the obtained results. Therefore slope can be different for the following rings. When Slope = Z and 3 deg. Level = N, then a theoretical hill of vision profile is as follows:
Ring Theoretical value of hill of vision
1˚ N
3˚ N
6˚ N
10˚ N – Z
22˚ N – ( Z * 2 )
30˚ N – ( Z * 3 )
40˚ N – ( Z * 4 )
50˚ N – ( Z * 5 )
The real hill of vision values are then subtracted from the theoretical ones. The result is presented as a map of differences demonstrated by picture 43.

AP-50 Automated Perimeter 82
Operation Manual 89-90006.02
Pic.42. Available formats of Hill of Vision maps (numerical, grey scale, pattern scale, colour scale, 3D graph). In case of graphical presentations, the following scales are used to display a map:
Difference in dB Scales
Pattern Grey Pattern
< -21dB -18 dB -15 dB -12 dB -9 dB -6 dB -3 dB 0 dB
+3 dB +6 dB
>+6 dB

AP-50 Automated Perimeter 83
Operation Manual 89-90006.02
21.3. Hill of Vision Probability Map A ‘Hill of vision probability map’ shows the probability of Hill of Vision defects for every single point of a field. The probabilities are calculated from the differences between theoretical and calculated hills of vision. The lower the probability, the bigger the defect in the field of vision.
Pic.43. Hill of vision probability map.
Hill of vision probability ranges are assumed as follows:
Symbol Difference between
calculated and theoretical HoV
Description
< -6 , N ) No defect.
□ < 5 % < -9 , -6 ) Value would appear in less than 5% of population. Small defect possible.
■ < 2.5 % < -12 , -9 ) Value would appear in less than 2.5% of population. Medium defect.
■ < 0.5 % < -15 , -12 ) Value would appear in less than 0.5% of population. Deep defect.
■ < 0.1 % ( -N , -15 ) Value would appear in less than 0.1% of population. Very deep defect.

AP-50 Automated Perimeter 84
Operation Manual 89-90006.02
21.4. Age Normal Map. An Age Normal map displays the differences between the age normal values and the values obtained in the test. Therefore the Age Normal map is considered as difference between the theoretical dB level map and the measured one. An Age Normal map can be drawn in the following formats: numerical, grey scale, colour scale, pattern scale and 3D graph.
Pic.44. Available formats of Age Normal map (numerical, grey scale, colour scale, pattern scale, 3D graph).
In case of numerical display, the following notation is used:
Symbol Description
Difference between dB level and theoretical age normal value is not bigger than ±6dB
-N Points with defects (difference N is bigger than –6dB)
+N Points where the retina sensitivity is better than expected
(difference is bigger than +6dB)
X Points not seen by the patient
BS Blind spot

AP-50 Automated Perimeter 85
Operation Manual 89-90006.02
The scales of Age Normal graphical maps have less numbers of levels than in the case of dB Level or HoV maps. The following scales are used to display a map:
Difference in dB Scales
Pattern Grey Pattern
≤ -18dB -12 dB -6 dB 0 dB
+6 dB +12 dB
>+12 dB Note that a certain number of different values will be presented as the same grey, pattern or colour level. For example: the left part of map from picture 45 contains values -12 dB and -15 dB. Graphical maps will mark the regions -12 dB and -15 dB using the same colour as set for all values in the range from -17dB to -12dB. 21.5. Age Normal Probability Map An Age Normal probability map shows the probability of defect for every single point of the field. The probabilities are calculated from the differences between theoretical and calculated Age Normal values. The lower the probability, the bigger the defect in the field of vision.
Pic. 45. Age normal probability map.

AP-50 Automated Perimeter 86
Operation Manual 89-90006.02
Age Normal probability ranges are assumed as follows:
Symbol Age Normal
deviation range Description
< -6 , N ) Point with no defect.
□ < 5 % < -9 , -6 ) Value would appear in less than 5% of population. Small defect possible.
■ < 2.5 % < -12 , -9 ) Value would appear in less than 2.5% of population. Medium defect.
■ < 0.5 % < -15 , -12 ) Value would appear in less than 0.5% of population. Deep defect.
■ < 0.1 % ( -N , -15 ) Value would appear in less than 0.1% of population. Very deep defect.
21.6. ABS Map An ABS map is obtained by dividing all values from a level dB map by 3 which decreases the dynamics of the presentation. Big values disappear and local changes are brought out. Therefore an ABS map is easy to analyse.
Pic.46. ABS presentation.
An ASB map can be presented in the numerical format only.

AP-50 Automated Perimeter 87
Operation Manual 89-90006.02
21.7. Normalized ABS Map A Normalized ABS map is obtained by subtraction the Zero Level value from all values creating a Decibel level map.
ABS norm. = ABS – Zero The minus values indicate the points with decreased sensitivity and are drawn in red colour. Therefore all local changes are more readable.
Pic.47. Normalized ABS map.
An ABS Normalized map can be presented in the numerical format only. 21.8. Defect Graph (Bebi graph) A Defect graph illustrates the summarized defect of an exam result. The graph is obtained on the basis of Age Normal deviation values. The vertical axis represents Age Normal deviation values. All tested points are located along the horizontal axis in decreasing order, so that points with high sensitivity are located on the left and points with low sensitivity are located on the right.
When the eye’s sensitivity is decreased (for example in case of cataract), a defect curve would be lowered. Local changes of the field of vision will lower a defect curve in its right part. The deeper the defects, the steeper the profile of a curve. If the local sensitivity is better than expected, a defect curve will be elevated in its left part.

AP-50 Automated Perimeter 88
Operation Manual 89-90006.02
Pic.48. Defect curve.
All points within the norm are marked with green colour, above the norm with blue colour and below the norm with red colour. 21.9. Lost Fixation The Lost fixation parameter can be measured using two different methods: Heijl-Krakau method (based on a stimulation of the blind spot) or digital fixation method (on-line eye tracking). Heijl-Krakau method stimulates the blind spot with a certain interval between the normal test cycles. Digital fixation method measures the movements of the eye on-line; therefore you get information about the fixation when every single point is being tested. Lost fixation parameters have the following form: Fixation lost: 12/33 = 20 % Average The first number indicates the number of seen stimuli which should not be seen. The second one indicates the number of trials. In case of the example presented above, fixation was tested 33 times and the program detected loss of fixation 12 times. The final results are presented as a percentage value with an additional description. The following descriptions are possible:

AP-50 Automated Perimeter 89
Operation Manual 89-90006.02
0% to 10% Very good
11% to 15% Good
16% to 20% Average
21% to 25% Bad
26% to 100% Very bad
21.10. False Positive Error False positive errors inform about patients’ responses to the stimuli which should not be seen. The perimeter program sometimes performs idle cycles during testing (without presenting any stimulus) to check for possible positive responses from the patient. The most common reasons that false positive errors appear are: the patient presses the button rhythmically or the patient doesn’t understand the principle of the exam. To minimize the risk that such error can appear it is recommended to increase ‘Fluctuation time’ parameter. The stimuli are presented then with a more random frequency. False positive error has the following form: False +: 12/33 = 20% Average The first number indicates the number of seen stimuli which should not be seen. The second one indicates the number of trials. In case of the example presented above, false positive error was tested 33 times and the program detected it 12 times. The final results are presented as a percentage value with an additional description. Descriptions are like those for the Fixation Lost parameters. False positive error should be less than 15%. 21.11. False Negative Error False negative errors appear when there is no response from a patient when such response is expected (a tested point should be seen). False negative errors are tested in points which have already been successfully tested. The stimuli are presented at a level 6dB brighter than the measured dB values in these points. The most common reasons that False negative errors appear are: the patient is already tired or the patient does not understand the principle of the exam.

AP-50 Automated Perimeter 90
Operation Manual 89-90006.02
False - : 12/33 = 20 % Average
The first number indicates the number of not seen stimuli which should be seen. The second one indicates the number of trials. The final results are presented as a percentage value with an additional description. Descriptions are like the ones for the Fixation Lost parameters. False positive error should be less than 15%. 21.12. Fluctuation The Fluctuation parameter describes the variability of exam results. Fluctuation checking is performed by additional testing of four points which have been already tested with their dB values known. One point from every quadrant located up to the 22˚ ring is selected. A fluctuation test starts when all points within rings up to 22˚ are already tested. A fluctuation value is proportional to the difference between the dB value measured during a normal test and the value measured during an additional fluctuation test. Fluctuation parameters have the following form: Fluctuation: -0.75dB(+2, -2, X, 3) The first number is the average fluctuation value given in dB. This parameter can reach both minus or plus values. If the results of a normal test were better than those of a fluctuation test, the average will be a plus value, otherwise a minus value. The four numbers in brackets are the fluctuations of the particular points. If the fluctuation could not be tested in a certain quadrant, it is marked as ‘-‘ instead of displaying numerical value. If a point selected by the program to test fluctuation could not be seen by a patient, it is marked as ‘X’.
Fluctuation can be tested only with the threshold strategies (Threshold, Fast threshold).
In case of a normal test, the fluctuation should not be bigger than ±3 dB.

AP-50 Automated Perimeter 91
Operation Manual 89-90006.02
21.13. Tested – Number of Tested Points This parameter gives the number of presented stimuli and the total number of tested points. It has the following form:
Tested : 420/164 The first is the number of presented stimuli. Neither False positive stimuli nor fixation testing stimuli are counted. False negative stimuli and those used to test fluctuation are added to the number of presented stimuli. The second number is the total number of tested points in the field. Blind spot points are not added to this number. 21.14. 3 deg. Level 3 deg. Level parameters are calculated from dB values of the tested points located within 1˚ and 3˚ rings. The point with the highest dB value is selected as reference. An average is calculated then from all points which are no more different than 6dB from the reference point. The obtained average can be considered as sensitivity of the hill of vision. If 3 deg. Level parameters cannot be calculated, it is assumed from age normal values and is marked with ‘*’. For example, if a patient does not see any point in the centre (all points taken to calculate 3 deg Level are ‘X’), 3 deg. Level is displayed as 0dB*. 21.15. Slope – Theoretical Slope of a Hill of Vision This parameter is the expected slope of a hill of vision. Slope is given in decibels per 10˚. For the screening strategies, the Slope parameter is assumed to be 3.0 dB/10˚. Slope parameters are calculated for the threshold strategies (Threshold, Fast Threshold) according to the following algorithm: The point with the highest dB value is defined in every ring. Next, averages are calculated for every ring from all points not more different than 6dB from the maximum. Finally, a set of averages is used to define a virtual line drawn as close as possible to all averages. Its slope corresponds to the theoretical slope of a hill of vision. Slope parameters should be within the range from 1.0dB to 4.5dB/10˚. When calculated slope values exceed those limits, Slope is assumed to be a border value (1.0 or 4.5dB/10˚) and marked with ‘*’, e.g. Slope: 4.5dB *

AP-50 Automated Perimeter 92
Operation Manual 89-90006.02
21.16. Zero Level Zero Level parameters are most common dB values in the field. 21.17. Average Average is given in dB and is calculated from all points of a tested field. All points not seen by a patient (‘X’) have virtual value –1dB used to calculated average. 21.18. Pattern Defect (PD) Pattern Defect parameters are obtained from an expected hill of vision. First, the standard deviations are calculated for values in every ring. They can be considered as local changes in the field of vision. Next, the standard deviations are multiplied by weighing factors. The rings located far from the centre have smaller factors than those in the centre. Therefore, local changes in the centre have a stronger influence on Pattern Defect values. So, Pattern Defect is an average of the standard deviations multiplied by the mentioned weighing factors. Pattern Defect can be positive values only. The additional descriptions, depending on Pattern Defect values, are defined as follows:
PD range Description
< 0 dB , 3 dB > PD : N dB
( 3 dB , 6 dB > PD : N dB *
( 6 dB , 9 dB > PD : N dB **
( 9 dB , N dB ) PD : N dB ***
High values of Pattern Defect parameters correspond to a big number of local changes and defects in the field of view. A smooth field with no defects will have Pattern Defect close to zero. A global field depression or elevation does not affect the Pattern Defect value.
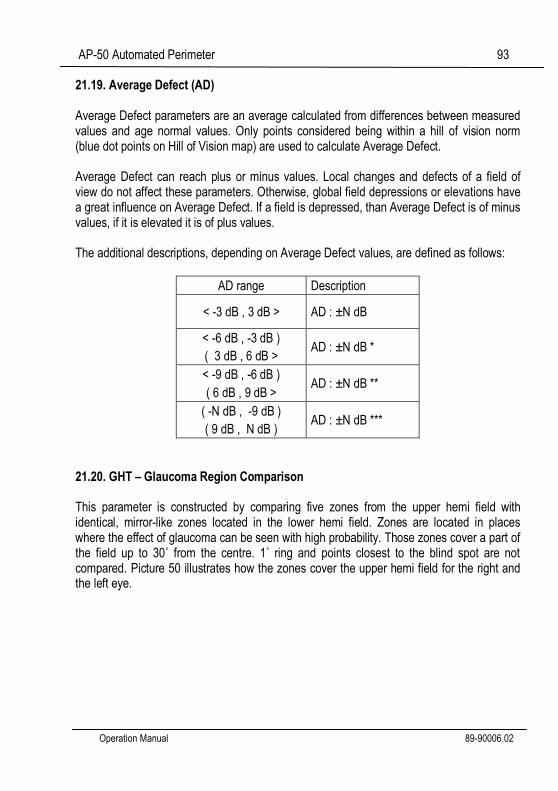
AP-50 Automated Perimeter 93
Operation Manual 89-90006.02
21.19. Average Defect (AD) Average Defect parameters are an average calculated from differences between measured values and age normal values. Only points considered being within a hill of vision norm (blue dot points on Hill of Vision map) are used to calculate Average Defect. Average Defect can reach plus or minus values. Local changes and defects of a field of view do not affect these parameters. Otherwise, global field depressions or elevations have a great influence on Average Defect. If a field is depressed, than Average Defect is of minus values, if it is elevated it is of plus values. The additional descriptions, depending on Average Defect values, are defined as follows:
AD range Description
< -3 dB , 3 dB > AD : ±N dB
< -6 dB , -3 dB )
( 3 dB , 6 dB > AD : ±N dB *
< -9 dB , -6 dB )
( 6 dB , 9 dB > AD : ±N dB **
( -N dB , -9 dB )
( 9 dB , N dB ) AD : ±N dB ***
21.20. GHT – Glaucoma Region Comparison This parameter is constructed by comparing five zones from the upper hemi field with identical, mirror-like zones located in the lower hemi field. Zones are located in places where the effect of glaucoma can be seen with high probability. Those zones cover a part of the field up to 30˚ from the centre. 1˚ ring and points closest to the blind spot are not compared. Picture 50 illustrates how the zones cover the upper hemi field for the right and the left eye.

AP-50 Automated Perimeter 94
Operation Manual 89-90006.02
a)
b)
Pic.49. GHT – zones. Right eye – a), left eye –b).
The average values of mirror sectors are calculated and compared. GHT parameters have the following form:
GHT : +2,-3,0,+1,-3 Suspect zone defect Every value represents a decibel difference between average values of symmetrical zones. The first number refers to zone 1, the fifth number to zone 5. Notation for GHT parameters are listed in the following table:
0 No difference
+ N Sensitivity in upper zone is bigger by N dB
- N Sensitivity in lower zone is bigger by N dB
When a GHT parameter cannot be calculated, it won’t be displayed. The additional descriptions for GHT parameters are defined as follows:
Description Classification
No defects No differences
Suspect zone defect Difference in one zone > 3dB
Zone defect Difference >=6dB in one zone or difference > 3dB in two or more zones
Hemi field depression Difference in three or more zones > 3dB

AP-50 Automated Perimeter 95
Operation Manual 89-90006.02
22. STRATEGIES
22.1. Screening Strategy Screening is a standard strategy in perimetry. First, the four yellow points have to be tested in order to determine initial levels for all points in the field. Calibration of all four calibration points is performed by using the Screening strategy. The calibration points are presented initially at intensities taken from age normal reference. The calibration is skipped if a pattern is used to fill the field with initial values. When the calibration is finished, a point with minimum brightness (maximum sensitivity) is taken to calculate the initial dB levels for the rest of points in the field. If the calibration point with maximum brightness = N dB was found, intensity levels for other points will be calculated as follows:
Ring (degree) Initial brightness ( dB )
1˚ N
3˚ N
6˚ N
10˚ N
15˚ N -3
22˚ N -6
30˚ N-9
40˚ N-12
50˚ N-15
Every calibration point with a dB value less than maximum will be retested starting from the initial level assigned as written in the table above. If all four calibration points have calibration levels at less than 6dB than age normal level, a message about a possible calibration error will be displayed. You can accept the measured calibration level and continue with the test or you can choose a calibration level corresponding to the patient’s age. It is recommended to continue with the calibration level as measured during the test. The second stage of the Screening strategy is conducted by presenting the points with the appropriate intensities calculated from the calibration level. If a point is not seen, the intensity is increased by 3dB and the point will be tested again. Testing of the point will be stopped when the patient gives a positive response.

AP-50 Automated Perimeter 96
Operation Manual 89-90006.02
22.2. Fast Threshold Strategy The Fast Threshold strategy yields results very similar to the typical Threshold strategy but the test duration can be shortened significantly which improves the results’ reliability. First, four yellow calibration points are tested to calculate the initial levels for all points in the field. The test is conducted according to the rules presented below:
Pic. 50. Fast Threshold algorithm

AP-50 Automated Perimeter 97
Operation Manual 89-90006.02
Then a set of points is selected (one point from every angle ring in every quadrant). These points will be tested at initial intensities according to the table:
Ring (degrees) Assign sensitivity level( dB )
1˚ N+3
3˚ N+3
6˚ N+3
10˚ N
15˚ N -3
22˚ N -6
30˚ N-6
40˚ N-9
50˚ N-12
The selected points are tested using the Threshold strategy. The measured dB values of these points are used then to initialise their neighbours from a part of the ring located in an appropriate quadrant. This method helps to forecast the threshold level for 80% of the points which were not tested yet. Such points are tested then using the Threshold method referenced to age normal values. It means that testing is finished when the dB value in a certain point is within or above the age normal value.
22.3. Threshold Strategy The Threshold strategy is conducted identically as the Fast Threshold strategy. As the only difference there is no reference to age normal values here, so the result is the real sensitivity of the patient’s retina given in dB. The results are very precise and the sensitivity is measured with an accuracy of 1dB.
22.4. Bi-Driving Strategy The Bi-Driving strategy is intended to perform a binocular test using both extended fields (up to 80˚ to the right and to the left). In the Bi-Driving strategy a test field is generated automatically and the USER cannot choose a particular field. All cells are tested with the constant value 10dB (white stimulus) or 3dB (green stimulus). The exposition time = 0.4s and cannot be changed. The live video is extended horizontally to provide a preview of both eyes. The patient should be tested with the correction glasses (if needed). The patient should observe the fixation point with two eyes open. When the central field is already tested the peripheral fields are being tested. The fixation point is moved then (twice, to the right and to the left in order to test both extended fields).

AP-50 Automated Perimeter 98
Operation Manual 89-90006.02
22.5. Industrial Medicine Strategy Before a test is started, initial dB levels are assigned to all points. These initial levels are taken from Age normal reference and decreased by 6dB. The program doesn’t perform calibration of the four yellow points. Then all points are tested according to the scheme: A point is presented at initial brightness level. If the response of a patient is positive, the point will be marked with ‘○’ and its testing is finished. If there is no response, the point will be tested again at 0dB brightness level. If such stimulus is seen, the point will be marked with ‘RD’ (relative defect). If the stimulus is not seen, ‘AD’ (absolute defect) will appear. Industrial Medicine strategy has its own test field allowing testing up to 50/80 degrees horizontally and 40/40 degrees vertically.
Pic. 51. Industrial Medicine strategy algorithm. 22.6. Industrial Medicine Extended Strategy Industrial Medicine strategy is conducted as the Screening strategy. Additionally, the shape of a tested field cannot be changed and is identical as in Industrial Medicine Strategy.

AP-50 Automated Perimeter 99
Operation Manual 89-90006.02
23. STANDARD TESTS
Standard tests are available in the AP-50 software by default and are described in the tables and pictures below.
Test name
Angle
Nasal Temple Number of
points to test Picture
Central 22 ̊ 22˚ 22˚ 71 a)
Central 30 ̊ 30˚ 30˚ 95 b)
Full 50˚ 50˚ 155 c)
Glaucoma 50˚ 30˚ 125 d)
Macula 10˚ 10˚ 36 e)
a)
b)
c)
d)
e)
Pic.52. Standard test fields.

AP-50 Automated Perimeter 100
Operation Manual 89-90006.02
23.1. Central 22 ̊ Standard central test field. The small number of points decreases the test duration regardless of the strategy. 23.2. Central 30 ̊ Central test field up to 30˚. It can be used with Threshold and Fast Threshold strategies due to the small number of points. 23.3. Full A Full test field covers 50˚ of the patient’s field of view. It is recommended to use it with Screening strategy due to the big number of points and a possible long test duration.
23.4. Glaucoma A Glaucoma field is a Central 30˚ field extended to 50˚ in the nasal direction. It can be used to trace glaucoma regressions and is an alternative for Central test fields. 23.5. Macula A Macula test field covers a small part – up to 10˚ from the centre - of the patient’s field of vision. It provides a fast diagnosis of the patient’s macula. It is recommended to be used with Threshold strategies.

AP-50 Automated Perimeter 101
Operation Manual 89-90006.02
24. DATA EXPORT / IMPORT
Selected data (patients and/or exams) from the AP database can be exported to an external file, for example to exchange the data between AP systems working in different places. The external file can also be given to the patient who can then show the exam results to another doctor working with AP-50 software. The export option is available on the main screen. To perform an export, select the appropriate records from the patient and/or exam table and click on the ‘Export’ button. When more then one record should be selected, press the CTRL key during selection.
Pic. 53. Export options.
It is possible to perform the following export operations:
Export data of the selected patients.
Export data of the selected patients and all their exams
Export data of the selected exams of a patient Data are exported to a file with ‘.VEX’ extension. Such files can be read by AP-50 software only. If Dicom export option is selected, then the exams will be exported to external DICOM files. Location of these files can be set in the service mode in the Settings register.

AP-50 Automated Perimeter 102
Operation Manual 89-90006.02
In order to perform data import, click on the ‘Import’ button on the main screen and select a file with ‘.VEX’ extension. If a result is imported which is already in the database, it will be shown as a second, identical record after import is finished. If a patient’s data are imported to a database which already contains this patient, his exam results will be added to the existing records. AP-50 software will not create a new patient record in such case.

AP-50 Automated Perimeter 103
Operation Manual 89-90006.02
25. SOFTWARE CONFIGURATION AND SETTINGS
Configuration registers are accessible on the main screen via the drop-down menu located on the top-left part of the screen.
Pic. 54. Service mode.
Select the ‘Tools’ and then the ‘Service mode’ option from the drop-down menu. A number of registers will be shown on the screen. The following registers are available:
Users – user management
Backup options – database backup management
Sounds – configuration of the sounds used in the software
Settings – configuration of software properties and settings
Print layout – configuration of the printouts
Service – service settings (should be used by a qualified personnel only)
Import / Export settings – import and export of the AP settings from/to an external file
Local settings – local settings (language and date format)
Some of the registers can be disabled depending on the current user’s rights. Guest users cannot access all registers.
In order to apply the changes click on the ‘Save’ button – otherwise the changes will be cancelled.
The ‘Default settings’ button is located at the bottom-left part of the form. Use this option when you need to restore the default settings of the AP-50 software

AP-50 Automated Perimeter 104
Operation Manual 89-90006.02
25.1. Register User management Available only for users with administrator rights. It allows you to add, to delete and to modify data of all existing users in the system.
Pic. 55. User management.
All available users and their rights are listed in the table on the right side of the form. The left side contains all information about the user such as: login, first name, last name, password. The field ‘Password’ will be always empty due to safety reasons. Overleaf ‘Rights’ gives information about rights of the currently selected user. Three buttons are located at the bottom-left part of the screen: to create or to delete a user and to apply the introduced changes into the users’ data. When user data are modified, it is needed to enter the user’s password. ‘ADMIN’ users cannot be removed from the database. It is possible only to modify the ‘ADMIN’ user data: password, first name and last name.

AP-50 Automated Perimeter 105
Operation Manual 89-90006.02
If the user was selected to be deleted, the software is looking for all patients attached to the user. If such patients exist, the software will ask to select a new user to whom these patients should be attached instead of the deleted user.
Pic. 56. Attaching patients to a new user instead of a deleted user.
Selecting the ‘Create’ option will display a dialog box where all data of a new user should be entered. The user name is unique – it is not allowed to have two users with the same user name in the database.
Pic. 57. Creating new user. The new user data will be accepted by clicking on the ‘OK’ button. The new user will be added to the database.

AP-50 Automated Perimeter 106
Operation Manual 89-90006.02
25.2. Register Backup service This option allows carrying out a database backup and restoring data from a previously performed backup.
Pic. 58. Restore/backup options.
Local backup – creates a copy of the current database in a user defined location CD/DVD local backup – creates a copy of the current database and allows the user to burn it on a selected CD or DVD disk. Server backup – creates a copy of the current database on the server. Restore from local backup – restore a previously stored database from a user defined location Restore from server backup – restore a previously stored database from the server. Auto backup enabled – option that executes an automatic server backup. This procedure is executed in cycles with a time interval defined by the ‘Period’ parameter.
Automatic and manual backups can be performed correctly only if all other users are logged out from the database. Otherwise the backup procedure will fail.

AP-50 Automated Perimeter 107
Operation Manual 89-90006.02
25.3. Register Sounds The AP-50 software is informing the user about test events during testing. Information is given in form of messages displayed on the screen. The most important events can be reported also by appropriate sounds. Events like loss of fixation, false positive error, false negative error and many others which are important for the test reliability can be connected with certain sounds. ‘Sounds enabled’ must be selected to activate the sounds in the software. All events which can occur during testing are listed on the screen. On the left side of every description a check box is located to select if a certain event should be reported by a sound. The buttons on the left allow to play the sounds. The buttons on the right are to select the appropriate sound files.
The AP-50 software allows attaching any sound file to an event. A sound file must be in ‘.WAV’ format. In case of using non-standard sounds, these should last no longer than 3 seconds.
Pic. 59. Sounds configuration.

AP-50 Automated Perimeter 108
Operation Manual 89-90006.02
25.4. Register Settings
Pic. 60. Settings.
Clinic data: data like the clinic’s name can be entered. These data will appear on top of every results’ printout. Test exposition per false positive exp.: parameter defining how many normal test expositions will be displayed between false positive expositions. Test exposition per false negative exp.: parameter defining how many normal test expositions will be displayed between false negative expositions. Test exposition per BS exposition: parameter defining how many normal test expositions will be displayed between blind spot testing. This parameter is valid only for the Heijl-Krakau fixation checking method. Retest point when fixation is lost: to be selected if, every tested point should be tested again if the fixation was lost in the moment of testing. This parameter is valid only using the digital fixation checking method. Pause test if fixation failed: if the fixation is lost 10 times one by one, a test will be automatically paused. This parameter is valid only using the digital fixation checking method.

AP-50 Automated Perimeter 109
Operation Manual 89-90006.02
Switch to Heijl-Krakau if digital fixation fails: if the fixation is lost 15 times one by one, the digital fixation checking method will be switched automatically to the Heijl-Krakau method. User will be also asked to correct patient’s position and press ‘Continue’ button to resume the exam. Shut down system on application exit: if this option is selected, the system will be automatically closed on the application exit. Norm range: this parameter sets a threshold for drawing blue dots in the Age Norm and Hill of Vision plots. All points which have value equal to the threshold or above will be depicted as blue dots instead of numerical value. BS brightness: option to set the brightness of the blind spot points. It is recommended to use 3dB or 6dB as brightness level. Names of additional fields: Text fields in this group box are to attach a user’s own descriptions of the three fields in the ‘New Patient’ form. Details how to create a new patient in the database are described in section 8. These fields are optional and do not need to be used. However they allow adding some non-standard patient information. Custom flicker settings: The user can define the frequencies for the custom flicker testing. The points lying on a certain ring (rings are denoted as 1˚ to 50˚) can appear with the frequency defined for this ring. Data path: The user can define a default disk path, where the exam results will be saved as a jpg or bmp image. Dicom path: The user can define a default disk path for DICOM files. If option Export automatically is selected then DICOM file with exam results will be created automatically after every exam. Simple menu: If this option is checked, the simple menu screen will be shown on application start.

AP-50 Automated Perimeter 110
Operation Manual 89-90006.02
25.5. Register Print layout Default: you can define which type of printout will be selected as a default printout in the print selection window. In this register you can also configure three types of printouts: Standard, Combo and Multiview. Each of the three buttons located in the upper part of the form opens a schematic layout of the printout. Standard printout has six maps, Combo and Multiview have four printouts each.
Pic. 61. Layout of Standard printout. Pic. 62. All available maps. On each layout of the printout there is a set of boxes. One box corresponds to one printed map on the final printout. On top of each box information about the selected map for this box is listed. You can change the type of display by clicking on the button. This will open a list off all available types of maps to be printed. You can choose the interesting printout type from this list. Information on the selected box should change automatically for the new type of selected printout.

AP-50 Automated Perimeter 111
Operation Manual 89-90006.02
25.6. Register Simple Menu It allows to define what types of perimeter fields and strategies will be assigned to the buttons displayed on the simple menu screen. Press one of the eight active buttons to open a window in which all desired test parameters can be set. You can also name the test with according to your needs using User exam name text field. If you name your defined test, its name will be shown on the button. If you decided not to name your test, only field name and strategy name will be displayed on the button. The number of buttons active on the simple menu screen can be changed using a combo box on the left.
Pic. 63. Simple menu settings.

AP-50 Automated Perimeter 112
Operation Manual 89-90006.02
Pic. 64. Simple menu – configuration window.
24.7. Register Service This register is intended for technical personnel trained by the Manufacturer. All options are described in the Service Manual

AP-50 Automated Perimeter 113
Operation Manual 89-90006.02
25.8. Register Local It allows choosing one of the available language and touchscreen keyboard versions. If you cannot find your native language in the pull-down lists contact the Manufacturer or supplier of the equipment. You can also change the data format to the one most suitable for your country.
Pic. 65. Regional settings.
All changes made in this register will take effect only after restarting the AP-50 software. Remember to click on ‘Save’ to apply any changes.

AP-50 Automated Perimeter 114
Operation Manual 89-90006.02
25.9. Register Export/Import settings This feature allows saving all important configuration data to an external file. The clinic’s name is exported to a file with the extension '.VLC'. All other settings are added to a file with the extension ‘.VST’. Please define the name for each file with exported data. You can export those settings to any selected location. This function is very useful in places where you have many computers with network access to the AP database. In that case you can configure all settings on one location and then save the configuration files. Then you can use those files to configure other computers in the network by simply copy all previously configured settings.
Pic. 66. Export/Import settings.

AP-50 Automated Perimeter 115
Operation Manual 89-90006.02
26. MAINTENANCE
26.1. Cleaning
The AP-50 Automated Perimeter is supplied with a special dust cover. When you finish working with the Automated Perimeter turn it off and always cover it. It will lengthen the time interval until the next cleaning of the perimeter housing.
Switch the power off and unplug the power cord before cleaning or servicing. Get rid of moisture completely before reconnecting to the mains outlet.
Do not use ammonia-, phenol-, or acetone-based cleaners. These cleaners may damage the perimeter surface.
Do not immerse Automated Perimeter in any liquid. Do not allow liquid to enter the perimeter.
Do not sterilize or autoclave the Automated Perimeter.
Cleaning shall be carried out using a piece of cloth moistened with mild cleaning solution.
The chin rest and the forehead support can be cleaned using generally available disinfectants, also alcohol-based
While cleaning the inside of the stimulator bowl it is advised to use a special soft cleaning cloth to avoid scratching the bowl’s surface.
This AP-50 Automated Perimeter is a high-precision optical instrument which is made up of many electrical parts. Therefore it is absolutely necessary that all caution is taken during cleaning.
After cleaning wait at least for 5 minutes before switching on the Automated Perimeter.
When any liquid is spilled onto the AP-50 Automated Perimeter the device has to be immediately dried using a pad of gauze. After cleaning, ensure the absence of liquid in the mains socket. The presence of liquid could cause shortening of the contacts. Clean the main socket using a dry pad of gauze and then wait for 1 hour before reconnecting the Automated Perimeter to the mains.

AP-50 Automated Perimeter 116
Operation Manual 89-90006.02
26.2. Repairs
In order to ensure a long life time of the Automated Perimeter, it is necessary to check periodically its status and replace damaged or faulty parts.
In the case on any fault of the Automated Perimeter immediately consult the Manufacturer or the dealer.
The right to repair the Automated Perimeter or to carry out periodical parts replacements is reserved only to the Manufacturer or to a person authorized by the Manufacturer.
Fuses replacement
Replace the fuse with a fuse of the same type and with the same rating (see table in section 28).
When replacing fuses, the Automated Perimeter should be disconnected from the mains.
26.3. Annual maintenance
The Manufacturer recommends periodical checks of the device, at least once a year, carried out by personel authorized by the Manufacturer. You shall contact FREY local authorised dealer concerning annual perimeter checkup.
Functional checks are recommended at least once a year. That should be performed by biomedical technicians of the hospital.
25.4. Disposal
Disposal of the device, or parts of it, should be done according to local environmental and waste disposal and recycling regulations.
This symbol is applicable for EU member countries only.
To avoid potential damage to the environment and possibly human health, this device should be disposed of for EU member countries - in accordance with WEEE (2002/96/EC Directive on Waste Electrical and Electronic Equipment), or for all other countries, in accordance with local disposal and recycling laws.

AP-50 Automated Perimeter 117
Operation Manual 89-90006.02
27. WARRANTY
The Manufacturer warrants the high-quality workmanship of the Automated Perimeter for a period of 24 month after the purchase date.
The Manufacturer or his authorized representatives take the obligation to carry out a warranty repair of the Automated Perimeter or to replace it with an operational one in case the Manufacturer or his authorized representatives determine that the cause of the perimeter’s failure was related to the manufacturing process.
If the Buyer found a defect in the Automated Perimeter during the Warranty period, he must report it and inform Manufacturer or his authorized representative within 30 days.
An Automated Perimeters sent for testing, repair or replacement is to be submitted to the Manufacturer or his authorized representative in its original or equivalent packaging. The Automated Perimeter is sent for repair and back at the Buyer’s expense.
If no defect is found during testing, the Manufacturer or his authorized representative reserve the right to submit the invoice to the Buyer for the work carried out.
This Warranty is not applicable to Automated Perimeter when failure was caused by violations of requirements of this Operation Manual, by mains voltage not conform to the requirements of IEC, by spills of liquid, by mechanical damages caused by shock or the Automated Perimeter being dropped, by perimeter damages during transportation, or when packaging is damaged.

AP-50 Automated Perimeter 118
Operation Manual 89-90006.02
28. SPARE PARTS
No. Part name Part number
1 Patient response button 53-01018.00
2 Eye cover 2 pcs. 38-19093.01
3 Fuses - 0,63A T 2 pcs 06-30302
4 Power cord (Europe standard) 06-49011
5 Dust cover 89-25001.01
6 USB cable 1,8 m 06-49505
7 Right/left chinrest 89-60200.01
8 Central chinrest 89-60220.01
9 Patient response button holder 89-60400.01