
AP-42, Appendix B.2 Generalized Particle Size Distributions
22
APPENDIX B.2 GENERALIZED PARTICLE SIZE DISTRIBUTIONS 9/90 (Reformatted 1/95) Appendix B.2 B.2-1
-
Upload
duongnguyet -
Category
Documents
-
view
223 -
download
0
Transcript of AP-42, Appendix B.2 Generalized Particle Size Distributions

APPENDIX B.2
GENERALIZED PARTICLE SIZE DISTRIBUTIONS
9/90 (Reformatted 1/95) Appendix B.2 B.2-1

B.2-2 EMISSION FACTORS (Reformatted 1/95)9/90

CONTENTS
Page
B.2.1 Rationale For Developing Generalized Particle Size Distributions. . . . . . . . . . . . . . .B.2-5
B.2.2 How to Use The Generalized Particle Size Distributions for Uncontrolled Processes . . B.2-5
B.2.3 How to Use The Generalized Particle Size Distributions for Controlled Processes. . . . B.2-20
B.2.4 Example Calculation. . . . . . . . . . . . . . . . . . . . . . . . . . . . . . . . . . . . . . . . . . . . . . .B.2-20
References. . . . . . . . . . . . . . . . . . . . . . . . . . . . . . . . . . . . . . . . . . . . . . . . . . . . . .B.2-22
9/90 (Reformatted 1/95) Appendix B.2 B.2-3

B.2-4 EMISSION FACTORS (Reformatted 1/95)9/90

Appendix B.2
Generalized Particle Size Distributions
B.2.1 Rationale For Developing Generalized Particle Size Distributions
The preparation of size-specific particulate emission inventories requires size distributioninformation for each process. Particle size distributions for many processes are contained inappropriate industry sections of this document. Because particle size information for many processesof local impact and concern are unavailable, this appendix provides "generic" particle size distributionsapplicable to these processes. The concept of the "generic" particle size distribution is based oncategorizing measured particle size data from similar processes generating emissions from similarmaterials. These generic distributions have been developed from sampled size distributions from about200 sources.
Generic particle size distributions are approximations. They should be used only in theabsence of source-specific particle size distributions for areawide emission inventories.
B.2.2 How To Use The Generalized Particle Size Distributions For Uncontrolled Processes
Figure B.2-1 provides an example calculation to assist the analyst in preparing particle size-specific emission estimates using generic size distributions.
The following instructions for the calculation apply to each particulate emission source forwhich a particle size distribution is desired and for which no source specific particle size informationis given elsewhere in this document:
1. Identify and review the AP-42 section dealing with that process.
2. Obtain the uncontrolled particulate emission factor for the process from the main textof AP-42, and calculate uncontrolled total particulate emissions.
3. Obtain the category number of the appropriate generic particle size distribution fromTable B.2-1.
4. Obtain the particle size distribution for the appropriate category from Table B.2-2.Apply the particle size distribution to the uncontrolled particulate emissions.
Instructions for calculating the controlled size-specific emissions are given in Table B.2-3 andillustrated in Figure B.2-1.
9/90 (Reformatted 1/95) Appendix B.2 B.2-5

Figure B.2-1. Example calculation for determining uncontrolledand controlled particle size-specific emissions.
SOURCE IDENTIFICATIONSource name and address: ABC Brick Manufacturing
24 Dusty WayAnywhere, USA
Process description: Dryers/GrindersAP-42 Section: 8.3, Bricks And Related Clay ProductsUncontrolled AP-42emission factor: 96 lbs/ton (units)
Activity parameter: 63,700 tons/year (units)Uncontrolled emissions: 3057.6 tons/year (units)
UNCONTROLLED SIZE EMISSIONSCategory name: Mechanically Generated/Aggregated, Unprocessed OresCategory number: 3
Particle size (µm)
≤ 2.5 ≤ 6 ≤ 10
Generic distribution, Cumulativepercent equal to or less than the size: 15 34 51
Cumulative mass≤ particle size emissions(tons/year): 458.6 1039.6 1559.4
CONTROLLED SIZE EMISSIONS*Type of control device: Fabric Filter
Particle size (µm)
0 - 2.5 2.5 - 6 6 - 10
Collection efficiency (Table B.2-3): 99.0 99.5 99.5
Mass in size range** before control(tons/year): 458.6 581.0 519.8
Mass in size range after control(tons/year): 4.59 2.91 2.60
Cumulative mass (tons/year):4.59 7.50 10.10
* These data do not include results for the greater than 10 µm particle size range.** Uncontrolled size data are cumulative percent equal to or less than the size. Control efficiency
data apply only to size range and are not cumulative.
B.2-6 EMISSION FACTORS (Reformatted 1/95)9/90

Table B.2-1. PARTICLE SIZE CATEGORY BY AP-42 SECTION
AP-42Section Source Category
CategoryNumber*
AP-42Section Source Category
CategoryNumber*
External combustion 8.5.3 Ammonium phosphates
1.1 Bituminous and subbituminous coal a Reactor/ammoniator-granulator 4
combustion Dryer/cooler 4
1.2 Anthracite coal combustion a 8.7 Hydrofluoric acid
1.3 Fuel oil combustion Spar drying 3
Residual oil Spar handling 3
Utility a Transfer 3
Commercial a 8.9 Phosphoric acid (thermal process) a
Distillate oil 8.10 Sulfuric acid b
Utility a 8.12 Sodium carbonate a
Commercial a Food and agricultural
Residential a 9.3.1 Defoliation and harvesting of cotton
1.4 Natural gas combustion a Trailer loading 6
1.5 Liquefied petroleum gas a Transport 6
1.6 Wood waste combustion in boilers a 9.3.2 Harvesting of grain
1.7 Lignite combustion a Harvesting machine 6
1.8 Bagasse combustion b Truck loading 6
1.9 Residential fireplaces a Field transport 6
1.10 Residential wood stoves a 9.5.2 Meat smokehouses 9
1.11 Waste oil combustion a 9.7 Cotton ginning b
Solid waste disposal 9.9.1 Grain elevators and processing plants a
2.1 Refuse combustion a 9.9.4 Alfalfa dehydrating
2.2 Sewage sludge incineration a Primary cyclone b
2.7 Conical burners (wood waste) 2 Meal collector cyclone 7
Internal combustion engines Pellet cooler cyclone 7
Highway vehicles c Pellet regrind cyclone 7
3.2 Off highway vehicles 1 9.9.7 Starch manufacturing 7
Organic chemical processes 9.12 Fermentation 6,7
6.4 Paint and varnish 4 9.13.2 Coffee roasting 6
6.5 Phthalic anhydride 9 Wood products
6.8 Soap and detergents a 10.2 Chemical wood pulping a
Inorganic chemical processes 10.7 Charcoal 9
8.2 Urea a Mineral products
8.3 Ammonium nitrate fertilizers a 11.1 Hot mix asphalt plants a
8.4 Ammonium sulfate 11.3 Bricks and related clay products
Rotary dryer b Raw materials handling
Fluidized bed dryer b Dryers, grinders, etc. b
8.5 Phosphate fertilizers 3
9/90 (Reformatted 1/95) Appendix B.2 B.2-7

Table B.2-1 (cont.).
AP-42Section Source Category
CategoryNumber*
AP-42Section Source Category
CategoryNumber*
Tunnel/periodic kilns 11.16 Gypsum manufacturing
Gas fired a Rotary ore dryer a
Oil fired a Roller mill 4
Coal fired a Impact mill 4
11.5 Refractory manufacturing Flash calciner a
Raw material dryer 3 Continuous kettle calciner a
Raw material crushing and screening 3 11.17 Lime manufacturing a
Electric arc melting 8 11.18 Mineral wool manufacturing
Curing oven 3 Cupola 8
11.6 Portland cement manufacturing Reverberatory furnace 8
Dry process Blow chamber 8
Kilns a Curing oven 9
Dryers, grinders, etc. 4 Cooler 9
Wet process 11.19.1 Sand and gravel processing
Kilns a Continuous drop
Dryers, grinders, etc. 4 Transfer station a
11.7 Ceramic clay manufacturing Pile formation - stacker a
Drying 3 Batch drop a
Grinding 4 Active storage piles a
Storage 3 Vehicle traffic on unpaved road a
11.8 Clay and fly ash sintering 11.19.2 Crushed stone processing
Fly ash sintering, crushing, Dry crushing
screening, yard storage 5 Primary crushing a
Clay mixed with coke Secondary crushing and screening a
Crushing, screening, yard storage 3 Tertiary crushing and screening 3
11.9 Western surface coal mining a Recrushing and screening 4
11.10 Coal cleaning 3 Fines mill 4
11.12 Concrete batching 3 Screening, conveying, handling a
11.13 Glass fiber manufacturing 11.21 Phosphate rock processing
Unloading and conveying 3 Drying a
Storage bins 3 Calcining a
Mixing and weighing 3 Grinding b
Glass furnace - wool a Transfer and storage 3
Glass furnace - textile a 11.23 Taconite ore processing
11.15 Glass manufacturing a Fine crushing 4
B.2-8 EMISSION FACTORS (Reformatted 1/95)9/90

Table B.2-1 (cont.).
AP-42Section Source Category
CategoryNumber*
AP-42Section Source Category
CategoryNumber*
Waste gas a 12.7 Zinc smelting 8
Pellet handling 4 12.8 Secondary aluminum operations
Grate discharge 5 Sweating furnace 8
Grate feed 4 Smelting
Bentonite blending 4 Crucible furnace 8
Coarse crushing 3 Reverberatory furnace a
Ore transfer 3 12.9 Secondary copper smelting
Bentonite transfer 4 and alloying 8
Unpaved roads a 12.10 Gray iron foundries a
11.24 Metallic minerals processing a 12.11 Secondary lead processing a
Metallurgical 12.12 Secondary magnesium smelting 8
12.1 Primary aluminum production 12.13 Steel foundries - melting b
Bauxite grinding 4 12.14 Secondary zinc processing 8
Aluminum hydroxide calcining 5 12.15 Storage battery production b
Anode baking furnace 9 12.18 Leadbearing ore crushing and grinding 4
Prebake cell a Miscellaneous sources
Vertical Soderberg 8 13.1 Wildfires and prescribed burning a
Horizontal Soderberg a 13.2 Fugitive dust a
12.2 Coke manufacturing a
12.3 Primary copper smelting a
12.4 Ferroalloy production a
12.5 Iron and steel production
Blast furnace
Slips a
Cast house a
Sintering
Windbox a
Sinter discharge a
Basic oxygen furnace a
Electric arc furnace a
12.6 Primary lead smelting a* Data for numbered categories are given Table B.2-2. Particle size data on "a" categories are found
in the AP-42 text; for "b" categories, in Appendix B.1; and for "c" categories, in AP-42Volume II:Mobile Sources.
9/90 (Reformatted 1/95) Appendix B.2 B.2-9

Figure B.2-2. CALCULATION SHEET
SOURCE IDENTIFICATIONSource name and address:
Process description:AP-42 Section:Uncontrolled AP-42emission factor: (units)
Activity parameter: (units)Uncontrolled emissions: (units)
UNCONTROLLED SIZE EMISSIONSCategory name:Category number:
Particle size (µm)
≤ 2.5 ≤ 6 ≤ 10
Generic distribution, Cumulativepercent equal to or less than the size:
Cumulative mass≤ particle size emissions(tons/year):
CONTROLLED SIZE EMISSIONS*Type of control device:
Particle size (µm)
0 - 2.5 2.5 - 6 6 - 10
Collection efficiency (Table B.2-3):
Mass in size range** before control(tons/year):
Mass in size range after control(tons/year):
Cumulative mass (tons/year):
* These data do not include results for the greater than 10 µm particle size range.** Uncontrolled size data are cumulative percent equal to or less than the size. Control efficiency
data apply only to size range and are not cumulative.
B.2-10 EMISSION FACTORS (Reformatted 1/95)9/90

Table B.2-2. DESCRIPTION OF PARTICLE SIZE CATEGORIES
Category: 1Process: Stationary Internal Combustion EnginesMaterial: Gasoline and Diesel Fuel
Category 1 covers size-specific emissions from stationary internal combustion engines. Theparticulate emissions are generated from fuel combustion.
REFERENCES: 1,9
Particle Size, µm
Cumulative %≤ Stated Size(Uncontrolled)
MinimumValue
MaximumValue
StandardDeviation
1.0a 82
2.0a 88
2.5 90 78 99 11
3.0a 90
4.0a 92
5.0a 93
6.0 93 86 99 7
10.0 96 92 99 4a Value calculated from data reported at 2.5, 6.0, and 10.0 µm. No statistical parameters are given for
the calculated value.
9/90 (Reformatted 1/95) Appendix B.2 B.2-11

Table B.2.2 (cont.).
Category: 2Process: CombustionMaterial: Mixed Fuels
Category 2 covers boilers firing a mixture of fuels, regardless of the fuel combination. Thefuels include gas, coal, coke, and petroleum. Particulate emissions are generated by firing thesemiscellaneous fuels.
REFERENCE: 1
Particle Size, µm
Cumulative %≤ Stated Size(Uncontrolled)
MinimumValue
MaximumValue
StandardDeviation
1.0a 23
2.0a 40
2.5 45 32 70 17
3.0a 50
4.0a 58
5.0a 64
6.0 70 49 84 14
10.0 79 56 87 12a Value calculated from data reported at 2.5, 6.0, and 10.0 µm. No statistical parameters are given for
the calculated value.
B.2-12 EMISSION FACTORS (Reformatted 1/95)9/90

Table B.2.2 (cont.).
Category: 3Process: Mechanically GeneratedMaterial: Aggregate, Unprocessed Ores
Category 3 covers material handling and processing of aggregate and unprocessed ore. Thisbroad category includes emissions from milling, grinding, crushing, screening, conveying, cooling, anddrying of material. Emissions are generated through either the movement of the material or theinteraction of the material with mechanical devices.
REFERENCES: 1-2,4,7
Particle Size, µm
Cumulative %≤ Stated Size(Uncontrolled)
MinimumValue
MaximumValue
StandardDeviation
1.0a 4
2.0a 11
2.5 15 3 35 7
3.0a 18
4.0a 25
5.0a 30
6.0 34 15 65 13
10.0 51 23 81 14a Value calculated from data reported at 2.5, 6.0, and 10.0 µm. No statistical parameters are given for
the calculated value.
9/90 (Reformatted 1/95) Appendix B.2 B.2-13

Table B.2.2 (cont.).
Category: 4Process: Mechanically GeneratedMaterial: Processed Ores and Nonmetallic Minerals
Category 4 covers material handling and processing of processed ores and minerals. Whilesimilar to Category 3, processed ores can be expected to have a greater size consistency thanunprocessed ores. Particulate emissions are a result of agitating the materials by screening or transferduring size reduction and beneficiation of the materials by grinding and fine milling and by drying.
REFERENCE: 1
Particle Size, µm
Cumulative %≤ Stated Size(Uncontrolled)
MinimumValue
MaximumValue
StandardDeviation
1.0a 6
2.0a 21
2.5 30 1 51 19
3.0a 36
4.0a 48
5.0a 58
6.0 62 17 83 17
10.0 85 70 93 7a Value calculated from data reported at 2.5, 6.0, and 10.0 µm. No statistical parameters are given for
the calculated value.
B.2-14 EMISSION FACTORS (Reformatted 1/95)9/90

Table B.2.2 (cont.).
Category: 5Process: Calcining and Other Heat Reaction ProcessesMaterial: Aggregate, Unprocessed Ores
Category 5 covers the use of calciners and kilns in processing a variety of aggregates andunprocessed ores. Emissions are a result of these high temperature operations.
REFERENCES: 1-2,8
Particle Size, µm
Cumulative %≤ Stated Size(Uncontrolled)
MinimumValue
MaximumValue
StandardDeviation
1.0a 6
2.0a 13
2.5 18 3 42 11
3.0a 21
4.0a 28
5.0a 33
6.0 37 13 74 19
10.0 53 25 84 19a Value calculated from data reported at 2.5, 6.0, and 10.0 µm. No statistical parameters are given for
the calculated value.
9/90 (Reformatted 1/95) Appendix B.2 B.2-15

Table B.2.2 (cont.).
Category: 6Process: Grain HandlingMaterial: Grain
Category 6 covers various grain handling (versus grain processing) operations. Theseprocesses could include material transfer, ginning and other miscellaneous handling of grain.Emissions are generated by mechanical agitation of the material.
REFERENCES: 1,5
Particle Size, µm
Cumulative %≤ Stated Size(Uncontrolled)
MinimumValue
MaximumValue
StandardDeviation
1.0a 0.07
2.0a 0.60
2.5 1 0 2 1
3.0a 2
4.0a 3
5.0a 5
6.0 7 3 12 3
10.0 15 6 25 7a Value calculated from data reported at 2.5, 6.0, and 10.0 µm. No statistical parameters are given for
the calculated value.
B.2-16 EMISSION FACTORS (Reformatted 1/95)9/90

Table B.2.2 (cont.).
Category: 7Process: Grain ProcessingMaterial: Grain
Category 7 covers grain processing operations such as drying, screening, grinding, and milling.The particulate emissions are generated during forced air flow, separation, or size reduction.
REFERENCES: 1-2
Particle Size, µm
Cumulative %≤ Stated Size(Uncontrolled)
MinimumValue
MaximumValue
StandardDeviation
1.0a 8
2.0a 18
2.5 23 17 34 9
3.0a 27
4.0a 34
5.0a 40
6.0 43 35 48 7
10.0 61 56 65 5a Value calculated from data reported at 2.5, 6.0, and 10.0 µm. No statistical parameters are given for
the calculated value.
9/90 (Reformatted 1/95) Appendix B.2 B.2-17

Table B.2.2 (cont.).
Category: 8Process: Melting, Smelting, RefiningMaterial: Metals, except Aluminum
Category 8 covers the melting, smelting, and refining of metals (including glass) other thanaluminum. All primary and secondary production processes for these materials which involve aphysical or chemical change are included in this category. Materials handling and transfer are notincluded. Particulate emissions are a result of high temperature melting, smelting, and refining.
REFERENCES: 1-2
Particle Size, µm
Cumulative %≤ Stated Size(Uncontrolled)
MinimumValue
MaximumValue
StandardDeviation
1.0a 72
2.0a 80
2.5 82 63 99 12
3.0a 84
4.0a 86
5.0a 88
6.0 89 75 99 9
10.0 92 80 99 7a Value calculated from data reported at 2.5, 6.0, and 10.0 µm. No statistical parameters are given for
the calculated value.
B.2-18 EMISSION FACTORS (Reformatted 1/95)9/90

Table B.2.2 (cont.).
Category: 9Process: Condensation, Hydration, Absorption, Prilling, and DistillationMaterial: All
Category 9 covers condensation, hydration, absorption, prilling, and distillation of all materials.These processes involve the physical separation or combination of a wide variety of materials such assulfuric acid and ammonium nitrate fertilizer. (Coke ovens are included since they can be considereda distillation process which separates the volatile matter from coal to produce coke.)
REFERENCES: 1,3
Particle Size, µm
Cumulative %≤ Stated Size(Uncontrolled)
MinimumValue
MaximumValue
StandardDeviation
1.0a 60
2.0a 74
2.5 78 59 99 17
3.0a 81
4.0a 85
5.0a 88
6.0 91 61 99 12
10.0 94 71 99 9a Value calculated from data reported at 2.5, 6.0, and 10.0 µm. No statistical parameters are given for
the calculated value.
9/90 (Reformatted 1/95) Appendix B.2 B.2-19

B.2.3 How To Use The Generalized Particle Size Distributions For Controlled Processes
To calculate the size distribution and the size-specific emissions for a source with a particulatecontrol device, the user first calculates the uncontrolled size-specific emissions. Next, the fractionalcontrol efficiency for the control device is estimated using Table B.2-3. The Calculation Sheetprovided (Figure B.2-2) allows the user to record the type of control device and the collectionefficiencies from Table B.2-3, the mass in the size range before and after control, and the cumulativemass. The user will note that the uncontrolled size data are expressed in cumulative fraction less thanthe stated size. The control efficiency data apply only to the size range indicated and are notcumulative. These data do not include results for the greater than 10 µm particle size range. In orderto account for the total controlled emissions, particles greater than 10 µm in size must be included.
B.2.4 Example Calculation
An example calculation of uncontrolled total particulate emissions, uncontrolled size-specificemissions, and controlled size specific emission is shown in Figure B.2-1. A blank Calculation Sheetis provided in Figure B.2-2.
Table B.2-3. TYPICAL COLLECTION EFFICIENCIES OF VARIOUS PARTICULATECONTROL DEVICESa
(%)
AIRSCodeb Type Of Collector
Particle Size (µm)
0 - 2.5 2.5 - 6 6 - 10
001 Wet scrubber - hi-efficiency 90 95 99
002 Wet scrubber - med-efficiency 25 85 95
003 Wet scrubber - low-efficiency 20 80 90
004 Gravity collector - hi-efficiency 3.6 5 6
005 Gravity collector - med-efficiency 2.9 4 4.8
006 Gravity collector - low-efficiency 1.5 3.2 3.7
007 Centrifugal collector - hi-efficiency 80 95 95
008 Centrifugal collector - med-efficiency 50 75 85
009 Centrifugal collector - low-efficiency 10 35 50
010 Electrostatic precipitator - hi-efficiency 95 99 99.5
011 Electrostatic precipitator - med-efficiencyboilersother
5080
8090
9497
012 Electrostatic precipitator - low-efficiencyboilersother
4070
7080
9090
014 Mist eliminator - high velocity >250 FPM 10 75 90
015 Mist eliminator - low velocity <250 FPM 5 40 75
B.2-20 EMISSION FACTORS (Reformatted 1/95)9/90
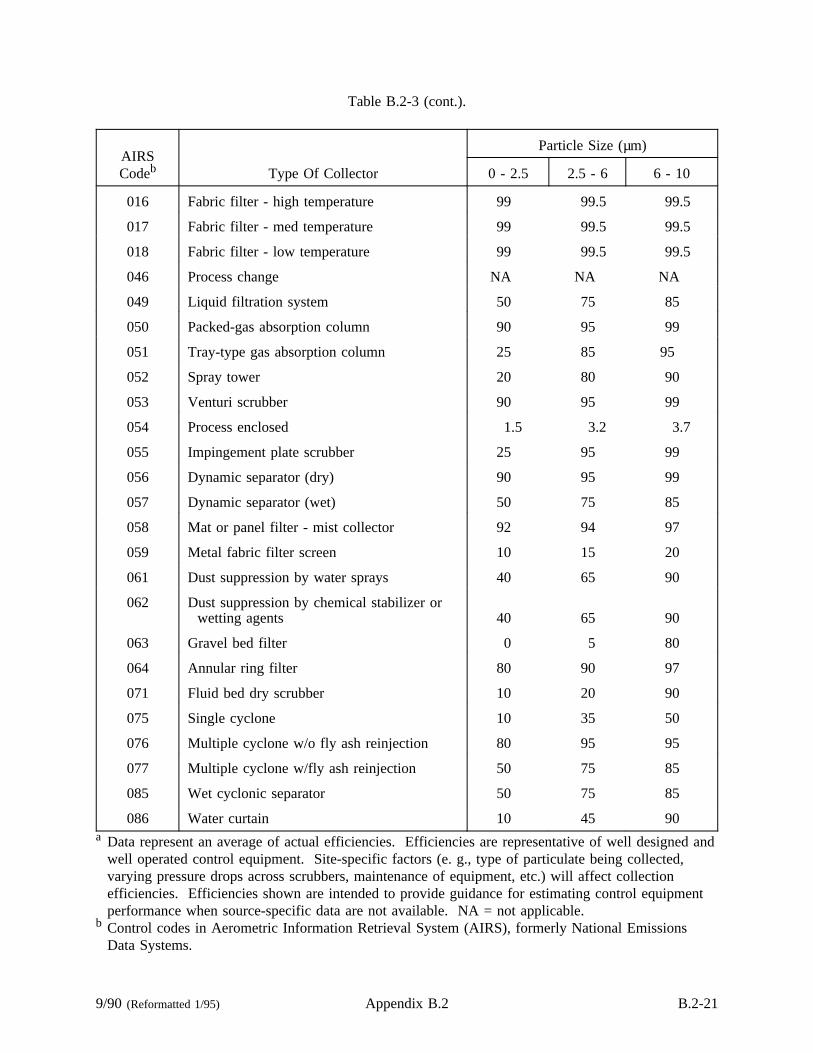
Table B.2-3 (cont.).
AIRSCodeb Type Of Collector
Particle Size (µm)
0 - 2.5 2.5 - 6 6 - 10
016 Fabric filter - high temperature 99 99.5 99.5
017 Fabric filter - med temperature 99 99.5 99.5
018 Fabric filter - low temperature 99 99.5 99.5
046 Process change NA NA NA
049 Liquid filtration system 50 75 85
050 Packed-gas absorption column 90 95 99
051 Tray-type gas absorption column 25 85 95
052 Spray tower 20 80 90
053 Venturi scrubber 90 95 99
054 Process enclosed 1.5 3.2 3.7
055 Impingement plate scrubber 25 95 99
056 Dynamic separator (dry) 90 95 99
057 Dynamic separator (wet) 50 75 85
058 Mat or panel filter - mist collector 92 94 97
059 Metal fabric filter screen 10 15 20
061 Dust suppression by water sprays 40 65 90
062 Dust suppression by chemical stabilizer orwetting agents 40 65 90
063 Gravel bed filter 0 5 80
064 Annular ring filter 80 90 97
071 Fluid bed dry scrubber 10 20 90
075 Single cyclone 10 35 50
076 Multiple cyclone w/o fly ash reinjection 80 95 95
077 Multiple cyclone w/fly ash reinjection 50 75 85
085 Wet cyclonic separator 50 75 85
086 Water curtain 10 45 90a Data represent an average of actual efficiencies. Efficiencies are representative of well designed and
well operated control equipment. Site-specific factors (e. g., type of particulate being collected,varying pressure drops across scrubbers, maintenance of equipment, etc.) will affect collectionefficiencies. Efficiencies shown are intended to provide guidance for estimating control equipmentperformance when source-specific data are not available. NA = not applicable.
b Control codes in Aerometric Information Retrieval System (AIRS), formerly National EmissionsData Systems.
9/90 (Reformatted 1/95) Appendix B.2 B.2-21

References For Appendix B.2
1. Fine Particle Emission Inventory System, Office Of Research And Development, U. S.Environmental Protection Agency, Research Triangle Park, NC, 1985.
2. Confidential test data from various sources, PEI Associates, Inc., Cincinnati, OH, 1985.
3. Final Guideline Document: Control Of Sulfuric Acid Production Units, EPA-450/2-77-019,U. S. Environmental Protection Agency, Research Triangle Park, NC, 1977.
4. Air Pollution Emission Test, Bunge Corp., Destrehan, LA, EMB-74-GRN-7, U. S.Environmental Protection Agency, Research Triangle Park, NC, 1974.
5. I. W. Kirk, "Air Quality In Saw And Roller Gin Plants",Transactions Of The ASAE, 20:5,1977.
6. Emission Test Report, Lightweight Aggregate Industry. Galite Corp., EMB- 80-LWA-6, U. S.Environmental Protection Agency, Research Triangle Park, NC, 1982.
7. Air Pollution Emission Test, Lightweight Aggregate Industry, Texas Industries, Inc.,EMB-80-LWA-3, U. S. Environmental Protection Agency, Research Triangle Park, NC, 1975.
8. Air Pollution Emission Test, Empire Mining Company, Palmer, Michigan, EMB-76-IOB-2,U. S. Environmental Protection Agency, Research Triangle Park, NC, 1975.
9. H. J. Taback,et al., Fine Particulate Emissions From Stationary Sources In The South CoastAir Basin, KVB, Inc., Tustin, CA, 1979.
10. K. Rosbury,Generalized Particle Size Distributions For Use In Preparing Particle Size-Specific Emission Inventories, U. S. EPA Contract No. 68-02-3890, PEI Associates, Inc.,Golden, CO, 1985.
B.2-22 EMISSION FACTORS (Reformatted 1/95)9/90


![The Matrix Generalized Inverse Gaussian …baner029/papers/16/CMCPMF.pdfMatrix Generalized Inverse Gaussian (MGIG) distributions [3,10] are a family of distributions over the space](https://static.fdocuments.us/doc/165x107/5f04904f7e708231d40e9764/the-matrix-generalized-inverse-gaussian-baner029papers16-matrix-generalized-inverse.jpg)


