
“Robust” chocolate bars are better · Parameter Design (the Robust Design step) Optimize the...
51
Transcript of “Robust” chocolate bars are better · Parameter Design (the Robust Design step) Optimize the...
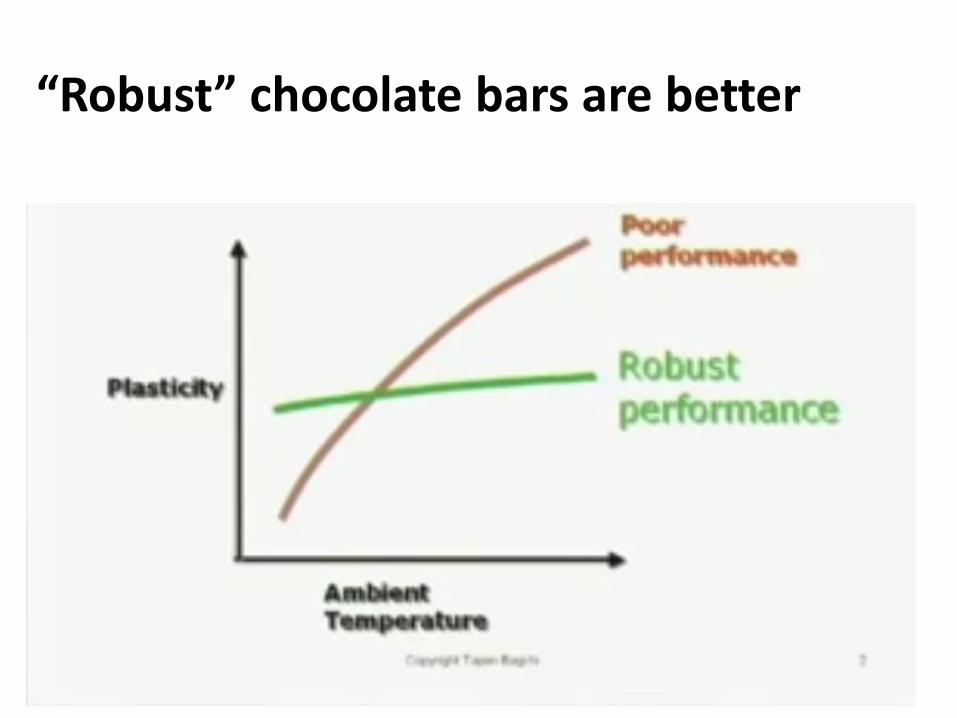
“Robust” chocolate bars are better
Taguchi Methods (or Quality Engineering or Robust Design)
Focus is on reducing variability of response to maximize robustness, generally achieved through Orthogonal Array Experiments

Historical Perspective
George E. P. Box (born 1919) was a student of R. A. Fisher. He made several advances to Fisher’s work in DOE theory and statistics. The founding chair of the University of Wisconsin’s Department of Statistics, Box was appointed the R. A. Fisher Professor of Statistics at UW in 1971.

QE Overview
Objective of this Lecture: To explore the basic ideas of two-level factorial design of experiments (DOE) and the connection of QE to statistical process control (SPC) Key Points: • DOE can help uncover significant variables and interactions among variables. • SPC can help uncover process shifts. • Quality engineering tools help the investigator to discover a path for process
improvement.
Typical QE Applications
• In manufacturing – improve performance of a manufacturing process.
• In process development – improve yields, reduce variability and cost.
• In design – evaluation and comparison of basic configurations, materials and parameters.
• The method is called Taguchi Methods. • The key tool is DOE (Design of Experiment).


C. R. Rao
You’d know Rao from his Cramer-Rao Inequality. Rao is recognized worldwide as a pioneer of modern multivariate theory and as one of the world’s top statisticians, with distinctions as a mathematician, researcher, scientist and teacher. Taught Taguchi. Author of 14 books and over 300 papers.
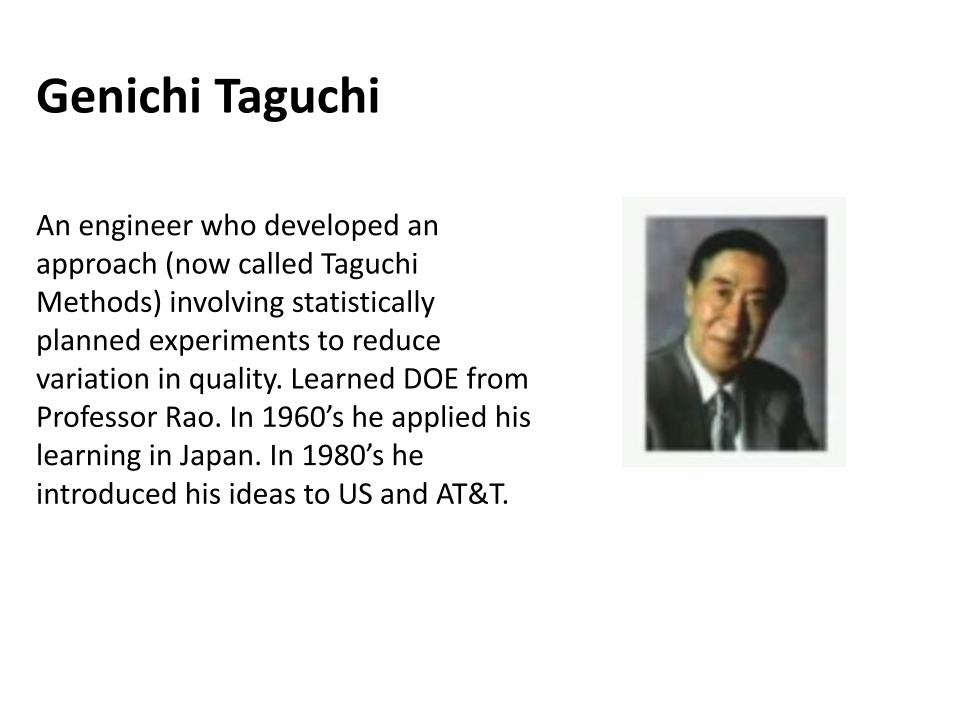
Genichi Taguchi
An engineer who developed an approach (now called Taguchi Methods) involving statistically planned experiments to reduce variation in quality. Learned DOE from Professor Rao. In 1960’s he applied his learning in Japan. In 1980’s he introduced his ideas to US and AT&T.
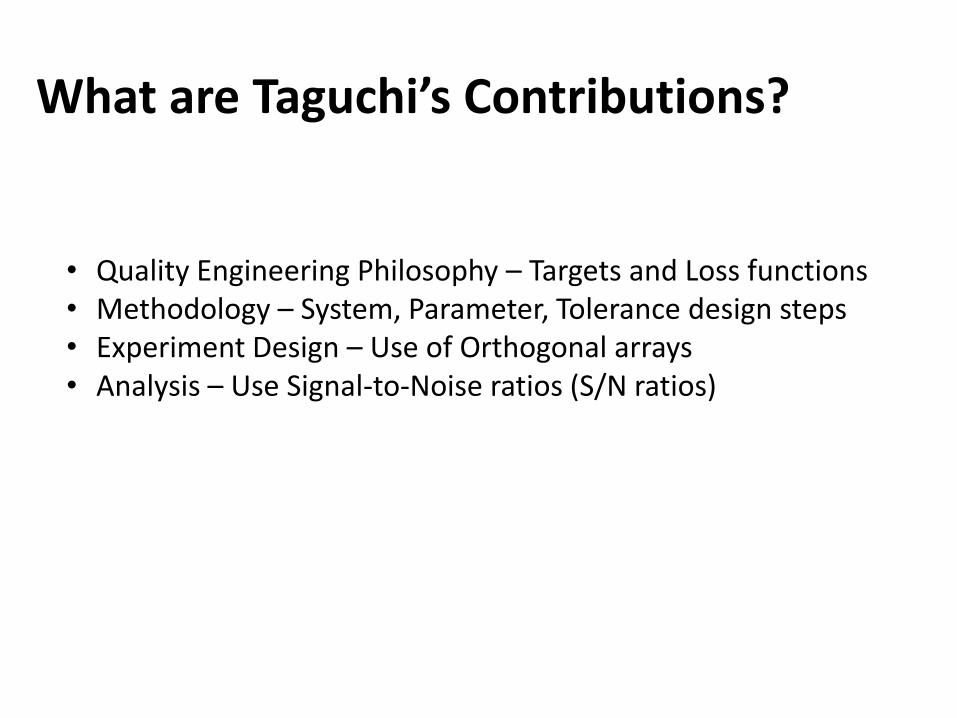
What are Taguchi’s Contributions?
• Quality Engineering Philosophy – Targets and Loss functions • Methodology – System, Parameter, Tolerance design steps • Experiment Design – Use of Orthogonal arrays • Analysis – Use Signal-to-Noise ratios (S/N ratios)
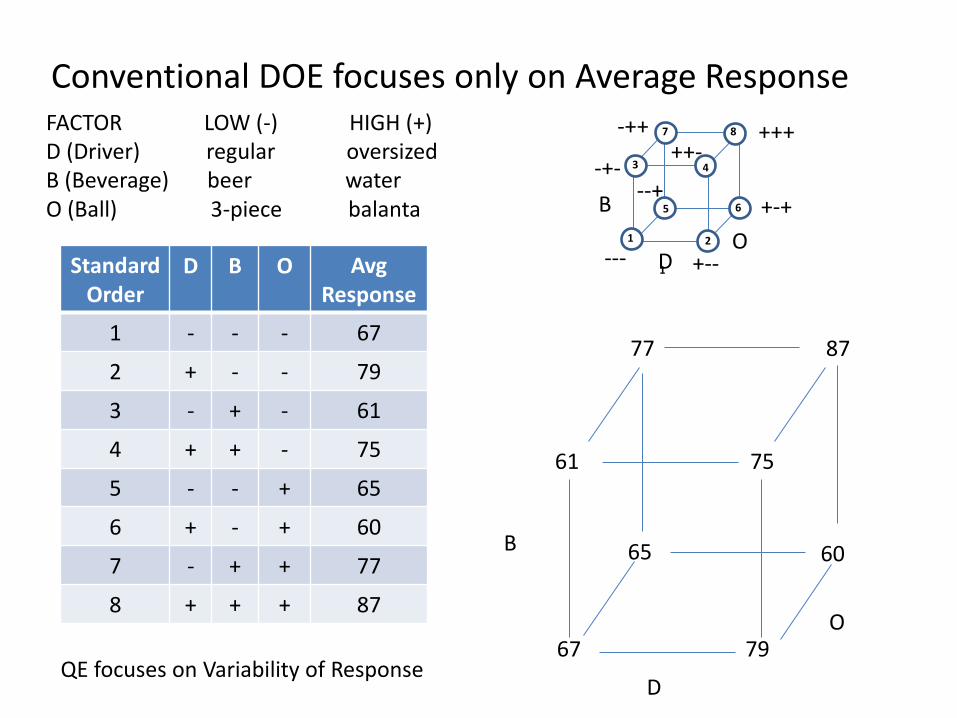
Conventional DOE focuses only on Average Response FACTOR LOW (-) HIGH (+) D (Driver) regular oversized B (Beverage) beer water O (Ball) 3-piece balanta
Avg Response
O B D Standard Order
67 - - - 1
79 - - + 2
61 - + - 3
75 - + + 4
65 + - - 5
60 + - + 6
77 + + - 7
87 + + + 8
QE focuses on Variability of Response
77 87
61 75
65 60
67 79
B
D
O
B
D O 1 2
3 4
7
5 6
1
8
--- +--
-+- ++-
--+ +-+
-++ +++
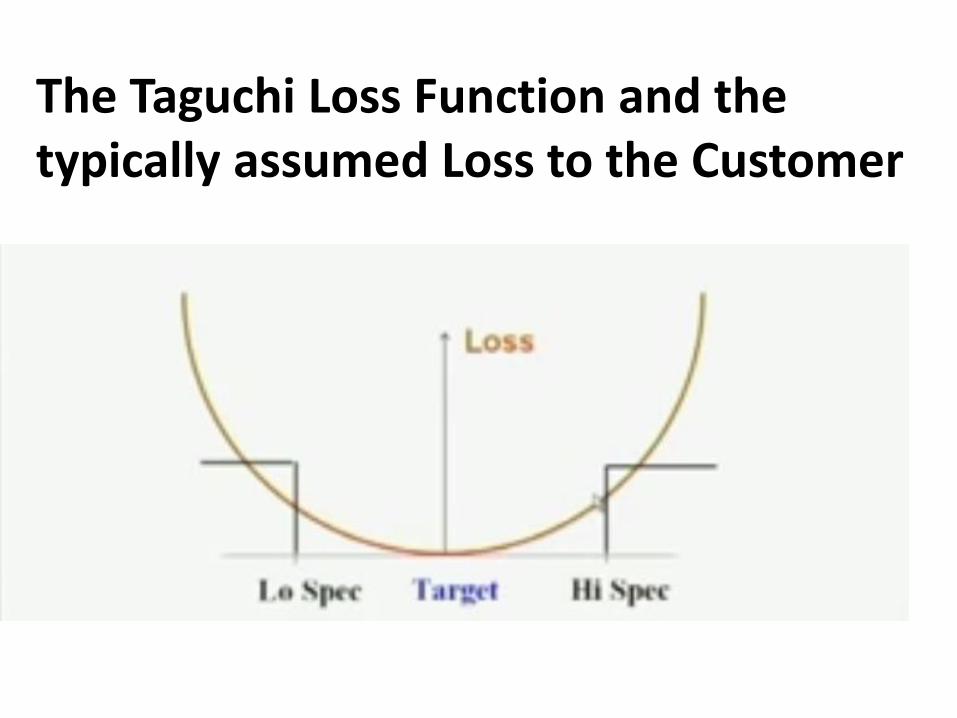
The Taguchi Loss Function and the typically assumed Loss to the Customer
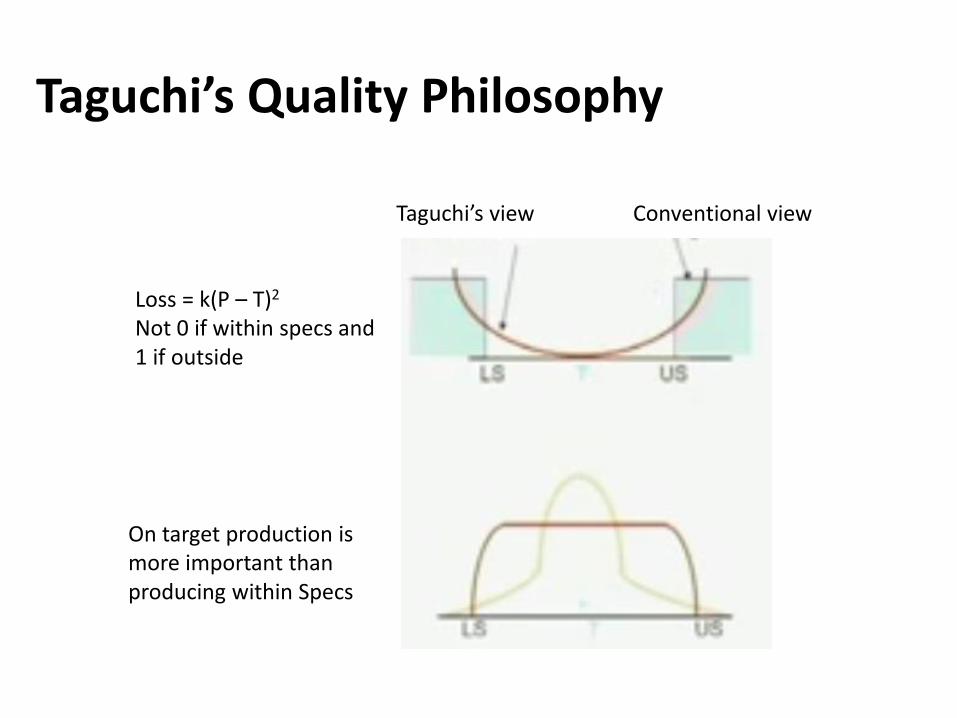
Taguchi’s Quality Philosophy
On target production is more important than producing within Specs
Loss = k(P – T)2
Not 0 if within specs and 1 if outside
Taguchi’s view Conventional view
Taguchi’s key contribution is Robust Design
Definition: Robust Design – A Design that results in products or services that can function over a broad range of usage and environmental conditions.
Taguchi’s Product Design Approach has 3 steps
System Design Choose the sub-systems, mechanisms, form of the prototype – develop the basic design. This is similar to conventional engineering design. Parameter Design Optimize the system design so that it improves quality (robustness) and reduces cost. Tolerance Design Study the tradeoffs that must be made and determine what tolerances and grades of materials are acceptable.
Parameter Design (the Robust Design step)
Optimize the settings of the design parameters to minimize its sensitivity to noise – ROBUSTNESS. By highlighting “robustness” as a key quality requirement, Taguchi really opened a whole area that previously had been talked about only by a few very applied people. His methodology is heavily dependent on design of experiments like Fisher’s and Box’s methods, but the difference he made was that for response he looked at not only the mean but also the variance of performance.
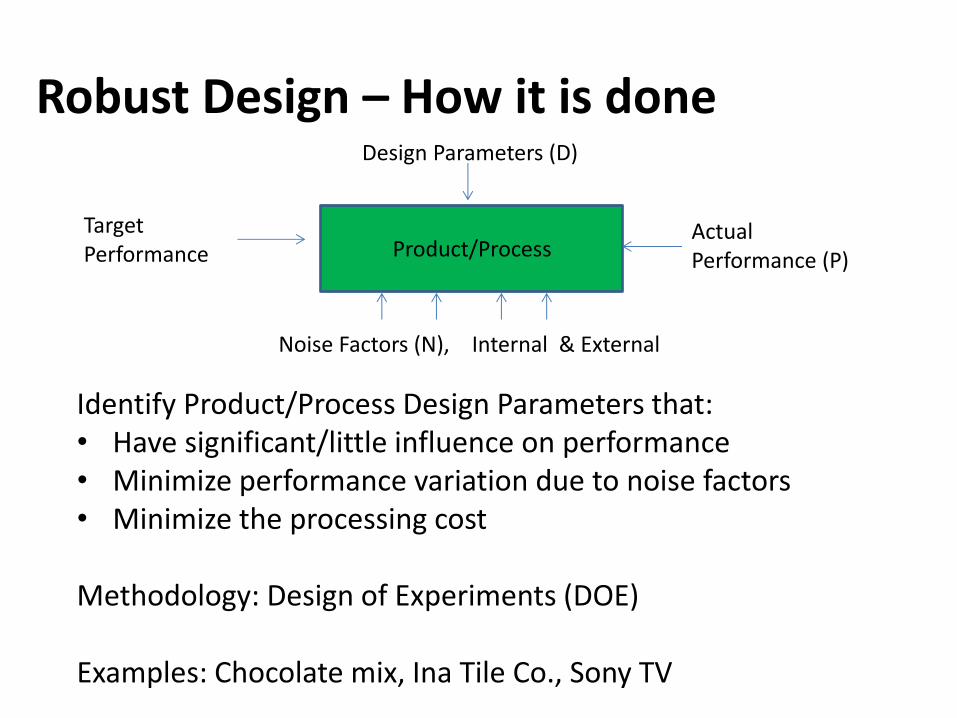
Robust Design – How it is done
Identify Product/Process Design Parameters that: • Have significant/little influence on performance • Minimize performance variation due to noise factors • Minimize the processing cost Methodology: Design of Experiments (DOE) Examples: Chocolate mix, Ina Tile Co., Sony TV
Target Performance Product/Process
Design Parameters (D)
Actual Performance (P)
Noise Factors (N), Internal & External
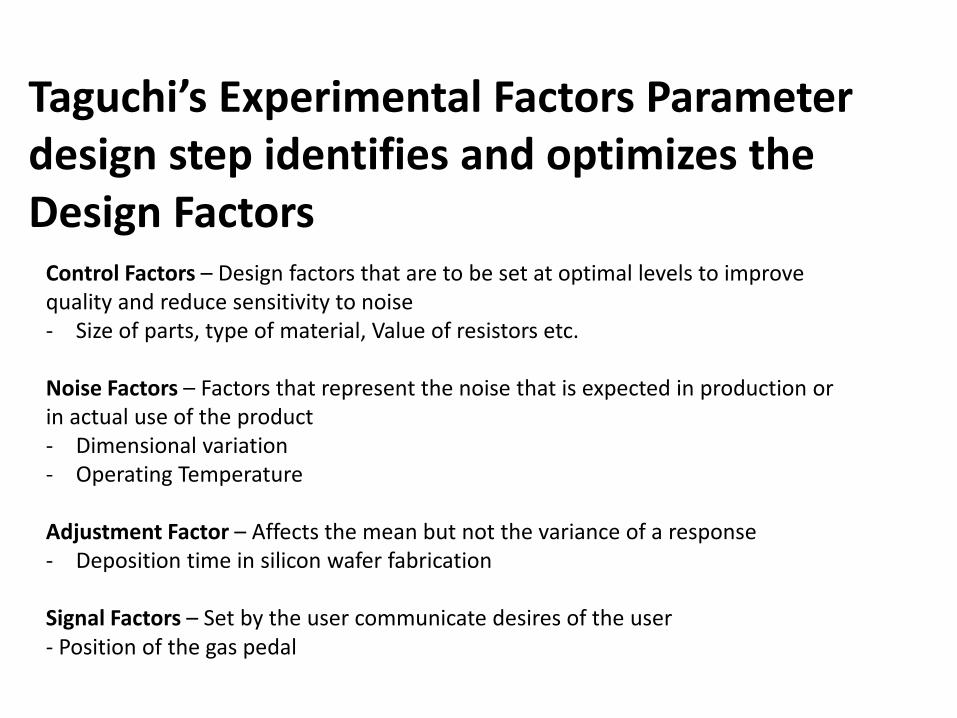
Taguchi’s Experimental Factors Parameter design step identifies and optimizes the Design Factors
Control Factors – Design factors that are to be set at optimal levels to improve quality and reduce sensitivity to noise - Size of parts, type of material, Value of resistors etc.
Noise Factors – Factors that represent the noise that is expected in production or in actual use of the product - Dimensional variation - Operating Temperature
Adjustment Factor – Affects the mean but not the variance of a response - Deposition time in silicon wafer fabrication
Signal Factors – Set by the user communicate desires of the user - Position of the gas pedal
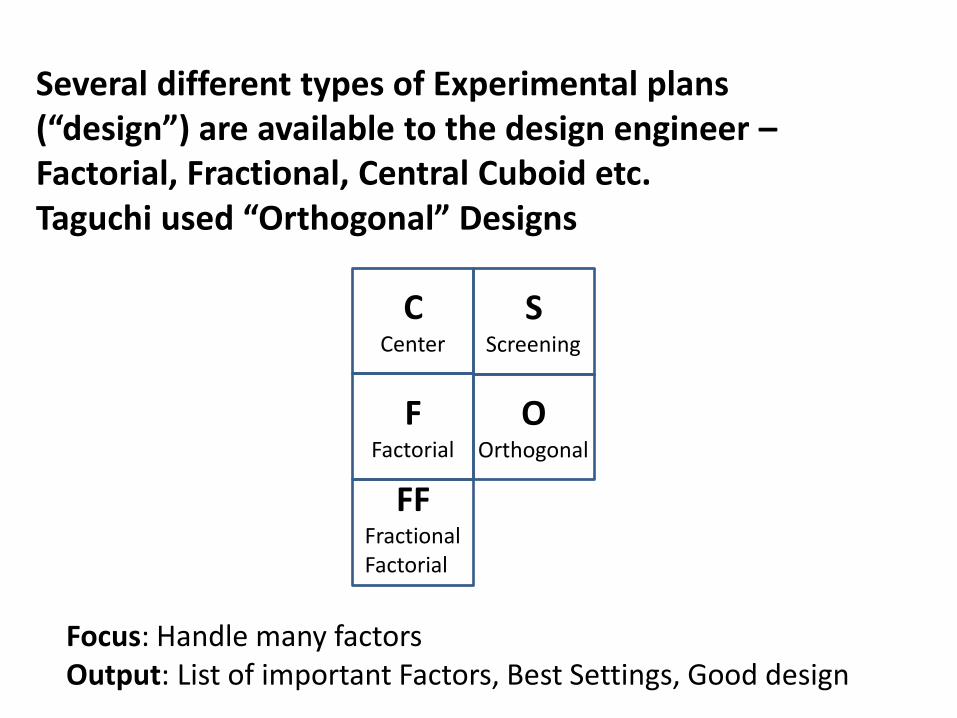
Several different types of Experimental plans (“design”) are available to the design engineer – Factorial, Fractional, Central Cuboid etc. Taguchi used “Orthogonal” Designs
C Center
S Screening
O Orthogonal
F Factorial
FF Fractional Factorial
Focus: Handle many factors Output: List of important Factors, Best Settings, Good design
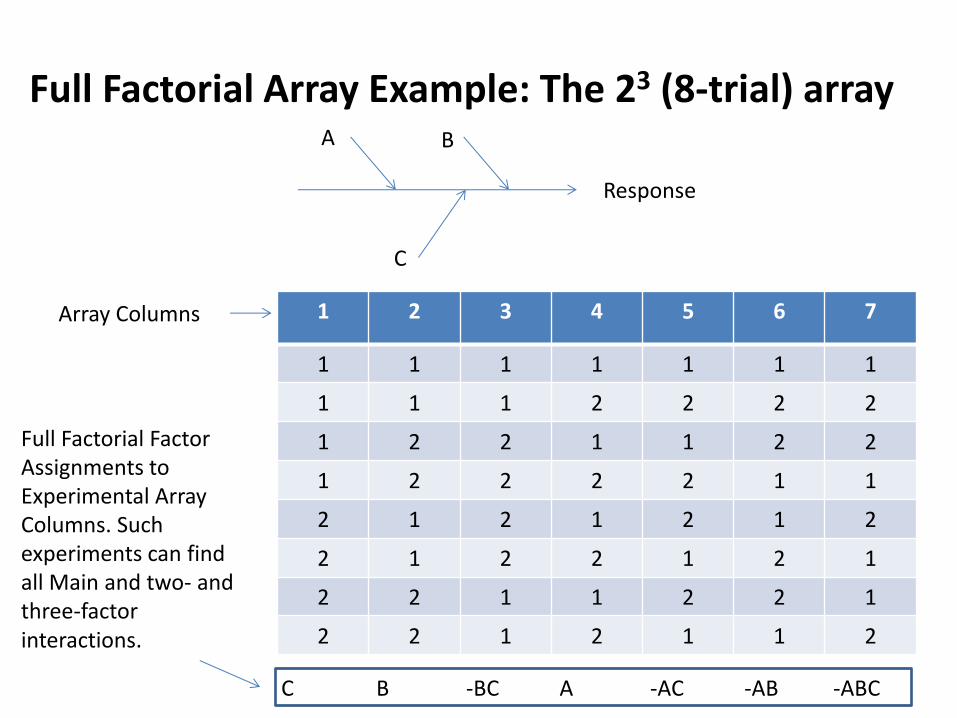
Full Factorial Array Example: The 23 (8-trial) array
A B
C
7 6 5 4 3 2 1
1 1 1 1 1 1 1
2 2 2 2 1 1 1
2 2 1 1 2 2 1
1 1 2 2 2 2 1
2 1 2 1 2 1 2
1 2 1 2 2 1 2
1 2 2 1 1 2 2
2 1 1 2 1 2 2
Full Factorial Factor Assignments to Experimental Array Columns. Such experiments can find all Main and two- and three-factor interactions.
C B -BC A -AC -AB -ABC
Array Columns
Response
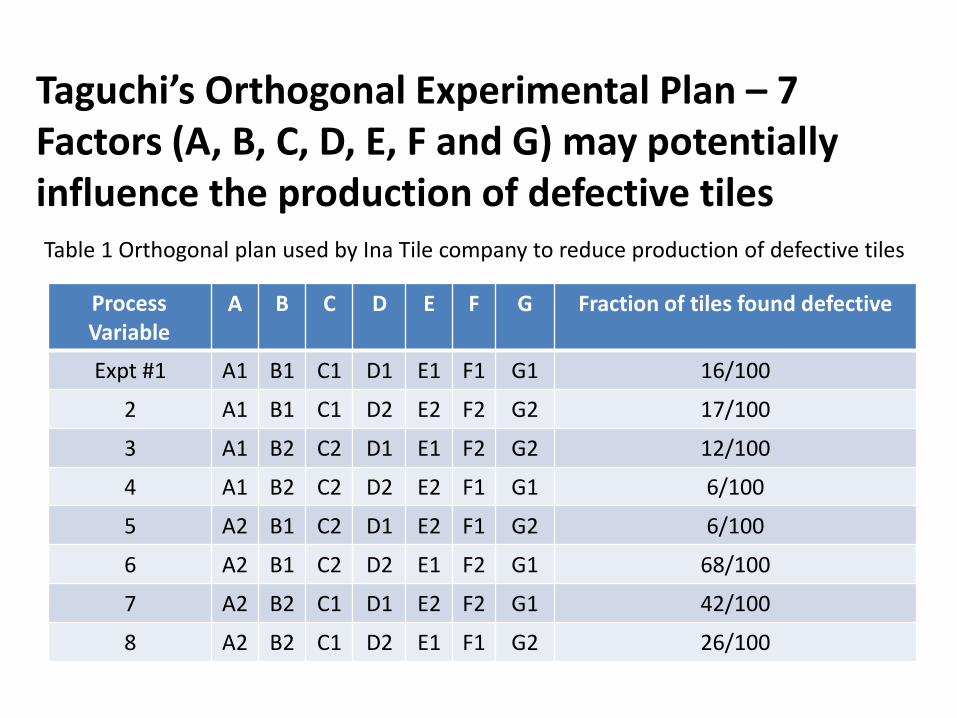
Taguchi’s Orthogonal Experimental Plan – 7 Factors (A, B, C, D, E, F and G) may potentially influence the production of defective tiles
Table 1 Orthogonal plan used by Ina Tile company to reduce production of defective tiles
Fraction of tiles found defective G F E D C B A Process Variable
16/100 G1 F1 E1 D1 C1 B1 A1 Expt #1
17/100 G2 F2 E2 D2 C1 B1 A1 2
12/100 G2 F2 E1 D1 C2 B2 A1 3
6/100 G1 F1 E2 D2 C2 B2 A1 4
6/100 G2 F1 E2 D1 C2 B1 A2 5
68/100 G1 F2 E1 D2 C2 B1 A2 6
42/100 G1 F2 E2 D1 C1 B2 A2 7
26/100 G2 F1 E1 D2 C1 B2 A2 8
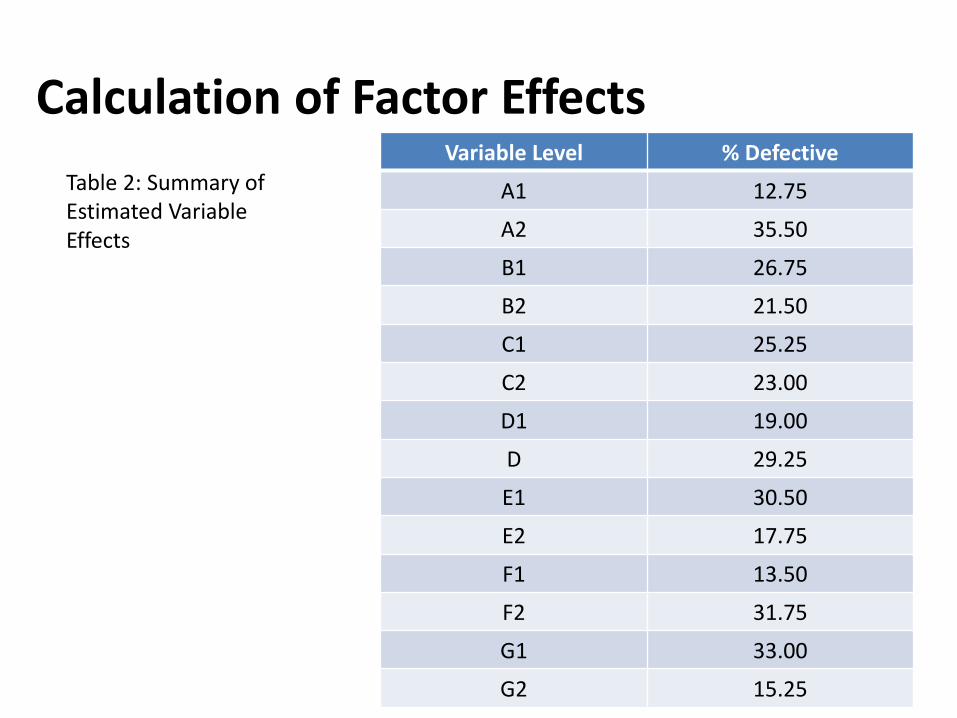
Calculation of Factor Effects
Table 2: Summary of Estimated Variable Effects
% Defective Variable Level
12.75 A1
35.50 A2
26.75 B1
21.50 B2
25.25 C1
23.00 C2
19.00 D1
29.25 D
30.50 E1
17.75 E2
13.50 F1
31.75 F2
33.00 G1
15.25 G2
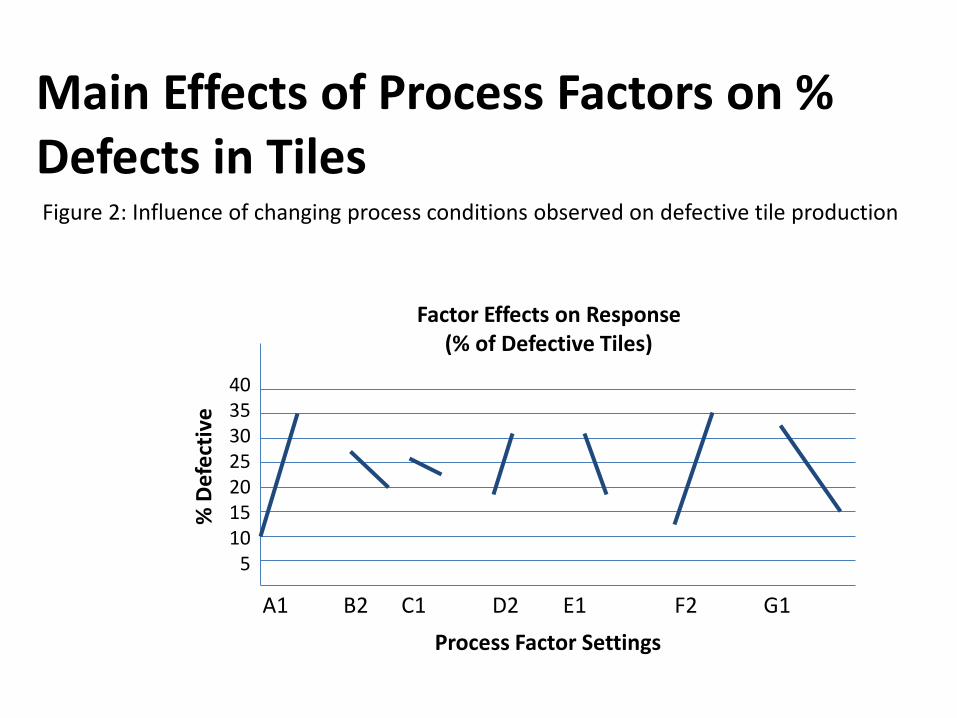
Main Effects of Process Factors on % Defects in Tiles Figure 2: Influence of changing process conditions observed on defective tile production
Process Factor Settings
% D
efe
ctiv
e
Factor Effects on Response (% of Defective Tiles)
40 35 30 25 20 15 10
5
A1 B2 C1 D2 E1 F2 G1
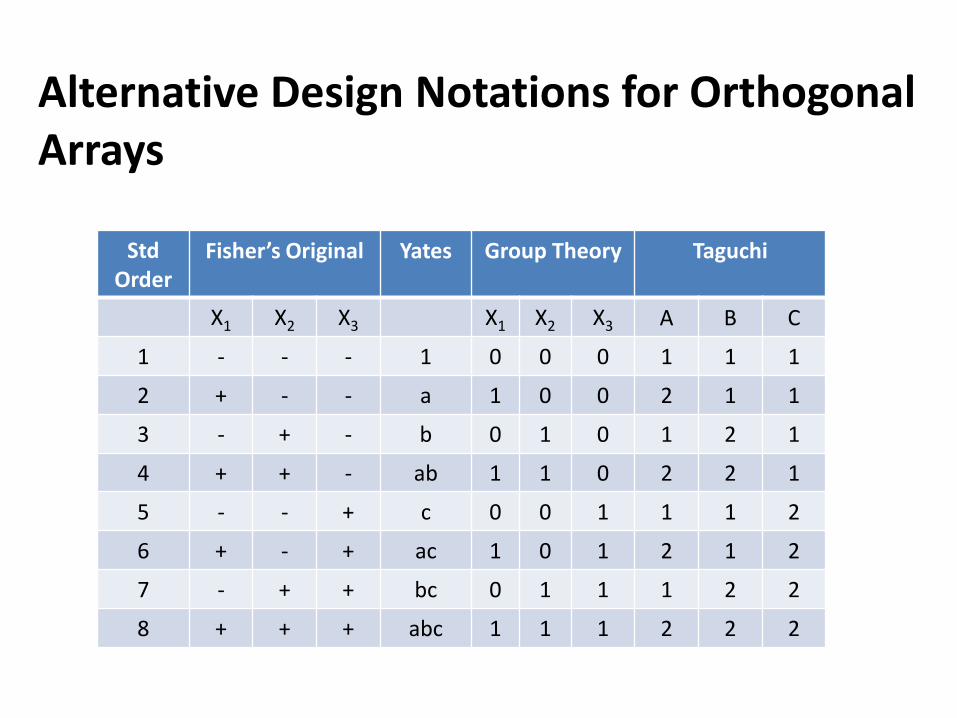
Alternative Design Notations for Orthogonal Arrays
Taguchi Group Theory Yates Fisher’s Original Std Order
C B A X3 X2 X1 X3 X2 X1
1 1 1 0 0 0 1 - - - 1
1 1 2 0 0 1 a - - + 2
1 2 1 0 1 0 b - + - 3
1 2 2 0 1 1 ab - + + 4
2 1 1 1 0 0 c + - - 5
2 1 2 1 0 1 ac + - + 6
2 2 1 1 1 0 bc + + - 7
2 2 2 1 1 1 abc + + + 8
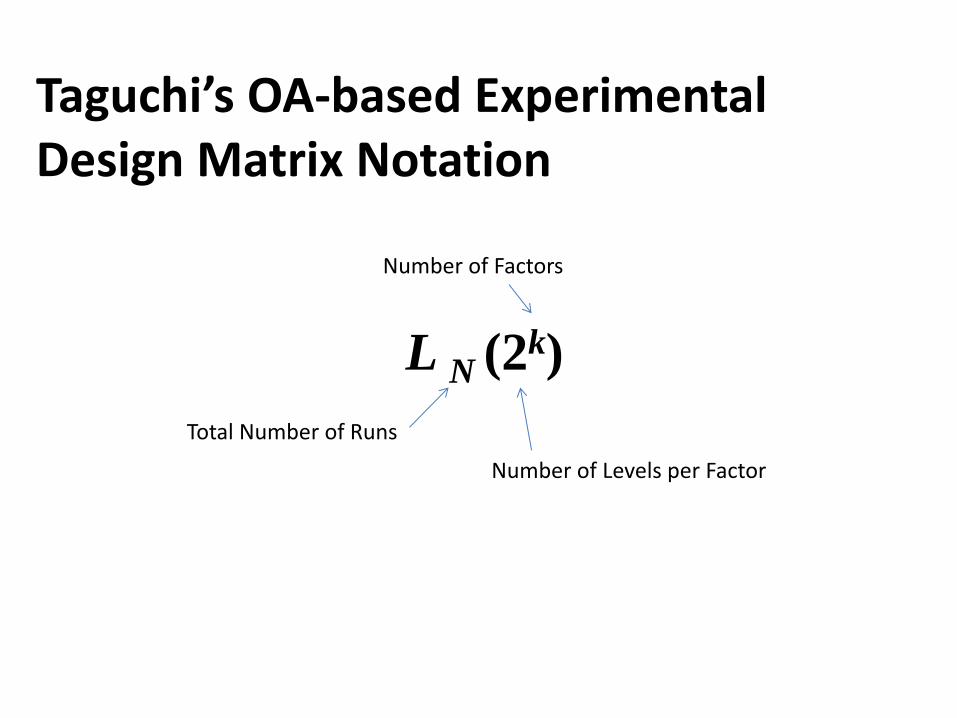
Taguchi’s OA-based Experimental Design Matrix Notation
L N (2k)
Number of Factors
Total Number of Runs
Number of Levels per Factor
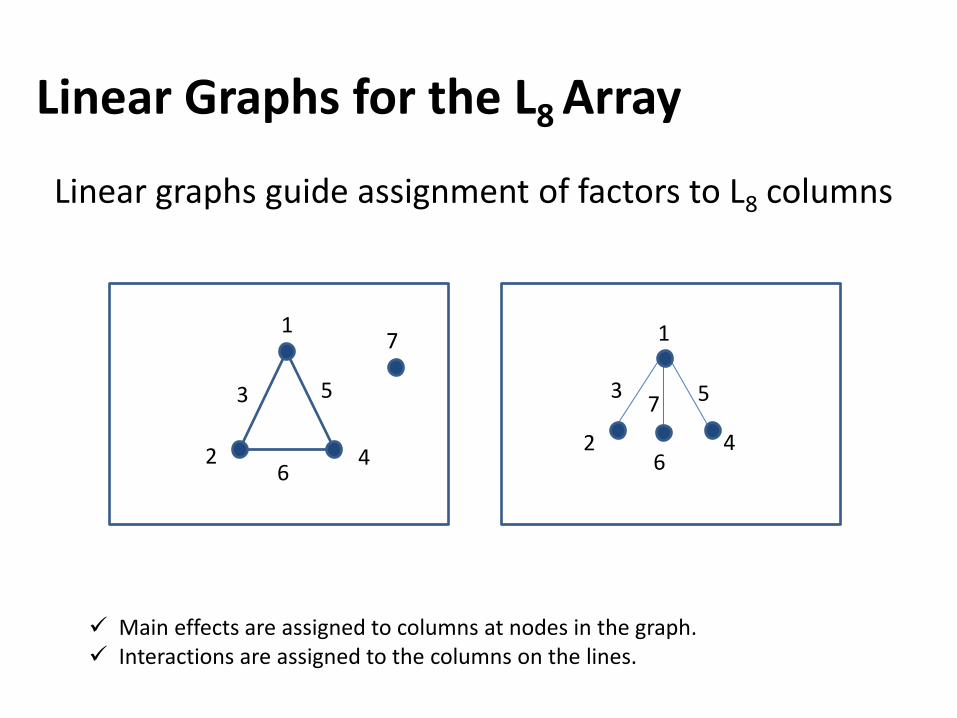
Linear Graphs for the L8 Array
Linear graphs guide assignment of factors to L8 columns
Main effects are assigned to columns at nodes in the graph. Interactions are assigned to the columns on the lines.
7 1
3
2 2
3
1
7
6 6 4 4
5 5
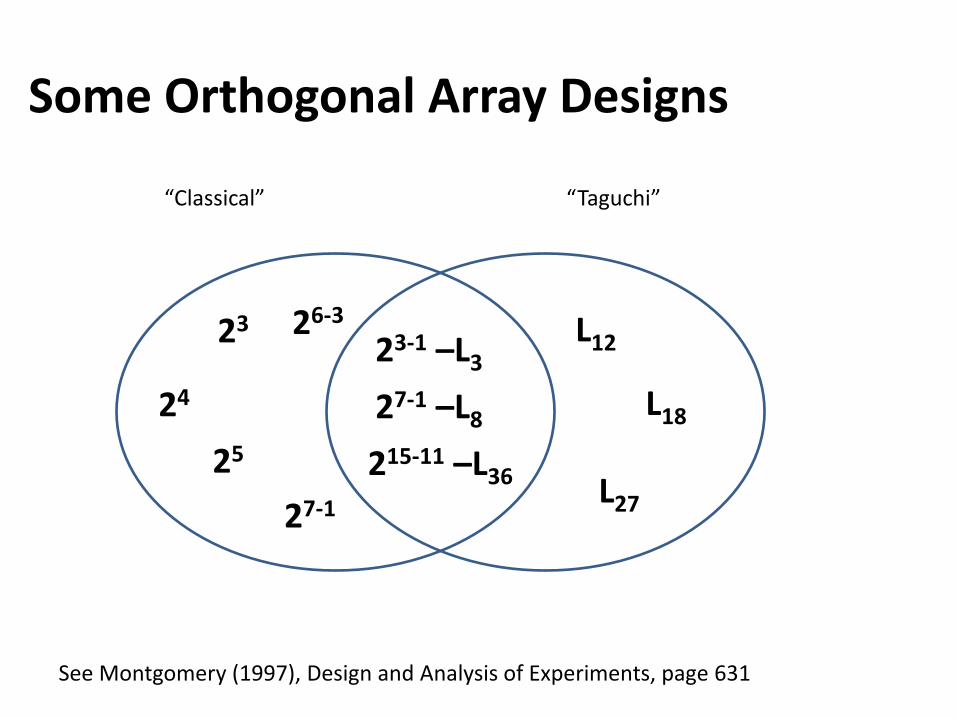
Some Orthogonal Array Designs
See Montgomery (1997), Design and Analysis of Experiments, page 631
“Classical” “Taguchi”
23
24
25
27-1
26-3
23-1 –L3
27-1 –L8
215-11 –L36
L12
L18
L27
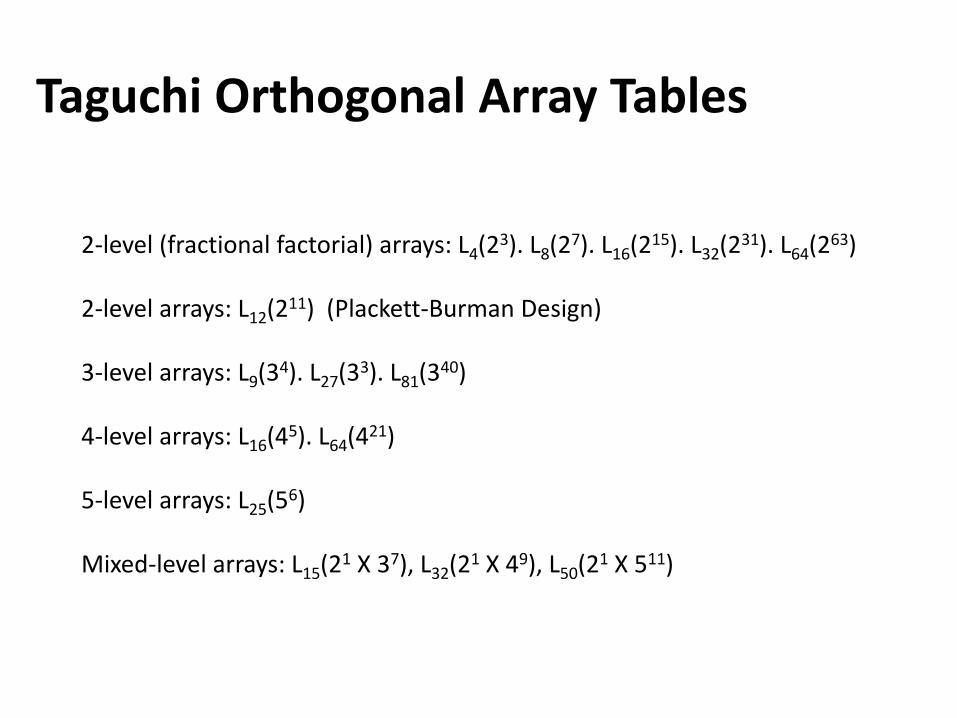
Taguchi Orthogonal Array Tables
2-level (fractional factorial) arrays: L4(23). L8(27). L16(215). L32(231). L64(263) 2-level arrays: L12(211) (Plackett-Burman Design) 3-level arrays: L9(34). L27(33). L81(340) 4-level arrays: L16(45). L64(421) 5-level arrays: L25(56) Mixed-level arrays: L15(21 X 37), L32(21 X 49), L50(21 X 511)
Comments on Taguchi Arrays
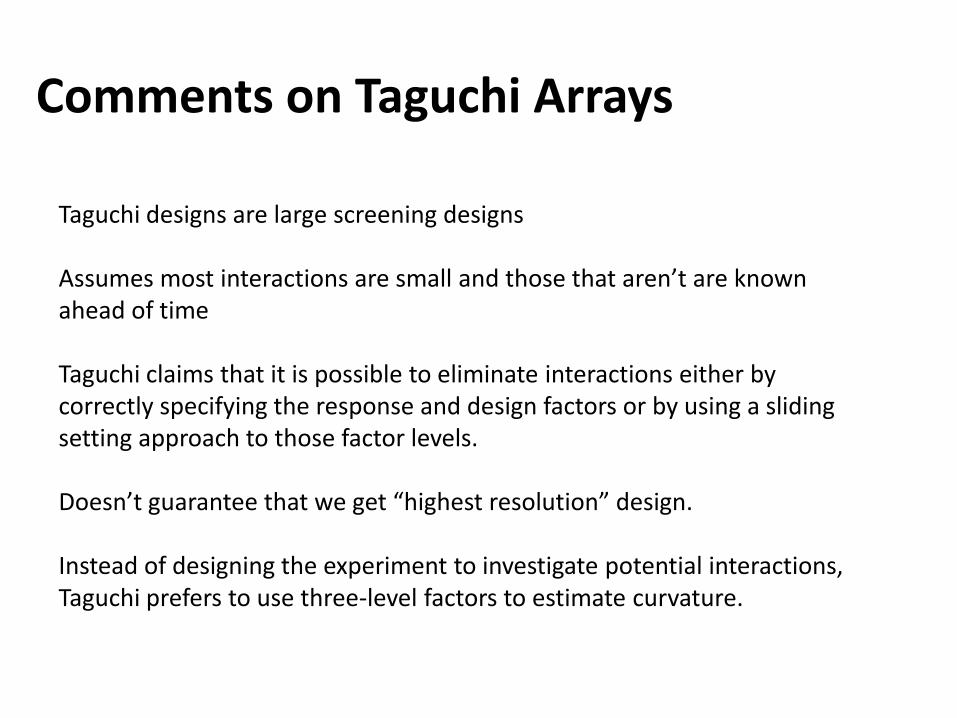
Taguchi designs are large screening designs Assumes most interactions are small and those that aren’t are known ahead of time Taguchi claims that it is possible to eliminate interactions either by correctly specifying the response and design factors or by using a sliding setting approach to those factor levels. Doesn’t guarantee that we get “highest resolution” design. Instead of designing the experiment to investigate potential interactions, Taguchi prefers to use three-level factors to estimate curvature.
Taguchi’s Robust Design Experiments
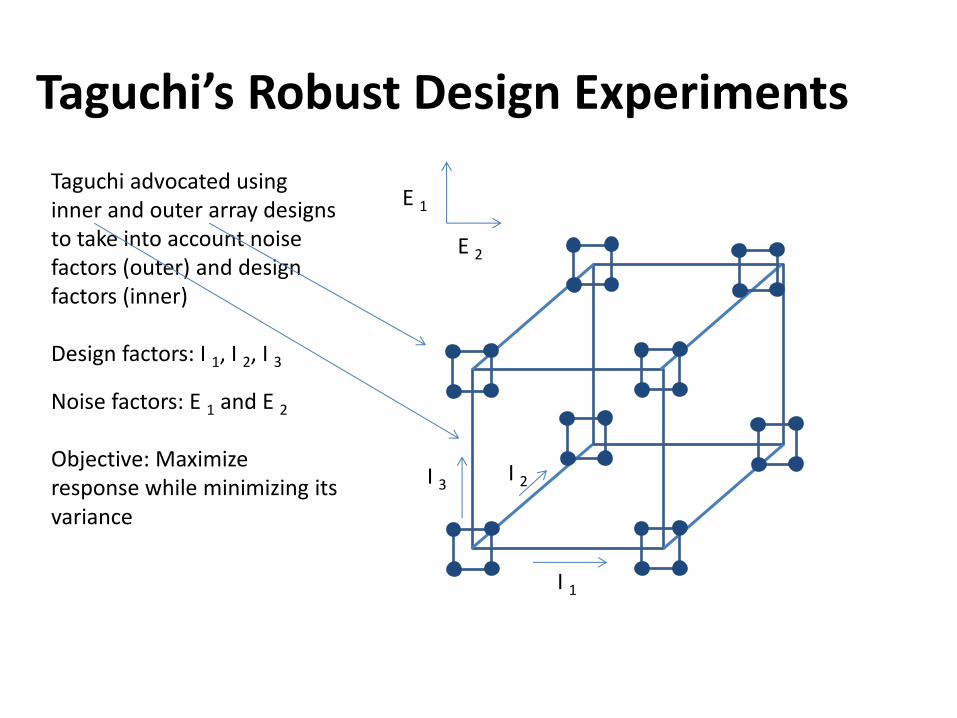
Taguchi advocated using inner and outer array designs to take into account noise factors (outer) and design factors (inner) Design factors: I 1, I 2, I 3
Noise factors: E 1 and E 2
Objective: Maximize response while minimizing its variance
I 1
I 2 I 3
E 1
E 2
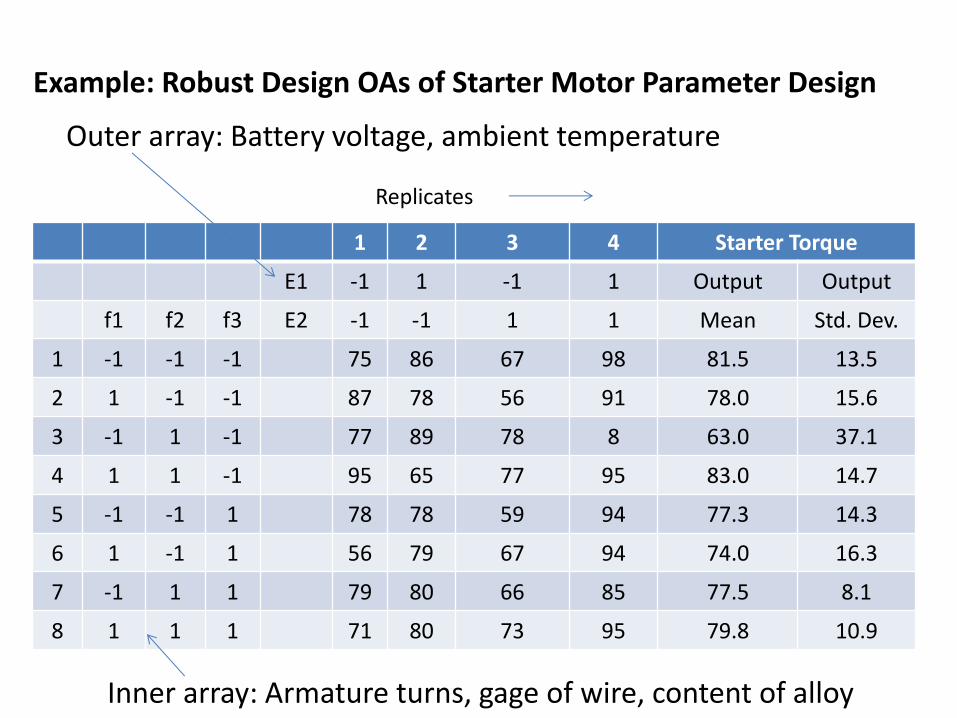
Example: Robust Design OAs of Starter Motor Parameter Design
Starter Torque 4 3 2 1
Output Output 1 -1 1 -1 E1
Std. Dev. Mean 1 1 -1 -1 E2 f3 f2 f1
13.5 81.5 98 67 86 75 -1 -1 -1 1
15.6 78.0 91 56 78 87 -1 -1 1 2
37.1 63.0 8 78 89 77 -1 1 -1 3
14.7 83.0 95 77 65 95 -1 1 1 4
14.3 77.3 94 59 78 78 1 -1 -1 5
16.3 74.0 94 67 79 56 1 -1 1 6
8.1 77.5 85 66 80 79 1 1 -1 7
10.9 79.8 95 73 80 71 1 1 1 8
Outer array: Battery voltage, ambient temperature
Replicates
Inner array: Armature turns, gage of wire, content of alloy
S/N Ratios are Maximized
𝑆𝑁𝑧 = 10log(𝑦2
𝑠2)
𝑆𝑁𝑧 = −10log( 1/𝑦2
𝑛)
𝑆𝑁𝑧 = −10log( 𝑦2
𝑛)
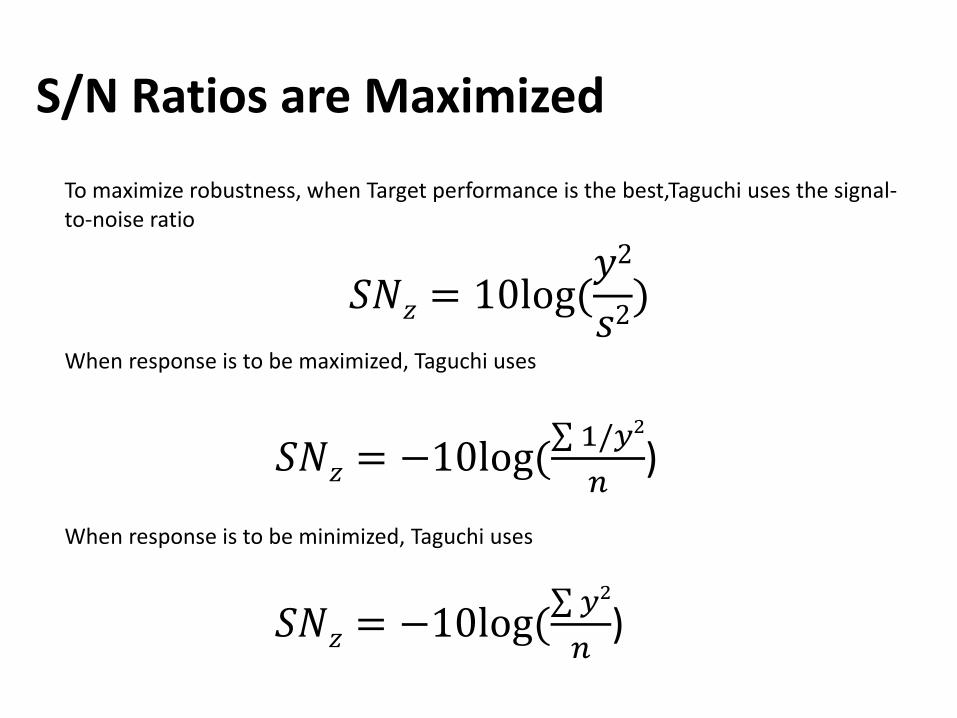
To maximize robustness, when Target performance is the best,Taguchi uses the signal-to-noise ratio
When response is to be maximized, Taguchi uses
When response is to be minimized, Taguchi uses
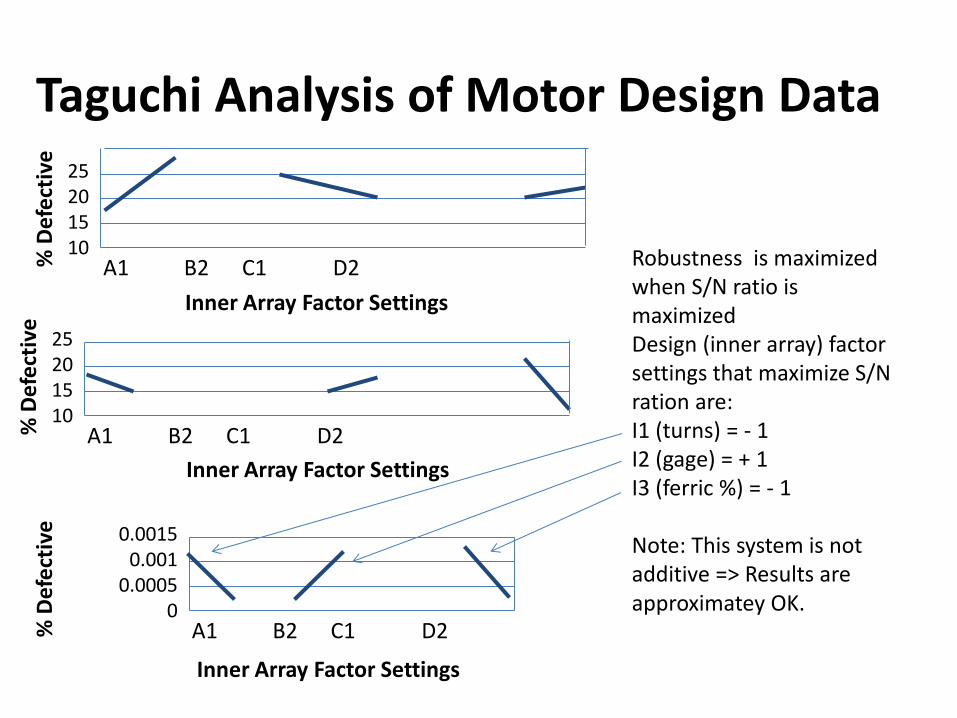
Taguchi Analysis of Motor Design Data
Robustness is maximized when S/N ratio is maximized Design (inner array) factor settings that maximize S/N ration are: I1 (turns) = - 1 I2 (gage) = + 1 I3 (ferric %) = - 1 Note: This system is not additive => Results are approximatey OK.
Inner Array Factor Settings
% D
efe
ctiv
e
25 20 15 10
A1 B2 C1 D2
Inner Array Factor Settings
% D
efe
ctiv
e
25 20 15 10
A1 B2 C1 D2
Inner Array Factor Settings
% D
efe
ctiv
e
0.0015 0.001
0.0005 0
A1 B2 C1 D2
Epilogue
Designers should embrace Taguchi’s philosophy of quality engineering. It makes very good sense. Note, however, that a key weakness of Taguchi method is its assumption of a “main factor only” (or “additive” model) … Taguchi ignores interactions Therefore, rather than use inner – outer arrays, we may use more efficient and exact methods that are no more difficult to learn and apply to carry Taguchi’s robust design philosophy into practice… You may use any of the various experimental and optimization techniques available in the literature such as multiple regression/RSM to develop robust designs. An example of such extension is shown in next slides.
Multiobjective Robust Design by Metaheuristic Methods
Tapan P. Bagchi & Madhu Ranjan Kumar (1993)
Sensitivity Analysis vs. “Robust Design”
Practice common in conventional engineering design: sensitivity analysis (SA). SA finds likely changes expected in the design’s performance due to uncontrollable factors. For designs too sensitive, one uses the worst-case scenario – to plan for the unexpected. However, worst-case projections often unnecessary: a “robust design” can greatly reduce off-target performance (Taguchi, 1986)
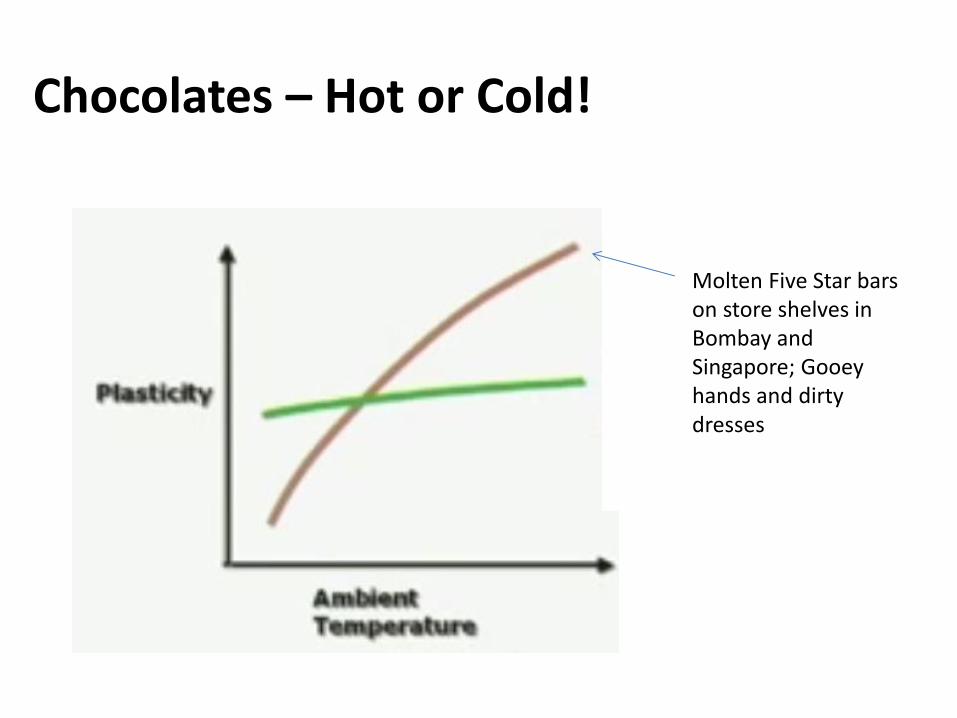
Chocolates – Hot or Cold!
Molten Five Star bars on store shelves in Bombay and Singapore; Gooey hands and dirty dresses
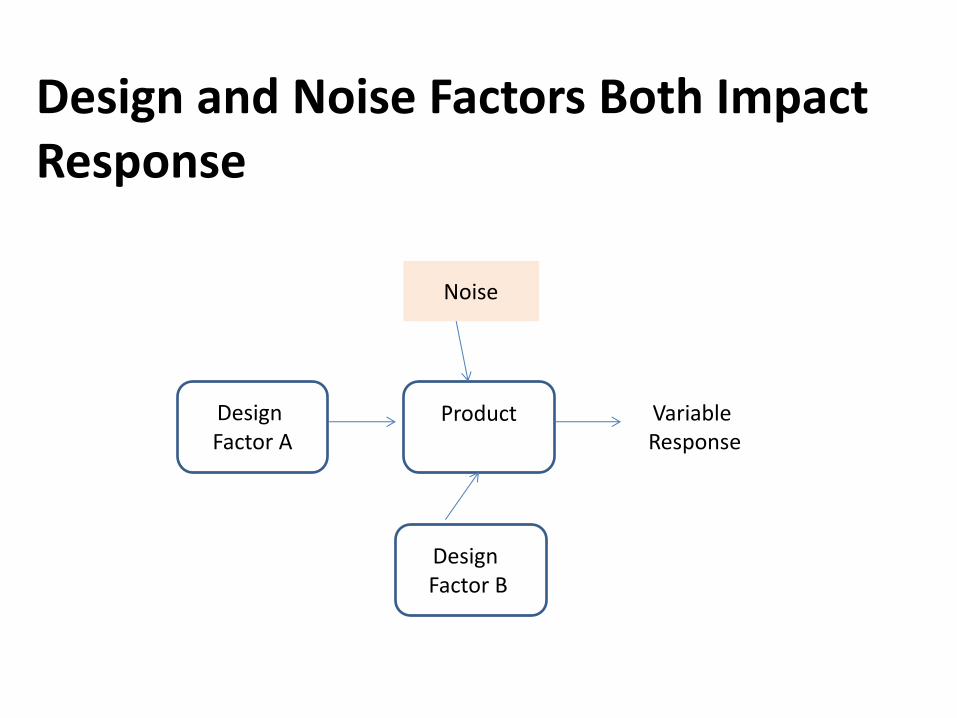
Design and Noise Factors Both Impact Response
Noise
Design Factor A
Product
Design Factor B
Variable Response
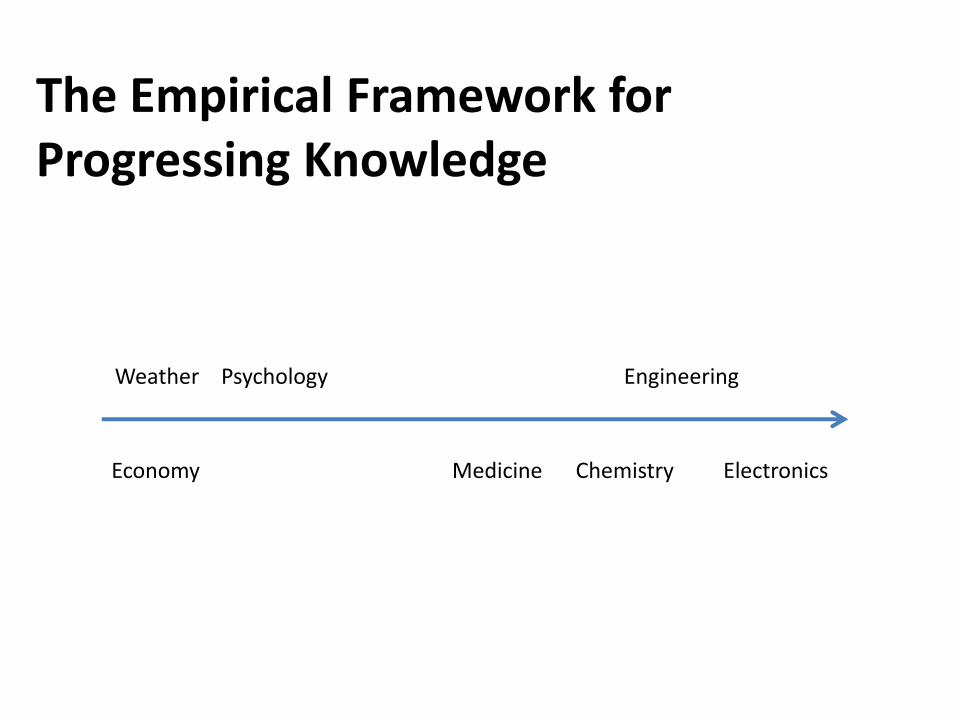
The Empirical Framework for Progressing Knowledge
Weather Psychology Engineering
Economy Medicine Chemistry Electronics
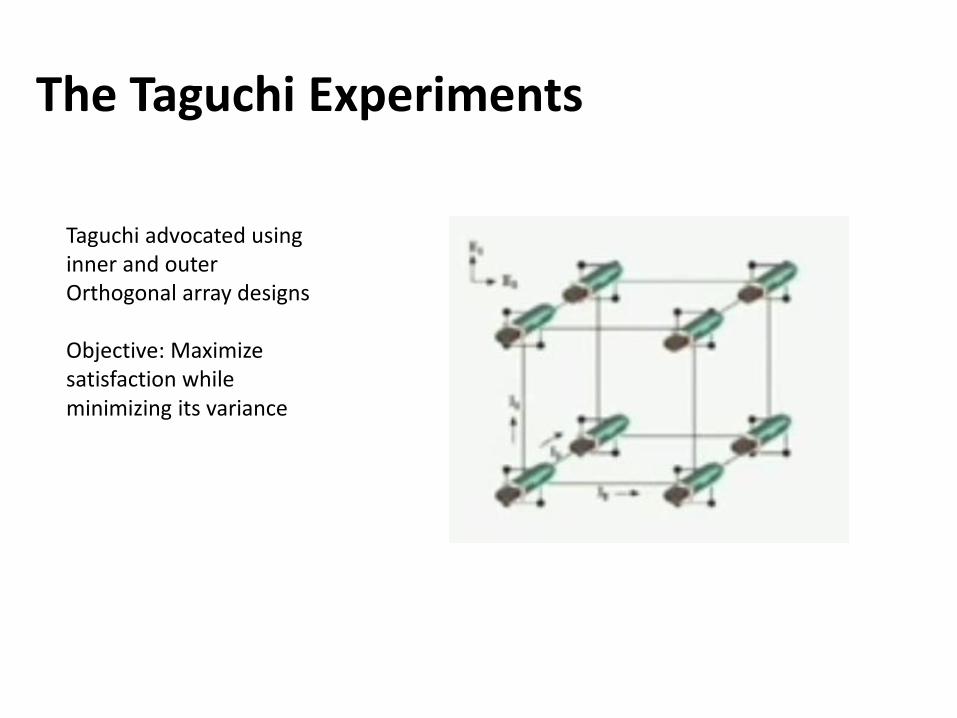
The Taguchi Experiments
Taguchi advocated using inner and outer Orthogonal array designs Objective: Maximize satisfaction while minimizing its variance
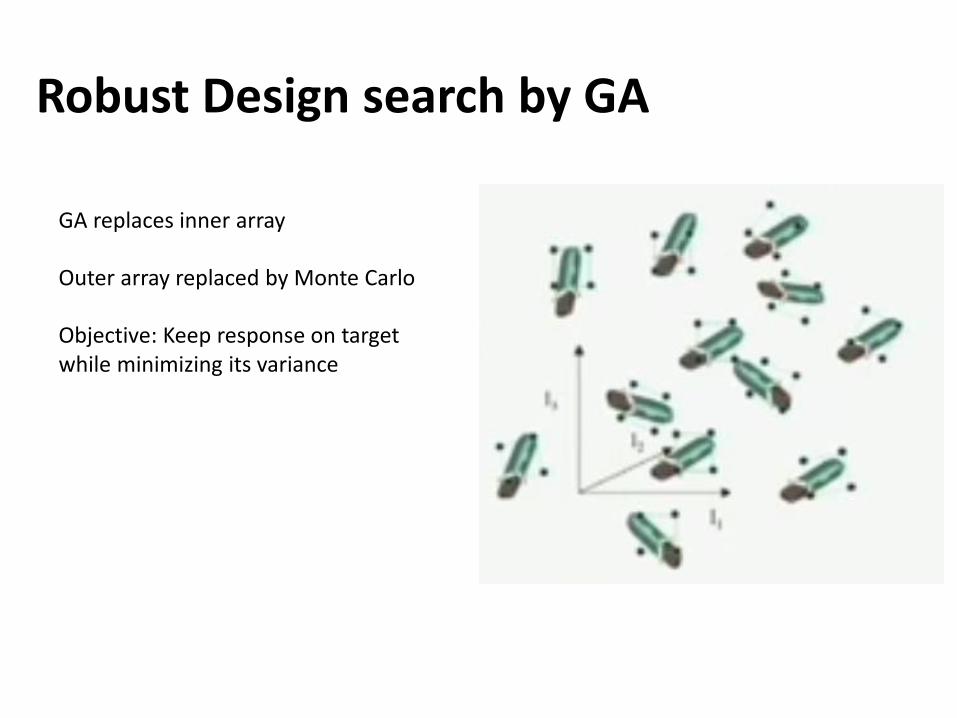
Robust Design search by GA
GA replaces inner array Outer array replaced by Monte Carlo Objective: Keep response on target while minimizing its variance
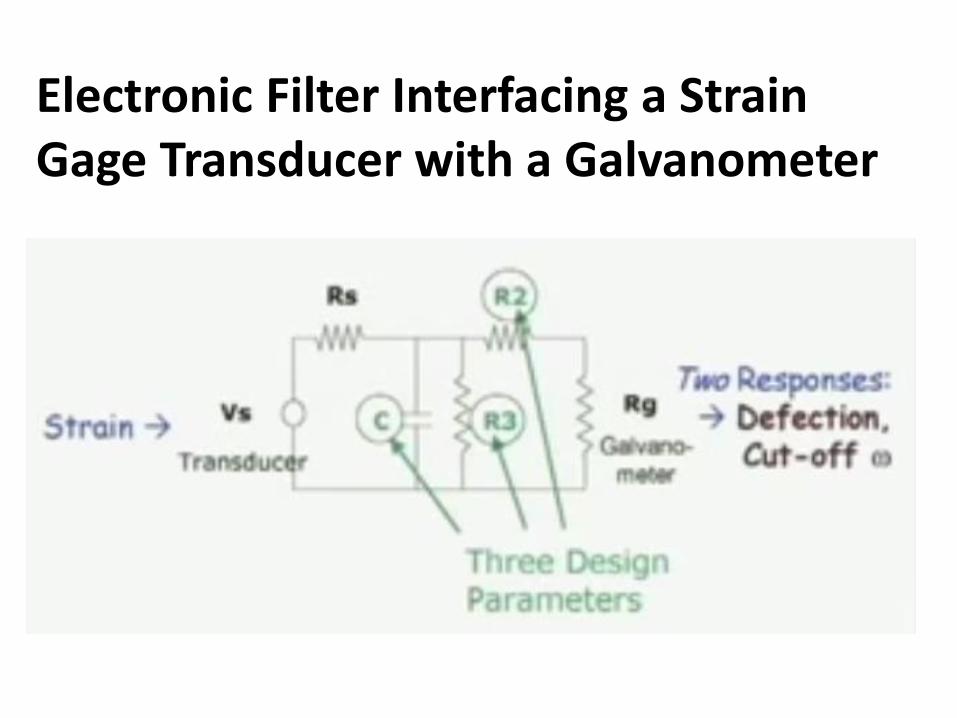
Electronic Filter Interfacing a Strain Gage Transducer with a Galvanometer
The Two Responses to be Made Robust
𝑅2 + 𝑔 𝑅𝑠𝑅3 + 𝑅3. 𝑅𝑠
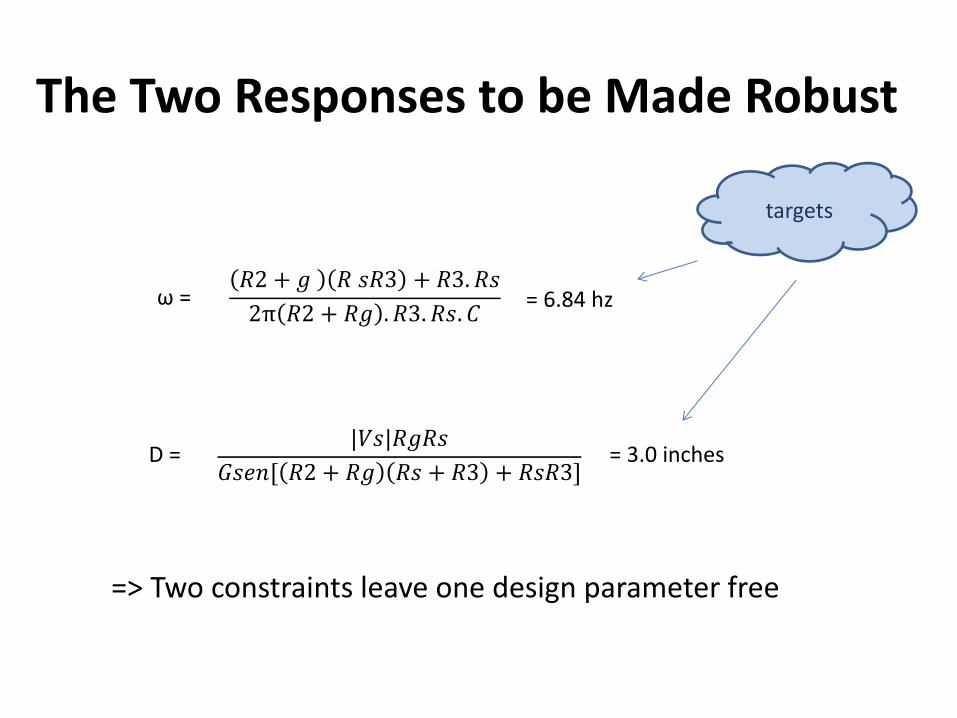
2π 𝑅2 + 𝑅𝑔 . 𝑅3. 𝑅𝑠. 𝐶 ω = = 6.84 hz
D = |𝑉𝑠|𝑅𝑔𝑅𝑠
𝐺𝑠𝑒𝑛[ 𝑅2 + 𝑅𝑔 𝑅𝑠 + 𝑅3 + 𝑅𝑠𝑅3] = 3.0 inches
=> Two constraints leave one design parameter free
targets
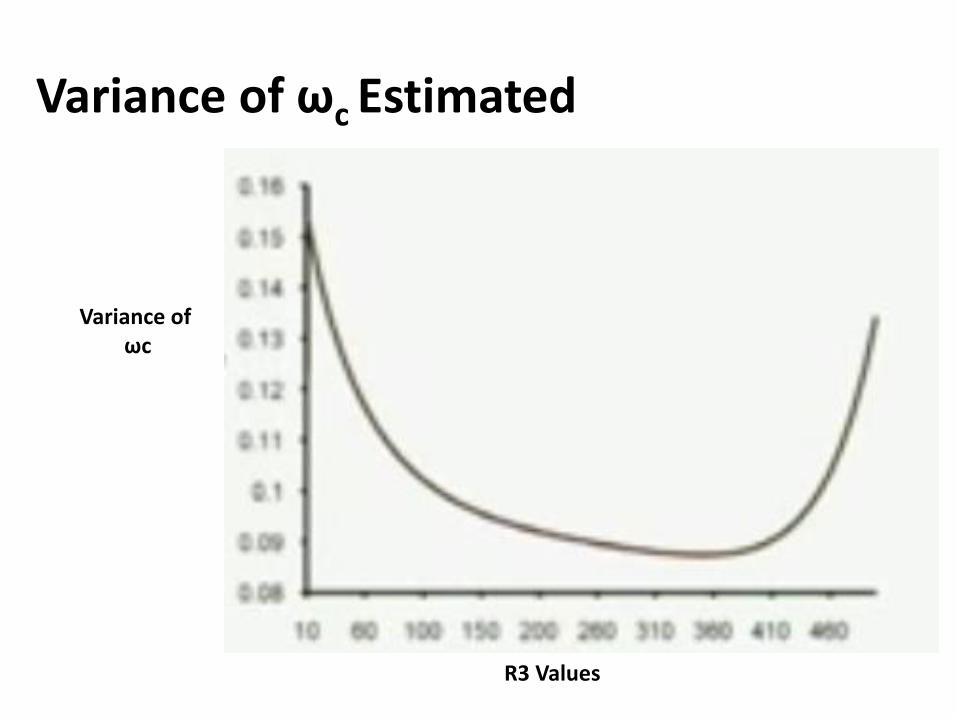
Variance of ωc Estimated
R3 Values
Variance of ωc
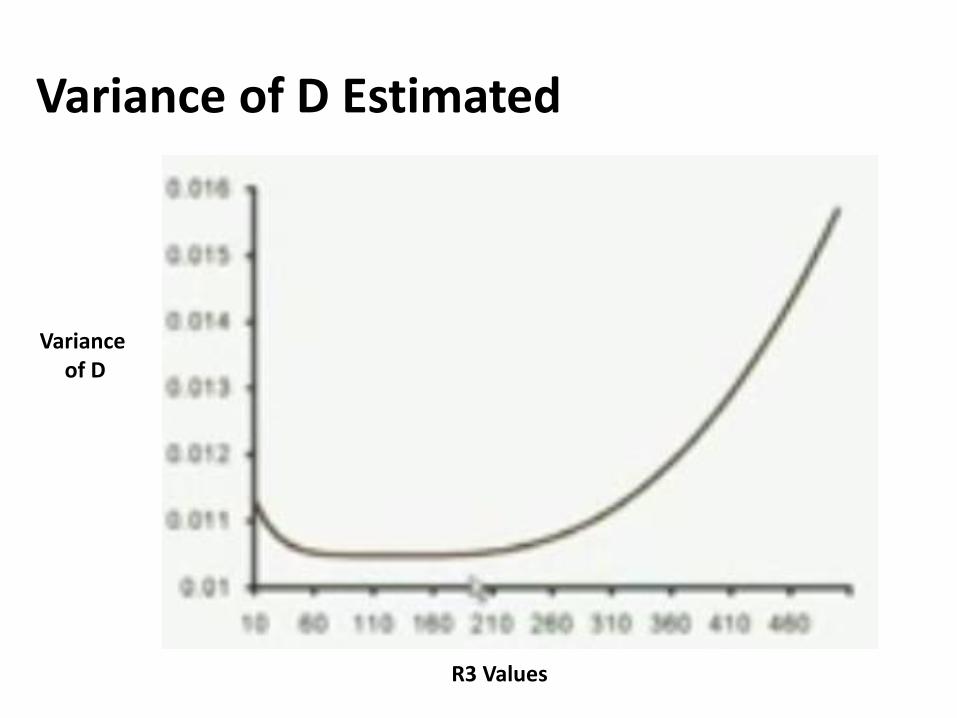
Variance of D Estimated
Variance of D
R3 Values
Original Taguchi Method is Ineffective Here!
Note that the filter design problem cannot be tackled using Taguchi’s “two-step” procedure. Effects of R2, R3 and C on ωc (or even D) are not separable (additive).
Further, one-response-at-a-time optimization does not produce Pareto-optimal designs. The two plots did produce two “best” robust designs, but none is “globally optimum”.
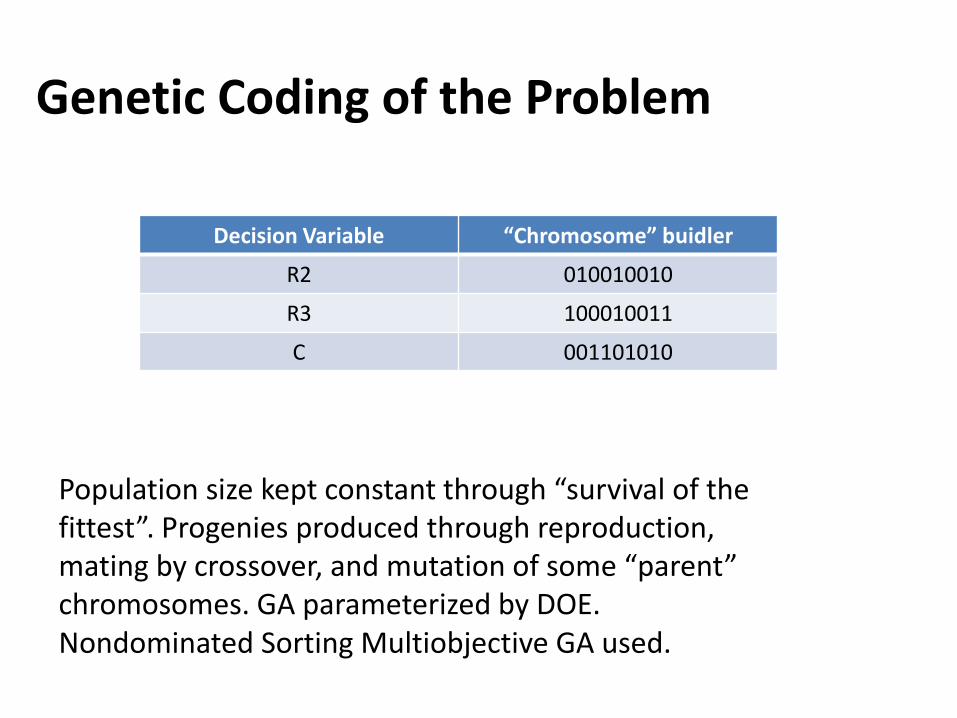
Genetic Coding of the Problem
“Chromosome” buidler Decision Variable
010010010 R2
100010011 R3
001101010 C
Population size kept constant through “survival of the fittest”. Progenies produced through reproduction, mating by crossover, and mutation of some “parent” chromosomes. GA parameterized by DOE. Nondominated Sorting Multiobjective GA used.
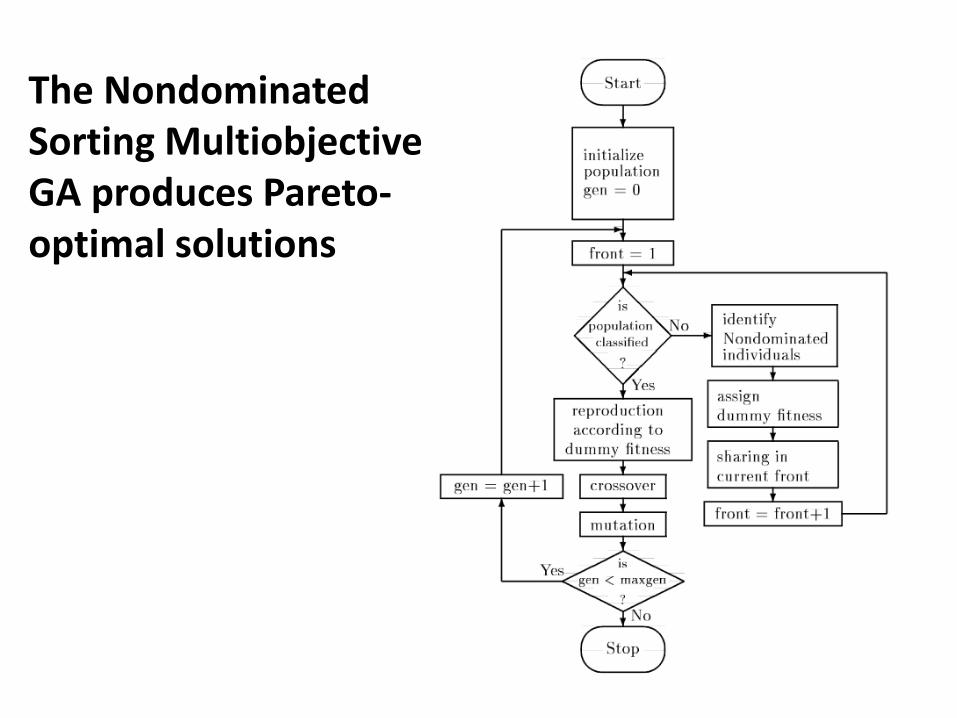
The Nondominated Sorting Multiobjective GA produces Pareto-optimal solutions
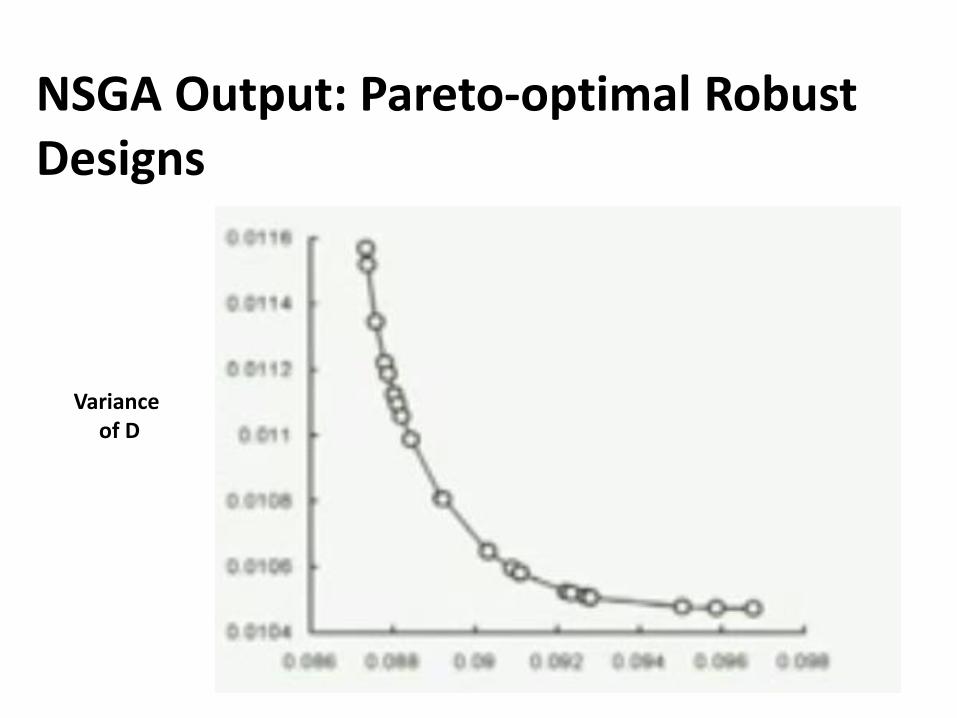
NSGA Output: Pareto-optimal Robust Designs
Variance of D
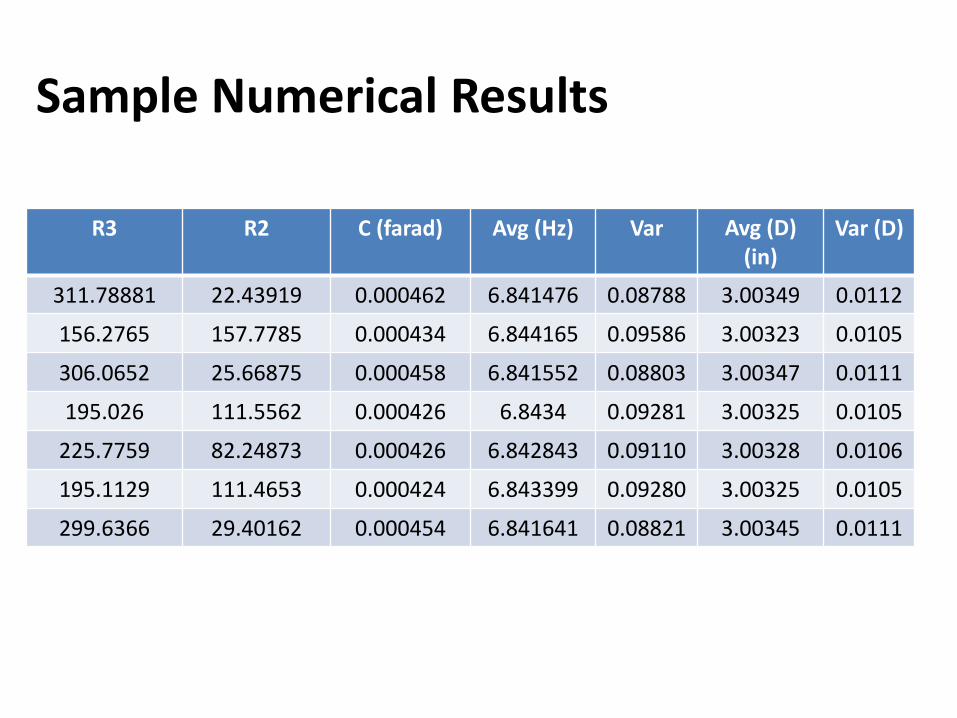
Sample Numerical Results
Var (D) Avg (D) (in)
Var Avg (Hz) C (farad) R2 R3
0.0112 3.00349 0.08788 6.841476 0.000462 22.43919 311.78881
0.0105 3.00323 0.09586 6.844165 0.000434 157.7785 156.2765
0.0111 3.00347 0.08803 6.841552 0.000458 25.66875 306.0652
0.0105 3.00325 0.09281 6.8434 0.000426 111.5562 195.026
0.0106 3.00328 0.09110 6.842843 0.000426 82.24873 225.7759
0.0105 3.00325 0.09280 6.843399 0.000424 111.4653 195.1129
0.0111 3.00345 0.08821 6.841641 0.000454 29.40162 299.6366
References Taguchi, G., Introduction to Quality Engineering, APO, Tokyo, 1986. Pieset, J. and Singhal, K., Tolerance Analysis and Design, Elsevier, 1980. Phadke, M.S., Quality Engineering and Robust Design, Prentice-Hall 1989. Bagchi, Tapan P., Taguchi Methods Explained. Practical Steps to Robust Design, Prentice-Hall (India), 1983. Filippone, J., Using Taguchi Methods to Apply to the Axioms of Design, Robot, Computer Integrated Manufacturing 6(2) 1989 133 – 142 Bagchi, Tapan P., Kumar, Mahdu Ranjan, Multiple-Criteria Robust Design of Electronic Devices, J of Electronic Manufacturing 3, 1993, 31- 38. Montgomery, Douglas C., Design and Analysis Experiments 3rd Edition Wiley, 1993. Bagchi, Tapna P., Templeton, J.G.C. ,Multiple-criteria Robust Design using Constrained Optimization, J. Design and Manufacturing, 4, 1994, 21 – 30. Myers, J., Carter, Jr. W. H., Response Surface Techniques for Dual Response Systems, Technometrics, 26, 1973, 301 – 317. Khattree, Ravindra, Robust Parameter Design: A Response Surface Approach, J. Quality Technology, 1996, 28 (2) 187 – 195. Voss, Stetan, Metaheuristics: The State of the Art, In Local Search for Planning and Scheduling, Alexander Nareyek (ed) Springer, 2001. Goldberg, G. E., Genetic Algonrithm on Search. Optimization and Machine Learning, Addison-Wesley, 1989, 147 – 215.


