“I Can” Do Math - The Curriculum Corner€¦ · “I Can” Do Math (Geometry) 8.G.B.6 I can...
23
© www.thecurriculumcorner.com “I Can” Do Math (The Number System) I can understand irrational numbers and approximate them by rational numbers. 8.NS.A.1 I can show that every number has a decimal. 8.NS.A.1 I can change every repeating decimal into a rational number. 8.NS.A.1 I can show that the decimal expansion eventually repeats for rational numbers. 8.NS.A.1 I can change a repeating decimal expansion into a rational number.
Transcript of “I Can” Do Math - The Curriculum Corner€¦ · “I Can” Do Math (Geometry) 8.G.B.6 I can...

© www.thecurriculumcorner.com
“I Can” Do Math (The Number System)
I can understand irrational numbers and approximate them by rational
numbers.
8.NS.A.1 I can show that
every number has a decimal.
8.NS.A.1 I can change every
repeating decimal into a
rational number.
8.NS.A.1 I can show that the
decimal expansion eventually
repeats for rational numbers.
8.NS.A.1 I can change a
repeating decimal expansion
into a rational number.

© www.thecurriculumcorner.com
“I Can” Do Math (The Number System)
8.NS.A.2 I can use rational
approximations of irrational
numbers to compare the size
of irrational numbers, locate,
and plot them approximately
on a number line diagram, and
then estimate the value of
expressions.
8.NS.A.2 I can use estimate
values to compare two or
more irrational numbers.

© www.thecurriculumcorner.com
“I Can” Do Math (Expressions & Equations)
I can work with radicals and integer exponents.
8.EE.A.1 I can use the
properties of integer exponents
to simplify expressions.
8.EE.A.2 I can use square and
cube root symbols to represent
solutions to equations of the
form x^2=p and x^3=p, where
p is a positive rational number.
8.EE.A.2 I can evaluate the
square root of a perfect square
and the cube root of a perfect
cube.
8.EE.A.2 I can understand that
the square root of 2 is
irrational.
© www.thecurriculumcorner.com
“I Can” Do Math (Expressions & Equations)
8.EE.A.3 I can write an
estimation of a large quantity
by expressing it as the
product of a single-digit
number and a positive power
of ten.
8.EE.A.3 I can write an
estimation of a very small
quantity by expressing it as
the product of a single-digit
number and a negative power
of ten.
8.EE.A.3 I can compare
quantities written as the
product of a single-digit
number and a power of ten.

© www.thecurriculumcorner.com
“I Can” Do Math (Expressions & Equations)
8.EE.A.4 I can solve
operations (+,-,x,÷) with two
numbers expressed in
scientific notation, including
problems that contain both
decimals and scientific
notation.
8.EE.A.4 I can use scientific
notation and choose units of
appropriate size for very large
or very small measurements.
8.EE.A.4 I can interpret
scientific notation that has
been generated by technology.

© www.thecurriculumcorner.com
“I Can” Do Math (The Number System)
I can understand the connections
between proportional relationships,
lines and linear equations.
8.EE.B.5 I can graph
proportional relationships,
interpreting the unit rate as
the slope of the graph.
8.EE.B.5 I can use a table, an
equation or graph to decide
the unit rate of a proportional
relationship.
8.EE.B.5 I can use the unit
rate of a graphed proportional
relationship to compare
different proportional
relationships.

© www.thecurriculumcorner.com
“I Can” Do Math (The Number System)
8.EE.B.6 I can use similar
triangles to explain why the
slope m is the same between
two points on a non-vertical
line in a coordinate plane.
8.EE.B.6 I can explain that an
equation in the form of y=mx
will represent the graph of a
proportional relationship with a
slope of m and y-intercept of 0.
8.EE.B.6 I can explain that an
equation in the form of y=mx +
b represents the graph of a
linear relationship with a slope
of m and a y-intercept of b.

© www.thecurriculumcorner.com
“I Can” Do Math (Expressions & Equations)
I can analyze and solve linear equations and pairs of simultaneous
linear equations.
8.EE.C.7 I can solve linear
equations with one variable.
8.EE.C.7A I can simplify a linear equation by using the distributive
property and combining like terms.
8.EE.C.7A I can give examples of linear equations with one solution, infinitely
many solutions or no solutions.
8.EE.C.7B I can solve linear equations with rational number coefficients,
including equations when solutions require expanding expressions using
the distributive property and combining like terms.

© www.thecurriculumcorner.com
“I Can” Do Math (Expressions & Equations)
8.EE.C.8 I can analyze and
solve pairs of simultaneous
linear equations.
8.EE.C.8A I can explain solutions to a system of two linear equations in two variables as the
point of intersection of their graph.
8.EE.C.8A I can describe the point of intersection between two lines as the point
that satisfies both equations at the same time.
8.EE.C.8B I can solve a system of two linear equations in two unknowns algebraically.
8.EE.C.8B I can identify cases in which a system of two equations in two unknowns has no solution or an infinite number of solutions.
8.EE.C.8B I can solve simple cases of systems of two linear equations in two variables by
inspection.
8.EE.C.8C I can solve real-world and mathematical problems leading to two linear
equations in two variables.

© www.thecurriculumcorner.com
“I Can” Do Math (Functions)
I can understand, interpret and compare functions.
8.F.A.1 I can define a function
as a rule, where for each input
there is exactly one output.
8.F.A.1 I can show the
relationship between inputs and
outputs of a function by
graphing them as ordered pairs
on a coordinate grid.
8.F.A.2 I can determine the
properties of a function given
the inputs and outputs in a
table.

© www.thecurriculumcorner.com
“I Can” Do Math (Functions)
8.F.A.2 I can compare the
properties of two functions that
are represented differently
(equations, tables, graphs or
given verbally).
8.F.A.3 I can explain why the
equation y=mx+b represents a
linear function and then find the
slope and y-intercept in relation
to the function.
8.F.A.3 I can give examples of
relationships and create a table
of values that can be defined as
a non-linear function.

© www.thecurriculumcorner.com
“I Can” Do Math (Functions)
I can use functions to show
relationships between quantities.
8.F.B.4 I can create a
function to model a linear
relationship between two
quantities.
8.F.B.4 I can determine the
rate of change and initial value
of the function from
decryption of the relationship
of two (x,y) values, including
reading a table or graph.

© www.thecurriculumcorner.com
“I Can” Do Math (Functions)
8.F.B.4 I can find the rate of
change and initial value of a
linear function in terms of the
situation it models and in terms
of its graph or a table of
values.
8.F.B.5 I can match the graph
of a function to a given
situation.
8.F.B.5 I can sketch a graph
that exhibits the qualitative
features of a function that has
been described verbally.
© www.thecurriculumcorner.com
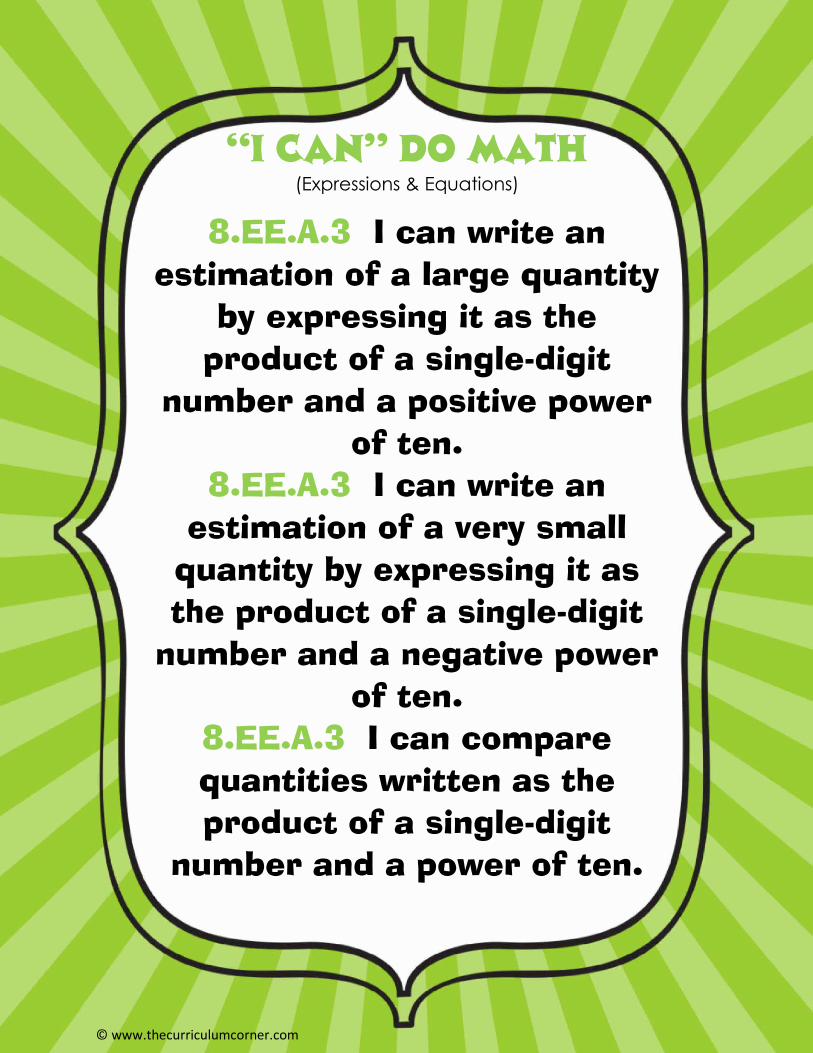
“I Can” Do Math (Geometry)
I can show I understand congruence and similarity using
physical models, transparencies or geometry software.
8.G.A.1 I can verify by
measuring and comparing the
properties of rotated,
reflected or translated
geometric figures.
8.G.A.1A I can verify that corresponding lines and line segments
remain the same length. 8.G.A.1B I can verify that
corresponding angles have the same measure.
8.G.A.1C I can verify that corresponding parallel lines remain
parallel.
© www.thecurriculumcorner.com
“I Can” Do Math (Geometry)
8.G.A.2 I can explain that a
two-dimensional figure is
congruent to another if the
second figure can be made
from the first by rotations,
reflections and translations.
8.G.A.2 I can describe a
sequence of transformations
that shows the congruence
between two figures.
8.G.A.3 I can describe the
changes to the x- and y-
coordinates of a figure after
either dilation, translation,
rotation or reflection.

© www.thecurriculumcorner.com
“I Can” Do Math (Geometry)
8.G.A.4 I can explain how
transformation can be used to
prove that two figures are
similar.
8.G.A.4 I can describe a
sequence of transformations
that either prove or disprove
that two figures are similar.

© www.thecurriculumcorner.com
“I Can” Do Math (Geometry)
I can understand and use the Pythagorean Theorem.
8.G.A.5 I can informally prove
that the sum of any triangle's
interior angles will be the
same measure as a straight
angle (180 degrees).
8.G.A.5 I can informally prove
that the sum of any polygon's
exterior angles will be 360
degrees.
8.G.A.5 I can estimate the
relationships and
measurements of the angles
created when two parallel
lines are cut by a transversal.

© www.thecurriculumcorner.com
“I Can” Do Math (Geometry)
8.G.B.6 I can use the
Pythagorean Theorem to
determine if a given triangle is
a right triangle.
8.G.B.6 I can use algebraic
reasoning to relate a visual
model to the Pythagorean
Theorem.
8.G.B.7 I can draw a diagram
and use the Pythagorean
Theorem to solve real-world
problems involving right
triangles.
8.G.B.7 I can draw a diagram
to find right triangles in a
three-dimensional figure and
use the Pythagorean Theorem
to calculate various
dimensions.
© www.thecurriculumcorner.com
“I Can” Do Math (Geometry)
8.G.B.7 I can apply the
Pythagorean Theorem to find
an unknown side length of a
right triangle.
8.G.B.8 I can apply the
Pythagorean Theorem to find
the distance between two
points in a coordinate system.
© www.thecurriculumcorner.com
“I Can” Do Math (Geometry)
I can solve real-world and mathematical problems involving volumes of cones, cylinders and
spheres.
8.G.C.9 I can solve real-world
and mathematical problems
involving the volumes of cones,
cylinders and spheres.
8.G.C.9 I can solve real-world
and mathematical problems
involving the volumes of
cylinders, cones and spheres

© www.thecurriculumcorner.com
“I Can” Do Math (Statistics & Probability)
I can investigate patterns of association in data that has two
variables (bivariate data).
8.SP.A.1 I can plot ordered
pairs on a coordinate grid
representing the relationship
between two data sets.
8.SP.A.1 I can describe
patterns such as clustering,
outliers, positive or negative
association, linear association
and nonlinear association.
8.SP.A.2 I can recognize if
the data plotted on a scatter
plot has a linear association.

© www.thecurriculumcorner.com
“I Can” Do Math (Statistics & Probability)
8.SP.A.2 I can draw a straight
line to approximate the linear
relationship between the
plotted points of two data sets.
8.SP.A.3 I can determine the
equation of a trend line that
approximates the linear
relationships between the
plotted points of two data sets.
8.SP.A.3 I can interpret the y-
intercept and slope of an
equation based on collected
data.

© www.thecurriculumcorner.com
“I Can” Do Math (Statistics & Probability)
8.SP.A.3 I can use the
equation of a trend line to
summarize the given data and
make predictions about
additional data points.
8.SP.A.4 I can create and
explain a two-way table to
record the frequencies of
bivariate categorical values.
8.SP.A.4 I can determine the
relative frequencies for rows
and/or columns of a two-way
table.
8.SP.A.4 I can use relative
frequencies and the context of
a problem to describe possible
associations between two sets
of data.


![IB Math Studies - Triangle Trigonometry Practice Key · IB Math Studies - Triangle Trigonometry Practice Key [233 marks] 1a. [1 mark] The diagram shows a triangle ABC in which AC](https://static.fdocuments.us/doc/165x107/5e0dfc01f451477127410f84/ib-math-studies-triangle-trigonometry-practice-ib-math-studies-triangle-trigonometry.jpg)