
“A great contribution to an exciting new field of SEA ...€¦ · Inc., 222 Rosewood Drive,...
238
ENVIRONMENT AND DEVELOPMENT Strategic Environmental Assessment for Policies Kulsum Ahmed and Ernesto Sánchez-Triana, Editors An Instrument for Good Governance 44639 Public Disclosure Authorized Public Disclosure Authorized Public Disclosure Authorized ublic Disclosure Authorized Public Disclosure Authorized Public Disclosure Authorized Public Disclosure Authorized ublic Disclosure Authorized
Transcript of “A great contribution to an exciting new field of SEA ...€¦ · Inc., 222 Rosewood Drive,...
E N V I R O N M E N T A N D D E V E L O P M E N T
Strategic Environmental Assessment for Policies
STRATEGIC ENVIRO
NM
ENTA
L ASSESSMEN
T FOR PO
LICIESA
n In
strum
ent for G
ood Govern
ance
ISBN 978-0-8213-6762-9
SKU 16762
Kulsum Ahmed and Ernesto Sánchez-Triana, Editors
An Instrument for Good Governance
“A great contribution to an exciting new field of SEA application: policy design and implementation. This book contains important lessons on how to improve the effectiveness of SEA at the policy level. It builds bridges between the worlds of impact assessment and political decision making. Specifically, convincing arguments are given to pay more attention to institutional and governance dimensions in policy SEA. The book shows ways forward in applying SEA as a continuous process rather than as a discrete intervention.”
Rob VerheemDeputy Director, The Netherlands Commission for Environmental Assessment
“This book suggests how an institutional lens can be applied systematically to improve public policy design and implementation and sectoral governance both from supply and demand perspectives. Environmental and natural resources policies are the focus of the book, but the lessons are much broader and should be of interest to both policy makers and development professionals.”
Sanjay PradhanDirector, Public Sector Governance, World Bank
44639P
ublic
Dis
clos
ure
Aut
horiz
edP
ublic
Dis
clos
ure
Aut
horiz
edP
ublic
Dis
clos
ure
Aut
horiz
edP
ublic
Dis
clos
ure
Aut
horiz
edP
ublic
Dis
clos
ure
Aut
horiz
edP
ublic
Dis
clos
ure
Aut
horiz
edP
ublic
Dis
clos
ure
Aut
horiz
edP
ublic
Dis
clos
ure
Aut
horiz
ed

Strategic Environmental Assessment for Policies

E N V I R O N M E N T
A N D
D E V E L O P M E N T
A fundamental element of sustainable development is environmental sustainability.Hence, this series was created in 2007 to cover current and emerging issues in orderto promote debate and broaden the understanding of environmental challengesas integral to achieving equitable and sustained economic growth. The series willdraw on analysis and practical experience from across the World Bank and fromclient countries. The manuscripts chosen for publication will be central to theimplementation of the World Bank’s Environment Strategy, and relevant to thedevelopment community, policy makers, and academia. Topics addressed in thisseries will include environmental health, natural resources management, strategicenvironmental assessment, policy instruments, and environmental institutions.
Also in this series:International Trade and Climate Change: Economic, Legal, and Institutional
PerspectivesPoverty and the Environment: Understanding Linkages at the Household Level
An Instrument for GoodGovernance
Kulsum Ahmed and Ernesto Sánchez-Triana, Editors
StrategicEnvironmental
Assessment forPolicies
© 2008 The International Bank for Reconstruction and Development/The World Bank1818 H Street, NWWashington, DC 20433Telephone 202-473-1000Internet www.worldbank.orgE-mail [email protected]
All rights reserved.
1 2 3 4 :: 11 10 09 08
This volume is a product of the staff of the International Bank forReconstruction and Development / The World Bank. The findings, inter-pretations, and conclusions expressed in this volume do not necessarilyreflect the views of the Executive Directors of The World Bank or thegovernments they represent.
The World Bank does not guarantee the accuracy of the data includedin this work. The boundaries, colors, denominations, and other informa-tion shown on any map in this work do not imply any judgement on thepart of The World Bank concerning the legal status of any territory or theendorsement or acceptance of such boundaries.
R I G H T S A N D P E R M I S S I O N S
The material in this publication is copyrighted. Copying and/or transmit-ting portions or all of this work without permission may be a violation ofapplicable law. The International Bank for Reconstruction andDevelopment / The World Bank encourages dissemination of its work andwill normally grant permission to reproduce portions of the work promptly.
For permission to photocopy or reprint any part of this work, pleasesend a request with complete information to the Copyright Clearance CenterInc., 222 Rosewood Drive, Danvers, MA 01923, USA; telephone: 978-750-8400; fax: 978-750-4470; Internet: www.copyright.com.
All other queries on rights and licenses, including subsidiary rights,should be addressed to the Office of the Publisher, The World Bank,1818 H Street NW, Washington, DC 20433, USA; fax: 202-522-2422;e-mail: [email protected].
ISBN-13: 978-0-8213-6762-9eISBN-13: 978-0-8213-67636DOI: 10.1596/978-0-8213-6762-9
Library of Congress Cataloging-in-Publication Data Strategic environmental assessment for policies: an instrument for goodgovernance / Kulsum Ahmed and Ernesto Sánchez-Triana, editors.
p. cm.“This edited book derives from the background papers originally preparedas the basis for a World Bank study published in 2005, titled IntegratingEnvironmental Considerations in Policy Formulation: Lessons from Policy-Based SEA Experience (Report No. 32783).”ISBN 978-0-8213-6762-9 — ISBN 978-0-8213-6763-6 (electronic)1. Environmental policy. 2. Environmental impact analysis. 3. Sustainabledevelopment. 4. Strategic planning—Environmental aspects. I. Ahmed,Kulsum, 1964- II. Sánchez Triana, Ernesto.
GE170.S766 2008333.72—dc22
2008001297Cover photo/illustrations:Waterfall in Guyana/Louie Psihoyos/Corbis; Girl in Central AfricanRepublic/Giacomo Pirozzi/Panos
Cover design:Auras Design, Silver Spring, Maryland
C O N T E N T S
ix About the Editors and Authorsxi Acknowledgmentsxiii Abbreviations
C H A P T E R 1
1 SEA and Policy FormulationKulsum Ahmed and Ernesto Sánchez-Triana
2 Evolution of SEA3 Impact-Based SEA5 Applying SEA to Policies6 Toward an “Institution-Centered” SEA Approach 8 Notes9 References
C H A P T E R 2
11 Policy-Level Strategic Environmental Assessments: Process Integration and Incentives of Policy ProponentsLeonard Ortolano
12 Case Studies21 Analysis of Case Studies25 Assessments of SEA Requirements for Policy Proposals in
Canada and the Netherlands30 Conclusions32 Notes34 References
C H A P T E R 3
37 The Continuous Process of Policy Formation Martha S. Feldman and Anne M. Khademian
38 Policy Formation as Decision Making47 Policy Formation as a Continuous Process55 Conclusion56 Note56 References
C H A P T E R 4
61 Toward Environmental Priority Setting in Development Richard D. Morgenstern
62 Background v

vi CONTENTS
65 Comparative Risk Analysis78 Economic Damage Assessment86 Conclusions 88 Notes89 References91 Bibliography
C H A P T E R 5
95 Giving the Most Vulnerable a VoiceCaroline Kende-Robb and Warren A. Van Wicklin III
97 Why the Vulnerable Should Be Involved in Policy Formulation
98 Definition of the Vulnerable and How They Are Affected103 Creation of an Enabling Environment in Which
the Vulnerable Can Be Heard 104 Entry Points for Giving Vulnerable Groups Voice106 Levels of Participation in Policy Processes107 Tools for Giving the Vulnerable Voice114 Case Studies121 Conclusions122 Notes122 References
C H A P T E R 6
127 Building and Reinforcing Social Accountability for ImprovedEnvironmental GovernanceHarry Blair
128 Definitions and Causal Linkages131 Causal Linkages135 Case Studies 146 Patterns and Themes 151 Conclusion152 Notes155 References
C H A P T E R 7
159 Learning in Environmental Policy Making and ImplementationAlnoor Ebrahim
160 What Is Organizational Learning?163 Framing Policy Learning164 Cases of Policy Learning172 Conclusions175 Notes177 References
C H A P T E R 8
181 Using Strategic Environmental Assessments to Design andImplement Public PolicyKulsum Ahmed and Ernesto Sánchez-Triana
184 SEA for Policies185 Policy Formation and Challenges for Applying SEA187 Proposed Policy SEA Approach194 Lessons from Good Practice 198 Conclusions and Future Directions200 Notes202 References
207 Index
BOX4 1.1 Impact-Based SEA Procedures
FIGURES39 3.1 Spectrum of Decision-Making Models51 3.2 Continuous Policy Process54 3.3 Continuous Policy Process: Green Forest97 5.1 Benefits of Participation and Consultation in Policy Formulation106 5.2 Flowchart of Participatory Policy Processes112 5.3 How Tools Fit into the Participatory Policy Cycle 132 6.1 Policy Making as a Linear Process132 6.2 The Policy-Making Process as It Actually Works141 6.3 PROPER II Annual Cycle148 6.4 Environmental Policy-Making Process for Air Pollution
Abatement in Delhi149 6.5 Environmental Policy-Making Process Under Indonesia’s
PROPER II Program165 7.1 Policy Learning as a Technical, Conceptual, and Social Process183 8.1 The Three Pillars of Institution-Centered SEA
TABLES5 1.1 Examples of SEAs for Policies22 2.1 Integration of SEA into Policy Making22 2.2 Level of Integration of SEAs in Case Studies40 3.1 Similarities between Rational Decision-Making Model and
Strategic Evaluation Assessment69 4.1 Comparison of International Comparative Risk Analyses72 4.2 Health Risk Rankings in Selected Comparative Risk Analyses82 4.3 Measured Costs of Environmental Degradation in Selected Countries84 4.4 Damage from Indoor and Outdoor Pollution in Selected Countries108 5.1 Tools for Participation in Policy Processes146 6.1 Accountability, Transparency, and Long-Term Constituencies
in Two Case Studies
CONTENTS vii


Kulsum Ahmed is lead environmental specialist at the World Bank and teamleader for the Environmental Institutions and Governance program (which includes,among other activities, the SEA program) and Environmental-Health program inthe Environment Department. She has considerable experience as an operationstask manager and led the team that prepared the Bank’s first structural adjust-ment loan to integrate environmental considerations in key sectors of a country’seconomy. She is the World Bank’s representative on the OECD DevelopmentAssistance Committee’s task team on strategic environmental assessment.Ms. Ahmed has authored numerous publications on energy, the environment,health, strategic assessment, and industrial pollution. She holds a Ph.D. fromImperial College, London, and a natural sciences degree from Cambridge University.
Ernesto Sánchez-Triana is senior environmental engineer at the World BankSouth Asia Region. Before joining the Bank he taught at Colombia’s NationalUniversity, managed the Special Division of Environmental Policy in Colombia’sDepartment of National Planning, and worked at the Inter-American DevelopmentBank. At the World Bank, he has led the preparation of policy-based loans thataim to incorporate environmental considerations into economic and sectoral poli-cies, as well as the conduction of comprehensive assessments to identify and correctthe institutional weaknesses that contribute to environmental degradation. Mr.Sánchez-Triana is the author of numerous publications on environmental andenergy policy, political economy, and the use of economic instruments for envi-ronmental protection. He holds a Ph.D from Stanford University.
Harry Blair is a senior research scholar and lecturer in political science at YaleUniversity.
Alnoor Ebrahim is a visiting associate professor at the John F. Kennedy Schoolof Government and the Wyss visiting scholar at the Harvard Business School.
Martha S. Feldman holds the Johnson Chair for Civic Governance and PublicManagement at the University of California–Irvine.
About the Editors and Authors
ix

Caroline Kende-Robb is a sector manager in the Social Development Departmentat the World Bank.
Anne M. Khademian is an associate professor at the Center for Public Administrationand Policy at the School for Public and International Affairs, Virginia PolytechnicInstitute and State University.
Richard D. Morgenstern is a senior fellow at Resources for the Future.
Leonard Ortolano is the UPS Foundation professor in the department of civiland environmental engineering at Stanford University.
Warren A. Van Wicklin III is an international development consultant.
x ABOUT THE EDITORS AND AUTHORS

This edited book derives from the background papers originally prepared as thebasis for a World Bank study published in 2005, titled Integrating EnvironmentalConsiderations in Policy Formulation: Lessons from Policy-Based SEA Experience(Report No. 32783). In converting these papers to stand-alone chapters in thisbook, many people have played an important role. These include the chapterauthors, who worked diligently to enrich their original manuscripts with addi-tional case studies drawn, in particular, from developing countries; the formalpeer reviewers, who provided valuable comments to improve this manuscript;and the many other colleagues who provided important resources, insights, andresearch assistance in the preparation of these chapters.
Formal chapter peer reviewers included Peter Croal (Canadian InternationalDevelopment Agency); Linda DeLeon (University of Colorado); Margaret Keck(Johns Hopkins University); Bjorn Larsen (economist and independent consultant),Leonard Ortolano (Stanford University); Nancy Roberts (Naval PostgraduateSchool); Rob Verheem (Netherlands EIA Commission); and Sameer Akbar,YewandeAwe, Giovanna Dore, Fernando Loayza, Giovanni Ruta, Jeff Thindwa, and ShahidYusuf (all of the World Bank). This work was carried out under the overallguidance of Laura Tlaiye, Sector Manager, and James Warren Evans, Director,both of the Environment Department at the World Bank.
Finally, the editors would also like to thank Jim Cantrell, Mary Fisk, and PatriciaKatayama for their support during the publication and dissemination phase ofthis book.
Acknowledgments
xi
This volume is dedicated to Professor Dennis Anderson, whose talent foreconomics and humble approach to life combine to inspire all developmentprofessionals who have had the good fortune of knowing and interactingwith him. His standard of professionalism and humanity is one to whichwe all aspire.


Abbreviations
ANC African National CongressAPA área de proteção ambiental, or environmentally protected areaBAPEDAL Badan Pengendalian Dampak Lingkungan, or Environmental
Impact Management AgencyBOD biochemical oxygen demandBPP Bangun Praja Program, or Good Environmental Governance
ProgramCARs corporaciones autónomas regionales, or regional development
corporationsCEA Country Environmental AnalysisCEPD Centre for Educational Policy DevelopmentCNG compressed natural gasCOD chemical oxygen demandCONNEPP Consultative National Environmental Policy ProcessCRA comparative risk analysisCSE Centre for Science and the EnvironmentCSIR Council of Scientific and Industrial ResearchCSO civil society organizationDALY disability-adjusted life yearDFAIT Department of Foreign Affairs and International TradeDPRD Dewan Perwakilan Rakyat Daerah, or local elected councilEIA environmental impact assessmentENVIRONET Committee Network on Environment and Development
CooperationEPA Environmental Protection AgencyEPCA Environment Pollution Prevention and Control AuthorityE-test environmental testGDP gross domestic productITAC International Trade Advisory CommitteeKLH Kementerian Negara Lingkungan Hidup, or Ministry of the
EnvironmentMPRP Mongolian People’s Revolutionary PartyNAFTA North American Free Trade AgreementNGO nongovernmental organizationNTB National Training BoardOECD Organisation for Economic Co-operation and DevelopmentPAT plan de acción trienal, or three-year action planPLSA Participatory Living Standards AssessmentPM particulate matter
xiii
PROKASIH Clean River ProgramPROPER Program for Pollution Control, Evaluation, and RatingPSIA Poverty and Social Impact AnalysisSAGIT Sectoral Advisory Group on International TradeSEA Strategic Environmental AssessmentSOP Sectoral Operational Program for Tourism and the Spa IndustryTOR terms of referenceUNECE United Nations Economic Commission for EuropeUSAID U.S. Agency for International DevelopmentWALHI Wahana Lingkungan Hidup, or Friends of the EarthWHO World Health Organization
xiv ABBREVIATIONS
SOUND ENVIRONMENTAL MANAGEMENT is particularly important forthe poor, whose lives can be transformed by development. Good management ofthe environment and natural resources protects health, reduces vulnerability tonatural disasters, improves livelihoods and productivity, spurs economic growthbased on natural resources, and enhances human well-being. Environmental riskfactors play a role in more than 80 diseases, and injuries and account for morethan a third of disease in children under five. Better environmental managementcould reportedly prevent more than 94 percent of deaths from diarrheal diseasesand 40 percent of deaths from malaria, saving the lives of as many as 4 millionchildren a year (Pruss-Ustun and Corvalan 2006).
Between 1980 and 2000 more than 1.5 million people died in floods, volcaniceruptions, tropical storms, landslides, droughts, and other natural disasters (UNDP2004). The tsunami in the Indian Ocean in December 2004 killed more than200,000 people, left more than 1.5 million homeless, and destroyed more thanUS$6 billion of physical capital (World Bank 2006). Deaths and economic lossescaused by natural disasters are far greater in poor countries than in rich ones.
C H A P T E R 1
SEA and Policy FormulationKulsum Ahmed and Ernesto Sánchez-Triana
1
Kulsum Ahmed is lead environmental specialist and team leader of the EnvironmentalInstitutions and Governance program at the World Bank. Ernesto Sánchez-Triana is seniorenvironmental engineer at the World Bank.
High vulnerability to natural disasters in poor countries is linked with the lackof warning and early response systems and inadequate integration of environ-mental considerations in regional and urban development.
In the poorest countries of Africa, Asia, and Latin America, forest, agricultural,and biological resources contribute significantly to the economy of poor ruralhouseholds.1 Some 200 million indigenous people depend on forests for theirlivelihood, food, medicine, and shelter (IUCN 2006).
The environment constitutes a fundamental driver of employment and economicgrowth. Tourism in Costa Rica (mainly ecotourism), for example, accounts for8.4 percent of GDP, generating about 72 percent of national monetary reservesand supporting 140,000 jobs (UNEP 2007). In Mexico, where tourism accountsfor 9 percent of GDP, environmental quality is a key determinant of tourists’choice of destination (SECTUR 2002; World Bank 2005). In Hong Kong (China)businesses cite traffic congestion, air pollution, and the need for a cleaner envi-ronment among the greatest obstacles to hiring international specialists andmanagers (AmCham 2006).
Public policies are a key tool for addressing current and future environmentaldegradation and natural resource use. How can policy makers and the public iden-tify cost-effective opportunities for improving human welfare? How are publicpolicies designed? Can they be designed in a way that is conducive to both economicgrowth and environmental sustainability? What is needed to allow them to do so?Does everyone benefit from a focus on environmental sustainability, or do somegroups lose out? Does designing sustainable policies require difficult trade-offsand political maneuvering, or are such policies likely to be embraced by all?
This volume explores methodologies for addressing these questions. It focuseson Strategic Environmental Assessment (SEA) for integrating environmental consid-erations into policies, exploring how SEA can be used to design sustainable policies.The book does not provide recipes for designing sustainable policies or delve intothe myriad meanings of environmental sustainability. It interprets sustainabledevelopment as economic growth that is socially equitable and environmentallyresponsible.2 The term environment is used broadly to mean the biophysical envi-ronment as well as the linkages of the biophysical environment with the qualityof life (health, livelihoods, and vulnerability) and economic activity (World Bank2001). Hence environment is as much about the biophysical environment as aboutthe people affected by environmental degradation. Paraphrasing an indigenousleader from Colombia, environmental sustainability is a state of being in whichboth environment and people are in harmony (Stephens 2006).
Evolution of SEA
SEA extends the application of environmental impact assessment (EIA) fromprojects to policies, programs, and plans.3 National, regional, and international
2 STRATEGIC ENVIRONMENTAL ASSESSMENT FOR POLICIES

SEA legislation usually falls under EIA legislation, extending its use to programs,plans, and, in some cases, policies. For example, national legislation in Chinarequires SEAs of plans; the regional European SEA Directive (Directive 2001/42/EC)requires that SEAs be conducted for all programs and plans. Other countries alsorequire SEAs for policies (as discussed later in this chapter).
Many SEAs (including those not driven by legislation) use a continuum ofapproaches rather than a single approach.4 OECD (2006: 17) describes SEA as a“family of approaches using a variety of tools rather than a single, fixed andprescriptive approach.” At one end of the spectrum, impact-based SEA integratesbiophysical environmental considerations into higher levels of decision makingby predicting potential effects of policies, plans, and programs on the environ-ment and adopting the corresponding protection and mitigation measures. Atthe other end of the spectrum, institution-centered SEA aims to mainstream theenvironment and sustainability across higher levels of policy making by assessingthe capability of the institutional and policy framework to detect environmentalrisks and its capacity to manage them in a timely and effective manner.
When SEA centers on impact assessment, it can be defined as “a systematic processfor evaluating the environmental consequences of proposed policy, plan or programmeinitiatives in order to ensure that they are fully included and appropriately addressedat the earliest appropriate stage of decision making on par with economic and socialconsiderations” (Sadler and Verheem 1996: 27). This definition (or variations of it)reflects an extension of “the EIA tradition and environmental concerns ‘further upthe chain’ of decision making toward programmes and plans arising and dealt within existing agencies and processes” (Connor and Dovers 2004: 165).
At the other end of the spectrum is the conceptualization of SEA “as a mech-anism for mainstreaming environment and sustainability across the higher levelsof policy making. . . . [It] suggests inadequacies of existing policy processes andthus a more substantial degree of organization and institutional reforms” thanthe concept of SEA as an upward extension of EIA (Connor and Dovers 2004: 165).This concept is reflected in a description of SEA as a participatory approach forupstreaming environmental and social issues to influence processes for develop-ment planning, decision making, and implementation at the strategic level.Implicitly included in this description is the importance of analytical work tosupport the decision-making process (Ahmed, Mercier, and Verheem 2005).5
Impact-Based SEA
Impact-based SEA evolved out of the field of EIA; many SEA advocates were EIAspecialists who believed that assessments at the level of policies, plans, and programscould overcome the limitations of assessments conducted for individual projects(Thérivel and Partidário 1996). The terminology and procedures used for impact-based SEAs have counterparts in the EIA literature (box 1.1).
SEA AND POLICY FORMULATION 3
4 STRATEGIC ENVIRONMENTAL ASSESSMENT FOR POLICIES
BOX 1 .1
Impact-Based SEA Procedures
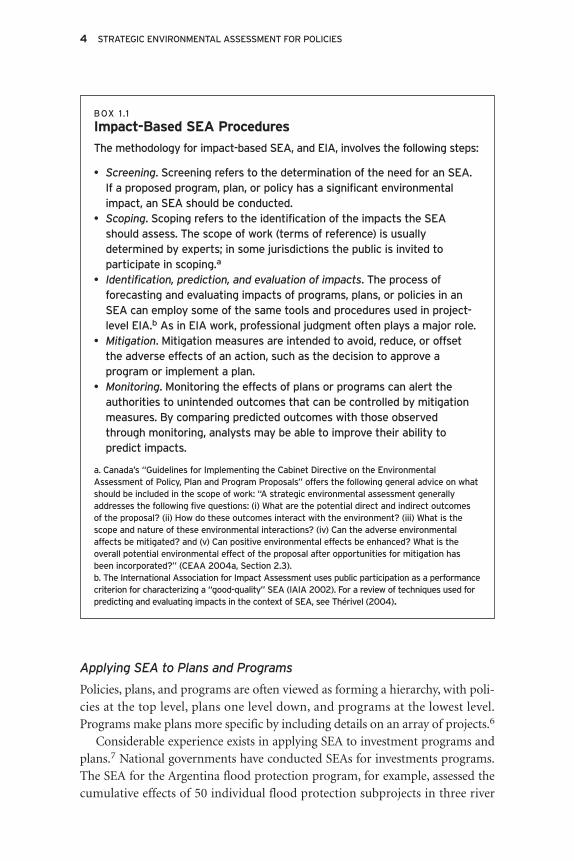
The methodology for impact-based SEA, and EIA, involves the following steps:
• Screening. Screening refers to the determination of the need for an SEA.If a proposed program, plan, or policy has a significant environmentalimpact, an SEA should be conducted.
• Scoping. Scoping refers to the identification of the impacts the SEAshould assess. The scope of work (terms of reference) is usuallydetermined by experts; in some jurisdictions the public is invited toparticipate in scoping.a
• Identification, prediction, and evaluation of impacts. The process offorecasting and evaluating impacts of programs, plans, or policies in anSEA can employ some of the same tools and procedures used in project-level EIA.b As in EIA work, professional judgment often plays a major role.
• Mitigation. Mitigation measures are intended to avoid, reduce, or offsetthe adverse effects of an action, such as the decision to approve aprogram or implement a plan.
• Monitoring. Monitoring the effects of plans or programs can alert theauthorities to unintended outcomes that can be controlled by mitigationmeasures. By comparing predicted outcomes with those observedthrough monitoring, analysts may be able to improve their ability topredict impacts.
a. Canada’s “Guidelines for Implementing the Cabinet Directive on the EnvironmentalAssessment of Policy, Plan and Program Proposals” offers the following general advice on whatshould be included in the scope of work: “A strategic environmental assessment generallyaddresses the following five questions: (i) What are the potential direct and indirect outcomesof the proposal? (ii) How do these outcomes interact with the environment? (iii) What is thescope and nature of these environmental interactions? (iv) Can the adverse environmentalaffects be mitigated? and (v) Can positive environmental effects be enhanced? What is theoverall potential environmental effect of the proposal after opportunities for mitigation hasbeen incorporated?” (CEAA 2004a, Section 2.3).b. The International Association for Impact Assessment uses public participation as a performancecriterion for characterizing a “good-quality” SEA (IAIA 2002). For a review of techniques used forpredicting and evaluating impacts in the context of SEA, see Thérivel (2004).
Applying SEA to Plans and Programs
Policies, plans, and programs are often viewed as forming a hierarchy, with poli-cies at the top level, plans one level down, and programs at the lowest level.Programs make plans more specific by including details on an array of projects.6
Considerable experience exists in applying SEA to investment programs andplans.7 National governments have conducted SEAs for investments programs.The SEA for the Argentina flood protection program, for example, assessed thecumulative effects of 50 individual flood protection subprojects in three river

systems and identified the need for a component to improve coordination betweencities and agencies in the flood plain—a provision that was included in a relatedproject implemented in the 1990s (Garcia 1997).
At the program level, a successful SEA was carried out for power develop-ment options in the Nile Equatorial Lakes region. This SEA incorporated amulticriteria methodology to screen power development options, cumulativeimpacts assessment, mitigation plans, and power system planning in order todefine an indicative least-cost regional power master plan for the subregion(World Bank 2007a).
The use of SEAs for watershed plans has been applied in developing countries(one example is the SEA for the Palar water basin in Tamil Nadu, India). This SEAuses both analytical and participatory processes to internalize environmentalconsiderations in water resources planning in order to frame a common devel-opment vision for the basin (World Bank 2007b).
Applying SEA to Policies
In contrast to the pervasive application of SEAs to programs and plans, theapplication of SEAs to policies has been scarce. For example, the EU SEA Directive,while requiring SEA for all programs and plans, does not mention SEA for poli-cies. However, a number of countries, including Canada, Denmark, theNetherlands, and New Zealand, have implemented procedures to incorporateenvironmental consideration into the design of public policies (table 1.1).Legislation on SEA of policies exists in some developing countries as well(including the Dominican Republic and Kenya), but implementation is rare.Such legislation typically extends impact-based SEA methodologies to policyapplication (Ahmed and Fiadjoe 2006).
SEA AND POLICY FORMULATION 5
TABLE 1 .1
Examples of SEAs for Policies
Country Instrument
Canada Policy Impact Assessment is applied to appraise environmentaleffects of policies and cabinet-level decisions (CEAA 2004a).
Denmark SEA is applied on bills and other proposals likely to have significantimpacts on the environment (Sadler and Verheem 1996).
Finland The Norm Law, issued in 1996, requires application of SEAs to policies.
Netherlands Environmental Test (E-Test) aims to assess the environmental effectsof policies.
New Zealand Policy statements and plans must be evaluated to determine if thegoal of the Resource Management Act (1991), which promotessustainable management of natural and physical resources, isachieved (Sadler and Verheem 1996).
Source: Authors.
While it still has to enter force, the Kiev (SEA) Protocol associated with theConvention of Environmental Impact Assessment in a Transboundary Context(the Espoo Convention) also mandates the application of SEA to programs andplans required under the protocol. However, in contrast to the EU SEA Directive,it includes a softer reference as applied to policies. Specifically, it states that “eachparty shall endeavor to ensure that environmental, including health, concerns areconsidered and integrated to the extent appropriate in the preparation of itsproposals for policies and legislation that are likely to have significant effects onthe environment, including health.”
Toward an “Institution-Centered” SEA Approach
This volume explores how to improve the effectiveness of SEA application topolicies and presents a new conceptual and methodological framework forapplying SEA to policies.
Initially, in chapter 2, Ortolano assesses several applications of SEA to policies.Canada and the Netherlands have extensive experience conducting environ-mental assessments for policies, plans, and programs. However, the agenciesrequired to prepare these assessments have often done so on a pro forma basis,as Ortolano shows in chapter 2. Performance was perfunctory partly becauseassessments often occurred late in the policy formulation process and partlybecause agencies could often marginalize environmental assessment require-ments without penalty. Key factors affecting policy SEA in Canada and theNetherlands include difficulties in applying impact assessment methodologiesto policy proposals, the absence of cross-sectoral agencies with responsibility foroverseeing compliance with the SEA requirements, and the lack of commitmentto SEA by top-level agency officials.8 The case study analysis in chapter 2 showsthat the influence of policy-level SEA on policy formulation and implementa-tion depends heavily on process-integration issues, especially when SEA beginsrelative to the policy-formulation and implementation process and how oftenSEA teams and policy designers interact.
In chapter 3, Feldman and Khademian argue that the application of impact-based SEA has had a limited impact on public policy because it is built on anunderstanding of policy formation as occurring in linear stages of rational deci-sion making. In reality, decisions are made in complex settings in which preferencesare unclear, technologies or the means of getting things done are not known, andparticipation in the process is fluid. Feldman and Khademian present two modelsthat acknowledge the complex context of policy formation as a continuous process.One, “adaptive management,” is oriented to enabling action in the face of uncer-tainty; the other, “inclusive management,” is oriented to enabling action in the
6 STRATEGIC ENVIRONMENTAL ASSESSMENT FOR POLICIES

face of ambiguity by encompassing more viewpoints in policy formation, includingthose that have been marginal in other processes.
The daunting and politically difficult task of setting environmental priori-ties in a policy decision-making process is the first SEA element in devisingeffective and cost-effective strategies for addressing environmental problems.Based on experiences with the application of environmental priority-settingtechniques in developing and developed countries, in chapter 4 Morgensternexamines alternative approaches to environmental priority setting that empha-size quantitative techniques. These techniques evaluate risks and economic damages,in particular through comparative risk and economic damage assessments.
Several studies show that giving the most vulnerable a voice helps policy makersunderstand the synergies between environmental goals, economic growth, andpoverty reduction. Thus a pillar of an institutions-centered SEA should be givingthe vulnerable greater voice in policy formulation, especially where environmentalconsiderations are involved. In chapter 5 Kende-Robb and Van Wicklin explainthe importance of ensuring that decision makers not only seek the voice of thevulnerable but also act on it—by creating “space” for public participation, iden-tifying entry points in the policy process for increasing voice, defining differentlevels of participation, and using tools for amplifying the voice of the vulnerableand making sure that voice is heard in the policy process.
To craft and nurture sustainable policy initiatives that can address externali-ties in ways that will have positive impact on the environment, SEA processesneed to support long-term constituencies that want to support such policies andcan hold policy makers accountable for their performance in implementing them.Transparency is critical in the policy process needed to allow these constituenciesto demand accountability from policy makers. In chapter 6 Blair constructs atheoretical framework that fits accountability, transparency, and long-termconstituency building together as part of the policy process. He illustrates thisframework with case studies from Delhi and Indonesia.
In chapter 7 Ebrahim argues that policy learning should not be viewed asa rational and technocratic process. Instead, learning should emphasize thepolitical and institutional contexts within which opportunities for policy learningemerge. Opportunities for policy learning appear at different stages: agenda- orpriority-setting on environmental issues, stakeholder access and representationin policy formulation, and accountability in implementation.
Drawing on the lessons emerging from chapters 2–7, as well as case studiesdocumented elsewhere, in chapter 8 Ahmed and Sánchez-Triana propose a newconceptual and methodological framework for applying SEA to policies. This“institution-centered SEA” is being piloted by the World Bank in differentregions of the world. The authors suggest that SEA can be used to help design
SEA AND POLICY FORMULATION 7
and implement equitable and environmentally sustainable policies by addinga third pillar designed to enhance learning and continuous improvement ofpolicy design and implementation to the existing two analytical and partici-patory pillars in traditional SEA methodology. This approach takes into accountthe complex process of policy formation and the importance of seizing oppor-tunities for policy reform as they arise. Elements within the approach also seekto enhance the creation of windows of opportunities for future policy reform.
Notes
1 In Cambodia about 80 percent of the population lives off of agriculture, forest, and fishresources (Evans 2006).
2 Ever since the release, in 1987, of the report of the World Commission on Environmentand Development (the Brundtland Commission), there has been emphasis on the impor-tance of sustainable development, a concept that weaves economic growth, environmentalprotection, and social justice as complementary goals across generations. The 1992Rio Earth Summit reemphasized this message. The Millennium Development Goals—particularly goal 7, target 9, which strives to “integrate the principles of sustainabledevelopment into country policies and programs and reverse loss of environmentalresources”—also reiterate it.
3 Examples of the limitations of EIA that can be overcome by SEA include its inability to account for the cumulative effects of multiple, successive projects in a particular area orto focus attention on strategic choices that, had they been made, would have precluded theneed for the project considered in the EIA (see Thérivel and Partidário 1996; Connor andDovers 2004). A 2004 intergovernmental policy forum on environmental assessment char-acterized as “core premises . . . that SEA will lead to fewer and/or simpler EIAs and will bemore effective in identifying issues of cumulative impact” (CEAA 2004b: 17).
4 See Dalal-Clayton and Sadler (2005) for a comprehensive review of SEA.
5 This description of SEA as consisting of both analytical and participatory approaches isconsistent with the most recent use of the term SEA by the OECD Development AssistanceCommittee Network on Environment and Development Cooperation (ENVIRONET).The latter describes SEA as “analytical and participatory approaches to strategic decision-making that aim to integrate environmental considerations into policies, plans andprogrammes and evaluate the inter linkages with economic and social considerations”(OECD 2006: 17).
6 Of course, real systems are often more complex than this hierarchy suggests (Dalal-Claytonand Sadler 2005).
7 Dalal-Clayton and Sadler (2005) document the extent of SEA activity around the world.Donors are trying to harmonize approaches to SEA and to identify new opportunities forits application. The Organisation for Economic Co-operation and Development’s recent“Good Practice Guidance on Applying SEA in Development Cooperation” (OECD 2006)is one such example. The World Bank’s application of SEA initially arose from a policyrequiring environmental assessment in all investment projects (that policy also providedfor the use of sectoral or regional environmental assessment in certain contexts). In 1999the requirement was extended to sectoral adjustment loans, for which SEA was often the toolof choice. The World Bank’s 2001 Environment Strategy recognized SEA as a key means ofintegrating environment into the sectoral decision-making and planning process at early
8 STRATEGIC ENVIRONMENTAL ASSESSMENT FOR POLICIES

stages and made a strong commitment to promote the use of SEA as a tool for sustainabledevelopment.
8 This assessment was carried out in 2005, relying on the information available at the time.It does not take into account any changes to SEA systems made after June 2005.
References
Ahmed, Kulsum, and Yvonne Fiadjoe. 2006. A Selective Review of SEA Legislation: Results froma Nine Country Review. Environment Strategy Paper 13, World Bank, Washington DC.
Ahmed, Kulsum, Jean-Roger Mercier, and Rob Verheem. 2005. Strategic Environmental Assessment:Concept and Practice. Environment Strategy Note 14, World Bank, Washington, DC.
AmCham (American Chamber of Commerce in Hong Kong). 2006. “Polluted Air ThreatensBusiness Decline in Hong Kong.” Journal of the American Chamber of Commerce in HongKong 38 (8): 9–16.
CEAA (Canadian Environmental Assessment Agency). 2004a. “Guidelines for Implementingthe Cabinet Directive on the Environmental Assessment of Policy, Plan and ProgramProposals.” Updated February 11. Ottawa. http://www.ceaa.gc.ca/016/directive_e.htm#2.
———. 2004b. “Status of Progress and Emerging Challenges in EIA and SEA: Ten Years afterthe Quebec Summit.” Ottawa.
Connor, R., and S. Dovers. 2004. Institutional Change for Sustainable Development. Cheltenham,United Kingdom: Edward Elgar.
Dalal-Clayton, B., and B. Sadler. 2005. Strategic Environmental Assessment (SEA): A Sourcebookand Reference Guide to International Experience. London: Earthscan.
Evans, Patrick. 2006. “Flood Forests and Community Fisheries on the Tonle Sap Great Lake,Cambodia.”European Tropical Forest Research Network. http://www.etfrn.org/etfrn/newsletter/news4546/.
Garcia, Luis. 1997. Evaluacion ambiental del programa de control de inundaciones. Consultantreport, La Plata, Argentina.
IAIA (International Association for Impact Assessment). 2002. Strategic Environmental AssessmentPerformance Criteria. Special Publication Series 1, Fargo, ND. www.IAIA.org.
IUCN (World Conservation Union). 2006. “Sustainable Livelihoods.” http://www.iucn.org/en/news/ archive/2001_2005/mbsustliveli.pdf.
North, Douglass C. 1990. Institutions, Institutional Change and Economic Performance.Cambridge: Cambridge University Press.
OECD (Organisation for Economic Co-operation and Development). 2006. Applying StrategicEnvironmental Assessment (SEA): Good Practice Guidance for Development Co-operation.DAC Guidelines and Reference Series. Paris: OECD Publishing.
Pruss-Ustun, A., and C. Corvalan. 2006. Preventing Disease through Healthy Environments:Towards an Estimate of the Environmental Burden of Disease. Geneva: World HealthOrganization.
Sadler, B., and R. Verheem. 1996. Strategic Environmental Assessment: Status, Challenges and FutureDirections. Publication 53, Ministry of Housing, Spatial Planning and the Environment, theHague.
SECTUR (Secretaria de Turismo). 2002. Programa nacional de turismo 2001–2006: El turismola fuerza que nos une, 2nd. ed. Mexico City.
SEA AND POLICY FORMULATION 9
Stephens, Carolyn. 2006. “Integrating Environmental Health into Poverty Reduction Strategiesand Sustainable Development.” Paper presented at the Ninth Poverty-EnvironmentPartnership Meeting, Washington DC, June.
Thérivel, R. 2004. Strategic Environmental Assessment in Action. London: Earthscan.
Thérivel, R., and M. R. Partidário. 1996. The Practice of Strategic Environmental AssessmentLondon: Earthscan.
UNDP (United Nations Development Programme). 2004. Reducing Disaster Risk: A Challengefor Development. New York: UNDP Bureau for Crisis Prevention and Recovery.
———. 2007. “How Tourism Can Contribute to Environmental Conservation.”http://www.uneptie.org/pc/tourism/sust–tourism/env–conservation.htm.
World Bank. 2001. An Environment Strategy for the World Bank. Washington DC.
———. 2005. Mexico Second Programmatic Environment Development Policy Loan. ProgramDocument, Report 32249–MX, Washington, DC.
———. 2006. IDA’s Thirteenth Replenishment: A Retrospective Review. Report 36321, BoardOperations, Washington, DC.
———. 2007a. Strategic Sectoral, Social and Environmental Assessment of Power DevelopmentOptions in the Nile Equatorial Lakes Region. Report No. 39199, Africa Region, Nile BasinCoordination Unit, Washington, DC.
———. 2007b. Strategic Environmental Assessment and Integrated Water Resources Managementand Development. Economic and Sector Work, Environment Department, Washington, DC.
10 STRATEGIC ENVIRONMENTAL ASSESSMENT FOR POLICIES

COUNTLESS ENVIRONMENTAL IMPACT ASSESSMENTS (EIAs) havebeen completed for individual projects, and many hundreds of strategic environ-mental assessments (SEAs) have been prepared for areawide and sectoral plansand programs. Fewer EIAs have been produced for policies than for plans andprograms.1 Sadler (2005) lists about a dozen countries with well-documented expe-riences with policy-level SEAs.2 Interest in policy-level SEAs has mounted rapidly,and efforts have been made to extract lessons from experience (Sadler 2003).3
Even if a new environmental assessment process intended to influence policydesign is created, it does not follow that those who receive the results of the assess-ments use them in ways that enhance policy making. This chapter argues that twoconsiderations are of overriding importance in determining the influence of policy-level SEAs on policy designs: the mode of integrating SEA into policy-making
C H A P T E R 2
Policy-Level StrategicEnvironmental Assessments:
Process Integration andIncentives of Policy Proponents
Leonard Ortolano
11
Leonard Ortolano is the UPS Foundation Professor of Civil Engineering at Stanford Univer-sity. Jiri Dusik, of the Regional Environmental Center for Central and Eastern Europe, inSzentendre, Hungary, had an important influence on this chapter; the author is very gratefulto him for sharing some of his many experiences in conducting SEAs. The author would alsolike to thank Kulsum Ahmed, Rachel McCormick, Ernesto Sánchez-Triana, Jaye Shuttle-worth, and two anonymous reviewers for their comments and suggestions on early drafts ofsections of this chapter.
processes (which Dalal-Clayton and Sadler 2005 refer to as process integration)and the incentives policy proponents have to consider the results of SEAs.
In an effort to synthesize lessons from experience with policy-level SEAs, thischapter examines five case studies of policy-level assessments intended to affectpolicy formulation. It also analyzes evaluations of national requirements calling forenvironmental assessments of proposed laws and policies in Canada and theNetherlands.4 Examination of each of these types of policy-level SEAs providesinsight into two central questions: How can SEA processes be structured to allowSEA teams to interact with policy designers in ways that facilitate the considerationof the environment in policy making? What steps can be taken to provide policydesigners with incentives to use environmental assessment results in policy making?
Because the environmental assessment studies considered here have differentobjectives (from formulating a national energy policy to drafting legislation) andoccur in diverse contexts and cultures, many dimensions are not comparable. Inall cases, however, designers of the SEA studies or the SEA program requirementswere required, at least implicitly, to deal with both of the questions posed above.The responses to this common set of questions are comparable in a general sense,and they provide a basis for drawing some tentative conclusions that can be usefulin SEA program design.
Case Studies
The synthesis of five case studies of policy formulation presented here provides aclose look at policy-level SEA in practice. Four of the five cases are based on mate-rial prepared by Environmental Resources Management, an environmentalconsulting firm (ERMs 2004). The other case, which concerns water and sanitationin Argentina, was reported in an unpublished paper by World Bank staff. For threeof the five cases (those involving Argentina, Canada, and the Czech Republic),supplemental information was obtained from participants in the original SEA work,and wherever possible, from supplemental literature not cited in the original SEAcase studies.
The synthesis focuses on the extent to which SEA processes were integratedinto policy-making processes and influenced policy designs. (In this context,“design” includes provisions for monitoring policy outcomes.) It indicates whereSEAs enhanced intersectoral coordination and public involvement; because thiscoordination and public involvement influenced how policy makers consideredthe environment.
An issue not examined here concerns how environmental outcomes observedon the ground were affected by proposed policies created based on recommen-dations in SEAs. The reason for this exclusion is that the ERM and World Bankdocumentation was for ex ante SEAs (that is, assessments conducted before
12 STRATEGIC ENVIRONMENTAL ASSESSMENT FOR POLICIES
decisions are made). In order to determine how an SEA influenced outcomes ofpolicy implementation, it would be necessary to conduct ex post studies and tomake causal arguments linking actions taken in response to ex ante SEAs withobserved outcomes.5
Argentina: Policy Reform in Water and Sanitation Sectors
During the late 1990s, the government of Argentina requested World Bank assis-tance in reforming its water and sanitation sectors.6 The government’s proposalconcerned policy reforms for medium-size cities and issues linked to earlier reformsin larger cities. The Bank asked the government to prepare an environmental assess-ment for what was termed the Argentina Water Sector Reform Project. In additionto policy reforms, the project concerned measures to finance public works, suchas municipal water and wastewater treatment facilities. The government hiredconsultants to prepare an SEA focusing on linkages between Argentina’s environ-mental regulatory activities and its water and sanitation sectors. The undersecretaryof water resources prepared the terms of reference (TOR) for the consultants.
The SEA was conducted during project preparation. In a departure from atypical SEA approach, the government’s TOR required the consultants to iden-tify priority issues by examining “negative external effects” (that is, unaccounted-forcosts imposed on others) in connection with: excessive water losses, such as leaksin water distribution systems; water quality deterioration, such as degradationcaused by pollution; and adverse effects of water and waste treatment systems,such as noise and odors.
The SEA was carefully integrated into the process of designing water and sani-tation sector reforms. SEA consultants coordinated with relevant policy-designauthorities in Argentina, particularly the Ministry of Economy. Interestingly, theministry initially had reservations about the SEA, because it felt EIAs for indi-vidual projects could satisfy World Bank safeguard requirements. However, theministry became a supporter of the SEA after the consultants showed how a frag-mented legal framework and weak enforcement of environmental regulationscontributed to water quality degradation, which interferes with provision of potablewater. The ministry’s change in attitude from reluctance to enthusiasm about SEAdemonstrates that policy makers who see how SEA advances their agencies’ missionsmay become SEA advocates.
In framing their analysis, government officials, World Bank task team members,and SEA consultants visited several cities and requested information from localwater authorities and other stakeholders. These visits, along with several workshops,helped identify regulatory issues blocking expansion of water service provision andparticipation by private water operators. The consultants traveled to some of thepoorest neighborhoods in order to learn about the needs of vulnerable populations.
POLICY-LEVEL STRATEGIC ENVIRONMENTAL ASSESSMENTS 13
Loan conditions recommended in the SEA were incorporated into the finalpolicy reform arrangements between the World Bank and the government ofArgentina. The project included an environmental institution-building compo-nent, which represented about 2 percent of total project cost. These funds wereto finance, among other things, revisions of environmental standards, prepara-tion of EIA guidelines, and enhancement of institutional capacity to managewatersheds. The SEA process also helped government officials move from a narrowfocus on environmental impacts of individual projects to a broader concern withsector-level priorities and environmental management issues that could be addressedonly through policy reforms. The SEA recommended information-gatheringactivities and other measures to foster monitoring of progress.
Canada: SEA for NAFTA
A 1990 Canadian cabinet directive (updated in 1999 and 2004) requires SEAs forproposed policies, plans, and programs before they are brought before the cabinet.A few years before issuance of the 1993 guidelines implementing this directive,the Canadian government undertook an environmental review of the NorthAmerican Free Trade Agreement (NAFTA). The resulting document, “NorthAmerican Free Trade Agreement: Canadian Environmental Review,” is viewedhere as an SEA.
NAFTA negotiations took place between June 1991 and August 1992. The finaldraft SEA was published in October 1992, when the text of NAFTA was initialedby trade negotiators for Canada, Mexico, and the United States, enabling the coun-tries to work toward domestic approval of the draft treaty.
The Canadian SEA for NAFTA did not reflect an effort to fully integrate activi-ties related to SEA into the process of drafting NAFTA, because the SEA wasconducted after negotiations had started.7 Production of an SEA was the last, andarguably the least-important, mechanism for integrating environmental consid-erations into NAFTA’s design. The following four-point plan was used for thispurpose (ERM 2004).■ Environmental representatives were appointed to the International Trade
Advisory Committee (ITAC) and each of the 15 Sectoral Advisory Groups onInternational Trade (SAGITs).
■ Trade-related environmental concerns were integrated into all phases of NAFTAnegotiations.
■ Parallel discussions were initiated on environmental cooperation by Canada,Mexico, and the United States.
■ The NAFTA Environmental Review Committee conducted an SEA.ITAC and the SAGITs were the principal mechanisms for public involvement.
These groups included representatives of business, the environment, labor, andacademia; results of consultations with ITAC and the SAGITs were reported to
14 STRATEGIC ENVIRONMENTAL ASSESSMENT FOR POLICIES

the Trade Minister (Hazell and Benevides 2000). In February 1992 the chairs ofITAC and the SAGITs, along with environmental representatives and Canada’ssenior NAFTA negotiators, met to discuss environmental issues. A similar groupmet in April 1992 for a workshop on trade and environment.
The SEA process included provisions for interagency coordination. The NAFTAEnvironmental Review Committee—led by the Department of Foreign Affairs andInternational Trade (DFAIT)—included representatives from many federal depart-ments (Shuttleworth 2005). The committee consulted with Canadian negotiators,provincial officials, and ITAC and the SAGITs; it also held workshops for environ-mental groups. An extensive stakeholder consultation process involved governmentministers, environmental agencies, and university professors (ERM 2004).
The TOR for the Canadian NAFTA SEA was made available to the public, andcitizens submitted comment letters.8 The general public did not participatedirectly in treaty design, however.
One of the main concerns of the environmental review was that treaty ratifi-cation might reduce Canada’s ability to regulate environmental quality(Shuttleworth 2005). The review concluded that this would not be the case.
Documentation does not allow the factors that led to either specific environ-mental provisions in NAFTA or the treaty’s environmental side-agreements tobe disentangled. NAFTA’s negotiators considered environmental concerns, andthe NAFTA Environmental Review Committee played a role in raising environ-mental concerns with the Canadian negotiators, but the SEA process was onlyone element of a four-part plan to integrate environmental concerns into treatydesign. Moreover, no evidence links a particular provision in either NAFTA or theenvironmental side-agreements to the process of producing the SEA document.It is unlikely that the SEA played a major role in negotiations, because treatynegotiators learned of environmental concerns through the earlier work of theITAC and SAGITs.
Environmental controversies surrounded the creation of NAFTA, and provi-sions were made to monitor policy outcomes linked to the environment. Acommittee on standards-related measures was formed to enhance environmentalstandards and cooperation among member states, and the North AmericanCommission on Environmental Co-operation was created to assess ongoingimpacts of NAFTA implementation.
In 2002 Foreign Affairs Canada established a new procedure for conductingSEAs for trade agreements.9 The new approach is similar to the Argentine case,because the SEA team works independently and in parallel with treaty negotiatorsbefore and during the negotiation process (J. Shuttleworth, personal communica-tion, June 1, 2005). It resembles the Slovak process (described next) in that a memberof the SEA team is also part of the treaty negotiation group, which allows nego-tiators to become aware of SEA results as they become available.
POLICY-LEVEL STRATEGIC ENVIRONMENTAL ASSESSMENTS 15

The Czech Republic: Tourism Policy
In 1992 the government of the Czech Republic enacted the Czech EnvironmentalImpact Assessment Act (No. 244/1992).10 Section 14 of the act requires environ-mental assessments for “development concepts”submitted to or approved by centraladministrative authorities in several sectors, including tourism. (The term conceptis widely understood to refer to strategies, policies, plans, and programs adopted bypublic authorities.)
Under Section 14 the proponent of a development concept must prepare SEAdocumentation, including elements typically contained in project-level EIAs. Theproposed concept and the associated SEA documentation are subject to publicreview using arrangements determined jointly by the proponent and the Ministryof the Environment. After public review, the proponent forwards review commentsalong with the concept and the SEA documentation to the Ministry of theEnvironment, which then issues an “SEA standpoint.” Although the proponentneed not accept the standpoint’s recommendations, the government will notapprove a concept unless it is accompanied by a standpoint.
Use of SEAs in the Czech Republic was limited before 1996. Indeed, somecentral governmental organizations evaded SEA requirements by changing thenames of documents for programs and policies so they would not be viewedas “concepts.”
In a departure from requirements in Section 14, the Ministry for RegionalDevelopment created Tourism Policy 2000 without preparing an environmentalassessment; the government approved that policy in preliminary form. Soon there-after the ministry prepared its draft Sectoral Operational Program for Tourismand the Spa Industry (SOP), which was also created without a required SEA. Afterthe Ministry of the Environment advised the government that SEAs were required,the government decided to withhold its final approval of the tourism policy untilafter an SEA was completed and the policy was resubmitted.
Initially, the Ministry for Regional Development had reservations aboutpreparing the SEAs, fearing that bureaucratic hurdles would slow a process itviewed as nearly complete. The Regional Development Ministry’s lack of eager-ness to conduct SEAs is reflected in the Ministry of the Environment’s need tointervene to have the SEAs performed. There was a delay of several months instarting the SEAs because of discussions between the two ministries.11
The SEA process unfolded in an unorthodox fashion. Under normal circum-stances, an SEA would have been conducted for the proposed tourism policy,and the final policy would have provided a basis for the SOP, which would havehad its own SEA. In this instance, when the draft SOP was nearly completed, theMinistry for Regional Development asked the Ministry of the Environmentwhether an SEA was needed. 12 The Ministry of Environment responded in theaffirmative; the Regional Development Ministry then engaged consultants to
16 STRATEGIC ENVIRONMENTAL ASSESSMENT FOR POLICIES

prepare an SEA for the SOP. Once that assessment was completed, work beganon the SEA for the tourism policy.
The public participated in each of the SEA processes. For the SOP, five work-shops were held in different regions. The SEA process for the tourism policy alsoallowed for public involvement, through a national public hearing. In both SEAspublic comments were positive.
Although both SEAs were conducted after the Ministry for Regional Developmenthad, in its own view, completed much of its policy design work, they led to notablechanges in the tourism policy and SOP. These changes included: addition of newpolicy goals (including “support of environmentally friendly mass transport atmore popular destinations”); environmental targets for projects that would beapproved under the SOP (including “reduction of excess of visitations [at] themost heavily visited destinations”); and new measures (including “measures tointroduce a system of [accreditation of] tourism destinations”) (ERM 2004: 26–27).Interestingly, the ministry eventually became enthusiastic about the SEA.
According to Jiri Dusik, a member of the team of consultants that preparedthe SEAs, the influence of the SEAs on the tourism policy and SOP can be explainedin two parts. The first concerns how vigorous debates between the SEA team andthe staff of the ministry were facilitated.13 Dusik gives particular credit to one ofhis co-team members, an environmental management specialist with a talent forreducing tensions in heated discussions.
The second concerns the structure of the SEA process. After first developingan understanding of the entire policy formulation process, the team sequentiallyassessed each of the four policy dimensions: overall context, goals and objectives,proposed measures, and implementation arrangements. The team would notassess any particular dimension without first completing its work on the precedingones (for example, it would not analyze proposed measures until it had completedits work on context and objectives).
When the SEA process began, the Ministry for Regional Development felt theteam would eventually try to discredit its proposed measures and activities; discus-sions of the team’s work on overall context were animated. After the SEA teamassessed goals and objectives set out in the SOP, the team met with 15 represen-tatives of different departments within the ministry. The team’s recommendationsfor changes in the goals section of the SOP were seriously considered and exten-sively debated. After two days of meetings, the SEA team’s recommendations forchanges in goals were accepted. This activity was eventually repeated for thetourism policy, with the ministry readily accepting recommended changes.14
By the time discussions concerning goals had been completed, the ministryunderstood the overall direction being followed by the SEA team and trust haddeveloped between the team and ministry staff. When the team’s meetings withthe ministry on proposed measures and activities in the SOP began, solid working
POLICY-LEVEL STRATEGIC ENVIRONMENTAL ASSESSMENTS 17
relationships had been established and the groundwork for productive negotia-tions laid. During these meetings the SEA team outlined possible impacts andproposed mitigation measures for the SOP, which were discussed over a three-to four-day period. Many of the team’s recommendations were eventually accepted.Corresponding changes in the tourism policy were later agreed on in less thana day.
Interactions between the SEA team and the ministry regarding recommen-dations for implementation and monitoring took place at a workshop, at whichindicators were created for use in monitoring progress toward goal attainment.Although the Ministry for Regional Development had agreed to conduct moni-toring activities, staff turnover hindered the progress on monitoring.15 Between2002 and 2005, nearly all of the staff members in both the Tourism Departmentof the Ministry for Regional Development and the SEA Department of theMinistry of the Environment were replaced with new staff. This slowed themonitoring effort, because most staff members who agreed to conduct moni-toring had left the ministries before a final, detailed monitoring plan had beencreated, and replacement staff were not well positioned to follow up. Somemonitoring has been conducted, but data gathering has not been as systematicas originally envisioned.
An important aspect of the SEA process concerns the learning that has takenplace within the Ministry for Regional Development. The assessment process itselfwas transformative: by the time the SEA was completed, ministry staff who hadbegun the process with significant misgivings about SEA had become enthusi-astic about it, suggesting that policy makers may embrace the process once theylearn what SEA is about and how it can help meet the goals of their agencies.16
Interestingly, individuals who replaced members of the Tourism Departmentwho had left following completion of the assessment are also supporters of SEA(J. Dusik, personal communication, January 17, 2006). In January 2006 the Ministryfor Regional Development initiated a process to update the Czech tourism policy;on its own initiative, Tourism Department staff decided to conduct an SEA simul-taneously with the update of the tourism policy. The TOR for the proposed SEAis comprehensive and specifies the stages of policy formulation at which inputsfrom the SEA process are expected. In addition, the new SEA is intended to yielda monitoring plan detailed enough to be implemented by the ministry. In thisway, the ministry hopes to avoid the difficulties caused by the lack of detail in themonitoring plan for the initial version of the tourism policy.
The Slovak Republic: Energy Policy 2000
Under the Slovak Republic’s EIA Law, initially implemented in 1994, environ-mental assessments are required for development policies in a number of sectors,including energy.17 The law requires the ministry designing a policy to prepare a
18 STRATEGIC ENVIRONMENTAL ASSESSMENT FOR POLICIES

draft policy reflecting environmental considerations and to inform the public ofthe draft at least two months before the Ministry of the Environment reviews it.The proposing ministry must then confer with the Ministry of the Environmentbefore submitting the policy for government approval.
The SEA process was indistinguishable from the process employed to designEnergy Policy 2000.18 Integration of environmental considerations into policymaking was part of the eight-step process used (ERM 2004). This process includedthe following steps:■ Preparation of draft policy■ Public notification of preparation of policy■ Formal consultations and public participation■ Public hearing on draft policy■ Statement by Ministry of Environment on draft policy■ Revision of draft policy■ Adoption of final policy ■ Monitoring of policy implementation
The way in which SEA is integrated into the policy formulation process has“probably [been] the most important factor behind the effectiveness of SlovakSEAs” (ERM 2004: 44).
Using this process the proposing ministry and the Ministry of the Environmentcoordinate closely when the Ministry of the Environment prepares its statementon the draft policy and when the draft policy is revised. The proposing ministryis not obligated to accept recommendations in the Ministry of the Environment’sstatement; revisions are made by mutual consent. In designing Energy Policy 2000,the proposing ministry (the Ministry of Economy) revised its draft policy basedon results of the SEA process. This represented an improvement in interagencycoordination (ERM 2004).
Public involvement was a hallmark of the SEA for Energy Policy 2000. The SEAprovided a vehicle for mobilizing NGOs concerned with energy-environmentrelations. The Ministry of Economy circulated a preliminary draft of the energypolicy to NGOs for comment before finalizing its draft policy. The draft wasincluded on several government, university, and NGO Web sites, and the publicwas notified of the draft through newspaper announcements. Media coverage wasextensive, the draft policy was made available at district and regional govern-mental offices, and an NGO established information kiosks in several towns. Inaddition, interested parties used the Internet to exchange information. By the endof the public comment period, the Ministry of the Environment had receivedhundreds of comments.
NGOs organized themselves under an umbrella organization, Energy 2000,and formulated their own proposal, the New Energy Policy of the Slovak Republic.This proposal was posted on government and NGO Web sites and discussed
POLICY-LEVEL STRATEGIC ENVIRONMENTAL ASSESSMENTS 19

extensively. Energy 2000 also organized an international conference, at which boththe new energy policy and the Ministry of Economy’s draft policy were debated.
A public hearing on the government’s draft policy and the new energy policy(organized by the Ministry of the Environment and the Ministry of Economy)drew about 150 participants. Transcripts of the hearing, government consulta-tions with experts, and several hundred public comments formed a basis for theMinistry of the Environment’s formal statement, which was made available to thepublic on request.
The SEA process, which considered economic as well as environmental andsocial factors, yielded many modifications to the draft energy policy. For example,the government’s draft was changed to encourage diversification of energy sourcesand “de-monopolization” and decentralization of the energy sector. Althoughmonitoring the environmental impacts of implementing Energy Policy 2000 wasnot legally required, the Ministry of Economy committed to a monitoring program.Monitoring was conducted by “responsible government bodies,” and the govern-ment was following through on commitments made in the SEA (Mária Kozová,Comenuius University, Bratilslava, Slovak Republic, personal communicationcited in ERM 2004: 40).
South Africa: KwaZulu-Natal Trade and Industrial Development Policy
South Africa’s 1995 Development Facilitation Act provides the foundation foraddressing environmental concerns in the context of spatial planning, but it doesnot require SEAs. Notwithstanding the absence of a legal mandate, several juris-dictions in South Africa have voluntarily undertaken SEAs (Wiseman 2000). Passageof the 1998 National Environmental Management Act enabled the Department ofEnvironment and Tourism to issue guidelines for “integrated environmental manage-ment”; SEA has become a popular tool for implementing this management approach(ERM 2004; see also Rossouw and Wiseman 2004). In 2000 the Council of Scientificand Industrial Research (CSIR), in partnership with the Department of Environmentand Tourism, issued a guideline document on SEA (CSIR 2000).
In response to the 1995 Development Facilitation Act, the KwaZulu-NatalRegional Economic Forum asked CSIR to prepare an SEA providing input forcreating the forum’s trade and industry policy for the KwaZulu-Natal region. Theforum, made up of representatives of regional government, industry and NGOs,was responsible for creating this policy; it wanted information on types of devel-opment that would be possible (Wiseman 2000).
The SEA process was completed before the policy-making process started; “itis not clear how the SEA was integrated into policy, if at all” (Wiseman 2000: 161).Because the SEA was an input into a subsequent policy design process, it had nobearing on either intersectoral coordination or the monitoring of policy outputs.
Apart from two stakeholder conferences involving members of the RegionalEconomic Forum, CSIR and its subcontractors conducted the SEA on their own.
20 STRATEGIC ENVIRONMENTAL ASSESSMENT FOR POLICIES
The SEA was “mainly an analytical exercise, based on the spatial resources base-line—that is, data embedded in a geographic information system—overlaid withpossible future industrial development scenario impacts” (ERM 2004: 46). It wascompleted during 1996, the same year the forum created its trade and industrialdevelopment policy.
CSIR began its SEA work with technical studies; it then held a stakeholderworkshop to discuss key environmental issues. In preparation for subsequentstages of the study, the SEA team identified assessment criteria for the degree towhich an industrial development scenario would lead to waste emissions in excessof “assimilative capacity” (the ability of a body of water or the atmosphere toreceive waste without significant deleterious effects); the demands of the proposedscenario on use of natural resources; and the suitability of particular land areasfor different types of industry.
In the final stage of its work, the team applied the criteria to classify the envi-ronmental issues and baseline conditions as strengths, weaknesses, opportunities,or threats in the context of particular industrial development scenarios. The SEAresults included information on how baseline environmental conditionsconstrained development and how particular development scenarios would affectthe environment.
After the CSIR team had conducted its analytic work, a second stakeholdermeeting was held. Forum members commented on results; in response CSIRmodified its SEA report. No apparent causal link exists between the SEA and theeventual trade and industrial policy issued by the forum. However, the industrialdevelopment sectors identified for development in the KwaZulu-Natal Trade andIndustrial Development Policy were featured in the SEA (ERM 2004).
Analysis of Case Studies
The case studies highlight the importance of the link between policy designoutcomes and the way SEAs are integrated into policy-making processes.19 Severallessons can be drawn from these studies.
Results Viewed in the Context of Integration
The cases can be classified in terms of the four ways in which SEA integrationwas carried out (table 2.1).
The outcomes of the five cases studied can be assessed using this typology(table 2.2). The assessment reflects only general tendencies; case study documen-tation does not permit a more complete characterization. The mode of integrationwas readily determined by considering when, in the policy-design process, theSEA team interacted with the policy designers. In some cases interagency coor-dination mechanisms and public involvement programs were created as part ofthe SEA process. In contrast, it was challenging to determine whether SEA processes
POLICY-LEVEL STRATEGIC ENVIRONMENTAL ASSESSMENTS 21

influenced policy design, except where specific recommendations in SEAs becamepart of final policies. It was particularly difficult to determine whether and howmonitoring programs were influenced by SEAs, because the case study docu-mentation often did not contain information on whether monitoring programsagreed to in SEA processes were carried out.
Several observations can be made based on this assessment:■ Even partially integrated SEAs can affect designs in significant ways (as the
cases of Argentina and the Czech Republic reveal).
22 STRATEGIC ENVIRONMENTAL ASSESSMENT FOR POLICIES
TABLE 2.1
Integration of SEA into Policy Making
Level of Integration Description Example
Complete SEA specialists are part of the Energy policy inpolicy design group; no clear the Slovak Republicdistinction exists between policy making and SEA.
Partial/simultaneous SEA experts form a team that Water and sanitationeffort is distinct from the policy- sector reforms in Argentina
making body; the team works cooperatively and in parallel with the policy-making group, with multiple points of contact.
Partial/late-stage SEA team works in response NAFTA and the Czecheffort to a draft policy proposal. Republic’s tourism policy
Multiple points of contact may exist between SEA experts and the policy-making body, but contacts occur relatively late inthe policy-design process.
Partial/technical SEA is conducted primarily to Trade and industrial support provide technical information development policy in
to support policy formulation; KwaZulu-Natalintegration occurs at a discrete point in the policy-design process.
Note: Other researchers have distinguished between full and partial SEA integration (see, for example,Dusik and Kosikova 2004).Source: Author.
TABLE 2.2
Level of Integration of SEAs in Case Studies
Partial/ Partial/Late-stagePartial/TechnicalComplete Simultaneous Effort
SupportSlovak Effort CzechLevel of Integration Republic Argentina Canada Republic South Africa
Intersectoral coordination Yes Yes Yes Yes No
Public involvement Yes Yes Yes Yes No
Influence on policy design Yes Yes Unclear Yes Unclear
Influence on monitoring Yes Yes Unclear Unclear No
Source: Author.

■ The influence of SEA on coordination depends on opportunities the SEA teamhas to interact with technical experts in agencies and policy designers. The onlySEA showing no discernable effects on improving intersectoral coordinationwas the one in South Africa.
■ The degree of public involvement in SEA is highly variable, reflecting thedifferent political and cultural contexts in which SEAs are conducted.
■ SEA documentation sometimes provides information on whether an SEAprocess led to design of an ex post monitoring plan that was implemented: theSlovak SEA clearly affected monitoring, and the South African SEA did not.The Czech Republic SEA yielded a general agreement on monitoring activities,but changes in staffing at the relevant ministries slowed implementation of themonitoring effort.20
■ The potential exists for cases in the partial integration/late-stage effort categoryto prolong the policy-making process and be viewed by policy designers as abureaucratic impediment. This occurred at the outset of the Czech Republic SEA,before the policy proponent eventually came to appreciate the value of SEA.
Integration and Concerns about Watering Down Attention to the Environment
In their book summarizing international experience with SEA, Dalal-Clayton andSadler (2005) highlight the importance of integration. In general, they write, “anSEA process should . . . be integrated with parallel analyses of economic and socialdimensions and issues, and with other planning and assessment instruments andprocesses” (2005: 15). Dalal-Clayton and Sadler distinguish two forms of integra-tion embedded in the previous statement. They use the term horizontal integrationto refer to the “bringing together of different types of impacts—environmental,economic and social—into a single overall assessment, at one or more stages inthe planning cycle . . .” (2005: 369). This is different from process integration, whichinvolves “integrating assessment findings into decision-making at different stagesin the planning cycle” (2005: 369).21
In the context of table 2.2, the term integration is used in the sense of processintegration, but both process and horizontal integration are important. As thecase studies indicate, careful attention to process integration is essential if thework of SEA specialists is to be considered fully and efficiently in policy making.22
Horizontal integration is also important, because without carefully examininglinkages between environmental, social, and economic processes, it is difficult toidentify environmental effects that may be indirect consequences of economicand social changes induced by a policy.
Smutney, Dusik, and Kosikova (2005: 44) describe the significance of processintegration based on their experience in the Czech Republic. “Establishing goodcommunication among the parties involved and especially between the proponent
POLICY-LEVEL STRATEGIC ENVIRONMENTAL ASSESSMENTS 23

and the SEA team is a key condition for an effective process,” they write.“This shouldbegin early, with a clear and common understanding of the process and agreementon its objectives and outputs.”
This emphasis on gaining a common understanding of the role of SEA in thepolicy-formulation process is a characteristic of the work of Jiri Dusik and hiscolleagues at the Regional Environmental Center for Central and Eastern Europe,headquartered in Szentendre, Hungary.23 For a policy-level SEA, their approachinvolves learning the details of the policy design process (that is, which issues areto be examined, why, and in what sequence) before designing the SEA. Dusik andhis colleagues ask policy makers whether the normal course of policy designincludes specific environmental investigations or consultations with environ-mental authorities or the public. Using this knowledge, an SEA team can takeadvantage of opportunities to build on assessments and consultations that policymakers would undertake whether or not an SEA was to be conducted. Based onhis experience with more than 15 SEAs conducted in this way, Dusik finds thatsuch preliminary discussions with planners and policy makers often lead to incre-mental improvements in strategic planning and policy making.
Effective process integration also involves building relationships and gainingsupport for the SEA work among policy designers. The significance of commu-nication and relationship building between SEA experts and policy designers isdemonstrated in the Czech Republic case study, which also illustrates how positiveexperience with SEA can foster organizational learning. Based in part on what itlearned through that SEA, the Czech Ministry for Regional Development tookthe initiative to begin an SEA process at the same time it started revising its tourismpolicy in 2006.
Although a strong case can be made for careful attention to both process inte-gration and horizontal integration, some experts have qualms about integration.Dalal-Clayton and Sadler (2005: 370) raise the central issue: “Many people areconcerned that the environmental dimension will be watered down in movingfrom SEA toward convergence with other appraisal and planning processes.”
Other misgivings are illustrated by criticisms of the complete integrationapproach used in the SEA for the Slovak Republic’s Energy Policy 2000. Accordingto ERM (2004), the assessment departed from good practice, because there wasno clear, structured assessment process; SEA results were not documented; andtrade-offs were not analyzed. Lee (2006: 63) notes that “it is important [that anSEA process] preserves its own independence and integrity.” The integrity of anSEA process can be maintained by requiring SEA documentation and by “inde-pendent auditing of both [the] assessment process and assessment findings (forexample, by stakeholder and peer review)” (Lee 2006: 63).
SEA experts concerned with the watering down of attention given to the envi-ronment suggest that an SEA conducted independently and in parallel with policy
24 STRATEGIC ENVIRONMENTAL ASSESSMENT FOR POLICIES
design may be preferred, because an independent SEA privileges environmentalfactors. Connor and Dovers (2004: 168) wonder “whether an independent SEAthrough its explicit championing of the environment, may offer a more effectivepolitical strategy than IA [integrated assessment] or SA [sustainability assessment],when the latter may serve to submerge environmental (and perhaps social) consid-erations within the process dominated by more powerful economic ones.”24
The position suggested by Connor and Dovers (2004) presumes that economicconcerns will dominate concerns over environmental and social factors. Thisdominance may or may not be present. For example, economic concerns do notappear to have dominated concerns about the environment in the SEA for EnergyPolicy 2000 in the Slovak Republic. Moreover, some SEA experts believe that fullintegration of SEA into policy design provides an opportunity to bring environ-mentalists together with economists and social assessment experts, thereby reducingbarriers across disciplines and enhancing overall policy coherence.25
The SEA procedure for trade policy negotiations in Canada provides an inno-vative way of maintaining the advantages of complete integration while avoidingany dilution of attention given to environmental factors.26 Environmental assess-ment of trade policy in Canada is conducted using an approach that combinesthe virtues of complete integration reflected in the Slovak Republic case studyand the partial integration/simultaneous effort illustrated by the Argentine case.In the context of the new SEA process for Canadian trade policy, the SEA teamconducts its work in parallel with the work of trade policy negotiators, therebyprivileging attention to the environment. A member of the SEA team is also amember of the negotiating team, facilitating communication between the SEAteam and the trade policy negotiators.
Assessments of SEA Requirements for Policy Proposals inCanada and the Netherlands
This section analyzes policy-level SEA systems in Canada and the Netherlands,extracting lessons relevant to the practice of conducting SEAs for cabinet-levelproposals in these countries.27 Canada and the Netherlands were selected becausetheir policy-level SEA requirements have been in place for several years and arewell documented. In addition, the effectiveness of each of these SEA programshas been subject to an independent external evaluation.
Studies of the effectiveness of the national requirements for environmentalappraisals of proposed policies in Canada and the Netherlands involve evalua-tions of a specific type of SEA application, one that is different from SEAs intendedto affect the original formulation of policies. In this type of SEA, an attempt ismade to have a cabinet (in Canada) or a council of ministers (in the Netherlands)consider the environment in making decisions on proposals set before them. Each
POLICY-LEVEL STRATEGIC ENVIRONMENTAL ASSESSMENTS 25
instance in which this is done involves an assessment, albeit one that is typicallymuch less elaborate and complete than the assessments conducted in the casestudies examined above. The evaluations discussed below examined agencyperformance and made comments about how things had been working and waysthey could be improved.
Audit of Canadian Cabinet Directive on SEA (2004)
In 1990 the Canadian cabinet issued a directive requiring federal departments toconduct SEAs before submitting proposed policies, plans, and programs to anindividual minister or the cabinet for approval. This requirement applies only ifimplementation of the proposal may result in significant environmental effects.
The Commissioner of the Environment and Sustainable Development in theOffice of the Auditor General of Canada assessed the performance of federaldepartments in implementing the 1990 directive (as amended). A 1998 assess-ment supported findings of an earlier study by the Canadian EnvironmentalAssessment Agency that “most departments had not developed guidelines or direc-tives on the Environmental Assessment of policies or programs” (Commissionerof the Environment and Sustainable Development 1998:17). It also found thatSEAs were conducted without consulting experts across departments or evenwithin the departments conducting the SEAs. Moreover, some senior depart-mental officials responsible for preparing cabinet documents “either were notaware of the existence of the . . . directive or did not know how it was being imple-mented” (1998: 18). A follow-up report in 2000 noted that departments were not“making sufficient progress to fully correct deficiencies” (Commissioner of theEnvironment and Sustainable Development 2000).
In 2004 the commissioner conducted another assessment, focusing on perform-ance from 2000 to 2002. This assessment found that, in general,“departments andagencies do not know how the strategic environmental assessments they havedone have affected the decisions made, and, in turn, what the ultimate impactson the environment are” (Commissioner of the Environment and SustainableDevelopment 2004: 22). Moreover, audit results “suggest that most departmentshave not made serious efforts to apply the directive” (28).28
The 2004 audit closes by asking why, more than a decade after the cabinetdirective was first issued, a performance gap remains. According to the report,one important reason is the lack of commitment by senior management. Thereport noted a correlation between relatively strong performance and high commit-ment by top-level managers. In departments in which senior managers lacked thiscommitment, the importance of the directive to the department was not commu-nicated to the organization, expected outcomes were not articulated clearly, andsufficient resources and staff for implementation were not made available. Theaudit lauded performance by the Department of Foreign Affairs and International
26 STRATEGIC ENVIRONMENTAL ASSESSMENT FOR POLICIES
Trade, which had a Web site that included an executive message establishing minis-terial commitment to SEA, as well as information on the benefits of SEA andinstructive case studies.
Another factor impeding progress was the absence of a central oversightauthority. In response, the report of the Commissioner of the Environment andSustainable Development (2004) recommended that the Privy Council Officeensure that responsibilities and authorities are assigned for central monitoringand compliance with the cabinet directive on an ongoing basis. Rather thanembracing this recommendation, the Privy Council Office argued that SEAs wereself-assessments and that quality control could be ensured by existing mechanismsfor intersectoral coordination.
The report of the Commissioner of the Environment and SustainableDevelopment (2004) also highlighted a systemic problem based on the lack ofcongruence between SEA as a “one-time-only” exercise and the existence ofmultiple decision-making points in the policy-making process. Thus, for example,some SEAs were conducted when a policy was first proposed and only at a generallevel. No follow-up was done when, much later in the process, details had beenadded to flesh out (and sometimes change considerably) the original policy state-ment. In contrast, other SEAs were conducted late in the policy-making process,just before submission for funding approval. In these cases, it was generally toolate for the SEA process to inform policy design.
This timing dilemma is linked to the practice of treating SEAs as “a separate,isolated track, or ‘silo,’ which is not integrated with other analyses” (Commissionerof the Environment and Sustainable Development 2004: 20). This practice limitsthe degree to which SEA results are integrated into decision making and mayresult in missed opportunities for integrating environmental studies with socialand economic analyses.
SEA specialists concerned that fully integrated assessments may dilute consider-ation given to environment should consider the alternative: if integration of SEAbegins late in the policy-design process, assessment results may be discounted heavily.The 2004 audit reinforces the argument that more attention should be given tofostering both process and horizontal integration. Process integration brings SEAsmore fully into policy design processes, instead of viewing them, as is currently doneunder the Canadian cabinet directive, as one-time exercises to assess a particularpolicy alternative. Horizontal integration considers environmental, social, and economicassessments together, so that indirect environmental effects can be accounted for anddecision makers can be presented with more-complete assessment results.
Evaluation of the Netherlands’ E-Test
Beginning in the 1980s, the government of the Netherlands experimented withrequirements to accompany legislative proposals with a statement of unintended
POLICY-LEVEL STRATEGIC ENVIRONMENTAL ASSESSMENTS 27

side effects.29 In 1994 this effort was expanded in the form of an “EnvironmentalTest” (E-Test)—a requirement to assess the environmental impacts of proposedlegislation. E-Test results are attached to draft legislation submitted for consider-ation by the Council of Ministers.
Many Dutch laws are drafted by government departments using an informalprocess based on trust and cooperation among civil servants. This process iscarried out without requirements for public participation and does not involveexternal review.
Those conducting the E-Test were asked to determine the consequences ofproposed legislation on energy consumption and mobility; use of renewable andnonrenewable resources; waste and emissions into the air, soil, and water; and useof open space. E-Test results were reviewed by the Joint Support Center for DraftLegislation, which served as both a review body and a source of assistance (byproviding information and environmental data). In cooperation with the Ministryof Justice, the center could oppose the submission of proposed legislation to theCouncil of Ministers if the E-Test did not produce information needed by thecouncil to make an informed decision.
After the first five years of experience with the E-Test, the Ministry of Housing,Spatial Planning and the Environment hired consultants to evaluate the test’seffectiveness. After reviewing documents, interviewing staff, and conducting casestudies, the consultants concluded that the E-Test was carried out so late in theprocess of drafting a legislative proposal that it had little influence on the qualityof the legislation eventually adopted. Moreover, staffs in many departmentsknew little about the E-Test. In general, the experience with the E-test through2001 showed that the test produced information that “played only a limited rolein policy-making and contributed little to the improvement of draft laws andregulations” (van Dreumel 2005: 73).
In response to the 2001 evaluation, the government replaced the E-Test with atwo-part process. The first part of the process is a “quick scan” screening step usedin the early stages of policy formulation that yields both a decision on whetheradditional study is needed and the TOR for the additional study. The additionalstudy, an “environmental appraisal,” is conducted by the department taking thelead in proposing the legislation.
The second part of the process is the granting of oversight responsibilities tothe Ministry of Justice. After an appraisal is conducted, the Ministry of Justiceprepares a “legislation report” indicating whether the quality of informationyielded by the appraisal is appropriate for the draft legislation being put forward.If the Ministry of Justice finds that the information is not of sufficiently highquality, it consults the ministry proposing the legislation. Following consultation,if there is no agreement regarding the completeness of the information, this is
28 STRATEGIC ENVIRONMENTAL ASSESSMENT FOR POLICIES
noted in the legislation report and the “the responsible ministry includes thisreport in the documents for the Council of Ministers” (van Dreumel 2005: 75).
Lessons Learned
Compliance with policy-level SEA requirements in both Canada and the Netherlandscan be described as pro forma. Where solid progress has been made, it has resultedpartly in response to evaluations by external bodies and the commitment of seniorofficials in particular agencies.
Self-assessment is a central feature of the environmental assessments of policyproposals in both countries. But why would departments spend time and moneyon such self-assessments? Part of the explanation for the slow progress in bothCanada and the Netherlands is the absence of strong incentives for departmentsto devote resources to policy-level SEAs.
What can be done to improve things? One approach, which has been discussedin both countries, requires creating an oversight body to control the quality ofSEA results. In Canada the Commissioner of the Environment and SustainableDevelopment (2004) recommended that the Privy Council assign oversightauthorities to a centralized body, but this recommendation was not embraced.In the Netherlands the Ministry of Justice, which has cross-sectoral responsibili-ties, has responsibility for commenting on the quality of information generatedduring the environmental assessment. The ministry’s oversight powers are modest:it comments on whether the quality of information yielded by the environmentalassessment is appropriate for the draft legislation being proposed and alerts theCouncil of Ministers when it finds an environmental appraisal inadequate. Becausethis oversight requirement was established only recently, it remains to be seenwhether it will bear fruit.
A different strategy, which could be pursued simultaneously with the creationof an oversight organization, involves raising awareness by agencies of ways inwhich SEAs can be used to attain agency goals. According to the 2004 auditconducted in Canada, the commitment to SEA of high-level officials within federaldepartments was correlated with whether SEAs were taken seriously. If agencyleaders believe SEAs can provide information that helps them meet their goals, thechances of having meaningful assessments conducted are likely to be enhanced.30
This was clearly demonstrated by actions taken at the Department of Foreign Affairsand International Trade and several other agencies in Canada.
The evaluations in Canada and the Netherlands highlight a systemic problemwith treating SEA as an exercise involving the analysis of environmental effects ofa specific policy proposal. Assessment of the Canadian cabinet directive empha-sized the limitations of “one-time-only”assessments in the context of policy making,which involves multiple decision-making points. The evaluation of the E-Test in
POLICY-LEVEL STRATEGIC ENVIRONMENTAL ASSESSMENTS 29
the Netherlands noted that the test was often conducted too late in the process tohave much influence on legislation. These systemic difficulties suggest a need forbeginning environmental assessment earlier and either fully integrating SEA intopolicy design or employing partial integration with a parallel SEA effort thatcontinues for the duration of the policy-design process.
Conclusions
What does it take for SEA to fulfill the goal of integrating environmental consider-ations into policy designs? Some aspects of the answer to this question are self-evident.SEAs must be carried out by trained staffs using appropriate methods and supportedby adequate resources. This chapter does not focus on these matters. Instead, itestablishes the overarching importance of integrating SEA into policy-design processesand creating incentives for policy proponents to take SEA seriously.
Before presenting conclusions from this analysis, a caveat is in order. No inquirybased on the modest set of case studies and evaluations considered here can yieldanything more than hypotheses requiring further investigation.
Process integration challenges are closely tied to the incentives of policy propo-nents to conduct SEAs and employ assessment results. Where incentives are weak,pro forma compliance (or even noncompliance) with formal SEA requirementsmay be widespread. In contrast, policy proponents motivated to embrace SEAbecause they see value in doing so are likely to give careful attention to processintegration issues.
Fostering Interaction between SEA Teams and Policy Designers
How can SEA processes be structured to allow SEA teams to interact with policydesigners in ways that facilitate consideration of the environment in policy making?Each of the case study settings in which SEA had the greatest influence on policymaking—Argentina, the Czech Republic, and the Slovak Republic—involvedintensive interaction between the SEA team and policy designers. In Argentinaand the Slovak Republic, SEA was initiated early in the policy formulation process,and SEA specialists interacted frequently with policy designers.31 In the CzechRepublic the SEA started late; although it nevertheless influenced policy making(because of the skill and effort the SEA team employed in fostering open commu-nications and building trust with the policy designers), there were notable delaysin the policy-making process.
The evaluations of environmental assessment requirements for cabinet-levelproposals in Canada and the Netherlands reinforce the overriding importance ofprocess integration. In both cases compliance with requirements was pro forma,and there was little apparent influence on outcomes as a result of most assess-ments. In the Canadian case, the evaluation emphasized the limitations ofconducting one-time-only assessments of policies at any particular stage in the
30 STRATEGIC ENVIRONMENTAL ASSESSMENT FOR POLICIES

policy-formulation process. In the Netherlands the lack of influence of environ-mental assessments on proposed legislation was attributed to the fact that theassessments were submitted too late (just before submission of legislative proposalsto the Council of Ministers). Revisions of the process addressed this weakness byintroducing a quick scan, conducted early in the policy-making process so that amore complete environmental appraisal could be conducted when warranted.
Some SEA experts argue that integrated assessments may dilute the attentiongiven to environmental factors. In the cases reviewed here, there was no evidenceof such dilution. It is not clear that integration (in the sense of both processintegration and horizontal integration) need involve dilution, because innovativeprocesses can be created to offset any such danger. This is demonstrated by thenew SEA approach developed by Foreign Affairs Canada for conducting environ-mental assessments for trade policies.
Creating Incentives for Compliance
What steps can be taken to provide policy designers with incentives to use envi-ronmental assessment results in policy making? The importance of this questionis established by noting what has happened in circumstances in which incentiveswere weak (in the sense that failing to comply with SEA requirements was notpenalized). In Canada the absence of penalties for noncompliance is viewed as animportant reason for the pro forma compliance of many agencies to the require-ment for environmental assessments of cabinet-level proposals.
One approach to creating incentives for complying with policy-level SEA require-ments involves imposing penalties for failure to comply. A standard way to do thisis to give a cross-sectoral agency responsibility and tools for ensuring compliance.
Another way of creating incentives involves controlling access to resources, anapproach demonstrated by the Argentine case study. The government of Argentinacould not have obtained the loan it sought if it had not conducted the environ-mental assessment required by the World Bank’s internal directives.
These incentives are external to the policy proponent: oversight is exercisedby another agency and control over resources is exerted by a funder. Incentivescan also be internal. Based on its experience with SEA in creating a nationaltourism policy, the Czech Republic’s Ministry for Regional Development wentfrom being a reluctant participant to a proactive adopter of the new environ-mental assessment process at the very start of its recent effort to revise its tourismpolicy. A similar reversal in attitude toward SEA occurred in Argentina, where theMinistry of Economy, which initially had reservations about the need for SEA,became an SEA supporter after seeing how the assessment could help meet theministry’s objectives in providing drinking water supplies. Similar outcomes areevident in Canada, where leaders of agencies that have embraced environmentalassessment requirements for cabinet-level proposals view SEA as an instrument
POLICY-LEVEL STRATEGIC ENVIRONMENTAL ASSESSMENTS 31

for goal attainment. For example, the Canadian Ministry of Foreign Affairs usedits early experience with SEAs for trade policies to create an innovative SEA processto help meet its sustainable development goals.
Fostering Organizational Learning
What can be done to foster organizational learning? Carefully tailored case studiesused to inform agency leaders may provide an answer.
Policy proponents might take SEA seriously if they learned of case studiesdemonstrating the value added by SEAs conducted in circumstances similar totheir own. The challenge is in identifying case study information relevant toagency-specific contexts and in finding venues at which policy proponents canbe informed about such case studies. This information transfer challenge mightbe handled at the national and subnational levels of government, where it ispossible to provide case study material and training programs tailored to circum-stances faced by individual agencies.
Gaining High-Level Commitment
Gaining the commitment of high-level agency officials is a critical step in imple-menting a program requiring policy-level SEAs. As experience in Canadademonstrates, commitment by agency heads signals to lower-level staff that SEAis to be taken seriously. In these circumstances, agency resources can be reallocatedand SEA processes crafted to reflect the realities of day-to-day agency operations.
Notes
1 For an introduction to the burgeoning literature on SEA, see Dalal-Clayton and Sadler(2005). Jones and others (2005) document the extensive use of SEA in land use planning.
2 Examples of countries with experience with policy-level SEAs dating to the 1990s includeCanada, the Czech Republic, Denmark, Finland, and the Slovak Republic.
3 The definition of policies suggested by Dalal-Clayton and Sadler (2005: 18)—“broad state-ments of intent that reflect and focus the political agenda of a government”—is adoptedhere. Policies include “laws, regulations, strategies and other official/formal governmentprocesses that have an implication on subsequent actions” (ERM 2004: 2).
4 This chapter summarizes an unpublished report originally prepared as a contribution toWorld Bank (2005). The report was prepared in response to contract terms of referencethat singled out the case studies in ERM (2004) and the SEA for Argentina discussed belowas well as the evaluations in Canada and the Netherlands considered here.
5 For insights into the challenges involved in conducting ex post studies to determine theinfluence of SEAs on environmental change, see Partidário and Fischer (2004) andPartidário and Arts (2005).
6 This section is based on Sánchez-Triana and Enriquez (2005).
7 Under current Canadian practice, environmental reviews for treaties begin before or, at thelatest, at the beginning of negotiations (J. Shuttleworth, Foreign Affairs Canada, personalcommunication, June 17, 2005).
32 STRATEGIC ENVIRONMENTAL ASSESSMENT FOR POLICIES

8 This paragraph is based on Hazell and Benevides (2000) and ERM (2004).
9 In 2003 DFAIT was divided into two departments, Foreign Affairs Canada and InternationalTrade Canada. The SEA procedure is detailed in DFAIT (2002).
10 General information on SEA in the Czech Republic in this paragraph and the two thatfollow is from Machac, Rimmel, and Zenaty (2000), and from personal communicationswith J. Dusik, Regional Environmental Center for Central and Eastern Europe, June 1 and18, 2005.
11 The Ministry for Regional Development’s feared delay in the policy-making process didoccur, but it resulted, in part, from the ministry’s initial omission of required SEAs.
12 Information in the remainder of this subsection is from J. Dusik, SEA consultant (personalcommunications, May 25 and June 18, 2005).
13 Another explanatory factor, which Dusik considers minor, is that the potential for findingmutually supportive linkages between tourism development and environmental protectionmakes it possible to identify actions that advance tourism while protecting the environment.
14 These changes were accepted in less than an hour, because targets for the protection ofenvironment had already been agreed on in the SOP.
15 At the end of the SEA process, the SEA consultants and the two ministries agreed thatthe ministries would later finalize the monitoring system jointly and clarify institutionalresponsibilities for monitoring. The rapid staff turnover that followed had not beenanticipated.
16 Marshall and Fischer (2005) give another example of organizational learning in the contextof SEA. They show how ScottishPower used SEA to “not only address the environmentalimpact of future investment programmes but . . . also to enhance the environmental gover-nance and stewardship of established corporate decision-making frameworks” (687–88).They conclude that, for purposes of evaluating “environmental parameters on equal footingwith economic and technical parameters. . . . [SEA] is a suitable instrument that is able tostrengthen and improve corporate decision-making procedures” (688).
17 This section is based on ERM (2004).
18 The government had experience conducting SEAs for energy policy. That experienceinfluenced the approach followed in 1999 when a new government started revising theenergy policy.
19 Many others have highlighted the significance of SEA process integration (see, for example,João 2005 and Partidário 2005).
20 The effects of SEAs on monitoring are difficult to discern for the NAFTA and Argentine cases.
21 Dalal-Clayton and Sadler (2005: 369) cite a third form of integration, which they callvertical integration: the integration of assessments “undertaken at different stages in thepolicy, planning and project cycle (tiering).” Scrase and Sheate (2002) go farther, distin-guishing 14 meanings of integration in the context of environmental governance.
22 Having an influence on policy design is a key reason for conducting a policy-level SEA.
23 In elaborating on practical issues linked to careful integration of SEA into planning andpolicy making, Dusik cautions that flexibility is required, because planners and policymakers may change their ideas abruptly and new SEA studies may be needed in responseto these changes. SEA budgets and TORs need to reflect these possible outcomes (personalcommunication January 19, 2006).
24 Integrated assessment is often used to refer to horizontal integration. Sustainability assessmentis “an integrated assessment that is carried out within an explicit framework of sustainability
POLICY-LEVEL STRATEGIC ENVIRONMENTAL ASSESSMENTS 33
objectives and criteria”Sadler (2005: 3, emphasis added). For more on sustainability assessment,see Gibson (2005).
25 This view was expressed by Jaye Shuttleworth (Foreign Affairs Canada) and ColinKirkpatrick (University of Manchester) in response to questions at a forum on “Ethicsand Quality in Trade Impact Assessment” at the June 2005 meeting of the InternationalAssociation for Impact Assessment, in Cambridge, MA. The journal IntegratedAssessment contains numerous examples documenting the growing experience withintegrated assessment.
26 For more information on the Canadian procedures for SEA in the context of trade policynegotiations, see DFAIT (2002).
27 This assessment was carried out in 2005, relying on the information available at the time.It does not take into account any changes to these SEA systems in those countries madeafter June 2005.
28 The 2004 audit also contained some positive findings and cited good practices. Somedepartments were lauded for accountability structures, guidance (both in documents andon Intranets), and SEA screening and tracking systems.
29 Except where noted, this section is based on Verheem (2004).
30 Marshall and Fischer (2005) examine how companies can use SEAs to meet their goals.Their discussion points to specific benefits from the voluntary application of SEA, includingtime and cost savings reaped by establishing a strategic decision-making framework thatconsolidates existing procedures and facilitates participation and consultation. They alsonote increased “levels of public understanding and acceptance of the plans andprograms. . . . Furthermore, SEA may assist in reducing negative environmental impactsor delays in corporate objectives that are ultimately costly for private companies” (676).
31 The Slovak SEA involved complete integration; the Argentine case involved partial inte-gration/simultaneous effort.
References
Commissioner of the Environment and Sustainable Development. 1998. “EnvironmentalAssessment: A Critical Tool for Sustainable Development.” In Report of the Commissionerof the Environment and Sustainable Development to the House of Commons. Office of theAuditor General of Canada, Ottawa.
———. 2000.“Follow-Up of Previous Audits: More Action Needed.” In Report of the Commissionerof the Environment and Sustainable Development to the House of Commons. Office of theAuditor General of Canada, Ottawa.
———. 2004.“Assessing the Environmental Impacts of Policies, Plans, and Programs.” In Reportof the Commissioner of the Environment and Sustainable Development to the House ofCommons. Office of the Auditor General of Canada, Ottawa.
Connor, R., and S. Dovers. 2004. Institutional Change for Sustainable Development. Cheltenham,United Kingdom: Edward Elgar.
CSIR (Council for Scientific and Industrial Research). 2000. Guideline Document, StrategicEnvironmental Assessment in South Africa. Report prepared in cooperation with theDepartment of Environment and Tourism, Pretoria.
Dalal-Clayton, B., and B. Sadler. 2005. Strategic Environmental Assessment: A Sourcebook andReference Guide to International Experience. London: Earthscan.
34 STRATEGIC ENVIRONMENTAL ASSESSMENT FOR POLICIES
DFAIT (Department of Foreign Affairs and International Trade). 2002. Handbook for ConductingEnvironmental Assessments of Trade Negotiations. Ottawa.
Dusik, J., and S. Kosikova. 2004. “Designing Effective SEA Systems: Lessons from REC PilotSEA Projects.” In Strategic Environmental Assessment Making a Difference, publication2003/012, European Environmental Bureau, Brussels.
ERM (Environmental Resources Management). 2004. “Case Studies of Policy SEAs.” Reportprepared for the World Bank, Environment Department, Washington, DC.
Gibson, R. B. 2005. Sustainability Assessment: Criteria, Processes and Applications. London:Earthscan.
Hazell, S., and H. Benevides. 2000. “Toward a Legal Framework for SEA in Canada.” InPerspectives on Strategic Environmental Assessment, eds. R. Partidário and R. Clark, 47–68.Boca Raton, FL: Lewis Publishers.
João, E. 2005. “Key Principles of SEA.” In Implementing Strategic Environmental Assessment,eds. M. Schmidt, E. João, and E. Albrecht, 3–14. Berlin: Springer.
Jones, Carys, Mark Baker, Jeremy Carter, Stephen Jay, Michael Short, and Christopher Wood,eds. 2005. Strategic Environmental Assessment in Land Use Planning. London: Earthscan.
Lee, N. 2006. “Bridging the Gap between Theory and Practice in Integrated Assessment.”Environmental Impact Assessment Review 26 (1) 57–78.
Machac, M. D., V. Rimmel, and L. Zenaty. 2000. “SEA in the Czech Republic.” In Perspectiveson Strategic Environmental Assessment, eds. M. R. Partidário and R. Clark, 81–89.Boca Raton, FL: Lewis Publishers.
Marshall, R., and T. Fischer. 2005. “Best Practice Use of SEA: Industry, Energy and SustainableDevelopment.” In Implementing Strategic Environmental Assessment, eds. M. Schmidt,E. João, and E. Albrecht, 673–72. Berlin: Springer.
Partidário, M. R. 2005. “Capacity-Building and SEA.” In Implementing Strategic EnvironmentalAssessment, eds. M. Schmidt, E. João, and E. Albrecht, 649–63. Berlin: Springer.
Partidário, M. R., and J. Arts. 2005. “Exploring the Concept of Strategic EnvironmentalAssessment Follow-Up.” Impact Assessment and Policy Appraisal 23 (3): 246–57.
Partidário, M. R., and T. B. Fischer. 2004. “Follow-Up in Current SEA Understanding.” In EIAand SEA Follow–Up, eds. A. Morrison-Saunders and J. Arts, 97–117. London: Earthscan.
Rossouw, N., and K. Wiseman. 2004. “Learning from the Implementation of EnvironmentalPublic Policy Instruments after the First Ten Years of Democracy in South Africa.” ImpactAssessment and Project Appraisal 22 (2): 131–40.
Sadler, B., ed. 2005. Strategic Environmental Assessment at the Policy Level: Recent Progress,Current Status and Future Prospects. Szentendre, Hungary: Regional Environmental Centerfor Central and Eastern Europe.
Sánchez-Triana, E., and S. Enriquez. 2005. “Using Strategic Environmental Assessments forEnvironmental Mainstreaming in the Water and Sanitation Sector: The Cases of Argentinaand Colombia.” Environmental and Socially Sustainable Development, Latin America andCaribbean Region, World Bank, Washington, DC.
———. 2007. “Using Policy-Based Strategic Environmental Assessments in Water Supply andSanitation Sector Reforms: The Cases of Argentina and Colombia.” Impact Assessment andProject Appraisal. 25 (3): 175–87.
Scrase, J. I., and W. R. Sheate. 2002. “Integration and Integrated Approaches to Assessment:What Do They Mean for the Environment?” Journal of Environmental Policy & Planning4 (4): 275–94.
POLICY-LEVEL STRATEGIC ENVIRONMENTAL ASSESSMENTS 35

Shuttleworth, J. 2005. “Building on Experiences and Addressing Challenges.” Paper presentedat the “Theme Forum on Ethics and Quality in Trade Impact Assessment,” 25th AnnualConference of the International Association for Impact Assessment, Cambridge, MA,May 31–June 3.
Smutney, M., J. Dusik, and S. Kosikova. 2005. “SEA of Development Concepts in the CzechRepublic.” In Strategic Environmental Assessment at the Policy Level: Recent Progress, CurrentStatus and Future Prospects, ed. B. Sadler, 36–45. Szentendre, Hungary: RegionalEnvironmental Center for Central and Eastern Europe.
van Dreumel, M. 2005. “Netherlands’ Experience with the Environmental Test.” In StrategicEnvironmental Assessment at the Policy Level: Recent Progress, Current Status and FutureProspects, ed. B. Sadler 69–75. Szentendre, Hungary: Regional Environmental Center forCentral and Eastern Europe.
Verheem, Rob. 2004. “Evaluation of the Dutch E-Test.” Commission for Environmental Impact,Utrecht, the Netherlands.
Wiseman, K. 2000. “Environmental Assessment and Planning in South Africa: The SEAConnection.” In Perspectives on Strategic Environmental Assessment, eds. M. R. Partidárioand R. Clark, 155–66. Boca Raton, FL: Lewis Publishers.
World Bank. 2005. Integrating Environmental Considerations in Policy Formulation: Lessons fromPolicy Based SEA Experience. Report 32783, Environment Department, Washington, DC.
36 STRATEGIC ENVIRONMENTAL ASSESSMENT FOR POLICIES
THIS CHAPTER EXAMINES two ways of conceptualizing policy formation.1
The first is as a rational decision-making process, exemplified by current use ofStrategic Environmental Assessment (SEA). SEA is a tool for integrating environ-mental considerations in the formation of programs, plans, and policies. It is builtupon an understanding of policy formation as linear stages of rational decisionmaking focused on defining policy problems and identifying and selecting solu-tions. Drawing on the example of SEA, this chapter introduces three assumptionsthat are key to understanding models of rational decision making and shows howthe uncertainty and ambiguity of policy formation make these assumptions hardto meet.
C H A P T E R 3
The Continuous Process ofPolicy Formation
Martha S. Feldman and Anne M. Khademian
37
Martha S. Feldman is the Johnson Chair for Civic Governance and Public Management inthe Department of Planning, Policy, and Design at the University of California–Irvine. AnneM. Khademian is associate professor at the Center for Public Administration and PolicySchool for Public and International Affairs, at Virginia Tech, in Alexandria, VA. The authorsthank Andrea Ballestero for sharing her research on reform of the water sector in Ceará,Northeast Brazil, and for her careful review of this chapter to integrate that research. KathyQuick read and provided very helpful comments on the chapter. Cressa Paz helped preparethe references. The authors are grateful for the comments of two anonymous reviewers on anearlier version of this chapter. Their thanks also go to Kulsum Ahmed and Ernesto Sánchez-Triana for the opportunity to contribute to this volume and for the guidance, suggestions,and helpful feedback they provided.
Alternatively, policy making can be conceptualized as a continuous process inwhich an action taken at one point is not an end but a means; each action helpsreveal the next set of policy questions and possibilities. For example, the actionof building taller smokestacks reduced the amount of air and ground pollutionfor communities near the smokestacks, but it revealed the next set of questions,related to the complex problem of acid rain affecting communities far from theinitial pollution source.
The model of policy formation as a continuous process combines two modelsthat have been developed elsewhere. One of these models, “adaptive manage-ment,” is necessary because action must be taken even when there is considerableuncertainty about its effects (Holling 1978; Walters and Holling 1990). Adaptivemanagement is a way of taking action designed to decrease risk and increaseopportunities for learning. The other model, “inclusive management,” describeshow people with different orientations and ways of understanding and valuingpolicy problems and solutions can work together to propose and take action(Feldman and Khademian 2000, 2007).
Central to understanding policy formation as a continuous process is an appre-ciation of policy processes as fundamentally social. Policy problems involve peoplein addition to material objects. They are complex and require multiple sources ofknowledge and information to address. They require getting people to move fromone set of policy actions to another. These fundamentally social aspects of policyformation point to the ongoing creation of a community of participation in anypolicy process and the importance of the qualities of any community of partici-pation for taking action in the context of ambiguity.
Using the case study of a small community in Northeastern Brazil (Ballestero2004, 2006), the chapter shows how the continuous process incorporates bothadaptive and inclusive management and how the combination enables policyformation to encompass more viewpoints, including those that have been marginalin other processes. The chapter is organized as follows. The next section explorestwo models of policy formation, the rational decision-making model and the“garbage can” model of decision making. The second section examines policyformation as a continuous process in which both uncertainty and ambiguity mustbe managed. The last section draws some conclusions.
Policy Formation as Decision Making
SEA is a tool for injecting environmental concerns into the discussion of policies,plans, and programs that have significant environmental implications. Ratherthan assessing concerns at the project level, where critical decisions of design andlocation have already been made, SEA seeks to influence decisions “upstream,” sothat environmental considerations are reflected in choices for alternative projects(World Bank 2002).
38 STRATEGIC ENVIRONMENTAL ASSESSMENT FOR POLICIES
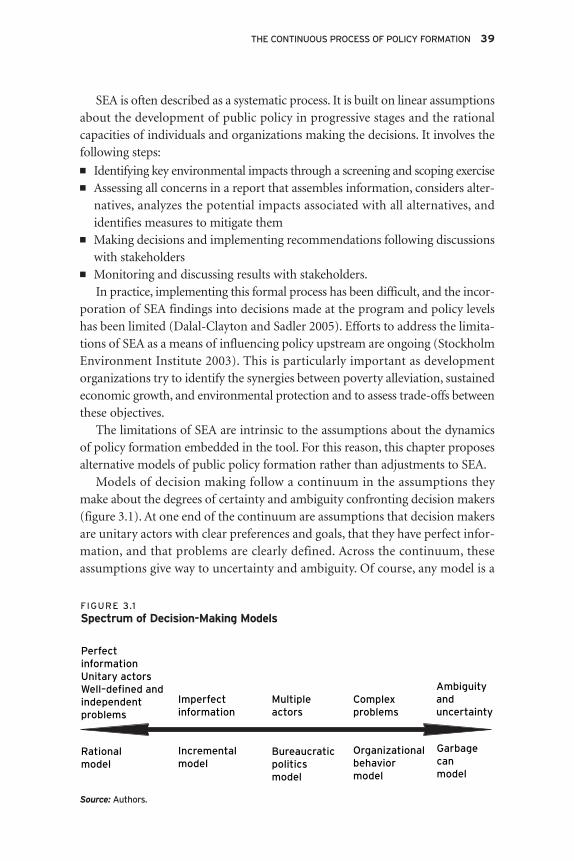
SEA is often described as a systematic process. It is built on linear assumptionsabout the development of public policy in progressive stages and the rationalcapacities of individuals and organizations making the decisions. It involves thefollowing steps:■ Identifying key environmental impacts through a screening and scoping exercise■ Assessing all concerns in a report that assembles information, considers alter-
natives, analyzes the potential impacts associated with all alternatives, andidentifies measures to mitigate them
■ Making decisions and implementing recommendations following discussionswith stakeholders
■ Monitoring and discussing results with stakeholders.In practice, implementing this formal process has been difficult, and the incor-
poration of SEA findings into decisions made at the program and policy levelshas been limited (Dalal-Clayton and Sadler 2005). Efforts to address the limita-tions of SEA as a means of influencing policy upstream are ongoing (StockholmEnvironment Institute 2003). This is particularly important as developmentorganizations try to identify the synergies between poverty alleviation, sustainedeconomic growth, and environmental protection and to assess trade-offs betweenthese objectives.
The limitations of SEA are intrinsic to the assumptions about the dynamicsof policy formation embedded in the tool. For this reason, this chapter proposesalternative models of public policy formation rather than adjustments to SEA.
Models of decision making follow a continuum in the assumptions theymake about the degrees of certainty and ambiguity confronting decision makers(figure 3.1). At one end of the continuum are assumptions that decision makersare unitary actors with clear preferences and goals, that they have perfect infor-mation, and that problems are clearly defined. Across the continuum, theseassumptions give way to uncertainty and ambiguity. Of course, any model is a
THE CONTINUOUS PROCESS OF POLICY FORMATION 39
PerfectinformationUnitary actorsWell–defined andindependentproblems
Imperfectinformation
Multipleactors
Complexproblems
Ambiguityanduncertainty
Garbagecan model
Organizationalbehaviormodel
Bureaucraticpoliticsmodel
Incrementalmodel
Rationalmodel
FIGURE 3.1
Spectrum of Decision-Making Models
Source: Authors.

simplification. For this reason, the focus is not on the particular ways in which amodel works in practice—which will always deviate from the abstract description—but on the basic assumptions. If the basic assumptions are fundamentallydisconnected from the context, even at the most abstract level, the model is notan appropriate base for action.
The Rational Decision-Making Model
SEA is very similar to the rational decision-making model (table 3.1). Its sequen-tial process makes sense in the abstract. It is in the practice of decision making orpolicy formation that difficulties are encountered. Many of the problems derivefrom the assumptions implicit in rational models. These assumptions fall intothree categories: assumptions about information, assumptions about unitaryactors, and assumptions about the nature of the problems being addressed.
The second step of the rational decision-making model shown in table 3.1 isnot explicitly included in SEA, but it is implicit in the identification of key envi-ronmental impacts. The other steps of the rational model are all reflected in theSEA model.
Assumption about information. The rational decision-making model assumesthat a decision maker has complete information. For many reasons, this assump-tion does not hold in most decision-making and policy-making processes. Thefundamental problem with this assumption is that people are limited informa-tion processors (Simon 1957a, 1957b; March and Simon 1958). The classicalrational model requires an amount of simultaneous information processingthat is simply beyond the capacity of human beings (Steinbruner 1974). Thedemand can be met if the boundaries of the problem are drawn very narrowly
40 STRATEGIC ENVIRONMENTAL ASSESSMENT FOR POLICIES
TABLE 3.1
Similarities between Rational Decision-Making Model and Strategic Evaluation Assessment
Rational Decision-Making Model Strategic Evaluation Assessment
1. Identify the problem 1. Identify key environmental impacts
2. Establish preferences 2. (Implicit in identification of key environmental impacts)
3. List all options or alternatives 3. Assess and consider alternatives andmeasures to mitigate
4. Gather all relevant information 4. Gather information
5. Make choice that maximizes or 5. Make choiceoptimizes the likelihood or efficiency of achieving preferences
6. Monitor impact of choice (repeat steps 4 and 5)
Source: Authors.
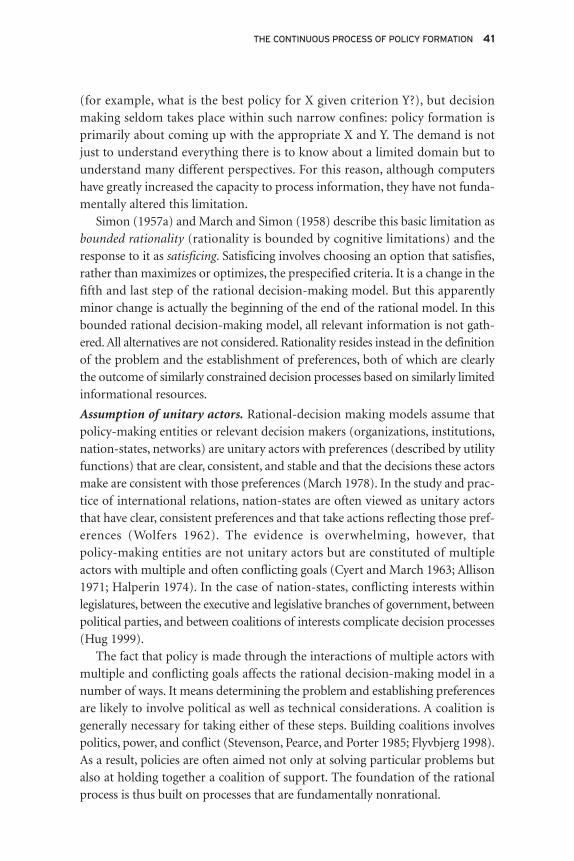
(for example, what is the best policy for X given criterion Y?), but decisionmaking seldom takes place within such narrow confines: policy formation isprimarily about coming up with the appropriate X and Y. The demand is notjust to understand everything there is to know about a limited domain but tounderstand many different perspectives. For this reason, although computershave greatly increased the capacity to process information, they have not funda-mentally altered this limitation.
Simon (1957a) and March and Simon (1958) describe this basic limitation asbounded rationality (rationality is bounded by cognitive limitations) and theresponse to it as satisficing. Satisficing involves choosing an option that satisfies,rather than maximizes or optimizes, the prespecified criteria. It is a change in thefifth and last step of the rational decision-making model. But this apparentlyminor change is actually the beginning of the end of the rational model. In thisbounded rational decision-making model, all relevant information is not gath-ered. All alternatives are not considered. Rationality resides instead in the definitionof the problem and the establishment of preferences, both of which are clearlythe outcome of similarly constrained decision processes based on similarly limitedinformational resources.
Assumption of unitary actors. Rational-decision making models assume thatpolicy-making entities or relevant decision makers (organizations, institutions,nation-states, networks) are unitary actors with preferences (described by utilityfunctions) that are clear, consistent, and stable and that the decisions these actorsmake are consistent with those preferences (March 1978). In the study and prac-tice of international relations, nation-states are often viewed as unitary actorsthat have clear, consistent preferences and that take actions reflecting those pref-erences (Wolfers 1962). The evidence is overwhelming, however, thatpolicy-making entities are not unitary actors but are constituted of multipleactors with multiple and often conflicting goals (Cyert and March 1963; Allison1971; Halperin 1974). In the case of nation-states, conflicting interests withinlegislatures, between the executive and legislative branches of government, betweenpolitical parties, and between coalitions of interests complicate decision processes(Hug 1999).
The fact that policy is made through the interactions of multiple actors withmultiple and conflicting goals affects the rational decision-making model in anumber of ways. It means determining the problem and establishing preferencesare likely to involve political as well as technical considerations. A coalition isgenerally necessary for taking either of these steps. Building coalitions involvespolitics, power, and conflict (Stevenson, Pearce, and Porter 1985; Flyvbjerg 1998).As a result, policies are often aimed not only at solving particular problems butalso at holding together a coalition of support. The foundation of the rationalprocess is thus built on processes that are fundamentally nonrational.
THE CONTINUOUS PROCESS OF POLICY FORMATION 41

While coalitions may be built around particular goals by compromising, it ispossible to proceed to action without resolving the conflicts between preferencefunctions. A different way of building coalitions—thereby dealing with multipleand conflicting goals—involves an even more serious break with the rational model.Cyert and March (1963) note that the “sequential attention to goals” is one way ofdealing with multiple goals. Logrolling is the political form of this strategy. Lindblom(1959) shows that sometimes policy makers simply ignore differences in prefer-ence functions and focus instead on policy. He illustrates this by giving examplesof policies that satisfy multiple and even opposing preference functions.
Two models of policy formation represent a response to the realization that policydecisions are not made by unitary actors: the governmental (or bureaucratic) poli-tics model and incremental decision making. In the first model, decision makersare multiple unitary actors. This type of model represents the notion that “whereyou stand depends on where you sit” (Allison 1971; Halperin 1974). People in anenvironmental agency tend to know more and care more about the effect of a policyon air or water quality, while people in agencies that deal with commerce or defensetend to know more and care more about the effect of a policy on the economy ornational security. Who takes the lead on a policy and who has to sign off on a policywill make a critical difference to what information is produced (Feldman 1989) andwhat policies are made (Seidman 1980). People with access to the process will tryto influence policy in the direction of their preferred policies. Policies are often theresult of compromise among a variety of competing preferences.
In the incremental decision-making model, the legacy of past policy decisionsconditions the present policy-making process. Unlike in the rational model, deci-sion makers in the incremental model do not reconsider policy preferences andconsider a broad array of possible alternatives to current policies. Rather, theyfocus on aspects of the policy that are considered problematic and make marginaladjustments in existing programs to resolve these problems. The difference isillustrated by efforts to engage in rational budgeting processes in which budgetsare built from the ground up rather than adjusted incrementally. Proponents ofincremental policy making argue that this process allows policy makers to makesensible adjustments to fine-tune programs and policies and that the alternativerequires more information and more agreement than is likely to be feasible at areasonable cost (Lindblom 1959; Wildavsky 1979). Opponents of the incrementalapproach claim that it institutionalizes inertia and legitimates ineffective poli-cies (see Hochschild 1984; Gersick 1991; Weick and Quinn 1999).
Assumptions about the nature of the problem. In the rational decision-makingmodel, problems are assumed to be well defined and independent. In fact, asproblems become more complex, it is often difficult or impossible to define themclearly. How should one define policy problems that cut across efforts to preservethe environment, alleviate poverty, and support sustained economic growth? There
42 STRATEGIC ENVIRONMENTAL ASSESSMENT FOR POLICIES

are difficult trade-offs between preferences and alternatives, and the relevance andvalue of information may vary across problems or parts of problems.
Ways of coping with the complexity of problems have developed at both themicro and macro levels. At the macro level, policy makers focus on process ratherthan outcomes. The organizational behavior model suggests that decisions aremade and policies formulated by assessing appropriate processes rather thanapplying conscious rationality. The way the model works has been likened to theway a thermostat works (Steinbruner 1974). An indicator triggers a response thatis often worked out in advance. Events and time are often the triggers for a response.The response is often in the form of a process or routine. The Challenger explo-sion and the Cuban missile crisis, for example, set off a number of different routinesthat constituted the response to these events (Vaughan 1997; Allison and Zelikow1999). Budget processes and program reviews are examples of organizationalprocesses that tend to be organized by time.
At the micro level, individuals use intuition or rely on extensive experience inproblem solving and lessons learned from successful and failed efforts (Isenberg1984). The intuitive decision maker relies on a deep understanding of the contextor setting of a problem to process information quickly in order to make a deci-sion. Intuition, sometimes described as a “gut feeling” (Mintzberg 1994), can beused to identify problems; define them; and identify, select, and implement a solu-tion (Isenberg 1984). Experience-based intuition, in other words, is an alternativeto the extensive analysis and consideration of alternatives that would be requiredfor rational decision making.
The Garbage Can Model of Decision Making
The garbage can model of decision making takes account of the fact that therational decision-making model does not fit the complex world of policy making(Cohen, March, and Olsen 1972; March and Olsen 1976). It is based on thefollowing assumptions:■ Preferences are problematic. For a variety of reasons, people do not always (or
even often) know what they want. Preferences may be difficult to articulate;people may recognize their preferences only when confronted with choices.Moreover, people may not know what preferences they will have for futureconditions, and different people may want different things.
■ Technologies are unclear. Even when people know what they want, they maynot know how to make it happen.
■ Participation is fluid. The people involved in decision making change over timeand in relation to different aspects of the policy.Policy formation characterized by these assumptions is fundamentally different
from rational decision making. Choice, the focal point of rational decision making,is not as central in the garbage can model. Instead, decision making is viewed as
THE CONTINUOUS PROCESS OF POLICY FORMATION 43

consisting of streams of problems, solutions, participants, and choice opportu-nities. As problems and solutions are not actually differentiated until they areconnected to one another, this picture can be simplified somewhat by saying thatthere are streams of issues. Issues are anything that can be defined as either aproblem or a solution. A dam, for instance, can be a solution to the problem ofdownstream flooding or upstream irrigation. It can be a problem for communi-ties living near the current riverbed or for endangered species.
Issues and participants flow into choice opportunities. A choice opportunityoccurs whenever people have a chance to connect different issues to one another.Meetings are examples of relatively formal choice opportunities. Such formalchoice opportunities often have labels, such as “meetings about the budget crisis.”Participants often bring issues to choice opportunities—concerns about cuttingfunding to social services, balancing the budget, maintaining the city’s bond ratingand its capacity to borrow—but other issues may be activated during the meetingwhen raised by a participant or when a connection is made through the discus-sion. Not all of the issues in the choice opportunity will be relevant to the labelor seen as relevant by all participants. In a meeting about a city budget crisis, forinstance, discussions of the school board election are essentially irrelevant, as theschool board has a separate budget. It is nevertheless possible that this and similarissues will find their way into the discussion.
Decisions may or may not be made, and decisions that are made may or maynot resolve problems. While choice opportunities provide arenas for discussingand possibly making decisions, many choice opportunities do not result in deci-sions, and many decisions are made outside of choice opportunities.
Decisions can be made in three ways: flight, oversight, and resolution. Of thethree, resolution is the only one that bears a resemblance to the rational model.Resolution occurs when an issue that is defined as a problem and an issue that isdefined as a solution are connected so that the solution resolves (or appears toresolve) the problem. Flight occurs when an issue that is making it difficult tomake a choice flies from one choice opportunity to another, making it possibleto make a choice. Oversight occurs when there are no issues that make it difficultto make a choice.
The garbage can model incorporates the previously described models of policyformation. Satisficing takes place in the process of resolution, which may be but isnot necessarily an optimizing process. Bureaucratic politics take place in the processesof jockeying for attendance in choice opportunities and in the ways issues are definedas either problems or solutions in the various discussions that take place. Incrementaldecision making occurs when the choice opportunity is defined either formally orinformally as adjustments to the status quo. Organizational processes, often in theform of organizational routines, influence when a choice opportunity arises as wellas the repertoire of responses that are offered as problems and solutions.
44 STRATEGIC ENVIRONMENTAL ASSESSMENT FOR POLICIES

The garbage can model and policy making. Kingdon (1995) builds on the garbagecan model to describe the way in which agendas are set by the federal govern-ment in the United States. According to him, the process is not linear but anorganized anarchy consisting of three process streams. In one stream problemsare recognized, defined, and redefined. Indicators or measurements, dramaticevents, and evaluations of existing programs combine with values and beliefs tobring a problem to the fore.
A second stream consists of a “policy primeval soup,” the ingredients of whichare ideas generated by multiple actors in multiple settings. Policy communitiesconsisting of academics, policy analysts, scholars at think tanks, administrators,interest groups, and congressional staff who share common interests in home-land security or transportation, for example, generate ideas that they shared atprofessional conferences, roundtables, and public hearings; in publications; andthrough lectures. The policies that bubble to the top of the soup will be viewedas feasible and in line with the values and beliefs held by policy makers.
The third stream is politics. Kingdon argues that the “national mood,” “pres-sure group campaigns,” and the turnover of legislative and administrative officesdefine the dynamics of this stream.
Just as choice opportunities provide decision-making opportunities in thegarbage can model, “windows of opportunity” provide opportunities to link thethree streams and set the agenda in Kingdon’s model. A “policy entrepreneur”plays the role of linkage by highlighting a problem from the problem stream,connecting it to a policy, and building on the national mood, an election, or thestrength of an interest group campaign to bring the issue to the federal agenda.An advocate for election reform, for example, could view a controversial presi-dential election as a window of opportunity, linking the problem of ensuring fairelections with possible solutions (such as touch-screen voting machines or earlyvoting) and building on the national mood and the interests of elected officialsin winning reelection to set the agenda.
This model draws attention to the use of information as symbol, signal, andrepertoire (Feldman and March 1981; Feldman 1989). Gathering and displayinginformation may have as much to do with the process of legitimizing the roleof particular players in a policy-making process as it does with answering policyquestions. Scholars have noted that the expectation that policy informationwill be used to solve current policy problems is unrealistic and seldom met(Weiss 1977, 1978, 1980; Lynn 1978; Lindblom and Cohen 1979; Bozeman1986; Feldman 1989).
The continued production of information can be explained in several ways.First, attention to processing information symbolizes participants’ adherence to aset of values consistent with the rational model. This adherence can legitimize therole of the participant as an appropriate decision maker (Feldman and March 1981).
THE CONTINUOUS PROCESS OF POLICY FORMATION 45

Second, attention to processing information can be a signal that the participantknows how to use information in ways that will help make rational decisions. Thecost of signaling decreases as the skill of the participant with information increases(Feldman and March 1981). Third, the information may form a repertoire, muchlike a library, that can be drawn on when needed, which is not necessarily the timeframe in which it was produced (Feldman 1989). In all of these senses, informa-tion becomes another stream that flows in and out of the garbage can model. Itis important to the overall outcome, but it does not have a linear relation toproblem solving or policy formation.
Policy formation and path dependency. The garbage can model sheds light on therelation between policy formation and path dependence. Path dependency is a wayto explain the longevity or ingrained nature of a policy. Once a policy is initiated,structures, processes, and understandings of the policy and the problems the policyaddresses can take hold that define a gradually well-worn path (Wilsford 1994).
Two factors will influence whether historical legacy or novelty are prominentin policy formation at any point in time. One is attention, or the presence of anissue in a choice opportunity. As both the originators of the garbage can modeland those who have used it, such as Kingdon, note, attention is critical to theprocess of choice. If the participants in a choice opportunity do not attend to anissue, it cannot be framed as either a solution or a problem, and it cannot bematched with a complementary part. Both history and novelty play roles in theprocess of attention. Some issues are attended to because they have always beenassociated with the choice opportunity. The state of the economy, for example, isalways an issue in a national budget process, just as campaign finance has becomea regular issue in a national election. Other issues gain attention in more dramaticways. Massive flooding focuses attention on the issue of flood plain insurance.The events of September 11 focused attention on terrorism.
Events alone, however, do not determine how attention will be focused or whatthe outcome of such focus will be. How events are interpreted and used dependson the availability of ideas about how to move forward (repertoires, in Feldman’sterms) as well as people in positions of power who want to move in that direc-tion (policy entrepreneurs, in Kingdon’s terms). One could argue that the differencebetween the reaction to the bombing of the Murrah Federal Building in OklahomaCity and the bombing of the World Trade Center in New York was the existenceof policy entrepreneurs with plans that could be connected to the issue of terrorismfrom outside the United States in the case of the 9/11 attacks and the absence ofboth following the bombing in Oklahoma City. The political skill of policy entre-preneurs as well as serendipity—being in the right place at the right time—willinfluence their ability to draw attention to issues. Developing repertoires of action-able ideas requires considerable time and effort by government agencies, thinktanks, and universities.
46 STRATEGIC ENVIRONMENTAL ASSESSMENT FOR POLICIES
“Competency traps” are another aspect of path dependency. The developmentof skills, technology, and organizational routines around particular policy choicescan make it difficult to move to other choices and encourage responses to novelsituations that are drawn predominantly from what decision makers already knowhow to do. The Norwegian response to the need to regulate oil rigs in the NorthSea after the discovery of oil there, for example, was to consider an oil rig “a some-what peculiar ship” (March and Olsen 1989: 36).
Limitations of and lessons from the garbage can model. The garbage can modelhas been used effectively to describe the decision-making and policy-formationprocesses. Having a clearer picture of the complexity is of enormous benefit topeople involved in the policy process. Nonetheless, the model can be faulted fora decidedly structural rather than agent-oriented approach to these processes anda resulting sense that these structural components will play out and that partici-pants can do little except be ready and try to be in the right place at the right time.This way of describing decision making is particularly limiting to unorganizedinterests (Weiner 1976), such as members of the public whose jobs are not relatedto their ongoing participation in the policy process and who may find it difficultto remain involved once visible choice points have passed (Sabatier 1975). It does,however provide insights—into the nonlinear and continuous nature of policyformation; the potential for entrepreneurs (including public managers, electedofficials, and technical experts) to make connections between streams; the impor-tance of creating and recognizing choice opportunities; and the ambiguous natureof information and the need to generate opportunities for interpretation of policyproblems and potential policy solutions.
Policy Formation as a Continuous Process
Given the complexities of making decisions, illustrated by the garbage can model,what are the options for policy makers looking for ways to address these difficultcircumstances and for managers trying to move forward? How can decision makersaddress multiple issues, such as environmental protection, economic develop-ment, and poverty alleviation, in ways that enable people to take actions that makea difference?
The emphasis needs to move away from decision making toward action as partof a continuous policy process. The decision-making frame focuses attention onthe pronouncement of a policy; at best it produces an understanding of policyformation as a staged process in which decisions are revisited and adjusted. Theconcern with policy formation, however, cannot stop with the pronouncementof a policy. It must also be possible to implement the policy (Brunsson 1985;Moore 1995; Feldman and Khademian 2007). Extending the understanding ofpolicy formation in this critical direction requires thinking about how the
THE CONTINUOUS PROCESS OF POLICY FORMATION 47
policy-formation process influences implementation and, indeed, viewing policyformation and implementation as continuous rather than separate stages.
This section presents two models that have emerged as ways of incorporatingconcerns with implementation into the policy-formation process in the complexcontext in which policy is inevitably formed. One, “adaptive management,” isoriented to enabling action in the face of uncertainty; the other,“inclusive manage-ment,” is oriented to enabling action in the face of ambiguity. Both uncertaintyand ambiguity are almost always present in decision and policy-formation processes(Moe 1990). These concepts have been discussed in terms of beliefs about causeand effect relations and preferences about possible outcomes (Thompson andTuden 1959; Thompson 1967). The models are combined here in order to proposea way of promoting policy that facilitates dealing with both dimensions.
Uncertainty often relates to the dimension of beliefs about cause and effect(there may also be uncertainty about other aspects of policies and decisions).Uncertainty occurs whenever the information that would be required to resolvea question can be specified (Feldman 1989). There is often uncertainty aboutfuture effects. One cannot know what impact a new dam will have on an endan-gered species, but one can know what information needs to be gathered to assessthis impact. Being able to specify the information needed to resolve uncertaintydoes not imply that the cost of obtaining the information is reasonable or eventhat the information is obtainable; often estimates or predictions are used.
Ambiguity—that is, situations that have many meanings (Feldman 1989)—is often related to the dimension of preferences. The multiplicity of meanings isimportant, because resolving multiple meanings is a fundamentally differentprocess from resolving a lack of information. Thus, how critical it is to preservea particular species of fish that may be endangered by a new dam and to whatdegree the fish should be protected are issues of ambiguity. They are matters ofinterpretation; the answers to these questions will vary based on one’s perspec-tive. Specific pieces of information will not resolve ambiguity. Indeed, thoughgathering information is often necessary in the face of ambiguity, more infor-mation often increases rather than decreases ambiguity. Processes of interpretation,which are fundamentally social processes, are necessary for resolving ambiguity(Feldman 1989). Taking action in the context of ambiguity often requires socialprocesses that produce some consensus on a way of understanding.
Both uncertainty and ambiguity are obstacles to taking action. Under uncer-tainty decision makers may know what they want to accomplish, but they maynot know what effects their actions will have. Under ambiguity, they may notknow what effects they want their actions to have or even what effects it wouldbe appropriate for them to have.
Both uncertainty and ambiguity are ubiquitous. If some uncertainty isresolved, other uncertainties emerge. As new uncertainties emerge, they createnew ambiguities.
48 STRATEGIC ENVIRONMENTAL ASSESSMENT FOR POLICIES

Uncertainty and ambiguity are also intertwined. Ambiguities are often revealedby efforts to resolve uncertainty, and how decision makers resolve uncertaintiesoften influences how they address ambiguities. Reconceptualizing policy forma-tion as a continuous process is necessary for understanding how policies emergein these very real contexts.
These concepts can be illustrated with research on water sector reform in Cearà,Northeast Brazil (Ballestero 2004, 2006). In the mid-1980s, the State of Cearà,began to change the way water was managed in one of the most populated semi-arid regions of the world. The new, centrally defined water policies and changesin regulatory design and jurisdiction were premised on participation, decentral-ization, and integration of diverse user needs at the local level, where decisionsabout the volume of water to be discharged from any given reservoir would bemade and permits would be issued for human consumption, industrial use, andfarming use of the water. The policy also introduced economic valuation of wateras a principle shaping everyday decisions about appropriate water use; participa-tion of water users; and incentives for some productive activities and not others.
The case illustrates the continuous nature of policy formation and the fluidnature of participation. While the formal changes by the state clearly provided acatalyst for the changes that eventually took place in the practice of regulatingwater use in Ceará, ongoing, localized actions were critical in determining theactual adaptations in water use and the potential use of these opportunities topromote more-inclusive practices.
Managing Uncertainty
Adaptive management is a model that is oriented primarily to enabling action inthe face of uncertainty. Participants may have a clear sense of what they wouldlike to accomplish, but the impact of actions taken to accomplish the goal are notclear. Adaptive management has been used in a variety of fields; it is most commonin the field of environmental policy (Holling 1978). This model of policy forma-tion promotes the use of quasi-experiments that take place as an ongoing part ofthe policy process (Jacobs and Wescoat 2002). It involves taking action while thereis still considerable uncertainty about the consequences, but designing actions sothat they can be monitored and adjusted as their effects become more clearlyunderstood. As Lee (1999) notes,“Management policies are designed to be flexibleand are subject to adjustment in a social learning process” (cited in NationalResearch Council 2004: 20).
While there is no formula for adaptive management, elements generally includethe following (National Research Council 2004):■ Management objectives that are regularly revisited and accordingly revised■ A model (or models) of the system being managed■ A range of management choices■ The monitoring and evaluation of outcomes
THE CONTINUOUS PROCESS OF POLICY FORMATION 49
■ A mechanism for incorporating learning into future decisions ■ A collaborative structure for stakeholder participation and learning.
The basic idea of this model is that an action is tried and its outcome evalu-ated in order to determine what to try next. Policy is formed through a processof experimentation, the adoption of successful experiments, and continued exper-imentation. An assumption of this model is that the desirability of an outcomewill be relatively clear once the outcome occurs. Whether one likes what hasoccurred is an issue of ambiguity; for this one needs a model that speaks to thebringing together of multiple perspectives—that is, a collaborative structure forstakeholder participation and learning. The inclusive model, developed next,addresses this issue more directly by characterizing specific projects as opportu-nities for the ongoing creation of communities of participation.
Managing Ambiguity
The inclusive model recognizes that managing ambiguity is fundamentally a socialprocess. It is based on understanding the intrinsic ambiguity revealed by many policy-making efforts and the importance of combining multiple perspectives in problem-solving efforts in a community of participation (the people and organizations involvedin a process of policy making and implementation and the way they interact) inorder to deal constructively with that ambiguity. In each policy-making or imple-mentation process, a community of participation is created. The creation of thiscommunity may be purposeful or simply consequential. A mandate, such as thecentrally defined water policies in Ceará, can specify a breadth of participation in apolicy process; managers and other participants may take actions to broaden thebase of participation to include differing perspectives and experiences or to narrowthe range of participation and exclude varied perspectives and experiences. Butcommunities of participation are created and recreated even without the intentionalefforts of legislators, managers, or other participants; people and organizations flowin and out of policy processes as choice opportunities arise. Communities of partic-ipation become increasingly inclusive as the categories of participants who view oneanother as having a legitimate role to play in a joint problem solving process increase.
The creation of an inclusive community of participation (in which a widerange of perspectives involved in a process of policy making and implementationis viewed as having a legitimate role to play) is an essential outcome of inclusivemanagement. It is achieved through the engagement of participants in specificprojects (Feldman and Khademian 2000, 2007; Khademian 2002). Where tradi-tional management models may see building community capacity as a by-productof solving policy problems, this model places capacity building in the foreground.Building capacity becomes the primary goal and projects a way of pursuing thatgoal. Capacity building is not something that is done instead of projects, it issomething that is done through projects.
50 STRATEGIC ENVIRONMENTAL ASSESSMENT FOR POLICIES
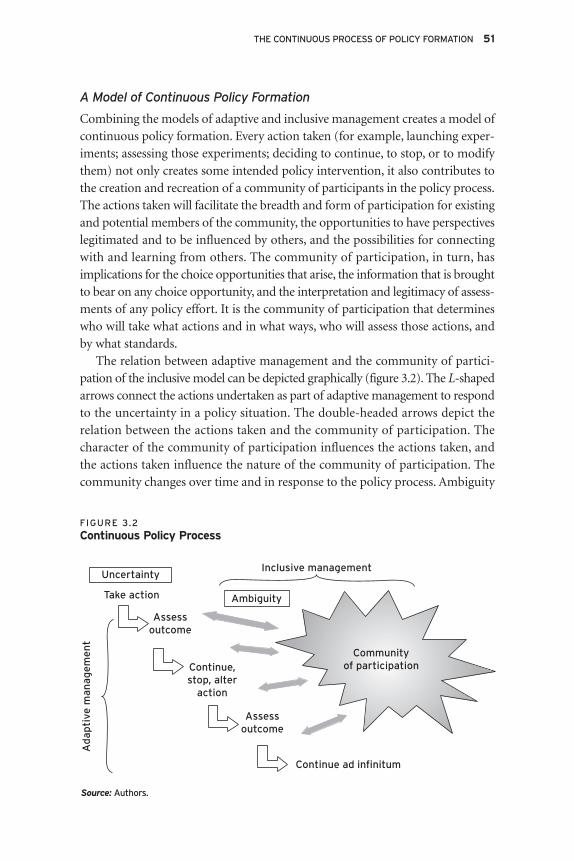
A Model of Continuous Policy Formation
Combining the models of adaptive and inclusive management creates a model ofcontinuous policy formation. Every action taken (for example, launching exper-iments; assessing those experiments; deciding to continue, to stop, or to modifythem) not only creates some intended policy intervention, it also contributes tothe creation and recreation of a community of participants in the policy process.The actions taken will facilitate the breadth and form of participation for existingand potential members of the community, the opportunities to have perspectiveslegitimated and to be influenced by others, and the possibilities for connectingwith and learning from others. The community of participation, in turn, hasimplications for the choice opportunities that arise, the information that is broughtto bear on any choice opportunity, and the interpretation and legitimacy of assess-ments of any policy effort. It is the community of participation that determineswho will take what actions and in what ways, who will assess those actions, andby what standards.
The relation between adaptive management and the community of partici-pation of the inclusive model can be depicted graphically (figure 3.2). The L-shapedarrows connect the actions undertaken as part of adaptive management to respondto the uncertainty in a policy situation. The double-headed arrows depict therelation between the actions taken and the community of participation. Thecharacter of the community of participation influences the actions taken, andthe actions taken influence the nature of the community of participation. Thecommunity changes over time and in response to the policy process. Ambiguity
THE CONTINUOUS PROCESS OF POLICY FORMATION 51
FIGURE 3.2
Continuous Policy Process
Uncertainty Inclusive management
Ambiguity Take action
Assess outcome
Assess outcome
Continue ad infinitum
Community of participation
Ad
apti
ve m
anag
em
en
t
Continue,stop, alter
action
Source: Authors.
is exposed in the efforts to find actions that the community can support andengage in.
Policy formation surrounding the allocation of water from a reservoir in thesmall community of “Green Forest” in Ceará, Northeastern Brazil, illustrates theinterplay between uncertainty and ambiguity (Ballestero 2006). The processinvolves uncertainty, in that the right amount of water to be discharged from areservoir in any given year and the effects of the discharge are not known. Thisuncertainty can be resolved by a number of means, including technical modelingof varied amounts of water discharge. Regardless of how the uncertainty is dealtwith, the process also involves ambiguity, because there are different ways of valuingthe water and assessing the outcomes of actions. What uses of water are mostimportant? Are technical or experiential means of assessing potential actions moreappropriate? How much risk is bearable? Such questions will be answered differ-ently by people with different perspectives.
Passage of water reform legislation in Ceará in 1994 gave water users increaseddecision-making authority in managing reservoirs. In Green Forest users of thereservoir include residents, whose concerns for water allocation focus on protectingthe purity and quantity of their water. They also include small to medium-sizefarmers who depend on irrigation, whose primary concern is ensuring an appro-priate level of discharge for their farms. (As farmers are also residents, there issubstantial overlap between the concerns of these two groups.) By mandate thecommunity of participation surrounding the Green Forest reservoir also includesstaff from the water agency, who provide technical estimates on the amount ofwater in the reservoir. By custom, the staff of the water agency determine howmuch water is released. The individuals who represent residents, farmers, and staffchange over time.
The following vignette—a small part of this complex case—illustrates how effortsto resolve uncertainty about the amount of water to be released and the means ofmeasuring that water expose ambiguities related to different ways of valuing waterand different understandings about how much risk to bear in the use of water froma local reservoir. It shows how efforts to respond to uncertainty influence the creationof a community of participation and the ability of that community to work outthese ambiguities. It also shows how the working out of these ambiguities influ-ences the composition and nature of the community of participation.
In 2001, the water agency staff conducted a study to assess the amount of waterin the aging reservoir. Because of the large quantity of eroded soil, it was difficultto determine how much water was available for use. Efforts to resolve this uncer-tainty revealed differences in interpretation. Technical difficulties with the measuringequipment produced estimates that the community received with great skepti-cism but that the water agency was willing to use as a basis for releasing water.The agency used this information to calculate an estimate for water release and
52 STRATEGIC ENVIRONMENTAL ASSESSMENT FOR POLICIES
decided to discharge water accordingly. Aware of residents’ opposition to releasingwater, the local reservoir manager asked for police backup when he started thedischarge. Residents assembled to prevent the release; after the police left, theybroke the valve to ensure that the water would not be released. These actionsexposed ambiguity, in the form of substantial differences in the ways that wateragency staff and residents valued water and what standards and actions theythought appropriate.
The community of participation at this point consisted of water agency staffand residents. The nature of this community was divisive. Water agency staff andresidents were not working together to resolve their differences. Possibilities forinteraction between residents and the water agency were limited by the residentperceptions of illegitimacy associated with the technical, estimated information,and by the water agency members’ determination that there was enough waterto release in contrast to the residents’ skepticism about the quality of the infor-mation and their reluctance to bear the risk of having insufficient water forresidential uses.
Over the next two years, tension between these groups persisted. A meetingwas held every year in which the water agency proposed releasing water. Residentschallenged the proposals, at meetings that were characterized by overt conflict.Though agreement was eventually achieved, the community of participationremained essentially divided.
The 2001 study, the attempted release of water, the reaction of residents, and theresidue of accumulated tension from the 2003 and 2004 meetings formed an impor-tant backdrop to the 2005 meeting. There were also new participants, from boththe community and the water agency, including the person from the water agencyin charge of mobilizing residents. Residents also had a new representative, in theform of the new school principal. Both these people had the ability to alter socialinteractions by facilitating communication between residents and water agency staff.
The discussion began with a presentation of technical data by a manager fromthe water agency. At the conclusion of his presentation, he asked for questionsand suggested that residents make a decision on the options he had presented.His request was met with silence. After several moments of silence, the schoolprincipal spoke up and said that he thought the community members did notwant to talk about the options. His comment released a flood of pent-up complaintsby community members. The water agency staff listened. When things calmeddown, they described the problem from their perspective. They explained thetechnical problems with the study and noted that the study had been conductedby people outside the agency before the agency had been given responsibility forthe reservoir.
By the end of the meeting two changes had taken place. First, residents andwater agency staff agreed not to release water from the reservoir for the coming
THE CONTINUOUS PROCESS OF POLICY FORMATION 53

year. Second, the community of participation had changed. The complaining,listening, and explaining produced a change in the way people treated oneanother. Water agency staff had a better understanding of community members’standpoint, and community members had a better understanding of the posi-tion water agency staff were in. Before everyone left the room, a teacher thankedthe managers for coming to their community and stressed that the communityknew that the managers were not to blame for the organization’s actions andthat residents liked them as individuals but could not accept any chance of losingtheir water (Ballestero 2006).
The new community of participation involved recognizing the constraints andconcerns of both technical staff and residents. This recognition resulted in a more-amicable set of relations, which formed the basis of the 2005 agreement surroundingwater discharge from the reservoir. In the new community of participation, tech-nical knowledge did not dominate political and social concerns held by localresidents. As a result, both water agency staff and residents became participantsin a different kind of community of participation, in which the process of resolvinguncertainty about how much water to release was understood to have implica-tions for the nature of the community.
This example illustrates the continuous processes that influence the commu-nity of participation and the actions that are taken. Actions taken exposeambiguities that require the community of participation to address them (figure 3.3). The process of addressing ambiguities creates and recreates thecommunity of participation.
54 STRATEGIC ENVIRONMENTAL ASSESSMENT FOR POLICIES
FIGURE 3.3
Continuous Policy Process: Green Forest
Uncertainty
Technical study
Ambiguity
exposed
Releasewater?
Allocatewater
Meeting in
school
Break valve
Inclusive management
Need for greaterinclusion recognized
Mutual legitimacyestablished
Ad
apti
ve m
anag
em
en
t
Source: Authors.

The process is a continuous one. New ambiguities emerge as marginal partic-ipants become more central and people who have not participated becomeparticipants. The way these ambiguities are dealt with will have implications forthe ongoing creation of the community of practice. In Green Forest farmers,whose interest overlap to some extent but not entirely with (nonfarmer) residents,still feel that their perspective is not included and their role in the communityof participation is not as relevant as those of either residents or water agencystaff members. As farmers are included, more ambiguities will almost certainlyemerge. Moreover, as the community of participation develops ways of resolvinguncertainties about how to measure available water and how much water torelease, other uncertainties will emerge. If water is released in the future, forinstance, there will be questions about what this water can be used for (Ballestero2006). These new uncertainties will reveal new ambiguities and new potentialparticipants in the community of participation.
Conclusion
This chapter examines two ways of conceptualizing the policy-making process.The first is as a decision-making process. The models examined can be arrangedon a continuum of increasing uncertainty and ambiguity. Linear models of policyformation, such as SEA, are adapted from decision-making models. They accom-modate less uncertainty and ambiguity than nonlinear models.
Nonlinear models of decision making, such as the garbage can model, revealthe importance of ambiguity and the need to generate opportunities for inter-pretation in the policy-formation process. These revelations suggest that in orderto understand how policy making works in practice, one needs to conceptualizepolicy making as a continuous process. Combining adaptive management withthe creation of an inclusive community of participation and the consequentacknowledgment and exposure of ambiguity creates a model of policy formationas a continuous process. In this model the character of the community of partic-ipation influences the actions taken by participants; those actions in turn influencethe nature of the community of participation. Efforts to resolve uncertainties andtake action can reveal ambiguities; the ability to resolve ambiguities is influencedby the constitution and the nature of the community of participation that isformed in part through efforts to resolve uncertainties.
The case study illustrates the important role that managers of governmentagencies can play in shaping the community of participation. A rich literature onparticipation and community empowerment documents efforts to solve prob-lems without input from government agencies (Rosenau and others 1992; Petersand Pierre 1998; Fung 2003; Boyte 2005). Although this type of action is oftennecessary, it is important to address ways in which government agencies can help.Public managers often have responsibility for projects that can be used to promote
THE CONTINUOUS PROCESS OF POLICY FORMATION 55
an inclusive community of participation. These projects can be opportunities toset up and facilitate processes that promote information exchange and the abilityto understand the perspectives of other participants. They can also be opportu-nities to create relationships that enable people to work together to address problems(Feldman and Khademian 2002). Efforts to accomplish governance without govern-ment fail to take advantage of these opportunities.
As development organizations continue to find ways to bring environmentalconsiderations to the formation of policies, it is useful to view tools such as SEA aspart of a continuous process rather than as a means to intervene “upstream” in alinear process. The actions associated with SEA can reveal ambiguity within acommunity of participation. They can focus attention on the social processes involvedin addressing ambiguity and the importance of building communities of partici-pation that can constructively address ambiguity in the pursuit of effective action.
Note
1 The term policy formation is used rather than policy formulation. An understanding ofpolicy making as stages in a linear process evokes the concept of formulation, or a formulafor making policy. In contrast, the term formation does not imply a particular structure orsteps toward policy but instead allows for the complexity, simultaneity, and often spon-taneity of choice opportunities and implementation efforts.
References
Allison, Graham. 1971. The Essence of Decision: Explaining the Cuban Missile Crisis. Boston:Little, Brown.
Allison, Graham, and Philip Zelikow. 1999. Essence of Decision, 2nd ed. New York: Longman.
Ballestero, Andrea. 2004. “Institutional Adaptation and Water Reform in Ceará: RevisitingStructures for Social Participation at the Local Level.” Master’s thesis, University ofMichigan, Ann Arbor.
———. 2006. “Water Policies, Resistance and the Making of Social Change: Scenes fromNortheast Brazil.” Paper presented at the 26th International Congress of the Latin AmericanStudies Association, San Juan, Puerto Rico.
Boyte, Harry. 2005. “Reframing Democracy: Governance, Civic Agency, and Politics.” PublicAdministration Review 65 (5): 536–46.
Bozeman, Barry. 1986. “The Credibility of Policy Analysis: Between Method and Use.” PolicyStudies Journal 14 (4): 519–39.
Brunsson, Nils. 1985. The Irrational Organization: Irrationality as a Basis for OrganizationalAction and Change. New York: John Wiley and Sons.
Cohen, M. D., J. G. March, and J. P. Olsen. 1972. “A Garbage Can Model of OrganizationalChoice.” Administrative Science Quarterly 17 (1): 1–25.
Cyert, R. M., and J. G. March. 1963. A Behavioral Theory of the Firm. Englewood Cliffs, NJ:Prentice-Hall.
Dalal-Clayton, Barry, and Barry Sadler. 2005. Strategic Environmental Assessment: A Sourcebookand Reference Guide to International Experience. London: International Institute forEnvironment and Development.
56 STRATEGIC ENVIRONMENTAL ASSESSMENT FOR POLICIES

Feldman, Martha. S. 1989. Order without Design. Stanford, CA: Stanford University Press.
Feldman, Martha S., and Anne M. Khademian. 2000. “Management for Inclusion: BalancingControl with Participation.” International Public Management Journal 3 (2): 149–68.
———. 2002. “To Manage Is to Govern.” Public Administration Review 62 (5): 541–54.
———. 2007. “The Role of the Public Manager in Inclusion: Creating Communities ofParticipation.” Governance 20 (2): 305–24.
Feldman, Martha S., and James G. March. 1981. “Information as Signal and Symbol inOrganizations.” Administrative Science Quarterly 26 (2): 171–86.
Flyvbjerg, Bent. 1998. Rationality and Power. Chicago: The University of Chicago Press.
Fung, Archon. 2003. “Associations and Democracy: Between Theories, Hopes and Realities.”Annual Review of Sociology 29: 515–39.
Gersick, C. J. 1991. “Revolutionary Change Theories: A Multilevel Exploration of PunctuatedChange Paradigm” Academy of Management Review 16 (1): 10–36.
Halperin, Morton H. 1974. Bureaucratic Politics and Foreign Policy. Washington, DC: BrookingsInstitution.
Hochschild, Jennifer L. 1984. The New American Dilemma: Liberal Democracy and SchoolDesegregation. New Haven, CT: Yale University Press.
Holling, C. S., ed.1978. Adaptive Environmental Assessment and Management. New York: JohnWiley and Sons.
Hug, Simon. 1999. “Nonunitary Actors in Spatial Models: How Far Is Far in Foreign Policy?”Journal of Conflict Resolution 43 (4): 479–500.
Isenberg, Daniel. 1984. “How Senior Managers Think.” Harvard Business Review,November/December: 92–98
Jacobs, Jeffrey W., and James L. Wescoat, Jr. 2002. “Managing River Resources: Lessons fromGlen Canyon Dam.” Environment 44 (2): 8–19.
Khademian, Anne M. 2002. Working with Culture: How the Job Gets Done in Public Programs.Washington, DC: CQ Press.
Kingdon, John. 1995. Agendas: Alternatives and Public Policies, 2nd ed. New York: Harper Collins.
Lee, K. N. 1999. “Appraising Adaptive Management.” Conservation Ecology 3 (2): 3.
Lindblom, Charles. E. 1959. “The Science of Muddling Through.” Public Administration Review19: 79–98
Lindblom, Charles E., and David Cohen. 1979. Usable Knowledge. New Haven, CT: YaleUniversity Press.
Lynn, Lawrence E., Jr. 1978. “The Question of Relevance.” In Knowledge and Policy: TheUncertain Connection, ed. L. E. Lynn, 12–22. Washington, DC: National Academy ofSciences Press.
March, James G. 1978. “Bounded Rationality, Ambiguity and the Engineering of Choice. BellJournal of Economics 9 (2): 587–608.
———. 1991. “Exploration and Exploitation in Organizational Learning.” Organization Science2 (1): 71–87.
March, James G., and Johan P. Olsen. 1976. Ambiguity and Choice in Organizations, BergenNorway: Universitetsforlaget.
———. 1989. Rediscovering Institutions: The Organizational Basis of Politics. New York: Free Press.
March, J. G., and H. A. Simon. 1958. Organizations. New York: Wiley.
THE CONTINUOUS PROCESS OF POLICY FORMATION 57

Mintzberg, Henry. 1994. “The Fall and Rise of Strategic Planning.” Harvard Business Review(January–February): 107–14.
Moe, Terry. 1990. “The Politics of Structural Choice: Toward a Theory of Public Bureaucracy.”In Organizational Theory from Chester Barnard to Present and Beyond, ed. Oliver E.Williamson. New York: Oxford University Press
Moore, Mark. 1995. Creating Public Value: Strategic Management in Government. Cambridge,MA: Harvard University Press.
National Research Council. 2004. Adaptive Management for Water Resources: Project Planning.Washington, DC: National Academies Press.
Peters, Guy P., and John Pierre. 1998. “Governance without Government? Rethinking PublicAdministration.” Journal of Public Administration Research and Theory 8 (2): 223–43.
Rosenau, James N., Ernst-Otto Czempiel, Steve Smith, Thomas Biersteker, Chris Brown,Phil Cerny, Joseph Grieco, A. J. R. Groom, Richard Higgott, G. John Ikenberry, CarolineKennedy-Pipe, and Steve Lamy, eds. 1992. Governance without Government. Cambridge:Cambridge University Press.
Sabatier, Paul. 1975.“Social Movements and Regulatory Agencies: Toward a More Adequate andLess Pessimistic Theory of Clientele Capture.” Policy Sciences 6 (3): 301–42.
Seidman, Harold. 1980. Politics, Position, and Power. New York: Oxford University Press.
Simon, Herbert. 1957a. Administrative Behavior: A Study of Decision Making Processes inAdministrative Organization, 2nd. ed. New York: Macmillan.
———. 1957b. Models of Man, Social and Rational. New York: John Wiley and Sons.
Steinbruner, John. 1974. The Cybernetic Theory of Decision. Princeton, NJ: Princeton UniversityPress.
Stevenson, William, Jone Pearce, and Lyman Porter. 1985. “The Concept of ‘Coalition’ inOrganization Theory and Research.” Academy of Management Review 10 (2): 256–68.
Stockholm Environment Institute. 2003. “Research and Advice on Strategic EnvironmentalAssessment.” November. http://www.sei.se/policy/SEA.pdf.
Thompson, James D. 1967. Organizations in Action. New York: McGraw-Hill.
Thompson, James D., and Arthur Tuden. 1959. “Strategies, Structures and Processes ofOrganization Decision.” In Comparative Studies in Administration, eds. James D. Thompson,Peter B. Hammond, Robert W. Hawkes, Buford H. Junker, and Arthur Tuden. Pittsburgh,PA: University of Pittsburgh Press.
Vaughan, Diane. 1997. The Challenger Launch Decision. Chicago: University of Chicago Press.
Walters, Carl, and C. S. Holling. 1990. “Large-Scale Management Experiments and Learningby Doing.” Ecology 71 (6): 2060–68.
Weick, K. E., and R. E. Quinn. 1999.“Organizational Development and Change.” Annual Reviewof Psychology 50: 361–86.
Weiner, Stephen S. 1976. Ambiguity and Choice in Organizations, eds. James G. March andJohan P. Olsen. Bergen, Norway: Universitetsforlaget.
Weiss, Carol H. 1977.“Research for Policy’s Sake: The Enlightenment Function of Social ScienceResearch.” Policy Analysis 3 (4): 531–45.
———. 1978.“Improving the Linkage between Social Research and Public Policy.” In Knowledgeand Policy: The Uncertain Connection, ed. L. E. Lynn. Washington, DC: National Academyof Sciences Press.
58 STRATEGIC ENVIRONMENTAL ASSESSMENT FOR POLICIES
———. 1980. “Knowledge Creep and Decision Accretion.” Knowledge: Creation, Diffusion,Utilization 1 (3): 381–404.
Wildavsky, Aaron. 1979. The New Politics of the Budgetary Process, 3rd ed. Boston: Little, Brown.
Wilensky, Harold L. 1967. Organizational Intelligence: Knowledge and Policy in Government andIndustry. New York: Basic Books.
Wilsford, David. 1994.“Path Dependency, or Why History Makes It Difficult, But Not Impossibleto Reform Health Care Services in a Big Way.” Journal of Public Policy 14 (3): 251–83.
Wolfers, Arnold. 1962. Discord and Collaboration: Essays on International Politics. Baltimore,MD: Johns Hopkins University Press.
World Bank. 2002.“Strategic Environmental Assessment (SEA): A Structured Learning Programat the World Bank.” SEA SLP Progress Note, June 27, Washington, DC.
THE CONTINUOUS PROCESS OF POLICY FORMATION 59

THE INTEGRATION OF ENVIRONMENTAL ISSUES into the mainstreampolicy arena involves issues of sustainability, government decentralization, effi-ciency, effectiveness, and transparency. The push for sustainability reflects a concernthat environmental considerations should be a part of all government policies, notjust those formally designated “environmental”; gone are the days when a singleminister or cabinet official at the national level was responsible for all environ-mental programs. Mitigating widespread environmental problems requires a broadarray of actions, touching on many sectors of the economy. The daunting andpolitically difficult task of setting priorities across this array of actions is the firstelement in devising cost-effective strategies for addressing environmental problems.
Because of the difficulty of the task, a formal government process in whichpriorities are made explicit is not common. In practice, environmental prioritiescan be influenced by public clamor; cultural, historical, institutional, and polit-ical factors; development agency priorities; international agreements; judicialdecisions; and the results of technical studies.
This chapter examines alternative approaches to environmental priority settingthat emphasize formal analytical/quantitative techniques. The focus is on the tech-niques used to evaluate risks and economic damage.1
C H A P T E R 4
Toward Environmental PrioritySetting in Development
Richard D. Morgenstern
61
Richard D. Morgenstern is a senior fellow at Resources for the Future, in Washington, DC.

The chapter is organized as follows. The next section presents backgroundinformation on the use of these techniques, along with selected critiques of boththe risk and economic approaches. The second section reviews the analytical frame-work and on-the-ground experiences with comparative risk assessment (CRA) inboth the developed and developing worlds. The third section focuses on the methodsused to conduct economic damage assessments and reviews the recent experienceswith this approach in 10 developing countries.2 The last section examines the simi-larities and differences between the two methodologies and draws conclusions thatcan help refine future efforts to mainstream environmental issues.
Background
Environmental protection policies enjoy strong and growing support worldwide.Public opinion surveys; efforts by legislators and government officials to enactand implement environmental laws; and the array of programs and financialsupport from development agencies all demonstrate the strong internationalcommitment to reducing risks to human health and the environment. Increasingly,environmental objectives are being integrated into other policy areas such asenergy, agriculture, and tourism. Over the past decade, the World Bank and otherinstitutions have put considerable effort into integrating both the risk and economicapproaches into their country and strategic environmental assessments in devel-oping countries. Increasingly, economic damage assessments are addressing arange of “green” issues, and attention is turning to nonurban and nonindustrialsectors as areas of interest.
Concurrent with the growing demand for greater environmental protection,serious concerns have arisen in many countries about whether the public agenciesin charge of environmental management are directing scarce resources toward themost serious problems. The notion that resources devoted to environmental protec-tion should be allocated to the most serious problems has broad appeal. Whenaugmented with information on mitigation costs, the findings on risk and economicdamage can be used to make sound environmental management decisions.
The methods used to prioritize environmental problems are sometimes contro-versial. Environmental advocates, for example, often see the use of such techniquesas a distraction; they prefer to focus on increasing the size of the pie rather thanfighting over the slices. Some government officials see risk- and economic-basedcriteria as undermining the normal workings of the political process or as incon-sistent with legislative intentions. They see a “tyranny of experts,”whose controversialscientific and pseudoscientific methods are used to create a false sense of objec-tivity and to shift emphasis away from traditional practices and beliefs, oftenignoring difficult ethical and social choices. Other observers see the use of thesetechniques as overemphasizing the easily measured indicators of human health or
62 STRATEGIC ENVIRONMENTAL ASSESSMENT FOR POLICIES

environmental quality at the expense of forests, coastal management, and otherhard-to-measure “green” issues.
Even in the more data-rich area of health analysis, many challenges remain.How does one compare the risk of a small drop in intelligence for children exposedto lead versus the risk of heart attacks among the elderly induced by elevated levelsof fine particulates in the ambient air? Which is worse, one person dying or 10,000people being slightly impaired? Does it matter if the person dying is a child or asmoker? How should ecological risks be compared with risks to human health?Critics contend that scientists are expert only at determining probabilities, thatthe public or its representatives should be asked to contribute their expertise tothe process of valuation.
Notwithstanding some resistance to risk- and economic-based techniques,traditional approaches are sometimes challenged by the discovery of new infor-mation. Such information often comes from a distant country or region with newscientific evidence on illness or death associated with particular types of pollution.Sometimes the information arises out of local experiences; occasionally it comesfrom tragedies, such as the disasters in Seveso, Italy, or Bhopal, India, in the 1980s.Whatever its source, new information can trigger a rethinking of traditional poli-cies and practices for environmental protection.
The growing interest in analytical techniques for priority setting signals a majorshift from the initial stages of environmental policies, which date back to the 1970sin many countries. Those earlier stages emphasized the existence of problemsrather than their magnitude and were often rooted in moral indignation directedat the behavior of polluters.
Of course, this early environmentalism can claim many successes. The U.S.Environmental Protection Agency (EPA) estimates that as a result of the CleanAir Act (originally enacted in 1970), the number of premature deaths amongpeople 30 and older fell by almost 200,000 between 1970 and 1990, and thenumber of cases of congestive heart failure, chronic bronchitis, and asthmaattacks fells by hundreds of thousands; ecological impacts were also reducedand agricultural yields improved (U.S. EPA 1997). Yet complaints of high costsand inefficiency have accompanied even these well-documented accomplish-ments. For other environmental issues—such as water pollution, where theresults are less readily quantified—complaints have been louder. This, in turn,has spawned efforts to introduce more scientific and economic rigor into thepolicy process.
Despite the growing support for analytic/quantitative techniques in many publicpolicy areas, such as health care and education, hostility to their use in environ-mental decision making remains an issue in many circles. Critics argue that thedisciplines of risk and economic analysis are too narrow to deal with the moraland ethical issues associated with environmental policy and that the paradigm
TOWARD ENVIRONMENTAL PRIORITY SETTING IN DEVELOPMENT 63
of individual preferences does not provide a broad enough basis on which to makeenvironmental decisions.
Concerns have also been raised about the possibility of manipulation of infor-mation. It is sometimes claimed that because of the primitive level of knowledgeabout the physical effects of pollution—not to mention some of the issues asso-ciated with the valuation of benefits and costs—the risk and economic analysisof environmental regulation is too readily manipulated. Yet, as Herman Leonardand Richard Zeckhauser (1986: 3) argued more than two decades ago:
Any technique employed in the political process may be distorted to suit parochial
ends and particular interest groups. [Economic] analysis can be an advocacy weapon,
and it can be used by knaves. But it does not create knaves, and to some extent it
may even police their behavior. The critical question is whether it is more or less
subject to manipulation than alternative decision processes. Our claim is that its ulti-
mate grounding in analytic disciplines affords some protection.
Notwithstanding some legitimate concerns about the techniques, there isgrowing support for the use of analytical studies to help improve the allocationof society’s resources and engender an understanding of who benefits and whopays for any given policy. Such studies can encourage transparency and account-ability in the decision-making process and provide a framework for consistentdata collection and identification of gaps in knowledge. Economic analyses havethe additional advantage of allowing for the aggregation of many dissimilar typesof damages (such as those on health, visibility, and crops) into one measure ofnet damages/benefits expressed in a single metric.
The fields of risk analysis and environmental economics have expanded rapidlyover the past several decades. A distinguished group of economists, includingNobel laureate Kenneth Arrow, has identified three major functions of economicanalysis in the regulation of health, safety, and the environment: arraying infor-mation about the benefits and costs of proposed regulations; revealing potentiallycost-effective alternatives; and showing how benefits and costs are distributed(geographically, temporally, and across income and racial groups, for example)(Arrow and others 1996).
A number of studies document how risk and economic analyses have beenused to support environmental management efforts. In the United States, forexample, such analyses have helped produce and accelerate stronger regulationof lead in gasoline; promoted more-stringent regulation of lead in drinking water;led to stronger controls on air pollution at the Grand Canyon and the NavahoGenerating Station; and supported the use of cleaner motor vehicle fuels(Morgenstern 1997). In Europe, where there are fewer requirements to conductsuch studies, their use is also growing.3
Risk and economic analyses have also been used to evaluate the equity andredistributive aspects of environmental policies. There are numerous examples
64 STRATEGIC ENVIRONMENTAL ASSESSMENT FOR POLICIES

of such evaluations in the developed world; the techniques have been used toexamine equity issues in the developing world as well. In Bogotá, Colombia, forexample, analytical studies have documented that the parts of the city with thedirtiest air are also the poorest (Blackman and others 2005). These studies producean additional rationale for improving air quality: enhancing the well-being oflow-income groups.
In sum, while there is no perfect method for establishing environmental prior-ities, there are many reasons to believe that risk- and economic-based techniqueshave an important role to play. In the United States, much debate has occurred onhow to expand the use of use these techniques in real-world decision settings. Whilesome would seek to create a more-formal structure, the predominant view is thatsuch techniques are best used as tools rather than rules for decision making. In thedeveloping world, these techniques are increasingly used in Strategic EnvironmentalAssessments (SEAs) undertaken by national governments, development agencies,and others to reform and strengthen environmental management systems.
Comparative Risk Analysis
Comparative risk analysis (CRA) is a systematic procedure for evaluating theenvironmental problems affecting an area. It typically incorporates elements of bothrisk assessment and risk management. In the United States this approach is used bythe federal government and by subnational entities in more than 50 localities.Internationally, more than a dozen countries have developed major projects basedon this methodology.4
CRA provides a systematic framework for evaluating environmental problemsthat pose different types and degrees of risk to human health and the environment.5
The basic premises of CRA are that risk provides an objective measure of the rela-tive severity of different environmental problems and that risk reduction providesa metric for organizing and evaluating efforts to address the problems.
CRA has two stages, risk assessment and risk management. In the risk-assessmentstage, the environmental problems facing an area are identified, evaluated, andcompared, with the aim of ranking the problems based on the risks they pose.In some cases a single risk metric is employed. In other cases different rankingsare developed for different risk categories (cancer versus noncancer health risks,health versus ecological risks. The ranking process involves assembling andanalyzing relevant data on environmental problems (including information fromscientific risk analyses) and using structured judgments to fill gaps in the data.Although the risk-ranking process is scientifically oriented, it relies heavily onvalue judgments. The hazards to be considered in the risk assessment, how “risk”is to be measured, how different risks should be weighted, and how uncertaintyshould be treated are matters that often involve local values and social choice.
TOWARD ENVIRONMENTAL PRIORITY SETTING IN DEVELOPMENT 65
Although not incorporated into all CRAs, risk management involves thedevelopment and assessment of initiatives to address the key risks identified inthe risk-assessment phase. The considerations in this stage extend beyond riskassessment to include economic, technical, institutional, legal, and political factors.
CRA was originally developed by the U.S. EPA and published as an agencyreport entitled Unfinished Business (U.S. EPA 1987). Although Unfinished Businessdid not immediately lead to a major reallocation of resources at EPA or radicallychange public perceptions of environmental risks, it did help broaden thinking inthe policy community on the need to prioritize efforts on the basis of the potentialfor risk reduction.
Since publication of Unfinished Business, more than half of all U.S. states andmore than 50 localities have employed CRA to identify and address importantenvironmental issues. Internationally, CRAs have been conducted in cities in morethan a dozen developing countries and transition economies, including Bangkok,Cairo, and Quito. There is evidence that risk-based studies have influenced manychoices about resources that have led to better health and ecological protection(Sessions and others 1997; Keane and Cho 2000).
Feldman, Ralph, and Rulth (1996) identify four principal goals of CRAs:■ Involve the public in the priority-setting process, and identify and incorporate
their concerns.■ Identify the greatest environmental threats and rank them accordingly.■ Establish environmental priorities.■ Develop action plans and strategies to reduce risks.
Individual CRAs vary in their methodological approaches and in the extent towhich they fulfill these objectives. Given the diversity in both the scope and methodsof CRAs, choices must be made about the elements selected as the basis of anyreview of these analyses. Konisky (1999) identifies three elements of particularimportance:1. Environmental problem list. This list typically includes a core set of pollution
problems typically managed by environmental agencies (air pollution, surfacewater pollution, drinking water contamination, hazardous and nonhazardouswaste). Increasingly, particularly in developing countries, the problem list isexpanding to include issues of broader social concern, such as traffic accidents,deforestation, and occupational exposures to toxic substances. AlthoughUnfinished Business included 31 problem areas, most CRAs focus on no morethan a dozen.
2. Criteria for evaluating problems. Across all CRAs, risk provides the commondenominator for comparing the disparate impacts of different environmentalproblems. Significant differences exist, however, in the types of risks CRA projectsponsors have addressed (health and ecological risks, risks to economic well-being, and risks to the general quality of life). Even larger differences exist in
66 STRATEGIC ENVIRONMENTAL ASSESSMENT FOR POLICIES

the criteria used to measure the magnitude of these endpoints (lives lost, numbersof cases of illnesses, extent of ecological damage, recovery time, monetizedeconomic losses). Some of the criteria allow for strict quantitative estimates ofharm or risk. Others are more qualitative.
3. Ranking. The ranking process can be thought of as a continuum ranging froma narrow process heavily determined by scientific estimates of adverse effectsto a broad framework that incorporates multiple values, including public pref-erences. A CRA can fail by going too far in either direction. Technical analysesof adverse effects are a critical element in a CRA, but if they are the only element,the CRA is likely to have only limited impact. If the CRA incorporates all rele-vant elements, including political factors, and gives them the same weight theyare given in the decision-making arena, it will wind up maintaining the statusquo and have no value added.No purely scientific methodologies exist for comparing very diverse types of
risks. Typically, CRAs avoid cross-category comparisons, focusing instead onwithin-category comparisons of health, environmental, and welfare issues. Whilethis is an attractive approach in many respects, it has a number of disadvantages:■ It provides no overall ranking and thus might not serve the purpose for which
the CRA was intended.■ For some types of risks, it may be difficult to separate out the most important
effects (some types of air pollution cause acute and chronic health effects, forexample, as well as environmental welfare impacts).
■ Even within certain categories, it may be difficult to compare different types ofrisks (asthma versus lung cancer, for example).
■ Because environmental risks are not expressed in monetary terms, direct compar-isons cannot be made with other economic indicators that could be helpful inallocating public and private resources.It is important to focus on who is doing the ranking. Slovic (1987) and others
suggest that while individuals trained in science and related fields generally employformal risk assessment to draw conclusions about relative risk, most ordinarycitizens rely instead on intuitive judgments. It is therefore not surprising thatexperts and the general public tend to rank the same environmental problemsdifferently (Morgenstern and Sessions 1988; U.S. EPA 1990b).
The existence of large differences in public and expert risk perceptions high-lights the normative issue of who in society should be doing the ranking. UnfinishedBusiness relied exclusively on the expert judgments of government scientists andprogram managers. More recently, public involvement in the process has increased,in the United States and internationally. Most CRAs are now overseen by multi-disciplinary working groups that include technical experts and interested individualsfrom institutions concerned with environmental management, including nongovern-mental organizations (NGOs), businesses, universities, and the general public.
TOWARD ENVIRONMENTAL PRIORITY SETTING IN DEVELOPMENT 67

Thirteen international CRAs have been conducted since 1990, all of them indeveloping countries or transition economies (table 4.1).6 Examination of theseanalyses reveals both similarities and differences in approaches. The number ofproblem areas considered in the international studies ranges from 3 to 16—farfewer than the 31 problem areas considered in Unfinished Business. Like UnfinishedBusiness, all the studies employed a heterogeneous rather than a homogenousclassification scheme (such as a pollutant, source, pathway, or receptor to definethe problems). All of the studies ranked problems based on their relative healthrisks; a few also developed separate rankings based on ecological risks and risksto quality of life.
The groups developing the rankings differed substantially across projects. Atone extreme, the risk rankings were developed by a small group of technical experts(generally less than 10 people). At the other extreme, several projects developedtheir risk rankings through a broad participatory process involving representa-tives of the general public as well as scores of experts from both government andNGOs. A few projects involved only consultants, several involved only govern-ment officials, most were multisectoral. Nearly all CRA risk-ranking processeswere informed by extensive collection and analysis of technical information.
About half the CRAs proceeded beyond the risk analysis to a risk-managementphase in which priorities, action plans, or initiatives were developed while consid-ering a range of management factors as well as risk reduction. This approachdiffers from Unfinished Business, which was strictly a risk-ranking exercise.
Some of the international CRAs incorporated novel features not widely usedin the United States. The USAID—sponsored CRA conducted in Quito, for example,used ethnographic methods (focus groups, structured observations, in-depth inter-views). Researchers studied behaviors that affected exposure to environmentalpollutants (how much drinking water they consumed, how they stored their water,whether or not they boiled the water before drinking it) in order to replace thetypical default exposure assumptions with estimates reflecting local practices.They also studied people’s attitudes in order to reflect local values in the risk assess-ment. In the local culture, for example, is an illness of more concern if it affectsa child, a working adult, or an elderly person? What sorts of “quality of life” risksshould be evaluated?
Despite the variety of methods used in the international CRAs, it is nonethe-less useful to try to compare the risk rankings across studies (table 4.2). Is thereuniformity in the relative risk rankings across different settings? Are certain envi-ronmental problems consistently found to be among the most serious?
Although the state and local CRAs conducted in the United States consideredfewer problems than did Unfinished Business, the definitions of the environmentalproblems used in these projects were quite similar to the Unfinished Business defi-nitions. The same cannot be said about CRAs conducted in other countries.
68 STRATEGIC ENVIRONMENTAL ASSESSMENT FOR POLICIES

TABLE 4.1
Comparison of International Comparative Risk Analyses
Number of Types of Risk for Notable Features Risk ManagementProblem Which Rankings Ranking or Project Data Collection of Risk-ranking Activities
Study Location Areas Were Developed Categorizing Participants and Analysis Method Performed
Troyan, Bulgaria At least 4 Health, ecological, Categorizing Mixed Some Technical committee Yes(ICLEI 1995) quality of life identified list of
environmentalproblems. Problemswere divided into high,medium, and low riskbased on risk analysisand public input.
Central America 7 Health, ecological, Categorizing Mixed. Project staff Extensive Different criteria and Yes(USAID 1996) quality of life did initial risk scoring systems were
ranking; multisectoral used for each typecommittee of risk. Identicaladjusted it procedures were used
in six countries and forregion as a whole.
Taiwan (China) 15 Cancer, noncancer, Some ranking, Government and None Experts identified and No(Morgenstern, ecological, welfare some nongovernment ranked environmentalShih, and categorizing experts problems based onSessions 2000) their own judgment.
Silesia region, 6 Health, ecological None Government and Extensive Analysis examined YesCzech Republic nongovernment severity and scale ofand Poland experts ecological as well as(U.S. EPA 1992, human health risks.1994)
(continued)
69

TABLE 4.1
Comparison of International Comparative Risk Analyses (continued)
Number of Types of Risk for Notable Features Risk ManagementProblem Which Rankings Ranking or Project Data Collection of Risk-ranking Activities
Study Location Areas Were Developed Categorizing Participants and Analysis Method Performed
Quito, Ecuador 9 Health only Categorizing Consultants Extensive Analysis drew on No(USAID 1993) quantitative risk
assessment and healthoutcome data, site-specific ethnographicstudy, and explicitscoring of problemsbased on probabilityand severity.
Cairo, Egypt, 16 Health only Categorizing Consultants Extensive Estimated incidence NoArab Rep. of and severity index(USAID 1994) was used to rank
problems.
Ahmedabad City, 11 Health, ecological, Categorizing Government and Extensive Risk assessment YesIndia (USAID quality of life nongovernment evaluated only1995) experts aggregated human
health risks; focusedon residual risk fromcurrent controls toguide future actionplans.
West Bengal, As many Health, ecological, Categorizing Nongovernment Extensive Integrated risk YesIndia (Ghosh, as 10 quality of life experts assessment and Bose & participatory methodsAssociates were based on health1997) and ecological impacts
and quality of life.
70
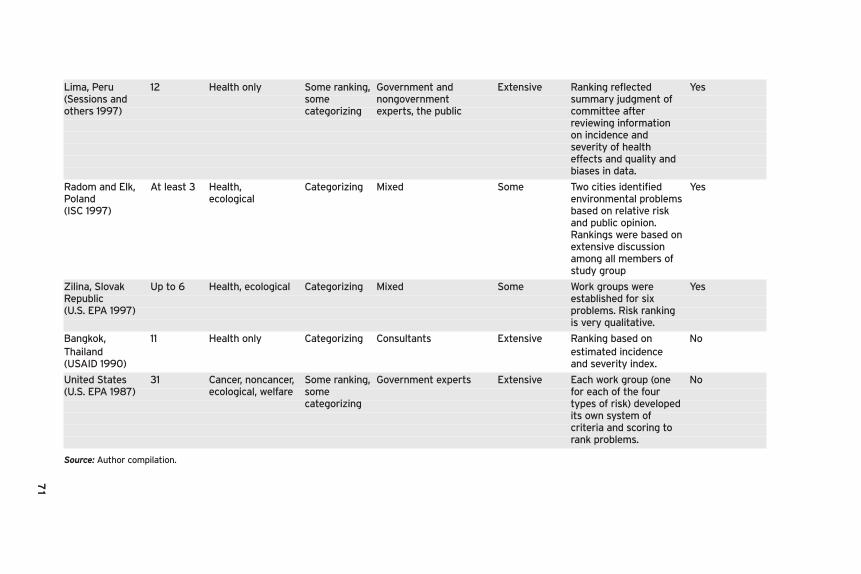
Lima, Peru 12 Health only Some ranking, Government and Extensive Ranking reflected Yes(Sessions and some nongovernment summary judgment ofothers 1997) categorizing experts, the public committee after
reviewing informationon incidence andseverity of healtheffects and quality andbiases in data.
Radom and Elk, At least 3 Health, Categorizing Mixed Some Two cities identified YesPoland ecological environmental problems(ISC 1997) based on relative risk
and public opinion.Rankings were based onextensive discussionamong all members ofstudy group
Zilina, Slovak Up to 6 Health, ecological Categorizing Mixed Some Work groups were YesRepublic established for six(U.S. EPA 1997) problems. Risk ranking
is very qualitative.
Bangkok, 11 Health only Categorizing Consultants Extensive Ranking based on NoThailand estimated incidence(USAID 1990) and severity index.
United States 31 Cancer, noncancer, Some ranking, Government experts Extensive Each work group (one No(U.S. EPA 1987) ecological, welfare some for each of the four
categorizing types of risk) developedits own system ofcriteria and scoring torank problems.
Source: Author compilation.
71
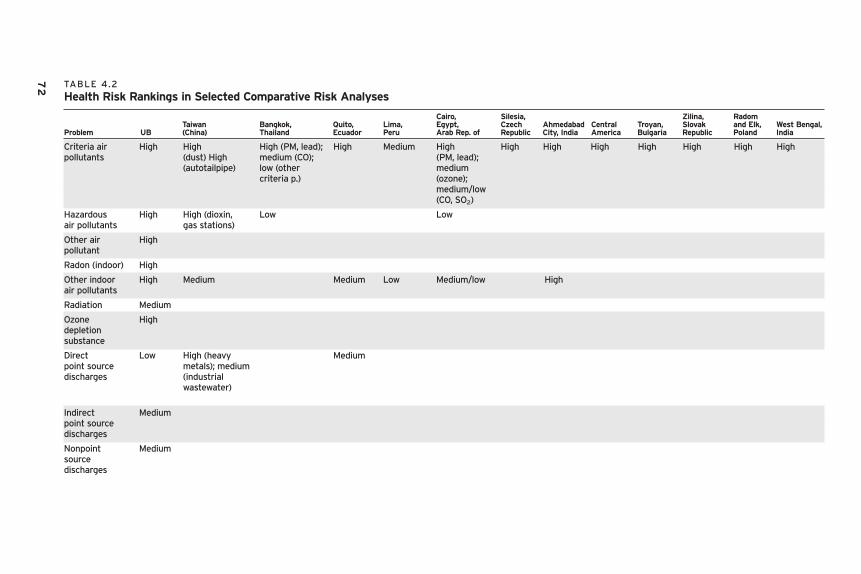
TABLE 4.2
Health Risk Rankings in Selected Comparative Risk Analyses
Cairo, Silesia, Zilina, RadomTaiwan Bangkok, Quito, Lima, Egypt, Czech Ahmedabad Central Troyan, Slovak and Elk, West Bengal,
Problem UB (China) Thailand Ecuador Peru Arab Rep. of Republic City, India America Bulgaria Republic Poland India
Criteria air High High High (PM, lead); High Medium High High High High High High High Highpollutants (dust) High medium (CO); (PM, lead);
(autotailpipe) low (other mediumcriteria p.) (ozone);
medium/low (CO, SO2)
Hazardous High High (dioxin, Low Lowair pollutants gas stations)
Other air Highpollutant
Radon (indoor) High
Other indoor High Medium Medium Low Medium/low Highair pollutants
Radiation Medium
Ozone Highdepletion substance
Direct Low High (heavy Mediumpoint source metals); mediumdischarges (industrial
wastewater)
Indirect Mediumpoint source discharges
Nonpoint Mediumsource discharges
72

Contaminated Lowsludge
Estuaries and Mediumcoastal waters
Wetlands Low
Drinking water High High (drinking Low (surface Medium High Medium/low Low High Medium High High High (waterwater) water (limited (cont by supply)
contamination) erratic chem) water Medium/lowsupply) (cont by
microbes
Active Low High (toxic Low Low Medium/lowhazardous substance) (toxic (hazardouswaste sites substance) waste)
Inactive Lowhazardous waste sites
Nonhazardous Medium Medium Low Low High Medium/low Low High Medium/waste sites, (solid waste) (solid (solid waste) lowmunicipal waste)
Nonhazardous Mediumwaste sites, Industrial
Mining waste Low
Accidental Hightoxic releases
Accidental URoil spills
Storage tank Lowreleases
Other NR Medium Low Medium Medium/ High Highgroundwater low (depletion) (depletion)contamination
(continued)
73
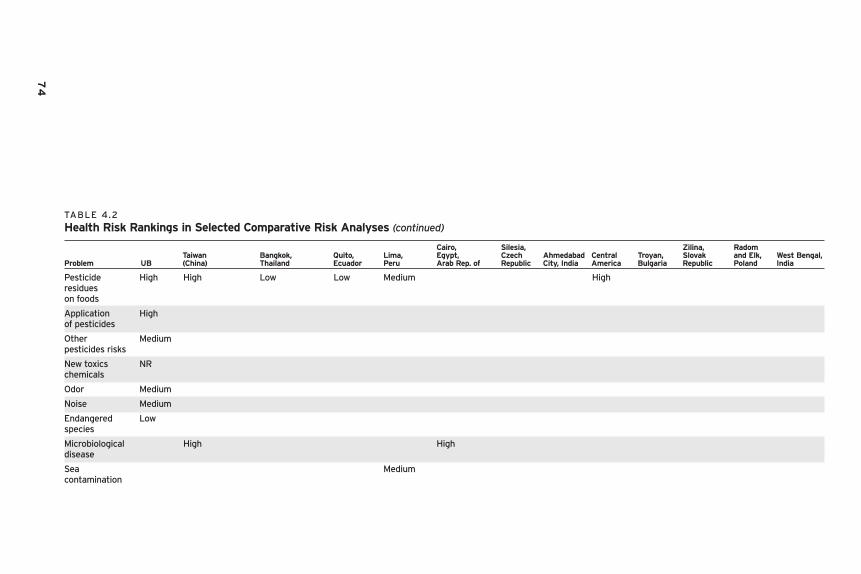
74
TABLE 4.2
Health Risk Rankings in Selected Comparative Risk Analyses (continued)
Cairo, Silesia, Zilina, RadomTaiwan Bangkok, Quito, Lima, Egypt, Czech Ahmedabad Central Troyan, Slovak and Elk, West Bengal,
Problem UB (China) Thailand Ecuador Peru Arab Rep. of Republic City, India America Bulgaria Republic Poland India
Pesticide High High Low Low Medium Highresidues on foods
Application Highof pesticides
Other Mediumpesticides risks
New toxics NRchemicals
Odor Medium
Noise Medium
Endangered Lowspecies
Microbiological High Highdisease
Sea Mediumcontamination
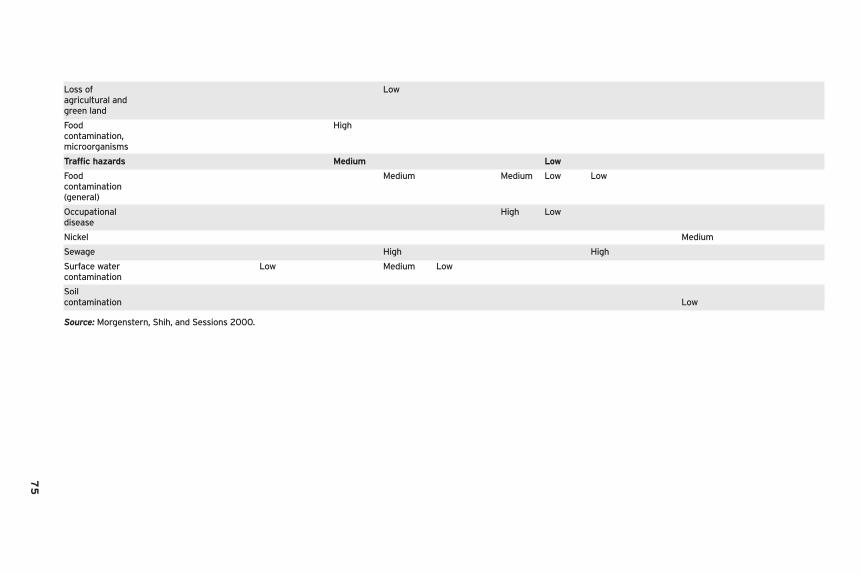
75
Loss of Lowagricultural andgreen land
Food Highcontamination, microorganisms
Traffic hazards Medium Low
Food Medium Medium Low Lowcontamination (general)
Occupational High Lowdisease
Nickel Medium
Sewage High High
Surface water Low Medium Lowcontamination
Soilcontamination Low
Source: Morgenstern, Shih, and Sessions 2000.
Definitional differences involve issues of aggregation and organizing structure. Forexample, Unfinished Business defined the problem of “criteria air pollutants” toinclude particulate matter, ozone, sulfur dioxide, nitrogen oxides, carbon monoxide,and lead. Other CRAs considered one or more of these air pollutants separatelyand ranked them individually. The Central American project defined “pesticides”as a single problem posing both human health and ecological risks. Other projectshad no explicit “pesticides” problem but instead included pesticides as part of“drinking water contamination,”“food contamination,” or “worker exposures.”
The range of the problems considered in CRAs is also important. How doesone interpret the fact that in considering only six problems, the Silesia CRA omittedmore than 80 percent of the problems analyzed in Unfinished Business? In makingcomparisons across CRAs, one is tempted to interpret exclusion of a problem asat least tacit acknowledgment that the omitted problem is less important than theincluded ones. It is also true, however, that some CRA projects have defineddifferent definitional boundaries for “environmental problems.” Should traffichazards be considered an environmental problem? What about occupational expo-sures and illnesses? What about groundwater depletion (as opposed to groundwatercontamination)? Not surprisingly, the organizers of a CRA are sometimes un-interested in a particular problem because it is not within the potential sphere ofits responsibility.
Comparing CRAs is also hindered by substantial differences in data and method-ologies. For example, all of the studies relied on similar dose-response functionsin estimating health risks for key pollutants. These dose-response functions areoften derived from U.S. studies. While this is not an unreasonable approach, if thetrue dose-response function varies substantially across countries (as a function ofthe age distribution or health of the population), the simplifying assumption ofuniform cross-national relationships would not be appropriate.
As part of their health risk analysis, most international CRAs have adoptedthe practice common in U.S. analyses of aggregating and then comparing thenumber of deaths associated with different environmental problems. Few inter-national CRAs distinguish between the death of an infant from diarrhea, of aworking adult from an occupational accident, or of an elderly respiratory patientfrom air pollution. Had the CRAs used other approaches that weighted deathsamong different members of society differently (using, for example, disability-adjusted life years) or through culture-specific judgments about the relative importof these different outcomes, the risk rankings of the environmental problemsmight have been significantly different.
Health risk, as opposed to ecological status or quality of life, was chosen as thebasis for the rankings because it is the only category considered in all of the studies.The rankings in table 4.2 are disaggregated into the 27 most-frequently used ofthe original 31 Unfinished Business categories. Fourteen other rankings that were
76 STRATEGIC ENVIRONMENTAL ASSESSMENT FOR POLICIES

considered in the international studies but not explicitly examined in UnfinishedBusiness are also included.7
Several observations emerge from the review of the risk rankings developedby these CRAs:1. Air pollutants consistently rank high as health risks. Given the diverse nature
of the settings studied in the CRAs—which differed in terms of economic devel-opment, ruralness, and climate—this finding is particularly important. At thesame time, some differences are apparent with regard to specific air pollutants.Particulate matter and lead are found to pose high risks in virtually all settings.The ranking for sulfur dioxide is much more variable, tending to be high inareas where coal is used extensively in cities (Eastern Europe) and much lowerin areas where there is little urban coal use and the predominant fuels havelower sulfur content (Bangkok, Cairo, Lima).
2. Unclean drinking water ranks as a high or medium health risk in almost allthe countries studied. The reasons for this ranking differ significantly acrossstudies. The high health risk ranking in the United States and several EasternEuropean communities reflects a judgment about the magnitude of the healtheffects caused by contaminants found in drinking water. In contrast, the CRAsof Lima and West Bengal addressed the erratic supply of clean water.
3. Problems involving toxic chemicals (hazardous air pollutants, pesticides, acci-dental toxic releases, radon, and radiation) tend to be ranked as greater healthrisks in the United States than in other countries, although dioxin and gasolinestation emissions are ranked as high health risks in Taiwan (China). At the sametime, several problems involving pathogens are recognized as significant prob-lems in developing country settings. This likely reflects the shift from basicsanitation and infectious disease problems to those involving industry, vehicles,toxic substances, and other problems associated with economic development(Smith 1988). Alternatively, it may simply reflect the greater availability of infor-mation on sources of such pollutants in the United States.
4. The pollution of surface (as opposed to drinking) water is generally ranked asa medium or low health risk. In most instances exposure to contaminatedsurface water (by eating fish and shellfish, by swimming and engaging in otherwater-contact activities) was judged to be limited. While surface water used asa source of drinking water was contaminated in many locales, the treatmentprocesses were generally thought to be acceptable. If separate rankings hadbeen performed for ecological risks, as they were in Unfinished Business, pollu-tion of surface water would likely have appeared as a greater concern.
5. Hazardous and (industrial) nonhazardous waste are ranked as medium or lowhealth risks in all areas studied except Taiwan (China), where unmanaged toxicwaste sites are believed to pose high risks. These results are consistent with thenotion that few people are directly exposed to hazardous and (industrial)
TOWARD ENVIRONMENTAL PRIORITY SETTING IN DEVELOPMENT 77
78 STRATEGIC ENVIRONMENTAL ASSESSMENT FOR POLICIES
nonhazardous waste. It is not entirely surprising that views may differ in Taiwan,where land area is limited and population density high.
6. Among CRAs that rank household waste, about equal numbers rank them aslow and high risks. Several CRAs that rank household waste as posing low ormedium health risks nevertheless mention the high risks it may pose to dumpscavengers or recyclers.
7. Pesticide on food is believed to pose a high health risk in Central America,Taiwan (China), and the United States; in all other settings it ranks low on thelist of health risks. Interestingly, the CRAs in Bangkok, Cairo, and Quito rankmicroorganisms on foods, but not pesticides, as high risks to health. Theseresults may reflect different intensities of pesticide use across countries.Alternatively, they may indicate differences in scientific understanding of therisks associated with pesticide use.The fact that more than 100 CRAs have been conducted over the past decade—
more than a dozen of them outside the United States—reflects the widespreadacceptance of the approach. At the same time, it is important to emphasize thatthe CRA rankings represent risk rather than priority rankings. Although a numberof the studies did develop some form of priority ranking for specific controloptions (risk management), such rankings are not the focus of CRA comparisons.Thus, the rankings considered here do not necessarily match the rankings thatshould be given to environmental programs once cost, technical feasibility, andother factors are considered. These is also the nagging question of whether theobserved similarities (and differences) in the results of the various CRAs reflectgenuine differences in risks across the locations studied or are simply artifacts ofthe methods used. Corroboration by other methods would strengthen confidencein the conclusion that the observed similarities and differences in the results ofthe international CRAs are genuine.
Economic Damage Assessment
Economic damage assessment draws from the economics literature as well as theliterature from the environmental, physical, biological, health, and epidemiologi-cal sciences. The approach is widely used in the United States and most otherdeveloped countries.
In the absence of a viable method for integrating the various health and ecologi-cal effects, the CRAs considered in the previous section stopped short of developinga single, aggregate measure of risk expressed in a single metric. Although the absenceof such a measure does not hinder the use of CRA results in many applications, itdoes hinder cross-category comparisons involving control costs. It also hinderscomparisons across multiple areas of government policy and, arguably, limitsopportunities to integrate environmental issues into the mainstream policy arena.
One relatively transparent means of developing an aggregate measure isassigning a monetary valuation to environmental damage. Among the manyadvantages of this approach is that it places environmental policies in the sameframework widely used in developing, justifying, and communicating policieson most other issues.
For individual pollutants it is possible to determine the least-cost means ofabatement without assigning monetary values by ranking the costs of variousoptions for meeting environmental objectives. When multiple pollutants areinvolved, cost-effectiveness analysis based on physical damage is not feasible. Themost commonly used way of creating a comparative framework is to convert phys-ical damages into economic values. The monetary valuation of environmentaldamages involves a range of natural and social science issues. The focus here ison economic issues, because most of the natural science issues are common toboth CRA and economic methods. A number of techniques have been developedto quantify and monetize the preferences and values of individuals and commu-nities with respect to environmental quality, conservation of natural resources, andenvironmental health risks. Because both benefits and costs can readily be expressedin monetary terms, the analysis can provide additional support to decision makersas they allocate resources across diverse societal goals.
Costing out environmental damages involves estimating the burden of envi-ronmental pollution and natural resource damage in a number of differentdimensions. Some costs are directly tied to a country’s measured economic output(GDP). These include the reduced productivity of agricultural land because oferosion, salinity, or other forms of land degradation; medical treatment costs andlost work days caused by illnesses associated with environmental pollution; reducedfishery catch caused by pollution and overexploitation; and losses in tourismrevenues caused by pollution and natural resource degradation. Other costs areassociated with reduced well-being and quality of life. These factors, which arenot explicitly included in GDP calculations, include the risk of mortality andmorbidity associated with pollution and the loss of recreational quality and naturalheritage caused by inadequate waste management practices, degradation of naturalresources, and other factors.
When estimating the cost of environmental damage, analysts distinguishbetween financial and economic costs. To the extent feasible, economic costsshould be applied, because they exclude transfers among groups or sectors andthus capture the net burden to society. The financial cost of health services anindividual pays may be substantially lower than the true cost of providing theseservices, for example. The real societal cost includes the portion paid by individualsreceiving the services and the portion paid by others, including the public sector.Another example is work time lost to illness or provision of care for ill familymembers. If the ill person or the individual providing care for an ill person does
TOWARD ENVIRONMENTAL PRIORITY SETTING IN DEVELOPMENT 79
80 STRATEGIC ENVIRONMENTAL ASSESSMENT FOR POLICIES
not earn income, the financial cost of time loss is zero. However, the ill person orcaretaker is normally engaged in activities that are valuable to the family. Theillness of a family member can impose significant burdens on the family, includingreduction in the amount of time available for leisure activities. In economic analysisthe opportunity cost of time (that is, the salary or fraction of the salary that theindividual could earn if he or she chose to work for income) is typically used tovalue losses to the family.8
Overall, the loss in national well-being because of environmental degradationincludes but is not necessarily limited to the following:■ Loss of healthy life and well-being of the population (premature death and
suffering caused by illness)■ Economic losses (such as a decline in soil productivity, the value of other natural
resources, or national income, as a result of lost tourism)■ Loss of environmental opportunities (such as the reduced recreational value
of lakes, rivers, beaches, and forests).The process of placing a monetary value on the consequences of environmental
degradation typically involves a three step process:■ Quantifying environmental degradation (through monitoring of ambient air
quality, water quality, and soil pollution, for example)■ Quantifying the consequences of degradation (such as declines in soil produc-
tivity, forest density and growth, natural resource–based recreational activities,and demand for tourism and the impact of by air pollution on health)
■ Assigning a monetary value to these consequences.Environmental and natural resource science, toxicology and epidemiology,
economics, and other approaches are used to quantify environmental degradationand its consequences. Economic methods are used to value the consequences ofdegradation. Where no information on the consequences of degradation is avail-able, primary research is conducted and expert opinions used to develop estimatesof likely impacts.
Several approaches can be used to provide quantitative estimates of the conse-quences of environmental degradation. One method involves computingdisability-adjusted life years (DALYs). The main value of this approach, whichhas been widely used by the World Bank and other institutions, is that it providesa common metric against which to compare impacts on morbidity and mortality.Illnesses are weighted by severity, so that a relatively mild illness or disabilityrepresents a small fraction of a DALY while a severe illness represents a largerfraction. One year lost to premature mortality represents one DALY; future yearslost are discounted at a fixed rate, typically 3 percent a year.
For waterborne illnesses associated with inadequate water and sanitation servi-ces and poor hygiene, the loss of DALYs is caused predominantly by child mortalityand population morbidity caused by diarrheal illnesses. Typically, the death ofeach child under five represents the loss of 35 DALYs.

TOWARD ENVIRONMENTAL PRIORITY SETTING IN DEVELOPMENT 81
For outdoor air pollution, impacts on health are estimated based on ambientair quality data from local areas and on local or international studies on adversehealth impacts associated with air pollution. Typically, each premature adult deathcaused by air pollution represents 10 DALYs, based on age-specific cardio-pulmonary death rates. Indoor air pollution, particularly in rural areas, can presenthigher risks than outdoor urban pollution, because of the poor ventilation asso-ciated with the use of biomass fuels for cooking and heating. Data for mostcountries are insufficient to develop estimates of potential health impacts asso-ciated with inadequate collection and management of solid waste. In some casesthe social costs of inadequate waste management have been estimated directlyusing willingness-to-pay methods.
The categories of natural resource degradation most commonly quantifiedinclude agricultural land and coastal zone degradation, damage from quarriesand unplanned construction, deforestation, and disruption of wildlife. For agri-cultural land degradation, the decline in productivity of land is estimated. Thecost of coastal zone degradation is based largely on estimated losses in recre-ational opportunities, tourism, and ecological values. The impacts of wastewaterpollution and inadequate industrial waste management on recreational activ-ities, the value of coastal zones, potable water, and well-functioning ecosystemsare typically quantified in more-limited ways. Losses to fisheries are usuallynot estimated.
A variety of methodologies is applied to monetize the consequences of envi-ronmental degradation. In the absence of willingness-to-pay studies, thecost-of-illness approach is usually used for morbidity. This approach estimatestreatment costs and the cost of lost work days or time provided by caregivers.9
The cost of adult mortality from air pollution is estimated based on the willing-ness to pay for mortality risk reduction. As such studies are not typically availablein developing countries, willingness-to-pay estimates from Europe and NorthAmerica are often used after adjusting for differences in per capita GDP.10, 11 Asa lower bound, DALYs lost to mortality have been valued on the basis of GDP percapita. This valuation technique is similar to the human capital approach, whichestimates the cost of mortality as lost future income from the time of death.12
A group of 10 assessments sponsored by the World Bank over the past decadeis used to examine the application of these methodologies and to compare theresults across countries (table 4.3). The earliest assessment—an internal discus-sion paper completed in 1995—valued environmental costs in Pakistan. ClearWater, Blue Skies (World Bank 1998), considered environmental degradation costsas well as some mitigation opportunities in China. Seven of the assessments wereconducted under the sponsorship of the Bank’s Mediterranean EnvironmentalTechnical Assistance Program. They estimate environmental damages in Algeria,the Arab Republic of Egypt, the Islamic Republic of Iran, Lebanon, Morocco, theSyrian Arab Republic, and Tunisia. A study conducted under the sponsorship of

TABLE 4.3
Measured Costs of Environmental Degradation in Selected Countries(percent of GDP)
Iran,Egypt, Islamic Syrian
Item Algeria China Colombia Arab Rep. of Rep. of Lebanon Morocco Pakistan Arab Rep. Tunisia
Year 1999 1995 2002 2000 2002 2001 1001 1992 2001 2000
Air pollution 1.0 7.1 1.0 2.1 1.6 1.0 1.0 0.9 1.3 0.6
Lack of access towater supply andwater sanitation 0.8 0.6 1.0 1.0 2.8 1.1 1.2 2.6 0.9 0.6
Land degradation 1.2 n.a. 0.8 1.2 2.5 0.6 0.4 1.4 1.0 0.5(includingrangeland anddeforestation)
Coastal zone 0.6 n.a. n.a. 0.3 0.2 0.7 0.5 n.a. 0.1 0.3degradation (Caspian
Sea only)
Waste management 0.1 n.a. n.a. 0.2 0.4 0.1 0.5 n.a. 0.1 0.1
Tourism n.a. n.a. n.a. n.a. n.a. n.a. n.a. 0.1 n.a. n.a.
Natural disasters n.a. n.a. 0.9 n.a. n.a. n.a. n.a. n.a. n.a. n.a.
Road accidents n.a. n.a. 1.5 n.a. n.a. n.a. n.a. n.a. n.a. n.a.
Total measured costs 3.6 7.7 5.2 4.8 7.5 3.4 3.7 5.0 3.3 2.1
Source: Data for Algeria and Morocco are from Sarraf (2004); data for China are from World Bank (1997); data for Colombia are from Larsen (2004); data for the ArabRepublic of Egypt are from Sarraf and Larsen (2002); data for the Islamic Republic of Iran are from Sarraf and others (2005); data for Lebanon and Tunisia are from Sarraf,Larsen, and Owaygen (2004); data for Syrian Arab Republic are from Sarraf (2004) and Sarraf, Bolt, and Larsen (2004).n.a. = Not available.
82
the Latin American and Caribbean Section of the Bank’s Environment Departmentfocuses on Colombia (World Bank 1998; Larsen 2004; Sarraf, Bolt, and Larsen 2004;Sarraf and Larsen 2002; Sarraf, Larsen, and Owaygen 2004; Sarraf and others 2005).
Although there are some important methodological differences across studies,all reflect a standard economic paradigm. While some Bank-sponsored studiesalso report results based on the human capital approach, the estimates consid-ered here are based largely on the willingness-to-pay approach. Some of themethods and, particularly, the underlying dose-response functions, as well as thevaluations, have been updated on the basis of new research results. For example,most of the estimates of air pollution damages were based on dose-responsecoefficients from the international literature on acute effects. Estimates of long-term effects by Pope and others (2002), however, were much larger than previouslyfound. Following extensive peer review, this study is increasingly becoming theconvention for estimating mortality effects of particulate pollution. It was usedin the two most recent World Bank damage assessments (on Colombia and theIslamic Republic of Iran). It is likely, therefore, that the damage assessments presentedin the earlier assessments underestimate the true health damages associated withair pollution. Overall, the methodological harmonization is greatest for air andwater pollution. For land and coastal degradation, waste management, and naturalresource degradation, the methodologies used depended on the available data.
Clear Water, Blue Skies values a broad array of air pollution damages. In addi-tion to the standard air pollution categories of premature death, morbidity,restricted activity days, chronic bronchitis and other health effects, the authors ofthe China assessment estimated the cost of lead exposure, mostly from gasolineand stationary sources, such as smelters. They also estimated the effect of acidrain on crops, forests, materials, and ecosystems. Damage by these two sourcesaccounted for about 17 percent of total air pollution damage estimated for China.
The Colombian study (Larsen 2004) includes two damage categories not typi-cally covered in economic/environmental damage assessments: natural disasters androad accidents. Based on data collected from Colombia’s Ministry of Interior andJustice, the study estimates that natural disasters such as floods, landslides,avalanches, storms, and earthquakes affected an average of 440,000 people a yearover the period 1997–2003, causing damage equivalent to 0.9 percent of GDP.
While road accidents are typically not considered an environmental problem,the World Health Organization (WHO) does include them in its broader defini-tion of the human environment. Accidents were included in the Colombia studyfor this reason and to provide a comparison with “traditional” environmentalissues. The mean annual cost of road accidents is estimated at 1.5 percent of GDP.
Data and resource limitations prevented estimation of degradation costs at thenational level for certain damage categories in some countries. All the studiesaddress (outdoor urban) air pollution and water pollution; in contrast, coverage
TOWARD ENVIRONMENTAL PRIORITY SETTING IN DEVELOPMENT 83

84 STRATEGIC ENVIRONMENTAL ASSESSMENT FOR POLICIES
of indoor air pollution, coastal zones (fisheries and tourism losses), wetlands,noise pollution, biodiversity, protected areas, rangeland, inappropriate solid wastedisposal, and inadequate industrial and hospital waste management is spottier.
The total damages associated with air pollution; water, sanitation and hygiene;and land degradation ranged from 1.7 to 7.7 percent of GDP. Damage caused bywater, sanitation, and hygiene represented the largest single category in four coun-tries (Islamic Republic of Iran, Lebanon, Morocco, and Pakistan). Damage causedby air pollution was the most important category in three countries (China, theArab Republic of Egypt, and the Syrian Arab Republic); in one country (Tunisia)damage caused by air and water pollution was about equal. Land degradation wasthe most important source of environmental damage only in Algeria.
Degradation of coastal zones, waste management, and tourism accounted fora much smaller share of damage. In the Syrian Arab Republic, for example, thesecategories accounted for an additional 0.1 percent of lost GDP. An exception isMorocco, where these categories accounted for 1.1 percent of GDP.
The only country that calculated the cost of natural disasters and road acci-dents was Colombia. The two categories account for 2.4 percent of lost GDP, almostdoubling the estimated cost of air pollution; inadequate water, sanitation, andhygiene; and land degradation.
Research shows that both indoor and outdoor air pollution have significantnegative effects on human health, causing premature mortality, chronic bron-chitis, respiratory disorders, and other effects (table 4.4). The most significant airpollutant in terms of health impacts is particulate matter, especially fine particles(PM10 and smaller). The use of biomass fuel for cooking and heating causes indoorair pollution that threatens health. The threat is greatest for women and children,who spend more time indoors than men.
TABLE 4.4
Damage from Indoor and Outdoor Pollution in Selected Countries(percent of GDP)
Country Outdoor Air Pollution Indoor Air Pollution Total Air Pollution
Algeria 0.6 0.4 1.0
China 5.4 1.7 7.1
Colombia 0.8 0.2 1.0
Egypt, Arab Rep. of 1.8 0.3 2.1
Iran, Islamic Rep. of 1.3 0.3 1.6
Lebanon 0.8 0.2 1.0
Morocco 0.6 0.4 1.0
Tunisia 0.4 0.2 0.6
Source: Data for Algeria and Morocco are from Sarraf (2004); data for China are from World Bank(1998); data for Colombia are from Larsen (2004); data for the Arab Republic of Egypt are from Sarrafand Larsen (2002); data for the Islamic Republic of Iran are from Sarraf and others (2005); data forLebanon and Tunisia are from Sarraf, Larsen, and Owaygen (2004); data for the Syrian Arab Republicare from Sarraf (2004) and Sarraf, Bolt, and Larsen (2004).

TOWARD ENVIRONMENTAL PRIORITY SETTING IN DEVELOPMENT 85
The importance of indoor versus outdoor air pollution varies considerablyacross the countries studied. In Algeria and Morocco, where total air pollutiondamage is relatively modest, damage from indoor air pollution is about two-thirdsas great as damage from outdoor pollution. In countries with populous and heavilypolluted urban centers, the damage from indoor air pollution is relatively smaller,partly because of the smaller number of people using biomass fuels and partlybecause of the greater health damage caused in urban areas.
On average the effect of indoor air pollution in the countries studied was moremodest than in many developing countries in Asia and Sub-Saharan Africa. Indoorair pollution tends to be greater in countries with large rural populations andlarge shares of households using solid fuels.
Lack of access to clean water ranks as the single most important damage cate-gory among the 10 countries studied. Substandard water quality for drinking andhygiene combined with inadequate sanitation facilities led to increases in diarrheaand other waterborne illnesses and associated mortality. Diarrhea and certain otherdiseases have their greatest impact on children. The economic estimates take accountof mortality, morbidity, and the time spent by caregivers taking care of ill people.Because they do not include damage to fisheries, ecosystems, or biodiversity causedby water pollution, these figures underestimate total damage.
In many of the countries studied, soil salinity, erosion, and degradation ofrangeland reduce agricultural productivity and the supply of livestock fodder.Although precise data are not available for each source of degradation, estimatesof the approximate magnitudes involved are available. In Colombia soil erosion(which reduces crop output) represents about 60 percent of total damage and soilsalinity 40 percent (Larsen 2004). (The data did not allow an estimate of the costrangeland degradation to be made.) In Lebanon, uncontrolled quarrying in thepast has caused major destruction of natural vegetation and habitat. Land pricesnear quarries were significantly lower than for comparable plots farther away(Sarraf, Larsen, and Owaygen 2004). In the Syrian Arab Republic, more than40 percent of total irrigated land in the Euphrates basin is affected by salinity,which is estimated to reduce yields of cotton and wheat, the main irrigated crops,by 37 percent (Sarraf, Bolt, and Larsen 2004).
Most of the countries studied are located near a major water body.13 Coastalresources represent an important economic, recreational, and ecological asset.This asset has been threatened by uncontrolled urban development, untreatedindustrial and municipal discharges, and port activities, which have contributedto significant coastal pollution. For the countries in the Middle East and NorthAfrica, estimates of the cost associated with this pollution include loss of bothinternational and domestic tourism and ecological damage, such as the extinc-tion of sea turtles near the Lebanese coast. In Tunisia, where 90 percent of tourismrevenue is associated with coastal zone recreation, a contingent valuation survey
found that 12 percent of tourists interviewed were willing to pay about 5 percentmore per stay to improve the cleanliness of the beaches.(Sarraf, Larsen, andOwaygen 2004).
Although the 10 studies used different methodologies and covered differentcategories of damage categories, the results send a powerful message: the economiccosts of environmental degradation are significant in virtually every countrystudied, and they are high in a number of countries. Some of the lower damageestimates reflect dose-response coefficients drawn from earlier studies or thelimited availability of data on damage.
A separate issue, not explored in this chapter, concerns intracountry variationin environmental damage. The World Bank analysis of Colombia finds that thedistribution of environmental damage varies widely within the country. If docu-mented by other studies, a finding of significant intracountry variation in damagesmay indicate that policy priorities need to be examined at the subnational levelrather for the country as a whole. It is hoped that next generation of studies willtake up that challenge.
Conclusions
CRA and economic damage assessment share many similarities. Both identify airand water pollution as key environmental problems and household, industrial,and hazardous waste issues as less significant. The largest differences between thetwo methods lie in the definitional boundaries of the problems studied. CRAsfocus almost exclusively on “brown” issues traditionally managed by pollutioncontrol agencies, such as specific air pollutants, drinking water, toxics, and pesti-cides. They also tend to define problem boundaries on a program-specific basis.
In contrast, economic damage assessments tend to focus on fewer but morebroadly defined problem categories, which often cut across specific program lines.They also tend to give more emphasis to “green” issues, such as forestry, agricul-ture, and coastal management.
There is nothing inherent in the methodologies that dictates these differences;they likely reflect the orientation of the client agencies. For CRAs, the client agen-cies have generally been involved in environmental management per se. Foreconomic damage assessments, the client agency often includes the local financeand planning ministries or international development agencies, which tend tohave a broader perspective on the country’s environmental resources.
What circumstances suggest that one approach rather than the other shouldbe applied? Particularly as it has evolved in recent years, the use of CRAs hasbecome participatory in nature, often involving government officials as well asrepresentatives of industry, NGOs, and the general public. In contrast, economicdamage assessments are typically conducted by experts with limited involvement
86 STRATEGIC ENVIRONMENTAL ASSESSMENT FOR POLICIES
TOWARD ENVIRONMENTAL PRIORITY SETTING IN DEVELOPMENT 87
in the local political process. While there is nothing inherent in the methodologiesthat creates these differences, the more-limited public knowledge about and accept-ance of environmental economics may be a factor.
How are the results of CRAs or economic damage assessments used in the SEAprocess? In terms of policy prescriptions, both approaches produce a “worst” list,but this focus on top-ranked problems can be misleading. If the top-ranked riskis global warming, should a country address that issue to the exclusion of allothers? While few would advocate such a strategy, particularly in light of the globalnature of the problem (and solution), the question highlights one of the dilemmaspolicymakers face.
Because only a limited number of remedial actions can be costed out, theeffectiveness of specific steps to mitigate environmental damages is often unknown.Thus, despite the value of both CRA and economic damage assessments for estab-lishing priority areas for action, they are often insufficient for identifying andevaluating specific projects to mitigate the problems. Doing so involves analyzingmarginal benefits and costs of individual actions in order to determine whichare likely to provide the largest gain for the resources expended.
Notwithstanding these limitations, both CRA and economic damage assess-ment can make important contributions to the strategic assessment process. Bothprovide useful mechanisms for ranking the social impacts of various forms ofenvironmental degradation; both can help policy makers integrate the environ-ment into decisions about economic development.
While economic methods also introduce greater complexities, by casting theissues in clear economic terms, they may make it easier for decision makers tointegrate environmental concerns into the broader policy process. These methodsgive finance and economic ministries a tool for discussing the importance ofenvironmental protections in economic terms, the same “language” used byother ministries.
Some evidence suggests that the results of these studies are being given increasingweight in policy decisions. Keane and Cho (2000) report that CRAs have figuredprominently in decisions in Asia, Eastern Europe, and Latin America. Sarraf (2004)reports on the growing use of economic damage assessments in decision makingin the Middle East and North Africa. The World Bank and the government ofMexico document the linkage between environmental factors and growth of thetourism sector (World Bank 2005). Buttressed by such analyses, the Mexicangovernment is seeking Bank support to improve infrastructure in and aroundmajor tourist facilities.
Particularly as environmental issues continue to enter the mainstream policyarena, a number of opportunities exist to expand the use of these techniques inboth national and international decision making. These options may be labeled ascarrots and sticks. In the sticks category, the most direct approach is to mandate use

88 STRATEGIC ENVIRONMENTAL ASSESSMENT FOR POLICIES
of CRA, economic damage assessments, or related techniques. Such mandates couldbe imposed at the national or subnational level. Another option is for internationallending agencies to condition some types of support on the use of such assessments.
To encourage stakeholders to conduct environmental risk and damage studies,international agencies, national governments, or subnational governments couldset aside funds for such studies. They could also tailor the scope and complexityof the required analyses better to local conditions and involve more local partici-pants in the studies. Such efforts would not only enhance local capacity-buildingefforts, they would also help develop a cadre of individuals and institutions betterprepared to advance the use of analytical/priority-setting techniques in local deci-sion making.
The increasing clamor for greater efficiency in government programs of alltypes and the growing emphasis on transparency in government bode well forthe expansion of CRA, economic damage assessments, and related techniques inenvironmental management. To paraphrase Winston Churchill, such techniquesmay be the worst approach to policy making—except for all the others that havebeen tried. Indeed, the expanded use of these techniques in environmental manage-ment is all but inevitable.
Notes
1 The development of sound management strategies also requires the integration of miti-gation cost estimates.
2 Although a growing number of developing countries and international organizationsconduct economic damage assessments, this review is confined to recent World Bank studies.
3 For six case studies on the conduct and use of economic analyses of environmental regu-lations in Europe, see Harrington, Morgenstern, and Sterne (2004).
4 A critique of CRA is that it focuses too narrowly on so-called “brown” issues, at the expenseof forestry, fisheries, and other national resource areas. This emphasis reflects the natureof the sponsoring agencies, however, rather than the underlying methodology.
5 Portions of this section are drawn from Morgenstern, Shih, and Sessions (2000).
6 Many studies in OECD countries have assessed the risks associated with environmentalproblems, and many have tried to compare risks across several environmental issues. Aparticularly sophisticated series of studies compares the risks associated with differentenergy technologies (Hirschberg, Spiekernan, and Dones 1998). No CRAs—defined ascomparative assessments of most or all of the environmental problems facing a geographicarea, the use of risk as the metric for comparison, and priority setting as the fundamentalpurpose of the work—appear to have been conducted in OECD countries outside theUnited States, however (for related work, see Navrud and Ready 2002).
7 In some cases the results have been transformed to make them compatible with thisreporting format. For example, both Unfinished Business and the Taiwan (China) studydeveloped separate rankings for cancer and noncancer health risks. The riskiest individualcategory was chosen as the overall risk category to combine them into a single health riskranking. Thus, gas stations, which were ranked as high in terms of cancer risk but mediumfor noncancer risks, were given an overall ranking of high.
TOWARD ENVIRONMENTAL PRIORITY SETTING IN DEVELOPMENT 89
8 For a fuller discussion of these issues, in Sarraf and others (2002, 2004) and Arrow andothers (1996).
9 Although not a universally accepted practice, DALYs lost to morbidity are sometimesvalued in relation to GDP per capita to estimate the upper value of damages. Such calcu-lations account for the cost of pain and suffering of illness, which is not included in thecost-of-illness approach.
10 The authors of Clear Water, Blue Skies (World Bank 1998), which developed estimates ofenvironmental damages in China, scaled a U.S.–based estimate of $3 million per statis-tical life to a level applicable to China by multiplying the ratio of average per capita incomesin the two countries ($500/$25,000). The resulting estimate was $60,000 per statistical lifein urban areas and $31,800 in rural areas of China.
11 Because the elderly (and the very young) are at greatest risk from air pollution, somestudies have attempted to adjust willingness-to-pay estimates for differences in life yearslost by mortality from air pollution and the overall mortality risks for which the willingness-to-pay estimate was originally calculated. For a discussion of the issue, including a rationalefor not making such adjustments, see Alberini and others (2004).
12 The human capital approach—which typically yields lower estimates than the willingness-to-pay approach—has been applied to child mortality by estimating the present value oflifetime income, approximated by GDP per capita, typically for income for people age 20–65.
13 Coastal zone degradation was not studied in China, Colombia, or Pakistan.
References
Alberini, Ana, Maureen Cropper, Alan Krupnick, and Nathalie B. Simon. 2004. “Does the Valueof a Statistical Life Vary with Age and Health Status? Evidence from the U.S. and Canada.”Journal of Environmental Economics and Management 48 (1): 769–92.
Arrow, Kenneth, Maureen L. Cropper, George C. Eads, Robert W. Hahn, Lester B. Lave, RogerG. Noll, Paul R. Portney, Milton Russell, Richard Schmalensee, V. Kerry Smith, and RobertN. Stavins. 1996. Benefit-Cost Analysis in Environmental, Health, and Safety Regulation: AStatement of Principles. American Enterprise Institute, the Annapolis Center, and Resourcesfor the Future, Washington, DC.
Blackman, Allen, Richard D. Morgenstern, Libardo Montealegre Murcia, and Juan Carlos Garciade Brigard. 2005. Review of the Efficiency and Effectiveness of Colombia’s EnvironmentalPolicies. Resources for the Future, Washington, DC.
Feldman, D. L., P. Ralph, and A. H. Rulth. 1996. “Environmental Priority-Setting in U.S. Statesand Communities: A Comparative Analysis.” Energy Environment and Resource Center,University of Tennessee, Knoxville.
Ghosh, Bose & Associates. 1997. “Environmental Management Plan of Asansol-DurgapurIndustrial Corridor.” Department of Environment, Government of West Bengal, and WestBengal Pollution Control Board. Report prepared with support from the EnvironmentalHealth Project and the U.S. Agency for International Development, Regional Housing andUrban Development Office, West Bengal, India.
Harrington, Winston, Richard Morgenstern, and Thomas Sterner, eds. 2004. ChoosingEnvironmental Policy: Comparing Instruments and Outcomes in the United States and Europe.Washington, DC: Resources for the Future Press.
Hirschberg, S., G. Spiekernan, and R. Dones. 1998. “Project GaBE: Comprehensive Assessmentof Energy Systems: Severe Accidents in the Energy Sector.” PSI Bericht Nr. 98–16, Vienna.
90 STRATEGIC ENVIRONMENTAL ASSESSMENT FOR POLICIES
ICLEI (International Council for Local Environmental Initiatives). 1995. “Risk-Based Planning:The Troyan Environmental Action Project.” Case Study 29, Participatory Priority Setting.Report prepared for the United Nations and the Commission on Sustainable Development,Toronto, April.
ISC (Institute for Sustainable Communities). 1997. “Polish National Environmental ActionProgram Pilot Project.” Report prepared for the U.S. Environmental Protection Agency,the Charles Stewart Mott Foundation, and the German Marshall Fund. Montpelier, VTand the municipalities of Radom and Elk, Poland, Montpelier, VT.
Keane, Susan E., and Jeannie Cho. 2000. “Comparative Risk Assessment in DevelopingCountries.” Pollution Management in Focus (January), World Bank, Washington, DC.
Konisky, D. M. 1999. “Comparative Risk Projects: A Methodology for Cross-Project Analysisof Human Health Risk Rankings.” Discussion Paper 99–46, Resources for the Future,Washington, DC.
Larsen, Bjorn. 2004. “Cost of Environmental Damage: A Socio-Economic and EnvironmentalHealth Risk Assessment.” Final report to the Ministry of Environment, Housing and LandDevelopment, Republic of Colombia.
Leonard, Herman B., and Richard J. Zeckhauser. 1986. “Cost-Benefit Analysis Applied to Risks:Its Philosophy and Legitimacy.” In Values at Risk, ed. D. MacLean. Totowa, NJ: Rowmanand Allanheld.
Morgenstern, Richard D., ed. 1997. Economic Analyses at EPA: Assessing Regulatory Impact.Washington, DC: Resources for the Future.
Morgenstern, Richard D., and Stuart L. Sessions. 1988. “EPA’s Unfinished Business: WeighingEnvironmental Risks.” Environment 30 (6): 14–17, 34–39.
Morgenstern, Richard D., Jhih-Shyang Shih, and Stuart L. Sessions. 2000. “Comparative RiskAssessment: An International Comparison of Methodologies and Results.” Journal ofHazardous Materials 78: 19–39.
Navrud, Ståle, and Richard C. Ready. 2003.“Valuing Cultural Heritage: Applying EnvironmentalValuation Techniques to Historic Buildings, Monuments and Artifacts.” Journal of CulturalEconomics 27 (3–4): 287–90.
Pope, C. Arden III, Richard T. Burnett, Michael J. Thun, Eugenia E. Calle, Daniel Krewski,Kazuhiko Ito, and George D. Thurston. 2002. “Cardiopulmonary Mortality, and Long-Term Exposure to Fine Particulate Air Pollution” Journal of the American MedicalAssociation 287 (5): 1132–41.
Sarraf, Maria. 2004.”Assessing the Costs of Environmental Degradation in the Middle East andNorth Africa Region.” Environment Strategy Note 9, World Bank, Washington, DC.
Sarraf, Maria, Katharine Bolt, and Bjorn Larsen. 2004. Syrian Arab Republic Cost Assessment ofEnvironmental Degradation. World Bank/Mediterranean Environmental TechnicalAssistance Program (METAP), February 9, Washington, DC.
Sarraf, Maria, and Bjorn Larsen. 2002. Arab Republic of Egypt: Cost Assessment of EnvironmentalDegradation. Sector Note 25175–EGT, World Bank/Mediterranean EnvironmentalTechnical Assistance Program (METAP), Washington, DC.
Sarraf, Maria, Bjorn Larsen, and Marwan Owaygen. 2004. Cost of Environmental Degradation: TheCase of Lebanon and Tunisia. Environment Department Paper 97, World Bank/MediterraneanEnvironment Technical Assistance Program (METAP),Washington, DC.
Sarraf, Maria, Marwan Owaygen, Giovanni Ruta, and Lelia Croitoru. 2005. Islamic Republic of Iran:Cost Assessment of Environmental Degradation. Report 32043–IR, World Bank/MediterraneanEnvironmental Technical Assistance Program (METAP),Washington, DC.

TOWARD ENVIRONMENTAL PRIORITY SETTING IN DEVELOPMENT 91
Sessions, S., A. Zucchetti, M. Alegre, A. Lanao, and L. Benson. 1997. “Proyecto Ecoriesgo:Ranking Environmental Health Risks in Metropolitan Lima, Peru.” Report ANE-0178-Q-00-1047-00, prepared for the U.S. Agency for International Development/Peru by Projectin Development and the Environment, Washington, DC.
Slovic, Paul. 1987. “Perception of Risk.” Science 236 (April 17): 280–85.
Smith, K. R. 1988. “The Risk Transition.” Working Paper 10, Environment and Policy Institute,East-West Center, Honolulu, Hawaii.
USAID (U.S. Agency for International Development. 1990. “Ranking Environmental HealthRisks in Bangkok, Thailand.” Report prepared for USAID Office of Housing and UrbanPrograms under contract PDC–1008–I–00–9066–00.
———. 1993. “Environmental Health Assessment: A Case Study Conducted in the City ofQuito and the County of Pedro Moncayo, Pichincha Province, Ecuador.” WASH Reprint:Field Report 436, Environmental Health Division, Office of Nutrition and Health.Washington, DC.
———. 1994. “Comparing Environmental Health Risks in Cairo, Egypt.” USAID Project398–0365, Washington, DC.
———.1995. “A Report on Comparative Environmental Risk Assessment of Ahmedabad City.”Report prepared under contract 386-1008-0-00-4286 by the Centre for EnvironmentalPlanning and Technology for the USAID Regional Housing and Urban DevelopmentOffice, Washington, DC.
———. 1996.“Comparative Risk Assessment for Central America: Executive Summary.” ReportANE-0178-Q-00-1047–00, prepared for USAID/Guatemala by Project in Developmentand the Environment and Chemonics International, Washington, DC.
U.S. EPA (United States Environmental Protection Agency). 1987. Unfinished Business: AComparative Assessment of Environmental Problems. Office of Policy Analysis,Washington, DC.
———. 1990b. Reducing Risk: Setting Priorities and Strategies for Environmental Protection.Science Advisory Board, Washington, DC.
———. 1992. “Project Silesia: Comparative Risk Screening Analysis.” Report prepared for theTechnical Workgroup, Ostrava (former Czechoslovakia) and the U.S. EnvironmentalProtection Agency by Industrial Economics, Inc., and Sullivan Environmental Consulting,Washington, DC.
———. 1994. “Project Silesia: Comparative Risk Screening Analysis.” Report prepared for theTechnical Workgroup, Katowice, Poland, the U.S. Environmental Protection Agency byIndustrial Economics, Inc., and Sullivan Environmental Consulting, Washington, DC.
———. 1997. The Benefits and Costs of the Clean Air Act: 1970 to 1990. Office of Air andRadiation/Office of Policy, Washington, DC.
World Bank. 2005. “Evaluacion ambiental estrategica del sector turismo en Mexico.” Studypublished in coordination with Environmental Resources Management and the Ministryof Tourism, Mexico, June 30.
Bibliography
Becker, H. 1997. Social Impact Assessment. London: University College Press.
Baiocchi, Gianpaolo, Patrick Heller, Shubham Chaudhuri, and Marcelo Kunrath Silva. 2005.“Evaluating Empowerment: Participatory Budgeting in Brazilian Municipalities.” WorldBank Policy Research Working Paper, Washington, DC.

92 STRATEGIC ENVIRONMENTAL ASSESSMENT FOR POLICIES
Beddies, S., and H. De Soto. 2005. Poverty and Social Impact Analysis (PSIA) of the Decentralizationand Water Sector Privatization in Albania. World Bank, Social Development Department,Washington, DC.
Bianchi, R., and S. Kossoudji. 2001. Interest Groups and Organizations as Stakeholders. SocialDevelopment Paper 35, World Bank, Washington, DC.
Blackburn, James, Robert Chambers, and John Gaventa. “Mainstreaming Participation inDevelopment.” World Bank, Operations Evaluation Department, Washington, DC.
Brinkerhoff, D., and B. L. Crosby. 2002. Managing Policy Reform: Concepts and Tools for Decision-Makers in Developing and Transition Countries. Bloomfield, CT: Kumarian Press.
Chambers, R. 1983. Putting the First Last. London: Longman.
Dedu, G., and G. Kajubi. 2005. “The Community Scorecard Process in The Gambia.” SocialDevelopment Note 100, World Bank, Washington, DC.
DeWind, Josh, and David H. Kinley. 1988. Aiding Migration: The Impact of InternationalDevelopment Assistance on Haiti. Boulder, CO: Westview Press.
Dulamdary, E., M. Shah, and R. Mearns, with B. Enkhbat and L. Ganzaya. 2001. “Mongolia:Participatory Living Standards Assessment.” Report prepared for the Donors ConsultativeGroup Meeting, Paris, May 15–16. National Statistics Office, Ulaanbaatar, Mongolia, andWorld Bank, Washington, DC.
Feldman, M., and A. Khademian. 2000. “Management for Inclusion: Balancing Control withParticipation.” International Public Management Journal 3 (2): 149–68.
———. 2005. “Inclusive Management: Building Relationships with the Public.” School forPublic and International Affairs, Virginia Tech, Blacksburg, VA.
Finsterbusch, K., J. Ingersoll, and L. Llewellyn. 1990. Methods for Social Analysis in DevelopingCountries. San Francisco: Westview Press.
Goldman, L. R., ed. 2000. Social Impact Analysis: An Applied Anthropology Manual. Oxford:Berg Press.
Government of Mongolia. 2003. Economic Growth Support and Poverty Reduction Strategy.Ulaanbaatar.
Grindle, M. S., and J. W. Thomas. 1991. Public Choices and Policy Change: The Political Economyof Reform in Developing Countries. Baltimore, MD: Johns Hopkins University Press.
Haney, M., M. Shkaratan, V. Kabalina, V. Paniotto, and C. Rughinis. 2003. Mine Closure and ItsImpact on the Community: Five Years after Mine Closure in Romania, Russia and Ukraine.Social Development Paper 42, World Bank, Washington, DC.
Holland, Jeremy, and James Blackburn. 1998. Whose Voice? Participatory Research and PolicyChange. Intermediate Technology Development Group, London.
Junge N., T. Pushak, J. Lampietti, N. Dudwick, and K. Van den Berg. 2004. Sharing Power: LessonsLearned from the Reform and Privatization of Moldova’s Electricity Sector. World Bank PolicyResearch Working Paper, Washington, DC.
Kanji, N., and S. Ware. 2002. “Trade Liberalization, Poverty and Livelihoods: Understanding theLinkages.” Department for International Development, African Policy and EconomicDepartment, London.
Keener, S., and S. Banerjee. 2006. “Ghana: Electricity Tariff Reform.” In Poverty and SocialAnalysis, ed. A. Dani. Washington, DC: World Bank.
Kvam, R., and H. Nordang. “The Jharkand Participatory Forest Management Project: SocialAssessment for Inclusion, Cohesion, and Accountability.” World Bank, Washington, DC.
92 STRATEGIC ENVIRONMENTAL ASSESSMENT FOR POLICIES

Leitner, Kerstin. 2005. “Heath and Environment: A View from WHO.” In Environment Matters.Washington, DC: World Bank.
Marquetti, Adalmir. 2000.“Participatory Budgeting in Porto Alegre.” Indicator S A (Johannesburg)17 (4): 71–78.
Mearns, R. 2004. “Sustaining Livelihoods on Mongolia’s Pastoral Commons: Insights from aParticipatory Poverty Assessment.” Development and Change 35 (1): 107–39.
Menegat, Rualdo. 2002. “Participatory Democracy and Sustainable Development: IntegratedUrban Environmental Management in Porto Alegre, Brazil.” Environment and Urbanization14 (2): 181–206.
Menegat, Rualdo, Maria Luiza Porto, Clovis Carlos Carrazo, and Luís Alberto Dávila Fernandes.1998. Environmental Atlas of Porto Alegre. Porto Alegre, Brazil: Edufrgs.
Narayan, D., R. Chambers, M. Shah, and P. Petesch. 2001. Voices of the Poor: Crying Out forChange. Washington, DC: World Bank.
National Statistics Office of Mongolia, and World Bank. 2001. Mongolia Participatory LivingStandards Assessment 2000. Ulaanbaatar.
Norton, A., B. Bird, K. Brock, M. Kakande, and C. Turk. 2001. A Rough Guide to ParticipatoryPoverty Assessments: An Introduction to Theory and Practice. London: ODI Publications.
Ostro, Bart. 1994. “Estimating the Health Effects of Air Pollutants: A Methodology withApplication to Jakarta.” Policy Research Working Paper 1301, World Bank, Washington, DC.
Paul, S. 2002. Holding the State to Account: Citizen Monitoring in Action. Bangalore: Books forChange.
Pollard, Amy. 2005. How Civil Society Organisations Use Evidence to Influence Policy Processes:An Annotated Bibliography. Overseas Development Institute, London.
Public Affairs Center. 2002. The State of Karnataka’s Public Services: Benchmarks for the NewMillennium. Bangalore.
Rawls, John. 1971. A Theory of Justice. Cambridge, MA: Belknap Press of Harvard UniversityPress.
Robb, C. 2000a. Can the Poor Influence Policy? Participatory Poverty Assessments in the DevelopingWorld. Washington, DC: International Monetary Fund and World Bank.
———. 2000b. “How the Poor Can Have a Voice in Government Policy?” Finance andDevelopment 37 (4). International Monetary Fund, Washington, DC.
———. 2003.“Poverty and Social Impact Analysis: Linking Macroeconomic Policies to PovertyOutcomes: Summary of Early Experiences.” IMF Working Paper WP/03/43, InternationalMonetary Fund, Washington, DC.
Robb, C., and A. Scott. 2001. “Reviewing Some Early Poverty Reduction Strategy Papers inAfrica.” IMF Policy Discussion Paper PDP/01/5, International Monetary Fund,Washington, DC.
Salmen, L. 1995.“Listening to the People.” Finance and Development 32 (2): 44–48. InternationalMonetary Fund, Washington, DC.
———. 2002. Beneficiary Assessment: An Approach Described. Social Development Paper 10,World Bank, Washington, DC.
Salmen, L., and M. Amelga. 1998. Implementing Beneficiary Assessment in Education: A Guidefor Practitioners. Social Development Paper 25, World Bank, Washington, DC.
Salmen, L., and E. Kane. 2006. Bridging Diversity: Participatory Learning for ResponsiveDevelopment. Washington, DC: World Bank.
TOWARD ENVIRONMENTAL PRIORITY SETTING IN DEVELOPMENT 93

94 STRATEGIC ENVIRONMENTAL ASSESSMENT FOR POLICIES
Shah, P., and D. Youssef. 2002. “Voices and Choices at a Macro Level. Participation inCountry-Owned Poverty Reduction Strategies.” Action Learning Program DisseminationSeries 1, World Bank, Social Development Department, Washington, DC.
Subbarao, Kalanidhi, Kene Ezemenari, Aniruddha Bonnerjee, Soniya Carvalho, Alan Thompson,Carol Graham, and Jeanine Braithwaite. 1997. Safety Net Programs and Poverty Reduction:Lessons from Cross-Country Experience. Washington, DC: World Bank.
Thindwa, J., C. Monico, and W. Reuben. 2003. “Enabling Environments for Civic Engagementin PRSP Countries.” Social Development Note 82, World Bank, Washington, DC.
Tikare, S., D. Youssef, P. Donnelly-Roark, and P. Shah. 2001. “Organizing ParticipatoryProcesses in the Poverty Reduction Strategy Process.” In PRSP Sourcebook. Washington,DC: World Bank.
Turk, C. 2001. “Linking Participatory Poverty Assessments to Policy and Policy Making:Experience from Vietnam.” Policy Research Working Paper 2526, World Bank,Washington, DC.
Wagle, S., and P. Shah. 2003. “Porto Alegre, Brazil: Participatory Approaches in Budgetingand Public Expenditure Management.” Social Development Note 71, World Bank,Washington, DC.
Wagle, S., J. Singh, and P. Shah. 2004. “Citizen Report Card Surveys: A Note on the Conceptand Methodology.” Social Development Note 91, World Bank, Washington, DC.
Whittingham, E., J. Campbell, and Philip Townsley. Poverty and Reefs. London: Department forInternational Development.
World Bank. 1998. Clear Water, Blue Skies. Washington, DC: World Bank.
———. 2001a. Filipino Report Card on Pro-Poor Services. Washington, DC.
———. 2001b. Making Sustainable Commitments: An Environment Strategy for World Bank.Washington, DC: World Bank.
———. 2002. World Development Report 2003: Sustainable Development in a Dynamic World.Washington, DC: World Bank.
———. 2003a. Cornerstones for Conservation: World Bank Assistance for Protected Areas.Washington, DC.
———. 2003b. Indonesia Kerinci Seblat Integrated Conservation and Development Project:Implementation Completion Report. Washington, DC.
———. 2003c. A User’s Guide to Poverty and Social Impact Analysis. Washington, DC: WorldBank. http://www.worldbank.org/poverty/psia/index.htm.
———. 2004a. “Community Scorecard Process: A Short Note on the General Methodology forImplementation.” World Bank, Washington, DC.
———. 2004b. Responsible Growth for the New Millennium. World Bank: Washington, DC.
———. 2005. Indonesia Coral Reef Rehabilitation and Management Project (COREMAP):Implementation Completion Report. East Asia and Pacific Region, Washington, DC.
World Bank, and DFID (Department for International Development). 2005. Tools for Institutional,Political and Social Analysis (TIPS) in Poverty and Social Impact Analysis (PSIA): A Sourcebookfor Commissioners and Practitioners, vol. 1. Washington, DC, and London.
World Health Organization. 2002. World Health Report. Geneva: WHO.
Zeckhauser, Richard J. 1981. “Preferred Policies When There Is Concern for Probability ofAdoption.” Journal of Environmental Economics and Policy 8 (3): 215–37.
IN MANY COUNTRIES, the most vulnerable often have the least influence onpolicy formulation, even if they are the most affected by policies. This has begunto change as governments and donors have developed tools and opened up policy-formulation processes to enable greater public participation, including that of themost vulnerable. To increase transparency and improve governance, an enablingenvironment is required that ensures that citizens participate in natural resourcemanagement policy making and implementation and contribute to the manage-ment of resource allocation.
Participatory approaches have been used at the project level for some time.Their use for policy analysis is more recent. Policy formulation was consideredtoo technical for most people, but as governments and donors adopted partici-patory processes more generally, they found that people have relevant knowledgeand can make useful contributions to policy. This progression to the policy levelis a logical extension of giving the most vulnerable increasing voice and partici-pation at the project level.
C H A P T E R 5
Giving the Most Vulnerable a VoiceCaroline Kende-Robb and Warren A. Van Wicklin III
95
Caroline Kende-Robb is a sector manager in the Social Development Department at theWorld Bank. Warren A. Van Wicklin III is an international development consultant. Theauthors thank Robin Mearns for inputs to the Mongolia case, Andre Herzog for inputs toBrazil example, and Sean Doolan for inputs on environmental governance.

Shifting environmental considerations to the policy level has improved the abilityto generate a better range of options from an environmental perspective. Shiftingparticipation to the policy level can have similar benefits. Rather than providing inputabout a specific dam, for example, citizens can help shape regional or national waterand energy strategies, including demand management and alternative sources ofwater and energy supply. Instead of mitigating impacts through restrictions on theuse of natural resources in protected areas, citizens can help formulate policies oncommon property resources, such as comanagement and sustainable use.
Governance over the environment and natural resources urgently needsimprovement. Changes in patterns of natural resource exploitation (includingglobal market and political linkages, international concerns along the value chain,and shifting national institutional and political perspectives) have created socialtensions at the local level. Increasing climatic variability exacerbates many of thesepressures. The equity and transparency of revenue sharing from natural resourcesare often highly contested, and conflicts between communities, the private sector,and the state over access to natural resources are escalating. Much of the conflictand depletion of natural resources can be traced to poor management of naturalresources, weak environmental protection, and a lack of voice for those mostaffected. In many countries the sustainability of the natural resource sectors andprospects for community stability and economic growth are put at risk by theabsence of effective regulatory institutions, by weak mechanisms for citizen voice,and by indecisive leadership on natural resources and the environment. Buildingmechanisms and institutions that increase citizen voice can help reduce socialtensions and conflicts associated with natural resource and environmental manage-ment and revenue allocation.
Studies show that by giving the most vulnerable a voice, policy makers are betterable to understand the synergies between environmental goals, economic growth,and poverty reduction (World Bank 2001). The results of consultative and partici-patory processes highlight that livelihood strategies adopted by vulnerable groupsare inextricably linked to the environment: degraded environments increase poverty,while poverty often degrades the environment (World Bank and DFID 2005).
This chapter reviews recent experience on how vulnerable groups can be givengreater voice in policy formulation, especially formulation of policies with envi-ronmental considerations. It is divided into eight main sections. The first explainswhy it is important to include vulnerable groups in policy formulation. The seconddefines people who are vulnerable from an environmental perspective. Thethird discusses the importance of an enabling environment in creating “space”for participation. The fourth identifies entry points in the policy process forincreasing voice. The fifth defines five levels of participation. The sixth describesseven common tools for amplifying the voice of vulnerable groups as well asmaking sure they are heard in the policy process. The seventh describes case studies
96 STRATEGIC ENVIRONMENTAL ASSESSMENT FOR POLICIES
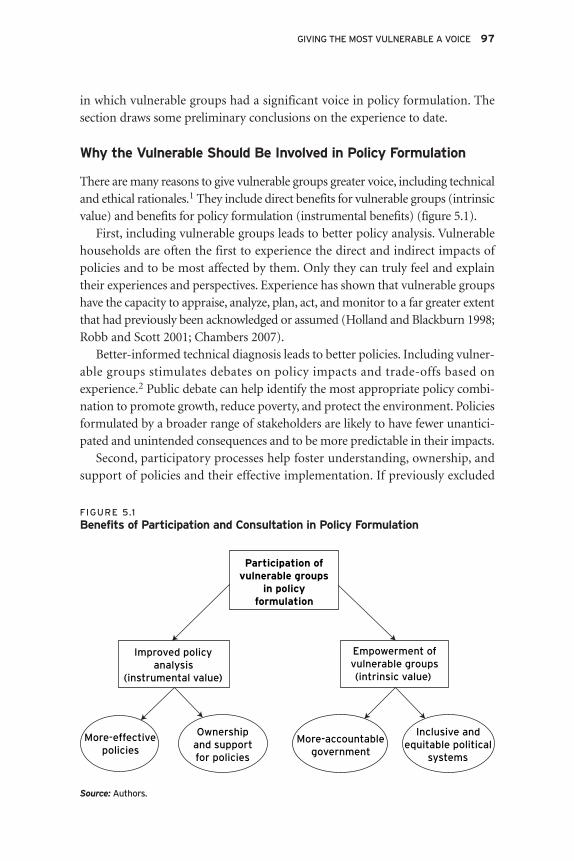
in which vulnerable groups had a significant voice in policy formulation. Thesection draws some preliminary conclusions on the experience to date.
Why the Vulnerable Should Be Involved in Policy Formulation
There are many reasons to give vulnerable groups greater voice, including technicaland ethical rationales.1 They include direct benefits for vulnerable groups (intrinsicvalue) and benefits for policy formulation (instrumental benefits) (figure 5.1).
First, including vulnerable groups leads to better policy analysis. Vulnerablehouseholds are often the first to experience the direct and indirect impacts ofpolicies and to be most affected by them. Only they can truly feel and explaintheir experiences and perspectives. Experience has shown that vulnerable groupshave the capacity to appraise, analyze, plan, act, and monitor to a far greater extentthat had previously been acknowledged or assumed (Holland and Blackburn 1998;Robb and Scott 2001; Chambers 2007).
Better-informed technical diagnosis leads to better policies. Including vulner-able groups stimulates debates on policy impacts and trade-offs based onexperience.2 Public debate can help identify the most appropriate policy combi-nation to promote growth, reduce poverty, and protect the environment. Policiesformulated by a broader range of stakeholders are likely to have fewer unantici-pated and unintended consequences and to be more predictable in their impacts.
Second, participatory processes help foster understanding, ownership, andsupport of policies and their effective implementation. If previously excluded
GIVING THE MOST VULNERABLE A VOICE 97
Improved policyanalysis
(instrumental value)
Empowerment ofvulnerable groups(intrinsic value)
More-effectivepolicies
Ownershipand supportfor policies
More-accountablegovernment
Inclusive andequitable political
systems
Participation ofvulnerable groups
in policyformulation
FIGURE 5.1
Benefits of Participation and Consultation in Policy Formulation
Source: Authors.
vulnerable groups are given a sufficient role in policy formulation, they are morelikely to accept the results of those processes, less likely to resist them, and perhapsmore likely to support those policies if they have sufficient incentives to do so(Blackburn, Chambers, and Gaventa 2000).
Third, participatory policy formulation helps marginalized and vulnerablegroups develop a relationship with government and other stakeholders.3 More-equitable, more-inclusive political systems are promoted through an appreciationof the varied needs of all groups within society. There is growing recognition thatcitizens have an important role to play in enhancing the accountability of publicofficials and the private sector and in reducing corruption and the leakage offunds. Social accountability has become an attractive approach for improvinggovernance processes, service delivery outcomes, and resource allocation decisions(see Ackerman 2005).4 Over the past decade, numerous examples have emergedthat demonstrate how citizens can make their voices heard and make the publicand private sectors more responsive and accountable. In many countries thecapacity of civil society needs to be strengthened to ensure that citizens under-stand their rights and obligations, build stronger partnerships, participate inlocal- and central-level policy-making processes, and monitor the delivery ofservices of public and private sector institutions.
Fourth, participation contributes to more-accountable government. Theaccountability of institutions is strengthened; citizens, including vulnerable groups,are better informed about government commitments; and governments are heldaccountable to their constituencies for performance. Building the role and capacityof nonstate institutions can help counterbalance the power of the state.
Fifth, citizens are empowered by their participation in policy formulation andimplementation. By helping shape policies to make them more relevant andresponsive to their needs, they no longer feel as vulnerable, insecure, or power-less. They become mobilized and active citizens. Participation in policy formulationoften leads to other actions that improve their position, such as developing part-nerships with like-minded stakeholders. Empowerment of vulnerable groups andaccountability also help prevent elite capture of the policy process.
Last, there is an ethical argument for giving the excluded a voice. It is only fairthat those who are likely to be most severely affected have a voice. Policies shouldaspire to have fair, if not equitable, effects.5 They should be crafted so that theirrationale is independent of any one stakeholder’s position and can be justified onbehalf of society as a whole.
Definition of the Vulnerable and How They Are Affected
Policy analysis has traditionally focused on a statistical approach to poverty basedon indicators of income, health, and education. Poverty itself was measured by
98 STRATEGIC ENVIRONMENTAL ASSESSMENT FOR POLICIES

income. Studies show that an approach dominated by economic analysis fails tocapture many dimensions of poverty and that a multidisciplinary approach candeepen understanding of the poor and vulnerable (Robb 2000).
The World Bank’s Voices of the Poor study helped elaborate a multidimensionaldefinition of poverty focused on vulnerability, physical and social isolation,insecurity, lack of dignity and self-respect, lack of access to information, distrustof state institutions, and powerlessness to defend one’s interests or change things(Narayan and others 2001). These dimensions are often interlinked. Many peopleare at the intersection of multiple forms of vulnerability. Poverty alone is not suffi-cient to define vulnerable groups.
The poor are not a static group. Economic transition and shocks throw peopleinto poverty and expose their vulnerability. Former socialist economies createdvulnerability as people lost guaranteed employment and resorted to naturalresource–based livelihoods that led to environmental degradation. Many Mongolianstate employees who lost their jobs, for example, went into goat herding, thenation’s leading occupation. The sudden unmanaged increase in livestock herdsput unsustainable pressures on pasture land (Mearns 2004). The East Asian finan-cial crisis reversed decades of impressive poverty reduction, throwing many peopleback into poverty. In the struggle to survive economic shocks, many turned tocommon property resources to sustain themselves, accelerating deforestation andother forms of environmental degradation (World Bank 2003b).
Maximizing income may be less of a priority to vulnerable groups than securingtheir livelihoods and reducing their vulnerability (Chambers 1983). For liveli-hoods to be sustainable, they need to be resilient to shocks without underminingthe natural resource base that supports them (Kanji and Ware 2002). Vulnerabilityappears to be a more salient concept than poverty. It is a broader and more inclu-sive concept. It may also be more relevant, especially in terms of policies that haveenvironmental consequences.
Some demographic and social groups are vulnerable for reasons other thaneconomic factors. Ethnic minorities and indigenous people, for example, areoften vulnerable because of exclusion or domination by the majority ethnicgroup. Women, children, and the elderly are often vulnerable even when theyare not poor. Women, too, often do lack access to or control over resources anddiscrimination in societies that exclude them from decision making. In the extrac-tive industries sector, for example, most benefits (employment, income, royalties,and infrastructure) tend to accrue to men, whereas negative impacts (culturaldisruption, social stress, environmental harm, and domestic violence) affectwomen and children.
As defined here, people are vulnerable either because they depend on the envi-ronment for their livelihoods or because they are otherwise significantly affectedby environmental degradation.
GIVING THE MOST VULNERABLE A VOICE 99

Where economic and environmental vulnerability are mutually reinforcing, thesefactors are often interconnected. Examples include the following:■ Natural resource management (forests, water, land, and other natural resources) ■ Environmental health (outdoor and indoor air pollution, waterborne diseases,
occupational health and safety, toxins, and other sources of risk)■ Waste management (solid waste, water pollution)■ Vulnerability to natural disasters (short term) and climate change (long term).
Natural Resource Management
Stronger governance in the natural resources and environment sectors is importantto ensure that these sectors continue to contribute responsibly to future patternsof inclusive growth. Strengthening governance requires effective regulatory mech-anisms and political commitment to manage the environmental resource baseand control adverse environmental impacts that affect livelihoods and levelsof human development. It also requires more-open access to environmentalinformation and analyses, expressed in terms that are relevant to other stake-holders, accompanied by mechanisms that enable broader dialogue across multiplestakeholders down to the local level.Vulnerability in the context of natural resourcesoccurs when livelihoods are threatened by a change in environmental conditionsof natural resources or in access to these resources. The poor are often dispropor-tionately affected by environmental degradation (World Bank 2001).
Globally, 1.3 billion people live on fragile lands—arid zones, slopes, wetlands,and forests—that cannot sustain them (World Bank 2002). The majority of theworld’s poor and vulnerable depend largely on agriculture for their livelihood. Asnatural resources become scarce or degraded, their incomes and livelihoods arethreatened. Increasing desertification has increased the vulnerability of millionsof pastoralists, especially in Africa. As water supplies become less reliable, poorfarmers are often the most vulnerable: wealthier farmers can often afford wellsand irrigation systems, but poor farmers are dependent on rainfed agriculture.
Sometimes vulnerable groups may be a particular set of stakeholders who havelimited influence. About 60 million people in the world (mainly indigenous andtribal groups) depend almost entirely on forests; another 350 million people wholive within or adjacent to dense forests depend on them to a high degree for subsis-tence and income (World Bank 2004b). Of the world’s 1 billion extreme poor—thoseliving on less than a dollar a day—90 percent are significantly dependent on forestresources for their income (World Bank 2002). Deforestation or use of these forestsfor other purposes threatens the livelihoods of these groups. Logging, mining,and commercial agricultural interests are usually more environmentally destructivethan the activities of the local poor, who have practiced sustainable forestry,farming, hunting, and gathering for generations. Their lack of political andeconomic power means their interests are often subverted to wealthier and more
100 STRATEGIC ENVIRONMENTAL ASSESSMENT FOR POLICIES
powerful interests. Vulnerable groups need greater voice for both economic andenvironmental reasons. The creation of protected areas, for example, should protectthe livelihoods and property rights of people living within those areas (WorldBank 2003a).
The causal linkage between economic and environmental vulnerability oftenworks in the other direction as well, with poverty causing environmental degra-dation and exacerbating vulnerability in a vicious circle. In many poor countries,the best agricultural land is owned by the wealthiest farmers. Many poor farmershave been forced to find farmland in marginal areas, such as steeply sloped landthat is unsuitable for mechanized agriculture. Farming steeper slopes, especiallyfor unsuitable food crops, accelerates their erosion and degradation. In Haiti thispractice led to massive environmental degradation, impoverishment, and migra-tion (DeWind and Kinley 1988).
The livelihoods of other people who depend on natural resources are alsoadversely affected by environmental impacts. Artisanal fishers suffer as coastalareas and coral reefs are overfished, become excessively polluted, or are otherwisedegraded (Whittingham, Campbell, and Townsley 2003). In Indonesia cyanideand dynamite fishing has destroyed or badly damaged coral reefs that supportfish populations. Many of the most destructive fishing practices are engaged innot by the local poor but by wealthier outsiders, who then move on to new fishingareas once an area has been destroyed and fished out. Local fishers, with theirneed for more sustainable fishing practices, are often the strongest advocates forenvironmentally sensitive fishing regulations and creation of protected marineareas (World Bank 2005).
Environmental Health
Vulnerability in the context of environmental health occurs when people aresusceptible to increased health risks associated with environmental pollution.These risks disproportionately affect the poor and children under five.
Lack of access to clean water and sanitation and indoor air pollution are thetwo main causes of illness and death in developing countries. Both problemsprincipally affect children under the age of five (as reflected in high infant mortalityrates linked with diarrhea, pneumonia, acute respiratory infections, and water-borne diseases [WHO 2002]).
Increased risk of waterborne diseases caused by inadequate water quality,sanitation, and hygiene is also a major cause of illnesses and death in developingcountries (WHO 2002). Diarrhea causes 1.7 million deaths a year and accountsfor about a third of deaths among children under the age of five in developingcountries (WHO 2002). Worldwide an estimated 3 million people a year die fromwater-related diseases (World Bank 2001). More than 90 percent of health effectsare experienced by children under age five.
GIVING THE MOST VULNERABLE A VOICE 101
Indoor air pollution comes from the burning of fuel wood for cooking andheating. Biomass is the primary source of energy for about 2.5 billion people (IEA2006). It causes acute respiratory infections in children and increased risk ofchronic pulmonary disease in women. In developing countries with high mortalityrates, indoor air pollution is the fourth leading cause of illness and death (WHO2002). Nearly 2 million children and women die every year from diseases causedby indoor air pollution (World Bank 2001), most of them from poor families(wealthier households use cleaner fuels).
Substantial evidence from around the world indicates that outdoor urban airpollution has significant negative impacts on public health and results in prema-ture death, chronic bronchitis, and respiratory disorders (Ostro 1994). The burdenof disease is lower than for indoor air pollution, however (WHO 2002). Even so,1 million people a year in developing countries die prematurely because of urbanair pollution, a disproportionate number of them children under five (Leitner 2005).
Waste Management
Vulnerability in the context of waste management occurs when people are suscep-tible to increased health risk. Where the increased health risk comes from toxicchemicals leaching into the soil and affecting water supplies, people living nearthe waste dumps will be principally affected. Waste pickers are directly affectedby vector-borne diseases.
Natural Disasters and Climate Change
Vulnerability in the context of natural disasters occurs when people’s liveli-hoods, assets, and health are adversely affected by natural disasters. Greaterclimate variability as a result of global climate change is expected to increasethe number of severe weather events over time and change the absolute level ofcertain natural resources, such as water and soil productivity, affecting bothhealth and livelihoods.
The poor are more vulnerable to natural disasters such as mudslides, tsunamis,earthquakes, and floods, for several reasons. They often live in areas that are moreprone to such disasters, such as steep hillsides, along flood channels, or in low-lying areas. Their houses are generally less sturdy and thus more easily damagedthan those of the nonpoor. They usually have less information about impendingcatastrophes and cannot avail themselves of warning systems as efficiently. Theireconomic vulnerability also places them at greater risk.
The poor are also more vulnerable to long-term environmental degradation.The poor are least able to afford mitigating or avoiding the impacts of rising sealevels, and they tend to live at lower elevations, which are more vulnerable toflooding. Some South Pacific islands are already losing land to rising sea levelsand relocating their inhabitants. Changing crop patterns are also more likely to have
102 STRATEGIC ENVIRONMENTAL ASSESSMENT FOR POLICIES

disproportionate effects on the poor, who find it expensive and more difficult toadapt to new crops, new locations, or new agricultural practices.
An informed national consituency is needed to drive potential responses toclimate change. Ensuring public debate on the impacts of climate change and adap-tation to climate change that moves beyond technical perspectives to incorporatelocal voices would help improve natural resource and environmental governance.
Creation of an Enabling Environment in Which the Vulnerable Can Be Heard
The entry points, forms of participation, and tools for providing voice for theenvironmentally vulnerable are the same as those for vulnerable groups in general.Local dimensions of environmental challenges often vary across a country.Developing mechanisms for recognizing these issues at the national level andenabling polic makers to make decentralized responses requires an enabling envi-ronment in which citizens’ voice can be heard at the policy-making level. The nextfour sections of this chapter therefore draw from the general literature on inclu-sive decision making. In fact, many of the tools were developed for use at theproject level and are therefore not even specific to policy formulation.
In chapter 3 of this volume, Feldman and Khademian present a decision-making model that has two main features: adaptive management and inclusivedecision making. Adaptive management is a model of continuous policy forma-tion. The basic idea of the model is to try something and then evaluate the outcomein order to determine what to try next. Policy is formed through a process ofexperimentation, the adoption of successful experiments and continued experi-mentation. Involving people and organizations with a wide range of perspectivesin a process of policy making and implementation is seen as legitimate and anessential outcome of inclusive management. Where traditional managementmodels may see building community capacity as a by-product of solving policyproblems, this model places capacity building in the foreground. Building capacitybecomes the primary goal, which is pursued through projects. Combining adap-tive management with the creation of an inclusive community of participationand the consequent acknowledgment and exposure of ambiguity create the inclu-sive model of policy formation (Feldman and Khademian 2000, 2005).
Directly consulting poor people does not ensure that they will have a voice ininfluencing policy formulation. Policy making is an inherently political process.Rules, legislation, traditions, networks, alliances, patronage, and bureaucraticstructures interact to form a complex and fluctuating policy environment (Grindleand Thomas 1991; Robb 2002). The political context and institutional frameworkthrough which consultation and participation take place can be built on to promotea more open process of policy formulation. Policy making is often a negotiation
GIVING THE MOST VULNERABLE A VOICE 103

between groups of unequal power and influence, in which the poor and vulnerablehave the least power. An appreciation of the unequal underlying power relationscan lead to a better understanding of how such policy choices are made and howdifferent groups are affected by them.
Inclusive decision making depends on the existence of an enabling environ-ment, which depends in large measure on the extent to which certain externalfactors assist or hinder promotion of the interests of vulnerable groups. Suchfactors include the legal and regulatory framework, the political and governancecontext, sociocultural characteristics, and economic conditions. These externalconditions in turn influence specific enabling elements that are essential to theeffectiveness of civil society as a key determinant of development. These includethe freedom of citizens to associate; their ability to mobilize financial resources tofulfill the objectives of their organizations; their ability to formulate, articulate, andconvey opinion; their access to information (necessary for their ability to exercisevoice and engage in negotiation); and the existence of spaces and rules of engage-ment for negotiation and public debate (Thindwa, Monico, and Reuben 2003).
Institutional and organizational dynamics within civil society also influencethe enabling elements. Along with the external factors, they must be the subjectof analysis if the fullest scope of constraints to giving vulnerable groups voice isto be understood. These dynamics include such factors as accountability, repre-sentation, legitimacy, institutional and organizational capacities, self-regulation,and institutional relationships across civil society groups and between civil societygroups and the state and private sector.
Entry Points for Giving Vulnerable Groups Voice
According to Feldman and Khademian (chapter 3), policy formulation is anongoing, iterative, adaptive process; participation at any stage gives voice in thenext cycle of policy making, including by affecting ongoing implementation ofthe existing policy. For this reason, participation needs to be an ongoing process,not a one-off event, such as a consultation or workshop. The entire policy processcycle presents opportunities for participation. In some contexts institutionalprocesses include specific spaces for consultation, negotiation, and debate amongdifferent stakeholders, including vulnerable groups. In many other contexts, nosuch spaces exist. In these settings participation can continuously raise issues, sothat over time the needs of vulnerable groups are taken into account throughincremental changes in a particular policy.
The policy process is not linear or coherent. In policy development and imple-mentation, change is often multidirectional, fragmented, frequently interrupted,and unpredictable. How to sequence actions, what to pay attention to, and whomto include can be hard to determine, and it can vary over the life of the policy
104 STRATEGIC ENVIRONMENTAL ASSESSMENT FOR POLICIES
cycle. Unlike projects and programs, which have clearly defined sets of activitiesand components, the boundaries for policies tend to be fuzzy, to shift over time,and to be open to interpretation. Multiple stakeholder institutional arrangementscan help build consensus in key areas of policy formulation and implementation.
There is a range of opinion about the structure of policy processes. Moreover,steps overlap and are not always in the same order. All policy processes, however,involve the following four steps (Shah and Youssef 2002):■ Analysis. Once a decision has been made to promote a new policy or reform
an existing one, a range of analyses and diagnoses is undertaken. Ideally, thefirst step is to conduct a stakeholder analysis to determine which groups maybe affected by the policy or could have an interest in shaping it. Vulnerablegroups can be directly consulted to analyze potential impacts and the impactsof past policies. Not only can vulnerable groups help develop the policy; theycan also help develop the consultation process.
■ Formulation. Once the relevant information is available, policy formulationadds operational detail to the initial policy analysis, which includes a statementof the problem, the policy goals and objectives, a framework that sketchesprograms in support of those targets, and a statement of required resources.
■ Implementation. Entry points for external participation in implementationvary, depending on the type of policy. Some sectoral policies, for example,offer opportunities for partnerships for service delivery in which externalentities may take the lead through contracting-out, delegation of authority,or community comanagement. The vulnerable should not only help developthe policy but have a role in its implementation, to ensure that the policy isimplemented as intended and that commitments are honored.
■ Monitoring and evaluation. The vulnerable can provide information to policymonitors and evaluators, and they can be consulted for their opinions, inter-pretations, and analyses. They can collaborate in joint monitoring and evaluation,or they can conduct their own independent assessments and evaluations. Theycan provide valuable data on the poverty and social impacts of policies and oninstitutional performance. They can help amend policies during implementa-tion if necessary. They feed information into policy-making processes in orderto enable policy makers to better understand the potential impacts of futurepolicies and reforms.Including vulnerable groups at various stages can be considered good-practice
policy making because it makes assumptions more explicit up front (including thepoor in ex ante analysis); monitors whether public actions and choices are working,thereby testing original assumptions and taking midcourse changes if public actionsare not succeeding (including vulnerable groups during policy implementation);assesses whether public actions were successful; and uses the information to influ-ence future policy design (including the poor in ex post evaluation).
GIVING THE MOST VULNERABLE A VOICE 105

Levels of Participation in Policy Processes
Participation ranges from information dissemination and consultation to jointdecision making (Robb and Scott 2001) (figure 5.2):■ Information dissemination is the one-way, top-down flow of information to
the public about the impacts of ongoing policies and policy diagnostics for theproposed policy or policy change. Knowledge about policies gives vulnerablegroups the opportunity to analyze and attempt to influence policies.
■ Consultation is the two-way sharing of information. It gives vulnerable groupsthe chance to share their knowledge and perspectives and to inform policymakers and other stakeholders. The very act of being consulted empowersvulnerable people, validating their knowledge.
■ Joint analysis is a process in which vulnerable groups and policy makers jointo analyze information relevant to the policy.
106 STRATEGIC ENVIRONMENTAL ASSESSMENT FOR POLICIES
Finalization of policy detailsEnactment of policy into law
Update of policy implementationInformation about proposed policy
Information
Exchange of information andpriorities relevant to proposed policy
Consultation
Preparation of feasibility studiesAnalysis of policy relevant data
Joint analysis
Negotiation of proposed policyPresentation of policy for decision
Consensus building
Decision making
Socialmobilization
Capacitybuilding
Technicalanalysis
Policyimplementationand monitoring
Revision of policyplanning process
Formalprocedures
FIGURE 5.2
Flowchart of Participatory Policy Processes
Source: Adapted from Malena, with Forster and Singh 2004.
■ Consensus-building goes beyond joint analysis to try to reach consensus onpolicy formulation through a mutually agreed interpretation of the informa-tion about the proposed policy and its anticipated impacts.
■ Shared decision making involves direct participation and partial control overpolicy decisions, including policy formulation, implementation, monitoring,and evaluation. It is the highest level of participation in policy processes. It goesbeyond giving vulnerable groups voice to giving them some measure of control.
Tools for Giving the Vulnerable Voice
A variety of tools and mechanisms is available for incorporating the voice of vulner-able groups into the policy process (table 5.1 and figure 5.3). Only a few of themost common are discussed here (for an introduction to a broader set of tools,see World Bank 2003c; Salmen and Kane 2006). Each policy process is set in apolitical, social, and cultural context that shapes which tools are most appropriate.
The first three tools—stakeholder analysis, institutional analysis, and socialimpact analysis—are often used together early in the policy process as part ofpolicy analysis or diagnosis. They give vulnerable groups voice by seeking theirviews about potential policy impacts and by making them a key target group forpolicy diagnostics.
Stakeholder Analysis
Stakeholder analysis is used to determine the interests and influence of differentgroups in relation to a policy (for more information on stakeholder analysis, seeBianchi and Kossoudji 2001). It should precede policy design and be deepenedas policy elements are elaborated.
Stakeholder analysis gives vulnerable groups voice by the following:■ Identifying how they are a relevant stakeholder group whose inputs should be
solicited and analyzed■ Seeking their input in analyzing how their views may differ from other stake-
holders and why■ Analyzing the likelihood of their participation in coalitions to support change■ Developing strategies for overcoming their opposition, such as giving them
incentives in order to win their support for policies.It was used in several World Bank–supported mine closure projects to create
a system of checks, balances, and independent assessments to ensure that all actorsfollowed the rules (Haney and others 2003).
Institutional Analysis
Institutional analysis unpacks the “black box” of decision making and implemen-tation processes to identify how vulnerable groups can be incorporated into policy
GIVING THE MOST VULNERABLE A VOICE 107
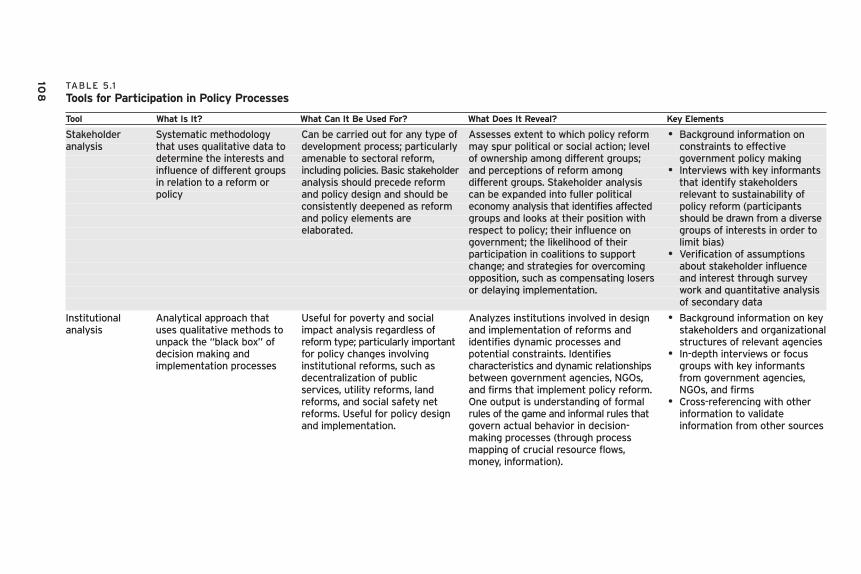
TABLE 5.1
Tools for Participation in Policy Processes
Tool What Is It? What Can It Be Used For? What Does It Reveal? Key Elements
Stakeholder Systematic methodology Can be carried out for any type of Assesses extent to which policy reform • Background information on analysis that uses qualitative data to development process; particularly may spur political or social action; level constraints to effective
determine the interests and amenable to sectoral reform, of ownership among different groups; government policy makinginfluence of different groups including policies. Basic stakeholder and perceptions of reform among • Interviews with key informants in relation to a reform or analysis should precede reform different groups. Stakeholder analysis that identify stakeholders policy and policy design and should be can be expanded into fuller political relevant to sustainability of
consistently deepened as reform economy analysis that identifies affected policy reform (participantsand policy elements are groups and looks at their position with should be drawn from a diverseelaborated. respect to policy; their influence on groups of interests in order to
government; the likelihood of their limit bias)participation in coalitions to support • Verification of assumptions change; and strategies for overcoming about stakeholder influence opposition, such as compensating losers and interest through survey or delaying implementation. work and quantitative analysis
of secondary data
Institutional Analytical approach that Useful for poverty and social Analyzes institutions involved in design • Background information on key analysis uses qualitative methods to impact analysis regardless of and implementation of reforms and stakeholders and organizational
unpack the “black box” of reform type; particularly important identifies dynamic processes and structures of relevant agenciesdecision making and for policy changes involving potential constraints. Identifies • In-depth interviews or focus implementation processes institutional reforms, such as characteristics and dynamic relationships groups with key informants
decentralization of public between government agencies, NGOs, from government agencies, services, utility reforms, land and firms that implement policy reform. NGOs, and firmsreforms, and social safety net One output is understanding of formal • Cross-referencing with other reforms. Useful for policy design rules of the game and informal rules that information to validate and implementation. govern actual behavior in decision- information from other sources
making processes (through process mapping of crucial resource flows, money, information).
108
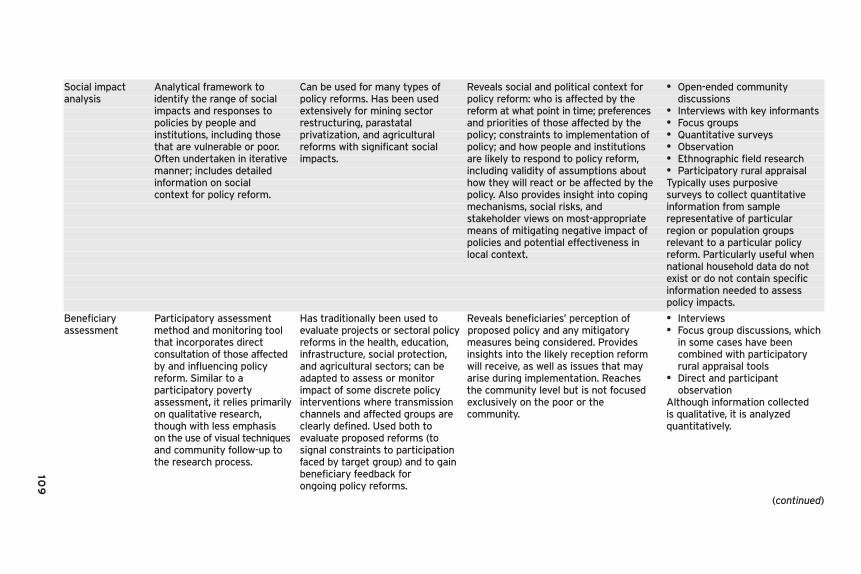
Social impact Analytical framework to Can be used for many types of Reveals social and political context for • Open-ended community analysis identify the range of social policy reforms. Has been used policy reform: who is affected by the discussions
impacts and responses to extensively for mining sector reform at what point in time; preferences • Interviews with key informantspolicies by people and restructuring, parastatal and priorities of those affected by the • Focus groupsinstitutions, including those privatization, and agricultural policy; constraints to implementation of • Quantitative surveysthat are vulnerable or poor. reforms with significant social policy; and how people and institutions • ObservationOften undertaken in iterative impacts. are likely to respond to policy reform, • Ethnographic field research manner; includes detailed including validity of assumptions about • Participatory rural appraisalinformation on social how they will react or be affected by the Typically uses purposive context for policy reform. policy. Also provides insight into coping surveys to collect quantitative
mechanisms, social risks, and information from sample stakeholder views on most-appropriate representative of particular means of mitigating negative impact of region or population groups policies and potential effectiveness in relevant to a particular policy local context. reform. Particularly useful when
national household data do not exist or do not contain specific information needed to assess policy impacts.
Beneficiary Participatory assessment Has traditionally been used to Reveals beneficiaries’ perception of • Interviewsassessment method and monitoring tool evaluate projects or sectoral policy proposed policy and any mitigatory • Focus group discussions, which
that incorporates direct reforms in the health, education, measures being considered. Provides in some cases have been consultation of those affected infrastructure, social protection, insights into the likely reception reform combined with participatory by and influencing policy and agricultural sectors; can be will receive, as well as issues that may rural appraisal toolsreform. Similar to a adapted to assess or monitor arise during implementation. Reaches • Direct and participant participatory poverty impact of some discrete policy the community level but is not focused observationassessment, it relies primarily interventions where transmission exclusively on the poor or the Although information collected on qualitative research, channels and affected groups are community. is qualitative, it is analyzed though with less emphasis clearly defined. Used both to quantitatively. on the use of visual techniques evaluate proposed reforms (to and community follow-up to signal constraints to participation the research process. faced by target group) and to gain
beneficiary feedback for ongoing policy reforms.
109
(continued)
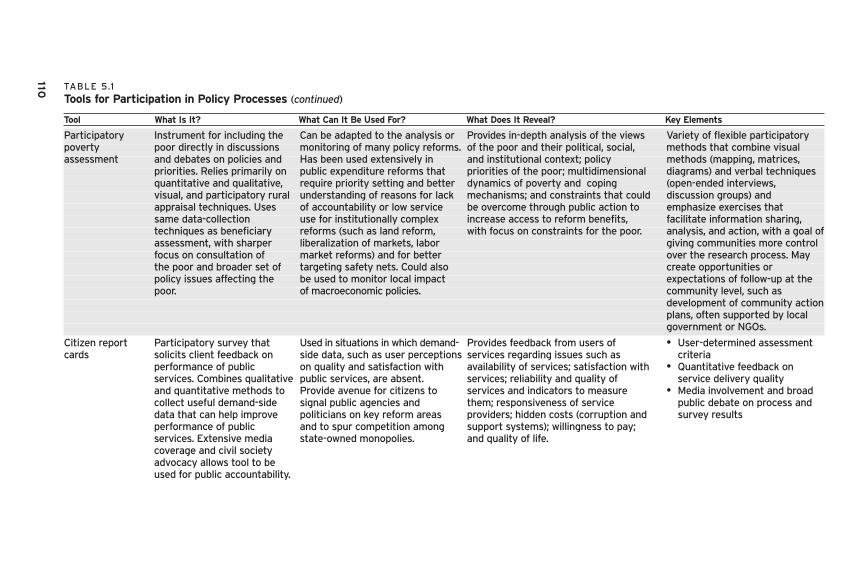
TABLE 5.1
Tools for Participation in Policy Processes (continued)
Tool What Is It? What Can It Be Used For? What Does It Reveal? Key Elements
Participatory Instrument for including the Can be adapted to the analysis or Provides in-depth analysis of the views Variety of flexible participatory poverty poor directly in discussions monitoring of many policy reforms. of the poor and their political, social, methods that combine visual assessment and debates on policies and Has been used extensively in and institutional context; policy methods (mapping, matrices,
priorities. Relies primarily on public expenditure reforms that priorities of the poor; multidimensional diagrams) and verbal techniques quantitative and qualitative, require priority setting and better dynamics of poverty and coping (open-ended interviews, visual, and participatory rural understanding of reasons for lack mechanisms; and constraints that could discussion groups) and appraisal techniques. Uses of accountability or low service be overcome through public action to emphasize exercises that same data-collection use for institutionally complex increase access to reform benefits, facilitate information sharing, techniques as beneficiary reforms (such as land reform, with focus on constraints for the poor. analysis, and action, with a goal ofassessment, with sharper liberalization of markets, labor giving communities more control focus on consultation of market reforms) and for better over the research process. May the poor and broader set of targeting safety nets. Could also create opportunities orpolicy issues affecting the be used to monitor local impact expectations of follow-up at the poor. of macroeconomic policies. community level, such as
development of community actionplans, often supported by local government or NGOs.
Citizen report Participatory survey that Used in situations in which demand- Provides feedback from users of • User-determined assessmentcards solicits client feedback on side data, such as user perceptions services regarding issues such as criteria
performance of public on quality and satisfaction with availability of services; satisfaction with • Quantitative feedback on services. Combines qualitative public services, are absent. services; reliability and quality of service delivery qualityand quantitative methods to Provide avenue for citizens to services and indicators to measure • Media involvement and broadcollect useful demand-side signal public agencies and them; responsiveness of service public debate on process anddata that can help improve politicians on key reform areas providers; hidden costs (corruption and survey resultsperformance of public and to spur competition among support systems); willingness to pay; services. Extensive media state-owned monopolies. and quality of life.coverage and civil society advocacy allows tool to be used for public accountability.
110

Community Community-based qualitative Allow communities to monitor and Provides information on how inputs or • Community-designed andscorecards monitoring tool that draws evaluate performance of services, expenditures match entitlements and executed qualitative service
on techniques of social audit, projects, and even government allocations at the local/facility level; assessmentcommunity monitoring, and administrative units (such as criteria used by community and • Professionally facilitated publiccitizen report cards. Increases district assemblies). Process providers to assess performance; how discussion of resultsempowerment and allows for tracking of inputs or both the community and providers accountability through expenditures; monitoring of quality score themselves on these criteria; interface meeting between of services and projects; anecdotal evidence on which these service providers and generation of benchmark scores are based; and how assessmentscommunity that allows for performance criteria that can be by the community and providers can beimmediate feedback. used in resource allocation and used to develop action plan for
budget decisions; comparison of improvement.performance across facilities and districts; generation of a direct feedback mechanism between providers and users; building of local capacity; and strengthening of citizen voice and community empowerment.
Source: Adapted from World Bank 2003c.
111

112 STRATEGIC ENVIRONMENTAL ASSESSMENT FOR POLICIES
processes (for more information on institutional analysis, see Brinkerhoff andCrosby 2002). It is useful for policy design and implementation; it is particularlyimportant for policy changes involving institutional reforms, such as decentraliza-tion of public services. Institutional analysis does not directly give vulnerablegroups voice, but it is critical in identifying how they can play a role in decision-making processes. It was used in the design of the World Bank–supported forestryproject in India to develop a more-inclusive legal and institutional frameworkthat allows forest-dependent communities to gain management control over theirnatural resources (Kvam and Nordang 2004).
Social Impact Analysis
Social impact analysis identifies the range of social impacts and responses topolicies by people and institutions, including those that are vulnerable or poor(for more information on social impact analysis, see Finsterbusch, Ingersoll, andLlewellyn 1990; Becker 1997; Goldman 2000). Social impact analysis helpsascertain the social and political context for policy reform; who is affected by thepolicy; the preferences and priorities of those affected by the policy; constraintsto implementation of the policy; and how people and institutions are likely torespond to policy reform, including whether assumptions on how they will reactor be affected by the policy were correct. It also provides insight into coping mech-anisms and social risks, by seeking suggestions from stakeholders on the mostappropriate means to mitigate the negative impact of policies. It has been used
Stakeholder analysisInstitutional analysisSocial Impact analysis Participatory povertyassessmentBeneficiary assessment
Participatoryplanning
Community scorecardsCitizen report cardsBeneficiary assessment
Participationand
consultation
Policyanalysis
Policyimplementation
Policymonitoring
Policyformulation
FIGURE 5.3
How Tools Fit into the Participatory Policy Cycle
Source: Adapted from Shah and Youssef 2002.

extensively for mining sector restructuring, parastatal privatization, and utilityand agricultural policy reforms that have significant social impacts (Junge andothers 2004; Beddies and De Soto 2005; Keener and Banerjee 2006).
Beneficiary Assessment and Participatory Poverty Assessment
The next two tools can be used as part of policy analysis or policy monitoring.As part of policy analysis, they are often used in conjunction with stakeholderanalysis or social impact analysis. They give vulnerable groups voice by makingthem a key target group for policy diagnostics and by seeking their feedback onactual impacts of policy implementation.
Beneficiary assessment is a participatory assessment method and monitoringtool that incorporates direct consultation of those affected by and influencing apolicy (for more information on beneficiary assessment, see Salmen and Amelga1998; Salmen 2002). Beneficiary assessment of vulnerable groups could give themvoice by identifying their constraints to participation and obtaining their feed-back on the policy, the problem the policy addresses, and any mitigatory measuresbeing considered. Five beneficiary assessments in the Zambia Social RecoveryProject studied the socioeconomic profile of project beneficiaries and assessedcoping strategies during structural adjustment and drought. Subsequent benefi-ciary assessments assessed the impact of changes introduced by social fundmanagement in response to recommendations from earlier beneficiary assess-ments (Jones and Owen 1998).
A participatory poverty assessment is an instrument for including the poordirectly in discussions of policies and priorities (for more information on partici-patory poverty assessment, see Norton and others 2001; Robb 2002). Participatorypoverty assessments are designed in consultation with policy makers and civilsociety groups. Unlike a household survey, which consists of a predeterminedset of questions, a participatory poverty assessment uses a variety of flexibleparticipatory methods. These methods combine visual techniques (mapping, matrices,diagrams) and verbal techniques (open-ended interviews, discussion groups); theyemphasize exercises that facilitate information sharing, analysis, and action.
Participatory poverty assessments go beyond the household unit of traditionalsurveys to focus on individuals, intrahousehold dynamics, social groups, andcommunity relationships. They give vulnerable groups voice by analyzing theirviews and their political, social, and institutional context, as well as their policypriorities and coping mechanisms; identifying constraints that could be overcomethrough public action to increase their access to policy benefits; and increasingtheir capacity to analyze and monitor poverty. The Vietnam participatory povertyassessment prioritized interventions that increased and stabilized agricultural andoff-farm incomes; increased access of poor migrants to government services;improved the targeting of interventions toward poor households; minimized
GIVING THE MOST VULNERABLE A VOICE 113
preferential access to services and resources by better-connected households; andimproved the transparency of beneficiary identification for government programs(Turk 2001; Robb 2003).
Citizen Report Cards and Community Scorecards
The last two tools are normally used as part of policy monitoring. They givevulnerable groups voice by seeking their feedback on the impacts of policy imple-mentation. These tools are useful for giving voice to citizens in a way that caninfluence actions by both the public and private sectors.
A citizen report card is a participatory survey that solicits client feedback onthe performance of public services (for examples and more information, see WorldBank 2001; Paul 2002; Public Affairs Centre 2002; Wagle, Singh, and Shah 2004).They are used in situations in which demand-side data, such as user perceptionson quality and satisfaction with public services, are absent. By collecting and aggre-gating user feedback, they provide an avenue for citizens to signal public agenciesand politicians on key policy areas. They also create competition among state-owned monopolies. They give vulnerable groups voice to the extent that they areincluded among those who are asked to provide user feedback on government orservice provider performance. While typically used to monitor public serviceperformance, citizen report cards can also be used to monitor policy impacts.
A community scorecard is a community-based qualitative monitoring toolthat draws on techniques of social audit, community monitoring, and citizenreport cards.6 The process allows for monitoring of the quality of services andprojects; generation of benchmark performance criteria that can be used in resourceallocation and budget decisions; comparison of performance across facilities anddistricts; creation of a direct feedback mechanism between providers and users;local capacity building; and strengthening of citizen voice and communityempowerment. Although community scorecards are usually used for projectmonitoring, they can be adapted to monitor policies. Citizen report cards andcommunity scorecards are part of a broader approach to promoting good gover-nance and making governments accountable and responsive to its citizens knownas social accountability (for an introduction to the theory and practice of socialaccountability, see Malena, with Forster and Singh 2004).
Case Studies
This section examines two case studies in which vulnerable groups were givenvoice in shaping environmental policy. Each example describes the politicaleconomy context of the policy process, how vulnerable groups participated in thepolicy process (including what tools were used), what the findings were of thatprocess, how their voice was ensured, what impacts their voice had on policy, andwhat impacts the policy had on vulnerable groups.
114 STRATEGIC ENVIRONMENTAL ASSESSMENT FOR POLICIES

Participatory Budgeting and Environmental Management in Porto Alegre, Brazil
Porto Alegre is one of the best-known cases in which vulnerable groups have beengiven voice in municipal-level planning. Porto Alegre is the capital of Brazil’ssouthernmost state, Rio Grande do Sul. It has the highest standard of living andthe longest life expectancy of any Brazilian metropolitan center (Menegat 2002).Virtually all its people have water piped to their homes, and most have good-quality sanitation and drainage. The garbage collection system reaches virtuallyall households and has included separate collection of recyclables since 1990.Other programs enforce industrial pollution control, reduce motor vehicleemissions, and ensure the reuse of organic wastes from parks and restaurants.
Southern Brazil has historically demonstrated a strong democratic politicalculture and resistance to authoritarianism. When direct elections for capital citymayors were reestablished, Porto Alegre was one of the few municipalities thenew Workers Party won in the 1988 elections. The Workers Party had a veryclear agenda, which advocated direct participation, redistribution, and a reductionin corruption.
The 1989 municipal elections brought to power a progressive mayor whorealized the potential for opening up to citizen’s scrutiny the dire fiscal situationinherited from the previous administration and engaging citizens in the priori-tization of local needs with respect to scarce municipal resources (Wagle and Shah2003). Facing extremely high expectations from constituents, financial meltdown,and threats from municipal councilors, the mayor shifted the local governanceculture from the traditional executive-legislative focus toward the people. Thiscreated significant political tensions, not only among the opposition but alsoamong segments of the left, which were not keen to change the political cultureand power relations.
Process. Participatory budgeting completely reversed the traditional patronageapproach that characterizes public administration in most Brazilian cities. Theprocess of discussion and decision making follows an annual cycle of two mainstages. The first involves defining priorities and proposals for public spending inplenary assemblies, in which all citizens can participate. The second involvesdrawing up the budget proposal and expenditure plan. The priorities and proposalsapproved by citizens are supposed to be sufficiently developed for submission tothe state legislature as the municipal budget. In 2000 the participatory budgetingprocess involved about 30,000 citizens, ensuring that public interventions corre-sponded with the priorities of the population (Menegat 2002). Since 1989, almost15 percent of the population has participated in at least one budget event.
The participatory budgeting cycle usually starts with the municipality organizinginformation meetings. Citizens are provided with necessary information, such asbudget rules and procedures, implementation status of the current budget, and
GIVING THE MOST VULNERABLE A VOICE 115

government expenditure priorities. The first stage consists of two large rounds ofgeneral and sectoral plenary assemblies. Citizens can participate in all events,during which they have the opportunity to present their requests and proposalsfor the annual municipal budget for their district or for a specific sector. Betweenthe two rounds is an interim phase, which consists of numerous more-specificmeetings in each of the municipality’s 16 districts and on five sectoral themes.These meetings are coordinated and facilitated by the delegates elected to thedistrict and sectoral assemblies. They allow communities to discuss their needsand priorities in greater depth.
The second round of meetings is coordinated by the participatory budgetingcouncil. During this round, citizens’ priorities are identified and voted on. Citizenrepresentatives undertake capacity-building activities to improve citizens’ under-standing of public budgeting, fiscal mechanisms, and service and investmentplanning, as well as to enhance their consensus-building and conflict resolutionskills. The representatives usually conduct field inspections to validate the prior-ities selected during the regional meetings. The government conducts technicaland financial feasibility studies for each priority presented at the budget council.After intensive debates between the government and citizens’ delegates, the finalproposal is voted on by the budget council and presented to the mayor for budgetconsolidation and submission to the municipal legislative council.
Grassroots groups mobilize vulnerable people so that they can have a significantpresence in the participatory budgeting process and elect their own representa-tive on the participatory budgeting council, the ultimate level of decision making.These groups implement an outreach campaign, help strengthen leadership amongvulnerable people, and advocate their needs in policy and budgeting decisionmaking. Because the process is time intensive, the most vulnerable groups oftenparticipate less than other social actors.
Findings and impact. Once citizens had become involved in decision makingfor the municipal budget, it was recognized that urban planning and manage-ment, in particular environmental management, needed to be fundamentallyrevised. It was clear that a purely physical planning model that operated in isola-tion from the key actors was incompatible with participatory democracy. Theplanning authority needed to adopt democratic decision-making processes in itsrelations with other government bodies, with other institutions, and with citizens.The need was identified for a system of knowledge and information of the urbanand natural environments that was accessible to all stakeholders, including plan-ners, politicians, institutions, and citizens. The production of this knowledgeitself required fundamental changes in the way information was collected,compiled, and validated.
The system for integrated environmental management is based on four inter-related components: citizen participation, public environmental management
116 STRATEGIC ENVIRONMENTAL ASSESSMENT FOR POLICIES

programs, comprehensive knowledge of Porto Alegre’s natural and built environ-ments, and environmental education (Menegat 2002). Citizens participate inenvironmental policy making through either the municipal councils or the assem-blies within participatory budgeting.
Several environmental programs have been undertaken to implement the moredemocratic and participatory environmental policy (Menegat 2002). Urban growthhas caused the degradation of public spaces, particularly green areas. Two ongoingprograms aim to address the problem by involving citizens in their management.The first is the Green Area Adoption Scheme, in which a partner institution “adopts”a square or park and commits to undertake the maintenance and gardening. Thesecond is the City Square Councils Program, which brings together interested citi-zens, civil society organizations, and businesses, who organize the maintenanceand gardening of a particular city square and define the rules for its use. Treeplanting along streets is one of the specific measures for environmental protec-tion set out in municipal legislation. Special programs were started in 1990 forpollution control of oil, water, and the atmosphere. The growing problem of refusedisposal has been mitigated through the integrated solid waste managementprogram, which has both reduced the quantity of waste disposed of in landfills(thus increasing their life) and generated income from recycling.
For citizens to participate in urban and environmental management in a mean-ingful way, they need information and knowledge about the natural and builtenvironments. In Porto Alegre such information was disseminated principallythrough the Environmental Atlas of Porto Alegre (Menegat and others 1998). TheAtlas uses plain language to present the relationships between the local, regional,and global environments, from the geosphere, hydrosphere, biosphere, and atmos-phere to the technosphere and urbansphere. It provides a solid foundation ofscientific knowledge that can be used to produce scenarios and forecasts on whichto base the city’s environmental monitoring, legislation, and licensing. The estab-lishment of environmental directives for various scenarios also means that specificissues raised by citizens can be responded to more quickly, as the information willbe more readily available. Following the publication of the Environmental Atlasof Porto Alegre, an environmental education program was established.
Participatory budgeting had instrumental value in promoting environmentaleducation, programs, and goals. It also had intrinsic value in bringing about afundamental change in the political culture of Porto Alegre. This change signifiedan end to the traditional top-down style of decision making, the redefinition ofpublic priorities in line with citizens’ views, and the transition to an inclusive city.The best illustration of the political impact of participatory budgeting in PortoAlegre is that after 16 years in power, the Workers Party lost the 2004 election toa coalition composed of all the opposition parties that were originally against buteventually supported participatory budgeting. The new mayor won election because
GIVING THE MOST VULNERABLE A VOICE 117

he acknowledged the importance of participatory budgeting and the need toimprove local governance mechanisms even further.
A rigorous impact assessment carried out by the World Bank (Baiocchi andothers 2006) compares various indicators in municipalities that used participatorybudgeting and municipalities that did not. It finds that participatory budgetinghad an impact, particularly for the poorest citizens, on the level of poverty andthat it increased the voice of vulnerable groups. Marquetti (2000) shows thatparticipatory budgeting in Porto Alegre increased the resources allocated toservices that benefit poor and vulnerable groups.
Why the voice of vulnerable groups was heard. The voice of vulnerable groupswas heard in Porto Alegre because a grassroots movement won power throughelections and the elected government was accountable and responsive to the poorand vulnerable. The social movement in Brazil demanded direct participation indecision making and control over resources. Once political freedom was reestab-lished in Brazil, many activists who were in the social movement joined politicalparties, mainly the Workers Party, bringing the social movement into the polit-ical arena. Participatory budgeting itself has become a powerful force in shapingthe politics of Porto Alegre, so much so that the Workers Party lost power in 2004,at least partly because it had not gone far enough in the view of vulnerable groups.
Policy toward Pastoralists in Mongolia
Under the communist regime that ruled the country until 1990, Mongolia madegreat progress in improving human development indicators and virtually elimi-nating poverty (Mearns 2004). Innovative service delivery mechanisms to nomadicpastoralists achieved almost universal coverage of primary health care and basiceducation services. Life expectancy increased from 47 in 1960 to 63 in 1990. Adultliteracy reached 97 percent.
The sudden loss of Soviet subsidies led to a one-third decline in gross domesticproduct (GDP). The 1990s saw political and economic transition and a rapid risein asset and income inequality. The economic transition led to a dramatic shakeoutof labor from uneconomic state-owned enterprises that was absorbed largely bythe extensive livestock sector in rural areas.
By the late 1990s, herders accounted for more than a third of the populationand half the active labor force. Pressures on common pastures grew, increasingviolence, livestock theft, and conflict over pastures. In 1998–99 export earningsfell because of the collapse in prices of Mongolia’s three main exports: gold, copper,and cashmere. More than a third of the population was defined as living underthe poverty line.
Three successive years (1999–2002) of drought and harsh winters led to highlivestock mortality and prompted two sorts of responses. The first was to recognize
118 STRATEGIC ENVIRONMENTAL ASSESSMENT FOR POLICIES
that household-level vulnerability to such risk episodes had been exacerbated byneglect at the level of public policy and investment in the livestock sector andother support frameworks over the preceding decade. The second was to reinvig-orate approaches to rural development, with particularly attention to pastoral riskmanagement, including ways of facilitating livestock mobility, both seasonallyand in response to episodic risk.
Process. The Mongolia Participatory Poverty Assessment (the Participatory LivingStandards Assessment [PLSA]), was conducted against the backdrop of the generalelection campaign in 2000. The incumbent democratic coalition government feltvulnerable to criticisms that poverty had not been declining quickly enough aftereconomic growth picked up in the mid-late 1990s. The former communist party,the Mongolian People’s Revolutionary Party (MPRP), ran on a platform that empha-sized, among other things, the importance of a poverty-reduction-with-growthagenda. Poverty was therefore a highly charged political issue in 2000, as well asthe foremost developmental challenge facing the country. The PLSA (NationalStatistical Office of Mongolia and World Bank 2001) was explicitly designed as anattempt to elicit the voices of the poor and vulnerable and to create space for theirvoices to be heard in framing a new national poverty reduction program. The PLSAset out to analyze not only poverty but also its wider context.
The PLSA focused on social differentiation, vulnerability, and access to assetsas key issues for more-secure and sustainable livelihoods (Dulamdary and others2001). It was the first exercise of its kind in Mongolia to use participatory learningand action methods to broader and deepen understanding of poverty at thenational level.
The assessment was based on the sustainable livelihoods approach, whichemphasizes the range of capital assets (natural, human, social, physical, andfinancial) that people draw upon in pursuing diverse livelihood strategies. Itused a range of participatory learning and action methods, including matrixranking and scoring, wealth and well-being ranking, semi-structured interviews,and focus groups.
The PLSA began with participants’ own understandings of well-being. Thisled to an analysis and discussion of differences among households within commu-nities. More than 2,000 people participated in the PLSA as informants or focusgroup members. Presentations of preliminary results were made at national confer-ences, workshops, and briefings to members of parliament, senior governmentofficials, NGOs, civil society groups, and donor agencies. A competition amongvarious media was held to promote public debate on poverty and public andprivate actions.
Findings and impact. The PLSA highlighted the multiple sources of insecurityand vulnerability that had emerged as a result of the privatization of state-owned
GIVING THE MOST VULNERABLE A VOICE 119

enterprises and pastoral collectives. It also outlined the coping strategies of poorcommunities. Priorities for action included the following:■ Recognize a view of ill-being that is broader than poverty and includes alcohol
abuse, crime, and domestic violence.■ Shift from creating employment to promoting people’s capacity to secure their
own livelihoods.■ Reduce vulnerability to risks through social networks, life skills, and innova-
tive microfinance products, including livestock insurance.■ Reduce risk to pastoral livestock production through restoration of pastoral
mobility, community-based pasture land management, and livelihood diver-sification.
■ Improve the quality and effectiveness of social services and infrastructure as abasis for thriving local economies.
■ Increase public access to information, and give citizens greater voice and influ-ence over public spending.The PLSA led to a broader public discourse on poverty and to increased under-
standing of the multiple dimensions, causes, and consequences of impoverishmentand vulnerability. Mongolia’s Poverty Reduction Strategy Paper and rural devel-opment strategy reflected many of the findings of the PLSA and formed the basisfor the government’s Household Livelihoods Capacity Support Program(Government of Mongolia 2003).
The PLSA also helped frame the design of the new national poverty programin terms of a sustainable livelihoods approach. The key components include pastoralrisk management, sustainable microfinance services to underserved groups suchas herders, and a more community-driven approach to identifying and managinginvestments in basic infrastructure, all of which give voice to vulnerable groups.
Perhaps the clearest example of how the voices of vulnerable groups influ-enced policy is the land law and policy toward pasture land tenure. Participationin the PLSA created the opportunity to enshrine in law the rights of poor andvulnerable herders. The revised Land Law prohibited privatization of pasture landand endorsed a more socially inclusive, common-pool approach to pasture landmanagement. Both are of central importance for the livelihoods of herders, whomof whom are poor and vulnerable.
Why the voice of vulnerable groups was heard. The voice of vulnerable groupsmay have been heard and taken into account in the PLSA because it served thepolitical interests of the MPRP to demonstrate its commitment to followingthrough on its campaign promises of pro-poor action.7 A sufficient coalition ofinterests—in government, parliament, NGOs, think tanks, and other civil societyinstitutions—was forged that heard the voice of vulnerable groups to permit someenabling progressive policies (such as some aspects of the land law and theHousehold Livelihoods Capacity Support Program) to find a foothold. Some
120 STRATEGIC ENVIRONMENTAL ASSESSMENT FOR POLICIES
highly committed public figures in these institutions have a genuine interest inprogressive social change and believe in the power of public action to help bringit about. These interests were able to stand up to opposition from very powerfulindividuals (such as the prime minister).
Conclusion
Giving vulnerable groups a voice in policy formulation yields many benefits.Policies are better informed, understood, and supported. The vulnerable areempowered and able to influence policies. They also benefit from helping makegovernment more inclusive and accountable to their needs. Giving voice to vulner-able groups is often a virtuous circle, in which empowerment leads to better policiesand policy impact, which lead to further empowerment and other benefits forvulnerable groups. The key is how to get the virtuous circle started.
The vulnerable are not simply poor. They also suffer from insecurity, isolation,lack of dignity, lack of access to information, and powerlessness. They are dependenton natural resources for their livelihoods, live in unhealthy environments, aremore vulnerable to waste management and toxins, and are more prone to theimpact of natural disasters and climate change. If the enabling environment isweak, participation may remain a one-way information flow. Social accounta-bility and transparency require participation that goes beyond one-way informationsharing to joint-decision making. In this way citizens are able to understand,engage with, and influence policy making and implementation.
Adaptive management and inclusive decision making create opportunities forgiving the vulnerable voice. An enabling environment—including the freedom toassociate, the resources to facilitate voice, the ability to exercise voice, and theexistence of spaces for voice—are critical. As both case study examples show,without political support from those in power, the voice of vulnerable groupswould not have been heard, much less acted upon.
Within the policy process, voice can be incorporated in policy analysis, formu-lation, implementation, and monitoring. Participatory planning, budgeting, anddecision making have been effective means for making the voice of vulnerable groupsheard. Some of the most common tools for giving voice include stakeholder analysis,institutional analysis, social impact analysis, participatory poverty assessment, bene-ficiary assessment, participatory planning, citizen report cards, and communityscorecards. These tools are techniques: what is important is the willingness andcapacity to give vulnerable groups voice, which usually requires political power orsupport from those in power to complement social mobilization from below.
Giving vulnerable groups voice has had a significant impact. It has led to abroader public discourse on poverty and to increased understanding of the multipledimensions, causes, and consequences of impoverishment and vulnerability.
GIVING THE MOST VULNERABLE A VOICE 121

It has helped shape poverty reduction and sectoral strategies (including envi-ronmental strategies, policies, and programs) and led policy makers to examinethe impacts of policies and reforms on the poor. It has prioritized interventions,improved access to and the quality of government services, improved the targetingof interventions toward vulnerable groups, and enhanced the capacity to carryout participatory research on policy issues. Direct consultation with vulnerablegroups can present opportunities for a more-open dialogue and greater under-standing between those in power and vulnerable groups.
Participation of vulnerable groups in policy processes is still in its infancy:participation in policy analysis, formulation, and monitoring has not been matchedby participation in policy implementation. Most participation has been in thesocial sectors (health, education, social protection) or governance processes(budgets, decentralization). Only more recently has it expanded to sectors in whichenvironmental considerations are more important (energy, agriculture, naturalresource management). While a good start has been made, much remains to bedone to improve the consistency, quality, and effectiveness of the participation ofvulnerable groups.
Notes
1 Robb and Scott (2001), Tikare and others (2001), and Shah and Youssef (2002) summarizethese arguments.
2 For information on evidence-based policy making using participatory approaches to includevulnerable groups and civil society more broadly, see Pollard (2005).
3 It is necessary to have an appreciation of the impact of reforms on groups other than thepoor and vulnerable, in order to understand why certain groups may want to influence orblock certain policy decisions.
4 Social accountability refers to the broad range of actions and mechanisms, beyond voting,that citizens can use to hold the state to account, as well as actions on the part of govern-ment, civil society, media, and other societal actors that promote or facilitate these efforts.
5 A policy can be considered fair if individuals would support it if they did not know inadvance what their position in society would be (Rawls 1971).
6 For more information on a community scorecard process, see World Bank (2004a). For anexample, see Dedu and Kajubi (2005).
7 For more information, see World Bank (2007).
References
Ackerman, J. 2005. Social Accountability in the Public Sector: A Conceptual Discussion. SocialDevelopment Paper 82, World Bank, Washington, DC.
Baiocchi, G., P. Heller, S. Chaudhuri, and M. K. Silva. 2006. “Evaluating Empowerment:Participatory Budgeting in Brazilian Municipalities.” In Empowerment in Practice: FromAnalysis to Implementation, eds. R. Alsop, M. Bertelsen, and J. Holland. Washington, DC:World Bank.
122 STRATEGIC ENVIRONMENTAL ASSESSMENT FOR POLICIES

Becker, H. 1997. Social Impact Assessment. London: University College Press.
Beddies, S., and H. De Soto. 2005. Poverty and Social Impact Analysis (PSIA) of theDecentralization and Water Sector Privatization in Albania. Washington, DC: World Bank.
Bianchi, R., and S. Kossoudji. 2001. Interest Groups and Organizations as Stakeholders. SocialDevelopment Paper 35, World Bank, Washington, DC.
Blackburn, J., R. Chambers, and J. Gaventa. 2000. “Mainstreaming Participation inDevelopment.” Working Paper, World Bank, Operations Evaluation Department,Washington, DC.
Brinkerhoff, D., and B. L. Crosby. 2002. Managing Policy Reform: Concepts and Tools for Decision-Makers in Developing and Transition Countries. Bloomfield, CT: Kumarian Press.
Chambers, R. 1983. Putting the First Last. London: Longman.
———. 2007. “Who Counts? The Quiet Revolution of Participation and Numbers.” IDSWorking Paper 296, Institute of Development Studies, Sussex, United Kingdom.
Dedu, G., and G. Kajubi. 2005. “The Community Scorecard Process in The Gambia.” SocialDevelopment Note 100, World Bank, Washington, DC.
DeWind, J., and D. H. Kinley. 1988. Aiding Migration: The Impact of International DevelopmentAssistance on Haiti. Boulder, CO: Westview Press.
Dulamdary, E., M. Shah, and R. Mearns, with B. Enkhbat and L. Ganzaya. 2001. “Mongolia:Participatory Living Standards Assessment,” Report prepared for the Donors’ ConsultativeGroup Meeting, Paris, May 15–16. National Statistics Office, Ulaanbaatar, Mongolia, andWorld Bank, Washington, DC.
Feldman, M., and A. Khademian. 2000. “Management for Inclusion: Balancing Control withParticipation.” International Public Management Journal 3 (2): 149–68.
———. 2005. “Inclusive Management: Building Relationships with the Public.” Paper 04-12,Center for the Study of Democracy, University of California–Irvine.
Finsterbusch, K., J. Ingersoll, and L. Llewellyn. 1990. Methods for Social Analysis in DevelopingCountries. San Francisco: Westview Press.
Goldman, L. R., ed. 2000. Social Impact Analysis: An Applied Anthropology Manual. Oxford:Berg Press.
Government of Mongolia. 2003. Economic Growth Support and Poverty Reduction Strategy.Prime Minister’s Office, Ulaanbaatar.
Grindle, M. S., and J. W. Thomas. 1991. Public Choices and Policy Change: The Political Economyof Reform in Developing Countries. Baltimore, MD: Johns Hopkins University Press.
Haney, M., M. Shkaratan, V. Kabalina, V. Paniotto, and C. Rughinis. 2003. Mine Closure and ItsImpact on the Community: Five Years after Mine Closure in Romania, Russia, and Ukraine.Social Development Paper 42, World Bank, Washington, DC.
Holland, J., and J. Blackburn. 1998. Whose Voice? Participatory Research and Policy Change.Intermediate Technology Development Group, London.
IEA (International Energy Agency). 2006. International Energy Outlook 2006. Paris: Organisationfor Economic Co-operation and Development/IEA.
Jones, B., and D. Owen.1998. “Beneficiary Assessment for Monitoring: The Zambia SocialRecovery Project.” Social Development Note 36, World Bank, Washington, DC.
Junge, N., T. Pushak, J. Lampietti, N. Dudwick, and K. Van den Berg. 2004. Sharing Power:Lessons Learned from the Reform and Privatization of Moldova’s Electricity Sector. WorldBank, Washington, DC.
GIVING THE MOST VULNERABLE A VOICE 123
Kanji, N., and S. Ware. 2002. “Trade Liberalization, Poverty and Livelihoods: Understanding theLinkages.” Review prepared for the African Policy and Economic Department, Departmentfor International Development, London.
Keener, S., and S. Banerjee. 2006. “Ghana: Electricity Tariff Reform.” In Poverty and SocialImpact Analysis of Reforms, eds. A. Coudouel, A. Dani, and S. Paternostro. Washington, DC:World Bank.
Kvam, R, and H. Nordang. 2004. The Jharkand Participatory Forest Management Project: SocialAssessment for Inclusion, Cohesion, and Accountability. World Bank, Washington, DC.
Leitner, K. 2005. “Heath and Environment: A View from WHO.” In Environment Matters.Washington, DC: World Bank.
Malena, C., with R. Forster and J. Singh. 2004. “Social Accountability: An Introduction tothe Concept and Emerging Practice.” Social Development Paper 74, World Bank,Washington, DC.
Marquetti, A. 2000. “Participatory Budgeting in Porto Alegre.” Indicator S A, Johannesburg,17 (4): 71–78.
Mearns, R. 2004. “Sustaining Livelihoods on Mongolia’s Pastoral Commons: Insights from aParticipatory Poverty Assessment.” Development and Change 35 (1): 107–39.
Menegat, R. 2002. “Participatory Democracy and Sustainable Development: Integrated UrbanEnvironmental Management in Porto Alegre, Brazil.” Environment and Urbanization14 (2): 181–206.
Menegat, Rualdo, Maria Luiza Porto, Clovis Carlos Carrazo, and Luís Alberto DávilaFernandes.1998. Environmental Atlas of Porto Alegre. Porto Alegre, Brazil: Edufrgs.
Narayan, D., R. Chambers, M. Shah, and P. Petesch. 2001. Voices of the Poor: Crying Out forChange. Washington, DC: World Bank.
National Statistical Office of Mongolia, and World Bank. 2001. Mongolia Participatory LivingStandards Assessment 2000. Ulaanbataar, Mongolia.
Norton, A., B. Bird, K. Brock, M. Kakande, and C. Turk. 2001. A Rough Guide to ParticipatoryPoverty Assessments: An Introduction to Theory and Practice. London: ODI Publications.
Ostro, B. 1994.“Estimating the Health Effects of Air Pollutants: A Methodology with Applicationto Jakarta.” Policy Research Working Paper 1301, World Bank, Washington, DC.
Paul, S. 2002. Holding the State to Account: Citizen Monitoring in Action. Bangalore, India:Books for Change.
Pollard, A. 2005. How Civil Society Organisations Use Evidence to Influence Policy Processes: AnAnnotated Bibliography. London: Overseas Development Institute.
Public Affairs Centre. 2002. The State of Karnataka’s Public Services: Benchmarks for the NewMillennium. Bangalore, India.
Rawls, J. 1971. A Theory of Justice. Cambridge, MA: Belknap Press of Harvard University Press.
Robb, C. 2000. “How the Poor Can Have a Voice in Government Policy.” Finance andDevelopment 37 (4), International Monetary Fund, Washington, DC.
———. 2002. Can the Poor Influence Policy? Participatory Poverty Assessments in the DevelopingWorld. Washington, DC: International Monetary Fund and World Bank.
———. 2003.“Poverty and Social Impact Analysis: Linking Macroeconomic Policies to PovertyOutcomes: Summary of Early Experiences.” IMF Working Paper WP/03/43, InternationalMonetary Fund, Washington, DC.
124 STRATEGIC ENVIRONMENTAL ASSESSMENT FOR POLICIES
Robb, C., and A. Scott. 2001. “Reviewing Some Early Poverty Reduction Strategy Papers inAfrica.” IMF Policy Discussion Paper PDP/01/5, International Monetary Fund,Washington, DC.
Salmen, L. 1995.“Listening to the People.” Finance and Development 32 (2): 44–48: InternationalMonetary Fund, Washington, DC.
———. 2002. Beneficiary Assessment: An Approach Described. Social Development Paper 10,World Bank, Washington, DC.
Salmen, L, and M. Amelga. 1998. Implementing Beneficiary Assessment in Education: A Guidefor Practitioners. Social Development Paper 25, World Bank, Washington, DC.
Salmen, L., and E. Kane. 2006. Bridging Diversity: Participatory Learning for ResponsiveDevelopment. Washington, DC: World Bank.
Shah, P., and D. Youssef. 2002. “Voices and Choices at a Macro Level: Participation in Country-Owned Poverty Reduction Strategies.” Action Learning Program Dissemination Series 1.World Bank, Social Development Department, Washington, DC.
Subbarao, K., A. Bonnerjee, J. Braithwaite, S. Carvalho, K. Ezemenari, C. Graham, and A.Thompson. 1997. Safety Net Programs and Poverty Reduction: Lessons from Cross-CountryExperience. Washington, DC: World Bank.
Thindwa, J., C. Monico, and W. Reuben. 2003. “Enabling Environments for Civic Engagementin PRSP Countries.” Social Development Note 82, World Bank, Washington, DC.
Tikare, S., D. Youssef, P. Donnelly-Roark, and P. Shah. 2001. “Organizing ParticipatoryProcesses in the Poverty Reduction Strategy Process.” In PRSP Sourcebook. Washington,DC: World Bank.
Turk, C. 2001.“Linking Participatory Poverty Assessments to Policy and Policy Making: Experiencefrom Vietnam.” Policy Research Working Paper 2526, World Bank, Washington, DC.
Wagle, S., and P. Shah. 2003. “Porto Alegre, Brazil: Participatory Approaches in Budgetingand Public Expenditure Management.” Social Development Note 71, World Bank,Washington, DC.
Wagle, S., J. Singh, and P. Shah. 2004. “Citizen Report Card Surveys: A Note on the Conceptand Methodology.” Social Development Note 91, World Bank, Washington, DC.
Whittingham, E., J. Campbell, and Philip Townsley. 2003. Poverty and Reefs. Department forInternational Development, London.
World Bank. 2001. Making Sustainable Commitments: An Environment Strategy for the WorldBank. Washington, DC: World Bank.
———. 2002. World Development Report 2003: Sustainable Development in a Dynamic World.Washington, DC: World Bank.
———. 2003a. Cornerstones for Conservation: World Bank Assistance for Protected Areas.Washington, DC: World Bank.
———. 2003b. Indonesia Kerinci Seblat Integrated Conservation and Development Project:Implementation Completion Report. Washington, DC: Indonesia Country Unit, World Bank.
———. 2003c. A User’s Guide to Poverty and Social Impact Analysis. Washington, DC: WorldBank, Poverty Reduction Group and Social Development Department.
———. 2004a. “Community Scorecard Process: A Short Note on the General Methodology forImplementation.” Social Development Department, World Bank, Washington, DC.
———. 2004b. Responsible Growth for the New Millennium. Washington, DC: World Bank.
GIVING THE MOST VULNERABLE A VOICE 125

———. 2005. “Indonesia Coral Reef Rehabilitation and Management Project (COREMAP):Implementation Completion Report.” World Bank, Indonesia Country Office.
———. 2007.“An Enabling Environment for Social Accountability in Mongolia.” Report 32584MN, World Bank, Social Development Department, Washington, DC.
World Bank, and DFID (Department for International Development). 2005. Tools forInstitutional, Political and Social Analysis (TIPS) in Poverty and Social Impact Analysis(PSIA): A Sourcebook for Commissioners and Practitioners, vol. 1. Washington, DC: WorldBank, and London: DFID.
World Health Organization. 2002. World Health Report. Geneva: WHO.
126 STRATEGIC ENVIRONMENTAL ASSESSMENT FOR POLICIES

IF DEVELOPING COUNTRIES ARE TO CRAFT AND NURTUREsustainable policy initiatives that can address externalities in ways that will helpthe environment, they will need long-term constituencies that want to supportsuch policies and can hold policy makers accountable for their performance inimplementing them. Transparency will be the critical quality in the policy processneeded for these constituencies to demand accountability from policy makers.This chapter explores the three key variables of accountability, transparency, andlong-term constituency building as crucial factors in dealing with externalities inorder to protect the environment in developing countries.
The chapter begins by defining some key concepts before constructing a theo-retical framework that brings the essential variables together as part of the policyprocess. The third section presents two case studies illustrating the three variablesin an environmental context. The last section identifies patterns and themesobserved in the case studies.
C H A P T E R 6
Building and Reinforcing SocialAccountability for ImprovedEnvironmental Governance
Harry Blair
127
Harry Blair is a senior research scholar and lecturer in political science at Yale University. Thischapter benefited greatly from comments generously provided by Kulsum Ahmed, SameerAkbar, Giovanna Dore, and Jeff Thindwa, all of the World Bank.

Definitions and Causal Linkages
Several concepts are key to understanding how accountability is used to effectchanges in environmental policy. Each of these concepts is defined here.
Accountability
Except for a few autocrats and top-level elites in corrupt systems, all political actorsare accountable or answerable to someone—the question is, to whom? Only to adictator? Just to elites? To the military? To voters? To the rule of law? In a verygeneral way, the advance of democracy can be gauged by the number and kindsof quarters to which actors are accountable: the more developed the democracy,the greater and more widespread the accountability.1
In “electoral democracies,”accountability comes only through elections (Diamond1999); in full “liberal democracies,” accountability mechanisms include legislativeoversight, civil society advocacy, legal redress (rule of law), a free and active media,and shared power (between branches of government). In a democratic system, tobe sure, elections form the ultimate defense against state mismanagement, offeringthe citizenry a chance to change system managers. In Tocqueville’s famous formu-lation, elections are why “the great privilege of the Americans is to be able to makereparable mistakes,” which, he believed, inevitably occur in a democratic setup(Tocqueville 2000: 216). But elections represent a very crude mechanism for account-ability; they occur only at infrequent intervals and allow no possibility for thecitizenry to exercise anything more than the crudest policy guidance. To hold thestate to account for particular policies or actions (or inactions), more finely tunedinstruments are needed that can function between elections to make specificdemands and intervene in the policy process for specific purposes. This is whereconstituencies come in, for they are the actors making these demands. But withouttransparency, they will not know what to demand or who to demand it from.
Social accountability refers to the accountability of the state to the society as awhole (as opposed to some individual sector of society). This chapter focuses onsocial accountability for environmental protection.
Transparency
In this era of Transparency International as a major think tank in the develop-ment community, transparency tends to be thought as corruption’s antonym—thatis, honesty and probity in the public sector. Countries such as Bangladesh andChad, which score at the bottom of Transparency International’s annual CorruptionPerceptions Index are seen as the essence of state corruption, while those at thetop (Iceland and Finland) are perceived as being the most transparent.
In this chapter, transparency is used differently: to mean openness and acces-sibility of state decision-making processes to public scrutiny. The processes
128 STRATEGIC ENVIRONMENTAL ASSESSMENT FOR POLICIES
themselves may not always be completely honest, but if they are transparent, theirdegree of probity or venality will be open to public view. In every political system,dishonesty is bound to occur from time to time, but if the system is transparentand civil society organizations (CSOs) and especially the media are exercising awatchdog function, the malfeasance will be discovered and publicized. If otheraspects explored in this chapter are working properly, more transparency shouldlead to more system probity.
Constituency
A true constituency is a group genuinely involved in public policy decisionmaking, on both the input and output sides. Constituencies make claims onpolicy decision making; if successful, they benefit from policy implementation.They potentially include state actors (the military, the bureaucracy); voluntaryadvocacy groups (trade unions, environmentalists, professional associations, busi-nesses, business chambers); ascriptively based groups (ethnic minorities, religiousgroups, women, linguistic communities); occupational categories (landlords,sharecroppers, forest loggers, bus operators); residents of a neighborhood orlocality (slum inhabitants, forest dwellers, people living near a factory); andultimately the citizenry at large, especially at times of systemic stress.2
Not every constituency contributes positively to the overall public weal; somecan be damaging. Criminal gangs, timber thieves, environmental polluters, andfanatical religious groups are all constituencies, sometimes powerful ones.
Not every social grouping is a constituency. A constituency has achieved aconsciousness of its identity and has developed an organization of some sort toadvance its interests. In contrast, a social grouping exists only as a taxonomic cate-gory. To paraphrase a Marxist adage, a constituency arises when a group existingin itself has become a group organized for itself.3
The state as a set of constituencies. In this chapter, the “state” includes the publicsector at all levels. Its three branches—executive, legislature, and judiciary—canalso act as constituencies, making demands on the state (such as patronagefunds for legislators feeling jealous of local government units). Two other stateconstituencies—the bureaucracy and the military—often act as powerfulautonomous (that is, not controlled by the main three branches) actors, evidencingstrong ability to garner resources for themselves at public expense and to thwartnew policy initiatives.
Often—indeed, perhaps more often than not in most countries—the inter-ests of these various state constituencies do not run in the same direction. Theexecutive may try to emasculate the legislature and control the judiciary. Thebureaucracy may become more concerned with seeking rents than with imple-menting the policy directives of the executive. The military may vie with thebureaucracy in rent seeking while evading the executive’s attempts to assert
BUILDING AND REINFORCING SOCIAL ACCOUNTABILITY 129

constitutional control over it. All these disorders are common in the devel-oping world (and many of them threaten to emerge in the industrial world aswell at times).
Civil society and civil society organizations. Many constituencies can be said tobe part of “civil society,” long a highly contentious term claimed by various parti-sans for different purposes.4 In the development community, some version ofGordon White’s definition has increasingly become accepted. This definition holdsthat civil society consists of “an intermediate associational realm between stateand family populated by organisations which are separate from the state, enjoyautonomy in relation to the state and are formed voluntarily by members ofsociety to protect or extend their interests or values” (White 1994: 379).5 Civilsociety can also be thought of as a third (nonprofit) sector of organized society,to be distinguished from the public (state) and private (business) sectors.6
An actual civil society constituency generally has some representation in thepolitical process through one or more CSOs that advocate on its behalf.7 Sometimesconstituencies act directly in the political arena, as in voting or rallies and demon-strations (and even spontaneous or orchestrated riots); usually they are representedby CSOs.
Many CSOs are formal organizations, such as a mine owners association or abus drivers union. Others are informal and ad hoc, such as a group of junior mili-tary officers claiming to represent a large sector of the army. Some exist outsidethe state sector altogether (mine owners), while others may have quasi-state status(junior army officers or public sector bus drivers). The key factor is whether aCSO is acting independently of the state.
Often there is contention over who is actually representing whom. There maybe rival mining associations, splits within the bus drivers group, or contentionbetween different groups of military officers. The boundaries between constituencyand civil society can thus be murky. It is important to note that the term constituencydenotes both a group of people able to make some claim on the policy processand representative advocates in the form of CSO(s) working on their behalf.
Some CSOs lack direct or obvious member constituencies. Human rightsorganizations often act on behalf of people they do not know; think tanks mayact in the name of a wider public interest, such as protecting the environment.
The media are the hardest to fit into any civil society taxonomy, because theyusually do not act as advocates for a particular constituency. Their function is todevelop information and provide it to civil society. The media are critical to thedemocratic process; without free media to investigate and publicize state malfea-sance—and to report the political scene more generally—democracy cannot existfor any length of time.
Constituency lifetimes. Constituencies can be short term or long term, tempo-rary or sustainable. Short-term constituencies tend to coalesce in response to
130 STRATEGIC ENVIRONMENTAL ASSESSMENT FOR POLICIES

specific crises (crime in the neighborhood, point-source pollution of a waterresource). While the CSOs representing them may enjoy some success in amelio-rating the immediate problem, they generally do not endure long thereafter, andno constituency remains in any coherent form.
Long-term constituencies have enduring interests and CSOs with organiza-tional skills, resources, and commitment. Examples are business associations,agricultural commodity lobbies, trade unions, and environmental organizations.
Participation
Participation constitutes the flip side of accountability. It refers to the processesthrough which constituencies (usually but not always through CSOs) make claimson the policy process. Voting, lobbying, lawsuits, bribery, demonstrations, lettersto the editor, and petition drives all constitute modes of participation. Withoutparticipation, constituencies cannot demand accountability from the state.8
Strength of the State
A “strong state” is one that can enforce its rules of the political game in sectorssuch as the rule of law, freedom of speech, the right to vote, and minority rights.Accordingly, as used in this chapter, strength is not related to autocracy or to thedegree of centralization the state attempts. Autocratic and highly centralized statesmay well prove unable to enforce their rules, as is the case in many African coun-tries, while democratic and decentralized states can be very strong (as, for instance,in Canada).
Causal Linkages
This section examines how the concepts and variables introduced above can belinked to depict the policy-making process.
Policy Making and Linearity
In the abstract, policy making is a linear process moving logically from initialassessment through formulation and implementation, with a feedback systemprovided by monitoring and evaluation to effect improvements (figure 6.1). Thepresence of constituencies making demands throughout all phases, however, makesthe process distinctly nonlinear (figure 6.2).
The abstract policy process depicted in figure 6.1 becomes a small activitywithin the hexagon at the center of figure 6.2. Constituencies and their represen-tatives are constantly trying to impede, change, embellish, and add to policies orpotential policies, forcing policy formulators to move back to the design stage toinclude new considerations before being able to proceed. An environmental activistgroup, for example, could stall a dam project already approved by the executive,forcing a new environmental impact analysis that takes potentially displaced
BUILDING AND REINFORCING SOCIAL ACCOUNTABILITY 131

floodplain dwellers into account. A coalition of industries might then pressurethe legislature to enhance the preferential rates promised for hydropower gener-ation from the dam. Civil engineers from the military might see an opening forinvolving themselves in flood control, which had been the preserve of the ministryof irrigation, and lobby the legislature to give them a role. Embarrassing news-paper coverage might reveal that the minister of public works had accepted a bribeto award contracts to cronies.
In one sense, all these interventions interfere with the policy-making process,degrading what should be a smooth flow of technical expertise leading from
132 STRATEGIC ENVIRONMENTAL ASSESSMENT FOR POLICIES
Assessment Strategy Design Policyformulation Implementation
Monitoringand
evaluation
Changes asneeded
FIGURE 6.1
Policy Making as a Linear Process
FIGURE 6.2
The Policy-Making Process as It Actually Works
Source: Author.
Source: Author.
Politicalparties
Business
Civil society
Oldelites
Executive
Bureaucracy
Legislature
Judiciary
Military
Int’l NGOs
Foreigndonors
Media
Policy
process

concept to execution. Indeed, they have often been perceived as such within thedonor community. But in another, more important way, the seeming mess depictedin figure 6.2 reflects contributions to the policy-making process. The various stateactors are shown as the nearly autonomous players they so often are, and inter-national actors are included as well. All players endeavor to influence policy makingat all stages; they also try to influence one another (thus the thicket of causalarrows). To the extent that they have the capacity and freedom to do so, the mediaand think tanks try to discern and report on these attempts at influence.
The bureaucracy may interact with the executive and the legislature to drawup policy initiatives while seeking to enhance its own perquisites as a policy isdrafted. It may work with old elites bent on preserving their control of land orinefficient protected industries, as well as with business elements wanting toencourage investment that will displace those old industries.9 It may also workwith CSOs trying to improve the position of their constituents, whose interests(such as higher wages or primary education) likely conflict with those of olderelites. Alternatively, the bureaucracy might side with a military wanting to keepwages down in order to enhance its own recruitment or wishing to divert educa-tion funds to its own activities. And on and on it goes.10
Engines of Environmental Accountability
For environmental accountability to be exacted, there must be institutions thatdemand it. Over time political parties can come to see the value of promotingpolicy initiatives that benefit the environment, as they begin to perceive constituen-cies concerned about environmental issues; this has been a frequent pattern indeveloped countries. The state itself can initiate the process (as the Indonesia casediscussed below suggests). The media are always an essential instrument, for it isthrough them that constituencies can be informed, aroused, and mobilized towork through CSOs, parties, or the courts to seek environmental redress.
CSOs are the primary engine driving environmental accountability, doing soon behalf of constituencies that demand it. Sometimes they do so by advocacydirectly targeting the state, sometimes they do so by appealing to political parties.It is the multiplicity of avenues that gives rise to the knotty and complex webportrayed in figure 6.2. In short, the engines are many and the paths are tangled.
Externalities and Constituencies
Public policy decisions often benefit certain constituencies while imposing costson others. Allowing a mine to discharge its heavy-metal residues into an adjoininglake may kill or poison aquatic life, destroying local fishing industry and injuringthe health of local fish consumers. Permitting loggers to clear-cut a tropical forestwill degrade the soil, increase runoff, and cause downstream flooding and silta-tion. Because long-term constituencies such as mine operators and loggers tend
BUILDING AND REINFORCING SOCIAL ACCOUNTABILITY 133

to be relatively wealthy, they are able to impose negative externalities on the envi-ronment and society in order to direct resources toward themselves. In contrast,groups addressing externalities tend to be more ad hoc, episodic, and less well-endowed with resources. A central challenge to the development community ishow to build and nurture long-term constituencies that can begin to redress exter-nalities and redirect their benefits.
The Danger from Elites
Just as economic elites continuously try to undermine a market economy bycreating oligopolies and oligopsonies, political elites constantly endeavor to attaindominance over policy making by establishing collusion among their own ranks.These tendencies manifest themselves just as much in advanced industrial coun-tries as in the least developed ones. A strong state (in the sense defined above) isneeded to protect against both perversions—to keep traditional elites (such aslandowners and the political class in Latin America or new oligarchs in the formercommunist countries) from dominating while encouraging smaller businesses tooperate in the economic game and less powerful constituencies to participate inthe political game. In environmental terms this usually comes down to the biggerdevelopers—miners, loggers, ranchers, fishers—having more money, better organi-zation, greater access, in short more economic and political clout than thosefavoring environmental protection. But developers do not always win, especiallyif strong pro-environmental constituencies can be built to withstand them, ensuresufficient transparency to discover and disclose what goes on, and use appropriateinstitutions within the political system to demand accountability from the statefor protecting the natural resource endowment.
Linking the Key Variables
Now that the main definitions and concepts have been established, it is possibleto link the key variables. The linkage can be defined as follows: State institutionsand potential polluters must be accountable in law and in practice to legitimatestandards and nonstate constituencies, but accountability cannot be real withouttransparency and participation that extends well beyond elite circles.11
Accountability is the key concept in crafting effective environmental protec-tion efforts. The central task is to promote the development of constituenciesrepresenting those not shown as entrenched players in figure 6.2, so that theycan demand some accountability from policy makers amid the cacophony ofinterests and influences. For them to accomplish this task, transparency will becritical. The principal risk is that virtually any structural arrangements facili-tating involvement of pro-environmental interests in the policy process alsoenables those who are better-off and already more advantaged to enhance theirown positions.
134 STRATEGIC ENVIRONMENTAL ASSESSMENT FOR POLICIES

Case Studies
The two case studies presented here describe successful environmental activism.In the first, two determined environmental CSOs mounted efforts that over timelead to effective initiatives to reduce atmospheric pollution in Delhi. In the second,an Indonesian government agency crafted an initiative to induce factories to reducetheir emissions.
Reducing Air Pollution in Delhi
Sparked by two environmental CSOs, the city of Delhi—certified in the mid-1990s as one of the world’s most polluted cities—managed to reduce air pollutionlevels dramatically by 2004.12,13 Although atmospheric pollution levels stillexceeded international standards, carbon monoxide emissions had fallen 32 percent,and sulfur dioxide levels had fallen 39 percent (http://cities.expressindia.com/fullstory.php?newsid=85665); sulfur dioxide declined another 63 percent, an evenmore dramatic improvement (Time Asia 2004).
Most of these reductions were brought about by cutting vehicular emissions,which had been widely believed to account for some 70 percent of air pollution.Laws designed to control atmospheric contaminants had been on the books sincethe early 1980s, but, as in so many developing countries, enforcement had beenessentially nonexistent. At the beginning of the new millennium, however, thesituation was beginning to change.
In a sense, the solution was simplicity itself: two CSOs—the Indian Councilfor Enviro-Legal Action, led by M.C. Mehta, and the Centre for Science andEnvironment (CSE), led by Anil Agarwal—brought public interest lawsuits andgenerated a high-profile, fact-based, publicity campaign that compelled the govern-ment to enforce the legal requirements. But the story behind this drama is muchmore complex and provides a first-rate example of how civil society activismworks, what is needed to enable it to function, and how it fits into the wider contextof accountability in governance.
Critical success factors. For the key actors in the drama—the Supreme Court ofIndia, civil society, and the media—to have succeeded in imposing new environ-mental standards, several necessary conditions had to be in place, especially inthe legal sector. The Supreme Court had to be autonomous enough from the exec-utive that it could render judgments that were not subject to governmental control.In addition, public interest law had to be an acceptable component of the legalregime—that is, private citizens had to have the right to bring suit against thestate on the grounds that it was not implementing its own laws. Finally, the SupremeCourt had to have attained sufficient public esteem to have the legitimacy to issueorders to the executive that the executive was obliged to implement. The govern-ment could have evaded the Supreme Court’s orders at several points in the course
BUILDING AND REINFORCING SOCIAL ACCOUNTABILITY 135
of the drama—by declaring polluting diesel to be an officially “clean” fuel, forinstance—but it chose not to do so.
The second key group of actors was the CSOs. For these organizations tooperate, freedom of speech and inquiry had to be in place as an enforceable legalnorm. Organizations needed to be able to operate free of government harassmentor intimidation, so that they could conduct their investigations, publicize theirfindings, and bring legal actions in the courts. They also required leadership withsufficient dedication, perseverance, and resources to remain active on the air pollu-tion front over the long haul. M. C. Mehta pursued his first cause—banningindustrial effluents that had been eroding the soft marble exterior of the TajMahal—for a decade before attaining victory in the Supreme Court in 1993. Andthough he launched the air pollution suit in the early 1990s, it was not until 1998that the Supreme Court issued its first comprehensive mandate for eliminatingpollutants. Anil Agarwal established the CSE in 1980; by the 1990s it had the tech-nical expertise to investigate pollution levels and the institutional know-how todisseminate their findings effectively.14 Neither organization was easily dissuaded.
The third actor, the media, needed constitutional guarantees of freedom ofspeech, which, except for the brief period of Indira Gandhi’s “Emergency” rule inthe mid-1970s, they have enjoyed virtually without interruption since independ-ence. They also needed a source of competently researched and understandablefindings to disseminate to their readership.
Taking advantage of public interest litigation provisions, M. C. Mehta askedthe Supreme Court to compel the Delhi government to enforce the clean airlaws that had been passed some 15 years earlier. Responding to the suit—in thecourse of which the government was made aware of the scientific evidence madeavailable by CSE—and conscious of the public awareness created through mediadissemination of CSE’s findings, the Court created a monitoring committee,the Environment Pollution Prevention and Control Authority (EPCA), whichit empowered to make policy recommendations and to which it appointed theCSE as a member. The CSE was thus in a position to make its expertise avail-able to the Court on what amounted to an insider basis while at the same timedisseminating its views to the wider public through the media. Groups opposedto the measures recommended by EPCA—the automobile industry, bus oper-ators, taxi and auto rickshaw drivers, and eventually commuters inconveniencedby strikes and Court-mandated sidelining of buses—were able to take their caseto the Court and the public as well, although in the end they were not able toaffect the outcome.
Taking heed of the recommendations given it by EPCA, the Supreme Courtin effect took charge of the antipollution effort, directing the Delhi governmentto phase out leaded gasoline, eliminate public transport vehicles more than 15 yearsold (the worst offenders), mandate the use of premixed fuel for two-stroke engines
136 STRATEGIC ENVIRONMENTAL ASSESSMENT FOR POLICIES

(which powered some 70 percent of Delhi’s vehicles), and require the use ofcompressed natural gas (CNG) in all Delhi buses. Fortunately, the Court had thelegitimacy to compel the government to carry out these mandates.
Each of the three actors—the Supreme Court, the CSOs, and the media—hada critical role to play. Because they were able to act together, civil society was ableto hold the state accountable in a way that elections by themselves never wouldhave been able to do (because air pollution, though vital to public health, couldnever have become a salient enough issue by itself to determine an election outcome).
Cautionary notes. As with any account of events in the public policy arena, certaincaveats must be noted. First, the process took a very long time. The relevant lawswere enacted in 1981, but even by the mid-1990s little had been done to imple-ment them. Lawsuits filed in 1996 took another six years to yield intermediateresults and culminate in the CNG mandate of 2002. In this case the SupremeCourt and the two sparkplug CSOs stayed the course; attention spans for publicpolicy issues are usually considerably shorter.15
Second, while think tank CSOs such as the two analyzed here clearly have avital role to play in holding the state accountable, they represent at most a verynarrow base of public opinion. Both were self-appointed guardians of the publicinterest, without any broad mandate; neither had a mass grassroots movementsupporting it. M. C. Mehta’s CSO really amounted to a one-man show with asupporting cast. While the CSE was a real organization in its own right, it wasnonetheless a small elite group founded and managed by a charismatic leader,largely dependent on grants from outside sources, and without a membershipbase.16 The wider public was at best informed of the efforts undertaken by theseCSOs rather than involved in formulating them.
Third, while the two CSOs emerged triumphant in this story, they were notthe only civil society players involved. An open civil society means that opponentsof any initiative, not just its supporters, are free to play as well. Automakers, busoperators, and at one point even commuters entered the fray in opposition to theantipollution campaign. This time around, they lost, but in other controversiesopponents of environmental controls often win, sometimes even rolling backearlier victories.
Fourth, the air pollution control initiative was fortunate in that while its firstfew policy forays faltered, it proved possible to find solutions that were techni-cally and logistically feasible. Standards could be set for various pollutants (suchas sulfur dioxide, nitrogen dioxide, or suspended particulate matter), but equip-ment often fails to detect them or can be manipulated to return false negatives(allowing polluting vehicles to pass the test); test inspectors can easily be bribed.Most alarmingly, if diesel were prohibited or restricted or subjected to priceincreases intended to discourage its use, bus operators could easily switch to subsi-dized kerosene, which is just as noxious in terms of effluent.17 More-workable
BUILDING AND REINFORCING SOCIAL ACCOUNTABILITY 137

solutions emerged in the form of selling premixed fuel for two-stroke engines(which actually saved the operators money on repairs), phasing out leaded gaso-line, retiring buses older than 15 years, and mandating the use of CNG in publicbuses. The first measure found favor with end users; the others were relativelyeasy to monitor and enforce. Such solutions would be considerably harder to craftin other environmental situations, however. No-fishing zones and logging restric-tions, for example, would be considerably harder to implement.
Fifth, the Supreme Court wound up not only demanding and monitoring govern-ment compliance with environmental laws but actually managing compliance—ineffect, micromanaging it. One has to ask whether such behavior is the properprovince of a judiciary or should best be left to the executive, even if the execu-tive drags its feet and delivers less than a perfect product. Constitutionally, afterall, it is the executive that is charged with implementing the laws, not the courts.One also has to wonder whether the Court leaned too heavily on CSE for advice.Even granting CSE’s impressive level of technical expertise, it would probably havebeen better to seek a multiplicity of views.18
Sixth, political parties were absent. As a “union territory” in the Indian system,Delhi has an elected government, with political parties regularly contesting control.Ideally, issues of significant salience are taken up by the parties, as part of theirefforts to attract votes. But while air pollution may have been gripping to the elitereaders of the Times of India and other newspapers, it was not absorbing enoughto become a major platform plank for either of the two major Delhi parties inpower over the period under analysis here.19 Civil society therefore had to takeon the entire burden of environmental activism, a role that in other countriesmight be shared with a green party or even a major party.20
Finally, even though the antipollution effort secured major successes, metro-politan Delhi’s air can scarcely be called clean. Buses may be running on CNGand two-stroke vehicles on premixed fuel, but the vehicle population is expandingso rapidly that these gains are being overrun by new threats.21 Data collectedby CSE in May 2005, for example, show that suspended particulate matter,respirable suspended particulates, and nitrogen dioxide exceed internationalmaximum permissible standards by a factor of at least two and in some casesmuch more.
It can also be argued that parallel efforts to reduce industrial pollution (mainlyby moving factories away from urban areas) had a greater impact on improvingair quality than lowering vehicular emissions (World Bank 2005). Other Indiancities face equally serious problems. To claim, then, as the Indian secretary of envi-ronment and forests does, that the country has reversed the environmental Kuznetscurve may be premature.22
In sum, the achievements recorded in this episode are but way stations on a verylong path to attain a cleaner environment in Delhi. They nevertheless clearly show
138 STRATEGIC ENVIRONMENTAL ASSESSMENT FOR POLICIES
that when the right enabling institutional structure is in place with respect to thelegal system, civil society, and the media, it is possible to make significant headway.
Using Public Disclosure to Abate Pollution in Indonesia
Against a backdrop of rapid Indonesian economic growth in the 1980s and early1990s (when industrial growth often topped 10 percent a year), rising pollutioncame to be viewed as a major concern. The state responded with various semi-voluntary and largely ineffective programs. Then, in the mid-1990s, the governmentintroduced a pilot scheme in which industries were to self-report their levels of waterpollution. This Program for Pollution Control, Evaluation and Rating (PROPER)led to significant reductions in pollution levels before being suspended in the wakeof the financial crisis during the late 1990s. After economic recovery (and a demo-cratic transition), a much-enhanced PROPER II was introduced in 2001.
Analysis of PROPER offers many contrasts as well as some interesting simi-larities with the Delhi air pollution saga.23 The program kicked off in early 1995,when the government’s Environmental Impact and Management Agency(BAPEDAL) rated some 187 factories in several river basins in Java, Kalimantan,and Sumatra. The river basins were selected mainly because they participated ina largely voluntary program begun in the late 1980s.24 The factories were askedto submit data on water pollution in terms of biochemical oxygen demand (BOD)and chemical oxygen demand (COD). The data were analyzed, checked wherediscrepancies were noted, and formulated into a five-tier color-coded rankingsystem with two failing (black and red) and three passing (blue, green, and gold)grades, as follows:■ Black: No effort to control pollution■ Red: Some effort to control pollution, but results remain below national standard■ Blue: National standard met in all measures (not just an average among measures) ■ Green: Pollution at least 50 percent lower than national standard in every measure;
basin has proper sludge disposal, good records, and adequate wastewatertreatment system
■ Gold: Demonstrated adherence to international standards for water pollution,air pollution, and hazardous waste.In June 1995, the five factories meeting the green standard were publicly lauded
by the vice president (no factory met the gold standard). All factories privatelyreceived their detailed results, with the understanding that a retest and publicrelease of results would occur by December. It was the public release of the find-ings that gave the program its impact, bestowing honor or shame on the factoriesrated (as well as added or reduced incentive to potential investors). The programgradually expanded, with the number of factories in the program reaching 324by mid-1998.25 During 1995–96, roughly 100 factories submitted self-reportsduring any given month. This figure rose to more than 170 in the following
BUILDING AND REINFORCING SOCIAL ACCOUNTABILITY 139
two years. In addition to encouraging factories to submit self-reports, BAPEDALalso inspected them on a regular basis. During 1995–96 about 200 official inspec-tions were conducted each year.26
In late 1997, the Indonesian economy was hit by the Asian financial crisis.While PROPER I endured for another year or so, with only slightly faltering ratingsdespite a rapidly failing economy, it went into a hibernation phase for the nextseveral years. By July 2001 the now democratic government reactivated the programunder the Ministry of the Environment (KLH), beginning with 85 factories in2002 and expanding to 466 by 2005.
In its reincarnation, PROPER II took on a new look in several dimensions.This time inclusion was mandatory rather than voluntary, and ratings targetednot only water pollution but also air pollution, hazardous waste, and communityrelations. As before, a multitier review structure and initial private disclosure toindividual factories preceded public release of the findings. Of equal importancewas the introduction of a sweeping decentralization initiative undertaken by thegovernment in 1999 (fully effective in 2001), which devolved significant authorityand resources to the provincial and especially the municipal (kota) and regional(kabupaten) level. Among the sectors transferred to the local level was the envi-ronment, meaning that local elected councils (Dewan Perwakilan Rakyat Daerah,DPRD) became responsible for monitoring pollution and enforcing standards.27
Enforcement mechanisms were expanded, with judicial prosecution added topublic disclosure and embarrassment.
Not surprisingly, given the more ambitious standards, there were more egre-gious failures; 33 of the 85 factories (39 percent) received black ratings in the firstround and another 35 percent were rated red, while just 14 (16 percent) wererated blue and only 8 (9 percent) were rated green. As before, however, factoriesupgraded themselves: by 2004 just 3 of the original 85 factories had black rank-ings, while the number of factories with green ratings swelled to 51. As the numberof factories in the program expanded to 466 in the 2005 round, the ratingsimproved, with only 72 factories (15 percent) rating black and 221 (47 percent)rating blue. The green level continued to remain elusive, however, with only 23factories (5 percent) receiving a green rating.28 Press coverage has been ample,29
and CSOs have become involved at the national level, denouncing PROPER forbeing too strict or too lenient with polluters.30
The PROPER II process is a complex one (figure 6.3). It consists of eight mainsteps:Step 1. First data gathering. Factories gather monthly data on air, water, and toxic
wastes and report to KLH.Step 2. Second data gathering. KLH develops database and analyzes the data.Step 3. Data verification. KLH gives pollution data to each factory assessed in
January–February, advising that it will measure again in several months.
140 STRATEGIC ENVIRONMENTAL ASSESSMENT FOR POLICIES
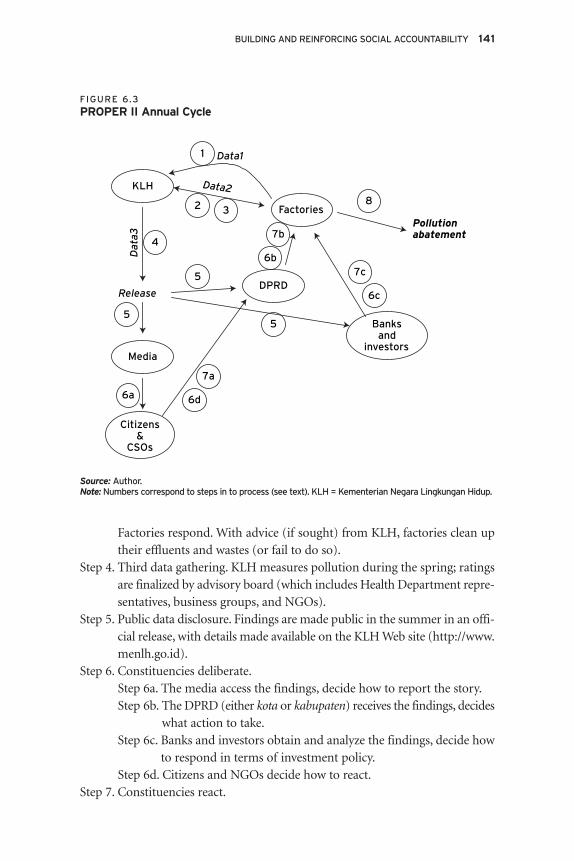
Factories respond. With advice (if sought) from KLH, factories clean uptheir effluents and wastes (or fail to do so).
Step 4. Third data gathering. KLH measures pollution during the spring; ratingsare finalized by advisory board (which includes Health Department repre-sentatives, business groups, and NGOs).
Step 5. Public data disclosure. Findings are made public in the summer in an offi-cial release, with details made available on the KLH Web site (http://www.menlh.go.id).
Step 6. Constituencies deliberate.Step 6a. The media access the findings, decide how to report the story.Step 6b. The DPRD (either kota or kabupaten) receives the findings, decides
what action to take.Step 6c. Banks and investors obtain and analyze the findings, decide how
to respond in terms of investment policy.Step 6d. Citizens and NGOs decide how to react.
Step 7. Constituencies react.
BUILDING AND REINFORCING SOCIAL ACCOUNTABILITY 141
KLH
Factories
Citizens&
CSOs
Media
DPRD
Banksand
investors
Data11
Dat
a3
2 3
4
6a
5
7b
7c
7a
8
Release
Pollutionabatement
Data2
6d
5
5
6c
6b
FIGURE 6.3
PROPER II Annual Cycle
Source: Author.Note: Numbers correspond to steps in to process (see text). KLH = Kementerian Negara Lingkungan Hidup.
Step 7a. Citizens (individuals) and CSOs (groups) lobby DPRD.Step 7b. DPRD decides whether to ignore, admonish, or prosecute facto-
ries ranked black or red.Step 7c. Banks and investors decide whether to redirect loans and invest-
ments.Step 8. Factories take (or fail to take) action on reducing pollution.
Critical success factors. Several factors proved key to success. First, and arguablymost important, PROPER had an energetic champion in a position to push italong and make it work. Nabiel Makarim spearheaded the initiation of PROPER Iand served as its head until he was removed as the program went into its hiber-nation phase in 1999. He then resurfaced in 2001 as minister in charge of the newMinistry of the Environment (KLH) to begin PROPER II. He was able to shepherdboth the ministry and PROPER II through the rapid changes of government in2001–24. Makarim’s successor has continued to promote a strong environmentaleffort at the ministry, threatening to prosecute the 14 firms that received blackratings for the second time in 2005 if they did not improve their performancewithin a month (The Jakarta Post 2005a).
Second, BAPEDAL, the environmental agency, decided at the outset to playfrom its principal weakness as a regulator. Evidently realizing that it could not domuch enforcing of environmental regulations in the ethos of corruption, autoc-racy, and crony capitalism that characterized the Suharto era, BAPEDAL did noteven attempt such an approach. Instead, building on an approach first tried withan earlier project (the PROKASIH project, in which Nabiel Makarim was a keyplayer [Afsah, Laplante, and Makarim 1996]), it relied on a recipe of public disclo-sure and anticipated reaction. It cushioned its disclosures by first releasing its testresults privately to each factory and then allowing a six-month period before aretest and public data release, in order to encourage polluters to clean up. On thefactory side some companies were induced to improve their performance by thecombination of potential bad publicity; increased pressure from the news media,CSOs, and nearby communities; and the negative influence on stock prices andpotential investors. In addition, some managers saw good ratings as helpful to themin obtaining an official certification from the International Standards Organization,which would help with future exports. This strategy substituted with some successfor the inability to prosecute or penalize environmental code violators.31
Third, the combination of self-reports and government inspections provedsufficient to motivate a high level of honesty in the self-reporting process. In thefirst two years of PROPER II, only some factories were inspected, but the possi-bility of inspection evidently induced reasonably honest self-reports. By 2004, allfactories included in the system were reporting self-inspection results monthlyand being inspected at least once a year. These self-inspections (reported to thegovernment) meant that factories could monitor their own progress. In a survey
142 STRATEGIC ENVIRONMENTAL ASSESSMENT FOR POLICIES
of factory managers involved in the PROPER catchment area, this feature of theprogram was selected as first or second most important by more managers thanany of its other aspects (Afsah, Blackman, and Ratunanda 2004).
Fourth, the legal environment supported the program. Environmental Act 23of 1997 established a requirement to monitor environmental compliance withregulations. It required companies to release environmental information andcreated legal rights to environmental information and rights for communities toparticipate in environmental management activities. That the act was passedduring the Suharto period most likely indicates that it was intended as public rela-tions window dressing. In the succeeding democratic era, however, its provisionsare presumably enforceable and justiciable, giving PROPER II significant standingas an environmental initiative while providing civil society and the media the legalunderpinning they need to promote pollution abatement. The media are free tocriticize PROPER, and CSOs can chastise the government when they perceive thatit is insufficiently dedicated to environmental goals.
Fifth, PROPER tailors the data it provides to its audiences, providing complexand specific data for factory managers and environmental experts while dissemi-nating simple and straightforward data for the public and potential investors.PROPER II provides more than 70 indicators for gauging the pollution dimen-sions it tracks; the five-color coding scheme facilitates an instant understandingby the average citizen. A computerized data analysis system enables quick dissem-ination of results that would have taken more than a year to assemble using olderspreadsheet methods.
Sixth, the existence of a sister environmental program provides synergy betweenthe two efforts that surely benefits PROPER. The Good Environmental Governanceprogram (known in Bahasa as the Bangun Praja Program [BPP]) began in 2002as a voluntary initiative through which KLH would monitor municipal waterquality and liquid and solid waste management. BPP operates in a fashion some-what similar to PROPER, in that KLH assesses performance and makes public itsfindings in order to encourage local government responsiveness to citizens andcitizen participation in local governance. By the program’s third year, some 133DPRDs had signed on to the program (Arundhati 2003; Leitmann and Dore 2005).
Finally, the provision of accurate, up-to-date information on pollution meansthat recipients can respond in a timely fashion while the data are still fresh. Factorymanagers can take corrective action, community residents can check claims forimprovement against their own experience from living next to the factories, andpotential investors can better determine where to put their money. The bankingindustry, for example, declared publicly in 2005 that it would not provide loansto companies included on the black list (Bisnis Indonesia 2005).
Cautionary notes. While PROPER has developed an ingenious strategy andachieved some notable successes, there are a number of reasons to be cautious in
BUILDING AND REINFORCING SOCIAL ACCOUNTABILITY 143
assessing the program. First, although it now covers many of Indonesia’s largestfactories and plans to expand to the entire country, PROPER still has a long wayto go before it achieves complete coverage. Indonesia reportedly had some 20,000factories in the mid-1990s; that number has surely expanded considerably sincethen. The 466 factories covered by PROPER II as of 2005 probably represent nomore than 2 percent of the total (though by taking on large factories, it is surelycovering a good deal more than 2 percent of the country’s aggregate pollution).
What are the chances that PROPER II can scale up to anything like completecoverage? It could try to follow the path intended for PROPER I, which plannedto expand by 2000 to cover the worst 10 percent of the country’s factories, whichcontributed 90 percent of total water pollution (Wheeler 2000). With its much moreambitious attempt to monitor air pollutants and toxic wastes, can PROPER II beexpected to attain this level of coverage within any reasonable time frame? To doso would be asking a great deal even in a highly developed country.
Second, and closely allied to the first point, is the issue of local governmentcompetence. The environmental laws of 1999 assign responsibility for environ-mental management to the DPRD. How competent are these councils to dischargetheir duties in this regard? How will they respond to the pressures that are certainto be brought to bear on them from civil society, the national government, andfactories? Given that the kotas and kabupatens had virtually no environmentalresponsibilities before 1999 (and acquired very little experience before the begin-ning of PROPER and its sister programs in 2002), the capacity of DPRD staff,especially its elected council members, to deal with environmental issues will bea major challenge for some time to come.
The KLH can support the learning process on the technical side; the politicalside will likely prove a good deal harder to master, for the council will have tochoose between environmental protection and development, trying to accom-modate and encourage both of these often conflicting goals without compromisingeither. This is a difficult balancing act, as the World Bank (2001, 2003) has recog-nized. Devolution of governance power can facilitate responsiveness to localconcerns, allow local voters to hold government accountable, encourage moresustainable use of resources, and so forth. But it can also facilitate local elitestaking control, steer benefits to themselves at the expense of the general public,and covering up their misdeeds. The track record in decentralization efforts,especially in developing countries, has been mixed at best, in the natural resourcesmanagement sector as well as more generally. In other countries local govern-ment bodies have proven themselves able to hold polluters to account—but theyhave been just as likely to sell out the environment as to protect it.32 Local CSOs,free and vigorous media, and institutions such as user groups can act as a prophy-lactic against such depredations, but their triumph is far from certain and alwaysin danger.
144 STRATEGIC ENVIRONMENTAL ASSESSMENT FOR POLICIES

A third and allied question regards how to craft and strengthen mechanismsthat can build on PROPER to improve the environment in Indonesia. The media,civil society, and the banking sector have become engaged, which is no meanachievement. The media and civil society players spread and magnify unfavor-able publicity (“naming and shaming”), putting moral and social pressure onerrant firms to improve; the banking sector wields the usually more powerful toolof monetary clout. Will these tools be sufficient to the task? Surely they will be insome—perhaps many—cases. But if Indonesian industries are like those in therest of the world, stringent government enforcement of norms will be necessaryto significantly reduce pollution.
The DPRD, which is institutionally charged with responsibility for the envi-ronment, has not yet entered the fray in any substantial way. What can a DPRDdo to encourage firms to improve their environmental performance? Can it setstandards and enforce them by withdrawing licenses, levying fines, or even shut-ting down flagrant violators? The KLH has threatened to prosecute factories ratedblack two times running that have not taken action. But local governments donot appear to have acted on this front, and the issue of jurisdiction (can the centralgovernment bring a legal case in an area reserved by law to local government?) isnot clear. How this will play out over time will be critical.
Fourth, there is the issue of corruption. The Suharto regime was notoriouslycorrupt. Although successor democratic administrations have improved, corrup-tion remains profound at all levels. Given Indonesia’s distinctly unenviable trackrecord in sectors such as logging and mining, it would be surprising if anythingmore than the most gradual rate of expansion in PROPER’s coverage were notaccompanied by serious levels of corruption.33 Self-reports can be faked, andinspectors can be bribed, threatened, or both.
Fifth, while the five-color scheme is a brilliant one in many ways, providingeasily assimilable information, it masks a great deal of very useful information.The key category is the red rating, which indicates that although some effort isbeing made to control pollution, performance falls short of the national standard.This category covers a huge range of performance. The BOD standard for plywoodfactories under PROPER I, for example, was 100 milligrams per liter of discharge;any plant generating more than 100 milligrams would be coded red (assumingthat it had taken at least some minimal effort to deal with pollution). Thus if afactory had reduced BOD effluent from, say, 312 milligrams (one standard devi-ation above the observed mean for all plywood factories) to 104 milligrams—areduction of two-thirds—it would continue to be rated red (López, Sterner, andAfsah 2004). Similarly, a factory that at one rating period was on the verge ofpassing from blue to green status but then fell to just above the red level wouldcontinue to be rated blue, even though its performance had deteriorated badly.Moreover, the BOD rating itself simply measures the amount of pollutant per
BUILDING AND REINFORCING SOCIAL ACCOUNTABILITY 145
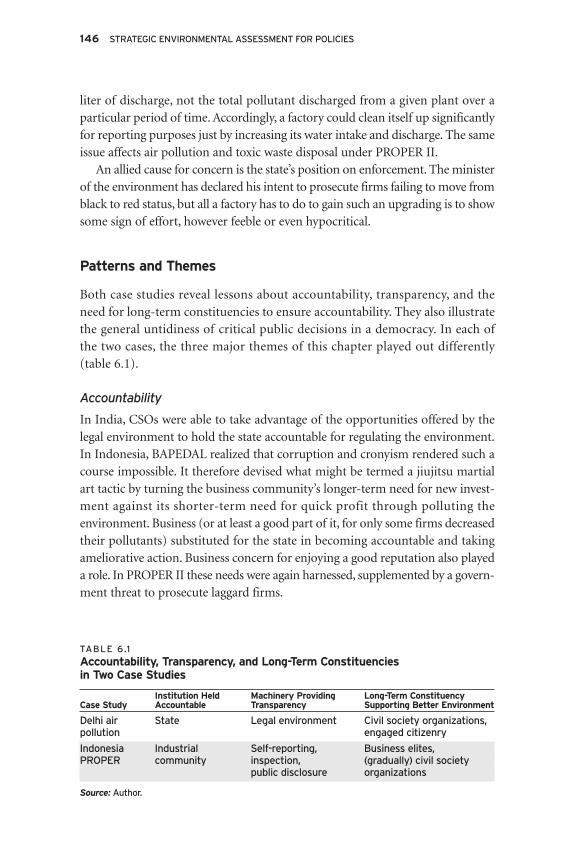
liter of discharge, not the total pollutant discharged from a given plant over aparticular period of time. Accordingly, a factory could clean itself up significantlyfor reporting purposes just by increasing its water intake and discharge. The sameissue affects air pollution and toxic waste disposal under PROPER II.
An allied cause for concern is the state’s position on enforcement. The ministerof the environment has declared his intent to prosecute firms failing to move fromblack to red status, but all a factory has to do to gain such an upgrading is to showsome sign of effort, however feeble or even hypocritical.
Patterns and Themes
Both case studies reveal lessons about accountability, transparency, and theneed for long-term constituencies to ensure accountability. They also illustratethe general untidiness of critical public decisions in a democracy. In each ofthe two cases, the three major themes of this chapter played out differently(table 6.1).
Accountability
In India, CSOs were able to take advantage of the opportunities offered by thelegal environment to hold the state accountable for regulating the environment.In Indonesia, BAPEDAL realized that corruption and cronyism rendered such acourse impossible. It therefore devised what might be termed a jiujitsu martialart tactic by turning the business community’s longer-term need for new invest-ment against its shorter-term need for quick profit through polluting theenvironment. Business (or at least a good part of it, for only some firms decreasedtheir pollutants) substituted for the state in becoming accountable and takingameliorative action. Business concern for enjoying a good reputation also playeda role. In PROPER II these needs were again harnessed, supplemented by a govern-ment threat to prosecute laggard firms.
146 STRATEGIC ENVIRONMENTAL ASSESSMENT FOR POLICIES
TABLE 6.1
Accountability, Transparency, and Long-Term Constituencies in Two Case Studies
Institution Held Machinery Providing Long-Term Constituency Case Study Accountable Transparency Supporting Better Environment
Delhi air State Legal environment Civil society organizations,pollution engaged citizenry
Indonesia Industrial Self-reporting, Business elites, PROPER community inspection, (gradually) civil society
public disclosure organizations
Source: Author.

While the successes in both countries were important, any celebration of themmust be tempered by realistic assessment. Delhi’s air pollution continues to farexceed maximum internationally permitted standards, and the explosion of newvehicles (cars and trucks) not subject to the regulations threatens to undo theprogress made. In Indonesia PROPER II expanded of the list of environmentalwastes it covers (air and toxic wastes are now included as well as water), and thenumber of factories covered rose more than fivefold (from 85 to 466 over a three-year period). Much needs to be done before the country’s more than 20,000factories are included, however, and the national standards (the blue level) remainsignificantly below generally acceptable international yardsticks. Even a cold doseof reality should not obscure the facts, however, that in both countries trans-parency was used to launch initiatives demanding accountability and the supportof constituencies made their success possible.
Transparency
Transparency in Delhi came through the legal environment, which guaranteedfreedom of speech and inquiry and permitted public interest lawsuits, thus allowingCSOs to pursue their advocacy programs. CSOs could investigate malfeasance,publicize their findings, and bring legal action against the state demanding thatit enforce the environmental regulations on its books. All of these activities showedwhat the state was doing or failing to do.
Indonesia was also able to achieve a good degree of transparency, even duringthe Suharto era. As a government organization with an able and determined leader,BAPEDAL was able to gather pollution data, and the media were able to publishit. Bad publicity, combined with concerns for future investment, proved sufficientto effect some improvement (as seen in the higher rankings attained by manyfirms in successive ratings). CSOs had less room for advocacy maneuver than inIndia, and the courts were subservient to the wishes of the executive branch.PROPER I operated with a good degree of transparency, but other elements ofthe system made it difficult for civil society or the legal system to take advantageof the information disseminated to the press.34 PROPER II presents far moreopportunity.
Constituencies
The fundamental long-term constituency in India was the active citizenry—peoplewho participated in civic life by reading newspapers, voting in elections, supportingthe constitution’s division of powers, and showing indignation and anger whenthe operating rules of the political order were flouted. Because these citizensrespond in opinion polls, support candidates for office, and vote, political leadersfound they must pay heed. In Indonesia, an active citizenry was important, for itwas they who read the media’s accounts of pollution and supported CSOs. They
BUILDING AND REINFORCING SOCIAL ACCOUNTABILITY 147

were reinforced by banks and potential investors, who had the power to decidewhether or not to back the firms financially.
When it comes to nurturing these constituencies, elite investors can generallylook after themselves, as they have done everywhere throughout most of modernhistory. Maintaining an active citizenry that will oppose environmental degrada-tion and political corruption is more difficult. Many institutions are required tokeep it in place and dynamic, among them a vibrant media, a vigorous publicdiscourse, self-motivated CSOs, and strong civic education in the school system.High-profile support from national leadership can be a powerful support as well.35
Many players got into the act as each of the two cases unfolded. Of the insti-tutions shown in figure 6.2, all but the military (and perhaps old elites) wereinvolved directly or indirectly in the Delhi air pollution case (figure 6.4). The circleof involved players in the Indonesian example was somewhat smaller (figure 6.5),but over time it came to include all the Indian actors except the parties and thejudiciary. Old elites (including major industrialists from the Suharto era) willnecessarily be drawn in if they have not been already. If and when foot-draggingindustries are prosecuted by the state, as the minister of the environment has prom-ised, the judiciary will get involved, and it surely cannot be too long before at leastsome political party finds some aspect of pollution abatement sufficiently appealingto take on board in its efforts to appeal to voters. It is also likely that the military
148 STRATEGIC ENVIRONMENTAL ASSESSMENT FOR POLICIES
Politicalparties
Business
Civil society
Oldelites
Executive
Bureaucracy
Legislature
Judiciary
Military
Int’l NGOs
Foreigndonors
Media
Policy
process
FIGURE 6.4
Environmental Policy-Making Process for Air Pollution Abatement in Delhi
Source: Author.Note: Significant players shown in boldface italics.

may well have played some shadow role, operating as it does a panoply of busi-ness enterprises, including many industrial ones.36
The role of foreign donors and international NGOs was somewhat obscure inboth cases. The CSE in Delhi, for example, has received grants from the FordFoundation, and it maintains links to international environmental NGOs forexchanging information and experience. WALHI has enjoyed support from anumber of outside organizations, such as Friends of the Earth, Greenpeace, andthe Dutch NGO Novib.37 Both phases of the PROPER initiative received supportfrom the World Bank.
The Role of Civil Society Organizations
CSOs served as catalysts for the Delhi case, but they did not carry the load ofexacting accountability alone. Instead, they initiated processes that enabled otherinstitutions to demand accountability. Environmental activists in Delhi convincedthe judiciary to enforce what the municipal authorities had been required to doby law all along. In Indonesia CSOs had at best minimal involvement during theSuharto era; during PROPER II they have been active on the environmental front,38
although they have not assumed the central role of their counterparts in India.Despite their foreign linkages, the Indian CSOs analyzed here have long been
pursuing self-generated activities. Likewise, although it has long had foreign
BUILDING AND REINFORCING SOCIAL ACCOUNTABILITY 149
Politicalparties
Business
Civil society
Oldelites
Executive
Bureaucracy
Legislature
Judiciary
Military
Int’l NGOs
Foreigndonors
Media
Policy
process
FIGURE 6.5
Environmental Policy-Making Process Under Indonesia’s PROPER II Program
Source: Author.Note: Significant players shown in boldface italics.

connections, WALHI has largely determined its own agendas in the environmentalfield. Unlike some NGOs, especially in the first flush of grant largesse that oftencomes when donors move into new countries, these were not “briefcase NGOs”or “family NGOs” pitching their program agendas to chase foreign funds. BothIndian CSO efforts drew on long experience. The CSE began its work in the early1980s; Mehta’s organization launched its first campaign at about the same time.WALHI dates back to 1980, when it began as a coalition of 10 environmentalNGOs. By the time the issues covered here were taken up, both organizations hadconsiderable experience at public interest initiatives.
CSO internal accountability and transparency per se are not as important asthe accountability and transparency they can demand from the political system.Among the CSOs in the case studies, M. C. Mehta’s enterprise seems largely aone-man operation, while CSE has been a group operation created and nurturedby a charismatic leader. Among successful CSOs, strong, even autocratic leader-ship tends to be the norm, as might be expected in a milieu in which achievementtends to depend more on gritty determination and even obsession than onanything else. It should not, therefore, be surprising that many CSOs are lessthan fully democratic in their internal operations. These organizations are moreimportant for what they do than what they are, however: their worth lies muchmore in their ability to hold the state to account and to represent their constituencythan in their capacity to serve as models for democratic internal management.
The Legal Environment
CSOs in India were able to launch their initiatives by acting within an enforce-able legal environment that sanctioned their activities. Freedom of speech andinquiry were firmly in place, though they had been seriously abridged in the nottoo distant past with Indira Gandhi’s “Emergency” in the mid-1970s. After therestoration of democracy, CSOs could investigate malfeasance and the mediacould report it. Transparency had become a part of the institutional landscape.
Indonesia created a suitable legal environment on paper with its 1997Environmental Act, but during the Suharto era its provisions were barely enforced.It was a government agency, BAPEDAL, that superintended the self-reportingprogram and the release of findings. After Indonesia’s democratic transition, thelegal environment became much more supportive of free speech and inquiry,and CSOs such as WALHI have virtually all the legal room they need to advo-cate their cause.
By itself, however, transparency would not have been enough: the truth hadto be not only discovered but also disseminated through the media. It is hard tooverstress the importance of the media in this regard. It is not just that the truthmust be known to some (a few always know the inside story) but rather thatpeople generally (the public, investors, shareholders) must know it.
150 STRATEGIC ENVIRONMENTAL ASSESSMENT FOR POLICIES
Within the constitutional structure, separation of powers had established itselfsufficiently firmly in India that the Supreme Court enjoyed autonomy from exec-utive control. In Suharto’s Indonesia, all branches of government remained firmlyunder presidential control. The legislature amounted to a rubber stamp, meaningthat the Environmental Act of 1997 was in fact a creation of the executive (incontrast with the decentralization legislation of 1999). Courts could enforce itonly on permission of the executive.39 Fortunately, BADEPAL proved able todevise a system that did not depend on enforcement power from the state but onpublic dissemination to create pressure for abating pollution.
The Process of Public Decision Making
The underlying theme in the two country case studies is the exaction of account-ability from the executive. In neither case was the path to success straightforward.The processes were convoluted in the Delhi case and indirect in the Indonesianone. Indian officials found it difficult if not impossible to set enforceable vehic-ular air pollution standards and to restrict the use of polluting fuels such asdiesel; eventually, more-workable solutions emerged that could be enforced.Indonesian officials devised a scheme under which a weak state seriously pene-trated by cronyism and corruption never had to undertake direct enforcementbut instead could rely on market forces and internal industry incentives toprovide the incentive for pollution abatement.
In the Indian case, civil society advocacy achieved demonstrable results: vehic-ular air pollution in Delhi declined appreciably. In Indonesia the role of civilsociety was more subtle, but CSOs such as WALHI did play roles in reducingfactory pollution significantly.
In many (probably most) settings, assessing outcomes is considerably moredifficult, particularly when it is poor and vulnerable constituencies on whosebehalf advocacy is undertaken. Gauging the effects of efforts to demand account-ability should be a major concern for donors promoting civil society initiatives,as well as others (such as the Indian Supreme Court) that rely on them.40
Conclusion
Accountability, constituencies, and transparency are mutually dependent, in thateach needs the other two to endure if public policy is to be inclusive and improvethe environment on a consistent basis. Accountability will not mean anythingwithout constituencies to exercise it, and constituencies cannot make informeddecisions in demanding accountability without transparency. But accountabilityis the master concept; the other two serve to support it. For it is by holding thestate and polluters accountable that externalities injurious to the environmentcan be reduced and corruption and malfeasance in high office opposed.
BUILDING AND REINFORCING SOCIAL ACCOUNTABILITY 151
The two case studies differ significantly along all three dimensions. In Delhi, itis the state that is held accountable for enforcing environmental standards; inIndonesia it is the industrial community. In Delhi, the legal environment providesthe critical requirements for transparency to function; in Indonesia, the system ofmonitoring and disclosure provides the essential mechanism. In both cases, pollu-tion abatement depends on civil society as a long-term constituency for support;in Indonesia the self-interest of business investors and banks has also been harnessed.
Notes
1 Another way to put this might be in terms of “inclusive decision making,” as analyzed inchapter 3 of this volume.
2 Examples of such times of systemic stress include Viktor Yushchenko’s 2004 OrangeRevolution in Ukraine, in which huge public demonstrations lasted weeks in Kiev (seeKuzio 2005), and the firestorm of protests that erupted in the United States after PresidentRichard Nixon fired his attorney general at the height of the Watergate crisis in 1973. Massmovements or campaigns have taken place over environmental issues as well. Examplesinclude the widespread (and sometimes violent) resistance to British attempts to encloseHimalayan forests in the late 19th century (Guha 1990) and the sizable groups currentlymobilized for and against forest clearance in Amazonian Brazil.
3 Organization here does not necessarily mean formal institutionalization. It can mean agroup pattern of behavior existing over time within an understood set of operating rules,a definition the Orange Revolution demonstrators fully met.
4 For a succinct discussion of the term, see Candland (2001). Ehrenberg (1999) traces theconcept of civil society from Aristotle to Jürgen Habermas and Robert Putnam.
5 White’s definition has become widely (though by no means universally) accepted in thehighly contested realm of specifying the meaning of this term.
6 In this conception of the term, individual business firms are in the private sector, whereasan association representing the business community is part of civil society. For an explo-ration of civil society seen as the larger nonprofit sector, see Salamon, Sokolowski, andAssociates (2004).
7 CSOs often deliver services. This chapter focuses on their advocacy function. For an analysisof how the two functions relate to each other, see Blair (2002).
8 Participation has had a longer history in the development community than any of theother terms used in this chapter, beginning with the perceived necessity to include the “feltneeds” of villagers in the community development initiatives of the 1950s. It has had aconsiderably more checkered career than accountability, beginning with Albert Mayer’swork in Indian community development in the 1940s (Mayer 1958) and Gunnar Myrdal’sdevastating critique in the 1960s (Myrdal 1968).
9 The dividing line between “old elites” and newer “business elements” is hazy at best. Onechallenge for environmental policy making is to convince old elites commanding pollutingindustry to turn themselves into modern entrepreneurs who attract new capital in partthrough operating environmentally sound enterprises.
10 Not all these interests are totally self-seeking. Many bureaucrats feel a duty to deliver theservices they are supposed to deliver; the executive often believes itself to be on a missionto nurture economic growth; business interests often take pride in their products.
152 STRATEGIC ENVIRONMENTAL ASSESSMENT FOR POLICIES
11 Legitimate here means standards enacted and constituencies behaving within parametersestablished through constitutionally determined procedures or operating rules of the game.
12 Except where noted, the facts of this account (but not their interpretation) are drawnlargely from Bell and others (2004). See also World Bank (2005).
13 Delhi’s claim to be the one of the most polluted cities in the world lies partly in itsinclusion in the short list of about 20 large cities monitored and publicized by theWorld Health Organization. In fact, many cities in India have far worse pollution(Agarwal n.d.; UNESCAP 2000, cited in World Bank 2005). Delhi’s pollution iscertainly heavy, however, a fact that has become widely known and commented on byresidents, visitors, and the media. This high level of public awareness undoubtedlymade it easier to gain legal attention for the lawsuits that proved instrumental incurbing pollutant levels.
14 A LexusNexus search of the Times of India (Delhi’s highest-circulation newspaper) andits sister publication the Economic Times (arguably the country’s leading financial daily)yielded some 385 stories mentioning the CSE during the five years ending in May 2005—impressive evidence of the organization’s ability to get its message out to the public.
15 In rare instances an environmental issue—such as the Narmada dam controversy inWestern India—has engaged public attention for more than two decades.
16 The fact that CSE survived the death of its founder-leader, Anil Agarwal, in 2002 andcontinues to thrive indicates that it is much more than a one-man operation.
17 Kerosene subsidies would have been politically impossible to eliminate, because of thewidespread use of kerosene for cooking and lighting among the poor throughout India.
18 CSE’s inside position with EPCA may have given it undue influence. It is typically indus-trial groups that have the inside track in such matters.
19 The Bharatiya Janata Party governed Delhi until the 1998 election, when it lost to theIndian National Congress Party.
20 When in power, both the Bharatiya Janata Party and the Congress Party proved willingto follow Supreme Court mandates on air pollution. Politicians of both parties, eventhose who had opposed various aspects of the pollution control effort, took public creditfor Delhi’s cleaner air in the 1998 elections. Thus in the end parties did get involved.
21 The number of vehicles in Delhi rose from less than 250,000 in the mid-1970s to 3.7 millionin 2003 and is expected to reach 6 million by 2011, with trucks and private passenger carsconstituting a very large proportion of the increase—a vivid testimonial to the conse-quences of economic growth in India (Times of India 2004a, 2004b).
22 Nobel laureate Simon Kuznets posited that as a country develops economically, incomeinequality initially rises. The “environmental Kuznets curve” holds that environmentalpollution increases and then decreases with per capita income along a similar invertedU-curve. Ghosh (2004) claims that India has begun to reverse the curve at a muchearlier point (in per capita income terms) than international experience would havepredicted.
23 Unless otherwise indicated, factual information about PROPER comes from Afsah andDore (2005).
24 This was the PROKASIH program. For an analysis, see Afsah, Laplante, and Makarim (1996).
25 Data in this paragraph are from Wheeler (2000).
26 Data for PROPER I are from Wheeler (2000); Blackman, Afsah, and Ratunanda (2004); andLópez, Sterner, and Afsah (2004).
BUILDING AND REINFORCING SOCIAL ACCOUNTABILITY 153

27 Each kabupaten and kota has a DPRD (the urban kotas exist independently of the largelyrural kubupatens). The number of DPRDs has been expanding, from less than 300 whenthe decentralization law was passed in 1999 to more than 430 by 2003. The number ofpeople living in a kabupaten or kota ranges from less than 25,000 to more than 4 million,with an average of roughly 500,000 (World Bank 2003). Among other provisions, the 1999law more than doubled the subnational share of public expenditure.
28 For PROPER I and especially PROPER II, factories that were rerated in successive yearsimproved markedly. Forty of the 112 plants rated black or red in June 1995 had progressedto blue by July 1997. There was also some retrogression, with 16 factories falling from blueto red over the same period (López, Sterner, and Afsah 2004). Under PROPER II of the63 plants rated black or red in 2002, only 26 continued to be so rated by 2004.
29 PROPER findings were given a front-page story and a lead editorial in the leading Englishdaily, The Jakarta Post (2005a, 2005b). The report was accorded even more extensivecoverage in the country’s most widely circulating Bahasa language daily, Kompas (2005a,2005b). While the newspaper emphasized the worst performers, it listed all ratings on itsWeb site at http://www.menlh.go.id/proper/.
30 On the day following publication of PROPER’s findings, the Federation of IndonesianMetalworking and Machine Industry Associations denounced PROPER for demandinghigher standards than factories could afford (Hakim 2005); a few days later, one of thecountry’s most prominent environmental CSOs, Wahana Lingkungan Hidup (WALHI),criticized KLH for awarding two green labels it thought were undeserved (WALHI 2005).
31 See Blackman, Afsah, and Ratunanda (2004) for an analysis of the PROPER I disclosureprogram, including a survey of factory participating factories.
32 For a more general analysis of the promise and problems, see Blair (2000) and Manor(1999). For an analysis of local governance and natural resource management, see Blair(1996). Indonesia’s new decentralized governments have not proven immune to the lureof corruption (Borsuk 2003).
33 In its 2005 survey, Transparency International ranked Indonesia 137th out of 159 coun-tries in its Corruption Perceptions Index. India ranked 88th that year (TransparencyInternational 2005).
34 The regime in Indonesia during the 1990s might best be described as one of “soft authori-tarianism”; restrictions on free speech, the media, and civil society were in place but notharsh (Sen and Hill 2000; Eldredge 2002).
35 On Indonesia’s Earth Day in June 2005, President Susilo Bambang Yudhoyono delivereda widely publicized speech urging the public to get involved in campaigns to press gover-nors, mayors, and regents to clean up their localities (Witular 2005).
36 In Indonesia, the military receives only a small fraction of its budget as an official govern-ment appropriation. It is expected to generate the vast bulk of its revenues from its ownmoney-raising efforts, most of which involve business operations.
37 WALHI provides a list of donors on its Web site (http://www.walhi.or.id/pusinfo/).
38 A vigorous environmental activist initiative has also been directed at the U.S.–basedNewmont Mining Company, the world’s largest gold producer (Perlez and Rusli 2004;Perlez 2004, 2005).
39 In 2004, the judiciary officially became independent of the executive branch in Indonesia;it remains to be seen how effective this separation will be (U.S. Department of State2005).
40 For more on measuring civil society advocacy outcomes, see Blair (2004) and Hirschmann(2002).
154 STRATEGIC ENVIRONMENTAL ASSESSMENT FOR POLICIES

References
Afsah, Shakeb, Allan Blackman, and Damayanti Ratunanda. 2004. “How Do Public DisclosurePollution Control Programs Work? Evidence from Indonesia.” Discussion Paper 00–44Resources for the Future, Washington, DC.
Afsah, Shakeb, and Giovanna Dore. 2005. “Instituting Environmental Programs in DevelopingCountries: The Case of Indonesia’s PROPER Program.” Draft background paper. WorldBank, Environment and Social Development Sector Unit, East Asia and Pacific Region,Washington, DC.
Afsah, Shakeb, Benoit Laplante, and Nabiel Makarim. 1996. “Program-Based Pollution ControlManagement: The Indonesian PROKASIH.” Policy Research Working Paper WPS 1602,World Bank, Washington, DC.
Agarwal, Anil. n.d. “When Will India Be Able to Control Pollution?” http://www.cseindia.org/html/au/anilji/airpollution_next.htm.
Arundhati, Sri Tantri. 2003. “Bangun Praja Program.” Note for Second Meeting of theKitakyushu Initiative Network (Mayors’ Segment).” Weihai, China, October 17. http://www.iges.or.jp.
Bell, Ruth Greenspan, Kuldeep Mathur, Urvashi Narain, and David Simpson. 2004. “Clearingthe Air: How Delhi Broke the Logjam on Air Quality Reforms.” Environment 46 (2): 22–39.
Blackman, Allen, Shakeb Afsah, and Damayanti Ratunanda. 2004. “How Do Public DisclosurePollution Control Programs Work? Evidence from Indonesia.” Human Ecology Review11 (3): 235–46.
Blair, Harry. 1996. “Democracy, Equity and Common Property Resource Management in theIndian Subcontinent.” Development and Change 27 (3): 475–99.
———. 2000.“Participation and Accountability at the Periphery: Democratic Local Governancein Six Countries.” World Development 28 (1): 21–39.
———. 2002.“Civil Society, Advocacy, Service Delivery, Non-Governmental Organizations, andUSAID Assistance: A Mapping Exercise.” Paper prepared for the Center for DevelopmentInformation and Evaluation, U.S. Agency for International Development. ManagementSystems International, Washington, DC.
———. 2004. “Assessing Civil Society Impact for Donor-Assisted Democracy Programs: Usingan Advocacy Scale in Indonesia and the Philippines.” Democratization 11 (1): 77–103.
Borsuk, Richard. 2003. “In Indonesia, a New Twist on Spreading the Wealth: Decentralizationof Power Multiplies Opportunities For Bribery, Corruption.” Wall Street Journal, EasternEdition, January 29.
Bisnis Indonesia. 2005. “Companies with Bad Environment Management Not to Get Loansfrom Banks.” Bisnis Indonesia, Jakarta, June 24.
Candland, Christopher. 2001. “Civil Society.” In The Oxford Companion to Politics of the World,ed. Joel Krieger, 140–41. New York: Oxford University Press.
Diamond, Larry. 1999. Developing Democracy: Toward Consolidation. Baltimore, MD: JohnsHopkins University Press.
Ehrenberg, John. 1999. Civil Society: The Critical History of an Idea. New York: New YorkUniversity Press.
Eldredge, Philip J. 2002. The Politics of Human Rights in Southeast Asia. London: Routledge.
Ghosh, Prodipto. 2004. “Harmonizing Environmental Concerns and Economic Growth: TheIndian Perspective.” Environment Matters (Annual Review, July 2003–June 2004): 10–11.
BUILDING AND REINFORCING SOCIAL ACCOUNTABILITY 155

Guha, Ramachandra. 1990. The Unquiet Woods: Ecological Change and Peasant Resistance inthe Himalaya. Berkeley: University of California Press.
Hakim, Zakki P. 2005. “Govt Environmental Audit Improper, Untimely: Industry.” The JakartaPost, August 10.
Hirschmann, David. 2002. “‘Implementing an Indicator’: Operationalizing USAID’s AdvocacyIndex in Zimbabwe.” Development in Practice 12 (1): 20–32.
The Jakarta Post. 2005a. “Cost of Environment.” Editorial, August 12.
———. 2005b. “Top Firms Get Poor Marks on Environment.” August 9.
Kompas. 2005a. “Peringkat hitam bakal digugat.” August 9.
———. 2005b. “Perusahaan hitam keluhkan proporsi.” August 10.
Kuzio, Taras. 2005. “The Opposition’s Road to Success: Ukraine’s Orange Revolution.” Journalof Democracy 16 (2): 117–30.
Leitmann, Joe, and Giovanna Dore. 2005. “Better Environmental Governance: Improving theRole of Local Governments and the Private Sector in Indonesia.” Presentation preparedfor the Environmentally and Socially Sustainable Development Week, World Bank,Washington, DC.
López, Jorge Garcia, Thomas Sterner, and Shakeb Afsah. 2004. “Public Disclosure of IndustrialPollution: The PROPER Approach for Indonesia?” Discussion Paper 04–34, Resources forthe Future, Washington, DC.
Manor, James. 1999. The Political Economy of Democratic Decentralization. Washington, DC:World Bank.
Mayer, Albert. 1958. Pilot Project India: The Story of Development at Etawah, Uttar Pradesh.Berkeley: University of California Press.
Myrdal, Gunnar. 1968. Asian Drama: An Inquiry into the Poverty of Nations. New York:Pantheon.
Perlez, Jane. 2004. “Mining Giant Told It Put Toxic Vapors into Indonesia’s Air.” New YorkTimes, December 22.
———. 2005. “Cause of Mystery Ills Splits Indonesian Village.” New York Times, March 27.
Perlez, Jane, and Evelyn Rusli. 2004. “Spurred by Illness, Indonesians Lash Out at U.S. miningGiant.” New York Times, September 8.
Salamon, Lester M., S. Wojciech Sokolowski, and Associates. 2004. Global Civil Society:Dimensions of the Nonprofit Sector, vol. 2. Bloomfield, CT: Kumarian Press.
Sen, Krishna, and David T. Hill. 2000. Media, Culture and Politics in Indonesia. Melbourne:Oxford University Press.
Time Asia. 2004. “Choking on Growth.” December 13.
Times of India. 2004a. “Green Mirage: Delhi’s Air is Murkier.” September 23.
———. 2004b. “Inching towards a Greener Delhi?” June 7.
Tocqueville, Alexis de. 2000 [orig. 1835, 1840]. Democracy in America, trans. and eds. Harvey C.Mansfield and Delba Winthrop. Chicago: University of Chicago Press.
Transparency International. 2005. “Corruption Perceptions Index 2005.” http://www.transparency.org.
U.S. Department of State, Bureau of Democracy, Human Rights, and Labor. 2005. “Indonesia.”In Country Reports on Human Rights Practices, 2004. Washington, DC. http://www.state.gov/g/drl/rls/hrrpt/2004/41643.htm.
WALHI (Indonesian Forum for Environment). 2005. “WALHI and JATAM Question GreenLabel for Newmont and RAPP.” Press release, August 12.
156 STRATEGIC ENVIRONMENTAL ASSESSMENT FOR POLICIES
Wheeler, David. 2000. Greening Industry: New Roles for Communities, Markets and Governments.New York: Oxford University Press for the World Bank.
White, Gordon. 1994. “Civil Society, Democratization and Development (I): Clearing theAnalytical Ground.” Democratization 1 (3): 56–84.
Witular, Rendi A. 2005. “Susilo Wants Public to Shame Dirty Cities.” The Jakarta Post, June 7.
World Bank. 2001. Indonesia: Environment and Natural Resource Management in a Time ofTransition. Washington, DC: World Bank.
——. 2003. Decentralizing Indonesia: A Regional Public Expenditure Review, Overview Report.Report 26191-IND, World Bank, East Asia Poverty Reduction and Economic ManagementUnit, Washington, DC.
———. 2005. For a Breath of Fresh Air: Ten Years of Progress and Challenges in Urban Air QualityManagement in India, 1993–2002. New Delhi: South Asia Region, Environment and SocialDevelopment Unit, World Bank.
BUILDING AND REINFORCING SOCIAL ACCOUNTABILITY 157


THIS CHAPTER EXAMINES how “learning” occurs in the context of environ-mental policy formulation and implementation. It identifies ways in which learningcan be enhanced to improve policy making and implementation.
The chapter begins with an overview of key types of learning apparent in orga-nizational and environmental policy contexts. It then analyzes examples drawnfrom the experiences of Brazil and South Africa. It concludes by identifying threesets of factors affecting environmental policy learning: priority or agenda setting,stakeholder access and representation, and accountability.
Two cautionary notes are warranted. First, the approach presented here runs therisk of portraying learning as a rational and technocratic endeavor rather than amessy process embedded in social, political, and cultural ambiguities. Second, thereis a risk of romanticizing learning (how can learning be anything but good?). Inpractice, learning processes are imperfect and do not easily lead to improvementsin organizational behavior, suggesting a need for conservatism in expectations.
C H A P T E R 7
Learning in EnvironmentalPolicy Making andImplementation
Alnoor Ebrahim
159
Alnoor Ebrahim is the Wyss Visiting Scholar at the Harvard Business School and a VisitingAssociate Professor at the John F. Kennedy School of Government, Harvard University. He isgrateful to Blake Kehler for his able research assistance. He would also like to thank MargaretKeck, Len Ortolano, and the volume editors for their comments and feedback, as well asDavid Bonbright, Faranak Miraftab, Peter Mollinga, and E. M. Shashidharan for usefulresources and insights.

As Levinthal and March (1993: 110) note, “Conservative expectations, of course,will not always enhance the selling of learning procedures to strategic managers,but they may provide a constructive basis for a realistic evaluation and elaborationof the role of learning in organizational intelligence.” Policy contexts are morecomplex than organizational ones. Given the appeal of incremental, rational, anddeliberative change, it is tempting to overemphasize the importance of learning.In fact, learning is best viewed as a modest element in a politicized process ofsocial change and control.
What Is Organizational Learning?
There is a considerable body of literature on organizational learning, drawn largelyfrom the fields of organizational sociology and management.1 Organizations canbe seen as learning “by encoding inferences from history into routines that guidebehavior” (Levitt and March 1988: 320) or by “improving actions through betterknowledge and understanding” (Fiol and Lyles 1985: 803). According to these defi-nitions, generating knowledge is not enough: learning also involves the use ofknowledge of past experience to influence organizational practices.2 Simply iden-tifying shortfalls in organizational performance and assuming that the organizationwill use the information to improve performance is insufficient for effecting change.
In their widely cited work, Argyris and Schön (Argyris 1992; Argyris and Schön1996) suggest that learning occurs at two basic levels in an organization—thesingle loop and the double loop. The single loop is “concerned primarily witheffectiveness: how best to achieve existing goals and objectives, keeping organiza-tional performance within the range specified by existing values and norms”;the double loop involves “inquiry through which organizational values and normsthemselves are modified” (Argyris and Schön 1996: 22). Both single- and double-loop learning involve an iterative process in which information is processed inorder to affect decisions.
Most models of organizational learning envision a cycle of four main steps,conceived in technocratic rather than political terms:■ Acquiring information about the organization and its environment■ Generating knowledge, by analyzing and interpreting information or reflecting
on action■ Applying knowledge to organizational activity or experimenting with new ideas■ Encoding knowledge and experience into routines or memory.
Knowledge and action occur in tandem: knowledge can inform and guide action,and knowledge can be generated by reflecting on action. The cycle is iterative: inan ideal setting knowledge is constantly being modified based on new informa-tion and feedback, as a result of which, routines are constantly being refined.
Although learning is often viewed through such a rationalist and normativelens, in which the filtering and processing of stimuli are viewed as an objective
160 STRATEGIC ENVIRONMENTAL ASSESSMENT FOR POLICIES
and empirical process, learning processes are frequently subject to a series of socialand institutional processes that are interpretative, symbolic, and power-laden. Forexample, policy and program evaluations can be undertaken for the symbolicpurpose of legitimating existing activities rather than identifying areas for improve-ment. Organizations often engage in such ceremonial activities, some of whichmay involve the decoupling of information from decisions (Meyer and Rowan1977; Feldman and March 1988). In addition, the information that receives atten-tion in a decision process is not necessarily the information that would be mostvaluable for improving effectiveness or performance. As Cohen, March, and Olsen(1972) note in their “garbage can” model of decision making, it is sometimes theserendipitous confluence of actors and information in one place at one time thatdetermines which decisions are made.3
Learning in a policy context is considerably more complex than learning inorganizations for a variety of reasons, including, but not limited to the following:■ Policy making and implementation involve multiple organizational actors and
political interests.■ Policy making occurs in a political arena, while implementation occurs in an
administrative one. (This distinction is porous and sometimes artificial.)■ Time lags between policy making and policy implementation are long, often
extending several years if not decades.■ Causal relations between policy choices and impacts are difficult to establish
or predict, given the large number of possible variables and confounding factors.What this suggests for examining learning in policy contexts is that it makes
sense, at the very least, to examine policy processes over long time frames and tohave conservative expectations about the potential for actual learning. It alsosuggests that a multistakeholder approach to examining policy can be useful foridentifying options, alternatives, and differential impacts.
The seminal work of Pieter Glasbergen (1996, as described in Fiorino 2001:324) on environmental policy in the Netherlands distinguishes three kinds ofpolicy learning:■ Technical learning involves “a search for new policy instruments in the context
of fixed policy objectives. Change occurs without fundamental discussion ofobjectives or basic strategies.” This type of learning may be viewed as a formof single-loop learning, because it does not involve the questioning of basicgoals, objectives, or problem definitions. The approach of policy makers toenvironmental problems is hierarchical and prescriptive, drawing on instru-ments with which they are familiar (regulations, oversight, and enforcement).
■ Conceptual learning involves “a process of redefining policy goals and adjustingproblem definitions and strategies.” In this type of learning, policy objectives aredebated and strategies reformulated. Because it requires new conceptualizationsof problems and objectives (such as sustainability and ecological moderniza-tion), this type of learning may be viewed as a form of double-loop learning.
LEARNING IN ENVIRONMENTAL POLICY MAKING AND IMPLEMENTATION 161
■ Social learning involves both technical and conceptual learning, but “it emphasizesrelations among actors and the quality of the dialogue.” It stresses the importanceof multistakeholder views and information for improving both technical andconceptual learning.These three types of learning can be viewed as complementary rather than
mutually exclusive. They are linked by the fundamental precept of policy learningof iterative attention to and deliberation on policy issues. In technical learning,such iteration and deliberation are focused on improving policy instruments andtheir implementation; in conceptual learning, they emphasize policy goals andobjectives. In social learning, the broader question of how multiple perspectivescan enhance dialogue becomes more important.
Glasbergen’s typology suggests that the institutional context of learning iscrucial, because it shapes the relationships between actors and the quality ofsocial learning. It is, therefore, impossible to separate learning about environ-mental policy from the legislative, legal, administrative, and democratic institutionsthat frame it. This linkage implies the need for reservation and caution in attemptsto transfer policy successes in one country to another, given the variation in insti-tutional contexts.
The “ideal-type” categorization by Glasbergen downplays at least two key factorsthat affect every stage of a learning cycle: bounded rationality and relationshipsof power. First, organizations and policy makers are limited in terms of the infor-mation they can collect and their ability to analyze and interpret it.4 They are only“boundedly rational,” unlikely to be able to make informed decisions without theparticipation of other stakeholders who possess other relevant information (Marchand Simon 1958). This is especially true of environmental policy contexts, inwhich there are multiple and interdependent issues concerning natural resources,public health, the economy, and environmental justice.
Second, relations of power frame the context in which policy making andimplementation occur. In environmental policy contexts, conventional divisionsbetween industry and environmental groups tend to portray policy choices aszero-sum games, pitting one set of technical experts against another. The “winners”in such cases are adept at advancing fixed policy positions (Nilsson 2005). Theremay be little social learning in such instances, however, given the absence of delib-erative dialogue between actors. Understanding the social and political context ofpolicy making, including relationships of patrimonialism and clientelism, is thusimportant for identifying possible avenues for and barriers to learning.
Given that each actor brings to the table a unique constellation of cognitivecapacities and institutionalized relationships of power, learning is likely to be severelylimited by these constraints of capacity and power. An approach to policy learningthat involves collective engagement among actors has the potential to reduce tech-nical uncertainty while providing openings for addressing political conflict. This
162 STRATEGIC ENVIRONMENTAL ASSESSMENT FOR POLICIES
approach resonates with the broader discussion in this volume on the necessityfor an adaptive and inclusive methodology for strategic environmental assessment.
Framing Policy Learning
While it is possible to draw theoretical distinctions among the technical, concep-tual, and social types of policy learning, actually observing policy learning inpractice is exceedingly difficult. How can one gauge, for example, the extent towhich dialogue and deliberation by diverse actors (that is, social learning) or simplepolitical coercion accounted for a policy change? Does empirical evidence andtechnical information (that is, technical learning) actually influence policy makers,or do they tend to make policies based on convictions and political interests?
To determine whether a policy change was a result of learning, one would needempirical evidence to link behavioral change by policy makers or implementingagencies to information gathered and assessed as part of a deliberate or routinizedprocess. One would need to identify who was learning, what was learned, andhow it was learned while ruling out other plausible explanations for policy change.
These methodological demands cannot be met in a chapter such as this, whichrelies entirely on secondary data. The aim here is more modest: to provide apreliminary conceptual framing for policy learning, followed by an examinationof two developing country cases based on limited secondary information.5
The framework draws on Glasbergen’s premise that policy learning is inher-ently social, in that relationships and dialogue between actors are important evenin technical discussions. Such a process relies on at least three themes that emergerepeatedly throughout this volume:■ Agenda or priority setting. If an environmental issue is deliberated by policy makers
through a process based either on the systematic collection and consideration ofempirical evidence (an adaptive management model) or an inclusive process ofcommunity participation (an inclusive management model), a policy learningprocess is at work.6 In contrast, if the discussion of an environmental issue andits presence on the agenda is ad hoc or primarily a result of individual or interestgroup politics, opportunities for learning are less likely. It is thus necessary tounderstand the political context within which policy priorities are established.This context is likely to vary both across and within states. Key questions includethe following: What are the mechanisms through which environmental priori-ties are identified and placed on policy agendas? Through which mechanisms dosuch priorities receive repeated attention that enables incremental improvementover time? Who has access and influence in setting these priorities? Adaptive orinclusive approaches do not necessarily precede agenda setting; in practice theyare more likely to follow it. A key concern for learning purposes is thus how tofocus repeated or iterative attention to a set of policy issues.
LEARNING IN ENVIRONMENTAL POLICY MAKING AND IMPLEMENTATION 163

■ Stakeholder access and representation in policy formulation. If policy learning isa deliberative and multistakeholder process, it is necessary to pay attention tohow participation is operationalized and whether it is simply a consultativeprocess (in which participants have limited influence) or a negotiated one (inwhich participants have greater influence). Key questions include the following:Through what mechanisms are multiple stakeholders brought into policy-making processes? Who participates in the process, and who has the power tochoose or identify participants? Is their participation limited to “voice” or dothey have actual “influence”?7
■ Accountability in implementation. A key challenge for policy making in devel-oping countries lies in implementation, which can be hindered by a rangeof factors, including a lack of resources and enforcement of laws and regu-lations. The presence of accountability mechanisms, such as transparencyand right-to-know laws, monitoring and evaluation systems, inspectorsgeneral, and forms of judicial redress, can have an impact not only on imple-mentation but also on the seriousness with which stakeholders engage thepolicy-making process itself. Policy learning requires feedback loops throughwhich implementation results are linked to a new round of policy making.Key questions include the following: Once a set of policies is developed, whatmechanisms ensure implementation? What forms of redress and conflictresolution are available to stakeholders? How are the effects of policies andtheir implementation monitored and fed back to policy makers and otherstakeholders? Such scrutiny and iterative attention are important for bothlearning and accountability.Attention to mechanisms in each of these three areas can arguably foster a
climate that is more amenable to policy learning.8 However, although agendasetting, representation, and accountability appear to be central to policy learning,they are not sufficient conditions for policy learning, given the political nature ofpolicy making. They may, nonetheless, help overcome two key constraints onlearning raised in the previous section: bounded rationality of policy makers andimbalances in relationships of power. These components of policy learning aredepicted in figure 7.1. At the center of the figure is the conventional technicallearning process, which is embedded in a much more complex conceptual andsocial learning environment that includes the three key elements described above.
Cases of Policy Learning
A key challenge facing developing countries face is the need to integrate economicdevelopment with environmental quality in a way that recognizes the trade-offs(Tobin 2003; Pearce 2004) while building supportive governance structures andthe capacities of legislatures, bureaucracies, and courts for effective policy making(Durant, Fiorino, and O’Leary 2004). Many developing countries have good
164 STRATEGIC ENVIRONMENTAL ASSESSMENT FOR POLICIES

environmental legislation; the core challenges lie in implementation (Turner andHulme 1997; Brinkerhoff and Gage 2002).
A caveat is necessary before proceeding to the case material. The cases outlinednext are not assessments of environmental policy or policy learning. Because ofthe reliance on secondary materials and the difficulties in observing and opera-tionalizing learning at the policy level, they are intended only to illuminate policylearning challenges and questions. The tentative nature of this task is amplifiedby the fact that the case materials rarely, if ever, explicitly cite “policy learning.”The connections drawn to learning are imputed in order to identify key issues forfurther empirical investigation.
Brazil: Making Policy in a Patrimonial Context
Much of the discussion on policy making in Brazil is characterized by repeatedreference to an entrenched feature of politics: patrimonialism.9 Patrimonialism
LEARNING IN ENVIRONMENTAL POLICY MAKING AND IMPLEMENTATION 165
Technical Learning Environment(Adaptive Management)
Policy Decisions
PolicyImplementation
Impact/OutcomeAssessment
(Monitoring & Evaluation)
(Constrained by boundedrationality, power hierarchies)
Social Learning Environment(Inclusive Management)
Access &Representation
• Who participates, and at what stages of policy making?
• Who chooses?
• Are there rights to participation?
• Is participation based on voice or influence?
Accountability
• What are the roles of stakeholders in implementation, monitoring & evaluation?
• What forms of redress and conflict resolution are available?
• How are the effects of policies monitored and evaluated? Conceptual Learning Environment
Agenda Setting
• What are policy priorities?• How and by whom are priorities identified?
• How can issues receive repeated attention?
FIGURE 7.1
Policy Learning as a Technical, Conceptual, and Social Process
Source: Author.

includes various forms of clientelism, rent-seeking, patronage, and co-optation,usually for purposes of personal gain rather than group or ideological interests.10
One skeptical observer of Brazil’s political context argues that “[t]here has beensuch a concentration of power in the hands of the State” that “civil society hashad very little room to organize itself” and that legislative and electoral processesfall far short of representing the plurality of interests in Brazilian society (Guimarães2002: 231–32). He suggests that Brazil’s environmental protection agency hasalways played a marginal role in environmental policies, because of its emphasison solving case-by-case problems and emergencies after they arise rather thanpreventing them and because of its dependence on political figures to championspecific causes.
Other observers, while agreeing on the relatively weak role of federal environ-mental policy making in Brazil, have suggested that Guimarães’ account does notpay sufficient attention to Brazil’s federated structure, in which considerable regu-latory authority falls to individual states. A more-nuanced picture emerges in Amesand Keck’s (1997–98) study of environmental policy making in the states of MatoGrosso, Paraná, Pernambuco, and Rondônia.11 They confirm the political natureof policy making and its clientelist form at both the federal and state levels, observingthat while federal and state assemblies often convene commissions to investigatecharges of environmental abuse, they rarely exercise effective oversight.
At the same time, Ames and Keck point to the need to understand how local institutions mediate the policy process. They identify four factors thataffected policy learning in the four states through their impact on clientelism,multistakeholder participation, and capacity:12
■ Competitiveness in state politics. In Pernambuco “a long history of competingelites has produced a highly competitive and politically organized society, inwhich clientelism is held somewhat in check by a mass politics that requiressubstantive results to maintain popular support.” In Paraná private businessactivities are more highly valued than politics, and clientelism is somewhat lesspervasive. In contrast, in Mato Grosso extreme competitiveness has led toviolence and a “Colombia-like accommodation among the state’s older elites.”In Rondônia highly competitive politics are based on alliances built throughclientelism rather than political parties. In short, clientelist politics and competi-tiveness vary in substance and form across states. Competitiveness can holdclientelism in check, opening up spaces for policy learning through delibera-tion and dialogue of competing groups, but extreme competitiveness canexacerbate clientelism and even lead to violence. The impact of competitive-ness on policy learning depends heavily on political context.
■ Bureaucratic capacity and stability. Competent bureaucracies (such as that inParaná) are associated with greater seriousness in budgeting and planning pro-cesses, including processes related to environmental policy making, technical
166 STRATEGIC ENVIRONMENTAL ASSESSMENT FOR POLICIES

learning, and implementation. Where bureaucracies are more politicized, newlyelected mayors and governors are inclined to purge them of holdovers fromthe previous administration (as occurred in Pernambuco), and there is greaterlikelihood of indifference to the law. Regardless of the stability of bureaucraticstructures, the experiences of all four states show that state “environmentalorgans were often left out of the policy-making loop, consulted only after gover-nors had already made policy choices” and that jurisdictional uncertainty aboutwhich agency should undertake which tasks was “rampant” across the states.Under conditions of weak bureaucratic capacity and instability, individualpower and connections rather than an iterative process of learning becomeimportant for policy making.13
■ Monitoring and information transparency. Government agencies often with-hold information from other agencies or state environmental councils ordevelop projects with little consultation with other agencies, legislatures, oraffected populations. Policy learning depends on the gathering and analysisof information, its interpretation for shaping policy agendas, and its avail-ability for public scrutiny. Ames and Keck point out that the “main processorsof policy information in industrial societies—legislatures, courts, politicalparties, unions, and the media—are ill equipped to play this role in Brazil.”Evidence from other Latin American countries points to the importance ofmonitoring and public scrutiny. Colombia’s Cauca Valley Corporation attrib-utes the success of its efforts to reduce water pollution to cooperating withindustry (in a highly patrimonial climate) while deemphasizing traditionalcommand and control efforts. But a crucial influence on industry behaviorwas citizen pressure and negative publicity in the press, which listed toppolluters, coupled with demands by parent transnational companies for envi-ronmental audits (Sánchez-Triana and Ortolano 2001). For purposes of policylearning, this experience suggests that a combination of a monitoring regimeand transparency can improve implementation while shedding light on whethera policy is working.
■ Openings for civic participation. Across all four states, the public was largely unin-formed about environmental policy issues during the 1990s; mass media coverageof environmental issues was ad hoc. Civic intervention took place almost exclu-sively through nongovernmental organizations (NGOs), most of which weresmall, volunteer based, and unprofessionalized (there is evidence of improve-ments in their capabilities). One of the best-known examples of NGO activismis their representation of environmental interests and indigenous peopleaffected by the Planafloro project in Rondônia, which resulted in their formalrepresentation on state councils for the project and on an independent evalu-ation committee.14 The representation of NGOs has been contentious in otherstates. In Paraná “developers quickly learned to form their own NGOs, adopt the
LEARNING IN ENVIRONMENTAL POLICY MAKING AND IMPLEMENTATION 167

word environmental in their titles, and accept official invitations to represent envi-ronmental interests on policy-making councils.”An implication for policy learningis that NGOs have played important roles in enabling civic engagement, raisingthe level of dialogue needed for policy deliberation (provided they have adequatecapacity). However, they are but one set of actors among many that have thepotential to contribute to policy dialogue by increasing civic engagement.These factors point to the highly political nature of environmental policy
making. From the perspective of policy learning, they suggest that deliberativediscourse on policy options is likely to be weak where these factors are weak. Inother words, promoting policy learning in environmental policy making isconfounded by various political factors, including clientelist behavior and incen-tives, limited bureaucratic capacity and stability, inadequate monitoring andinformation transparency, constrained spaces for meaningful civic participation(not just voice but actual influence), public scrutiny, and enforcement of laws.The conditions for policy learning may thus be viewed as the effects of politicalaction. Improving these conditions requires political exertion rather than simplybetter management and technocratic effort.
Oliveira (2002) provides an example of efforts to overcome some of theseconstraints in an analysis of environmentally protected areas (área de proteçáo ambi-ental [APA]) in the state of Bahia.15 Although his study looks at policy implementationrather than formulation, it is instructive for its insights on bureaucratic capacityand political support. Oliveira identifies four major obstacles to policy implemen-tation in developing countries: lack of political and public support, funding forprotected areas, institutional capacity, and cooperation and coordination at the locallevel. Despite these obstacles, between 1990 and 1998 the number of APAs in Bahiagrew from 2 to 27, expanding the area covered by a factor of 130.
In Oliveira’s analysis, a central challenge in Bahia concerned the weak influ-ence of environmental agencies relative to that of the development agencies. Thestate environmental agency “horizontally decentralized” the administration ofAPAs by distributing implementation responsibility among several agencies (ratherthan seeking to do it itself), thus helping integrate environmental policies withdevelopment policies. Oliveira argues that development agencies needed to estab-lish protected areas in order to gain approval for their development projects fromstate and multilateral funders.
A second key feature of implementation was that funding for APAs was notdetermined a priori through an allocation to the state environmental agency. Hadthis been the case, it would likely have resulted in failure, because the state agencywas chronically underresourced and did not have the political clout to ask formore funds. Instead, public agencies, especially the influential development agen-cies, could draw on multiple sources for implementing their policies.
168 STRATEGIC ENVIRONMENTAL ASSESSMENT FOR POLICIES
A third factor was increased competition among public agencies for creatingand controlling APAs. This competition arose from the fact that environmentalprojects tend to attract international funding, thereby increasing the politicalleverage of agencies engaged in those projects. While this competition initiallycreated distrust among agencies, it eventually led to increased cooperation in orderto create more APAs. An unexpected benefit of this cooperation was improve-ment in bureaucratic capacity across participating agencies, which occurred becausecoordination and sharing of expertise are necessary for gaining political leveragein requesting more state funding.
The Bahian experience offers a number of tentative insights into the three keythemes of this chapter. First, the story of APAs is a political one, not a techno-cratic one. It demonstrates that environmental issues received greater attentionin priority setting by linking to broader economic and social change agendas.Public agencies were motivated to prioritize protected areas as a way of increasingtheir political power and financial resources, within a broader economic agendaof tourism promotion that was firmly entrenched in clientelist politics. Arguably,the process hinged on the “commanding role” of a three-time Bahian governorin crafting “an unusually coherent policy process” that brought in regional devel-opment through a clientelist process that shored up his political power (personalcorrespondence, Margaret Keck, Johns Hopkins University, October 2005). Thisis not dissimilar to the South African experience in the early 1990s (describedbelow), in which the education sector was more successful than the environmentalsector in garnering attention and resources by “politicizing” education.
Second, while the Bahian experience does not speak directly to broad stake-holder representation, it does demonstrate the potential power of “horizontaldecentralization” to secure the participation of multiple public agencies. Stakeholderparticipation through interagency coordination helps address the problem ofpublic bureaucracies operating in isolation from one another, particularly giventhe weak political clout typical of environmental agencies. Global stakeholdersalso played a role, particularly the efforts of pro-conservation advocates to harnessglobal concerns about deforestation in the Amazon.
Finally, this case demonstrates that an accountability system of checks andbalances was necessary for implementation of the protected areas policy. Staff ofthe state environmental agency and the state environmental council (which includedNGOs) were required to approve protected areas as well as development projects;they could block those that did not satisfy certain environmental guidelines. Thesecouncils had not just voice but direct influence or power of approval.
Taken together, the work of Guimarães, Ames and Keck, and Oliveira suggeststhat the central themes discussed in this chapter—priority setting, stakeholderrepresentation, and accountability—do not stand apart from the politics of policy
LEARNING IN ENVIRONMENTAL POLICY MAKING AND IMPLEMENTATION 169

making but are shaped by it. There is a dialectic relationship among these threecomponents, their political context, and opportunities for policy learning.
South Africa: Making Environmental and Educational Concerns Relevant to Citizens
The case of South Africa is instructive in a study of policy learning because of thecountry’s unprecedented policy development just before and during its first decadeof democracy. South Africa has undergone a deliberate and ongoing shift from thecentralized, technocratic, and discriminatory policy making of the apartheid eratoward a more inclusive and equitable set of policies and policy processes. Whilethe country boasts a highly progressive and inclusive environmental policy frame-work today, policy makers paid very little attention to environmental issues in thetransitional years preceding democracy in 1994 (Orkin, Tshandu, and Dugard 1995).
Educational policy in the late 1980s and early 1990s followed a radically differenttrajectory.16 The education sector experienced a range of policy initiatives thatnot only brought various policy stakeholders—universities, parastatal researchcenters, NGOs, industry, and political parties—together but also generatedextensive public interest and debate, leading to a number of major reforms inpostapartheid education.
Orkin, Tshandu, and Dugard (1995) offer a number of possible reasons forthis difference, some of which are relevant to policy learning:■ Politicization of an issue. There was keen public interest in education, the rele-
vance of which was apparent to all segments of society. The issue of educationwas highly politicized, in that it served as a key political platform for state actorsand the democratic movement. In contrast, environmental actors focused onconservation and preservation of wilderness areas, which were of greater interestto white elites than to the majority of South Africans. They failed to politicizetheir issues broadly and thus to make them relevant to the larger public (bylinking them to drinking water, health, and conflict, for example).
■ Proactive state involvement. The state’s involvement in education was proactiveand mass based. The white-led Department of National Education conductedtwo major policy formulation initiatives. The black-led National EducationCoordinating Committee convened a massive two-year National EducationPolicy Initiative. In contrast, the approach in environmental policy was driveneither by narrow industrial interests or by the elitist conservation orientationof large NGOs such as the Endangered Wildlife Trust, the Southern AfricanNature Foundation, and the Wildlife Society of Southern Africa.
■ Research capacity. Research mechanisms to inform policy formulation were estab-lished in education but not in the environmental arena. The National EducationCoordinating Committee’s policy efforts were supported through research atuniversity-based Educational Policy Units; the African National Congress’
170 STRATEGIC ENVIRONMENTAL ASSESSMENT FOR POLICIES
Education Department drew on recommendations from the Center for Educa-tional Policy Development (CEPD), an NGO; the state commissioned researchthrough the Human Sciences Research Council; and the business sector had itsown education research centers. The CEPD is particularly interesting as a policylearning catalyst, because it worked “collaboratively with the community of policyanalysts in universities, mass-based movements, and NGOs, especially those asso-ciated with the democratic movement”(Orkin, Tshandu, and Dugard 1995: 480).
■ High-level multistakeholder policy forums. Multiple policy actors in the educa-tion sector were brought together for vigorous high-level policy debates. Throughconsultation with several hundred people from different constituencies, theCEPD developed a draft policy framework for the African National Congress(ANC). The National Training Board (NTB), a statutory body focused onnational labor issues, also opened up its policy formulation process in responseto pressure from labor groups, eventually setting up eight working groups toformulate NTB policy on education and training. Both the CEPD and the NTBexercises marked a shift from unilateral policy formulation by separate insti-tutions characterized by standoffs among policy actors into relationships ofexchange, engagement, and cooperation.17 Even in these multistakeholderarenas, however, policy formulation remained dominated by elites.Since the study by Orkin, Tshandu, and Dugard, there have been dramatic
changes in environmental policy in South Africa, particularly the inclusion ofenvironmental rights and justice in the constitution, the creation of a ConsultativeNational Environmental Policy Process (CONNEPP), and the promulgation ofthe 1998 National Environmental Management Act. These successes in environ-mental policy making in the first decade after democratization appear, at least onpreliminary examination, to bear some of the hallmarks of the factors identifiedabove: politicization of environmental concerns into issues of rights and justice,proactive state involvement and forums for stakeholder engagement (throughCONNEPP), and an increase in the research capacities on environmental issuesof various actors, including government agencies, universities, and NGOs.
Such momentum is difficult to implement and sustain. A review of the consul-tative process under CONNEPP carried out by researchers at South Africa’sCouncil for Scientific and Industrial Research and the City of Cape Town suggeststhat many of the challenges apparent in 1995 were still relevant to environmentalpolicy making in 2004 (Rossouw and Wiseman 2004). These challenge includeinsufficient consultation with local government and local councils; failure tomaintain stakeholder engagement and networks after completing the policy-formulation process; lack of ongoing consultation with civil society in theimplementation and monitoring of policy; failure to follow up on key opera-tional commitments in the policy; unfunded mandates for sustainabilityplanning;18 inadequate integration of environmental priorities with national
LEARNING IN ENVIRONMENTAL POLICY MAKING AND IMPLEMENTATION 171

priorities of poverty eradication and social transformation; and lack of mecha-nisms for policy learning and continuous improvement, including policyassessment and monitoring, as part of the policy process. Even less-criticalobservers point to the difficulties in implementing policy and enabling adaptivelearning, noting that while South African water management policy “is consid-ered internationally to be progressive, forward-thinking and ambitious,” there isa strong need for a “strategic, adaptive approach to policy implementation”through a process that “allows for learning to be gathered along the way and fedback into improving the process” (MacKay, Rogers, and Roux 2003: 353–54).
These issues represent challenges for both adaptive and inclusive management.The list could apply to the environmental policy and implementation processesof most countries, developing or developed. As such, the experiences of environ-mental policy making in South Africa illuminate three lessons for the three themesof this chapter—the need to politicize environmental issues in order to get themonto policy agendas, the importance of building stakeholder capacity in order tohave quality stakeholder representation, and the challenges of creating account-ability systems that are not just about transparency of information but also aboutmonitoring and follow-through.
Conclusions
The cases examined in this chapter identify a number of factors that are signifi-cant in constraining and enabling policy learning. The lessons learned should betaken as propositional and thus subject to empirical validation.
Priority or Agenda Setting
Policy learning, in the sense of iterative attention of policy makers to an issue,requires getting environmental issues on their agendas in the first place. This canbe done in several ways:■ “Politicize” environmental issues, by linking them to broader issues of economic
and social development and poverty eradication, in order to make it more likelythat policy makers will take the risks of engaging them. Issues presented in highlytechnocratic terms of narrow interest (such as environmental preservation andconservation) are unlikely to nurture mass support if they do not appeal to thedaily struggles of electorates. Effective politicizing was apparent in the case ofeducation policy in the lead up to democracy in South Africa. While environ-mental policy was initially mired in preservation terms, it later underwent asignificant shift to focus on issues of environmental justice, livelihood, and equity.
■ Integrate the agendas of environmental ministries with those of more-influentialministries. A sustainable development agenda requires explicit links to issuessuch as food and income security, water scarcity, and conflict over resources.
172 STRATEGIC ENVIRONMENTAL ASSESSMENT FOR POLICIES

The experience of protected areas in Bahia shows that integration betweenenvironment and economic development is possible even in a patrimonial andcompetitive policy context.
■ Create policy advocacy networks in order to get diverse perspectives on the agendasof policy makers not just once but repeatedly. Sustained NGO activism was centralto the representation of environmental and indigenous organizations on a delib-erative council in Brazil’s Planafloro project, as well as to the critique of itspredecessor project. In the case of protected areas in Bahia, NGOs and otheractors who were members of state environmental councils had both adminis-trative influence with respect to approval for projects and access to policy circles.
Stakeholder Representation in Policy Formulation
If policy learning is a deliberative and multistakeholder process of engagementon policies and ideas, it is necessary to pay attention to how participation is oper-ationalized. Consultative process must give participants not just voice but influence.This is a problem of elite control of policy formulation and implementation (forexample, through clientelism, rent-seeking behavior, and expert domination).
Several lessons can be drawn from the case studies:■ The capacity for policy research and analysis across all types of policy actors
(governments, civil society organizations, industry, universities) is crucial topolicy learning. The impact of such capacity is most apparent in the case ofSouth Africa’s education sector, where the major policy actors had access toresearch units and were able to participate in national forums that directlyaffected policy. This stood in stark contrast to environmental policy processes,in which there was limited research capacity, except perhaps in industry (thishas changed significantly in recent years).
■ Public forums for policy debate vary in significance for policy learning. Forumsthat are consultative in nature and in which participants have formal voice butcannot directly shape policy are sometimes exercises in public relations ratherthan policy learning. In the South African education sector, the forums estab-lished through the National Training Board and the CEPD were premised onthe notion that managed conflict and tension are necessary for democratic policymaking. They marked a shift from a process of unilateral policy formulation byseparate institutions into relationships of exchange and cooperation.19 Similarly,the South African Consultative National Environmental Policy Process madeconsiderable headway in creating political space for policy debate. It has beencritiqued, however, as having been undermined by insufficient follow-throughin maintaining stakeholder engagement networks and in integrating with nationalpriorities on poverty eradication.
■ The participation of multiple public agencies on environmental policy issuesis necessary for reconciling interagency tensions while improving coordination
LEARNING IN ENVIRONMENTAL POLICY MAKING AND IMPLEMENTATION 173
and resources. The Bahian experience with “horizontal decentralization” improvedinteragency coordination. Although a key incentive was access to funding andpolicy influence at the state level, such coordination increased bureaucraticcapacity and competence. Differences in bureaucratic competence can varysignificantly within a single country, as the four-state study of Brazil reveals.Overcoming the constraints of bounded rationality in public decision makingrequires improving interagency coordination.
Accountability in Implementation
Policy learning requires feedback loops through which implementation is linkedto policy making and through which constituents can hold policy makers toaccount for both follow-through and the consequences of policy decisions. Thisis the least-developed dimension of the case studies.
The case studies—and the literature on accountability—nevertheless offersome insights:■ Effective transparency mechanisms make information available to citizens in
ways that allow it to influence their political choices.20 They provide completeinformation about activities and options before key decisions are made, in locallanguages, culturally appropriate formats, and ways that are readily accessibleand affordable (Nelson 2001). In this sense transparency is necessary not onlyfor enhancing policy dialogue but also for monitoring the activities of publicagencies. Examples include public right-to-know legislation and citizen over-sight of public budgeting activities.
■ Monitoring and evaluation of the policy-making and implementation processesis costly and rare but important for policy learning. The experiences with stateenvironmental councils in Bahia and the Planafloro deliberative council inBrazil suggest that citizen groups can play central roles in monitoring theimpacts of policies and monitoring how and if they are implemented. Indeed,part of the critique of consultative processes in environmental policy makingin South Africa has centered on insufficient procedures and funding for moni-toring and evaluation, by both public agencies and citizen groups.
■ Supporting media scrutiny of policy and implementation issues can enhancepublic monitoring while strengthening accountability. There is evidence thatthe public and industry respond to sustained and pointed media scrutiny.Publication by the local newspaper of the names of top polluters in Colombia’sCauca Valley, combined with citizen pressure and policies of parent transnationalcompanies that called for environmental audits, motivated better pollutioncontrol efforts (Sánchez-Triana and Ortolano 2001). Legislative reportingrequirements can enhance such scrutiny (as noted above).
■ Maintaining stakeholder engagement and networks after completing a policyformulation exercise is important for long-term learning and dialogue. The
174 STRATEGIC ENVIRONMENTAL ASSESSMENT FOR POLICIES
experiences with educational and environmental reform in South Africasuggest that one-off policy engagements are unlikely to lead to sustainedpolicy improvement.In closing, four more general lessons arise repeatedly regarding policy learning.
First, policy learning may be enhanced where agendas and priorities are shapedby multiple stakeholder perspectives, including those of public agencies, ministries,and civil society groups. The politicization of an issue in broad developmental andsocial terms (rather than only in environmental terms) seems crucial for repeatedpolicy attention. Second, given the iterative nature of policy formation and thelimitations of bounded rationality, policy learning may benefit from participationof stakeholders at all stages of a policy process, from agenda setting through imple-mentation, monitoring, and evaluation.
Third, accountability in policy learning and implementation relies not onlyon monitoring and evaluation but also on effective transparency and enforce-ment mechanisms. Transparency refers not only to the provision of informationbefore key decisions are made but also to the presentation of that information informs users can understand. This combination appears to be an important ingre-dient for sustained and informed policy debate and thus for social learning. It isespecially important in countries where right-to-know legislation and legal formsof redress are weak. In the long term, efforts to strengthen the rule of law mayalso enhance policy learning, by making policy makers and agency administra-tors more responsive to citizen concerns.
Finally, the factors or conditions identified above (on agenda setting, stake-holder access and representation, and accountability) suggest that there are nosimple institutional mechanisms for ensuring learning. Moreover, these condi-tions are not sufficient for policy learning, largely because policy formulation andimplementation are highly political processes. Nonetheless, the cases do providesome preliminary evidence that the 10 conditions cited here can ease two keyconstraints on policy learning: bounded rationality and hierarchies of power.Enhancing the negotiated and deliberative dimension of policy making—byinvolving multiple actors in roles of influence, supported by capacities for researchand monitoring, in ongoing and iterative dialogue—can help deal with both prob-lems. The cases also suggest that opportunities for policy learning can be enhancedeven in circumstances of adversarial power relations and clientelism. Expectationsshould be moderated, however, by the fact that policy learning is but one compo-nent in broader processes of social and political transformation.
Notes
1 The terms organizational learning and learning organization are often used interchangeablyin the literature. Organizational learning is more widespread in the analytical literature;learning organization is more normative (Denton 1998; Senge 1990).
LEARNING IN ENVIRONMENTAL POLICY MAKING AND IMPLEMENTATION 175
2 Learning is only one of many processes yielding organizational change. For example,changes in organizational routines can also be brought about through new laws thatmandate procedural changes. Moreover, learning is not always an intentional process, andit does not always lead to improvements in an organization’s performance (Levitt andMarch 1988; Scott 1992).
3 The garbage can model is discussed in chapter 3 of this volume.
4 Limitations in cognitive capacity can lead to “superstitious” or “ambiguous” learning.Superstitious learning arises when individuals incorrectly deduce that a specific action ledto a particular outcome (March and Olsen 1988). Ambiguous learning occurs when anoutcome is so poorly understood that multiple explanations emerge. The learning that resultsis ambiguous, because meaning is imputed even though it may not be clear what exactlyhappened, why it happened, or whether what happened was good or bad (March and Olsen1988). Such ambiguity is more likely in policy contexts than in organizational ones.
5 Identifying actual instances of learning is also difficult in developed country contexts. In theirstudy of accountability and performance in public bureaucracies in the United States, forexample, Gormley and Balla (2004: 18) observe that “with few exceptions, legislators haveignored performance data, even from agencies that have produced relatively useful andcomplete information.” Efforts by legislators to advance fixed policy positions, rather thanthose amenable to change through learning, are also common in Sweden (Nilsson 2005).
6 Chapter 3 examines both models.
7 The distinction between voice and influence is significant. In a widely cited backgroundpaper prepared for the Human Development Report 2002, Goetz and Jenkins (2001: 9) notethat “simply listening to these voices [of the poor], and doing nothing to respond to theirinsistent demands has discredited the idea that promoting voice is central to improvinghuman well-being.” The World Bank’s World Development Report (2003b: 79) extends thisreasoning to accountability, noting that “voice is not sufficient for accountability; it maylead to answerability but it does not necessarily lead to enforceability.”
8 This assumption is contestable and potentially tautological. Broad stakeholder participa-tion does not guarantee learning, particularly where it is used primarily for public relations.Similarly, heavy-handed accountability requirements can restrict learning by limiting risktaking and innovation. The conclusions drawn from these assumptions should thus betreated as propositional.
9 The author is indebted to Professor Margaret Keck for detailed comments on this sectionof the chapter.
10 The challenges of patrimonialism and regulatory capture are, of course, not limited toBrazil. An institutional assessment of Colombia’s environmental management system, forexample, finds that despite the creation of numerous mechanisms for public participa-tion in environmental policy formulation and implementation, regulatory capture byprivate sector interests has been significant (Blackman and others 2004).
11 The discussion of these states is helpful for identifying key political factors that shapeopportunities for policy learning. Given both the limited and dated nature of the availablesecondary material, it should not be extended beyond this purpose.
12 Except where otherwise noted, this section relies on and quotes from Ames and Keck(1997–98: 25–31).
13 Even in the most successful state for environmental policy (Paraná), policy making “remainshighly dependent on individuals: the installation of the governor’s brother as head of thestate’s new environmental organ halted new initiatives” (Ames and Keck 1997–98: 28).
176 STRATEGIC ENVIRONMENTAL ASSESSMENT FOR POLICIES

14 Critics contend that while this inclusion gave some NGOs a formal voice in the process,it provided little actual influence, because the council was not directly involved in plan-ning, it failed to include a number of large and well-organized interest groups, and it didnot provide NGOs with the capacity building needed to participate effectively. This is anexample of the distinction between voice and influence raised earlier in the chapter. Laterstages of the project appear to have partially responded to these concerns by increasingNGO participation in supervision, monitoring, and evaluation while increasing supportfor indigenous communities. For a self-critical review of the Planafloro project, includinghow NGOs were involved, see World Bank (2003a).
15 Brazil’s National Environmental Council defines an APA as an area “destined to preservethe environmental quality and natural resources in a certain region in order to improvethe quality of life of the local population and to protect regional ecosystems” (cited inOliveira 2002: 1732).
16 Unless otherwise noted, this comparison of environmental and educational policy formu-lation draws on Orkin, Tshandu, and Dugard (1995).
17 This national consultative approach was later adopted in the environmental arena.
18 Some large municipalities, such as the City of Cape Town, have been better able to estab-lish stakeholder consultation processes for formulating and implementing municipalenvironmental policies. Rossouw and Wiseman (2004: 138) call this a “paradigm shift”from “denying access to information . . . to the current understanding that informationcan provide a means to empower citizens.”
19 Such forums should not be idealized. Miraftab’s (2003) work on housing policy formula-tion and implementation in South Africa shows that even under seemingly positiveconditions, the practice of participation can easily degenerate into a zero-sum game, partic-ularly in the absence of efforts to strengthen the capacities of weaker actors to shapeagendas and claim their rights.
20 For a broader discussion of transparency, see Nelson (2001), Fung and others (2004), andHerz and Ebrahim (2005).
References
Ames, Barry, and Margaret E. Keck. 1997–98. “The Politics of Sustainable Development:Environmental Policy Making in Four Brazilian States.” Journal of Interamerican Studies andWorld Affairs 39 (4): 1–40.
Argyris, Chris. 1992. On Organizational Learning. Cambridge, MA: Blackwell.
Argyris, Chris, and Donald A. Schön. 1996. Organizational Learning II: Theory, Method, andPractice. Reading, MA: Addison-Wesley.
Blackman, Allen, Sandra Hoffman, Richard Morgenstern, and Elizabeth Topping. 2004.Assessment of Colombia’s National Environmental System (SINA). Washington, DC:Resources for the Future.
Brinkerhoff, Derick W., and James D. Gage. 2002. “Natural Resources Management Policy inAfrica: Implementation Challenges for Public Managers.” In Environmental Policy andDeveloping Nations, ed. S. S. Nagel, 74–114. Jefferson, NC: McFarland & Company.
Cohen, Michael D., James G. March, and Johan P. Olsen. 1972. “A Garbage Can Model ofOrganizational Choice.” Administrative Science Quarterly 17 (1): 1–25.
Denton, John. 1998. Organizational Learning and Effectiveness. London: Routledge.
LEARNING IN ENVIRONMENTAL POLICY MAKING AND IMPLEMENTATION 177

Durant, Robert F., Daniel J. Fiorino, and Rosemary O’Leary. 2004. “Environmental GovernanceReconsidered: Challenges, Choices, and Opportunities.” Cambridge, MA: MIT Press.
Feldman, Martha S., and James G. March. 1988. “Information in Organizations as Signal andSymbol.” In Decisions and Organizations, ed. J. G. March, 410–28. Cambridge, MA: BasilBlackwell.
Fiol, C. M., and M.A. Lyles. 1985. “Organizational Learning.” Academy of Management Review10 (4): 803–13.
Fiorino, Daniel J. 2001. “Environmental Policy as Learning: A New View of an Old Landscape.”Public Administration Review 61 (3): 322–34.
Fung, Archon, David Weil, Mary Graham, and Elena Fagotto. 2004. “The Political Economy ofTransparency: What Makes Disclosure Policies Effective?” Ash Institute for DemocraticGovernance and Innovation, John F. Kennedy School of Government, Harvard University,Cambridge, MA.
Glasbergen, Pieter. 1996. “Learning to Manage the Environment.” In Democracy and theEnvironment: Problems and Prospects, eds. W. M. Lafferty and J. Meadowcroft, 175–93.Cheltenham, UK: Edward Elgar.
Goetz, Anne Marie, and Rob Jenkins. 2001. “Voice, Accountability and Human Development:The Emergence of a New Agenda.” Background paper for the Human Development Report2002. New York: United Nations Development Programme.
Gormley, William T., and Steven Balla. 2004. Bureaucracy and Democracy: Accountability andPerformance. Washington, DC: Congressional Quarterly Press.
Guimarães, Roberto P. 2002. “The Bureaucratic Politics of Environmental Policy Formationin Brazil.” In Environmental Policy and Developing Nations, ed. S. S. Nagel, 227–44. Jefferson,NC: McFarland & Company.
Herz, Steve, and Alnoor Ebrahim. 2005. “A Call for Participatory Decision Making: DiscussionPaper on World Bank–Civil Society Engagement.” Report commissioned by the civil societymembers of the World Bank–Civil Society Join Facilitation Committee, World Bank,Washington, DC. http://siteresources.worldbank.org/CSO/Resources/World_Bank_Civil_Society_Discussion_Paper_FINAL_VERSION.pdf.
Levinthal, Daniel A., and James G. March. 1993. “The Myopia of Learning.” StrategicManagement Journal 14 (Winter): 95–112.
Levitt, Barbara, and James G. March. 1988. “Organizational Learning.” Annual Review ofSociology 14: 319–40.
MacKay, H. M., K. H. Rogers, and D. J. Roux. 2003. “Implementing African Water Policy:Holding the Vision While Exploring an Uncharted Mountain.” Water SA 29 (4): 353–58.http://www.wrc.org.za.
March, James G., and Johan P. Olsen. 1988. “The Uncertainty of the Past: OrganizationalLearning under Ambiguity.” In Decisions and Organizations, ed. J. G. March, 335–58.Cambridge, MA: Basil Blackwell.
March, James G., and Herbert A. Simon. 1958. Organizations. New York: John Wiley.
Meyer, John W., and Brian Rowan. 1977. “Institutionalized Organizations: Formal Structure asMyth and Ceremony.” American Journal of Sociology 83 (2): 340–63.
Miraftab, Faranak. 2003.“The Perils of Participatory Discourse: Housing Policy in PostapartheidSouth Africa.” Journal of Planning Education and Research 22 (3): 226–39.
Nelson, Paul J. 2001.“Transparency Mechanisms at the Multilateral Development Banks.” WorldDevelopment 29 (11): 1835–47.
178 STRATEGIC ENVIRONMENTAL ASSESSMENT FOR POLICIES

Nilsson, Mans. 2005.“Learning, Frames and Environmental Policy Integration: The Case of SwedishEnergy Policy.” Environment and Planning C, Government and Policy 23 (2): 207– 26
Oliveira, Jose Antonio Puppim de. 2002. “Implementing Environmental Policies in DevelopingCountries through Decentralization: The Case of Protected Areas in Bahia, Brazil.” WorldDevelopment 30 (10): 1713–36.
Orkin, Mark, Zwelakhe Tshandu, and Jackie Dugard. 1995. “Policy Research and Formulation:Two Case Studies.” In Managing Sustainable Development in South Africa, eds. P. FitzGerald,A. McLennan, and B. Munslow, 469–507. Cape Town: Oxford University Press.
Pearce, David. 2004. “Growth and the Environment: Can We Have Both?” In EnvironmentMatters, 14–15. Washington DC: World Bank.
Rossouw, Nigel, and Keith Wiseman. 2004.“Learning from the Implementation of EnvironmentalPublic Policy Instruments after the First Ten Years of Democracy in South Africa.” ImpactAssessment and Project Appraisal 22 (2): 131–40.
Sánchez-Triana, Ernesto, and Leonard Ortolano. 2001. “Influence of Organizational Learningon Water Pollution Control in Colombia’s Cauca Valley.” Water Resources Development21 (3): 493–508.
Scott, W. Richard. 1992. Organizations: Rational, Natural, and Open Systems. Englewood Cliffs,NJ: Prentice Hall.
Senge, Peter M. 1990. The Fifth Discipline: The Art and Practice of the Learning Organization.New York: Currency Doubleday.
Tobin, Richard J. 2003.“Environment, Population, and the Developing World.” In EnvironmentalPolicy: New Directions for the Twenty-First Century, eds. N. J. Vig and M. E. Kraft, 347–69.Washington, DC: Congressional Quarterly Press.
Turner, Mark, and David Hulme. 1997. Governance, Administration and Development: Makingthe State Work. West Hartford, CT: Kumarian.
World Bank. 2003a. “Implementation Completion Report (CPL–34440) on a Loan in theAmount of US$167.0 Million to the Federative Republic of Brazil for a Rondonia NaturalResources Management Project (Loan 3444–BR).” Washington, DC.
———. 2003b World Development Report 2004: Making Services Work for Poor People.Washington, DC: World Bank.
LEARNING IN ENVIRONMENTAL POLICY MAKING AND IMPLEMENTATION 179

HOW CAN A STRATEGIC ENVIRONMENTAL ASSESSMENT (SEA) shapethe design and implementation of public policy in the direction of greatersustainability? Under what circumstances can SEA strengthen environmentalgovernance? Two very different examples—one relating to the functioning ofregional development corporations, the other to action on the air pollution agenda,both documented in the Colombia Country Environmental Analysis (CEA)(Sánchez-Triana, Ahmed, and Awe 2007)—show the potential of SEA processes toshape the design and implementation of public policies aimed at alleviating poverty,promoting economic growth, and preventing environmental degradation.1
One important area identified in the Colombia CEA as needing attention toimprove the functioning of regional development corporations (corporaciónesautónomas regionales [CARs]) was the importance of aligning national environ-mental priorities and regional environmental expenditures (World Bank 2006;Sánchez-Triana, Ahmed, and Awe 2007).2 According to these needs, the governmentdesigned a system of performance indicators for CARs, adopted as Presidential
C H A P T E R 8
Using Strategic EnvironmentalAssessments to Design
and Implement Public PolicyKulsum Ahmed and
Ernesto Sánchez-Triana
181
Kulsum Ahmed is lead environmental specialist and team leader of the EnvironmentalInstitutions and Governance program at the World Bank. Ernesto Sánchez-Triana is a seniorenvironmental specialist at the World Bank. The authors would like to thank Shahid Yusuf,Leonard Ortolano, and Fernando Loayza for their insightful comments on earlier versions ofthis chapter.
Decree 1200 of 2004. The decree requires the CARs to measure the impact of theirenvironmental investments, through 10-year regional environmental manage-ment plans and 3-year action plans (Planes de Acción Trienal [PATs], thus promotinggreater accountability from CAR directors. From a list of environmental qualityimpact indicators of national importance, CAR directors are asked to select thosethat apply to their region.3 This procedure strengthens the linkage between nationalpriorities and regional implementation while allowing the regions to choose theirown priority areas. At the national level, the Ministry of the Environment reviewsprogress on PAT goals. The decree includes a provision for removing the CARdirector if the goals set forth in the PAT are not met.
The second example relates to the air pollution agenda. The Colombia CEAhighlighted indoor and outdoor air pollution as key priorities (World Bank 2006;Sánchez-Triana, Ahmed, and Awe 2007), but the government was not inclinedto immediately revise the national air quality standards developed in the 1980s.Wide media coverage of the results of the Colombia CEA, however, resulted ina broad public debate, which was taken up by politicians during the electioncampaign. One senator placed white blankets over Bogotá and widely publicizedthe change in the color of the blankets, comparing it with the effect on people’slungs and quality of life. Open public debate increased the number of cham-pions for revising air quality standards (Chavarro Vásquez 2007). In 2007, thefirst air pollution control bill was discussed in the national congress (interviewwith Senator Nancy Patricia Gutierrez, President of the National Congress ofColombia, August 15, 2007).
Both these cases and related dialogue with the government illustrate theimportance of internal champions and constituencies in moving reforms forward.They also illustrate that policy design and implementation lie on a continuumand that policies can be influenced during a current period of policy reform oron a longer time scale in a future period of policy reform. In the first case, theanalysis in the Colombia CEA was already available when an opportunity to effectreform came along. This opportunity was created by multiple factors, includingthe importance President Alvaro Uribe placed during his election campaign onimproving the efficiency of the CARs in delivering services (Uribe 2002a) andalleged cases of corruption among CARs (Uribe 2002b). The information in theCEA was timely and hence used in the design of the reform. In the second case,the wide dissemination of the results of the Colombia CEA and the ensuingmedia and political take-up and dialogue with civil society helped createconstituencies for change at a crucial time (elections). The first case is an exampleof seizing an opportunity by being in the right place at the right time and beingprepared; the second case is an example of creating an opportunity to effectreform by generating information and providing a forum for debate in order tocreate constituencies.
182 STRATEGIC ENVIRONMENTAL ASSESSMENT FOR POLICIES

This chapter draws on the authors’ experiences, including the two case studiesdescribed above, as well as lessons learned from other chapters in this volume topropose a new conceptual and methodological framework for applying SEA to poli-cies. The chapter proposes a useful tool—namely, institution-centered SEA—fordesigning and implementing equitable and environmentally sustainable policiesand strengthening environmental institutions and governance. In addition to applyinganalytical and participatory approaches typical within SEA frameworks (OECD2006), institution-centered SEA incorporates a third pillar designed to enhancelearning and continuous improvement of policy design and implementation(figure 8.1). The World Bank is currently piloting this institution-centered SEA indifferent sectors and regions of the world with results from the pilots being used torefine the approach (World Bank 2005a).4
As suggested by the examples above, institution-centered SEAs yieldrecommendations with both short- and long-term effects. Recommendations withshort-term effects help identify current environmental priorities and the technicaland institutional solutions that can address them; they enable actors to seize oppor-tunities to influence already-initiated policy reform. Recommendations withlonger-term impact help strengthen institutions, so that opportunities are contin-uously created to raise issues that matter to the weakest or most vulnerable citizens,thereby promoting social accountability of public officials. Raising issues thatmatter to the weaker members of society helps create opportunities for futurereform, so that there is continuous improvement of public policies in the direc-tion of greater sustainability. Because governance is the act or manner of governing,this suggests that the approach to SEA for policies presented in this chapter couldbe used as an instrument for sound and sustainable governance.
This chapter is divided into five sections. The first section briefly describesthe application of strategic environmental assessment for policies and thelimited influence of previous approaches in effecting change in the context ofpolicy reform. The second section presents some important concepts withrespect to policy formation and their implications on SEA for policies. Thethird section describes the conceptual framework of the proposed SEA approachand its components. The fourth section provides good-practice applications
USING SEAs TO DESIGN AND IMPLEMENT PUBLIC POLICY 183
Analyticalwork
Participatoryapproaches
Learningprocesses
FIGURE 8.1
The Three Pillars of Institution-Centered SEA
Source: Authors.
of various components of the proposed approach. The last section summarizesthe chapter’s main conclusions.
SEA for Policies
SEA was initially based on the application of environmental impact assessmentmethodologies to the environmental impact of groups of investment projectsclustered in programs and of land-use zoning and regional plans. Considerableexperience exists in applying SEA to investment programs and land-use zoningplans (Sadler and Verheem 1996; Fischer 2002; Noble 2002; Partidario 2002;Ahmed, Mercier, and Verheem 2005). The international review by Dalal-Claytonand Sadler (2005) shows the wealth of ongoing SEA activity. Donors are also tryingto harmonize approaches to SEA and identify new opportunities for its application(OECD 2006).
Chapter 1 discusses the traditional methodologies applied in SEAs for plansand programs and provides some examples of their application. Typically, theinitial step involves identifying potential environmental impacts. An assessmentthen determines which impacts are most significant. Mitigative actions are thenproposed, along with monitoring frameworks. Public consultation typically takesplace to help identify potential impacts.
There are fewer examples of the application of SEA to policies. As Ortolanonotes in chapter 2, the influence of policy-level SEA on policy formulation andimplementation depends heavily on process integration issues, especially thoseconcerned with when SEAs begin relative to the policy-formulation and imple-mentation process and how often SEA teams and policy designers interact.According to Ortolano, national assessments of the application of SEA in Canadaand the Netherlands indicate that agencies often prepare these assessments on apro forma basis. Assessments often occurred late in the policy-formulation process,and agencies were allowed to marginalize environmental assessment requirementswithout penalty. Key factors affecting policy SEA in Canada and the Netherlandsappear to be linked to difficulties in applying impact assessment methodologiesto policy proposals, the absence of cross-sectoral agencies with responsibility foroverseeing compliance with SEA requirements, and lack of commitment to SEAon the part of top-level agency officials.5
Traditional SEA methodologies, developed for plans and programs, are diffi-cult to apply to policy formation. The first step (identifying environmental impacts)is difficult because policies do not have defined boundaries and scenarios devel-oped are subject to path dependence (the influence of historical events on thepresent and the future). Public consultations are also problematic, because equalrepresentation of those most affected by environmental degradation is difficultto ensure given vested interests and elite capture. Traditional SEA also representsan assessment at a point in time rather than a continuous process, with SEA agents
184 STRATEGIC ENVIRONMENTAL ASSESSMENT FOR POLICIES

often focusing more on the preparation of a report than on how to influencedecision makers. Because policy formation is a continuous process, with windowsof opportunity to effect change, SEA methodologies for policies need to focus ontaking advantage of opportunities as they occur.
Policy Formation and Challenges for Applying SEA
Policies differ from investment programs or land-use plans in several ways. Eachof these differences is described below.
Policy Formation Is Continuous
Feldman and Khademian (chapter 3) show that given the nonlinear process ofpolicy formation, SEA could be applied as a tool with which to take advantage ofwindows of opportunity that occur when there is a concurrence of issues, prob-lems, solutions, and people in the context of policy decision making. They advocatethat SEA be designed to seize opportunities, as was done in Colombia to improvethe CARs. They present two policy-formation models, the adaptive managementmodel, which strives to learn from previous experience and support incrementalimprovements in policies, and the inclusive management model, which bringsdifferent stakeholders’ viewpoints together continuously throughout the policyprocess. Their analysis suggests that an SEA approach for policies should focuson promoting continuous improvements in policy design and a learning culturebased on the involvement of many stakeholders.
Historical Events Shape and Lock in Policies
The influence of historical events on the present and the future (path depend-ence) plays a key role in shaping and locking in public policies.6 However, asdevelopment contexts change, so may the environmental issues that affectstakeholders. The air pollution example from Colombia illustrates this point.As a result of Colombia’s shift from a primarily rural economy to a highlyurbanized country during the course of four decades, urban air pollution is nowa priority. The mismatch between resource allocation and priorities is under-standable given historical factors. Path dependence suggests that any attemptto shape institutional change requires periodic reevaluation of the goal itselfrather than an incremental approach to measuring results that assumes the goalis still valid. Analysis is important, as is directly asking affected stakeholderswhat is working and what is not. Most important, however, is a commitmentto be open, to learn from the analysis and the answers, and to act on this infor-mation.7 This suggests that rather than assume that the general perception ofcurrent priorities is still valid, an SEA approach for policies needs to reevaluateenvironmental priorities based on both participatory methods as well as on anobjective analytical basis.
USING SEAs TO DESIGN AND IMPLEMENT PUBLIC POLICY 185

Elite Capture and Vested Interests Influence Policy Design and Implementation
Elites are small groups with partial or total control over policy and the economy.They include large landowners and business owners, bureaucrats, politicians inauthoritarian regimes, unions, religious leaders, and ruling castes, among others.They create formal rules that maximize their payoff by affecting policies and gener-ating or blocking institutional reforms (Easterly 2001).8 Elites are not necessarilymonolithic; they include different groups with partly divergent interests. Hence,departing from traditional SEA methodologies to include political economyanalysis is important in institution-centered SEAs.9
Bardhan (1989, 2004) and others have discussed the tenacity of vested interests and the difficulties in bringing about institutional change. Collectiveaction by the nonelite (possibly supported by dissident groups of the elite), inter-national pressure, or exogenous shocks can sometimes make reform feasible evenin countries with weak institutions, as it has in the case of national environmentalstandards and national responses to global climate change in many countries. Inmost cases, however, reforms get entrenched because of elite control.
Bardhan (2004, 2007) notes that there are two broad classes of problems:informational problems (such as uncertainty about who the potential winnersare ex ante) and commitment problems (the fact that the potential gainers cannotcredibly commit to compensate the losers ex post). Both problems indicate thatbringing about institutional change is a country-specific process that can beaddressed only by applying the sovereignty principle, not through external inter-vention. This point suggests that elite control can be partially constrained throughinformation and analysis and the promotion of social accountability. Transparencyand information disclosure, data collection, and analysis, including analysis of thedistributional impacts of institutional reforms, are key. Opening up decision-making processes to public scrutiny; ensuring the rule of law (by enforcing contractsand protecting property rights, for example); and putting anticorruption mech-anisms into place are important tools for achieving social accountability. Thissuggests a broader approach to participation in institution-centered SEA than istypically found in traditional SEA.
Policy Making Is a Complex—and Inherently Political—Process
Political economy factors themselves often constrain transparency and account-ability. As a result, change is often incremental over long periods of time. Elitecapture means that directly consulting the vulnerable does not guarantee thatpolicy will be influenced. Rules, legislation, traditions, networks, ethnic alliances,patronage, political allegiances, and bureaucratic structures interact to form acomplex and fluctuating policy environment. Individual survival in an organiza-tion, organizational survival in a government, and the maintenance of a regime
186 STRATEGIC ENVIRONMENTAL ASSESSMENT FOR POLICIES

within a country can also affect policy choice (Grindle and Thomas 1991). Effectingchange is difficult, as suggested by the conceptual framework developed by North,Wallis, and Weingast (2006), according to which the interactions between polit-ical and vested interest actors explain why limited-access social orders are a naturalstate. Hence, political economy analysis is an important tool for understandingthe political dimension and facilitating effective policy implementation.
One way of facilitating change is to reduce regulatory capture. Regulatorycapture occurs when interest groups exert undue influence on the authorities, sothat instead of furthering social welfare, they further the interests of select groups.10
Sometimes overcoming informational problems—by, for example, providingclearer information on the distributional effects of policies—may help differentstakeholders (with different positions and power) coalesce to support a policy.This may be particularly opportune for several environmental issues, because theenvironment is a global good. One example is urban air quality. Poor roadsidevendors may suffer disproportionately from air pollution, but other more-powerfulinterest groups are also affected and can join with them to promote policy action.Analysis of the distributional impact of alternative policies can be important andfacilitate the formation of such coalitions.
Proposed Policy SEA Approach
In order to more effectively influence policies, the proposed SEA approach aimsto strengthen the institutional, technical, and governance dimensions of policy-making processes. In addition to applying analytical and participatory approachestypical within SEA frameworks, SEA for policies or institution-centered SEA alsoneeds to incorporate a third pillar, designed to enhance learning and continuousimprovement of policy design and implementation.
Analytical Work
Analytical work that is likely to facilitate the influence of SEA on policy designand implementation consists of three components: identification of environ-mental priorities, technical analysis, and institutional analysis.
Identifying environmental priorities. The strategic character of SEAs is estab-lished when environmental priorities are identified, determining and revealingthe objectives, purposes, or goals to be pursued by public policies. The SEAapproach proposed here points out the importance of periodic reevaluation ofenvironmental priorities within a country or a sector through rigorous, quanti-tative analysis as well as consultation with weak and vulnerable stakeholders. Thissuggests the need for a priority-setting step that is both linked to the design andimplementation of a specific policy and used to raise attention to priorityenvironmental issues more broadly, so that as public policies are developed and
USING SEAs TO DESIGN AND IMPLEMENT PUBLIC POLICY 187
implemented, these high-priority environmental issues are internalized in thosepolicies. This is a major departure from traditional SEA methodologies.
Several factors can influence the establishment of environmental priorities.These include public clamor; cultural, historical, institutional, and political factors;development agency priorities; international agreements; judicial decisions; andthe results of technical studies employing analytical/quantitative techniques. Twoquantitative techniques relevant for priority setting are cost of degradation studiesand comparative risk assessments (see chapter 4). Cost of degradation studies,which use the language of finance officials, have been particularly effective in alertingsenior policy makers in finance and planning ministries to the importance ofenvironmental issues affecting the economy (Sarraf 2004; Pillai 2008).
Priority-setting exercises also focus attention in the context of scarce resourcesand competing priorities. As the ultimate goal to which countries aspire is long-term sustainable economic growth, it is important that any analytical work onprioritization evaluate environmental priorities, taking into account how theyaffect broader sustainable economic development. This suggests a departure fromtraditional SEA methodology, which focuses on significant stand-alone environ-mental impacts of a specific policy rather than its linkages with long-termsustainable economic development.
Such priority setting could be carried out by country nationals or externalactors. Ideally, such capacity needs to be built through domestic universities andthink tanks, but capacity building is a slow process.11 Practice shows that the useof these tools is often driven by development agency requests for funding.12
Also important is the need to amplify the voice of the weak and vulnerablestakeholders in the priority-setting exercise. This can be done through assessingthe distributional costs of environmental problems. Furthermore, combiningquantitative methods with participatory methods allows the understanding ofhow environmental degradation may affect vulnerable groups to be deepened.Indeed, in traditional SEA methodology, consultation with affected stakeholdersis the mechanism typically used to allow vulnerable stakeholders to voice theirviews. However, because of the role of vested interests and elite capture, it is impor-tant to acknowledge that conducting a one-off consultation in the context ofpreparing an SEA report, no matter how well done, does not ensure that reformproposals are taken up or implemented (Sánchez-Triana and Enriquez 2006).(This issue is addressed below.)
Technical analysis. Once priorities are identified, technical analysis to select effec-tive and efficient interventions comes into play. One important aspect of thisanalysis is the assessment of the costs and benefits of alternative policy designs,which provides information decision makers can use if opportunities for policyreform arise. However, identifying alternative interventions and estimatingthe costs and benefits of each intervention involves a number of uncertainties.
188 STRATEGIC ENVIRONMENTAL ASSESSMENT FOR POLICIES

As Pindyck (2007: 49) notes, environmental policy interventions “must contendwith highly nonlinear cost functions, irreversibilities, and long-term horizons. Butin addition, environmental problems usually involve three compounding levels ofuncertainty—uncertainty over the underlying physical or ecological processes,uncertainty over the economic impacts of environmental change, and uncertaintyover technological changes that might ameliorate those economic impacts and/orreduce the cost of limiting the environmental damage in the first place.”
Pindyck’s observation points to the importance of pairing technical analysiswith institutional analysis, so that institutionally feasible interventions can beidentified. Given the uncertainties in costs and benefits associated with environ-mental problems, the co-implementation of the pillar on learning processes(described below) helps ensure that the interventions selected steer policy designand implementation in the direction of greater environmental sustainability.
Institutional analysis. Elements that may yield better understanding of institu-tions linked with a particular policy reform include the following:■ Historical analysis to understand how current priorities have become locked in■ Political economy analysis, including goals, values, behaviors, and incentives
of stakeholders involved in policy formulation and implementation■ Analysis of horizontal (intersectoral) and vertical (across federal, state, and
municipal levels) coordination mechanisms within government to betterunderstand implementation hurdles
■ Analysis of mechanisms to promote social accountability and learning■ Identification of efficient and politically feasible interventions to overcome
environmental priority issues.
Participatory Approaches
To be inclusive, participatory approaches should identify weak and vulnerablegroups and amplify their voice in policy formation. Doing so will increase thelikelihood that policies that are responsive to many different segments of societyare designed and implemented.
Identifying weak and vulnerable stakeholders. In the context of environmentalissues, vulnerable groups include those susceptible to increased health risks asso-ciated with environmental factors, those whose livelihoods are threatened as aresult of changes in the natural resource base, and those susceptible to economiclosses as a result of disasters ranging from flooding to toxic chemical releases toglobal climate change.
Health outcomes associated with environmental factors, such as respiratory diseasesor waterborne diseases, are directly linked to human capital and hence current andfuture productivity. Most of the estimated 3 million deaths a year caused by air pollu-tion and waterborne diseases occur in women and young children from poor families
USING SEAs TO DESIGN AND IMPLEMENT PUBLIC POLICY 189
that lack access to safe water, sanitation, and modern household fuels (Ezzati andothers 2004). Even in the context of global environmental issues, such as climate vari-ability, it is the poor who often take the hardest hit, because they have limited copingstrategies and access to other resources. The arguments that environment is a globalgood and that the environment is closely linked with improved quality of life andwell-being for the poor in particular are not mutually exclusive.
The World Commission on Environment and Development’s definition ofsustainable development implies ensuring that future generations have at least thesame opportunities as current generations. For many, the future is distant and diffi-cult to link to present needs. It is, however, directly linked to the present throughchildren, the future generation (Ahmed and Sánchez-Triana 2004). Children arealso the ones usually most affected by environmental degradation in developingcountries, principally through the impact on their health. Diarrhea, for example,causes an estimated 1.7 million deaths a year (Pruss-Ustan and others 2004).
In an institution-centered SEA, the process of identifying the most vulnerablegroups differs from that used in traditional SEA methodologies, which focus onidentifying groups affected by physical environmental impacts, independent oftheir vulnerability. The Argentina Water Supply and Sanitation SEA illustrateshow the analysis provided by the SEA was targeted to design reforms aimed atproviding basic urban services to the lowest income groups. It identified how lackof access to water and sanitation primarily affected poor households, with chil-dren under five facing particularly severe risks. The SEA also looked at the factorsthat limited expansion of coverage to poor communities (Sánchez-Triana andEnriquez 2005, 2007).
Enhancing the voice of environmentally vulnerable groups. Sustainable policiesare those that favor poverty alleviation, economic growth, and control of envi-ronmental degradation. Bourguignon and others (2002, 2004), De Ferranti andothers (2004), and the World Bank (2005c) all note that equity (defined prima-rily as equality of opportunity) is highly effective for poverty reduction, becauseit tends to favor sustained overall development and provides increased opportu-nities to the poorest groups in society.
The development literature has increasingly recognized the importance ofproviding an opportunity for the vulnerable to voice their needs (World Bank2002b, 2005c). Kende-Robb and Van Wicklin argue convincingly in chapter 5 thatgiving the most vulnerable a voice helps policy makers understand the synergiesamong environmental goals, economic growth, and poverty reduction (WorldBank 2000b). They describe seven tools available to amplify the voice of the mostvulnerable. They also describe two case studies, in Brazil and Mongolia, wherethe voice of the vulnerable influenced policy formulation. They acknowledge thatwithout political support from those in power, the voice of the vulnerable wouldnot have been heard, much less acted upon.
190 STRATEGIC ENVIRONMENTAL ASSESSMENT FOR POLICIES

In general, open political environments provide opportunities for social inclusiveness around policies for improving the quality of life and reducing poverty.In Costa Rica, where there is a tradition of bringing marginal groups into the politi-cal sphere, the government was eager to better understand poverty from the perspectiveof the poor and welcomed a participatory poverty assessment (Robb 2002).
If a government is not fully committed to consulting with vulnerable groups,it is unlikely to act on research results that run counter to its own interest. In suchcircumstances, other mechanisms need to be considered for increasing the like-lihood that the views of the most vulnerable are heard.
One option is the use of national advocates on behalf of vulnerable groups. Incountries where the culture of consultation is weak, consulting national advo-cates may be easier than consulting vulnerable groups themselves, because theadvocates are nationals rather than external actors. Ensuring that CSOs or otheradvocates, such as university professors, are present in the community of partic-ipation on behalf of vulnerable groups is one way of making their views heard.CSOs often have their own narrow agendas, however, which may not be in linewith the needs of vulnerable groups. Furthermore, it is not possible to encourageCSOs to represent only vulnerable stakeholders. Encouraging CSO engagementin policy making may give powerful stakeholders another mechanism with whichto influence the policy debate.
An effective CSO advocate can be found in the case study, reported by Blair inchapter 6, on urban air pollution in Delhi. In this case two fairly elitist NGOs, theIndian Council for Enviro-Legal Action and the Centre for Science andEnvironment, brought public interest lawsuits and waged a high-profile, fact-based publicity campaign that compelled the government to enforce legalregulations on air pollution.
Reinforcing social accountability. Social accountability refers to the obligationof public officials and decision makers to render account to citizens and societyat large regarding their plans of actions, their behavior, and the results of theiractions (Ackerman 2005). At a general level, accountability mechanisms includefree and fair elections, legislative oversight, administrative supervision, financialaudits, legal redress (the rule of law), and a free and active media.
Social accountability mechanisms refer to the broad range of actions andmechanisms (beyond voting) that citizens can use to hold the state accountable.They include citizen monitoring of public services, participatory expendituretracking, social auditing, independent budget analysis, and civil society moni-toring of the impact of policies. These initiatives regularly rely on actions bygovernment, the media, and other societal actors that increase transparency,improve access to public information, or enhance the enabling environment forcivic engagement (Malena 2005). As Blair notes in chapter 6,“If developing coun-tries are to craft and nurture sustainable policy initiatives that can address
USING SEAs TO DESIGN AND IMPLEMENT PUBLIC POLICY 191

externalities in ways that will help the environment, they will need long-termconstituencies that want to support such policies and can hold policy makersaccountable for their performance in implementing them. Transparency will bethe critical quality in the policy process needed for these constituencies to demandaccountability from policy makers.”
Traditional SEA methodologies encourage disclosure of information and publicparticipation in the context of SEAs. In contrast, the methodology proposed hereemphasizes the strengthening of underlying legislation on information disclosureand public participation and related implementation practice consistent with the key messages put forth in Principle 10 of the Rio Declaration and emphasizedin the 1998 Aarhus Convention on Access to Information, Public Participation inDecision-Making and Access to Justice in Environmental Matters13—namely,public disclosure of information, public participation in decision making, andaccess to justice on environmental matters. These areas are crucial for shaping aculture of inclusion and consensus building and hence ensuring social account-ability for improved environmental governance.
Learning Processes
The third pillar for effective incorporation of environmental considerationsinto policy aims at enhancing social learning processes in order to periodicallyreevaluate policy direction and implementation in order to improve the qualityof life of all people. In doing so, the SEA becomes more tightly focused ondesigning and implementing public policies that are sustainable in the longterm rather than on minimizing or mitigating short-term biophysicalenvironmental impacts.
Policy making is an iterative and incremental process. The challenge is to putin place learning mechanisms that help ensure that incremental change is directedtoward long-term sustainable development. Putting learning mechanisms inplace is complicated, as Ebrahim notes in chapter 7. He suggests that policylearning may be enhanced where agendas and priorities are shaped by multiplestakeholder perspectives and that politicization of an issue in broad develop-mental and social terms (rather than only in environmental terms) is crucial forrepeated policy attention. He also suggests that policy learning may benefit fromparticipation of stakeholders at all stages of the policy process—from agendasetting through implementation, monitoring, and evaluation. Accountability inpolicy learning and implementation relies not only on monitoring and evalua-tion but also on effective transparency and enforcement mechanisms, wheretransparency refers not only to providing information before key decisions aremade but also to making information available in forms that are understand-able to users, thus allowing for a sustained and informed policy debate and, overtime, social learning.
192 STRATEGIC ENVIRONMENTAL ASSESSMENT FOR POLICIES

Building on the chapter by Ebrahim, this chapter proposes that the learningpillar of institution-centered SEA facilitate the following elements of social learning:■ “Politicizing” environmental issues, by linking them to broader issues of
economic and social development and poverty eradication■ Integrating agendas of environmental ministries with those of more influen-
tial ministries ■ Strengthening policy advocacy networks to ensure that diverse perspectives are
repeatedly placed on policy makers’ agendas■ Strengthening the capacity for policy research and analysis across all types of
policy actors (governments, CSOs, industry, universities, and so forth)■ Creating public forums for policy debate with appropriate backing from
top-level officials to effectively create political space for policy debate■ Encouraging participation of multiple public agencies on environmental policy
issues to reconcile interagency tensions while improving coordination andresources
■ Putting effective transparency mechanisms in place to make informationavailable to citizens in ways that can influence their political choices
■ Monitoring and evaluating the policy-making and implementation processesto facilitate learning
■ Supporting media scrutiny of policy and implementation to strengthenaccountability
■ Maintaining stakeholder engagement and networks after completing a policy-formulation exercise in order to ensure long-term learning and dialogue.Learning involves generating knowledge by processing information or events
and then using that knowledge to cause behavioral change. This progressionis a shift from traditional SEA methodologies, which focus on predicting impacts.The proposed approach in institution-centered SEA is consistent with adap-tive management (as described in chapter 3). Dialogue among actors, a cultureof questioning and scrutiny, social accountability mechanisms, and constantevaluation are also important in fostering social learning.
Ultimately, promoting social learning in environmental policy appears to be lessabout developing technical measures or benchmarks and monitoring systems andmore about creating a culture of stakeholder involvement and scrutiny among policymakers and implementers. Improving policy learning—technical, conceptual, andsocial—relies on enhanced communication and dialogue and continued evaluation.
Which agency should be responsible for implementing learning mechanisms?The answer is country specific. The role could be carried out by a powerful envi-ronmental agency, a planning agency, an auditor general’s office, or a combinationof them, among other options.
Social learning enables attention to be directed to priority environmental issues.It allows for incremental improvements over time, as states iterate through policy
USING SEAs TO DESIGN AND IMPLEMENT PUBLIC POLICY 193
formulation and implementation with continually broader perspectives andincreased knowledge on how to achieve more-sustainable environmental outcomes.
Lessons from Good Practice
Drawing from good practice on different components of the suggested policySEA approach, this section illustrate the opportunities to widely apply themethodology proposed toward attaining effective designs and implementationof sustainable policies.
Setting Priorities to Periodically Reevaluate Goals and Raise Attention
In order to bring an issue to the policy agenda, it is essential to first generateattention. An example illustrates this point. The Colombia cost of degradationstudy showed that the estimated number of annual premature deaths from urbanand indoor air pollution exceeded 7,000—more than the number in any othercategory, including road accidents. This fact helped attract the attention ofpolicy makers and the mass media to the importance of tackling air pollution, anissue that had not been high on the policy agenda (Larsen 2004; World Bank 2006;Sánchez-Triana, Ahmed, and Awe 2007).
Qualitative techniques, such as participatory poverty assessments and opinionsurveys, are also important. They need to be coupled with quantitative techniques,however, to ensure that perceptions are not solely driving prioritization. A randomsample survey of more than 2,600 citizens from the public and private sectors,industry, academia, and civil society was used to assess environmental prioritiesin the context of the Colombia CEA. It revealed that priorities varied with incomeas well across stakeholder groups. Among lower-income groups, environmentalissues linked to improvements in air quality and reduction in noise, together withreductions in risk from natural disasters, such as flooding and landslides, weremost important. By contrast, higher-income groups indicated that the most impor-tant priorities were global environmental issues, biodiversity, and urbanenvironmental issues. The general public, including many industry stakeholders,identified air pollution as the most important environmental issue, whereas envi-ronmental officials identified loss of biodiversity as most critical (CNC 2004;World Bank 2006; Sánchez-Triana, Ahmed, and Awe 2007).
Ensuring that the Voice of the Most Vulnerable Is Heard
The Government of Peru and the World Bank (2007) carried out a CountryEnvironmental Analysis (CEA) through a participatory process to build consensuson the importance, scope, and methodologies used in the environmental analysis.The CEA process ensured that the voice of the most vulnerable was heard at severalworkshops attended by representatives of various sectors, including the
194 STRATEGIC ENVIRONMENTAL ASSESSMENT FOR POLICIES

environment, health, finances, agriculture, energy, and mining; regionalenvironmental authorities; the private sector; NGOs; indigenous communities;civil society; and international organizations. As a result of the CEA, environ-mental health issues—Peru’s top environmental priority—were incorporated intothis analysis.14
As in the Colombia CEA example described earlier, distributional analysis wasalso used in Peru to estimate the impact of environmental degradation on themost vulnerable groups, thus helping identify linkages between environmentalhealth issues and poverty. As elsewhere, the poor in Peru tend to be exposed togreater environmental risks than higher-income groups and to lack the resourcesto mitigate those risks. The analysis found that the impact of urban air pollutionrelative to income was more severe for the poor than for the nonpoor. Healthimpact relative to income was a useful indicator, because illness and prematuremortality result in medical treatment costs and lost income, in addition to pain,suffering, and restriction of activity. Based on this indicator, health impacts were75–300 percent higher among the poor than among the nonpoor (World Bank2007). Through a media campaign, the results of the CEA analysis are helpingcreate awareness, generate national consensus, and build broader constituenciesaround an issue that matters most to the vulnerable groups.
Reinforcing Social Accountability
In recent years India has made major strides in increasing access to the judi-ciary to address environmental pollution issues. A landmark case on air qualityin Delhi firmly brought the issue to the attention of government policy makers(see chapter 6). In the early 1990s, an Indian nongovernmental organization(NGO) asked the Supreme Court to compel the Delhi government to enforcethe clean air laws that had been passed some 15 years earlier. After a long andsustained campaign by the NGO, which used quantitative information on healthdamage effects, including estimated mortality rates, as well as an effective publicawareness campaign through the press, in 1998 the Supreme Court issued itsfirst comprehensive mandate for tackling air pollution.
The trend in India continues, with the filing of a civil writ petition linked tothe installation and operation of incinerators for biomedical waste by an NGOagainst several government organizations, including the Ministry of the Environmentand Forests and the Central, Delhi, and Maharashtra Pollution Control Boards.Environment and Forests Secretary Prodipto Ghosh (2004) has stressed the impor-tance of voice and accountability mechanisms, such as India’s strong, independentjudicial institutions and free press, in harmonizing environmental concerns andeconomic growth.
Mechanisms to disseminate information in a manner that is easily interpretablecan allow communities to function as informal regulators. Such mechanisms also
USING SEAs TO DESIGN AND IMPLEMENT PUBLIC POLICY 195

promote accountability on the part of those being regulated. An example is thepioneering public disclosure scheme in Indonesia (PROPER), which encouragedfirms to clean up their air and water pollution (World Bank 2000a) (see chapter 6).In a second phase of the program, the government made the disclosure programcompulsory (Leitmann and Dore 2005). A mandatory program may induce greatersocial accountability than a voluntary program.
Other examples of accountability mechanisms include actions implemented bythe government in the Mexico Programmatic Environment Structural AdjustmentLoan (World Bank 2002a). These examples include public disclosure of funds returnedto municipalities for water treatment investment programs to encourage greaterscrutiny and accountability on the part of the public and the requirement to poston Internet the processing status of all environmental licenses. The requirement isintended to improve transparency of government procedures, thereby reducingcorrupt practices. A transparency law passed in 2001 greatly facilitated these actions.
CSOs can be a key mechanism for providing voice to those who are vulnerableto environmental damage. But it is essential to fully understand the institutionalcontext in which CSOs operate. Blackman and others (2004) note that eventhough Colombia’s 1991 constitution and Law 99 of 1993 create numerousmechanisms for public participation in both the formulation and implemen-tation of environmental policy, regulatory capture by private sector interestgroups and political considerations have a much stronger influence. They empha-size different courses of action to strengthen the environmental NGO sector inColombia, including promoting environmental education, making environ-mental data easily available, ensuring that NGOs are adequately represented onboth formal and informal deliberative bodies, and adopting reforms thatstrengthen advance notice of significant environmental policy actions and provideopportunities for public input.
Incorporating Learning in Environmental Policy Making and Implementation
In the 1970s, the conventional wisdom was that high ambient concentrations oftotal suspended particles represented a serious health problem. Improvements inmeasurement technologies and analytical techniques have since revealed that fineparticles with diameters of 2.5 microns (PM 2.5) or less appear to be the realculprits. This finding has lead to significant changes in air pollution control strate-gies in the United States and other countries. In Colombia, for example, throughdialogue over the CEA during 2004, the importance of fine particles on healthimpacts was increasingly recognized, and the government has committed to moveahead with the installation of a monitoring system for PM 2.5.15 This illustratesthe importance of ensuring that systems of evaluation are able to adjust to newdevelopments in science, technology, and other fields.
196 STRATEGIC ENVIRONMENTAL ASSESSMENT FOR POLICIES
The story of indoor air pollution is still at an early stage. As recently as 2000,a special theme paper published in the Bulletin of the World Health Organizationsuggested that indoor air pollution was a major public health hazard (Bruce, Perez-Padilla, and Albalak 2000). Indoor air pollution subsequently appeared on the listof top 10 causes of illness and death in the World Health Organization’s GlobalBurden of Disease report (WHO 2002). WHO estimates indicate that indoorsmoke from solid fuels causes 1.5 million deaths a year (WHO 2007). This problemhas existed for generations. Only with the creation of new information and theprocessing of that information did it become clear that this form of pollutionaffects millions of people, principally women and children in poor rural families,who depend on firewood for cooking and heating. Some countries are realizingthe importance of this problem and acting on it. Many others have still not graspedthe need to place this issue high up on the policy agenda.16
Another example of incremental behavioral change is the evolving policy inMexico with respect to improving the sustainability of water resource manage-ment. Allocated water rights far exceed water availability in certain water-stressedareas. Water availability and quality is a crucial resource for growth and qualityof life in some states. Politically, therefore, water is a contentious issue. Hence, adiscussion on reducing existing “rights” to such a resource is fraught with diffi-culties in the short term, despite its importance from a sustainability perspective,where water is considered a potential limiting factor to future growth. Mexico’sapproach in addressing this issue has been incremental. The first step was to effectbehavioral change by publishing water availability data and improving the waterrights registry. In 2002 the possibility of “buying back” excess water rights to accu-rately reflect water scarcity was mere speculation (World Bank 2002a). Three yearslater, the government was actively buying back water rights in one overexploitedaquifer (World Bank 2005b).
Other examples of behavioral change effected in a short period of time are thetransformations in Bogotá, Colombia, and Curitiba, Brazil. Both cities changedexpectations with respect to the quality of city life among their citizens. In Bogotáan increase in green spaces, pedestrian walkways, and bike paths; the introduc-tion of a bus mass transit system; and the introduction of an annual “day withouta car” during the short administration of Mayor Enrique Penalosa in the late 1990schanged citizens’ expectations regarding the quality of city life.
Publicly available monitoring and evaluation systems are crucial, not only fortechnical learning but also for purposes of democratic legitimacy and publicconfidence. Such systems involve both ex post evaluations and ex ante assessmentsof policy making and impacts built on broadly shared sustainable developmentgoals. Sometimes things do not seem as they appear. An example is the commonmisconception of the critical factors behind the success of Colombia’s CaucaValley Corporation’s successful water pollution control program, which has led
USING SEAs TO DESIGN AND IMPLEMENT PUBLIC POLICY 197

the corporation to emphasize cooperation with industry, deemphasize strictenforcement of regulations, and experiment with effluent charges. A more-thorough analysis demonstrates that an important factor for the success of theprogram was citizen pressure, negative publicity, and the policies of parenttransnational companies calling for the use of environmental audits to facilitatecompliance with environmental rules (Sánchez-Triana and Ortolano 2005).
Conclusions and Future Directions
This chapter proposes a new conceptual and methodological framework for theapplication of SEA to policies: institution-centered SEA. The approach extendsthe traditional two-pillar analytical and participatory approach in SEA method-ology by the addition of a third pillar designed to enhance learning and continuousimprovement of policy design and implementation. The approach takes intoaccount the process of policy formation and the importance of seizing oppor-tunities for policy reform as they arise. Elements within the approach also seekto enhance the creation of windows of opportunities for future policy reform.
The first pillar of the SEA approach includes three components:■ Environmental analysis, designed to identify priority environmental issues
within a country or a sector through quantitative analysis and consultationwith weak and vulnerable stakeholders
■ Technical analysis, which includes assessment of the costs and benefits ofalternative policy designs
■ Institutional analysis, which includes historical analysis to understand howcurrent priorities have become locked in; distributional costs of environmentalproblems; political economy analysis, including goals, values, behaviors, andincentives of stakeholders involved in policy formulation and implementation;analysis of mechanisms to promote social accountability and learning; analysisof horizontal (intersectoral) and vertical (across federal, state and municipallevels) coordination mechanisms within governments to better understandimplementation hurdles; and identification of efficient and politically feasibleinterventions to overcome environmental priority issues.The second pillar seeks to enhance social accountability of public officials to
all citizens, including the weak and vulnerable, and to facilitate the creation ofwindows of opportunity for continuous improvement of policies. The approach,therefore, suggests that institution-centered SEA move from consultation of affectedgroups to amplifying the voice of vulnerable groups through institutional mech-anisms, in order to facilitate the design of policies that are responsive to manydifferent segments of society.
The third pillar aims to enhance social learning processes so that there is peri-odic reevaluation of policy direction and implementation in order to improve the
198 STRATEGIC ENVIRONMENTAL ASSESSMENT FOR POLICIES
quality of life of all citizens. The focus is on designing and implementing publicpolicies that are sustainable in the long term rather than on minimizing or miti-gating short-term biophysical environmental impacts.
The outputs from institution-centered SEAs can be divided into two groups.The first are those with short-term impact. Identifying these recommendationsis particularly useful if decision makers are to be able to seize opportunities aswindows for reform open up. Recommendations with longer-term impact helpstrengthen institutional mechanisms over a longer period, so that public officialsare socially accountable to their citizens and can continue to pursue continuousimprovement of public policies in a direction of greater sustainability. Thisapproach, in turn, helps create windows of opportunity for future reform efforts.
Several countries have established national legislation and regulations thatrequire that SEAs be carried out by governmental agencies. SEA legal instru-ments include the European SEA Directive and the SEA Protocol to the UNECE(Espoo) Convention on Environmental Impact Assessment in a TransboundaryContext. These national and regional legal instruments focus on SEA for plansand programs. Several countries, including Canada, the Dominican Republic,Kenya, the Netherlands, and South Africa, also require SEA for policies (Ahmedand Fiadjoe 2006). Current SEA requirements in most national legal instru-ments emphasize traditional impact-centered SEA methodologies (Ahmed andFiadjoe 2006). If the proposed approach to SEA for policies presented in thischapter is validated, countries developing legislation requiring application ofSEA to policies may wish to rethink how SEA is described in their nationallegal instruments.
There is also increasing push for the application of SEA, by both donors anddeveloping countries, to make aid to developing countries more effective (OECD2006). Given scarce human and financial resources in developing countries, externalresources from development aid could be harnessed to support developing coun-tries’ efforts to conduct such assessments. Some examples include refining the broadercountry-level environmental analyses carried out by development agencies (whichalready include some level of assessment of both priority environmental problemsand institutional aspects) to better incorporate these concepts. Assessments of trans-parency, participation, and access conducted by CSOs could also be drawn on.17
If a country is to design and implement policies that enhance synergies amongpoverty alleviation, economic growth, and a healthy environment that enhancethe quality of life, it must be able to learn from experience. An institution-centeredSEA is likely to be more effective in influencing policy in a country with a stronglearning framework and culture. However, in countries with weaker learningframeworks, an institution-centered SEA that provides information and nurturesinternal champions and the formation of constituencies to enhance learning couldalso play an influential role.
USING SEAs TO DESIGN AND IMPLEMENT PUBLIC POLICY 199
Two broad aspects are particularly important for enhancing learning. In linewith adaptive management are monitoring and evaluation frameworks, whichcontinuously reexamine the priorities and underlying goals, evaluate distribu-tional impacts of environmental problems, assess distributional impacts of policyimplementation, and bring to the attention of policy makers the results ofmonitoring and evaluation. In line with inclusive management are promoting aculture of debate, scrutiny, and social accountability through information dissem-ination, using different mechanisms and forums to bring stakeholders togetherto participate in decision making, and access to recourse mechanisms or justiceon environmental matters.
Both require long periods of continuous engagement by policy makers as theymake changes in formal rules and attempt to change informal rules (culture,behavior, and so forth). For this reason, the effectiveness of institution-centeredSEA can be evaluated only over a long period of time. Such evaluation shouldassess both immediate changes in policies that improve environmental sustain-ability or quality of life, as well as the ability of the SEA to support decision makersin strengthening learning frameworks.
The World Bank is currently supporting a pilot program to test this approachin various countries and sectors. Evaluation of this program in the coming yearswill yield important lessons for refinement of this approach. However, if validated,the most important implication is that institution-centered SEA could help devel-oping country governments move toward a path that integrates poverty alleviation,social equity, economic growth, and ultimately environmental sustainability.
Notes
1 The authors, who task managed the Colombia Country Environmental Analysis, view thisproduct as an example of an institution-centered SEA.
2 The CARs were set up in Colombia between 1952 and 1974 as autonomous agencies withresponsibilities for implementing water resources and infrastructure projects (based onthe model of the Tennessee Valley Authority in the United States) (Sánchez-Triana 2007).By 1980, their mandate was expanded beyond these economic development functions toinclude environmental regulation (Sánchez-Triana and Ebrahim 1999; Sánchez-Triana,Ahmed, and Awe 2007).
3 The six impact indicators for environmental quality in the PATs cover issues such as defor-estation rates and forest conservation efforts, development of green markets, rationalizationand optimization of renewable natural resource consumption, reduction in health impactsassociated with environmental factors, and reduction in vulnerability risk associated withnatural disasters.
4 See http://www.worldbank.org/seatoolkit for more details.
5 This assessment was conducted in 2005, based on information available at the time. Itdoes not take into account any changes to these SEA systems made since June 2005.
6 The developmental path of policies is usually conditioned by those policies’ history. David(1985) and Arthur (1988a, 1988b, 1989, 1994) used the technologies they studied to
200 STRATEGIC ENVIRONMENTAL ASSESSMENT FOR POLICIES
demonstrate “the peculiar fact that incremental changes in technology, once begun on aparticular track, may lead one technological solution to win out over another, even when,ultimately this technological path may be less efficient than the abandoned alternativewould have been” (North 1990: 93). North (1990) extends Arthur’s concept of path depend-ence to institutional change and organizational decision making. For him (1990) pathdependence occurs because “the present and the future are connected to the past by thecontinuity of society’s institutions. Today’s and tomorrow’s choices are shaped by the past”(North, 1990: vii).
7 Easterly (2006) alludes to this in his depiction of the effectiveness of “planners” versus“preachers” in the context of development aid.
8 Fearing replacement, the monarchy and aristocracy in 19th century Russia and Austria-Hungary blocked the establishment of institutions to facilitate industrialization (Acemogluand Robinson 2006). The divergent development paths in North and South America sincecolonial times suggest how, in societies with high levels of inequality before colonization,institutions evolved in ways that restricted access to political power and economic oppor-tunities to a narrow elite (Engerman and Sokoloff 2002). Initial unequal conditions hadlong-term effects through elite influence on public policies.
9 A recent case study of the Bogotá Savanna documents that powerful interests, such as theirrigation district, the regional environmental corporation, and the energy company, havesecured access to a sufficient quantity of water in the Savanna. In contrast, small farmersin the region lack adequate water supplies (World Bank 2005a).
10 The National Technical Advisory Council in Colombia was set up under Article 11 ofLaw 99 of 1993 to assist the Ministry of the Environment in assessing the technical feasi-bility of environmental projects, policies, and regulations. It is directed by a secretaryappointed by the minister. Its members include representatives from universities, as wellas representatives from agriculture, mining, the petroleum industry, and other industries.This council is an example of regulatory capture, because private sector interests dominate(Blackman and others 2004).
11 The World Bank assisted the Government of Mexico in building national capacity for envi-ronmental economic analysis by creating and strengthening the Economic and Social Unitin the Mexican Ministry of the Environment and Natural Resources under the NationalEnvironmental Project, initiated in 1992 (World Bank 2005a). Sarraf (2004) reports thatthe Tunisian National Environmental Protection Agency is interested in setting up a unitof economists who will conduct economic analyses of environmental projects.
12 It was originally envisioned that client countries would finance and implement Povertyand Social Impact Analysis (PSIA) (personal communication Anis Dani, Advisor, SocialDevelopment Department, World Bank, May 17, 2005). The more than 100 PSIA studiesinitiated between 2001 and 2005 revealed the human and financial resource limitationsto their doing so, however. Although governments have taken the lead in designing andusing the results of these studies, capacity constraints and resource limitations often preventthem from managing them.
13. See http://www.unece.org/env/pp/documents/cep43e.pdf.
14 Air pollution and other environmental health problems were traditionally not consideredpriority issues in the environmental agenda in Peru.
15 Another air pollution issue that illustrates behavioral change is the phasing out of lead ingasoline as a result of greater understanding of its health impacts on children, as well asbetter knowledge that is based on other country’s experiences about how to move forwardand implement such a policy.
USING SEAs TO DESIGN AND IMPLEMENT PUBLIC POLICY 201

16 In Guatemala information on the connection between indoor pollution and health waslacking at all levels, from senior policy makers to poor women, many of whom wereunaware of the link between health and smoke from indoor combustion of fuelwood(Ahmed, Awe and others 2005).
17 See, for example, http://www.accessinitiative.org or http://www.pp10.org.
References
Acemoglu, Daron, and James A. Robinson. 2006. “Persistence of Power, Elites andInstitutions.” NBER Working Paper Series W12108, National Bureau of EconomicResearch, Cambridge, MA.
Ackerman, John M. 2005. Social Accountability in the Public Sector: A Conceptual Discussion.Social Development Paper 82, World Bank, Washington, DC.
Ahmed, Kulsum, Yewande Awe, Douglas Barnes, Maureen Cropper, and Masami Kojima. 2005.Environmental Health and Traditional Fuel Use in Guatemala. Directions in DevelopmentSeries, Washington, DC: World Bank.
Ahmed, Kulsum, and Yvonne Fiadjoe. 2006.“A Selective Review of SEA Legislation: Results froma Nine Country Review.” Environment Strategy Paper 13, World Bank, Washington, DC.
Ahmed, Kulsum, Jean-Roger Mercier, and Rob Verheem. 2005. Strategic Environment Assessment:Concept and Practice. Environment Strategy Note 14, World Bank, Washington, DC.
Ahmed, Kulsum, and Ernesto Sánchez-Triana. 2004. “Sustainable Development and PolicyReform: Implementing MDG 7, Target 9.” Environment Matters, World Bank AnnualReview (July 2003–June 2004), 22–25.
Arthur, W. Brian. 1988a.“Competing Technologies: An Overview.” In Technology and Economics,eds. G. Dosi, C. Freeman, R. Nelson, L. Soete, and G. Silverberg. London: Pinter.
———. 1988b. “Self-Reinforcing Mechanisms in Economics.” In The Economy as an EvolvingComplex System, eds. K. J. Arrow and P. Anderson, 9–33. New York: John Wiley.
———. 1989.“Competing Technologies, Increasing Returns, and Lock-In by Historical Events.”Economic Journal 99 (394): 116–31.
———. 1994. Increasing Returns and Path Dependence in the Economy. Ann Arbor: Universityof Michigan Press.
Bardhan, Pranab. 1989. “The New Institutional Economics and Development Theory.” WorldDevelopment 17 (9): 1389–95.
———. 2004. Scarcity, Conflicts, and Cooperation Essays in the Political and InstitutionalEconomics of Development. Cambridge, MA: MIT Press.
———. 2007. “Institutional Economics of Development: Some Reflections on RecentAdvances.” DEC Lecture, April 19, World Bank, Washington, DC.
Blackman, Allen, Sandra Hoffman, Richard Morgenstern, and Elizabeth Topping. 2004.Assessment of Colombia’s National Environmental System (SINA). Washington, DC:Resources for the Future.
Bourguignon, François, Francisco Ferreira, and Nora Lustig. 2004. The Microeconomics ofIncome Distribution Dynamics in East Asia and Latin America. New York: Oxford UniversityPress for the World Bank.
Bourguignon François, and Christian Morrisson. 2002. “Inequality among World Citizens:1820–1992.” American Economic Review 92 (4): 727–44.
202 STRATEGIC ENVIRONMENTAL ASSESSMENT FOR POLICIES
Bruce, Nigel, Rogelio Perez-Padilla, and Rachel Albalak. 2000. “Indoor Air Pollution inDeveloping Countries: A Major Environmental and Public Health Challenge.” Bulletin ofthe World Health Organization 78 (9): 1078–92.
Chavarro Vásquez, Pedro A. 2007. Evaluación del impacto del Análisis Ambiental de País (AAP)en las políticas gubernamentales y percepción públicas. Report commissioned by the WorldBank, Latin America and the Caribbean Region, Washington, DC.
CNC (Centro Nacional de Consultoria). 2004. “Colombian Environmental Priorities.”Presentation made at the Country Environmental Analysis Workshop, Bogotá, August 26.
Dalal-Clayton, B., and B. Sadler. 2005. “Strategic Environmental Assessment (SEA):A Sourcebook and Reference Guide to International Experience.” London: Earthscan.
David , Paul A. 1985. “Clio and the Economics of QWERTY.” American Economic Review75 (2): 332–37.
De Ferranti, David, Guillermo E. Perry, Francisco H. G. Ferreira, and Michael Walton. 2004.Inequality in Latin America: Breaking with History? Washington, DC: World Bank.
Easterly, William. 2001. The Elusive Quest for Growth. Cambridge, MA: MIT Press.
———. 2006. The White Man’s Burden. London: Penguin Press.
Engerman, Stanley L., and Kenneth L. Sokoloff. 2002. Factor Endowments, Inequality, and Pathsof Development among New World Economies. NBER Working Paper Series 9259, NationalBureau of Economic Research, Cambridge, MA.
Ezzati, Majid, Alan D. Lopez, Anthony Rodgers, and Christopher J. L. Murray. 2004. ComparativeQuantification of Health Risks: Global and Regional Burden of Disease Attributable to SelectedMajor Risk Factors, vol. 1. Geneva: World Health Organization.
Fischer, Thomas B. 2002. Strategic Environmental Assessment in Transport and Land UsePlanning. London: Earthscan.
Ghosh, Prodipto. 2004. “Harmonizing Environmental Concerns and Economic Growth: theIndian Perspective.” Environment Matters, World Bank Annual Review (July 2003–June2004): 10–11.
Grindle, M. S., and J. W. Thomas. 1991. Public Choices and Policy Change: The PoliticalEconomy of Reform in Developing Countries. Baltimore, MD: Johns Hopkins UniversityPress.
Larsen, Bjorn. 2004. Colombia: Cost of Environmental Damage. A Socio-Economic andEnvironmental Health Risk Assessment. Consultant report prepared for the Ministry ofEnvironment, Housing and Land Development, Bogotá.
Leitmann, J., and G. Dore. 2005. “Better Environmental Governance: Improving the Role ofLocal Governments and the Private Sector in Indonesia.” Presentation prepared for theEnvironmentally and Socially Sustainable Development Week, World Bank, Washington,DC.
Malena, Carmen, with Reiner Forster and Janmejay Singh. 2005. Social Accountability: AnIntroduction to the Concept and Emerging Practice. Social Development Paper 76, WorldBank, Washington, DC.
Noble, Bram F. 2002. “Strategic Environmental Assessment: What Is It and What Makes ItStrategic?” Journal of Environmental Assessment Policy and Management 2 (2): 203–24.
North, Douglass C. 1990. Institutions, Institutional Change, and Economic Performance. NewYork: Cambridge University Press.
———. 1993. “Nobel Prize Lecture.” December 9, Stockholm, Sweden.
USING SEAs TO DESIGN AND IMPLEMENT PUBLIC POLICY 203

North, Douglass C., John Joseph Wallis, and Barry R. Weingast. 2006. A Conceptual Frameworkfor Interpreting Recorded Human History. NBER Working Paper Series 12795, NationalBureau of Economic Research, Cambridge, MA.
OECD (Organisation for Economic Co-operation and Development). 2006. Applying StrategicEnvironmental Assessment (SEA): Good Practice Guidance for Development Co-operation.Development Assistance Committee Guidelines and Reference Series. Paris: OECD Publishing.
Partidário, Maria Rosario. 2002. “Strategic Environmental Assessment (SEA): Key Elementsand Practices in European Approaches. Course Manual.” Training course presented at the22nd Annual Meeting of the International Association for Impact Assessment, NetherlandsCongress Center, the Hague, June 15–16.
Pindyck, Robert S. 2007. “Uncertainty in Environmental Economics.” Review of EnvironmentalEconomics and Policy 1 (1): 45–65.
Pillai, Poonam. 2008. “Strengthening Policy Dialogue on Environment: Learning from FiveYears of Country Environment Analysis.” Environment Department Paper Series, WorldBank, Washington, DC.
Pruss-Ustan, A., D. Kay, L. Fewtrell, and J. Bartram. 2004. “Unsafe Water, Sanitation andHygiene.” In Comparative Quantification of Health Risks: Global and Regional Burden ofDisease Attributable to Selected Major Risk Factors, vol. 1, eds. Majid Ezzati, Alan D. Lopez,Anthony Rodgers, and Christopher J. L. Murray. Geneva: World Health Organization.
Robb, Caroline M. 2002. Can The Poor Influence Policy? Participatory Poverty Assessments inthe Developing World. Washington, DC: World Bank and International Monetary Fund.
Sadler, Barry, and Rob Verheem.1996. Strategic Environmental Assessment: Status, Challenges andFuture Directions. The Hague: Ministry of Housing, Spatial Planning and the Environment.
Sánchez-Triana, Ernesto. 2007. “A Unique Model for Environmental Management.” InEnvironmental Priorities and Poverty Reduction: A Country Environmental Analysis forColombia. Directions in Development Series. eds. E. Sánchez Triana, Kulsum Ahmed, andYewande Awe. Washington, DC: World Bank.
Sánchez-Triana, Ernesto, Kulsum Ahmed, and Yewande Awe, eds. 2007. Environmental Prioritiesand Poverty Reduction: A Country Environmental Analysis for Colombia. Directions inDevelopment Series. Washington, DC: World Bank.
Sánchez-Triana, Ernesto, and A. Ebrahim. 1999.“From the Tennessee Valley to the Cauca Valley:Differential Isomorphism in the Capture of Environmental Regulatory Agencies.” WorkingDocument, Instituto de Estudios Ambientales de la Universidad Nacional de Colombia,Bogota.
Sánchez-Triana, Ernesto, and S. Enriquez. 2005.“Using Strategic Assessments for EnvironmentalMainstreaming in the Water and Sanitation Sector: The Cases of Argentina and Colombia.”Sustainable Development Working Paper 26, Latin America and Caribbean Region, WorldBank, Washington, DC.
———. 2006. “Using Strategic Environmental Assessments for Environmental Mainstreamingin the Water and Sanitation Sector: The Cases of Argentina and Colombia.” EnvironmentStrategy Note 15, World Bank, Washington, DC.
———. 2007. “Using Policy-Based Strategic Environmental Assessments in Water Supply andSanitation Sector Reforms: The Cases of Argentina and Colombia.” Impact Assessment andProject Appraisal 25 (3): 175–88.
Sánchez-Triana, Ernesto, and Leonard Ortolano. 2005. “Influence of Organizational Learningon Water Pollution Control in Colombia’s Cauca Valley.” International Journal of WaterResources Development 21 (3): 493–508.
204 STRATEGIC ENVIRONMENTAL ASSESSMENT FOR POLICIES
Sarraf, Maria. 2004. “Assessing the Costs of Environmental Degradation in the Middle Eastand North Africa Region.” Environment Strategy Note 9, World Bank, Washington, DC.
Uribe, Alvaro. 2002a. “Manifiesto democrático: Los 100 puntos de Uribe.” El Colombiano,May 30, Medellin.
———. 2002b. “Punto 64. La Colombia que quiero. Manifiesto democrático: Los 100 puntosde Uribe.” El Colombiano, May 3, Medellin.
WHO (World Health Organization). 2002. World Health Report. Geneva.
———. 2007. Indoor Air Pollution: National Burden of Disease Estimates (Revised). Geneva.
World Bank. 2000a. Greening Industry. Washington, DC: World Bank.
———. 2000b. World Bank Development Report 2000/2001: Attacking Poverty. Washington,DC: World Bank.
———. 2002a. “Mexico: Programmatic Environment Structural Adjustment Loan: ProgramDocument. Report 24458 ME.” July 8, Washington, DC.
———. 2002b. World Development Report 2003: Sustainable Development in a Dynamic World.Washington, DC: World Bank.
———. 2005a. Integrating Environmental Considerations in Policy Formulation: Lessons fromPolicy-Based SEA Experience. Report 32783, Washington, DC.
———. 2005b. “Mexico: Second Programmatic Environment Development Policy Loan:Program Document.” Report 32248–MX, August 9, World Bank, Washington, DC.
———. 2005c. World Development Report 2006: Equity and Development. Washington, DC:World Bank.
———. 2006.“Republic of Colombia: Mitigating Environmental Degradation to Foster Growthand Reduce Inequality.” Report 36345–CO, Latin America and the Caribbean Region,Environmentally and Socially Sustainable Development Department, World Bank,Washington, DC.
———. 2007. Environmental Sustainability: A Key to Poverty Reduction in Peru. CountryEnvironmental Analysis. Washington, DC: Latin American and the Caribbean Region,Environmentally and Socially Sustainable Development Department.
USING SEAs TO DESIGN AND IMPLEMENT PUBLIC POLICY 205


A
Aarhus Convention on Access to Information,Public Participation in Decision-Makingand Access to Justice in EnvironmentalMatters (1998), 192
abatement, pollution, 7, 79, 135, 139–46,152, 196
accidents. See road accidentsaccountability
See also social accountability; transparencyCSOs and, 150in decision-making process, 64in developing countries, 127for environmental governance, 127–57in Indonesia, 146f, 146–47organizational learning and, 174–75policy design and implementation and, 164,
169, 172, 174–75, 192, 195–96of public officials, 98vulnerable groups and, 104
actors. See multiple and unitary actorsadaptive management model
See also inclusive management modelchallenges to, 172continuous policy formation and, 51, 55empirical evidence in, 163incremental policy improvements and, 185monitoring and, 200uncertainty and, 6, 38, 48, 49vulnerable groups and, 103, 121
Africa, 85, 87, 100See also individual countries
African National Congress (ANC), 170–71Agarwal, A., 135, 136, 153n16agenda setting, 163, 164, 169, 172–73, 175, 192
See also environmental priority settingagriculture and agricultural policies
crop patterns and, 103CSOs for, 131environmental objectives integrated into, 62
as “green issues,” 86participatory poverty assessment and, 113social impact analysis and, 113vulnerable groups, 100, 101, 195
Ahmed, K., 1, 7, 181air pollution
See also biomass fuelsacid rain and, 38in Brazil, 117children and, 84, 189, 197, 201n15coalitions to fight, 187in Columbia, 65, 181–82, 185, 194,
195, 196CRAs and, 77, 86DALYs and, 81damage from, 83–85, 84tdeaths caused by, 189–90, 194defined in Unfinished Business, 76in Delhi (India), 135–39, 147, 148, 148f,
151, 153n20, 191, 195in developing countries, 85, 101–2elderly and, 89n11in Indonesia, 140, 144, 146, 196indoor, 81, 84t, 84–85, 101–2, 182, 194, 197,
202n16mortality and morbidity and, 81, 83, 84,
89n11, 102, 195in United States, 63, 64
Algeria, 81, 84, 85allocation of resources, 52, 64, 95, 98,
114, 185Amazon, deforestation in, 169ambiguity in policy formation, 38, 39, 47,
48–56See also uncertainty in policy formation
Ames, B., 166, 167, 169ANC (African National Congress),
170–71área de proteçáo ambiental (APA) (Brazilian
environmentally protected area), 168–69,177n15
I N D E X
207
Boxes, figures, notes, and tables are indicated by b, f, n, and t, respectively.

Argentinaenvironmental assessments in, 31Ministry of Economy in, 13, 31sanitation sector reform in, 12, 13–14, 190SEA for trade agreements in, 15, 25SEA influence on policy making in, 30water sector reform in, 12, 13–14, 190
Argentina Water Sector Reform Project, 13Argentina Water Supply and Sanitation SEA,
190Argyris, C., 160Arrow, K., 64Asia, 85, 87, 99, 140
See also individual countries
B
Bahia (Brazil), 168–69, 173, 174Bangkok (Thailand), 66, 78Bangladesh, corruption in, 128Bangun Praja Program (BPP), 143banking sectors, 143, 145BAPEDAL (Environmental Impact and
Management Agency). See IndonesiaBardhan, Pranab, 186beneficiary assessments, 113–14, 121Bharatiya Janata Party (India), 153nn19–20Bhopal (India), 63biochemical oxygen demand (BOD), 139,
145–46biomass fuels, 81, 84–85, 102
See also air pollutionBlackman, A., 196Blair, H., 7, 127, 191BOD. See biochemical oxygen demandBogotá (Columbia), 64, 65, 182, 197bounded rationality, 41, 162, 164, 165f, 175Bourguignon, F., 190BPP (Bangun Praja Program), 143Brazil
forest clearance in, 152n2National Environmental Council, 177n15participatory budgeting and environmental
management in, 115–18, 190patrimonialism in, 159, 165–70water sector reform in, 49, 50, 52–55, 115
Brundtland Commission. See WorldCommission on Environment andDevelopment
budgets and budgetingin Brazil, 115–18, 166community scorecards and, 114participatory, 115–18, 121processes for, 42, 43, 46
Bulletin of the World Health Organization, 197bureaucracy and bureaucratic capacity
in Brazil, 169, 174choice opportunities and, 44constituencies and, 129in Czech Republic, 16, 23policy formation and, 103, 133, 186stability and, 166–67, 168
C
Cairo (Egypt), 66, 78Canada
Commissioner of the Environment andSustainable Development, 26, 27, 29
Department of Foreign Affairs andInternational Trade, 26–27
Environmental Assessment Agency, 26Ministry of Foreign Affairs, 32NAFTA and, 14–15Office of the Auditor General, 26Privy Council Office, 27, 29pro forma compliance in, 29, 30, 31SEA application to policies in, 5, 6, 184SEA directive (2004), 14, 26–27, 29SEA requirements for policy proposals in,
12, 25–27, 29–32, 199trade policy negotiations in, 25
capacity and coalition buildingadaptive management model and, 103community scorecards and, 114environmental damage studies and, 88inclusive management model and, 50participatory budgeting and, 116rational decision-making model and, 41–42tools for, 188
Cape Town (South Africa), 171, 177n18Caribbean, 83
See also individual countriesCARs. See corporaciónes autónomas regionalesCauca Valley Corporation (Columbia), 167,
174, 197–98CEA. See Columbia Country Environmental
Analysis; Peru Country EnvironmentalAnalysis
Cearà (Brazil), 49, 50, 52Center for Educational Policy Development
(CEPD), 171, 173Central America, 78
See also individual countriesCentre for Science and Environment (CSE),
135, 136–37, 138, 149, 150, 153n14,153n16, 191
CEPD. See Center for Educational PolicyDevelopment
208 INDEX

Chad, corruption in, 128chemical oxygen demand (COD), 139chemical pollutants, 77, 102children
air pollution affecting, 84, 189, 197, 201n15diarrhea and, 85, 101environmental risk and degradation
affecting, 1, 190mortality of, 89n12vulnerability of, 99, 101–2
China, 3, 81, 83, 89n10Cho, J., 87choice opportunities, 44, 46, 47, 50, 51citizen report cards, 114, 121City Square Councils Program (Brazil), 117civic engagement. See public involvementcivil society and civil society organizations
(CSOs)See also non-governmental organizations
(NGOs); transparencyin Brazil, 166in Columbia, 182defined, 130in developing countries, 199in India, 135–37, 138, 139, 146, 147, 149–51in Indonesia, 140, 142, 143, 144–45,
147–49, 151institutional dynamics within, 104in liberal democracies, 128in Mongolia, 119, 120participatory poverty assessment and, 113in Peru, 195social accountability and, 130–31, 133,
149–50in South Africa, 171transparency and, 129, 150vulnerable groups and, 191, 196
Clean Air Act of 1970 (U.S.), 63Clear Water, Blue Skies (World Bank), 81, 83,
89n10clientelism, 162, 166, 168, 169, 175climate change, 100, 102–3, 121CNG. See compressed natural gascoalition building. See capacity and coalition
buildingcoastal zone degradation. See environmental
degradationCOD (chemical oxygen demand), 139Cohen, M. D., 161Colombia
air pollution in, 65, 185, 196CARs in, 185environmental damages estimated in, 83,
86, 194
environmental management system in,176n10
environmental sustainability in, 2GDP loss in, 84media in, 174, 182, 195Minister of Interior and Justice, 83Ministry of the Environment, 182,
201n10soil erosion in, 85water pollution in, 12, 13–14, 167,
197–98Columbia Country Environmental Analysis
(CEA), 181, 194, 195, 196community scorecards, 114, 121comparative risk assessments (CRAs), 7, 62,
63, 86–88, 188background and development of, 66, 68defined, 65in developing countries, 68, 69t–71tgoals of, 66health risk and, 72t–75t, 76OECD countries and, 88n6risk rankings developed from, 77–78selection of elements for, 66–67stages of, 65in U.S. vs. other countries, 68, 76
compliance incentives, 31–32compressed natural gas (CNG), 137, 138conceptual learning, 161–62, 163, 164, 165f,
193CONNEPP (Consultative National
Environmental Policy Process), 171Connor, R., 25constituencies
in Columbia, 182, 195in developing countries, 192in India, 147–49in Indonesia, 141, 146fsocial accountability and, 128, 129–34, 132fin South Africa, 171
Constitution of 1991 (Columbia), 196consultations and consultative process
environmental priority setting and, 187influence through, 173in traditional SEA methodologies, 184with vulnerable groups, 106, 113, 122,
191, 198Consultative National Environmental Policy
Process (CONNEPP), 171continuous policy formation model, 38, 51f,
51–55, 54fConvention on Environmental Impact
Assessment in a Transboundary Context,6, 199
INDEX 209
coordination. See interagency coordinationcorporaciónes autónomas regionales (CARs),
181–82, 185, 200n2corruption
in Columbia, 182in Indonesia, 142, 145, 146, 148, 151reduction of, 98, 115, 186transparency and, 128–29
Corruption Perceptions Index (TransparencyInternational), 128
Costa Rica, 2, 191cost benefit analysis, 64, 188–89, 198cost of degradation studies. See economic
damage assessmentscost-of-illness approach, 81, 89n9Council of Scientific and Industrial Research
(CSIR), 20, 21CRAs. See comparative risk assessmentsCSE. See Centre for Science and EnvironmentCSIR. See Council of Scientific and Industrial
ResearchCSOs. See civil society and civil society
organizationsCuritiba (Brazil), 197Cyert, R.M., 42Czech Environmental Impact Assessment
Act (No. 244/1992), 16Czech Republic
Ministry for Regional Development, 16, 17,18, 24, 31
Ministry of the Environment, 16, 18monitoring programs in, 23process integration in, 23SEA influence on policy making in, 30Tourism Department, 18tourism policy and, 16–18, 24, 31
D
Dalal-Clayton, B., 8n7, 23, 24, 32n3,33n21, 184
DALYs. See disability-adjusted life yearsdeath. See mortality and morbiditydecision-making models, 38–47, 39fDe Ferranti, D., 190deforestation. See forests and deforestationdegradation. See environmental degradationDelhi (India)
accountability in, 151, 152CSE in, 149number of vehicles in, 153n21pollution in, 135–39, 148, 148f, 153n13,
153n20, 191, 195transparency in, 147
Denmark, SEA for policies in, 5
Department of Foreign Affairs andInternational Trade (DFAIT, Canada),15, 29
dependency. See path dependencydesign. See policy design and implementationdeveloping countries
See also specific countriesaid to, 199air pollution in, 85, 101–2comparative risk assessment in, 68, 69t–71tcost-of-illness approach in, 81environmental assessments in, 62environmental degradation in, 190environmental problem lists in, 66policy implementation in, 127, 164–65, 168,
191–92water pollution in, 101
Development Facilitation Act of 1995 (SouthAfrica), 20
Dewan Perakilan Rakyat Daerah (DPRDs)(Indonesian councils), 140, 141–42, 143,144, 145, 154n27
diarrheal illnesses, 1, 80, 85, 101, 190Directive 2001/42/EC. See European SEA
Directivedisability-adjusted life years (DALYs), 80–81,
89n9disclosure, 139–46Dominican Republic, SEA for policies in, 199dose-response coefficients, 83, 86double-loop learning. See single- and double-
loop learningDovers, S., 25DPRDs. See Dewan Perakilan Rakyat Daerahdrinking water, 77, 81, 85, 86
See also water pollution; water sectorsDugard, J., 170, 171Dusik, J., 17, 23, 24, 33n13, 33n23dying. See mortality and morbidity
E
Eastern Europe, 77, 87See also individual countries
Ebrahim, A., 7, 159, 192, 193economic damage assessments, 62, 63, 78–88,
188, 194Economic Times (newspaper), 153n14education sectors, 169, 170–72, 175Egypt, Arab Republic of, environmental
damages in, 81EIA Convention. See Convention on
Environmental Impact Assessment in aTransboundary Context
EIA Law of 1994 (Slovak Republic), 18
210 INDEX
EIAs. See environmental impact assessmentselderly persons, 63, 76, 89n11, 99elite capture, 186, 188
See also eliteselites
See also elite captureaccountability and, 134as constituencies, 148consultative process and, 173in India, 138in Indonesia, 144older, 133, 152n9in Pernambuco (Brazil), 166in South Africa, 170
emissions. See air pollutionEndangered Wildlife Trust, 170energy
biomass fuel as, 102citizen participation and, 96environmental considerations and, 62E-Tests and, 28policies, 18–20, 24, 25vulnerable groups and, 195
Energy Policy 2000 (Slovak Republic), 18–20,24, 25
Energy 2000 (organization), 19–20entrepreneurs. See policy entrepreneursENVIRONET (OECD Development
Assistance Committee Network onEnvironmental and DevelopmentCooperation), 8n5
Environmental Act 23 of 1997 (Indonesia),143, 150, 151
Environmental Atlas of Porto Alegre(Menegat), 117
environmental degradationchildren and, 190cost of, 79–80, 82tdamage assessments on, 83, 84, 85in Indonesia, 148of natural resources, 81poverty and, 99, 100, 101, 102–3SEA processes and, 181sustainable policies for, 190urban growth and, 117vulnerable groups and, 195
environmental health, 79, 100, 101–2, 195See also human health risks
Environmental Impact Assessment in aTransboundary Context, 6
environmental impact assessments (EIAs), 2–3,4b, 8n3, 11, 13, 16, 18
environmental priority setting, 61–94, 187–89See also agenda setting
background for, 62–65comparative risk assessment, 7, 62, 63,
65–78, 69t–71t, 72t–75t, 86–88economic damage assessment, 7, 62, 63,
78–88Environmental Resources Management (ERM
2004), 12, 24“Environmental Test,” 27–30EPA (U.S. Environmental Protection Agency),
63, 66EPCA (Environment Pollution Prevention and
Control Authority, India), 136ERM 2004. See Environmental Resources
ManagementEspoo Convention. See Convention on
Environmental Impact Assessment in aTransboundary Context
E-Test, 27–30ethnic minorities and indigenous peoples, 99,
167, 195Euphrates basin, 85Europe, 81
See also individual countriesEuropean SEA Directive (2001), 3, 5, 6, 199
F
farming. See agriculture and agricultural policiesFeldman, D.L., 66Feldman, M. S., 6, 37, 103, 104, 185Fischer, T., 33n16, 34n30fishing and fisheries, 81, 85, 101, 133, 138floods and flood protection programs, 4–5, 46,
102, 132, 133, 194Ford Foundation, 149Foreign Affairs Canada, 15, 31forests and deforestation, 99, 100, 112, 133,
169, 200n3Friends of the Earth, 149fuel. See air pollution; biomass fuels
G
Gandhi, Indira, 150garbage can model of decision making, 38,
43–47, 55, 161GDP. See gross domestic productGhosh, P., 153n22, 195Glasbergen, P., 161, 162, 163Global Burden of Disease report (World
Health Organization), 197Goetz, A. M., 176n7Grand Canyon (U.S.), 64grassroots groups, 116, 118, 137
See also non-governmental organizations
INDEX 211
Green Area Adoption Scheme (Brazil), 117Green Forest (Brazil), 52, 54f, 55“green” issues, 62, 63, 86Greenpeace, 149gross domestic product (GDP), 79, 81, 83, 84,
89n9, 89n12, 118Guatemala, indoor air pollution in, 202n16Guimarães, R. P., 166, 169
H
Haiti, farming practices in, 101hazardous waste, 77–78, 86, 140, 144, 146health. See diarrheal illnesses; environmental
health; human health risks; mortalityand morbidity
herders. See pastoralistshierarchies of power. See relationships of
powerHimalaya mountains, 152n2Hong Kong (China), 2“horizontal decentralization,” 169, 174horizontal integration, 23, 24, 27Household Livelihoods Capacity Support
Program, 120human capital approach, 81, 83, 89n12Human Development Report (Goetz &
Jenkins), 176n7human health risks, 68, 72t–75t, 76–77, 83–85,
84t, 88n7, 101, 189–90See also environmental health
Human Sciences Research Council, 171hygiene, 80, 84, 85, 101
See also sanitation sectors; wastemanagement
I
IAs. See integrated assessmentsimplementation. See policy design and
implementationincentives of policy proponents, 11–36inclusive management model
See also adaptive management modelambiguity and, 6–7, 48, 50challenges to, 172continuous policy formation and,
51, 185cooperation in, 38stakeholder participation in, 163, 200vulnerable groups and, 103, 104, 121
incremental decision-making model,42, 44
Indiaair pollution in, 135–39, 151, 153n20, 195
Central, Delhi, Maharashtra PollutionControl Boards, 195
CSOs in, 135–37, 138, 139, 146, 147, 149–51Environment Pollution Prevention and
Control Authority (EPCA), 136forestry project in, 112Kuznets curve and, 153n22Ministry of the Environment and Forests,
195Supreme Court, 135–37, 138, 151, 153n20,
195Indian Council for Enviro-Legal Action, 135,
191Indian National Congress Party, 153nn19–20indigenous peoples. See ethnic minorities and
indigenous peoplesIndonesia
Environmental Impact and ManagementAgency (BAPEDAL), 139, 140, 142, 146,147, 150–51
fishing in, 101Good Environmental Governance program,
143Ministry of the Environment (KLH),
140–41, 142, 143, 144, 145pollution abatement in, 7, 135, 139–46,
152, 196Indonesian Forum for Environment. See
WALHIindoor air pollution, 81, 84t, 84–85, 101–2,
182, 194, 197, 202n16industrial development policies, 20–21industrial waste and pollution, 81, 84, 85, 86,
115, 138institutional analysis, 107–12, 121, 189, 198integrated assessments (IAs), 25, 31, 33n24integration. See process integrationinteragency coordination, 21, 23International Standards Organization
(ISO), 142International Trade Advisory Committee
(ITAC), 14–15intersectoral coordination. See interagency
coordinationIran, Islamic Republic of, environmental
damages in, 81ISO (International Standards Organization),
142ITAC (International Trade Advisory
Committee), 14–15
J
Java (Indonesia), 139Jenkins, R., 176n7joint analysis, 106–7, 121
212 INDEX

K
kabupatens (Indonesian regionalgovernments), 140, 144, 154n27
Kalimantan (Indonesia), 139Keane, S. E., 87Keck, M. E., 166, 167, 169Kende-Robb, C., 7, 95, 190Kenya, SEA for policies in, 199Khademian, A. M., 6, 37, 103, 104, 185Kiev (Ukraine), 152n2Kiev Protocol, 6Kingdon, J., 45, 46Kirkpatrick, C., 34n25KLH (Ministry of the Environment). See
IndonesiaKonisky, D.M., 66Kosikova, S., 23kotas (Indonesian municipal governments),
140, 144, 154n27Kuznets, S., 153n22Kuznets curve, 138, 153n22KwaZulu-Natal (South Africa), 20–21KwaZulu-Natal Regional Economic Forum, 20KwaZulu-Natal Trade and Industrial
Development Policy, 21
L
land degradation. See environmentaldegradation
Land Law (Mongolia), 120Latin America, 83, 87, 167
See also individual countriesLaw 99 of 1993 (Columbia), 196, 201n10learning
See also conceptual learning; organizationallearning; single- and double-looplearning; social learning; technicallearning
ambiguous, 176n4superstitious, 176n4
Lebanon, 81, 85Lee, K. N., 49Lee, N., 24Leonard, H., 64Levinthal, D. A., 160Lima (Peru), 77Lindblom, C. E., 42linearity of policy process, 131–33, 132f
M
Makarim, N., 142March, J. G., 41, 42, 160, 161
Marquetti, A., 118Marshall, R., 33n16, 34n30Mato Grosso (Brazil), 166MDGs (Millennium Development Goals), 8n2media
accountability and, 128–29, 191in Brazil, 167, 174in Columbia, 174, 182, 195function of, 130in India, 135, 136, 137, 139in Indonesia, 143, 144–45, 147, 150in Mongolia, 119policy influence reporting, 133in Slovak Republic, 19
Mediterranean Environmental TechnicalAssistance Program (World Bank), 81
Mehta, M. C., 135, 136, 137, 150Menegat, R., 117Mexico, 2, 14, 87, 197, 201n11Mexico Programmatic Environment Structural
Adjustment Loan, 196Middle East, 85, 87
See also individual countriesMillennium Development Goals (MDGs), 8n2monetary valuations. See economic damage
assessmentsMongolia, 99, 118–21, 190Mongolian People’s Revolutionary Party
(MPRP), 119, 120Mongolia Participatory Poverty Assessment,
119–20monitoring and monitoring programs
in adaptive management model, 49, 200beneficiary assessment and, 113in Brazil, 167, 168citizen report cards and scorecards for, 114by Indian Supreme Court, 138in Indonesia, 140, 143, 152linearity of policy process and, 131in policy implementation, 164, 174, 192,
193SEA and, 22, 23, 29, 39shared decision making and, 107Slovak energy policy and, 19, 20social accountability and, 191in South Africa, 171–72stakeholder participation in, 175vulnerable groups and, 105, 121, 122
morbidity. See mortality and morbidityMorgenstern, R. D., 7, 61Morocco, 81, 84, 85mortality and morbidity
air pollution and, 81, 83, 84, 89n11,102, 195
INDEX 213
in children, 89n12DALYs and, 80, 89n9diarrhea and, 85, 101livestock, 118pollution generally and, 79
MPRP. See Mongolian People’s RevolutionaryParty
multiple and unitary actors, 40, 41–42
N
NAFTA (North American Free TradeAgreement), 14–15
NAFTA Environmental Review Committee,14, 15
National Education Policy Initiative (SouthAfrica), 170
National Environmental Management Act of1998 (South Africa), 20, 171
natural disasters, 1–2, 100, 102–3, 121, 194natural resource degradation. See
environmental degradationnatural resources and natural resource manage-
ment, 1, 2, 81, 95–96, 100–101, 144Navaho Generating Station (U.S.), 64Netherlands
Council of Ministers, 28, 29environmental policy in, 161E-Test evaluation in, 27–30Joint Support Center for Draft Legislation,
28Ministry of Housing, Spatial Planning and
the Environment, 28Ministry of Justice, 28, 29SEA application to policies in, 5, 6, 184SEA requirements for policy proposals in,
12, 25, 27–31, 199New Energy Policy of the Slovak Republic, 19New Zealand, SEA for policies in, 5NGOs. See non-governmental organizationsNile Equatorial Lakes region, 5Nixon, Richard, 152n2noise pollution, 13, 84, 194non-governmental organizations (NGOs)
See also civil society and civil societygroups; grassroots groups
in Brazil, 167–68, 173in Columbia, 196CRAs and, 67, 86in Delhi (India), 149–50, 191, 195in Indonesia, 141in Mongolia, 119, 120in Peru, 195in Slovak Republic, 19–20in South Africa, 170–71
North, D. C., 187North America, 81
See also individual countriesNorth American Commission on
Environmental Co-operation, 15North American Free Trade Agreement
(NAFTA), 14–15“North American Free Trade Agreement:
Canadian Environmental Review,” 14Novib (Dutch NGO), 149NTB (National Training Board). See South
Africa
O
OECD. See Organisation for Economic Co-operation and Development
OECD Development Assistance CommitteeNetwork on Environmental andDevelopment Cooperation(ENVIRONET), 8n5
Oliveira, J.A.P. de, 168, 169Olsen, J. P., 161Orange Revolution (2004), 152n2, 152n3Organisation for Economic Co-operation and
Development (OECD), 3, 8n5, 8n7, 88n6organizational behavior model, 43organizational learning, 159–79, 192–94
accountability in implementation,174–75
agenda setting in, 7, 172–73cases studies
in Brazil, 159, 165–70in South Africa, 159, 169, 170–72
defined, 160–63, 175n1fostering, 32framing policy learning, 163–64ScottishPower and, 33n16stakeholder representation and, 7,
173–74Orkin, M., 170, 171Ortolano, L., 6, 11, 184oversight. See monitoring and monitoring
programs
P
Pakistan, environmental costs in, 81Paraná (Brazil), 166, 167–68participation. See public involvementparticipatory budgeting. See budgets and
budgetingParticipatory Living Standards Assessment
(PLSA), 119–20pastoralists, 100, 118–21path dependency, 46–47, 185
214 INDEX
patrimonialism, 159, 162, 165–70, 173, 176n10PATs (Planes de Acción Trienal), 182Penalosa, E., 197Pernambuco (Brazil), 166Peru Country Environmental Analysis (CEA),
194–95pesticides, 78, 86Pindyck, R. S., 189Planafloro project (Brazil), 167, 173, 174Planes de Acción Trienal (PATs), 182, 200n3PLSA (Participatory Living Standards
Assessment), 119–20policy design and implementation,
181–205accountability in, 164, 169, 174–75, 191–92,
195–96bureaucratic capacity in, 166–67, 168challenges for applying SEA, 183, 185–87
continuous policy formation and,8, 185elite capture and vested interests, 186historical events and, 185political complexity of, 186–87
consultative process and, 173future directions for, 8, 184, 198–200lessons from good practice, 183–84,
194–98priority setting in, 187–89, 194proposed policy SEA approach, 183,
187–94institutional analysis and, 189learning processes, 8, 192–94participatory approaches, 189–92stakeholder identification, 189–90technical analysis and, 188–89
SEA for policies, 183, 184–85vulnerable groups and, 191–92, 195–96
policy entrepreneurs, 45, 46policy formation, continuous, 37–59, 56n1,
184See also policy formulation and SEAcontinuousness of, 6–8, 47–55, 185
ambiguity in, 38, 39, 47, 48–56continuous policy formation model, 38,51f, 51–55, 54funcertainty in, 38, 39, 47, 48–50, 51–52,54–55
decision-making models in, 38–47, 39fgarbage can model and, 38, 43–47, 55rational decision-making model and, 37,38, 40t, 40–43
policy formulation and SEA, 1–10See also policy formation, continuous;
policy-level SEAsapplication of SEA to plans and programs,
4–6
application of SEA to policies,5t, 5–6
evolution of SEA and, 2–3impact-based SEA and, 3–4, 4binstitution-centered SEA approach, 6–8
policy implementation. See policy design andimplementation
policy-level SEAs, 11–36See also policy formulation and SEAcase studies
in Argentina, 12, 13–14, 25, 30, 31in Canada, 14–15, 32in Czech Republic, 16–18, 24, 30, 31in Slovak Republic, 18–20, 25, 30in South Africa, 20–21
case study analysesdiluted attention to environment, 22t,23–25, 27, 31integration context and, 21–23, 22t
compliance incentives for, 31–32organizational learning and, 32SEA requirements for policy proposals,
25–30in Canada, 12, 25–27, 29–31in Netherlands, 12, 25, 27–31
SEA teams and policy designers and,30–31
political elites. See elitespollution. See abatement, pollution; air pollu-
tion; chemical pollutants; industrialwaste and pollution; waste management;water pollution
poor people. See poverty and poverty reduc-tion; vulnerable groups
Pope, C., 83Porto Alegre (Brazil), 115–18potable water. See drinking waterpoverty and poverty reduction
See also vulnerable groupsmeasurement of, 98–99, 105in Mongolia, 118–21natural resource management and,
100–101participatory budgeting and, 118participatory poverty assessments, 113–14,
121, 194policies for, 190–91, 199politicization of environmental issues and,
172public debate and, 97SEA processes and, 39, 181in South Africa, 172vulnerable groups and, 7, 96, 122
Poverty and Social Impact Analysis (PSIA),201n12
INDEX 215

Poverty Reduction Strategy Paper, 120power, relationships of, 162, 164, 165f, 175Presidential Decree 1200 of 2004 (Columbia),
181–82priority setting. See agenda setting;
environmental priority settingproblem lists, environmental, 66process integration, 11–36, 22t, 184process streams, 45, 46, 47pro forma compliance, 29, 30, 31Program for Pollution Control, Evaluation and
Rating I and II (PROPER I and II), 139,140, 141f, 142–44, 145–47, 149, 149f,154n28, 196
PSIA (Poverty and Social Impact Analysis),201n12
public disclosure, 139–46public involvement
See also stakeholdersin Brazil, 167–68in Czech Republic, 17degree of, 23NAFTA and, 14risk rankings and, 68in Slovak Republic, 19, 20
Q
quality of lifein Brazil, 197in Columbia, 182environment and, 79, 190, 199, 200policies for improving, 191social learning processes and, 192, 199
Quito (Ecuador), 66, 68, 78
R
Ralph, P., 66rational decision-making model, 37, 38, 40t,
40–43refuse disposal. See waste managementRegional Environmental Center for Central
and Eastern Europe, 24regulatory capture, 187report cards. See citizen report cardsright-to-know legislation, 164, 174, 175Rio Declaration on Environment and
Development (1992), 192Rio Earth Summit (1992), 8n2Rio Grande do Sul (Brazil), 115risk management and assessment,
65–66, 68risk rankings, 65, 67, 68, 72t–75t, 78road accidents, 66, 83, 84, 194
Rondônia (Brazil), 166, 167Rossouw, N., 177n18Rulth, A.H., 66
S
Sadler, B., 8n7, 11, 23, 24, 32n3, 33n21, 184SAGITs (Sectoral Advisory Groups on
International Trade), 14–15Sánchez-Triana, E., 1, 7, 181sanitation sectors, 12, 13–14, 190
See also hygiene; waste managementSarraf, M., 87SAs. See sustainability assessmentssatisficing, 41, 44Schön, D. A., 160scorecards. See community scorecardsScottishPower, 33n16SEAs. See Strategic Environmental AssessmentsSectoral Advisory Groups on International
Trade (SAGITs), 14–15Sectoral Operational Program for Tourism and
the Spa Industry, Czech Republic (SOP),16–18
sectors. See banking sectors; education sectors;sanitation sectors; water sectors
Seveso (Italy), 63shepherds. See pastoralistsShuttleworth, J., 34n25Simon, H., 41single- and double-loop learning, 160, 161Slovak Republic
energy policy and, 18–20, 25Ministry of Economy, 19, 20Ministry of the Environment, 19monitoring programs in, 23SEA in, 15, 30
Slovic, P., 67Smutney, M., 23social accountability, 127–57, 198–99
See also accountabilitycase studies
in India, 7, 135–39in Indonesia, 7, 135, 139–46
causal linkages, 131–34elites and, 134environmental accountability and, 132f,133externalities and constituencies, 133–34linearity of policy process and, 131–33,132flinking key variables, 132f, 134
definitions and causal linkages, 122n4,128–31accountability and, 7, 128
216 INDEX
civil society and, 130–31constituencies and, 7, 129–31participation and, 131strength of state and, 131, 134transparency and, 7, 128–29
elite control and, 186good governance and, 114in institutional analysis, 189joint-decision making and, 121patterns and themes, 146–51
accountability and, 146f, 146–47, 151civil society organizations, 149–50, 152constituencies and, 146f, 147–49, 148f,149f, 151–52legal environment, 150–51public decision making, 151transparency and, 146f, 147, 151
reinforcement of, 191–92, 195–96social learning and, 193
social impact analysis, 107, 112–13, 121social learning, 163, 164, 165f, 193–94, 198–99SOP (Sectoral Operational Program for
Tourism and the Spa Industry, CzechRepublic), 16–18
South AfricaCouncil for Scientific and Industrial
Research, 171Department of Environment and Tourism,
20Department of National Education, 170Educational Policy Units, 170environmental and educational concerns,
159, 169, 170–72industrial development policy and, 20–21intersectoral coordination in, 23KwaZulu-Natal trade and, 20–21monitoring programs in, 23National Education Coordinating
Committee, 170National Training Board (NTB), 171, 173SEA requirements for policies in, 199
South African Consultative NationalEnvironmental Policy Process, 173
Southern African Nature Foundation, 170stakeholders
See also public involvementaccess to environmental information and,
100in adaptive management model, 50analysis, 107, 113, 121in Argentinean water sector project, 13benefits of involvement by, 97bounded rationality and, 162damage studies by, 88in education sectors, 170, 174–75
identification of weak and vulnerable,189–90
in NAFTA negotiations, 15participatory budgeting and, 116representation of, 164, 169, 172, 173–74in SEA process, 39social impact analysis and, 112in South African trade and industrial devel-
opment policy, 20, 21vulnerable groups as, 104–5, 191, 198
Strategic Environmental Assessments (SEAs)applying to plans and programs, 4–6applying to policies, 5t, 5–6evolution of, 2–3ex ante, 12–13impact-based SEA, 3–4, 4binstitution-centered, 6–8, 183, 183f, 187,
190, 193, 198–200policy-level, 11–36
streams. See process streamsSuharto, 145, 151Sumatra (Indonesia), 139sustainability assessments (SAs), 25, 33n24sustainable development, 2, 190sustainable livelihoods approach, 119, 120Syrian Arab Republic, 81, 84, 85Szentendre (Hungary), 24
T
Taiwan (China), 77–78, 88n7Taj Mahal (India), 136technical learning, 163, 164, 165f, 193terms of reference (TORs), 13, 15, 18, 28,
33n23Times of India (newspaper), 138, 153n14Tocqueville, Alexis de, 128TORs. See terms of referencetourism
coastal zone degradation and, 81in Costa Rica, 2in Czech Republic, 16–18, 24, 31environmental considerations and, 33n13,
62losses in, 79, 84, 85–86in Mexico, 2, 87
Tourism Policy 2000 (Czech Republic), 16toxic waste. See hazardous wastetraffic accidents. See road accidentstransparency
See also accountability; civil society and civilsociety organizations
analytical studies improving, 64in Brazil, 168
INDEX 217

CRAs and, 88CSOs and, 150in Delhi (India), 147in developing countries, 127, 199elites and need for, 134environmental concerns and, 61in Indonesia, 146f, 147of information, 172, 174, 175, 186, 193in natural resource management, 96participatory poverty assessment and, 114in policy implementation, 164, 167, 192social accountability and, 128–29, 191–92vulnerable groups and, 95, 121
Transparency International, 128, 154n33Tshandu, Z., 170, 171tsunamis, 1, 102Tunisia, 81, 85–86, 201n11
U
Ukraine, Orange Revolution in, 152n2uncertainty in policy formation, 38, 39, 47,
48–52, 54–55See also ambiguity in policy formation
Unfinished Business (U.S. EPA), 66, 67, 68,76–77, 88n7
unitary actors. See multiple and unitary actorsUnited States
air pollution in, 196chemical pollutants in, 77comparative risk assessment in, 65, 68drinking water in, 77economic damage assessment in, 78Environmental Protection Agency (EPA),
63, 66NAFTA and, 14pesticides on food in, 78risk and economic analyses in, 64, 65risk ranking in, 67statistical life estimate in, 89n10Watergate and, 152n2
United States Agency for InternationalDevelopment (USAID), 68
Uribe, Alvaro, 182USAID (United States Agency for International
Development), 68
V
valuations. See economic damage assessmentsVan Wicklin, W. A., III, 7, 95, 190vertical integration, 33n21vested interests, 186–87, 188Vietnam, participatory poverty assessment in,
113–14
Voices of the Poor (World Bank), 99vulnerable groups, 95–126, 194–95
See also poverty and poverty reductionbeneficiary and participatory poverty
assessment, 113–14, 121case studies
in Brazil, 115–18, 190in Mongolia, 118–21, 190
citizen report cards and community score-cards, 114, 121
climate change and, 102–3, 121communication tools for, 7, 107–14,
108t–111t, 112f, 121, 190communicative entry points for, 7, 104–5communicative environment for, 103–4,
121, 190–91definition of, 98–100, 121environmental health and, 101–2institutional analysis, 107–12involvement in policy formulation, 97f,
97–99, 121, 122levels of policy process participation by,
106f, 106–7natural disasters and, 102–3, 121natural resource management and, 100–101policy design and implementation and,
194–95social impact analysis, 112–13stakeholder analysis and, 107, 113waste management and, 102, 121
W
Wahana Lingkungan Hidup Indonesia. SeeWALHI
WALHI, 149, 150, 151Wallis, J. J., 187waste. See hazardous waste; industrial waste
and pollution; waste managementwaste management
See also hygiene; sanitation sectorsin Brazil, 115, 117damage assessments on, 83, 84in Indonesia, 143social costs of inadequate, 81vulnerable groups and, 100, 102
Watergate, 152n2water pollution
See also drinking water; water sectorsin Brazil, 117in Columbia, 12, 13–14, 167, 197–98complaints about, 63CRAs measuring, 86damage assessments on, 83, 85deaths caused by, 189–90
218 INDEX

in developing countries, 101in Indonesia, 139–40, 143, 144, 196in surface water, 77
water sectorsSee also drinking water; water pollutionin Argentina, 12, 13–14, 190in Brazil, 49, 50, 52–55, 115citizens role in policy formation, 96disability-adjusted life years and, 80in Mexico, 197
Weingast, B. R., 187West Bengal (India), 77White, G., 130, 152n5WHO. See World Health OrganizationWildlife Society of Southern Africa, 170willingness-to-pay approach, 81, 83,
89nn11–12Wiseman, K., 177n18women, 84, 99, 102, 189, 197, 202n16Workers Party (Brazil), 115, 117, 118World Bank
Argentina and, 12, 13–14, 31Columbia and, 86disability-adjusted life years and, 80environmental degradation costs measured
by, 81, 82t, 83
Environmental Department, 83Environment Strategy of 2001, 8n7Indonesia and, 144institutional analysis used by, 112institution-centered SEA and, 7, 183, 200Mexico and, 87, 201n11participatory budgeting and, 118Peru and, 194–95poverty reduction and, 99, 190PROPER supported by, 149risk and economic approaches used by, 62stakeholder analysis used by, 107
World Commission on Environment andDevelopment (Brundtland Commission),8n2, 190
World Development Report (2003, WorldBank), 176n7
World Health Organization (WHO), 83, 197
Y
Yushchenko, V., 152n2
Z
Zambia Social Recovery Project, 113Zeckhauser, R., 64
INDEX 219

220 INDEX

INDEX 221

ECO-AUDIT
Environmental Benefits Statement
The World Bank is committed to preservingendangered forests and natural resources.The Office of the Publisher has chosen toprint Strategic Environmental Assessmentfor Policies on recycled paper with 100 percent postconsumer fiber in accordancewith the recommended standards for paperusage set by the Green Press Initiative, anonprofit program supporting publishers inusing fiber that is not sourced from endan-gered forests. For more information, visitwww.greenpressinitiative.org.
Saved:• 6 trees• 4 million BTUs of total
energy• 500 lbs. CO2 equivalent
of greenhouse gases• 2,076 gallons of
waste water• 267 pounds of
solid waste
E N V I R O N M E N T A N D D E V E L O P M E N T
Strategic Environmental Assessment for Policies
STRATEGIC ENVIRO
NM
ENTA
L ASSESSMEN
T FOR PO
LICIESA
n In
strum
ent for G
ood Govern
ance
ISBN 978-0-8213-6762-9
SKU 16762
Kulsum Ahmed and Ernesto Sánchez-Triana, Editors
An Instrument for Good Governance
“A great contribution to an exciting new field of SEA application: policy design and implementation. This book contains important lessons on how to improve the effectiveness of SEA at the policy level. It builds bridges between the worlds of impact assessment and political decision making. Specifically, convincing arguments are given to pay more attention to institutional and governance dimensions in policy SEA. The book shows ways forward in applying SEA as a continuous process rather than as a discrete intervention.”
Rob VerheemDeputy Director, The Netherlands Commission for Environmental Assessment
“This book suggests how an institutional lens can be applied systematically to improve public policy design and implementation and sectoral governance both from supply and demand perspectives. Environmental and natural resources policies are the focus of the book, but the lessons are much broader and should be of interest to both policy makers and development professionals.”
Sanjay PradhanDirector, Public Sector Governance, World Bank


![Creating a Conducive Policy Environment for Micro, Small ... · Rosewood Drive, Danvers, MA 01923 [Fax: (+1) (978) 750 4470; e-mail: info@copyright.com] or in other countries with](https://static.fdocuments.us/doc/165x107/5f6fd5275a9fad3d4e5b86db/creating-a-conducive-policy-environment-for-micro-small-rosewood-drive-danvers.jpg)


![Copyright © International Labour Organization 2005 · Drive, Danvers, MA 01923 [Fax: (+1) (978) 750 4470, email: info@copyright.com] or in other countries with associated Reproduction](https://static.fdocuments.us/doc/165x107/5ec0ec9804c946640339e48b/copyright-international-labour-organization-2005-drive-danvers-ma-01923-fax.jpg)