
AO WORLD PLC Final Results FY18 · This presentation contains oral and written statements that are,...
27
© 2018 AO World All Rights Reserved AO WORLD PLC Final Results FY18 5 June 2018
Transcript of AO WORLD PLC Final Results FY18 · This presentation contains oral and written statements that are,...

© 2018 AO World All Rights Reserved
AO WORLD PLCFinal Results FY185 June 2018

Forward-looking statements disclaimer
This presentation contains oral and written statements that are, or may be, “forward-looking statements” with respect to certain of AO World plc’s(“AO”) plans and its current goals and expectations relating to its future financial condition, performance and results. These forward-lookingstatements are usually identified by words such as “believe”, “estimates”, “plans”, “projects”, “anticipates”, “goal”, “expects”, “intends”, “may”, “will”,or “should” or, in each case, their negative or other variations or comparable terminology. These forward-looking statements include matters thatare not historical facts and include statements regarding the Company’s intentions, beliefs or current expectations.
Any forward-looking statements in this presentation reflect the Company’s current expectations and projections about future events. By theirnature, forward-looking statements involve a number of risks, uncertainties and assumptions which may be beyond AO’s control and could causeactual results or events to differ materially from those expressed or implied by the forward-looking statements. There are important factors thatcould cause AO’s actual financial condition, performance and results to differ materially from those expressed or implied by the forward-lookingstatements, including, among other things: UK domestic and global political, social and economic and business conditions; our ability to maintainour culture, expand into new European territories, grow our brand and attract new customers; the resilience of our IT systems; changes inregulations or compliance and interruption to physical infrastructure. A further list and description of these risks, uncertainties and other factors, isset out in our Interim Results for the six months to 30 September 2017 and our Annual Report for the year ended 31 March 2018 (which will shortlybe available) both of which can be found at www.ao.com/corporate.
Forward-looking statements contained in this presentation regarding past trends or activities should not be taken as a representation that suchtrends or activities will continue in the future. You should not place undue reliance on forward-looking statements, which speak only as of the dateof this presentation. No representations or warranties are made as to the accuracy of such statements, estimates or projections. AO expresslydisclaims any undertaking or obligation to update the forward-looking statements made in this presentation or any other forward-lookingstatements we may make except as required by law.
Please note that the Directors of the Company are, in making this presentation, not seeking to encourage shareholders to either buy or sell shares inthe Company. Shareholders in any doubt about what action to take are recommended to seek financial advice from an independent financialadvisor authorised by the Financial Services and Markets Act 2000.
A copy of this presentation can be found on our corporate website at www.ao.com/corporate
2

Agenda
Welcome Geoff Cooper, Chairman
Financial Performance Mark Higgins, CFO
Strategic Progress Steve Caunce, CEO
Q&A
3

FY18 highlights
• Growing revenue and steady financial progress
• Significant achievements in building the strength of the business
• Fundamental work in articulation of strategy
4

Financial Performance
Mark HigginsChief Financial Officer
5

FY18 financial highlights
• UK AO website sales up 8.7% (total UK revenue up 8.1%)
• Europe revenue up 54.8%
• Group revenue up 13.6%
• Adjusted EBITDA:
− UK profit reduced to £22.6m
− Europe losses reduced to €29.6m
− Group losses increased to £3.4m
6

Continued revenue growth
• Group revenue increased by 13.6% to £796.8m (FY17: £701.2m)
• Overall UK growth of 8.1% to £680.8m (FY17:£629.7m) continues to be driven by AO website sales as we consolidate our position in core UK markets
• Strong European revenue growth of 54.8% to €131.2m (FY17: €84.7m)
For the 12 months ending 31 March 2018Note: Certain financial data have been rounded. As a result of this rounding, the total of data presented may vary slightly from the arithmetic totals of such data.
599701
797
0100200300400500600700800900
FY16 FY17 FY18
Group Revenue (GBPm)
↑17%
↑14%
56
85
131
0
20
40
60
80
100
120
140
FY16 FY17 FY18
Europe Revenue (EURm)
↑52%
↑55%
7
558630
681
0
100
200
300
400
500
600
700
800
FY16 FY17 FY18
UK Revenue (GBPm)
↑13%
↑8%

Gross margin remains on plan
UK
• Efficiency gains in delivery & trunking costs and improvements in warranty contribution offset by:
– Competitive pricing environment in mature categories
– Dilutive margin impact of newer categories as we build scale
• Supplier support remains strong
Europe
• Further supplier product margin progress
• Improvements in costs-to-deliver but logistics leverage will not be linear (FY19 investment in outbases)
• Further improvements as volumes/drop densities increase
• On-track against expectations set out in February ’17
For the 12 months ending 31 March 2018Note: Certain financial data have been rounded. As a result of this rounding, the total of data presented may vary slightly from the arithmetic totals of such data.
8
19.3
20.3
22.5
19.9
22.2
20.4
(13.8)
(10.0)
(5.7)
(5.5)
(4.2)
(1.0)
-20.0 -10.0 0.0 10.0 20.0 30.0
H1 16
H2 16
H1 17
H2 17
H1 18
H2 18
Gross Margin %
Europe UK

UK SG&A cost analysis
UK
• Warehousing costs reflecting revenue leverage in the investments in recycling and outbases evident in first half
• Marketing costs showing a significant reduction from 5.5% H1 to 3.0 % in H2
− First half includes BGT sponsorship
− Second half significantly lower TV advertising
− Will resume TV advertising in FY19 following the launch of our new brand creative
• Other admin reflective of investments in IT, ecommerce and aftercare sales teams
Notes*Excludes impact of ERP share plan charges, restructuring costs and European set-up costs which are categorised as exceptional Certain financial data have been rounded. As a result of this rounding, the total of data presented may vary slightly from the arithmetic totals of such data
9
3.8% 4.3% 5.5%3.0%
4.5% 4.2%4.5%
4.3%
10.6%8.4%
10.8%
10.0%
0%
5%
10%
15%
20%
25%
FY17/H1 FY17/H2 FY18/H1 FY18/H2
UK SG&A Expenses as a % of revenue*
Advertising and Marketing Warehousing Other Admin
16.9% 17.3%
20.8%
18.9%

Europe SG&A cost analysis
Europe
• Continue to demonstrate leverage across all cost bases with revenue growth
• Marketing costs reflective of minimal branded advertising and mostly traffic acquisition
• We expect to continue to leverage Other admin with growth
Notes*Excludes impact of ERP share plan charges, restructuring costs and European set-up costs which are categorised as exceptional Certain financial data have been rounded. As a result of this rounding, the total of data presented may vary slightly from the arithmetic totals of such data.
10
8.6% 8.6%4.7% 3.7%
6.5% 5.0%
4.0%3.4%
18.6%17.9%
15.8%
12.9%
0%
5%
10%
15%
20%
25%
30%
35%
40%
FY17/H1 FY17/H2 FY18/H1 FY18/H2
Europe SG&A Expenses as a % of revenue*
Advertising and Marketing Warehousing Other Admin
31.6%
20.0%
24.5%
33.6%
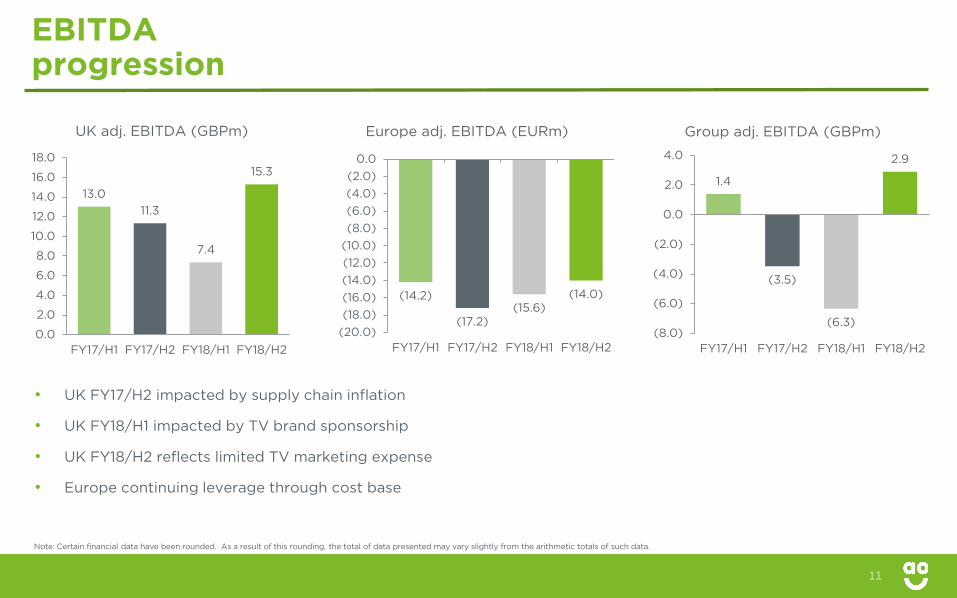
EBITDA progression
Note: Certain financial data have been rounded. As a result of this rounding, the total of data presented may vary slightly from the arithmetic totals of such data.
11
1.4
(3.5)
(6.3)
2.9
(8.0)
(6.0)
(4.0)
(2.0)
0.0
2.0
4.0
FY17/H1 FY17/H2 FY18/H1 FY18/H2
Group adj. EBITDA (GBPm)
13.011.3
7.4
15.3
0.0
2.0
4.0
6.0
8.0
10.0
12.0
14.0
16.0
18.0
FY17/H1 FY17/H2 FY18/H1 FY18/H2
UK adj. EBITDA (GBPm)
(14.2)
(17.2)(15.6)
(14.0)
(20.0)(18.0)(16.0)(14.0)(12.0)(10.0)(8.0)(6.0)(4.0)(2.0)
0.0
FY17/H1 FY17/H2 FY18/H1 FY18/H2
Europe adj. EBITDA (EURm)
• UK FY17/H2 impacted by supply chain inflation
• UK FY18/H1 impacted by TV brand sponsorship
• UK FY18/H2 reflects limited TV marketing expense
• Europe continuing leverage through cost base

Operating cash flow
Note: Certain financial data have been rounded. As a result of this rounding, the total of data presented may vary slightly from the arithmetic totals of such data.
• Working capital outflow as inventory and accrued income increased faster than creditors
• Replacement Capex of £5.5m during period (FY17: £16.9m)
• £48m (net) equity placing in April ’17
RCF extended to support future growth
• RCF agreed June ’16 now increased to £60m
• Addition of new lender – HSBC
• RCF for working capital purposes in the UK business
• Supports growth during peak
• Significant liquidity headroom
As at 31 March (£m) FY18 FY17
Adjusted EBITDA (3.4) (2.1)
Europe set-up costs (0.3) (0.7)
Non-cash movements 0.8 1.2
Net change working capital:
Movement in trade & other receivables and accrued income (21.5) (13.3)
Movement in inventories (8.4) (10.3)
Movement in trade and other payables 17.1 28.9
Cash generated from / (used in) operating activities (15.7) 3.7
Tax received/(paid) 0.3 0.2
Capex and interest received (5.2) (4.9)
Financing activities (4.1) (2.6)
Placing proceeds 48.1 -
Movement in cash 23.5 (4.0)
Net cash 52.9 29.4
Un-utilised facilities 58.6 29.5
Total liquidity 111.5 58.9
12

FY19 Financial outlook
Trading
UK
• Market conditions expected to remain tough but we have achieved double-digit sales growth in first two months of FY19 underpinning market expectations for the full year
• Will return to investing in brand advertising in the UK following conclusion of review
Europe
• Progress continues against the plan set out at our Capital Markets Day
Capex
• Further significant investment in recycling
• Expected to be similar to FY17 with asset finance against large investments
13

Strategic Progress
Steve CaunceChief Executive Officer
14

Ensuring we are aligned for growth
15
CEO FY18 focus:
• Our Strategy
• Our Purpose
• Our Brand
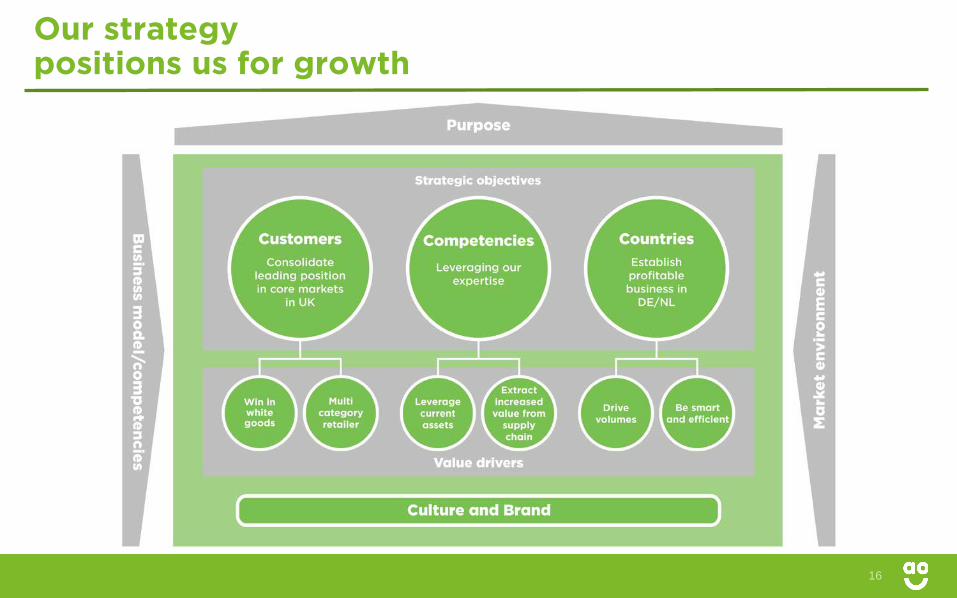
Our strategypositions us for growth
16

OurPurpose
• AO is an evolving business
• Been living and breathing our culture for years but to protect it we have:
– worked to identify what drives and connects our business; and
– articulated our Purpose in such a way so that it applies to all our competencies
• Allows us to:
– sharpen the lens through which we operate
– provide alignment and a renewed sense of direction and motivation
17

Using our Purpose to build our brand
• Our Purpose is the cornerstone of new brand campaign
• 12 month process undertaken involving extensive consumer research
• Creation of a new brand platform
• Go-live date H1/FY19
18

UK brand progress
• Modest increases in spontaneous and prompted brand awareness over the reporting period
• Actions required:
– Build trust and awareness
– Encourage trial – when customers try AO they love us
19
Source: Mediacom Brand Tracking survey, Large Kitchen Appliances
0%
10%
20%
30%
40%
50%
60%
70%
Jul-
13O
ct-1
3Ja
n-14
Ap
r-14
Jul-
14O
ct-1
4Ja
n-15
Ap
r-15
Jul-
15O
ct-1
5Ja
n-16
Ap
r-16
Jul-
16O
ct-1
6Ja
n-17
Ap
r-17
Jul-
17O
ct-1
7Ja
n-18
UK Spontaneous Brand Awareness
UK Prompted Brand Awareness

Strategic progress
20
• Customers
• Competencies
• Countries

Strategic Objectives: Customers
Delivering our customer objective
• Transactional Mobile App successfully launched across all territories
• Addition of complementary categories and ranges: Mobile Phones, Gaming Consoles, Smart Home and Cameras
• Introduction of great value timed-delivery slots
• New outbase opened in Bridgend September ’17 to improve delivery ability and services
• Increase in UK premium installation fleet to improve lead times
21
OBJECTIVE: CONSOLIDATE LEADING POSITION IN CORE MARKETS IN THE UK

Strategic Objectives: Customers
Strong UK customer metrics
• Approaching 5 million customers who have bought from AO
• Net Promoter Score remains consistently high at >80
• Reached over 100,000 reviews on UK site Trustpilot whilst maintaining a 95% “great” or “excellent” score
• AO.com voted third best online shop by Which? (2017)
- 500
1,000 1,500
2,000 2,500 3,000 3,500 4,000 4,500 5,000
FY14 FY15 FY16 FY17 FY18
UK Customers (000's)*
*A customer is defined as an individual who has purchased from us
22
OBJECTIVE: CONSOLIDATE LEADING POSITION IN CORE MARKETS IN THE UK

Strategic Objectives: Customers
0%
10%
20%
30%
40%
50%
60%
0
100000
200000
300000
400000
500000
600000
Jun-
08
Sep
-08
Dec
-08
Mar
-09
Jun-
09
Sep
-09
Dec
-09
Mar
-10
Jun-
10S
ep-1
0D
ec-1
0M
ar-1
1Ju
n-11
Sep
-11
Dec
-11
Mar
-12
Jun-
12S
ep-1
2D
ec-1
2M
ar-1
3Ju
n-13
Sep
-13
Dec
-13
Mar
-14
Jun-
14S
ep-1
4D
ec-1
4M
ar-1
5Ju
n-15
Sep
-15
Dec
-15
Mar
-16
Jun-
16S
ep-1
6D
ec-1
6M
ar-1
7Ju
n-17
Sep
-17
Dec
-17
Mar
-18
% o
f repeat
Cus
tom
er n
umb
er
UK New Customers vs Repeat Customers %
New Customers Repeat Customers Repeat %
First order Time
23
OBJECTIVE: CONSOLIDATE LEADING POSITION IN CORE MARKETS IN THE UK
Strategic Objectives: Competencies
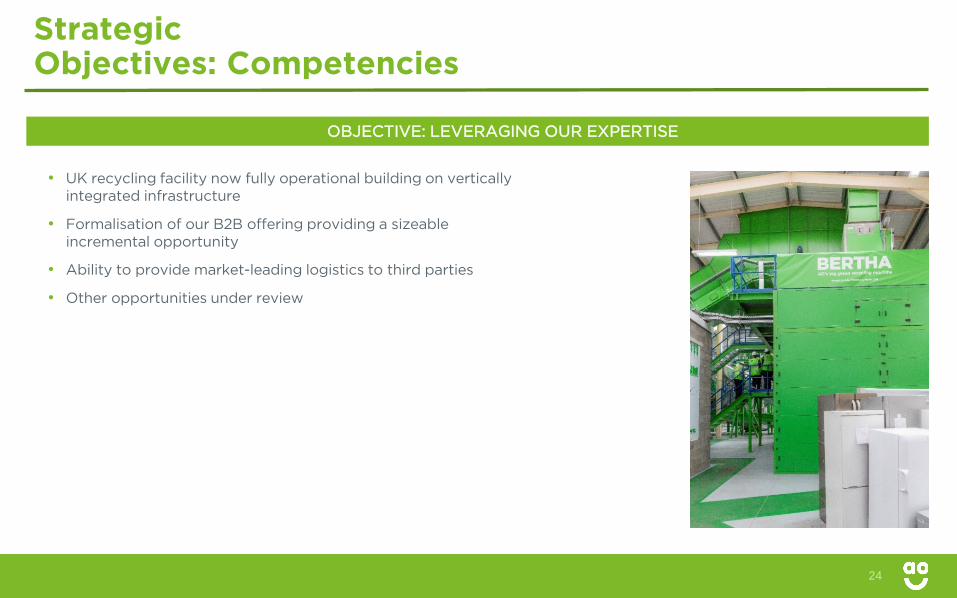
• UK recycling facility now fully operational building on vertically integrated infrastructure
• Formalisation of our B2B offering providing a sizeable incremental opportunity
• Ability to provide market-leading logistics to third parties
• Other opportunities under review
24
OBJECTIVE: LEVERAGING OUR EXPERTISE

Strategic Objectives: Countries
OBJECTIVE: ESTABLISH PROFITABLE BUSINESS IN DE/NL
25
• All key metrics improving
• New categories rolled out
• Further enhancements to customer journey
• Leveraging Bergheim
• Culture & management structure well embedded
• Supplier support continues to build
• Growing with minimal ATL marketing investment
• On-track to achieve expectations set out at February ’17 Capital Markets Day
0%
5%
10%
15%
20%
25%
0
20000
40000
60000
80000
100000
120000
Dec
-14
Mar
-15
Jun-
15
Sep
-15
Dec
-15
Mar
-16
Jun-
16
Sep
-16
Dec
-16
Mar
-17
Jun-
17
Sep
-17
Dec
-17
Mar
-18
% o
f repeat
Cus
tom
er n
umb
er
Europe New Customers vs Repeat Customers %
New customers Repeat customer EUR % repeat UK % repeat*
First order time
Netherlands commences trading
*UK % repeat based on comparable trading period of Jun-08 to Sep-11

Summary & outlook
• Our redefined Purpose will ensure strategic priorities are driven with consistency
• Continuing to deliver our objectives:
– Strong customer metrics in core UK business, new categories rolled-out
– Leveraging our competencies into new opportunities
– European operations progressing to plan
• Continuing economic uncertainty in UK
• Remain excited about the opportunities available to us
26

Q&A
27


![FY18 June Bernstein.pptx [Read-Only]2 Forward-Looking Statements and Non-GAAP Measures Forward-Looking Statements This presentation contains certain “forward-looking statements”](https://static.fdocuments.us/doc/165x107/5e69560b2621db78a82794d7/fy18-june-read-only-2-forward-looking-statements-and-non-gaap-measures-forward-looking.jpg)