ANZ Economic Monthly · heavy industry and real estate – where there are concerns aboutexcess...
26
Economics@ November/December 2005 ANZ Economic Monthly 1 ANZ Economic Monthly Report from China: High growth, stable policies This week, Economics@ANZ undertook a research trip to China that included a series of meetings with government officials, business executives and independent experts and observers. The meetings provided important insights into some of the major economic trends in China at the moment, as well as indications as to how economic policy might evolve in the short and medium term. This report will focus on those insights, and their potential impact upon some of our forecasts for the global economy and the financial markets. Growth may well be accelerating as we head into 2006 Headline GDP growth was around 9.5% for the first three quarters of this year, led by very strong investment growth and supported by strong export growth. ANZ’s forecast had been that real GDP growth would slow to around 9% in the next few quarters and to around 8% by the end of next year due to government efforts to a slowdown in investment and falling US demand. However, many public and private sector observers in China say that there are no signs of a slowdown in sight; in keeping with widespread consensus that headline GDP figures often misstate real growth levels, some suggest that China’s real GDP is expanding at an annual rate of anywhere from 12% to 15%. The government believes that the official statistics are correct, and that the economy’s natural rate of growth is on the order of 9-10%. Views on the ground therefore suggest that there is significant upside risk to ANZ’s growth forecast. While on the surface this may cause concern about the potential for overheating, some argue that investment activity may be rotating away from heavy industry and real estate – where there are concerns about excess capacity – and toward infrastructure, particularly in non-coastal areas. Raising investment levels in rural areas is in line with the new Five Year Plan for 2006 – 2011 that focuses on reducing income disparities. Such a rotation would ease fears about overcapacity in heavy industry and real estate while keeping headline fixed asset investment growth rates relatively high. At the same time, export growth remains well above 25% YOY and shows little sign of slowing. A pickup in imports of semi-finished data processing and electronics parts may indicate that China’s electronics assembly sector is picking up steam; this would be consistent with the pickup in electronics orders observed in Taiwan over the past few months. The source of the demand is likely to be a combination of business investment picking up in the US and Europe as well as the anticipation of requirements for the post-Katrina rebuilding period. Accelerating export growth adds to surplus 85.0 95.0 105.0 115.0 125.0 135.0 145.0 J-04 S-04 D-04 M-05 J-05 S-05 85 90 95 100 June 04 = 100 100 Imports (LHS) Exports (LHS) Manufacturing as % of exports (RHS) % 100 0.0 5.0 10.0 15.0 20.0 25.0 2000 2001 2002 2003 2004 2005 US$ bn 100 Mobile Phones New-tech & high-tech products Electronic machinery & Parts Digital processing components Trade growth Electronics exports Source: Datastream Price pressures seem relatively benign There is debate in China about whether inflation or deflation represents a greater economic risk, as the CPI has declined from more than 5% on an annual basis in mid-2004 to only 1.2% YOY in October. The ex-factory prices that comprise PPI remain fairly flat. Disinflation in this case is a curious trend, considering the very strong levels of growth. As CPI in particular has been dragged down by falling food prices following weather- related spikes last year, some observers remain concerned about latent price pressures that could arise once the base effect wears off. There is evidence to suggest there is modest inflation in non-food consumer prices. Given food’s very heavy weighting in the CPI, there appears to be some consideration of further modifying the index to reflect the changing nature of consumption in the economy. The majority of observers however feel that deflation remains a greater risk, as producers clearly have only limited pricing power in an increasingly crowded market of locally produced goods. While there is little doubt that China’s middle class is expanding and that consumption in major cities is on the rise, this remains a relatively small percentage of the population and of the
Transcript of ANZ Economic Monthly · heavy industry and real estate – where there are concerns aboutexcess...

Economics@ November/December 2005
ANZ Economic Monthly 1
ANZ Economic Monthly
Report from China: High growth, stable policies
This week, Economics@ANZ undertook a research trip to China that included a series of meetings with government officials, business executives and independent experts and observers. The meetings provided important insights into some of the major economic trends in China at the moment, as well as indications as to how economic policy might evolve in the short and medium term. This report will focus on those insights, and their potential impact upon some of our forecasts for the global economy and the financial markets. Growth may well be accelerating as we head into 2006
Headline GDP growth was around 9.5% for the first three quarters of this year, led by very strong investment growth and supported by strong export growth. ANZ’s forecast had been that real GDP growth would slow to around 9% in the next few quarters and to around 8% by the end of next year due to government efforts to a slowdown in investment and falling US demand. However, many public and private sector observers in China say that there are no signs of a slowdown in sight; in keeping with widespread consensus that headline GDP figures often misstate real growth levels, some suggest that China’s real GDP is expanding at an annual rate of anywhere from 12% to 15%. The government believes that the official statistics are correct, and that the economy’s natural rate of growth is on the order of 9-10%. Views on the ground therefore suggest that there is significant upside risk to ANZ’s growth forecast. While on the surface this may cause concern about the potential for overheating, some argue that investment activity may be rotating away from heavy industry and real estate – where there are concerns about excess capacity – and toward infrastructure, particularly in non-coastal areas. Raising investment levels in rural areas is in line with the new Five Year Plan for 2006 – 2011 that focuses on reducing income disparities. Such a rotation would ease fears about overcapacity in heavy industry and real estate while keeping headline fixed asset investment growth rates relatively high. At the same time, export growth remains well above 25% YOY and shows little sign of slowing. A pickup in imports of semi-finished data processing and electronics parts may indicate that China’s electronics assembly sector is picking up steam;
this would be consistent with the pickup in electronics orders observed in Taiwan over the past few months. The source of the demand is likely to be a combination of business investment picking up in the US and Europe as well as the anticipation of requirements for the post-Katrina rebuilding period.
Accelerating export growth adds to surplus
55.0
65.0
75.0
85.0
95.0
105.0
115.0
125.0
135.0
145.0
J-04 S-04 D-04 M-05 J-05 S-0585
90
95
100
105
110
115
120
125
130June 04 = 100100
Imports (LHS)
Exports (LHS)
Manufacturing as % of exports (RHS)
%100
0.0
5.0
10.0
15.0
20.0
25.0
2000 2001 2002 2003 2004 2005
US$ bn100
Mobile Phones
New-tech & high-tech products
Electronic machinery & Parts
Digital processing components
Trade growth Electronics exports
Source: Datastream Price pressures seem relatively benign
There is debate in China about whether inflation or deflation represents a greater economic risk, as the CPI has declined from more than 5% on an annual basis in mid-2004 to only 1.2% YOY in October. The ex-factory prices that comprise PPI remain fairly flat. Disinflation in this case is a curious trend, considering the very strong levels of growth. As CPI in particular has been dragged down by falling food prices following weather-related spikes last year, some observers remain concerned about latent price pressures that could arise once the base effect wears off. There is evidence to suggest there is modest inflation in non-food consumer prices. Given food’s very heavy weighting in the CPI, there appears to be some consideration of further modifying the index to reflect the changing nature of consumption in the economy. The majority of observers however feel that deflation remains a greater risk, as producers clearly have only limited pricing power in an increasingly crowded market of locally produced goods. While there is little doubt that China’s middle class is expanding and that consumption in major cities is on the rise, this remains a relatively small percentage of the population and of the

Economics@
ANZ Economic Monthly 2
overall economy and so does not tend to be reflected in national data. However, the general consensus seems to be that as the focus of investment rotates away from areas in which there may be excess capacity, pricing power may return on a wider basis and ease the threat of deflation.
Consumer price inflation relatively low
Selected Components of CPI
Sources:Datastream, Economics@ANZ.
-10
-5
0
5
10
15
2003 2004 2005
Durables UtilitiesFood Rent
CPI
% YOY
Over the longer term, many seem to believe that the overall risk of inflation remains negligible given China’s vast pool of untapped labour in rural areas combined with plans to continue the urbanisation process. Under this scenario, wage growth would remain muted and so would inflation expectations. A rapid acceleration in wage growth would be the first indication that real inflation expectations were starting to develop in the economy. The government’s focus on employment growth means efforts will be made to maintain both low prices and low interest rates The authorities are extremely focused on improving income inequality and raising the standard of living for the 80%+ of the population who lives in rural China. Although there is speculation in the local media on the possibility of raising the retail price of petrol or raising money market rates to reduce liquidity, the government seems unlikely to proceed with such measures for fear of a potentially negative impact on low wage earners. To the extent that the government may become concerned about overheating or excessive investment, the response appears likely to be a greater reliance upon administrative rather than market-based measures. There is little question that there is a lot of liquidity in the economy – M2 is more than four times the size of foreign exchange reserves, and the credit / GDP ratio far exceeds that of other Asian economies. Nonetheless, the authorities feel that credit conditions are fairly tight, which is the result of
regulations adopted over the past year. Going forward, administrative measures could include such steps as further guidelines from the banking regulator in relation to perceived risks in certain sectors or fiscal incentives to direct liquidity in a certain manner. The economy’s key growth drivers will remain investment and exports in the short and medium term Although the new 5 Year Plan advocates increased consumption – an advance for a government that has traditionally emphasised the virtues of thrift – powering up a large consumer base in China presents major obstacles. The savings rate stands at about 40% and will be difficult to change due to the relatively small social safety net as well as low rates of return on personal savings. To the extent that investment remains a key growth driver, it will be important to ensure that the rotation of capital expenditure as discussed above does occur. If not, there is a risk that excess capacity will continue to accumulate and eventually lead into a deflationary cycle. Of course, greater financial sector liberalisation and the development of the local capital market could help to lower the savings rate over the longer term. Offering investable assets with decent rates of return would help to reduce the amount of principle that households need to save in order to provide for their future. Greater availability of capital to small and medium sized enterprises would also lower the need at present to use personal savings to fund small businesses. Such structural reforms could provide the basis for the next phase of productivity growth in the Chinese economy, but changes in this area are likely to proceed only slowly. Expect nothing but gradual change to the exchange rate On 25 November, the People’s Bank of China conducted its first foreign exchange swap in the newly established swap market, selling US$6 bn in one-year currency swaps at a rate of USD/CNY 7.85 versus a rate of about USD/CNY 8.079 currently. The transaction had the effect of both draining liquidity from the market, and signalling the central bank’s intention on the rate of appreciation for the CNY. This is closely in line with our forecast for an end-2006 exchange rate of USD/CNY 7.78, a pro jection that was based on the view that the authorities would move cautiously with exchange rate appreciation in order to gauge the effects on capital flows and the economy. Indications from the monetary authorities in the local press are that such swaps may be conducted on a fairly regular basis going forward. It will be

Economics@ Economics@
ANZ Economic Monthly 3
interesting to watch the choice of tenors for these transactions, as a longer tenor would provide an even longer-term signal as to the potential pace of appreciation. Liberalisation of the foreign exchange regime and liberalisation of the capital account are both proceeding, but should not be viewed as simultaneous processes For many decades, the Chinese economy has operated under the framework of a fixed and/or heavily managed exchange rate and a closed capital account under which cross border foreign exchange transactions required government approval. This policy framework allowed the government to determine monetary policy based solely upon the needs of developing the domestic economy while ignoring growth and inflation differentials with China’s major trading partners. With the unification of China’s exchange rate(s) in 1994 and the move to a more flexible exchange rate regime in July 2005, the government is purposefully allowing its exchange rate to become more responsive to the real balance of demand and supply for the CNY from domestic and foreign actors. This process needs to be understood as being distinct from the process of opening the capital account to formally allow more types of foreign exchange transactions, and to allow transactions to occur without pre -approval. The government is taking steps to liberalise the capital account, at the moment primarily by loosening the regulations around capital outflows. Independent experts have suggested that the sequencing of the liberalisation of the exchange regime and the capital account need to be considered separately. The further liberalisation of the capital account could continue with the easing of more restrictions around particular categories of transactions. At the same time, other steps to further regulate transactions through the capital account could also be taken. The pace of foreign exchange reserve accumulation has not slowed, and this continues to be in focus
Reserves accumulated at an average pace of US$16.8 bn per month for the first half of the year, with accumulation accelerating to an average of US$19.3 per month in the third quarter. Total reserves were US$769 bn at the end of September, and at this rate would easily exceed US$800 bn by the end of this year.
China dominates FX Reserves accumulation
Sources: Datastream, Bloomberg
-10
-5
0
5
10
15
20
25
30
35
40
Dec-04 Mar-05 Jun-05 Sep-05
US$ bn
China
ASEAN 5North East Asia
Japan
Monthly FX Reserves accumulation
29.3North East Asia
27.6ASEAN 5
3.2Philippines
195.1China
56.9Total Asia (ex China)
1.4Thailand
17.4Malaysia
5.5Singapore
0.1Indonesia
1.3Hong Kong
14.6Taiwan
13.4Korea
FX Reserves (US$bn)
FX Reserves accumulation since Dec 2004
ASEAN5 inlc: Indonesia, Singapore, Malaysia, Thailand & PhilippinesNorth E Asia incl: Korea, HongKong & Taiwan
The rapid pace of reserve accumulation complicates the conduct of monetary policy as a rise in reserves adds to the size of the monetary base. In order to prevent the monetary base from expanding too quickly and fuelling inflation, central banks in this situation would commonly conduct open market operations to drain liquidity by issuing central bank bills. The People’s Bank of China has actively issued all year, and with apparent success as M2 remained within the 15% YOY growth range the PBOC has targeted. The rate of M2 expansion has ticked up slightly in the past few months, but the target remains around 15%. It is extreme ly difficult to get a handle on the sources for these large capital inflows. What can be observed is that the trade surplus, the current account surplus, and the volume of foreign direct investment - eg, the types of transactions typically allowed under current capital account regulation – are not sufficient to explain this pace of accumulation. Some amount of speculative activity is being undertaken, although the size of the speculation and its sources remains rather unclear. The authorities continue to work on gathering data in order to better understand the sources of these extraordinary inflows. There is optimism about the continued improvement in the strength of the banking sector Although general concerns about the level of non-performing loans remain in place, most observers believe that the process of writing off bad loans and recapitalising the banks is proceeding well and that the growth of new bad loans is unlikely to be significant. Banks are active in preparing themselves for the opening of the sector to foreign competition next year, and a change in culture toward increased capital efficiency and improved risk management is taking hold. Some have argued that up to 80% of the stock of existing non-performing loans are still the legacy

Economics@
ANZ Economic Monthly 4
of the restructuring of the state -owned enterprises, but that once the process of write offs and recapitalisation is completed the banking system would be able to handle the remaining 20% stock of NPLs. Explicit government debt remains quite low at less than 30% of GDP There are significant contingent liabilities, principally related to: NPLs in the banking sector; unfunded pension liabilities; and the weak fiscal position of some provincial and local governments. However, estimates are that even including these contingent liabilities, government debt remains manageable at under 70% of GDP. The view is that the economy’s high growth rate combined with the government’s ability to maintain a high tax/GDP ratio means that it will not be difficult to reduce this debt burden over the medium term. In terms of unfunded pension liabilities, the government is actively setting aside part of the proceeds from asset sales as these progress to reduce this liability over time. Implications The above points made during discussions in China have some important implications for our outlook for China and the global economy.
• Our expectation that global growth is on a decelerating trend led by the US may be proven wrong. As trade data for major Asian economies is published very quickly after the relevant month, it can act as a sort of leading indicator for OECD demand. Data for October looks good and seems to suggest possible acceleration from the third quarter along with a rotation from consumer goods to capital goods demand. If data remain strong, speculation in the financial markets would increase that the US Federal Reserve will keep raising interest rates to the higher end of the 4.25% - 5% consensus forecast range. This could lead to further US dollar strength.
• If it is the case that China’s rate of growth will remain strong – whether the 9% official figure or the informal estimates of around 12% - there is little doubt that demand for commodity imports would likely remain strong. Trends in the steel sector, which many expect would lead a slowdown in heavy industry if one were to occur, show a resurgence of demand at this stage.
• The stickiness of inflation means that China will be able to maintain its ultra -competitive export pricing for some time to come, putting downward pressure on consumer goods prices around the world.
As has been the case over the past few years, this could help to offset some of the increased price pressures coming through from high commodity prices. It also implies that structural pressures on the low-end manufacturing sector in OECD countries and the migration of these industries into Asia will continue unabated.
In addition, there are some important medium term risks to keep in mind. The first risk is related to the liberalisation of the exchange rate regime and the capital account. Although the capital account is technically regulated, it is hard to escape the conclusion that there is significant leakage. This is limiting the authorities’ ability to shield domestic monetary policy from the external market as the liberalisation of the foreign exchange regime continues. Economic literature argues and experience in many developing countries shows that over the long term it is very difficult for a government to simultaneously maintain a managed or pegged exchange rate, an open capital account and control over monetary policy. The reason is that if a government’s monetary policy is perceived to be inconsistent with the path of inflation, market expectations will be that either monetary policy will shift or the rate of foreign exchange will change.1 Given the opportunity, market participants will position themselves for that change to occur. In the current environment in China, this situation implies:
• That the government is potentially facing a situation in which it has a very heavily managed exchange rate and a semi-open capital account;
• That it will become more difficult to maintain control over monetary policy, since monetary policy will have to be used to moderate capital flows in order to maintain a certain level of the exchange rate; and
• That monetary policy could, at some point in the future, become inappropriate for the needs of the domestic economy; or
• There could be a disorderly realignment of the exchange rate, interest rates and inflation expectations.
It is not our expectation that a sudden realignment will occur. The history of the government’s policy responses on macroeconomic issues suggests that if this situation unfolded, it seems more likely that the authorities would seek to re -regulate or fully
1 Munro, A and Spencer, G, “The exchange rate: a major source of uncertainty for monetary policy,” Reserve Bank of New Zealand, 2004

Economics@ Economics@
ANZ Economic Monthly 5
close the capital account rather than allow monetary policy or the exchange rate to adjust suddenly. Thus, our view is that the risk that would come out of this scenario is one of increased capital controls rather than significant exchange rate or interest rate movements. A second, more remote risk relates to the opening up of the financial sector and the potential of rapid capital outflows in the event of a loss of confidence in the banking system. It may seem strange to mention the possibility of significant capital outflows during this period when the central bank is accumulating reserves at an historically unprecedented pace. Nonetheless, the monetary base is very large. Should deposit holders shift even 10% of their collective CNY savings offshore – if only to chase higher yields outside China – foreign exchange reserves would be nearly halved. However, it is important to repeat that the above are risk scenarios, and not our baseline scenario. Furthermore, the authorities are well aware of the potential pitfalls of the liberalisation process and continue to work diligently to manage these risks. Following this trip, our outlook in general is for continued strong growth in China – possibly above what we had previously forecast – with low inflation and continual but gradual liberalisation of the foreign exchange regime. Amy Auster Head of International Economics Email: [email protected] Ph: +61 3 9273 5417 Fax: +61 3 9273 5711 The next issue of ANZ Economic Monthly will be published in January 2006.

Financial Markets Update
Economics@ November/December 2005
ANZ Economic Monthly 6
Exchange rates, US$ per local currency unit, indexed
90
100
110
120
130
140
Jan-03 Jun-03 Dec-03 May-04 Nov-04 Apr-05 Oct-05
01 Jan 2003 = 100
Korea
Australia
TaiwanJapan
India
NZ
Source: Datastream
Exchange rates • The Australian dollar has been able to maintain
a relatively stable level in 2005 thus far due primarily to strong demand for commodities. However, more recently the dollar has begun to have its position eroded by the increasingly narrow US-AUD policy rate differential.
• The Yen continues to depreciate as US interest rates rise.
• A rise in interest rates in most East Asian economies have helped to support their currencies against the US dollar.
• The Indian Rupee has come under pressure as faster economic growth has lifted imports and demand for US dollars.
Policy rates
0
2
4
6
8
10
12
14
16
18
20
Jan-02 Jun-02 Dec-02 May-03 Nov-03 Apr-04 Oct-04 Mar-05 Sep-05
Philippines
Indonesia
NZ
Singapore
Australia
%
US
Source: Bloomberg
Policy rates • In line with its move to normalise monetary
policy, the US Fed is expected to continue to raise rates with 2 quarter-point hikes expected in December and January, bringing the Fed funds rate to 4.5%.
• Australia’s RBA moved to a soft tightening bias in its November Monetary Policy Statement but partial indicators suggest that a rate rise is not imminent. New Zealand is expected to raise its OCR rate to 7.25% in December as inflation pressures persist.
• Stronger-than-expected inflation in Indonesia in October and November (17.9% YOY and 18.4% YOY) is likely to prompt further rate hikes.
• Energy prices have softened, but are expected to remain high. Further pass-through and therefore rate rises are likely.
Government Bond Index
2
3
4
5
6
7
8
9
10
Jan-02 Jun-02 Nov-02 Apr-03 Sep-03 Mar-04 Aug-04 Jan-05 Jun-05 Nov-050
2
4
6
8
10
12
14
16
18
China (lhs)Hong Kong (lhs)
Indonesia (rhs)
Yield (on traded index)
Thailand (lhs)
Korea (lhs)
Australia (lhs)
Source: JP Morgan
Bond markets • The chart at left shows the yield on traded
government bonds included in JP Morgan’s Government Bond Index (GBI) of local currency bonds.
• Government bond yields have broadly been rising in line with expectations of higher inflation.
• The Australian yield curve remains unusually flat with long end yields being held down by the failure of the US markets to sell off
• Indonesia and Thailand have seen yields come off a bit but still remain at high levels.

Economics@
ANZ Economic Monthly 7
International reserves
0
100
200
300
400
500
600
700
800
900
2002 2003 2004 2005
China
US$ bn
Korea
Japan
Source: Datastream
0
50
100
150
200
250
300
2002 2003 2004 2005
Singapore
Hong Kong
US$ bn
Korea
Taiwan
Australia
Thailand
International reserves • Chinese foreign exchange reserves continue to
accumulate rapidly, increasing 49.5%YOY to September 2005. China’s State Administration of Foreign Exchange released it’s first report on International Balance of payments in late November. The report identified the usual suspects of trade surpluses and investment for the increasingly large balance of payment surplus and subsequent rapid accumulation of reserves. In addition, current transfers, such as remittances, from overseas contributed around US$67 bn in the first half of 2005.
• Korea’s strong trade performance throughout late 2004 and 2005 has driven a significant increase in reserves. Conversely, growth in Taiwan’s reserves has slowed recently due to strong increases in imports outstripping exports.
Share price indices
50
100
150
200
250
300
Jan-03 Apr-03 Aug-03 Dec-03 Apr-04 Aug-04 Dec-04 Apr-05 Jul-05 Nov-05
01 Jan 2003 = 100
Indonesia
India
Japan
China
Singapore
Philippines
Source: Datastream
Equity markets • Domestic factors have helped to lift sentiment in
some Asian stockmarkets. • The Philippine government’s go-ahead with fiscal
reform has supported a rally in the stockmarket, which climbed by 7% in the month.
• The Jakarta stock exchange has recovered some ground following the October Bali bombing and uncertainty as energy price hikes were implemented.
• Improving business conditions and continued growth in domestic demand have underpinned the steady rise in the Nikkei stock index.
• India’s rally through the month largely reflects growing optimism over economic prospects. The central bank has raised its GDP growth forecast to 7.5% for year-ended 31 March 2006 from 7% previously.
Trade Finance Credit Spread
0
50
100
150
200
250
300
350
400
450
500
Jan-03 Jul-03 Jan-04 Jul-04 Jan-05 Jul-05
Latin America
Europe & Middle East
Asia
Source: LTP Trade Finance Index, LTP Risk Management
bps over Libor
Trade finance • The chart at left shows that the trade finance
spread for Asia has been fairly steady over the past few years and at a reduced level compared with Latin America and Europe-Middle East.
• The low foreign currency risk spread largely reflects Asia’s stronger macroeconomic position following the crisis of the late 1990s.
• Growing intra-Asian trade, with China being among the top exports markets for the rest of Asia, coupled with US demand have also underpinned exports and kept risk spreads low.
• The decline in the risk premium for trade finance reflects reduced risk perceptions across developing countries, which has reduced the global cost of capital.

Economics@
ANZ Economic Monthly 8
FX and policy interest rate forecasts Oct-05 Nov-05 Dec-05 Mar-06 Jun-06 Sep-06 Dec-06 China USD/CNY, eop 8.08 8.05 8.03 7.97 7.91 7.84 7.78 AUD/CNY, eop 6.08 5.91 5.70 5.54 5.38 5.41 5.45 Short term rates* 5.6 5.6 5.6 5.6 5.6 5.7 5.8
Hong Kong USD/HKD, eop 7.75 7.75 7.75 7.77 7.79 7.78 7.78 AUD/HKD, eop 5.83 5.69 5.50 5.40 5.29 5.37 5.45 Short term rates** 5.25 5.5 5.75 6 6 6 5.75 India USD/INR, eop 45.14 45.59 45.50 46.00 43.00 42.50 42.00 AUD/INR, eop 33.92 33.49 32.31 31.97 29.24 29.33 29.40 Short term rates 5.25 5.25 5.25 5.5 5.5 5.5 5.5 Indonesia USD/IDR, eop 10,115 10,018 10,000 9,875 9,750 9,625 9,500 AUD/IDR, eop 7,601 7,358 7,100 6,863 6,630 6,641 6,650 Short term rates*** 11 12.25 12.75 12.0 11.5 10.75 9.5 Korea USD/KRW, eop 1041 1046 1055 1025 1040 1050 1030 AUD/KRW, eop 783 768 749 712 707 725 721 Short term rates**** 3.5 3.5 3.5 3.75 3.75 3.75 3.5 Malaysia USD/MYR, eop 3.78 3.77 3.75 3.72 3.71 3.69 3.68 AUD/MYR, eop 2.84 2.77 2.66 2.58 2.52 2.55 2.58
Short term rates**** 2.7 3.0 3.0 3.0 3.0 2.7 2.5 Philippines USD/PHP, eop 54.88 54.85 54.80 56.00 55.50 55.00 54.50 AUD/PHP, eop 41.24 40.29 38.91 38.92 37.74 37.95 38.15 Short term rates**** 7.5 7.5 7.5 7.75 7.5 7.25 7 Singapore USD/SGD, eop 1.69 1.70 1.70 1.73 1.70 1.68 1.67 AUD/SGD, eop 1.27 1.25 1.21 1.20 1.16 1.16 1.17 Short term rates+ 2.2 3 3.2 3.3 3.3 3.0 2.5 Taiwan USD/TWD, eop 33.6 33.8 33.8 34.0 34.3 34.5 33.0 AUD/TWD, eop 25.2 24.8 24.0 23.7 23.3 23.8 23.1 Short term rates+++ 2.2 2.2 2.3 2.4 2.4 2.3 2.2 Thailand USD/THB, eop 40.76 41.07 42.00 43.00 42.50 42.00 41.50 AUD/THB, eop 30.63 30.16 29.82 29.89 28.90 28.98 29.05 Short term rates++ 3.75 3.75 4 4 3.75 3.75 3.5 Vietnam USD/VND, eop 15,901 16,058 16,100 16,175 16,250 16,325 16,400 AUD/VND, eop 11,950 11,794 11,431 11,242 11,050 11,264 11,480 Japan USD/JPY, eop 115.9 118.5 121.0 123.0 119.0 115.0 111.0 AUD/JPY, eop 87.1 87.0 85.9 85.5 80.9 79.4 77.7 Short term rates 0.00 0.00 0.00 0.00 0.00 0.00 0.25 Australia AUD/USD, eop 0.75 0.73 0.71 0.70 0.68 0.69 0.70 Short term rates^ 5.50 5.50 5.50 5.50 5.50 5.50 5.75 New Zealand NZD/USD, eop 0.70 0.69 0.66 0.62 0.57 0.58 0.60 AUD/NZD, eop 1.07 1.06 1.08 1.12 1.19 1.19 1.17 Short term rates^ 6.75 7.00 7.25 7.25 7.25 7.00 6.50 *:One-year base lending rate; **: HKMA discount rate; ***: One-month lending rate; ****: Overnight rate
+: 3-month rate; ^: cash rate; ++: 14-day repurchase rate; +++: discount rate

Economics@
ANZ Economic Monthly 9
Real GDP Growth (%) 2004 2005f 2006f 2007f Australia 3.3 2.5 3.4 3.6
Cambodia 7.7 6.9 6.4 6.4
China 9.5 9.3 8.0 7.6 Hong Kong 8.2 7.2 4.1 3.3
India+ 6.9 7.5 7.4 7.0
Indonesia 5.1 5.5 4.6 6.3 Japan 2.6 2.3 1.7 1.8
Korea 4.6 3.7 4.1 3.0
Malaysia 7.1 5.2 4.3 3.8 New Zealand 4.4 2.7 1.7 2.8
Philippines 6.1 4.6 4.1 3.7
Singapore 8.4 5.3 4.7 5.0 Taiwan 5.7 3.6 3.5 3.4
Thailand 6.1 3.6 3.8 4.1
Vietnam 7.7 8.2 7.8 7.5
Nominal GDP (US$ bn) 2004 2005f 2006f 2007f Australia 616.4 686.6 674.4 736.0
Cambodia 4.9 5.2 5.4 5.6
China 1653.0 1,853.6 2,114.4 2,358.8
Hong Kong 165.7 171.8 179.1 187.0
India+ 670 750 840 930
Indonesia 257.6 281.0 325.0 350.0
Japan 4674.7 4,692.0 4,546.0 4,861.0
Korea 681.5 814.0 852.6 880.7
Malaysia 118.3 125.7 135.6 145.4
New Zealand 96.8 107.7 95.4 99.2
Philippines 86.1 97.2 104.3 113.2
Singapore 108.8 111.0 117.0 125.0
Taiwan 305.4 336.0 357.0 385.0
Thailand 163.4 178.0 197.0 216.0
Vietnam 45.3 53.1 61.3 69.6
Inflation (%) 2004 2005f 2006f 2007f Australia 2.3 2.7 2.7 2.3
Cambodia 3.8 5.6 5.0 4.3
China 3.9 1.9 2.6 3.9
Hong Kong 0.0 0.8 1.8 1.0
India 3.8 4.0 4.5 3.5
Indonesia 6.1 10.3 10.4 5.5
Japan 0.0 0.0 0.1 0.6
Korea 3.6 2.9 4.4 4.0
Malaysia 1.4 2.9 3.5 2.0
New Zealand 2.7 3.6 2.5 1.7
Philippines 5.9 7.8 7.1 6.5
Singapore 1.7 0.2 0.6 0.5
Taiwan 1.6 2.6 3.0 2.0
Thailand 2.8 4.6 4.8 3.0
Vietnam 7.8 8.4 7.0 6.6
Fiscal Balance (% of GDP)* 2004 2005f 2006f 2007f Australia 0.8 0.8 0.8 0.8
Cambodia -5.4 -5.6 -5.8 -6.0
China -2.3 -2.0 -1.8 -1.9 Hong Kong 1.7 0.7 -0.4 -1.4
India+ -4.5 -4.3 -4.0 -3.7
Indonesia -1.6 -1.2 -1.0 -0.2 Japan -7.1 -6.9 -6.5 -6.0
Korea -0.9 -1.5 -1.8 -1.5
Malaysia -4.3 -3.3 -3.0 -2.3 New Zealand 5.3 3.9 4.3 2.9
Philippines -3.9 -2.9 -1.6 -1.0
Singapore -0.2 0.1 0.1 0.1 Taiwan -3.1 -3.3 -4.0 -3.7
Thailand 0.1 -1.2 -1.7 -1.4
Vietnam -1.7 -2.1 -2.3 -2.9
Current Account (% of GDP) 2004 2005f 2006f 2007f Australia -6.4 -6.2 -6.2 -6.4
Cambodia -10.1 -10.9 -10.6 -10.3
China 16.6 18.2 10.0 4.8 Hong Kong 8.7 9.3 5.6 2.1
India -0.1 -2.1 -2.6 -2.4
Indonesia 1.1 1.6 1.0 0.7 Japan 3.7 3.3 3.0 2.5
Korea 4.0 1.8 1.0 0.2
Malaysia 12.5 11 7.7 6.3 New Zealand -7.0 -8.8 -9.3 -8.0
Philippines 4.0 3.6 3.0 2.6
Singapore 26.1 24.5 22.0 20.0 Taiwan 6.9 4.9 4.4 4.0
Thailand 4.3 -2.8 -2.0 -1.5
Vietnam -2.1 -2.7 -3.6 -4.0
Foreign Exchange Reserves (US$ bn) 2004 2005f 2006f 2007f Australia 35.8 n.a. n.a. n.a.
Cambodia 0.95 0.94 0.94 0.93
China 609 810 900 780 Hong Kong 123.6 120 118 105
India 126.5 140 147 155
Indonesia 34.9 28 32 35 Japan 833.9 828 815 800
Korea 199.8 215.5 236.7 230
Malaysia 66.6 81 83 85 New Zealand 5.3 n.a. n.a. n.a.
Philippines 13.1 16.5 17.5 18.5
Singapore 112.2 117 122 125 Taiwan 241.7 260 265 270
Thailand 48.7 49 51 52
Vietnam 7.0 8.9 10.7 12.8 +: Fiscal year beginning April; *:Fiscal balance for Australia, New Zealand, Malaysia and Singapore corresponds to fiscal year

Economics@
ANZ Economic Monthly 10
Long Term Foreign Currency Debt Ratings
Investment Grade Sub-Investment Grade
Moody’s S&P Moody’s S&P
Aaa AAA Ba1 BB+ Australia Australia Bulgaria Egypt Canada Canada Costa Rica El Salvador France France Egypt India
Germany Germany Morocco Morocco Japan Singapore Panama
New Zealand United Kingdom Romania Singapore United States Ba2 BB
United Kingdom Colombia Colombia United States Fiji Costa Rica
Guatemala Jordon Aa1 AA+ Jordan Panama
Belgium Belgium Peru New Zealand Ba3 BB-
Aa2 AA Peru Brazil Italy Vietnam Cook Islands Aa3 AA- Brazil Guatemala
Cayman Islands Hong Kong Philippines Taiwan Italy Serbia
Japan Turkey Taiwan Ukraine
A1 A+ Vietnam Czech Republic Qatar B1 B+
Hong Kong Kuwait Papua New Guinea Ghana Hungary Philippines Indonesia Macau Suriname Pakistan Qatar Turkey Venezuela UAE Ukraine A2 A
China Chile B2 B Cyprus Cyprus Honduras Papua New Guinea Israel Korea Indonesia Uruguay Kuwait Saudi Arabia Pakistan Poland Venezuela
A3 A- B3 B- Korea China Argentina Argentina
Malaysia Czech Republic Bolivia Bolivia Saudi Arabia Hungary Lebanon Lebanon
Israel Uruguay Paraguay Malaysia Suriname
Baa1 BBB+ Caa1 and below CCC and below Chile Oman Cuba Belize
Mexico Poland Ecuador Ecuador South Africa Thailand Nicaragua Thailand South Africa Paraguay
Oman Belize Baa2 BBB
Mauritius Mexico Tunisia Tunisia Russia Bulgaria
Baa3 BBB-
El Salvador Russia India Romania

Country Update Australia November/December 2005 Economics@
ANZ Economic Monthly 11
Inflation pushes RBA comfort zone
1
2
3
4
5
6
7
99 00 01 02 03 04 05
% change from year earlier
Weighted Median
Trimmed Mean
Headline
Target Band
Source: Australian Bureau of Statistics
Housing construction approvals soften
4
6
8
10
12
14
16
18
91 93 95 96 98 00 01 03 058,000
9,000
10,000
11,000
12,000
13,000
14,000
15,000
16,000
17,000
18,000% Units
Sources: ABS and Reserve Bank
Construction Approvals
Housing Lending Rate
• Inflationary pressures are building. Headline CPI inflation accelerated to 3% over the year to September, right at the top of the RBA target band of 2% to 3%, and continuing the steady upward trend from the cyclic low of 2% over the year to March 2002. The various core measures remained more muted at around 2½%, but even these have shown a (more gentle) rise over the past year.
• The labour market softened a touch in September and October, with consecutive monthly falls in employment and a rise in the unemployment rate from 5% to 5.2%. Nevertheless, labour market conditions remain very tight. Wages growth remains high, although the quarterly growth rate is not accelerating, with the wage price index rising by 1.0% in the September quarter, slightly below the 1.1% increase in the two previous quarters. The annual rate accelerated to 4.2%, compared to 3.5% a year earlier.
• Dwelling construction approvals have turned down again in recent months, and it now looks as if the upturn in home building will be delayed until 2006. Having said that, we still expect a soft landing for the industry, with construction buoyed by a large backlog of work, strong ongoing demographics, and falling rental vacancies.
• The RBA has adopted a soft tightening bias. It has warned
there are upside risks to inflation, and has noted its comfort zone could be breached if there were a further rise in fuel prices, any pass through of higher input costs to final prices, or any further acceleration in wages. To this danger list we would add a depreciation of the $A, given that the RBA forecasts on the assumption of currency stability.
• We view the RBA warning as an attempt to influence price
and wage decision makers, rather than as a sign that a tightening is imminent. We maintain our long held view that the next move in rates is up, but not until the second half of 2006.
Tony Pearson
Economic data – Australia Monthly data Mar 05 Apr 05 May 05 Jun 05 Jul 05 Aug 05 Sep 05 Oct 05 Building Approvals, 000’s 12.6 13.1 14.3 13.9 12.9 11.7 12.0 N/A Retail Sales, % YOY 3.2 2.1 3.1 3.1 2.9 3.4 2.4 3.2 Exports, % YOY 14.0 16.7 16.4 9.3 16.4 12.5 9.9 N/A Imports, % YOY 15.4 10.4 10.1 5.2 6.7 7.3 5.4 N/A Trade Balance, AUD bn -2.61 -1.26 -1.23 -1.33 -1.34 -1.46 -1.61 N/A Foreign Exchange Reserves, US$ bn 34.7 36.4 40.5 42.3 42.9 43.4 40.4 35.9 Quarterly data Dec 03 Mar 04 Jun 04 Sep 04 Dec 04 Mar 05 Jun 05 Sep 05Real GDP, % YOY 4.4 4.0 4.4 3.0 1.8 1.9 2.6 N/A - Private consumption 5.5 6.4 5.9 5.6 4.0 3.2 3.0 N/A - Government consumption 3.4 4.1 3.3 3.1 3.0 2.1 3.6 N/A - Gross fixed capital expenditure 6.5 6.8 8.5 7.5 13.4 12.2 15.9 N/A Consumer Price Index, % YOY 2.4 2.0 2.5 2.3 2.6 2.4 2.5 3.0 Current Account, AUD bn -12.2 -10.5 -11.9 -15.6 -16.0 -13.1 -12.5 N/A Capital Account, AUD bn 12.0 11.4 11.3 15.5 15.9 13.6 11.8 N/A Sources: Bloomberg, RBA, ANZ Bank

Country Update Cambodia November/December 2005 Economics@
ANZ Economic Monthly 12
Trade balance deteriorates in H1 2005
-300
-200
-100
0
100
200
300
400
Mar-02 Sep-02 Mar-03 Sep-03 Mar-04 Sep-04 Mar-05
Imports
Exports
March-02 to June 05
Trade Balance
$US mn
International Trade
Source: IMF Direction of Trade Statistics,
Exports growth to US to help close the
gap
0
50
100
150
200
250
300
350
02 03 04 05
Imports from
Exports to
March-02 to June 05
$US mn
Asia Trade
0
50
100
150
200
250
02 03 04 05
$US mn
Exports to
Imports from
March-02 to Sept 05
US Trade
Source: IMF Direction of Trade Statistics, U.S. Census Bureau FTD
• Cambodia’s external trade to June 2005 has seen imports increase by 17.0%YOY and exports by 6.0%YOY. In recent months import growth has been driven by higher cement and steel orders needed to support the rapidly expanding construction sector. The value of construction approvals has reached record highs in the first half of 2005 with around $US130 mn worth of construction being approved in May-July 2005 alone, up from around $US51 mn over the same period in 2004. In addition, imports of diesel rose sharply in July by 54.5%YOY, despite recent prices rises. Gasoline imports increased by only 2.2%YOY over the same period, however this may not be a complete indication of the amount of gasoline coming into the country with cross-border smuggling rife. This increase in imports (and a slowing of exports) in H1 2005 has driven a further deterioration of the trade balance over the period. Cambodia sources the vast majority of its imported goods from the Asian region.
• After peaking in late 2004, prior to the expiry of the Multi-fibre agreement, the value of Cambodian exports (primarily garments) has been decreasing throughout the first half of 2005. However, June figures from the IMF-DOTS show some recovery, especially in key markets of the US and EU, confirmed by Cambodia’s Customs and Excise Dept who also indicate export growth in July. Data releases to September from the US Census indicate Cambodian exports have surged in recent months increasing $US91 mn since the trough in May. Cambodia continues to benefit from the restrictions imposed by the US on Chinese clothing and textiles trade. However, recently the US has agreed to allow higher imports of textiles and garments from China, increasing by 8% to 10% in 2006, by 13% in 2007 and by 17% in 2008 (originally the US proposal has attempted to keep growth at 7.5%). This may have an adverse impact on the Cambodian garment industry which not only the largest earner of foreign exchange but the single employer with around 230,000 employees and 200 factories.
Alex Joiner
Economic data – Cambodia Monthly data Mar 05 Apr 05 May 05 Jun 05 Jul 05 Aug 05 Sep 05 Oct 05 Consumer Price Index, % YOY 5.4 5.9 6.3 7.0 4.1 4.5 5.0 N/A
-Transport & Communication 11.6 12.2 10.5 10.6 11.9 11.0 12.9 N/A -Food & Beverages 7.3 8.4 9.6 11.2 5.2 6.0 6.7 N/A
Exports, % YOY 18.4 17.9 11.2 6.0 n/a n/a n/a N/A Imports, % YOY 16.0 6.6 17.2 17.0 n/a n/a n/a N/A Trade Balance, US$ mn -140.1 -142.7 -191.3 -133.4 n/a n/a n/a N/A Foreign Exchange Reserves, US$ mn 959.8 948.4 957.2 943.1 936.7 940.3 n/a N/A Tourist Arrivals, % YOY 68.4 68.5 42.5 41.9 44.4 42.3 37.8 N/A GDP Composition 2004 Trading Partners Exports Imports Real GDP, % YOY 7.7 2004 % share US 55.9 Vietnam 10.9 - Agriculture, % YOY -2.0 Germany 11.7 Thailand 22.5 - Industry, % YOY 16.1 UK 6.9 Singapore 10.8 - Services, % YOY 9.2 Vietnam 4.4 China 13.6 Nominal GDP, US$ bn 4.89 Japan 3.5 Hong Kong 14.1
Sources: Datastream, National Institute of Statistics of Cambodia

Country Update China November/December 2005 Economics@
ANZ Economic Monthly 13
Fixed asset investment and IP growth are trending down
Industrial productionFixed asset investment
0
20
40
60
Jan-03 Feb-04 Mar-05 Apr-05
% YOY
Light industry
Total
Heavy
Sources: Datastream
0
10
20
30
40
50
60
70
80
90
Feb-04 Oct-04 Jun-05
% YOY change
Total
Manufacturing
Mining
Real estate
Authorities trying to boost prices and rates
Inflation and M2
Sources: Datastream, Economics@ANZ.
-6
0
6
12
18
24
Oct-02 Sep-03 Aug-04 Jul-05
% YOY
CPI
Ex-factory manufacturing
M2
0.0
1.0
2.0
3.0
4.0
5.0
6.0
Jan-01 Jul-02 Jan-04 Jul-05
% pa
Interest rates
Interbank 3 month rate (policy rate)
Repo rate
Deposit rate
• Monthly data continue to show a slight decelerating trend as the authorities seek a much-desired soft landing. Fixed asset investment rose 27.6% YOY growth in October from 27.7% in September, but this was the first time that FAI has ticked downward since this time last year. Industrial production rose 29% YOY in October, the first time growth has been under 30% since April. Heavy industry in rose 31% YOY in October, versus 33.4% YOY in September.
• Importantly, some rebalancing of growth appears to be coming through following the ongoing yuan revaluation. Exports rose 29% YOY in October, a similar level to the growth seen for much of this year. Import growth, however, continues to accelerate, rising 23.4% YOY in October after averaging around 17% YOY in the first half with notable surges in telecoms and data processing equipment. There is also evidence of stronger domestic demand in retail data. Consumer goods sales remained steady at 13.6% YOY growth in urban areas, but surged to 17% YOY growth in rural areas.
• Prices remain subdued, with annual inflation rising 1.2% in October from 0.9% in September despite a marked increase in monetary base growth. Declines in grain and food prices are largely responsible for low CPI. Durables prices are on the upswing – a surprise considering that growth in ex-factory prices for manufacturing is slowing. The central bank continues its sterilisation program but is being forced to pay higher rates than has been the case in the past.
• President Bush’s much-anticipated trip to Asia failed to generate any significant policy moves or announcements. The US Treasury will issue its biannual report on the currency markets soon, but appears unlikely to accuse China of manipulating its currency for trade advantage. A slow revaluation remains our baseline projection.
Amy Auster
Economic data -China Monthly data Mar 05 Apr 05 May 05 Jun 05 Jul 05 Aug 05 Sep 05 Oct 05 Industrial Production, %YOY 25.8 29.2 32.3 34.4 31.8 31.3 30.4 29.4 Retail Sales, % YOY 13.9 12.2 12.8 12.9 12.7 12.5 12.7 12.8 Consumer Price Index, % YOY 2.7 1.8 1.8 1.6 1.8 1.3 0.9 1.2 Exports, % YOY 32.8 31.9 30.3 30.6 28.8 33.2 25.8 29.6
Imports, % YOY 18.6 16.2 15.0 15.1 12.4 23.5 23.3 23.4 Trade Balance, US$ bn 5.7 4.6 9.0 9.7 10.6 10.6 7.6 12.0 Foreign Exchange Reserves, US$ bn 659.1 670.8 691.0 711.0 732.7 753.2 769.0 N/A Quarterly data Dec 03 Mar 04 Jun 04 Sep 04 Dec 04 Mar 05 Jun 05 Sep 05Real GDP, % YOY 9.9 9.8 9.6 9.1 9.5 9.4 9.5 9.4 - Primary sector 2.5 4.5 4.9 5.5 6.3 4.6 5.0 5.0 - Secondary sector 12.7 11.6 11.5 11.1 11.1 11.1 11.2 11.1 - Tertiary sector 7.8 8.0 8.1 8.1 8.3 7.7 7.8 8.1 Nominal GDP, US$ bn 371.0 385.2 401.6 420.0 446.1 436.0 453.8 481.5 Current Account, US$ bn 50.9 46.1 51.6 76.1 100.8 128.6 103.8 91.9 FDI, US$ bn 13.3 12.2 19.1 14.8 15.3 13.4 15.2 14.7
Sources: Datastream, Bloomberg

November/December 2005 Economics@
Country Update: Hong Kong
ANZ Economic Monthly 14
Retail sales, tourism and trade supporting growth
-80
-60
-40
-20
0
20
40
60
Jan-01 Jul-02 Jan-04 Jul-05
HK arrivals & retail sales
Retail sales
Visitor arrivals
% YOY 3mma
Sources: Datastream, Economics@ANZ.
-150
-50
50
150
250
350
450
550
Jun-01 Dec-02 Jun-04
% YOY, 6mma
Buildings commenced
Inflation ticking upward as unemployment
falls
0
1
2
3
4
5
6
Aug-02 Jul-03 Jun-04 May-05
% pa
PBOC
Taiwan
HKMA
US Fed
Local rates keep pace with Fed
Sources: Datastream, Bloomberg Economics@ANZ.
-6
-4
-2
0
2
4
6
8
10
Jan-01 May-02 Sep-03 Jan-05
HK CPI and unemployment
Unemployment
CPI
• The local economy continues to benefit from strong retail trade and a rebounding real estate market. The opening of Disneyland in September does not appear to have given the immediate boost to sales that might have been anticipated – despite attracting 1 million visitors in its first 100 days – but annual growth of 6% for both retail sales and visitor arrivals is still strong. Data on buildings commenced is highly volatile, but as measured by square meters the amount of construction commenced in October reached its second highest monthly total of the year, after April.
• The services sector will continue to expand into the mainland with a widening of the Closer Economic Partnership Agreement that seeks to reduce barriers across a number of sectors including banking, tourism and construction.
• The CPI accelerated to 1.8% in October from 1.6% in October as housing and utilities prices continued to climb. Housing costs comprise nearly 30% of the CPI, but rising inflation rates have not yet slowed the real estate market as employment and wage growth are high. The pass through from energy costs and slightly higher import goods cost due to China’s revaluation could bring about further price pressures. HKMA will continue to raise its policy rate in line with the US Federal Reserve.
• Significant attention is being paid to emergency preparedness measures in the event of an human flu pandemic arising from the current outbreak of the H5N1 virus. Hong Kong was one of the economies to suffer most in the region during the SARS outbreak, and has said that it will destroy its entire poultry stock if there is more than one location in which H5N1 is found in the country. It has also limited poultry imports from certain regions in China where outbreaks have been more frequent. Nonetheless, a human pandemic represents a significant threat to Hong Kong given its reliance on tourism and services.
Amy Auster
Economic data – Hong Kong Monthly data Mar 05 Apr 05 May 05 Jun 05 Jul 05 Aug 05 Sep 05 Oct 05 Visitor Arrivals, %YOY 5.7 11.9 7.5 5.8 3.8 2.6 #N/A N/A Retail Sales, % YOY 6.2 8.6 7.1 6.1 7.1 6.2 4.9 N/A Consumer Price Index, % YOY 1.2 0.8 0.9 1.4 1.4 1.3 1.5 1.7 Exports, % YOY 3.4 7.8 17.0 12.9 8.4 13.1 17.5 N/A Imports, % YOY 2.4 3.8 16.1 10.8 6.9 13.3 15.7 N/A Trade Balance, US$ bn -1.8 -1.3 -1.2 -0.9 -0.4 -0.5 -0.5 N/A Foreign Exchange Reserves, US$ bn 122.4 122.6 122.4 122.0 121.9 122.3 122.8 121.9 Quarterly data Dec 03 Mar 04 Jun 04 Sep 04 Dec 04 Mar 05 Jun 05 Sep 05 Real GDP, % YOY 4.9 7.1 12.1 6.8 7.1 6 7 8.5 - Private consumption 3.9 5.7 10.8 5.2 5.8 4.4 2.7 4.6 - Government consumption 5.5 5.7 0 -1.3 -1.7 -4.8 -2.3 -1.8 - Gross fixed capital expenditure 2.7 5.1 11.5 2.1 -1.4 0.4 4.5 2.4 Nominal GDP, US$ bn 40.3 41.1 41.5 41.2 42.0 42.8 43.9 N/A Current Account, US$ bn 4.2 2.1 1.0 6.7 6.5 4.3 3.8 N/A Capital Account, US$ bn -0.3 0.0 0.0 -0.2 -0.1 -0.3 #N/A N/A
Source: Datastream

Country Update: India
November/December 2005 Economics@
ANZ Economic Monthly 15
Industrial production continues to grow at healthy pace
-10
-5
0
5
10
15
20
25
2001 2002 2003 2004 2005
IP-capital goods
IP-consumergoods
IP-Total
3mma, %YOY
Source: Datastream
Trade balance to deteriorate as imports soar
-6000
-4000
-2000
0
2000
4000
6000
8000
10000
12000
14000
03 04 05
Source: Datastream
US$ mn
Trade balance
Imports
Exports
• Partial indicators suggest that the economy is still growing at a solid pace. Industrial production for September was up 7.3% YOY with output of consumer goods growing by 13.1% YOY and capital goods rising by 17.6%. Cement sales were also up 8% YOY. Rising affordability has supported strong vehicle sales, which have been growing at a healthy pace.
• The trade deficit continued to widen. It was US$3.2 bn in October compared with US$2.3 bn in October 2004. The government aims to lift exports to US$93 bn in the year to March 2006, up 17% from the previous year. India’s exports rose 28% YOY to US$51 bn in the seven months to October, signalling that this forecast could be conservative. Imports, however, have stayed strong due in part to the high oil import bill. Imports for April-October 2005 were US$74.8 bn, up 38.6% from the same period in 2004. Non-oil imports rose by 21% YOY in the six months to September while oil imports surged by 29% YOY during this period.
• Elections in the state of Bihar saw Nitish Kumar, leader of the Janata Dal United Party become its chief minister. This has ended the 15-year rule of Rail Minister, Lalu Prasad’s Rashtriya Janata Dal party. The latter is aligned with the United Progressive Alliance coalition, led by the Indian National Congress party. This loss is expected to weaken its influence in the ruling coalition.
• Relations between India and Pakistan have improved markedly and this has paved the way for further cooperation in the region. South Asian nations (Bangladesh, Bhutan, India, Maldives, Nepal, Pakistan, Sri Lanka) agreed to cut trade barriers from 1 January 2006 in a summit held in November. The plan is for tariffs to be reduced to between 0-5% by 2016.
Jasmine Robinson
Economic data – India Monthly data Mar 05 Apr 05 May 05 Jun 05 Jul 05 Aug 05 Sep 05 Oct 05 Industrial Production, %YOY 10.7 7.9 10.6 11.8 6.2 8.2 7.3 N/A Passenger car sales, % YOY 13.3 13.5 9.8 2.5 -4.2 14.1 11.1 2.3 Consumer Price Index, % YOY 4.1 5.0 3.7 3.4 4.1 3.4 3.6 N/A Exports, % YOY 16.5 31.0 24.1 25.3 33.3 30.9 17.7 35.9 Imports, % YOY 42.4 54.3 40.2 39.8 33.3 47.8 22.1 37.3 Trade Balance, US$ bn -1.6 -3.9 -3.6 -4.0 -2.7 -3.1 -3.2 -3.3 Foreign Exchange Reserves, US$ bn 136.0 136.0 133.0 132.0 135.0 138.0 137.0 N/A Quarterly data Dec 03 Mar 04 Jun 04 Sep 04 Dec 04 Mar 05 Jun 05 Sep 05 Real GDP, % YOY (at factor cost) 11.0 8.4 7.6 6.7 6.4 7.0 8.1 N/A - Agriculture 6.4 7.9 7.6 9.1 9.2 7.3 10.1 N/A - Industry 18.2 10.4 3.8 0.0 -0.5 1.8 2.0 N/A - Services 10.6 8.6 9.5 8.2 8.8 9.3 9.8 N/A Nominal GDP, US$ bn 151.3 151.4 143.4 140.6 171.9 175.0 166.5 N/A Current Account, US$ bn 0.3 0.4 0.3 -0.5 -0.6 0.0 -0.6 N/A Capital Account, US$ bn 0.4 0.7 0.4 0.4 1.2 1.2 0.7 N/A
Source: Datastream, Bloomberg

November/December 2005 Economics@
Country Update: Indonesia Kong
ANZ Economic Monthly 16
GDP growth slows but stays above 5%
1
2
3
4
5
6
7
01 02 03 04
% change over year
Source : Datastream
Private consumptionReal GDP
Inflation spikes on reduction in fuel subsidies
% YOY
Source: Datastream
0
2
4
6
8
10
12
14
16
18
20
01 02 03 04 05-10
0
10
20
30
40
50
Total CPI (lhs)
Food CPI(rhs)
Transport CPI (rhs)
% YOY
• Indonesia’s economy rose by 5.3% over the year to Q3 2005, the slowest rate of growth since Q3 2004 but a respectable pace of expansion considering the events over the third quarter. Concerns over inflation expectations and sharply higher fuel prices, exacerbating US dollar demand for oil purchases, pushed the rupiah down to levels last seen in 2001. Aggressive interest rate moves since July would have dampened domestic demand but private consumption remained resilient, growing by 4.4% YOY. This could have reflected a rise in spending in anticipation of further price increases.
• A further slowing in economic growth is forecast for the final quarter as accelerating inflation and higher interest rates impact demand. Annual inflation for October came in at a sharply higher rate of 17.9% following the hike in energy costs from 1 October. Transport prices rose a hefty 44.7% YOY. Housing (including utilities) and food prices also jumped to 14.1% and 18% respectively. Annual inflation for November was also higher-than-expected, at 18.4% YOY. Inflation is likely to remain elevated over the next few months but ease towards mid-2006 as the impact of the first-round of energy price hikes wears off.
• Bank Indonesia raised the BI rate once again, this time by a hefty 125 bps rise, bringing the rate to 12.25%. Real interest rates are likely to remain in negative territory in the next few months but improve thereafter as inflation eases.
• The rupiah continues to hold up well, trading at around USD/IDR10,050, signalling a positive response to BI’s pro -active stance against inflation pressures. We expect the rupiah to trade with a gradual upside bias as the central bank continues with monetary tightening. Demand for fuel is also expected to moderate and ease pressures on dollar demand to meet payments for oil imports
Jasmine Robinson
Economic data - Indonesia Monthly data Mar 05 Apr 05 May 05 Jun 05 Jul 05 Aug 05 Sep 05 Oct 05 Industrial Production, %YOY 7.2 3.5 4.7 3.3 -1.5 -1.5 -3.4 N/A Motor cycle sales, % YOY 33.7 30.7 35.0 44.4 37.4 41.7 21.5 28.5 Consumer Price Index, % YOY 8.8 8.1 7.4 7.4 7.8 8.3 9.1 17.89 Exports, % YOY 44.8 28.7 28.5 13.4 17.2 10.0 1.9 N/A
Imports, % YOY 43.5 41.5 44.8 24.7 14.9 31.7 15.3 N/A Trade Balance, US$ bn 2.4 1.8 2.2 2.0 2.2 1.6 2.5 N/A Foreign Exchange Reserves, US$ bn 34.6 34.9 33.2 32.5 30.8 29.7 28.7 N/A Quarterly data Dec 03 Mar 04 Jun 04 Sep 04 Dec 04 Mar 05 Jun 05 Sep 05Real GDP, % YOY 4.8 4.4 4.4 5.1 6.5 6.2 5.9 5.5 - Private consumption 4.9 5.7 5.3 5.0 3.8 3.2 3.6 4.4 - Government consumption 13.3 9.9 5.2 -3.6 -2.8 -6.7 -6.0 15.7 - Gross fixed capital expenditure -0.5 11.8 13.3 19.2 18.5 14.2 14.3 9.2 Nominal GDP, US$ bn 61.9 63.5 62.9 64.1 67.2 68.5 69.7 70.3 Current Account, US$ bn 2.4 -2.2 2.2 2.8 0.3 1.4 -0.5 N/A Capital & Financial Account, US$ bn 0.8 1.6 -0.7 1.0 1.1 -0.6 #N/A N/A
Sources: Bloomberg, Datastream, Bank Indonesia

Country Update: Japan
November/December 2005 Economics@
ANZ Economic Monthly 17
Domestic led recovery continues
-4
-3
-2
-1
0
1
2
3
4
5
Mar-98 Mar-00 Mar-02 Mar-04
% YOY change
CPI
Real GDP
Sources: Datastream, Economics@ANZ.
GDP and inflation
-15
-10
-5
0
5
10
15
20
Mar-98 Mar-00 Mar-02 Mar-04
% YOY change
Private consumption
Exports
Business investment
GDP components
Leading indicators and industrial production performing well
20
30
40
50
60
70
80
90
100
110
120
Jan-98 Jul-00 Jan-03 Jul-05
Leading indicators
Leading economic index
Index level
Shokochukin index
-25
-20
-15
-10
-5
0
5
10
15
20
25
Jan-01 May-02 Sep-03 Jan-05
Industrial production
Machinery orders
Industrial production
% YOY
Sources: Datastream, Economics@ANZ.
• Third quarter GDP rose 0.4% QOQ and 1.7% YOY (annualised), slightly above market expectations of 1.1% annual growth and below our expectations of 2.0%. Underlying data shows that the recovery continues to be driven by domestic demand and business investment, with private final demand rising 3% YOY while public demand was up 1.3%. Although exports performed well in a quarter that featured strong external demand, net exports were essentially flat and contributed little to the headline growth rate.
• Also of note in the quarterly data was a strong uptick in labour productivity of 2.3% YOY even as unit labour costs and wages rose over the quarter. The Shokochukin index of business conditions rose above 50 for the combined and manufacturing sectors for the first time in a year.
• Public remarks in October by BoJ policy makers regarding the return of inflation and the end of quantitative easing led to countering remarks in November by the MoF and politicians warning against a premature policy tightening. Statements by PM Koizumi to the effect that no policy change should take place in the near term sent the yen to a two-year low of USD/JPY119.5.
• We continue to expect that BoJ will end quantitative easing around the start of the 2006/2007 fiscal year in April by stopping the rollover of its bill issuance. The process will likely take 4-6 months, after which nominal interest rates should become positive.
• A return to positive interest rates will put more pressure on the government to reduce its debt stock, forecast to be 151% of GDP by the end of this fiscal year. MoF has pledged to somewhat reduce its bond issuance program for the next fiscal year.
Amy Auster
Economic data - Japan Monthly data Mar 05 Apr 05 May 05 Jun 05 Jul 05 Aug 05 Sep 05 Oct 05 Industrial Production, %YOY 2.2 1.5 -0.9 0.2 -1.1 0.3 1.3 N/A Retail Sales, % YOY 0.3 3.8 2.9 3.0 0.6 1.6 0.2 -0.3 Consumer Price Index, % YOY -0.2 0.0 0.2 -0.5 -0.3 -0.3 -0.3 N/A Exports, % YOY 9.3 8.2 6.5 4.2 2.0 8.8 7.7 2.3 Imports, % YOY 11.0 13.3 24.6 11.8 9.2 20.9 16.3 11.6 Trade Balance, US$ bn 10.6 8.9 2.7 8.0 7.8 1.0 8.6 7.2 Foreign Exchange Reserves, US$ bn 818.6 824.2 823.9 825.0 821.7 829.9 824.9 823.2 Quarterly data Dec 03 Mar 04 Jun 04 Sep 04 Dec 04 Mar 05 Jun 05 Sep 05Real GDP, % YOY 2.2 4.1 3.1 2.4 0.9 1.0 2.3 2.9 - Private consumption 1.0 1.8 2.0 1.8 0.3 0.9 1.6 2.0 - Government consumption 0.9 2.1 3.1 2.5 3.1 2.3 2.0 2.0 - Gross fixed capital formation 3.5 5.0 1.0 1.3 -1.7 -0.4 3.5 4.4 Nominal GDP, US$ bn 4617.1 4737.5 4601.0 4587.1 4773.1 4869.1 4889.7 4856.7 Current Account, US$ bn 158.6 172.9 171.2 170.6 174.1 171.3 164.8 162.5 Capital Account, US$ bn -2.6 -8.5 -1.1 -2.5 -7.0 -4.7 -2.7 -1.4
Source: Datastream

November/December 2005 Economics@
Country Update: Korea
ANZ Economic Monthly 18
Consumer confidence edges up and rates are on hold
0
1
2
3
4
5
6
Jan-01 May-02 Sep-03 Jan-05
Inflation and interest rates
CPI, % YOY
Call money rate (brokered)
%
Sources: Datastream, Economics@ANZ.
0
10
20
30
40
50
60
70
80
90
100
110
120
Jan-01Jul-02Jan-04Jul-05
-6
-4
-2
0
2
4
6
8
10
12
14
Consumer confidence and retail sales
Cons confidence
Retail sales (RHS)
% YOYIndex level
Industrial activity still trending with external demand
-30
-20
-10
0
10
20
30
40
50
Jan-01 Jun-02 Nov-03 Apr-05
Exports and imports
Imports
Exports
% YOY, 3 mma
-4
-2
0
2
4
6
8
10
12
14
Jan-01 May-02 Sep-03 Jan-05
Industrial production
% YOY, 3mma
Sources: Datastream, Economics@ANZ.
• Consumer confidence rose in October to 97.5 from 96.7 in September, possibly helped by continued employment growth. The uptick in confidence was hailed by some local observers as a sign of an improving domestic economy but a reading of below 100 still indicates that pessimists outnumber optimists. Early reports of spending in October appear favourable, with large department stores and at least one automaker reporting rising sales in the past few months.
• The CPI rose 2.4% in November, with the decline from the 2.7% rise in September easing pressure on Bank of Korea to keep tightening monetary policy. The finance ministry reports that household debt problems are vastly improved, but BoK will want to ensure that domestic demand is firmly on track before continuing on its tightening path. Rates were left unchanged in November. Given the clear intention to leave rates unchanged, it was interesting to note the won’s strength as the yen sold off in November.
• The BoK said it expects growth to reach 4% YOY in the fourth quarter and for inflation to remain below 3%. This is close to our projection; a growth rate of around 4% in Q4 implies the full year growth rate will be around 3.7%. We expect inflation to average 2.9% for the year.
• The Finance Ministry and BoK released a growth projection of 5% for 2006, based upon expectations of 4% growth in private demand, increased business investment and still strong external demand. BoK considers 5% to be the economy’s natural growth rate. Our forecast is for growth of 4.1% in 2006 as our outlook for exports is less sanguine.
• The Ministry of Finance announced a raft of potential changes to financial market regulation, including loosening rules to enable local financial institutions to deal in derivatives in commodities and raising the limit on the amount of their own capital that banks can invest in securities.
Amy Auster
Economic data - Korea Monthly data Mar 05 Apr 05 May 05 Jun 05 Jul 05 Aug 05 Sep 05 Oct 05 Industrial Production, %YOY 4.9 3.9 4.2 4.1 6.9 6.4 7.2 N/A Retail Sales, % YOY 6.1 5.5 4.6 3.7 3.5 4.3 3.7 N/A Consumer Price Index, % YOY 3.1 3.1 3.1 2.7 2.5 2.0 2.7 2.5 Exports, % YOY 13.1 6.5 11.0 9.5 10.7 17.9 17.9 13.4
Imports, % YOY 19.0 12.7 18.1 14.6 16.7 20.8 24.4 11.6 Trade Balance, US$ bn 1.2 1.7 2.0 2.5 1.8 1.4 1.9 2.9 Foreign Exchange Reserves, US$ bn 204.6 205.6 205.3 204.2 204.9 206.0 206.0 206.6 Quarterly data Dec 03 Mar 04 Jun 04 Sep 04 Dec 04 Mar 05 Jun 05 Sep 05Real GDP, % YOY 4.2 5.2 5.6 4.9 3.0 2.8 3.4 4.4 - Private consumption -2.3 -1.3 -0.5 -0.7 0.5 1.4 2.8 3.9 - Government consumption 3.8 3.0 4.2 2.9 1.9 3.2 4.1 4.5
- Gross fixed capital expenditure 4.3 2.2 4.3 3.0 -1.2 0.1 2.1 1.8 Nominal GDP, US$ bn 158.8 163.2 166.1 170.4 181.8 191.4 197.6 N/A Current Account, US$ bn 7.3 6.1 7.0 7.1 7.4 6.0 2.8 2.5 Capital Account, US$ bn -0.3 -0.4 -0.5 -0.4 -0.5 -0.5 -0.7 -0.6
Source: Datastream

Country Update: Malaysia
November/December 2005 Economics@
ANZ Economic Monthly 19
Inflation edges up
Annual % change
Inflation
-1.5
-1
-0.5
0
0.5
1
1.5
2
2.5
01 02 03 04 05
%
Real interest rates
Sources: Bloomberg, Datastream
0
0.5
1
1.5
2
2.5
3
3.5
4
01 02 03 04 05
Ringgit edges closer to previous peg
Sources: Datastream
3.71
3.72
3.73
3.74
3.75
3.76
3.77
3.78
3.79
3.8
3.81
1-Jun 13-Jul 24-Aug 5-Oct 16-Nov
MYR
USD/MYR
• Annual inflation over the past two months has eased from a high of 3.7% in August. Inflation was 3.3% over the year to October led by a 6.3% rise in the prices of beverage and tobacco after the government increased tobacco and alcohol taxes for the third year in its latest budget. Transport and communication costs rose 6%, a slightly slower rate than in September (7%). Inflation is likely to stay above 3% over the next few months reflecting the impact of the cut in fuel subsidies as well as the hike in the tobacco and liquor tax.
• Malaysia’s third quarter GDP was a higher-than-expected 5.3% YOY after a revised 4.3% gain in the second quarter. Growth was spurred by a lift in external demand for electronics and electrical products. Concerns over inflation and a strong GDP outcome prompted the central bank to raise rates. The overnight policy rate was lifted from 2.7% to 3%. The rising global interest rate environment may also be another factor behind the rate hike as the interest rate gap has widened.
• The ringgit has been under pressure reflecting capital outflows in search of better returns now that e xpectations of a further upward adjustment of the ringgit following the adoption of a managed float on 21 July have subsided. Negative real interest rates and the expectation of higher US rates have added to the weaker ringgit story. The ringgit has been trading at around USD/MYR3.77 in November.
• The trade sector continues to strengthen with the cumulative trade surplus for January-September at US$19 bn, up 20% from the same period in 2004. Electronics exports and high commodity prices continue to underpin export earnings.
• There is widespread expectation of a cabinet reshuffle before the year is up as PM Abdullah Badawi seeks to solidify his position. Former Federal Territory Minister was dismissed from cabinet following graft charges
Jasmine Robinson
Economic data - Malaysia Monthly data Mar 05 Apr 05 May 05 Jun 05 Jul 05 Aug 05 Sep 05 Oct 05 Industrial Production, %YOY 5.5 4.1 -0.1 3.2 0.2 4.1 4.9 N/A Motor Vehicle sales, % YOY 21.6 6.7 17.3 1.8 -3.0 21.2 14.7 29.1 Consumer Price Index, % YOY 2.6 2.7 3.1 3.2 3.0 3.7 3.4 3.3 Exports, % YOY 16.4 9.9 10.9 11.7 3.0 13.6 8.4 N/A
Imports, % YOY 9.6 4.7 13.8 6.0 7.6 11.3 7.5 N/A Trade Balance, US$ bn 2.7 2.2 1.8 2.0 1.6 2.6 2.2 N/A Foreign Exchange Reserves, US$ bn 72.4 73.7 74.9 75.2 78.7 80.8 80.4 N/A Quarterly data Dec 03 Mar 04 Jun 04 Sep 04 Dec 04 Mar 05 Jun 05 Sep 05Real GDP, % YOY 7.0 7.8 8.4 6.7 5.8 6.0 4.3 5.3 - Private consumption 8.6 8.9 11.9 11.2 10.2 10.1 7.4 10.4 - Government consumption 13.3 11.8 9.5 1.1 4.2 1.5 0.9 5.9 - Gross fixed capital expenditure 3.6 3.5 3.5 3.2 2.3 2.0 6.7 9.6 Nominal GDP, US$ bn 27.2 28.2 29.3 30.2 30.7 31.1 31.8 33.6 Current Account, US$ bn 2.8 3.8 3.3 4.4 3.4 5.5 4.7 N/A Capital & Financial Account, US$ bn -0.6 2.3 0.0 -0.9 2.7 0.9 0.1 N/A
Sources: Datastream, Bloomberg

November/December 2005 Economics@
Country Update: New Zealand
ANZ Economic Monthly 20
Inflation and inflation pressure
1.0
1.5
2.0
2.5
3.0
94 95 96 97 98 99 00 01 02 03 04 05 06 07
-70
-60
-50
-40
-30
-20
-10
0
10
20
30
apc
Survey, difficulty finding skilled labour (RHS)
Inflation (LHS)
index, 7 qtrs advance, inverted
Source: RBNZ; ANZ National Bank; Statistics NZ
‘Big’ banks’ fixed mortgage rates
7.0%
7.3%
7.5%
7.8%
8.0%
8.3%
8.5%
S-04 O-04 N-04 J-05 M-05 A-05 M-05 J-05 A-05 S-05 O-05
Average of all fixed rates
Implicit easing due to banking competition
Explicit tightening
Source: ANZ National; RBNZ
• The Household Labour Force Survey has pushed our GDP estimate higher for the September quarter to 1.0%. This, coupled with a strong June outturn of 1.1%, points to year-average growth of 2¾% in December with the output gap remaining above 1%.
• Indicators continue to point to rising inflation. In particular, the labour market remains exceptionally tight with the latest unemployment rate outturn falling to a 23-year low of 3.4%. Furthermore, recent wage data released puts unit labour costs at its highest growth rate in the history of the series (since 1992).
• The Reserve Bank has reiterated themes surrounding excesses in the domestic economy and their perception that monetary policy is “losing potency”. This reflects households’ tendency to fix their mortgage rates – as much as 80% of all mortgages are now fixed. Moreover, banking competition and low offshore bond rates have kept mortgage rates lower than perhaps the Reserve Bank anticipated. But now with mortgage rates now moving above 8%, monetary policy will begin to bite at these levels.
• Consequently, we expect a quarter percentage point hike in the Official Cash Rate (OCR) in December to 7.25%. All 15 economists surveyed by Reuters expect a quarter percentage point hike. We have left the door open for a subsequent January move.
• There is conjecture that the Reserve Bank could raise the OCR by half a percentage point in December. We believe a 50bp hike – especially at this point in the business cycle – would send a disconcerting signal to offshore investors. The interest rate market is fully pricing in a rate rise in December, with around a 60% change of a percentage point hike. A 25% probability is priced into January.
Lauren Rosborough
Economic data – New Zealand Monthly data Mar 05 Apr 05 May 05 Jun 05 Jul 05 Aug 05 Sep 05 Oct 05 Retail Sales, % YOY 7.3 7.1 7.2 7.1 7.0 7.1 6.9 N/A Building consents (% YOY) -2.3 -7.3 -9.5 -18.7 -18.8 -19.7 -15.6 N/A Exports, % YOY 8.7 8.3 4.5 2.5 1.8 1.6 2.4 N/A Imports, % YOY 9.6 8.5 9.3 7.2 7.6 7.3 7.1 N/A Annual Trade Balance, US$ bn -3.2 -3.1 -3.6 -3.7 -3.7 -4.0 -4.1 N/A Quarterly data Dec 03 Mar 04 Jun 04 Sep 04 Dec 04 Mar 05 Jun 05 Sep 05Real GDP, % YOY 3.4 3.6 4.2 4.4 4.4 3.8 3.1 N/A - Private consumption 5.4 5.9 6.1 6.3 6.3 5.9 5.8 N/A - Government consumption 2.4 3.1 4.3 4.8 5.4 5.6 5.2 N/A - Gross fixed capital expenditure 11.4 15.2 15.1 14.8 13.7 8.6 8.1 N/A Nominal GDP, US$ bn 78.4 84.2 88.2 92.4 96.8 99.5 104.1 N/A Annual Current Account, US$ bn -3.5 -4.2 -4.4 -5.5 -6.4 -7.4 -8.0 N/A Consumer Price Index, annual % change 1.6 1.5 2.4 2.5 2.7 2.8 2.8 N/A
Sources: Statistics NZ, ANZ National Bank

Country Update: Philippines
November/December 2005 Economics@
ANZ Economic Monthly 21
GDP growth slows
-4
-2
0
2
4
6
8
98 99 00 01 02 03 04 05
quarter-on-quarter
Year-on-year
% change
Source: Bloomberg
Financial markets lifted by fiscal reform
52.5
53
53.5
54
54.5
55
55.5
56
56.5
57
1/01/04 29/07/04 24/02/05 22/09/05
500
600
700
800
900
1000
1100
1200
1300
1400peso
Peso per USD (inverted scale)
stockmarket
Index
• The Philippines economy grew by a lower-than-expected 4.1% YOY in the third quarter, the slowest pace in more than two years as political uncertainty and high oil prices undermined activity. Growth in the industry and services sectors slowed to 3.9% YOY and 5.1% YOY respectively while growth in the agriculture/forestry/fishery sector was stable. Fixed investment stayed weak, declining, on a year-on-year basis, for the third successive quarter. Private consumption, however, held up well.
• The government will raise the VAT from 10% to 12% in February under the new Expanded Value Added Tax (EVAT) law implemented in November. This will assist in bringing the budget deficit back to balance over the medium term. The IMF, in a statement issued on 22 November, responded positively to the progress on economic reform. Fiscal reform has helped to improve sentiment and this has been reflected in a lift in the equities market and the peso.
• Foreign investment has picked up strongly this year. Net foreign direct investment (FDI) rose by 70% YOY during January-August 2005 to US$929 mn. The opening of the mining sector to foreign-owned companies, following a Supreme Court ruling in December 2004, has lifted investment prospects. The government is keen to attract FDI to help lift economic activity and employment. Political stability will be a key factor in attracting stronger FDI flows.
• Annual inflation was high at the start of the year – 8.4% in January - largely reflecting escalating food prices and an increase in utilities charges. It has since eased to 7% in October. Inflation for 2005, however, is likely to average 7.5% compared with 4.5% over 2000-2004. With oil prices likely to stay elevated and with the EVAT, inflation pressures are likely to persist over 2006.
Jasmine Robinson
Economic data - Philippines Monthly data Mar 05 Apr 05 May 05 Jun 05 Jul 05 Aug 05 Sep 05 Oct 05 Manufacturing Production, %YOY -0.9 4.6 3.1 -2.9 0.3 5.0 -5.0 N/A Motor Vehicle sales, % YOY 13.6 33.9 15.7 25.2 0.7 12.6 10.2 12.8 Consumer Price Index, % YOY 8.5 8.5 8.5 7.6 7.1 7.2 7.0 7.0 Exports, % YOY -2.8 8.8 1.1 1.2 11.4 0.8 -1.1 N/A
Imports, % YOY -4.0 6.5 9.4 6.0 -3.1 10.1 17.7 N/A Trade Balance, US$ mn -179.0 -451.0 -289.0 -647.0 -182.0 -602.0 -516.0 N/A Foreign Exchange Reserves, US$ bn 13.7 13.9 14.7 15.0 14.9 15.3 15.9 N/A Quarterly data Dec 03 Mar 04 Jun 04 Sep 04 Dec 04 Mar 05 Jun 05 Sep 05Real GDP, % YOY 4.6 6.1 6.3 6.3 5.4 4.5 4.8 4.1 - Private consumption 5.5 5.7 6.3 5.5 5.7 5.0 4.8 4.8 - Government consumption 5.4 4.1 -1.2 -7.2 5.6 0.6 15.7 -2.1 - Gross fixed capital expenditure 0.7 5.0 4.0 3.6 4.3 -4.4 -3.9 -3.8 Nominal GDP, US$ bn 20.2 20.5 21.2 21.9 22.5 23.2 24.2 24.1 Current Account, US$ bn 1.0 -0.1 0.3 1.4 1.7 0.7 0.4 N/A Capital Account, US$ mn -1.1 -0.5 0.8 -1.2 -1.2 1.1 0.5 N/A Sources: Datastream, Bloomberg
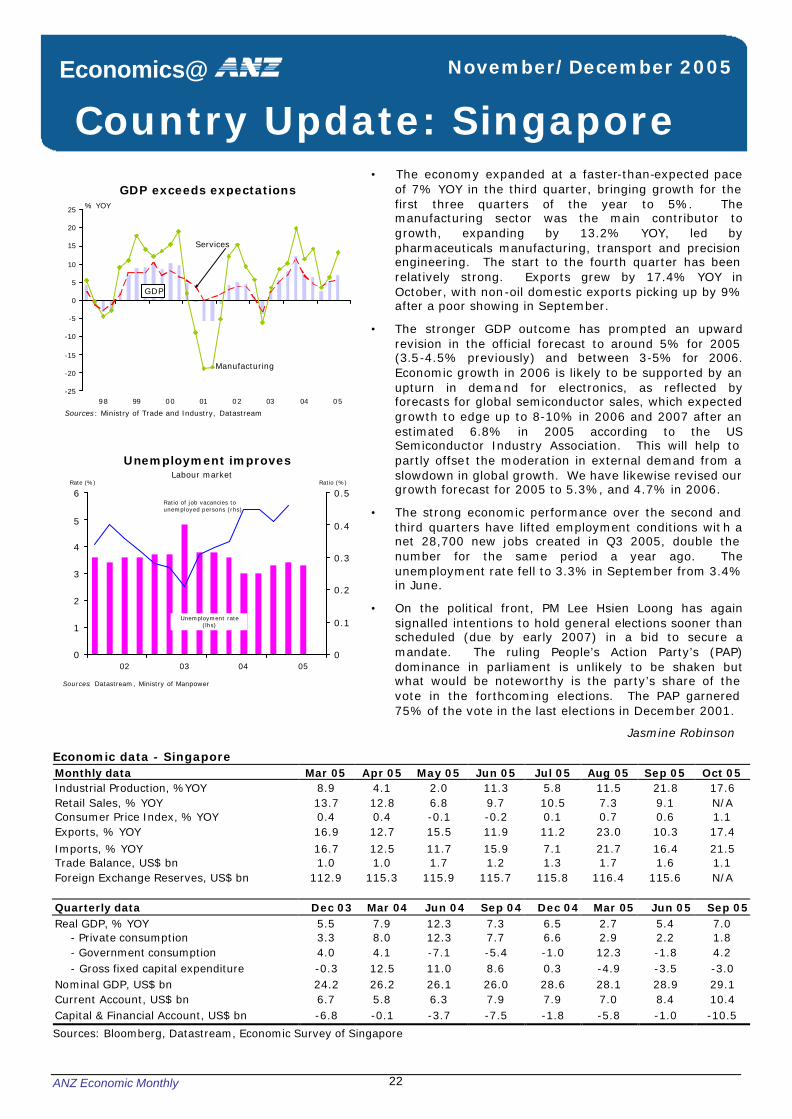
November/December 2005 Economics@
Country Update: Singapore
ANZ Economic Monthly 22
GDP exceeds expectations
-25
-20
-15
-10
-5
0
5
10
15
20
25
98 99 00 01 02 03 04 05
Manufacturing
GDP
Services
% YOY
Sources: Ministry of Trade and Industry, Datastream
Unemployment improves
Sources: Datastream, Ministry of Manpower
0
1
2
3
4
5
6
02 03 04 050
0.1
0.2
0.3
0.4
0.5Rate (%)
Labour market
Unemployment rate (lhs)
Ratio of job vacancies to unemployed persons (rhs)
Ratio (%)
• The economy expanded at a faster-than-expected pace of 7% YOY in the third quarter, bringing growth for the first three quarters of the year to 5%. The manufacturing sector was the main contributor to growth, expanding by 13.2% YOY, led by pharmaceuticals manufacturing, transport and precision engineering. The start to the fourth quarter has been relatively strong. Exports grew by 17.4% YOY in October, with non-oil domestic exports picking up by 9% after a poor showing in September.
• The stronger GDP outcome has prompted an upward revision in the official forecast to around 5% for 2005 (3.5-4.5% previously) and between 3-5% for 2006. Economic growth in 2006 is likely to be supported by an upturn in demand for electronics, as reflected by forecasts for global semiconductor sales, which expected growth to edge up to 8-10% in 2006 and 2007 after an estimated 6.8% in 2005 according to the US Semiconductor Industry Association. This will help to partly offset the moderation in external demand from a slowdown in global growth. We have likewise revised our growth forecast for 2005 to 5.3%, and 4.7% in 2006.
• The strong economic performance over the second and third quarters have lifted employment conditions wit h a net 28,700 new jobs created in Q3 2005, double the number for the same period a year ago. The unemployment rate fell to 3.3% in September from 3.4% in June.
• On the political front, PM Lee Hsien Loong has again signalled intentions to hold general elections sooner than scheduled (due by early 2007) in a bid to secure a mandate. The ruling People’s Action Party’s (PAP) dominance in parliament is unlikely to be shaken but what would be noteworthy is the party’s share of the vote in the forthcoming elections. The PAP garnered 75% of the vote in the last elections in December 2001.
Jasmine Robinson
Economic data - Singapore Monthly data Mar 05 Apr 05 May 05 Jun 05 Jul 05 Aug 05 Sep 05 Oct 05 Industrial Production, %YOY 8.9 4.1 2.0 11.3 5.8 11.5 21.8 17.6 Retail Sales, % YOY 13.7 12.8 6.8 9.7 10.5 7.3 9.1 N/A Consumer Price Index, % YOY 0.4 0.4 -0.1 -0.2 0.1 0.7 0.6 1.1 Exports, % YOY 16.9 12.7 15.5 11.9 11.2 23.0 10.3 17.4
Imports, % YOY 16.7 12.5 11.7 15.9 7.1 21.7 16.4 21.5 Trade Balance, US$ bn 1.0 1.0 1.7 1.2 1.3 1.7 1.6 1.1 Foreign Exchange Reserves, US$ bn 112.9 115.3 115.9 115.7 115.8 116.4 115.6 N/A Quarterly data Dec 03 Mar 04 Jun 04 Sep 04 Dec 04 Mar 05 Jun 05 Sep 05Real GDP, % YOY 5.5 7.9 12.3 7.3 6.5 2.7 5.4 7.0 - Private consumption 3.3 8.0 12.3 7.7 6.6 2.9 2.2 1.8 - Government consumption 4.0 4.1 -7.1 -5.4 -1.0 12.3 -1.8 4.2 - Gross fixed capital expenditure -0.3 12.5 11.0 8.6 0.3 -4.9 -3.5 -3.0 Nominal GDP, US$ bn 24.2 26.2 26.1 26.0 28.6 28.1 28.9 29.1 Current Account, US$ bn 6.7 5.8 6.3 7.9 7.9 7.0 8.4 10.4 Capital & Financial Account, US$ bn -6.8 -0.1 -3.7 -7.5 -1.8 -5.8 -1.0 -10.5
Sources: Bloomberg, Datastream, Economic Survey of Singapore

Country Update: Taiwan
November/December 2005 Economics@
ANZ Economic Monthly 23
GDP growth led by investment and small rise in consumption
-30
-20
-10
0
10
20
30
40
Jan-01 May-02 Sep-03 Jan-05
Taiwan exports
Export prices
Export orders% YOY
Total exports
Sources: Datastream, Economics@ANZ.
-20
-15
-10
-5
0
5
10
15
20
Q1 2001 Q1 2003 Q1 2005
Composition of GDP
Private consumption
Investment
Public consumption
% YOY
Further impetus to keep raising rates
Sources: Datastream, Economics@ANZ.
-8
-6
-4
-2
0
2
4
6
8
10
12
14
01 02 03 04 05
% YOY
CPI measures
Food
Core CPI excl food and energy
CPI
• Real GDP rose a stronger than expected 4.4% YOY in the third quarter, above the 3.5% gain we had forecast. The outturn was explained by stronger than expected external demand, particularly in electronics as sales rose more than 7% in the quarter. However, gross fixed capital formation was also pretty strong, and there was a rise in private consumption in the quarter. The result raises our year-end forecast to 3.6% from 3.0%.
• Third quarter balance of payments data showed that the current account surplus shrank significantly to US$879 mn from US$1.7 bn in the second quarter and US$4.4 bn in the first quarter. The capital account deficit declined, but registered US$6.3 bn of portfolio investment outflows and a US$4.1 bn inflow of “other investment.”
• Export orders continued to rise in October, up 21.5% YOY. Industrial production also continued to rise, up 9.3% YOY in October after a 6.8% rise in September, with heavy industry responsible for much of the growth. The unemployment rate fell to a recent low of 4%, versus 4.11% in August. However, export prices do not appear to be keeping pace, which is preventing the value of total exports from rising very quickly.
• Core inflation accelerated markedly in October, rising 1.5% MOM and 1.1% YOY. Headline inflation, however, moderated to 2.6% YOY in October from 3.2% in September. The CBC is likely to raise interest rates by a further 12.5 or 25 bps in December given the improved economic performance of late and the risk of pass through from higher energy prices.
• Cross strait relations again came into focus in November with President Bush’s speeches during a trip through Asia in which he reaffirmed the one China policy but made numerous references to the development of a freed and democratic Taiwan.
Amy Auster
Economic data – Taiwan Monthly data Mar 05 Apr 05 May 05 Jun 05 Jul 05 Aug 05 Sep 05 Oct 05 Industrial Production, %YOY -0.2 0.9 -1.3 2.0 -1.7 6.5 6.9 9.3 Retail Sales, % YOY 8.1 5.0 4.6 4.8 7.4 5.6 N/A N/A Consumer Price Index, % YOY 2.3 1.6 2.3 2.4 2.4 3.6 3.2 2.6 Exports, % YOY 6.1 11.0 4.0 2.7 5.0 6.5 6.9 15.6
Imports, % YOY 14.1 18.5 11.3 2.1 9.0 10.0 7.5 8.1 Trade Balance, US$ bn -0.5 0.0 0.1 -0.2 0.3 0.4 0.7 1.5 Foreign Exchange Reserves, US$ bn 251.1 252.6 253.2 253.6 253.6 254.1 253.8 252.0 Quarterly data Dec 03 Mar 04 Jun 04 Sep 04 Dec 04 Mar 05 Jun 05 Sep 05Real GDP, % YOY 6.1 7.8 8.9 5.3 2.5 2.4 2.9 4.4 - Private consumption 2.5 5.1 5.9 1.6 3.1 2.5 2.8 3.8 - Government consumption 0.6 1.4 -0.2 -1.4 -2.0 -0.6 0.8 1.0
- Gross fixed capital expenditure 8.1 15.2 23.9 15.6 15.7 8.8 7.1 0.1 Nominal GDP, US$ bn 78.5 79.3 81.0 79.9 82.0 86.2 87.2 86.7 Current Account, US$ bn 8.0 5.9 5.5 5.3 1.8 4.4 1.8 0.9 Capital Account, US$ bn -6.4 -5.7 -5.0 -4.8 -4.4 -4.6 -3.4 -3.0
Sources: Bloomberg, Datastream, National Statistics

November/December 2005 Economics@
Country Update: Thailand
ANZ Economic Monthly 24
Inflation continues to accelerate …
Source: Bloomberg
-2
0
2
4
6
8
10
12
97 98 99 00 01 02 03 04 05
%YOY
CPI
Core CPI
…. prompting aggressive monetary tightening
0
5
10
15
20
25
30
97 98 99 00 01 02 03 04 05
% pa.
Source: Datastream
14-day repurchase rate
• Annual inflation surged to 6.2% in October, the highest rate since September 1998, due largely to high fuel prices. Core inflation has edged up from the start of the year but has been relatively steady in recent months (2.4% YOY in October). The recent decline in oil prices and monetary tightening are likely to result in some easing of price pressures although the impact of the dismantling of fuel subsidies is still likely to be felt in the months ahead. Annual inflation in November was 5.9%.
• New incidences of bird flu have been identified. Thailand has thus far been able to contain such outbreaks through the culling of infected birds but risks remain high of a more widespread outbreak given that the virus has now been found in migratory birds.
• On the political front, elections held on 30 October reflected a drop in popularity for the ruling Thai Rak Thai party. It lost all but one of the seats in elections held in 4 constituencies. The opposition parties now collectively hold 125 seats in the 500-seat lower house, creating a more serious challenge to the Thaksin administration.
• The government faced another setback with the Supreme Court’s decision to suspend the initial public offer of Electricity Generating Authority of Thailand (Egat Plc). Egat shares were supposed to have gone on sale on 16 November and begin trading on the Stock Exchange on 30 November. The IPO delay could be a precursor of the path of future privatisations.
• Unrest in southern Thailand shows no sign of abating. Repeated calls for self-government have been ruled out. The situation in the south continues to plague the Thaksin government, which has introduced a series of policies.
Jasmine Robinson
Economic data - Thailand Monthly data Mar 05 Apr 05 May 05 Jun 05 Jul 05 Aug 05 Sep 05 Oct 05 Manufacturing Production, %YOY 8.1 5.2 8.4 9.4 4.9 11.9 4.4 N/A
Car Sales, % YOY 24.1 9.0 21.9 25.6 12.3 21.0 7.9 N/A Consumer Price Index, % YOY 3.2 3.6 3.7 3.8 5.3 5.6 6.0 6.2
Exports, % YOY 20.3 13.1 12.5 9.4 16.3 22.9 21.0 N/A
Imports, % YOY 29.8 30.0 36.4 35.4 18.4 19.6 18.2 N/A Trade Balance, US$ bn -1.1 -1.6 -1.8 -1.9 -0.1 0.0 0.8 N/A
Foreign Exchange Reserves, US$ bn 47.5 48.1 47.1 47.2 47.3 48.2 48.5 N/A
Quarterly data Dec 03 Mar 04 Jun 04 Sep 04 Dec 04 Mar 05 Jun 05 Sep 05Real GDP, % YOY 7.6 6.7 6.4 5.9 5.5 3.4 4.4 N/A - Private consumption 7.6 6.2 5.8 5.5 5.5 4.5 4.7 N/A
- Government consumption 7.2 6.8 4.9 0.3 4.8 15.8 9.3 N/A
- Gross fixed capital expenditure 19.3 16.5 13.1 12.5 15.5 15.0 14.4 N/A
Nominal GDP, US$ bn 38.4 40.2 40.5 40.4 42.4 44.0 43.6 N/A
Current Account, US$ bn 2.5 2.2 0.6 1.2 3.1 -1.5 -4.7 1.2
Capital & Financial Account, US$ bn -2.0 -1.6 0.3 0.3 1.8 -0.5 4.0 N/A
Sources: Bloomberg, Datastream, ANZ Bank

Country Update: Vietnam
November/December 2005 Economics@
ANZ Economic Monthly 25
Inflation driven by fuel prices
8.3
7.4
10.5
9.6
11.9
-9.2
-10 -5 0 5 10 15
All items
Food
Food stuffs
Housing andConstruction
Transport &Communciations
Post &Communications
YOY %
Inflation October 2005
Source: General Statistics Office of Vietnam
Investment growth continues
0 200 400 600 800
Oil & Gas
Fishery
Offices &Apartments
Transportation& Comms
Hotel &Tourism
Construction
Foodstuffmanufacturing
Culture, Health& Education
Agriculture &forestry
Services
Heavy industry
Light industry
150
170
190
210
230
250
270
290
310
330
350
J F A M J A S N
July 2000=100
FDI by Sector – October 05 Vietnam Stock Market 2005
$US mn
Source: General Statistics Office of Vietnam, Bloomberg
• Inflationary pressures continue to emerge in Vietnam driven primarily by higher fuels costs which have increased from VND6,000 per litre to VND10,000 in recent months. Efforts by the government to subsidise fuel have imparted increased pressure on public finances which are estimated at US$440 mn for the first half of 2005. In an attempt to reduce this cost the government has already sanctioned three separate price increases in March, July and August 2005, with more expected. Despite the reduction in subsidies they are still forecast to cost the government US$709 mn for calendar 2005.
• Inflation ran at 8.3% in October, prices in the transport & communications sector increased by 11.9% YOY this is despite prices in the communications component of the index falling by 9.2%. Food prices have grown steadily throughout 2005 and are expected to accelerate as increased storm activity and Typhoon Damrey damaged significant tracts of rice paddies and aquaculture installations.
• Foreign investment in Vietnam has increased significantly, there have been 659 newly granted projects worth around US$3 bn in the year to October 2005. The majority of this investment has taken place in the industrial, infrastructure and constructions sector. Further encouraging foreign direct investment, the Vietnamese government intends to allow increased flows in to the services sector (including goods distribution, insurance, banking, transport, and telecommunications), which have previously been under strict control. Liberalisation is also taking place in the relatively small Vietnam stock market with in-principle approval received for the first foreign-invested-enterprise to list on the VN index. The market currently has around only 30 listed companies and a market capitalisation of under US$300 mn. Vietnam’s recent first sovereign bond issue was also very successful attracting orders totalling US$4.5 bn for the only US$750 mn of bonds. The 10-year bond was priced to yield 7.125%.
Alex Joiner
Economic data - Vietnam Monthly data Mar 05 Apr 05 May 05 Jun 05 Jul 05 Aug 05 Sep 05 Oct 05 Industrial Production+, %YOY 14.4 15.1 15.4 15.6 16.0 18.1 16.5 16.7 Retail Sales+, % YOY 18.5 18.7 18.8 18.9 19.0 19.1 19.7 20.0 Consumer Price Index, % YOY 8.4 8.5 8.1 7.6 7.5 7.3 7.8 8.3 Exports+, % YOY 16.2 23.2 20.4 17.4 18.1 18.7 21.1 21.9
Imports +, % YOY 18.5 22.4 21.2 22.0 20.5 20.0 19.2 18.3 Trade Balance*, US$ bn -1.1 -1.8 -2.6 -3.6 -3.5 -3.8 -3.9 -4.1 Tourist Arrivals+, %YOY 22.8 20.1 19.4 23.7 23.8 22.7 20.6 20.3 China, number of visitors* 211,930 246,066 302,439 408,817 478,195 527,138 559,790 621,786 US, number of visitors* 94,787 115,161 134.243 166,875 204,051 230,937 230,937 275,596 Quarterly data Growth Q1-Q3 2005 Contributions to Growth (ppts) Real GDP+, % YOY 8.1 Agriculture, forestry, fishery, % YOY 4.1 0.8 Industry & construction, % YOY 10.0 4.0
Services, % YOY 8.2 3.3
+: January-to date vs same period in previous year *: January to date ^: US$ bn Source: General Statistics Office of Vietnam

ANZ COUNTRY UPDATE 26
ANZ is represented in:
AUSTRALIA by: Australia and New Zealand Banking Group Limited ABN 11 005 357 522 10th Floor 100 Queen Street, Melbourne 3000, Australia Telephone +61 3 9273 6224 Fax +61 3 9273 5711 UNITED KINGDOM by: Australia and New Zealand Banking Group Limited ABN 11 005 357 522 Minerva House, PO Box 7, Montague Close, London, SE1 9DH, United Kingdom Telephone +44 20 7378 2121 Fax +44 20 7378 2378 UNITED STATES OF AMERICA by: ANZ Securities, Inc. (Member of NASD and SIPC) 6th Floor 1177 Avenue of the Americas New York, NY 10036, United States of America Tel: +1 212 801 9160 Fax: +1 212 801 9163 NEW ZEALAND by: ANZ National Bank Limited Level 7, 1-9 Victoria Street, Wellington, New Zealand Telephone +64 4 802 2000 In Australia and the UK, ANZ Investment Bank is a business name of Australia and New Zealand Banking Group Limited, ABN 11 005 357 522 (“ANZ Bank”), which holds an Australian Financial Services licence no. 234527 and is authorised in the UK by the Financial Services Authority (“FSA”). In New Zealand, ANZ Investment Bank is a business name of ANZ National Bank Limited WN / 035976 (“ANZ NZ”). This document is being distributed in the United States by ANZ Securities, Inc. (“ANZ S”) (an affiliated company of ANZ Bank), which accepts responsibility for its content. Further information on any securities referred to herein may be obtained from ANZ S upon request. Any US person(s) receiving this document and wishing to effect transactions in any securities referred to herein should contact ANZ S, not its affiliates. This document is being distributed in the United Kingdom by ANZ Bank for the information of its market counterparties and intermediate customers only. It is not intended for and must not be distributed to private customers. In the UK, ANZ Bank is regulated by the FSA. Nothing here excludes or restricts any duty or liability to a customer which ANZ Bank may have under the UK Financial Services and Markets Act 2000 or under the regulatory system as defined in the Rules of the FSA.
This document is issued on the basis that it is only for the information of the particular person to whom it is provided. This document may not be reproduced, distributed or published by any recipient for any purpose. This document does not take into account your personal needs and financial circumstances. Under no circumstances is this document to be used or considered as an offer to sell, or a solicitation of an offer to buy. In addition, from time to time ANZ Bank, ANZ NZ, ANZ S, their affiliated companies, or their respective associates and employees may have an interest in any financial products (as defined by the Australian Corporations Act 2001), securities or other investments, directly or indirectly the subject of this document (and may receive commissions or other remuneration in relation to the sale of such financial products, securities or other investments), or may perform services for, or solicit business from, any company the subject of this document. If you have been referred to ANZ Bank, ANZ NZ, ANZ S or their affiliated companies by any person, that person may receive a benefit in respect of any transactions effected on your behalf, details of which will be available upon request. The information herein has been obtained from, and any opinions herein are based upon, sources believed reliable. The views expressed in this document accurately reflect the author’s personal views, including those about any and all of the securities and issuers referred to herein. The author however makes no representation as to its accuracy or completeness and the information should not be relied upon as such. All opinions and estimates herein reflect the author’s judgement on the date of this document and are subject to change without notice. No part of the author's compensation was, is or will directly or indirectly relate to specific recommendations or views expressed about any securities or issuers in this document. ANZ Bank, ANZ NZ, ANZ S, their affiliated companies, their respective directors, officers, and employees disclaim any responsibility, and shall not be liable, for any loss, damage, claim, liability, proceedings, cost or expense (“Liability”) arising directly or indirectly (and whether in tort (including negligence), contract, equity or otherwise) out of or in connection with the contents of and/or any omissions from this communication except where a Liability is made non-excludable by legislation. Where the recipient of this publication conducts a business, the provisions of the Consumer Guarantees Act 1993 (NZ) shall not apply.
For further information, please email [email protected]