Anxiety or Pain? The Impact of Tariffs and Uncertainty on ...
43
Anxiety or Pain? The Impact of Tariffs and Uncertainty on Chinese Firms in the Trade War Felipe Benguria (U of Kentucky), Jaerim Choi (U of Hawaii), Deborah L. Swenson (UC Davis), and Mingzhi Xu (Peking University) Presented at Sogang University 2020.9.15 Benguria, Choi, Swenson, and Xu Anxiety or Pain? 2020.9.15 1 / 43
Transcript of Anxiety or Pain? The Impact of Tariffs and Uncertainty on ...

Anxiety or Pain? The Impact of Tariffs and Uncertaintyon Chinese Firms in the Trade War
Felipe Benguria (U of Kentucky), Jaerim Choi (U of Hawaii),Deborah L. Swenson (UC Davis), and Mingzhi Xu (Peking University)
Presented at Sogang University
2020.9.15
Benguria, Choi, Swenson, and Xu Anxiety or Pain? 2020.9.15 1 / 43

Introduction
Introduction
Benguria, Choi, Swenson, and Xu Anxiety or Pain? 2020.9.15 2 / 43

Introduction
The U.S.-China Trade War
Trade War Timeline:
Newly implemented U.S. trade policies stand in stark contrast withthe long trend towards freer trade.
1 (In the Beginning) In January 2018 - Safeguard Tariffs on solarpanels and washing machines. In March 2018 - Tariffs on steel andaluminum under national security grounds.
2 (The First Round) In July/August 2018 - $50 billion US tariff listand $50 billion Chinese tariff list both with 25% rates go into effect.
3 (The Second Round) In September 2018 - $200 billion US tariff Listwith 10% rates and $60 billion Chinese tariff list ranging from 5 to10% rates go into effect.
4 (More Tariff Hikes) In May 2019 - $200 billion US tariff went from10% rates to 25% rates. In June 2019 - Chinas tariff rate hike on USexports goes in effect, covering $36 billion of the $60 billion list
Benguria, Choi, Swenson, and Xu Anxiety or Pain? 2020.9.15 3 / 43

Introduction
Research Question
Research Question:
What are the impacts of the 2018-2019 trade war on Chinese firms?
Benguria, Choi, Swenson, and Xu Anxiety or Pain? 2020.9.15 4 / 43

Introduction
Research Question
Research Question:
What are the impacts of the 2018-2019 trade war on Chinese firms?
Previous Research: Focused on the U.S. economy
1 Analyze the impact of the trade war on the U.S. economy and findthe welfare loss for the U.S equal to 0.4% of GDP.(Fajgelbaum et al, QJE, 2019; Amiti et al, JEP, 2019)
2 Evaluate the investment consequences for U.S. listed firms.(Amiti et al, NBER, 2020)
3 Examine the effects on the financial markets (i.e., stock marketreturns) of the trade war.(Huang et al, Working Paper, 2020)
⇒ Provide the first account of the impact of the trade war on Chinesefirms!
Benguria, Choi, Swenson, and Xu Anxiety or Pain? 2020.9.15 5 / 43

Introduction
The Focus of Our Study
Previous Research: Focused on the price adjustment channel
Higher tariffs induce higher prices faced by consumers and firms;terms-of-trade effects induce reallocations; it may also lead to GEeffects across industries and regions(Fajgelbaum et al, QJE, 2019; Amiti et al, JEP, 2019)
The Focus of Our Study: Trade Policy Uncertainty (TPU)
In addition to the price adjustment channel, uncertainties perceived byChinese firms (or U.S. firms) may also increase during the trade war.
The trade war has significantly raised the uncertainty facing economicagents (IMF, 2018)
⇒ Investigate this new TPU channel, which has been rarely studied at thefirm-level, and provide new insights on this research arena!
Benguria, Choi, Swenson, and Xu Anxiety or Pain? 2020.9.15 6 / 43

Introduction
What’s New?
Unique and Comprehensive Dataset: Three sources
1 Firm-level measures of tariff exposure(Customs data + Trade war tariffs + MFN tariffs)
2 Firm-specific measures of trade policy uncertainty(Firms’ annual reports - textual analysis)
3 Firm-level real outcome variables(COMPUSTAT Global database)
Identification Strategy: U.S.-China Trade War
Study the sources and consequences of TPU during the trade war(Endogenous TPU)
⇒ Using the finely detailed dataset and a clean identification strategyallow us to shed light on the mechanisms through which the trade warimpacts Chinese firms.
Benguria, Choi, Swenson, and Xu Anxiety or Pain? 2020.9.15 7 / 43

Introduction
Preview
Empirical Strategy:
Estimate a difference-in-differences empirical specification based onvariation across Chinese firms in exposure to trade war tariffs.
We find that:
1 Increases in U.S. tariffs and Chinese retaliatory tariffs both raisedTPU for Chinese firms.
2 The impact of tariffs on uncertainty is heterogeneous.
Larger among smaller and less capital-intensive firms.Smaller for more diversified exporters, but the diversification effect ishampered when firms have too much dependence on U.S. sales.
3 A one SD increase in TPU leads to a reduction in investment, R&Dexpenditures, and profits by 1.4, 2.7, and 8.9%, respectively.
Benguria, Choi, Swenson, and Xu Anxiety or Pain? 2020.9.15 8 / 43

Firm-level Measurement
Firm-level Measurement
Benguria, Choi, Swenson, and Xu Anxiety or Pain? 2020.9.15 9 / 43

Firm-level Measurement
Firm-level Tariff Exposure Measures
The U.S. tariff exposure of a Chinese firm i in time t:
TariffU.S.it =
∑j∈Jei
[XU.S.ij0∑
s∈JeiXU.S.is0
τU.S.jt
]
τU.S.jt : Good j ’s ad valorem tariff (i.e., MFN tariff plus trade war tariff)
imposed by the U.S. in time t
XU.S.ij0 : Average exports of good j to the U.S. by firm i during
2013-2016
Jei : The set of goods exported by firm i
Benguria, Choi, Swenson, and Xu Anxiety or Pain? 2020.9.15 10 / 43

Firm-level Measurement
TariffU.S.it
Benguria, Choi, Swenson, and Xu Anxiety or Pain? 2020.9.15 11 / 43

Firm-level Measurement
Firm-level Tariff Exposure Measures
The Chinese tariff tariff exposure of a Chinese firm i in time t:
TariffCHNit =
∑j∈Jmi
[MU.S.
ij0∑s∈Jmi
MU.S.is0
τCHNjt
]
τCHNjt : Good j ’s ad valorem tariff (i.e., MFN tariff plus trade war tariff)
imposed by China on the U.S. goods in time t
MU.S.ij0 : Average imports of good j from the U.S. by firm i during
2013-2016
Jmi : The set of goods imported by firm i
Benguria, Choi, Swenson, and Xu Anxiety or Pain? 2020.9.15 12 / 43

Firm-level Measurement
TariffCHNit
Benguria, Choi, Swenson, and Xu Anxiety or Pain? 2020.9.15 13 / 43

Firm-level Measurement
Firm-level Trade Policy Uncertainty Measure
Our annual firm-level TPU measures are constructed using a textualanalysis of the transcript of yearly reports of publicly listed companiesin China.
1 Import annual reports with each line of transcript stored as anobservation.
2 Search each line for the keywords related to uncertainty or future risksuch as uncertainty and risk.
3 Search each line for trade policy related keywords such as tariff, importduty, export tariff, protectionism, unilateralism, trade barriers, andanti-dumping
4 Set the uncertainty counting variable as zero if there are no tradepolicy related keywords before and after the appreance of uncertaintykeywords.
Benguria, Choi, Swenson, and Xu Anxiety or Pain? 2020.9.15 14 / 43

Firm-level Measurement
Trade Policy Related Keywords in the Annual Report(Angang Steel Company - GVKEY 205808)
Benguria, Choi, Swenson, and Xu Anxiety or Pain? 2020.9.15 15 / 43

Firm-level Measurement
Firm-level Trade Policy Uncertainty Measure
Formally, the firm-level TPU for firm i in year t is defined as follows:
TPUit =1
Rit
Rit∑w=1
{1[w ∈ KeywordsUncertainty
]×1
[|w−t| < One Line
]}
w = 0, 1, ...,Rit : Words contained in the annual report of firm i in t
Rit : Length of report measured as the total number of Chinesecharacters
t: The position of the nearest synonym of trade policy keywords(i.e., t ∈ KeywordsTrade policy).
Benguria, Choi, Swenson, and Xu Anxiety or Pain? 2020.9.15 16 / 43

Firm-level Measurement
Summary of Firm-level TPU Measure by Year
(I) Appearance in Range of +/− 1 Lines (II) Appearance in the Same LineYear Keywords Number Keywords Share Keywords Number Keywords Share
Mean Std. Dev. Mean Std. Dev. Mean Std. Dev. Mean Std. Dev.
2008 0.111 0.377 0.014 0.047 0.039 0.204 0.005 0.0282009 0.145 0.487 0.017 0.059 0.052 0.246 0.006 0.0292010 0.076 0.315 0.009 0.039 0.033 0.195 0.004 0.0242011 0.098 0.373 0.011 0.044 0.036 0.213 0.004 0.0252012 0.099 0.403 0.012 0.047 0.048 0.278 0.006 0.0332013 0.070 0.332 0.008 0.038 0.035 0.230 0.004 0.0262014 0.068 0.314 0.007 0.033 0.031 0.218 0.003 0.0232015 0.069 0.312 0.007 0.032 0.028 0.187 0.003 0.0202016 0.112 0.430 0.011 0.041 0.042 0.241 0.004 0.0232017 0.132 0.461 0.012 0.044 0.063 0.298 0.006 0.0292018 0.303 0.733 0.026 0.063 0.182 0.536 0.015 0.045
Notes: The table summarizes firm-level TPU measure by year.
Benguria, Choi, Swenson, and Xu Anxiety or Pain? 2020.9.15 17 / 43

Firm-level Measurement
Our TPU measure and TPU in Davis et al. (2019)
Benguria, Choi, Swenson, and Xu Anxiety or Pain? 2020.9.15 18 / 43

Empirical Analysis
Empirical Analysis
Benguria, Choi, Swenson, and Xu Anxiety or Pain? 2020.9.15 19 / 43

Empirical Analysis
Firm-level Impact of the 2018-2019 Trade War on TPU
Estimate the following regression in first-differences:
∆TPUi = α+β∆log(1+TariffU.S.i )+γ∆log(1+Tariff
CHNi )+δXi+ψREG+ψIND+εi
∆ denotes changes between 2017Q4 and 2018Q4∆TPUi : Change in firm i ’s TPU∆log(1 + TariffU.S.
i ): Change in firm i ’s US Tariff∆log(1 + TariffCHN
i ): Change in firm i ’s CHN TariffXi : Revenue, capital and profits in 2017Q4.ψREG: Region FEsψIND: Industry FEs
⇒ These region dummies and industry dummies absorb region- andindustry-specific trends in trade policy uncertainty. This alleviates the concernabout the endogeneity of tariffs (i.e., targeting certain industries such as IT orhigh-tech-related industries).
Benguria, Choi, Swenson, and Xu Anxiety or Pain? 2020.9.15 20 / 43

Empirical Analysis
TPU and Tariffs: 2017Q4 - 2018Q4
Dependent Variable:∆Trade Policy Uncertainty
(1) (2) (3) (4) (5)
∆log(1+TariffU.S.) 0.314*** 0.245* 0.131 0.126(0.121) (0.125) (0.128) (0.133)
∆log(1+TariffCHN) 0.701** 0.569* 0.722** 0.668**(0.296) (0.307) (0.303) (0.310)
Firm Characteristics No No No No YesRegion FE No No No Yes YesIndustry FE No No No Yes YesObservations 2,180 2,180 2,180 2,168 2,135R-squared 0.003 0.003 0.005 0.078 0.081
Benguria, Choi, Swenson, and Xu Anxiety or Pain? 2020.9.15 21 / 43
Empirical Analysis
Pre-Existing Trends
One may still argue that tariff can target particular firms and thosefirms simultaneously had a pre-existing trend in TPU.
To alleviate this concern, we check for pre-existing trends in firm-leveltrade policy uncertainty as follows:
∆16Q4−17Q4TPUi = α + β∆17Q4−18Q4log(1 + TariffU.S.i )
+ γ∆17Q4−18Q4log(1 + TariffCHNi )
+ δXi + ψREG + ψIND + εi
Benguria, Choi, Swenson, and Xu Anxiety or Pain? 2020.9.15 22 / 43

Empirical Analysis
Tests for Pre-Existing Trends
Dependent Variable:∆16Q4−17Q4Trade Policy Uncertainty
(1) (2) (3) (4) (5)
∆17Q4−18Q4log(1+TariffU.S.) 0.011 0.009 -0.024 -0.004(0.082) (0.085) (0.093) (0.095)
∆17Q4−18Q4log(1+TariffCHN) 0.022 0.017 -0.031 -0.000(0.214) (0.222) (0.225) (0.229)
Firm Characteristics No No No No YesRegion FE No No No Yes YesIndustry FE No No No Yes YesObservations 2,028 2,028 2,028 2,017 1,984R-squared 0.000 0.000 0.000 0.081 0.083
Benguria, Choi, Swenson, and Xu Anxiety or Pain? 2020.9.15 23 / 43

Empirical Analysis
Firm Size and Capital Intensity
Next, we explore whether the trade war tariffs have had a differentialimpact on trade policy uncertainty for firms of different sizes:
∆TPUi = α + β1∆log(1 + TariffU.S.i )
+ β2∆log(1 + TariffU.S.i )× log(Revenuei )
+ γ1∆log(1 + TariffCHNi )
+ γ2∆log(1 + TariffCHNi )× log(Revenuei )
+ δXi + ψREG + ψIND + εi
Benguria, Choi, Swenson, and Xu Anxiety or Pain? 2020.9.15 24 / 43

Empirical Analysis
TPU, Tariffs, and Size: 2017Q4 - 2018Q4
Dependent Variable: ∆Trade Policy UncertaintyInteractions with Revenues Interactions with Capital(1) (2) (3) (4) (5) (6)
∆log(1+TariffU.S.) 1.800*** 1.563** 1.687*** 1.331**(0.589) (0.609) (0.592) (0.609)
∆log(1+TariffCHN) 3.314** 2.238 4.060*** 3.187**(1.375) (1.407) (1.321) (1.343)
∆log(1+TariffU.S.)× log(Revenue) -0.255*** -0.231**(0.095) (0.098)
∆log(1+TariffCHN) × log(Revenue) -0.392* -0.233(0.213) (0.219)
∆log(1+TariffU.S.) × log(Capital) -0.230** -0.188*(0.094) (0.096)
∆log(1+TariffCHN) × log(Capital) -0.490*** -0.367*(0.189) (0.193)
Firm Characteristics Yes Yes Yes Yes Yes YesRegion FE Yes Yes Yes Yes Yes YesIndustry FE Yes Yes Yes Yes Yes YesObservations 2,135 2,135 2,135 2,135 2,135 2,135R-squared 0.082 0.082 0.085 0.081 0.084 0.086
Benguria, Choi, Swenson, and Xu Anxiety or Pain? 2020.9.15 25 / 43

Empirical Analysis
Firm Size and Capital Intensity
Fan, Li and Yeaple (JIE, 2018) find that, around the time of China’sWTO accession, lower productivity firms benefit more from theaccession due to the quality upgrading that is facilitated by tradeliberalization.
If Chinese firms were sourcing optimally before the trade war, thereversal of opportunities due to the trade war implies that the damagewould be greatest for these firms which are likely to be characterizedby low capital intensity, small revenue and low productivity.
Benguria, Choi, Swenson, and Xu Anxiety or Pain? 2020.9.15 26 / 43

Empirical Analysis
Trade Diversification
In addition to the quality channel, the effect of tariffs on TPU couldalso depend on firms product and market diversification patterns:
∆TPUi = α + β1∆log(1 + TariffU.S.i )
+ β2∆log(1 + TariffU.S.i )× Nexp,prod
i
+ γ1∆log(1 + TariffCHNi )
+ γ2∆log(1 + TariffCHNi )× N imp,prod
i
+ Nexp,prodi + N imp,prod
i + δXi + ψREG + ψIND + εi
Nexp,prodi and N imp,prod
i are the total number of exported and importedproducts for firm i from 2013 to 2016.
Benguria, Choi, Swenson, and Xu Anxiety or Pain? 2020.9.15 27 / 43

Empirical Analysis
TPU, Tariffs, and Diversification: 2017Q4 - 2018Q4
Dependent Variable:∆Trade Policy UncertaintyNumber of Products Number of Partner Countries
(1) (2) (3) (4) (5) (6)
∆log(1+TariffU.S.) 0.271* 0.173 0.572*** 0.392**(0.151) (0.152) (0.192) (0.192)
∆log(1+TariffU.S.)×Nexp,prodi -0.003 -0.003
(0.002) (0.002)
∆log(1+TariffU.S.)×Nexp,ctryi -0.016*** -0.012**
(0.005) (0.005)∆log(1+TariffCHN) 0.764** 0.732** 0.577 0.570
(0.373) (0.366) (0.459) (0.471)
∆log(1+TariffCHN) ×N imp,prodi -0.005 -0.006
(0.010) (0.009)
∆log(1+TariffCHN)×N imp,ctryi -0.019 -0.019
(0.035) (0.035)
Firm Characteristics Yes Yes Yes Yes Yes YesRegion FE Yes Yes Yes Yes Yes YesIndustry FE Yes Yes Yes Yes Yes YesObservations 2,135 2,135 2,135 2,135 2,135 2,135R-squared 0.080 0.081 0.083 0.082 0.083 0.087
Benguria, Choi, Swenson, and Xu Anxiety or Pain? 2020.9.15 28 / 43

Empirical Analysis
Trade Diversification
Multi-country exporters perceive less uncertainty after an increase intariff, presumably due to their ability to reroute trade(see Kramarz et al., JIE, 2020; Caselli et al., QJE, 2020).
Also, if there are sunk costs of searching for trade partners, or fixedinvestments that are placed as new export destinations are created,the existence of established trade partners helps to explain thediversification effects.
Benguria, Choi, Swenson, and Xu Anxiety or Pain? 2020.9.15 29 / 43
Empirical Analysis
Dependence on U.S. Sales
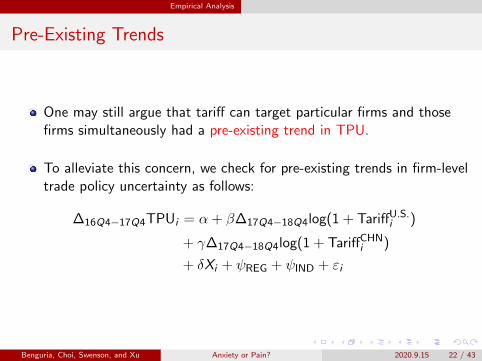
When firms have too much dependence on U.S. sales, given the fixedcosts of locating and entering new markets, the ability to hedge inexport markets could be hampered.
To test this hypothesis, we construct the measures of U.S. reliancebased on firm trade prior to the trade war.
Those measures are incorporated into our baseline regression in theform of interactions with the tariff exposure variables.
Benguria, Choi, Swenson, and Xu Anxiety or Pain? 2020.9.15 30 / 43

Empirical Analysis
TPU, Tariffs, and U.S. Dependence: 2017Q4 - 2018Q4
Dependent Variable: ∆Trade Policy UncertaintyCutoff of D: 5% 5% 10% 15% 20%
(1) (2) (3) (4) (5) (6) (7)
∆log(1+TariffU.S.) 0.126 0.427** -0.278 0.023 0.100 0.099 0.169(0.133) (0.194) (0.212) (0.244) (0.237) (0.231) (0.232)
∆log(1+TariffCHN) 0.668** 0.477 0.284 0.141 0.054 0.864 0.787(0.310) (0.444) (1.874) (1.865) (1.137) (1.118) (1.107)
∆log(1+TariffU.S.)× Nexp,ctryi -0.009** -0.009** -0.009** -0.009** -0.009**
(0.004) (0.004) (0.004) (0.004) (0.004)
∆log(1+TariffCHN)× N imp,ctryi 0.016 0.014 0.015 0.016 0.016
(0.028) (0.028) (0.028) (0.028) (0.028)∆log(1+TariffU.S.) 0.541** 0.559** 0.489** 0.513** 0.406*
× Dexp, U.S.-dominanti (0.249) (0.247) (0.243) (0.238) (0.239)
∆log(1+TariffCHN) 0.350 0.335 0.421 -0.462 -0.371
× D imp, U.S.-dominanti (1.899) (1.858) (1.139) (1.122) (1.108)
Firm Characteristics Yes Yes Yes Yes Yes Yes YesRegion FE Yes Yes Yes Yes Yes Yes YesIndustry FE Yes Yes Yes Yes Yes Yes YesObservations 2,135 2,135 2,135 2,135 2,135 2,135 2,135R-squared 0.081 0.083 0.083 0.086 0.085 0.085 0.085
Benguria, Choi, Swenson, and Xu Anxiety or Pain? 2020.9.15 31 / 43

Empirical Analysis
Dependence on U.S. Sales
Our findings indicate that the ability to hedge in export markets couldbe hampered when firms have some dependence on U.S. sales,relative to firms that have very few dependence on U.S. sales, giventhe fixed costs of locating and entering new markets.
Benguria, Choi, Swenson, and Xu Anxiety or Pain? 2020.9.15 32 / 43

Empirical Analysis
Firm-level Impact of TPU on Economic Outcomes
Next, we analyze whether heightened firm-level TPU impactsfirm-level outcomes:
log(Ki ,t+k)− log(Ki ,t) = α+ β∆TPUi + γXi +ψREG +ψIND + εi
log(Ki,t+k)− log(Ki,t): Percent change in capital stocks for firm i fromt = 17Q4 to t + k where t + k denotes a quarter after 18Q4 (i.e.,t + k = {18Q4, 19Q1, 19Q2, 19Q3})
Benguria, Choi, Swenson, and Xu Anxiety or Pain? 2020.9.15 33 / 43

Empirical Analysis
Investment and TPU
Dependent Variable: ∆log(Capital)(1) (2) (3) (4)
17Q4-18Q4 17Q4-19Q1 17Q4-19Q2 17Q4-19Q3
∆TPU (17Q4-18Q4) -0.034** -0.034* -0.040** -0.048**(0.017) (0.019) (0.020) (0.024)
Firm Characteristics Yes Yes Yes YesRegion FE Yes Yes Yes YesIndustry FE Yes Yes Yes YesObservations 2,134 2,135 2,131 2,121R-squared 0.109 0.113 0.111 0.113
Benguria, Choi, Swenson, and Xu Anxiety or Pain? 2020.9.15 34 / 43

Empirical Analysis
R&D and TPU
Dependent Variable: ∆log(R&D) (2017-2018)(1) (2) (3) (4) (5) (6)
∆TPU -0.039 -0.034 -0.048* -0.052* -0.049* -0.063**(17Q4-18Q4) (0.028) (0.027) (0.025) (0.030) (0.028) (0.025)
log(R&D)2017 -0.130*** -0.254*** -0.150*** -0.326***(0.030) (0.053) (0.033) (0.058)
Firm Characteristics No No Yes No No YesRegion FE Yes Yes Yes Yes Yes YesIndustry FE No No No Yes Yes YesObservations 2,032 2,032 2,004 2,019 2,019 1,993R-squared 0.019 0.083 0.160 0.069 0.145 0.260
Benguria, Choi, Swenson, and Xu Anxiety or Pain? 2020.9.15 35 / 43

Empirical Analysis
Profits and TPU
Dependent Variable: ∆Profit17Q4-18Q4 17Q4-19Q1 17Q4-19Q2 17Q4-19Q3
(1) (2) (3) (4)
∆TPU -24.571 -9.609 -19.786* -25.915*(17Q4-18Q4) (16.381) (11.278) (10.503) (13.598)
Firm Characteristics Yes Yes Yes YesRegion FE Yes Yes Yes YesIndustry FE Yes Yes Yes YesObservations 2,135 2,135 2,131 2,121R-squared 0.142 0.269 0.191 0.251
Benguria, Choi, Swenson, and Xu Anxiety or Pain? 2020.9.15 36 / 43

Empirical Analysis
The Direct Impacts of Tariffs on Economic Outcomes
Rising U.S. tariffs and Chinese retaliatory tariffs could also havenegatively affected Chinese firms directly, by reducing demand forChinese exports or increasing the cost of imported inputs.
If so, the previous estimates of the TPU channel might becompounded with the direct impacts of tariffs.
log(Ki ,t+k)− log(Ki ,t) = α + β1∆TPUi
+ β2∆log(1 + TariffU.S.i )
+ β3∆log(1 + TariffCHNi )
+ γXi + ψREG + ψIND + εi
Benguria, Choi, Swenson, and Xu Anxiety or Pain? 2020.9.15 37 / 43
Empirical Analysis
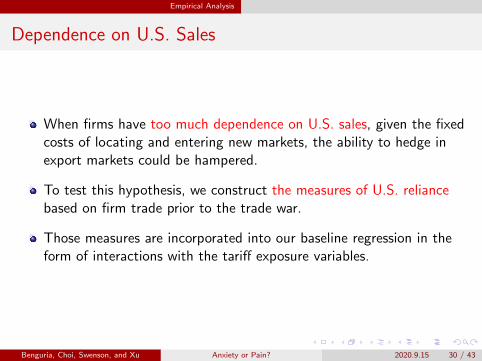
Investment, Trade Policy Uncertainty, and Tariffs
Dependent Variable: ∆log(Capital)17Q4-18Q4 17Q4-19Q1 17Q4-19Q2 17Q4-19Q3
(1) (2) (3) (4)
∆TPU -0.036** -0.035* -0.042** -0.050**(17Q4-18Q4) (0.017) (0.019) (0.020) (0.025)
∆log(1+TariffU.S.) 0.090 0.054 0.111 0.163(17Q4-18Q4) (0.086) (0.093) (0.100) (0.114)∆log(1+TariffCHN) 0.176 0.161 0.196 0.237(17Q4-18Q4) (0.163) (0.175) (0.190) (0.208)
Firm Characteristics Yes Yes Yes YesRegion FE Yes Yes Yes YesIndustry FE Yes Yes Yes YesObservations 2,134 2,135 2,131 2,121R-squared 0.110 0.113 0.112 0.115
Benguria, Choi, Swenson, and Xu Anxiety or Pain? 2020.9.15 38 / 43

Empirical Analysis
Profit, Trade Policy Uncertainty, and Tariffs
Dependent Variable: ∆Profit17Q4-18Q4 17Q4-19Q1 17Q4-19Q2 17Q4-19Q3
(1) (2) (3) (4)
∆TPU -26.079 -8.624 -18.182* -25.154*(17Q4-18Q4) (16.391) (11.352) (10.597) (13.807)
∆log(1+TariffU.S.) 102.150 -38.250 -93.622 -4.881(17Q4-18Q4) (122.952) (79.449) (86.981) (79.447)∆log(1+TariffCHN) 194.837 -159.796 -221.017 -145.197(17Q4-18Q4) (211.802) (147.866) (188.854) (158.522)
Firm Characteristics Yes Yes Yes YesRegion FE Yes Yes Yes YesIndustry FE Yes Yes Yes YesObservations 2,135 2,135 2,131 2,121R-squared 0.143 0.270 0.191 0.252
Benguria, Choi, Swenson, and Xu Anxiety or Pain? 2020.9.15 39 / 43

Empirical Analysis
Discussion
1 First, the average ratio of exports to the U.S. to total sales forChinese listed firms in the sample is about 1.7 percent in 2016according to Chinese customs data and COMPUSTAT Global data.
2 A second explanation is that a third country may have been chosen byChinese exporters as re-routing locations.
3 Lastly, trade diversification can help mitigate the negative impacts oftariffs.
Benguria, Choi, Swenson, and Xu Anxiety or Pain? 2020.9.15 40 / 43

Empirical Analysis
Robustness Checks
1 To the extent that some Chinese firms are focused on serving thedomestic market, while others are more heavily involved in exporting,we explore if our main results change according to firm orientation.
2 We test whether firms that are in a better financial positionexperience less concern about TPU.
3 We explore specifications with different fixed effects and differentclustering method.
Benguria, Choi, Swenson, and Xu Anxiety or Pain? 2020.9.15 41 / 43

Conclusion
Conclusion
Benguria, Choi, Swenson, and Xu Anxiety or Pain? 2020.9.15 42 / 43

Conclusion
Conclusion
Key messages:
(What we do) Explore the sources and consequences of TPU during theongoing U.S.-China trade war.
(Takeaway I) While it has been generally acknowledged that TPU musthave played a role in the trade war (IMF, 2018), there is littleunderstanding of how does the process work, the magnitude of thischannel, and which firms are more exposed to it.
We move one step in this direction and show that the increases infirm-level TPU seen during this period are systematically associated toexposure to both U.S. tariffs and Chinese tariffs.
(Takeaway II) Document the negative consequences of the TPU spike onfirm investment, R&D expenditures and profits.
Overall, our work highlights the importance of the TPU channel duringthe ongoing U.S.-China trade war
Benguria, Choi, Swenson, and Xu Anxiety or Pain? 2020.9.15 43 / 43