Anticipating and addressing barriers to the communication of critical information Ellen Peters,...
44
Anticipating and addressing barriers to the communication of critical information Ellen Peters, Ph.D. Decision Research Eugene, OR
-
Upload
jasmin-dora-melton -
Category
Documents
-
view
214 -
download
1
Transcript of Anticipating and addressing barriers to the communication of critical information Ellen Peters,...
Anticipating and addressing barriers to the communication of critical information
Ellen Peters, Ph.D.Decision Research
Eugene, OR
Outline What is needed to make a good decision? Some barriers to effective communication of
critical information Addressing the barriers
2
3
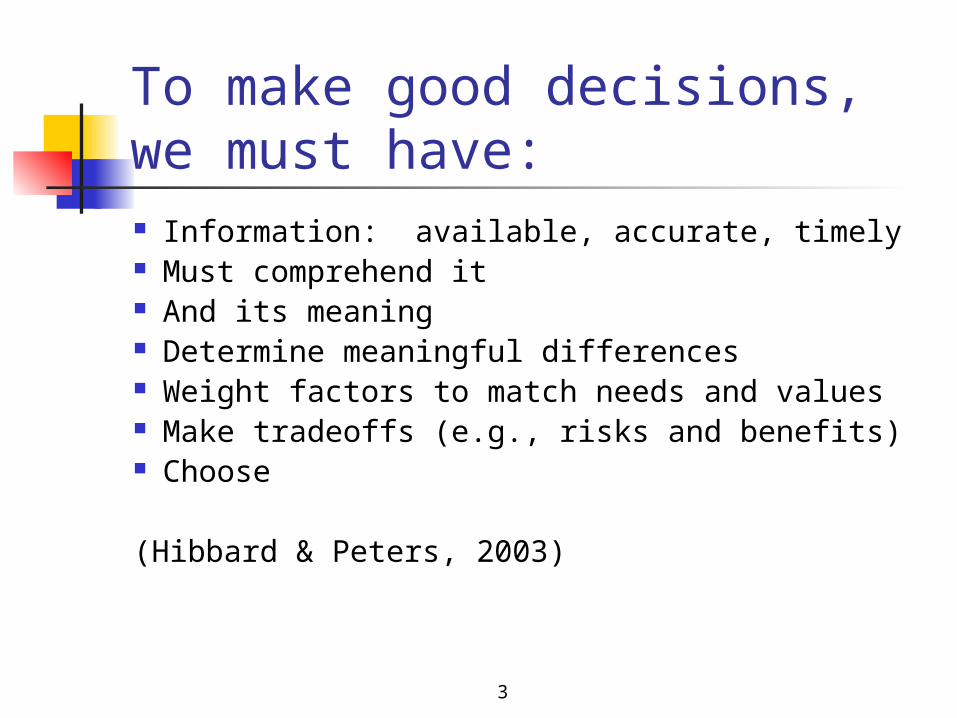
To make good decisions, we must have: Information: available, accurate, timely Must comprehend it And its meaning Determine meaningful differences Weight factors to match needs and values Make tradeoffs (e.g., risks and benefits) Choose
(Hibbard & Peters, 2003)
4
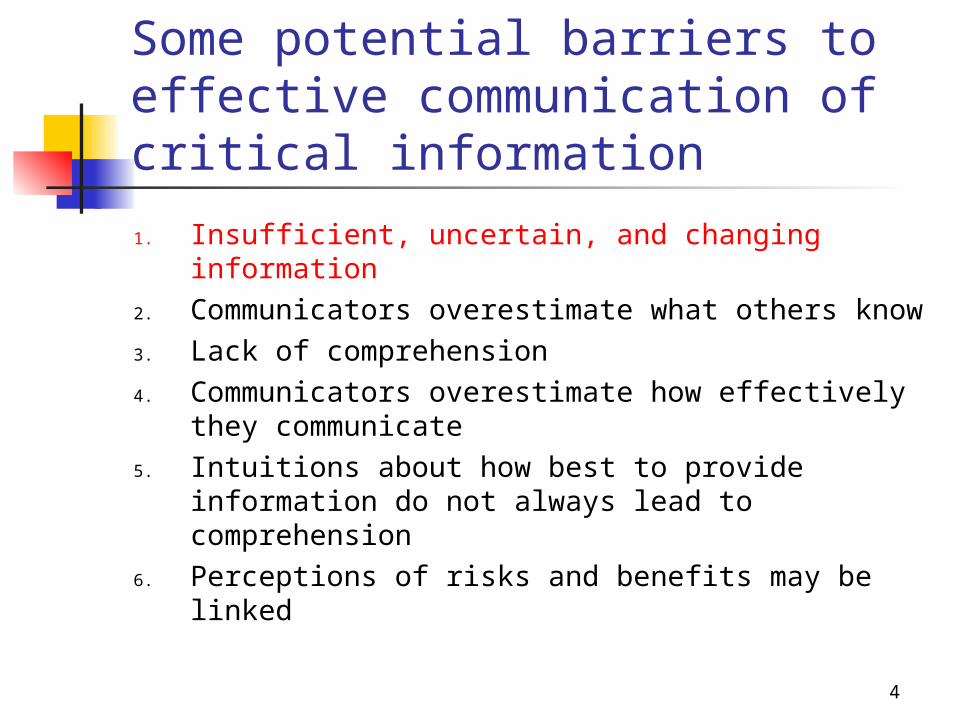
Some potential barriers to effective communication of critical information
1. Insufficient, uncertain, and changing information2. Communicators overestimate what others know3. Lack of comprehension4. Communicators overestimate how effectively
they communicate5. Intuitions about how best to provide information
do not always lead to comprehension6. Perceptions of risks and benefits may be linked
5
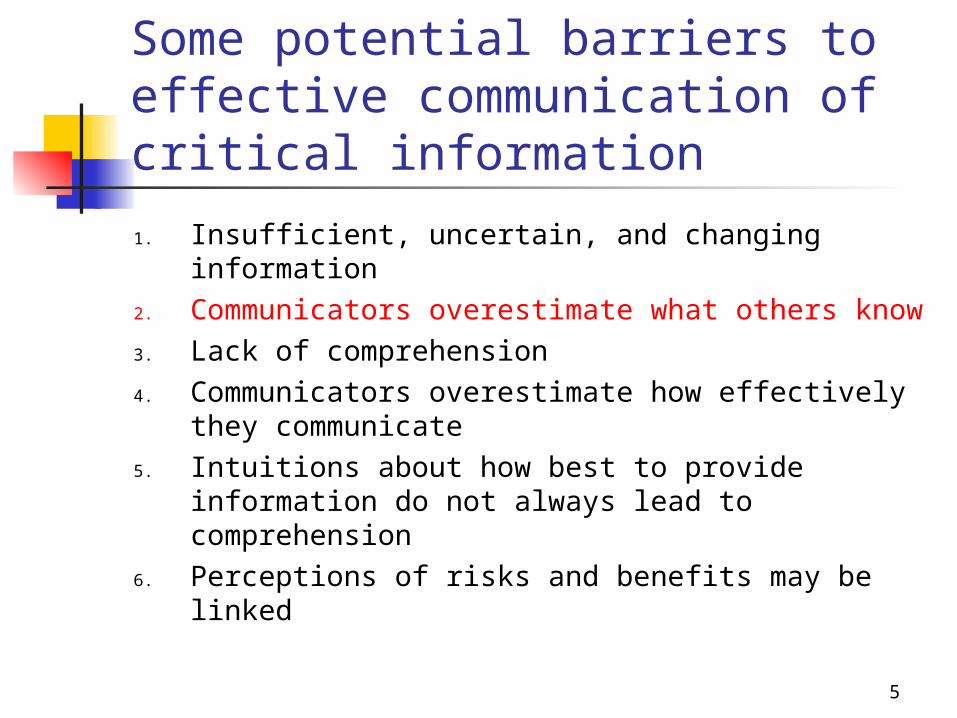
Some potential barriers to effective communication of critical information
1. Insufficient, uncertain, and changing information2. Communicators overestimate what others know3. Lack of comprehension4. Communicators overestimate how effectively
they communicate5. Intuitions about how best to provide information
do not always lead to comprehension6. Perceptions of risks and benefits may be linked
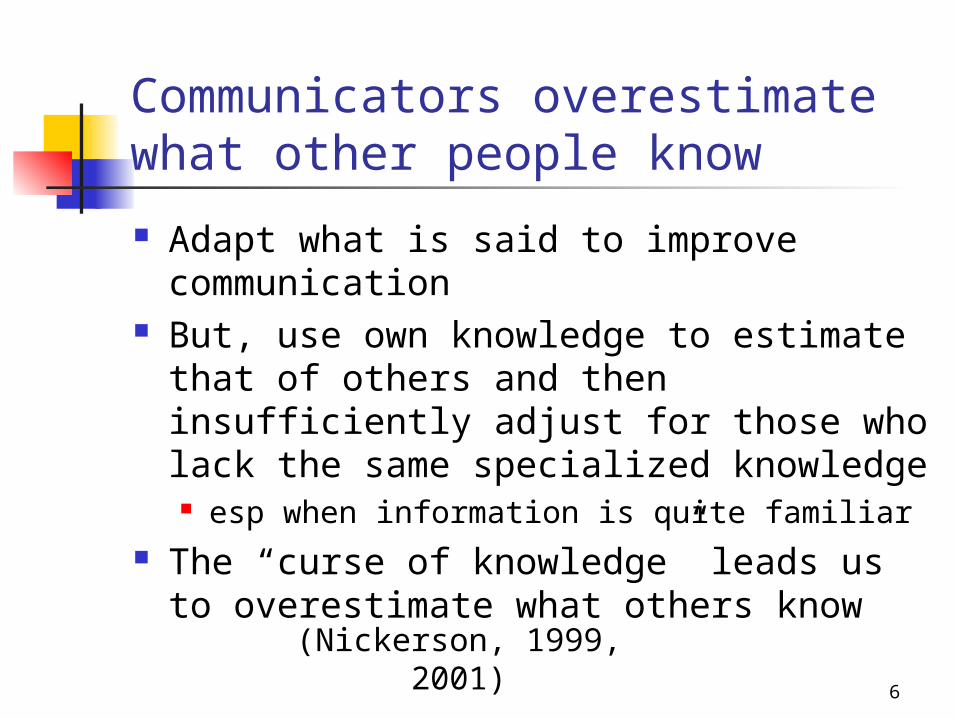
Communicators overestimate what other people know
Adapt what is said to improve communication
But, use own knowledge to estimate that of others and then insufficiently adjust for those who lack the same specialized knowledge esp when information is quite familiar
The “curse of knowledge” leads us to overestimate what others know
6
(Nickerson, 1999, 2001)
7
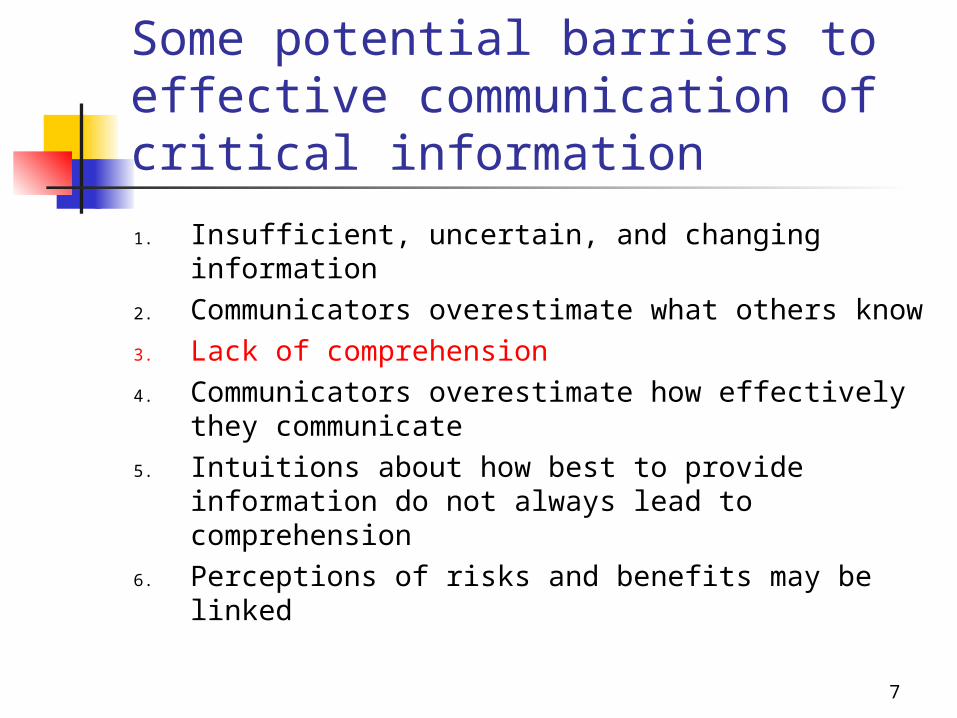
Some potential barriers to effective communication of critical information
1. Insufficient, uncertain, and changing information2. Communicators overestimate what others know3. Lack of comprehension4. Communicators overestimate how effectively
they communicate5. Intuitions about how best to provide information
do not always lead to comprehension6. Perceptions of risks and benefits may be linked
8
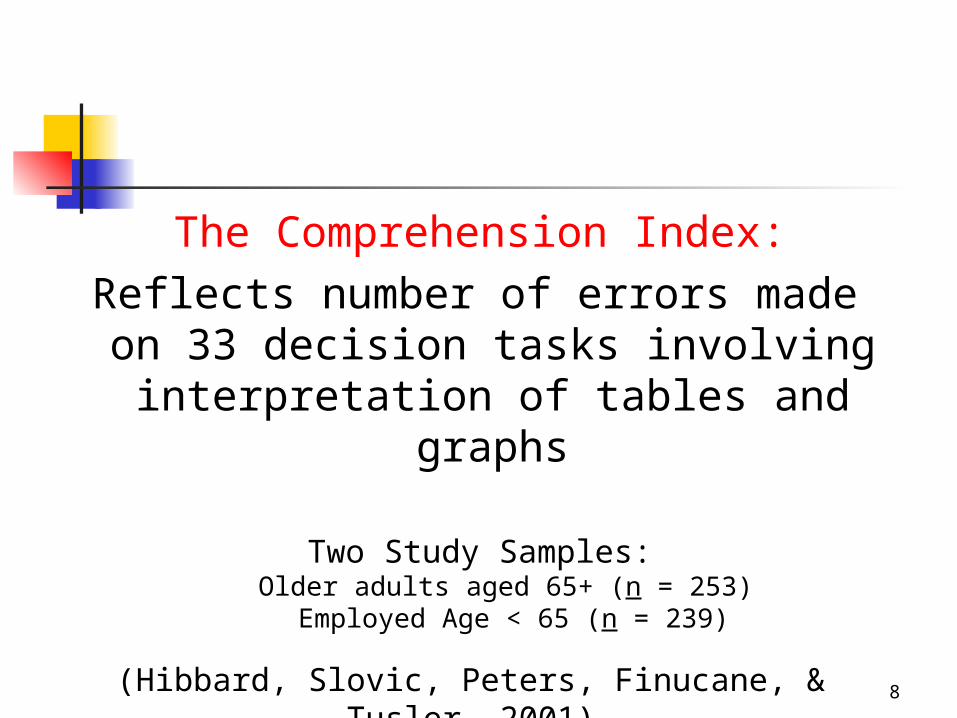
The Comprehension Index: Reflects number of errors made on 33
decision tasks involving interpretation of tables and graphs
Two Study Samples: Older adults aged 65+ (n = 253)
Employed Age < 65 (n = 239)
(Hibbard, Slovic, Peters, Finucane, & Tusler, 2001)
9
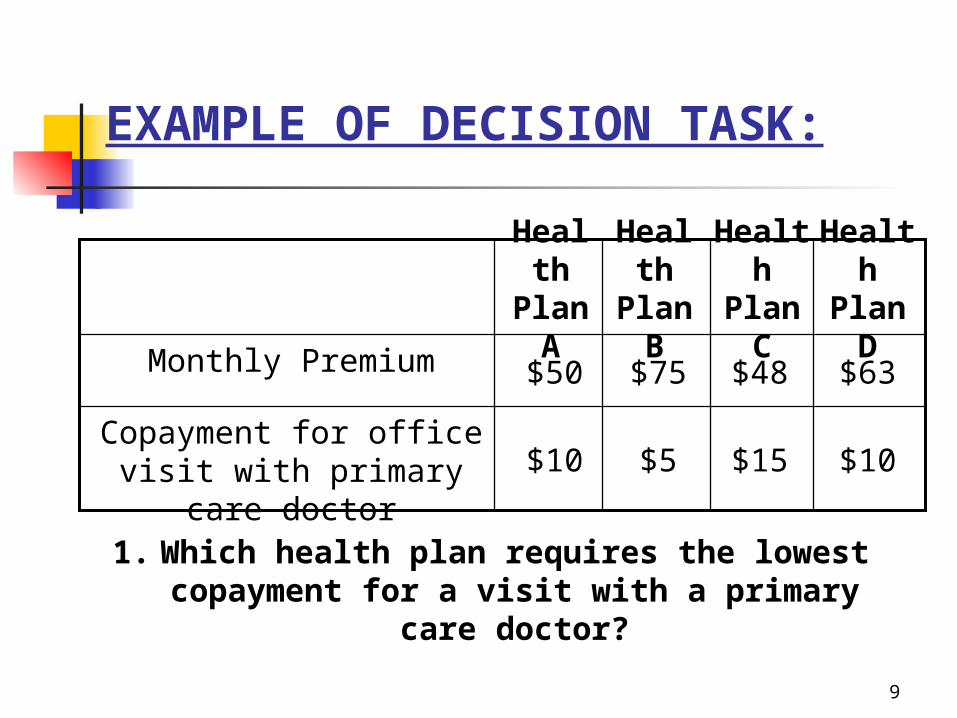
EXAMPLE OF DECISION TASK:
$10$15$5$10Copayment for office visit with
primary care doctor
$63$48$75$50Monthly Premium
Health Plan D
Health Plan C
Health Plan B
Health Plan
A
1. Which health plan requires the lowest copayment for a visit with a primary care doctor?
10
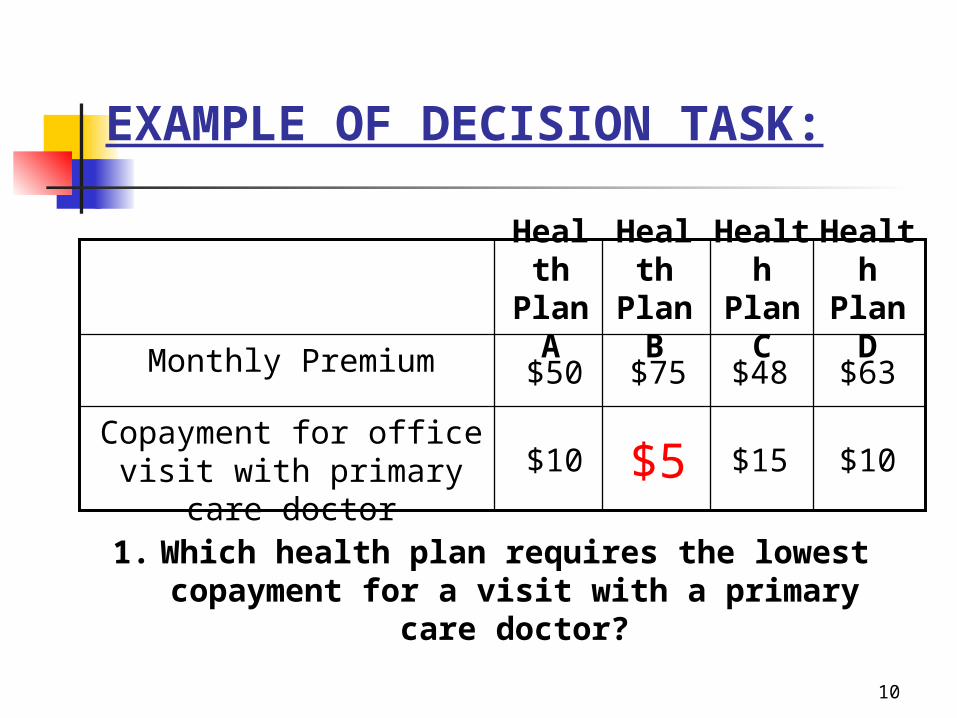
EXAMPLE OF DECISION TASK:
$10$15$5$10Copayment for office visit with
primary care doctor
$63$48$75$50Monthly Premium
Health Plan D
Health Plan C
Health Plan B
Health Plan
A
1. Which health plan requires the lowest copayment for a visit with a primary care doctor?
11
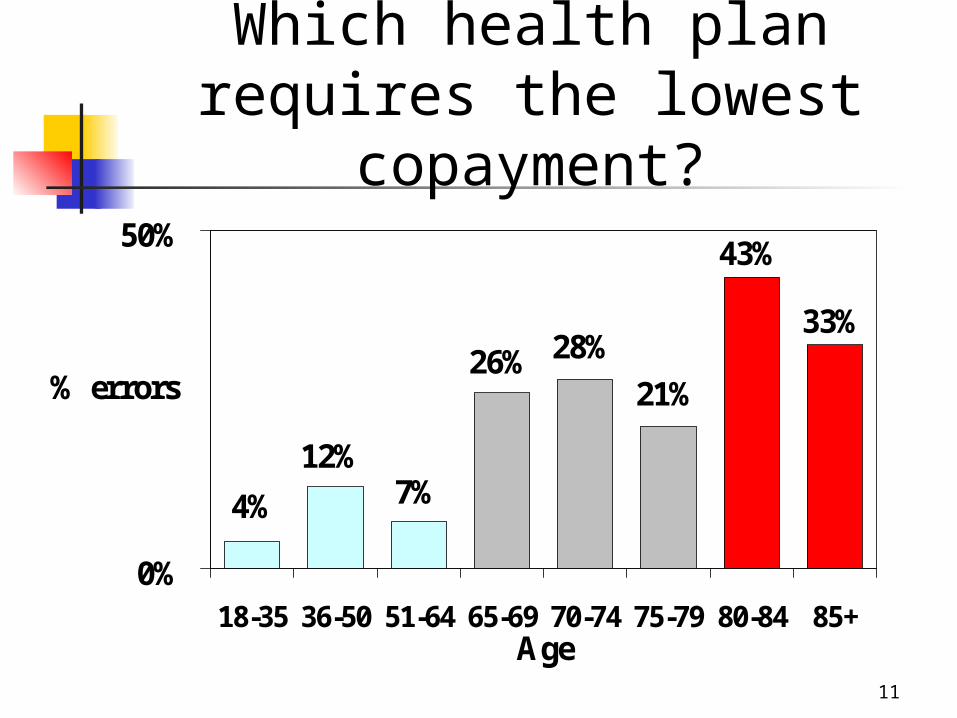
Which health plan requires the lowest
copayment?43%
33%28%26%
7%12%
4%
21%
0%
50%
18-35 36-50 51-64 65-69 70-74 75-79 80-84 85+Age
% errors
12
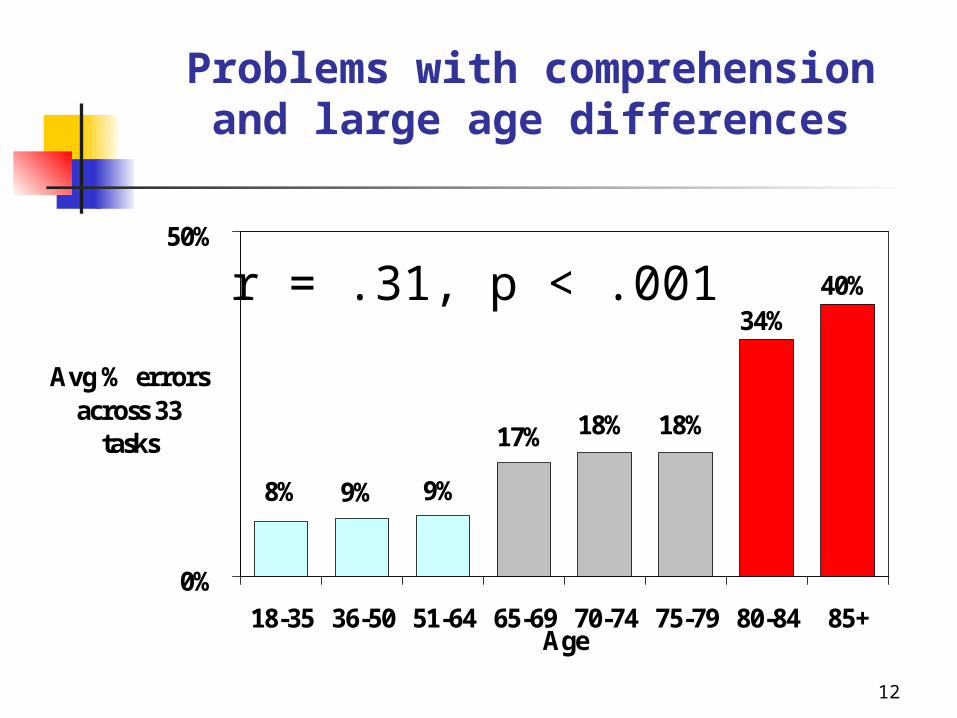
Problems with comprehension and large age differences
34%40%
18%17%
9%9%8%
18%
0%
50%
18-35 36-50 51-64 65-69 70-74 75-79 80-84 85+Age
Avg % errors across 33
tasks
r = .31, p < .001
13
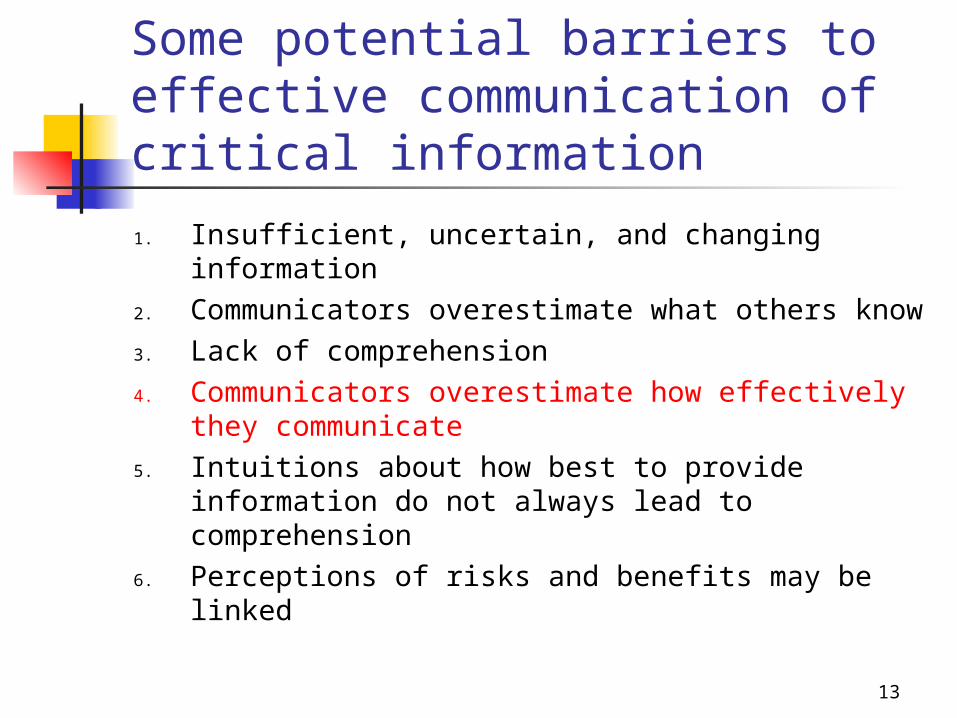
Some potential barriers to effective communication of critical information
1. Insufficient, uncertain, and changing information2. Communicators overestimate what others know3. Lack of comprehension4. Communicators overestimate how effectively
they communicate5. Intuitions about how best to provide information
do not always lead to comprehension6. Perceptions of risks and benefits may be linked
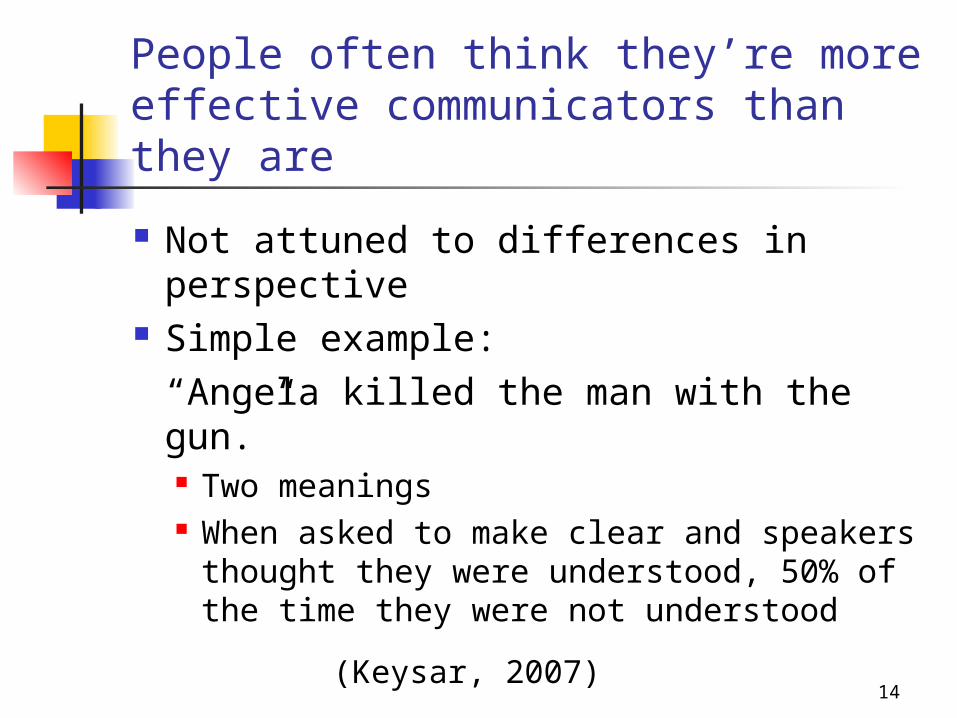
People often think they’re more effective communicators than they are
Not attuned to differences in perspective
Simple example: “Angela killed the man with the gun.” Two meanings When asked to make clear and speakers
thought they were understood, 50% of the time they were not understood
14(Keysar, 2007)
15
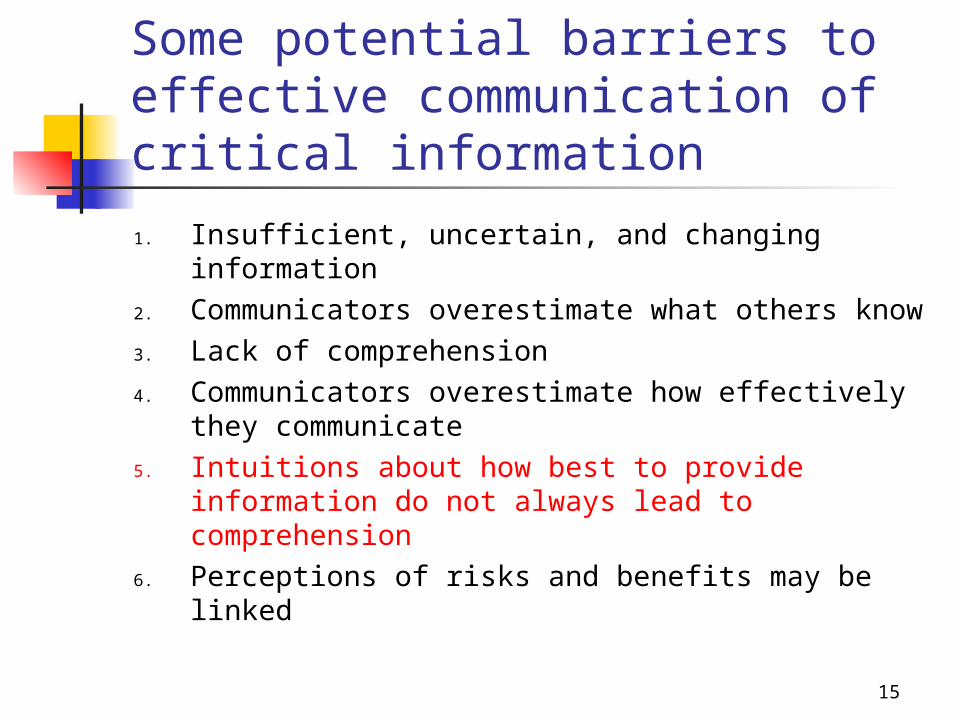
Some potential barriers to effective communication of critical information
1. Insufficient, uncertain, and changing information2. Communicators overestimate what others know3. Lack of comprehension4. Communicators overestimate how effectively
they communicate5. Intuitions about how best to provide information
do not always lead to comprehension6. Perceptions of risks and benefits may be linked
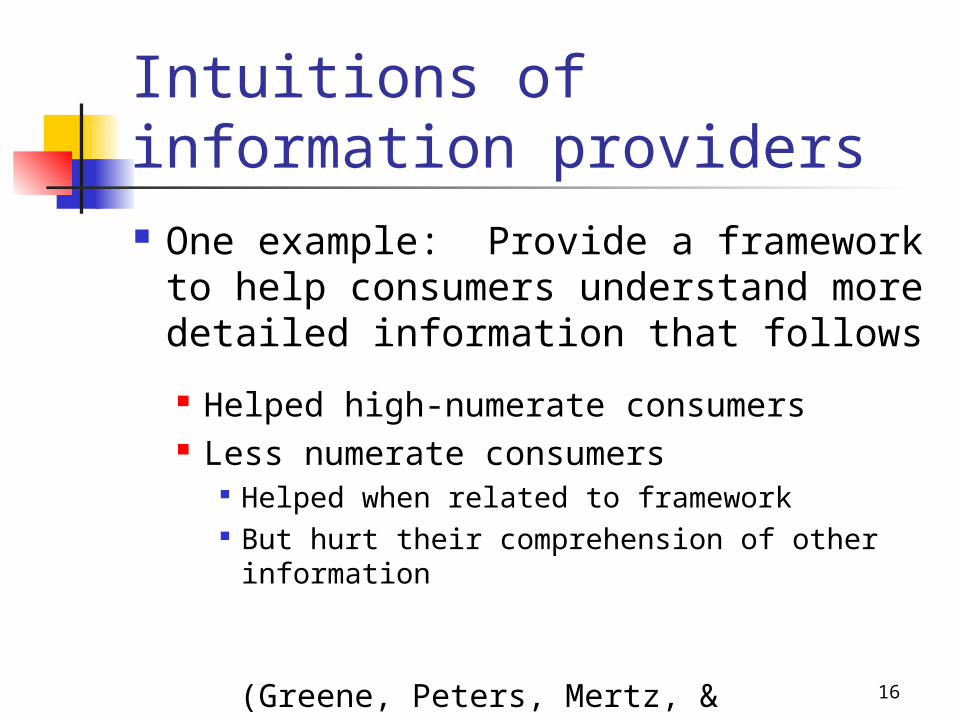
Intuitions of information providers One example: Provide a framework
to help consumers understand more detailed information that follows
Helped high-numerate consumers Less numerate consumers
Helped when related to framework But hurt their comprehension of other
information
16(Greene, Peters, Mertz, & Hibbard, 2008)
17
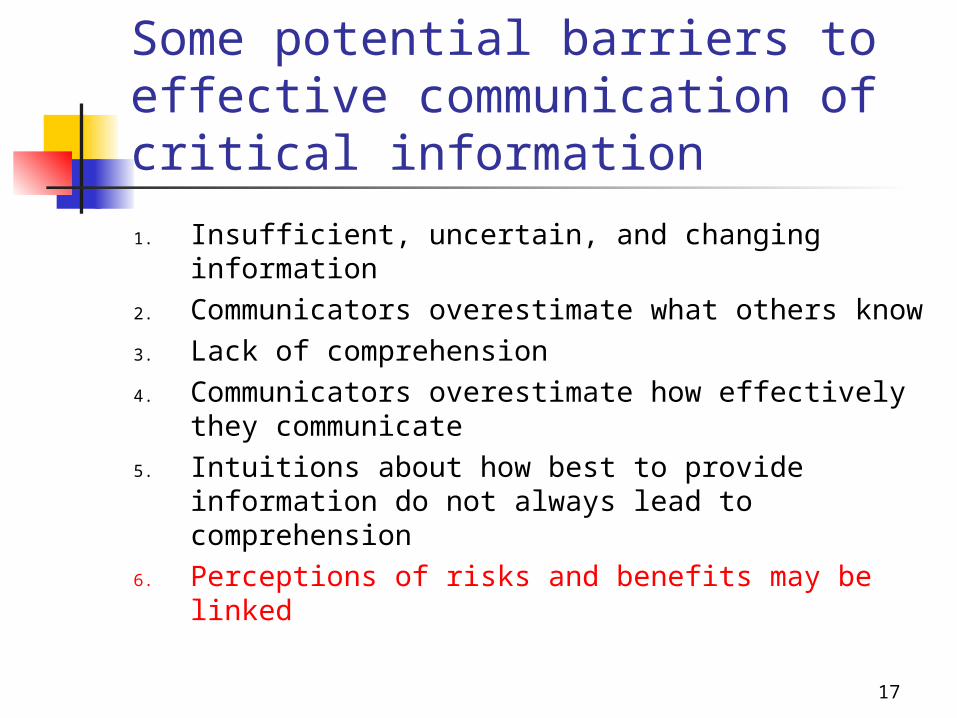
Some potential barriers to effective communication of critical information
1. Insufficient, uncertain, and changing information2. Communicators overestimate what others know3. Lack of comprehension4. Communicators overestimate how effectively
they communicate5. Intuitions about how best to provide information
do not always lead to comprehension6. Perceptions of risks and benefits may be linked
18
Low H ighBenefit
High
Low
Risk
Activ it ies,hazards, e tc.
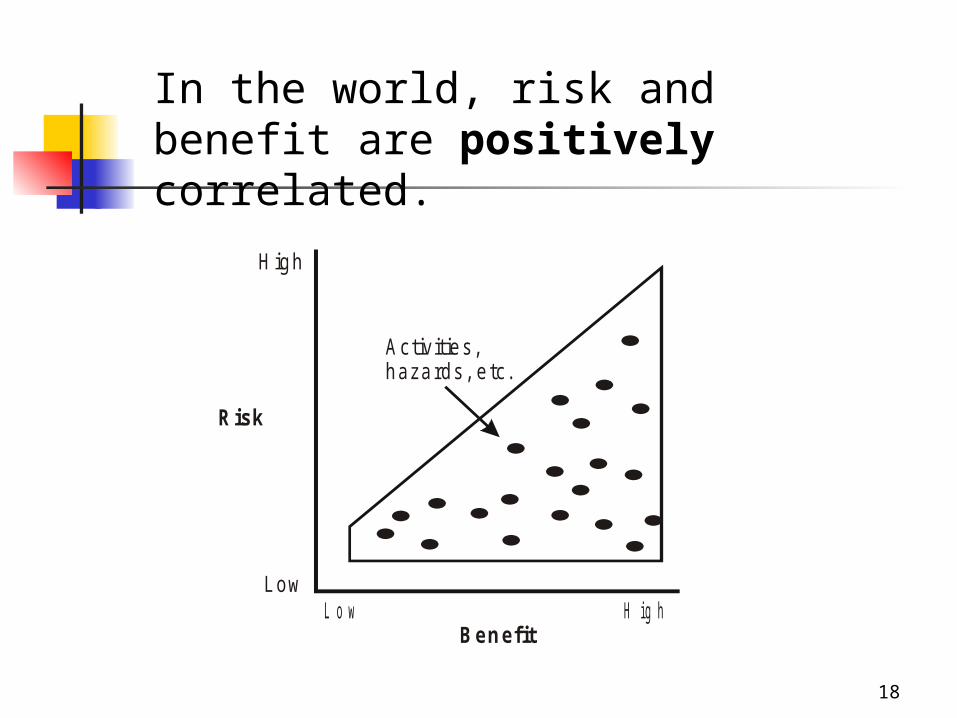
In the world, risk and benefit are positively correlated.
19
Low H ighBenefit
High
Low
Risk
Activ it ies,hazards, e tc.
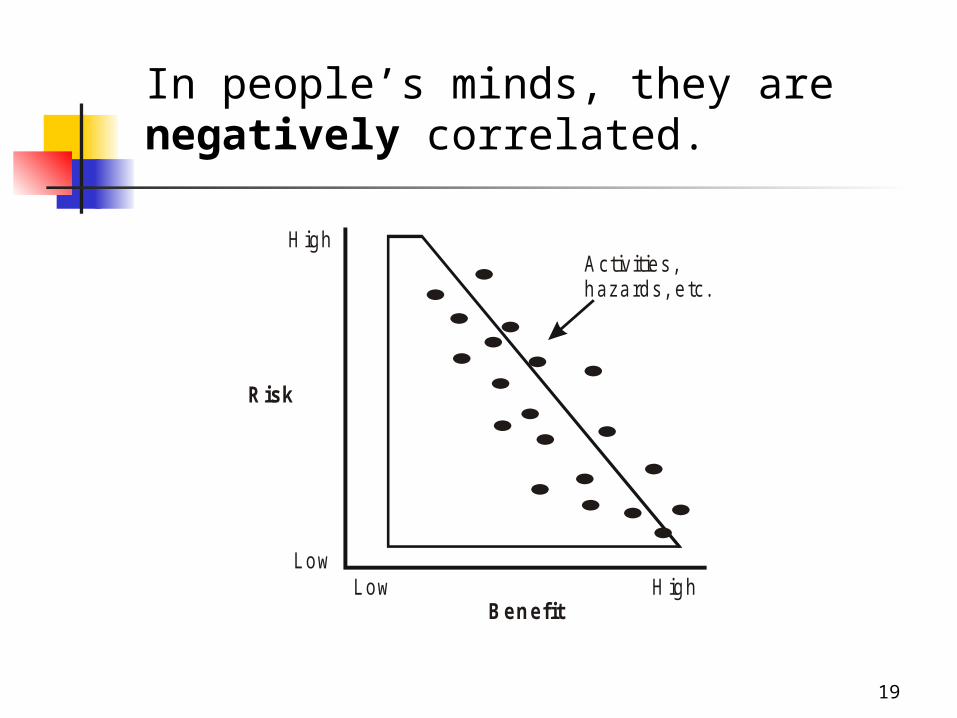
In people’s minds, they are negatively correlated.
20
The strength of the inverse (negative) relationship between risk
and benefit judgments for a particular hazard or consumer good
depends on its affect:how good or bad it feels.
21
54321
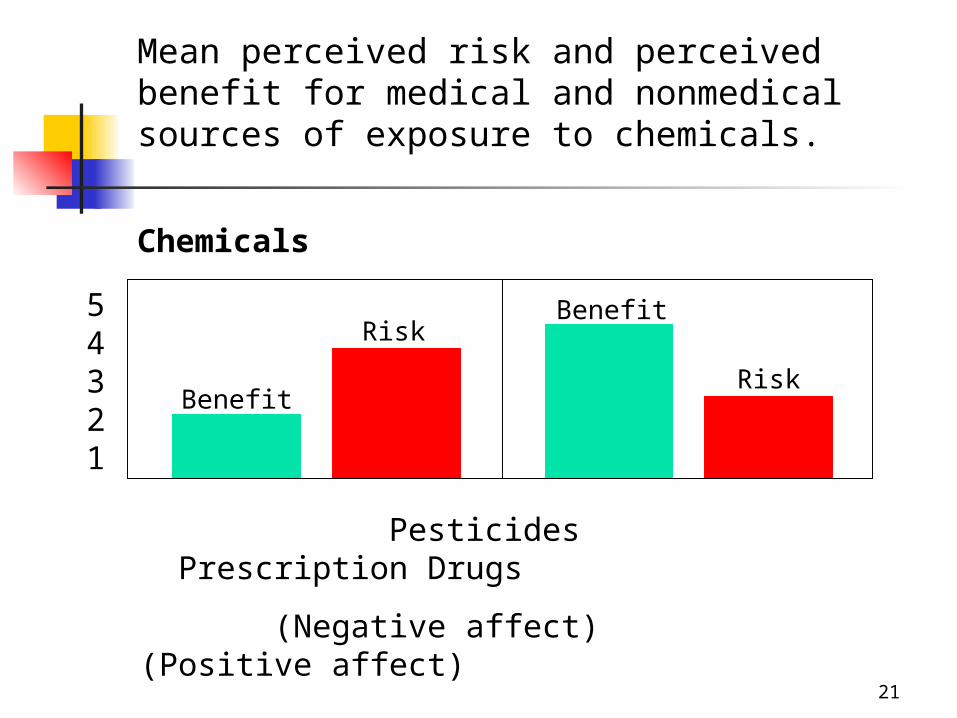
Chemicals
Pesticides Prescription Drugs
(Negative affect) (Positive affect)
Mean perceived risk and perceived benefit for medical and nonmedical sources of exposure to chemicals.
Benefit
Benefit
Risk
Risk
22
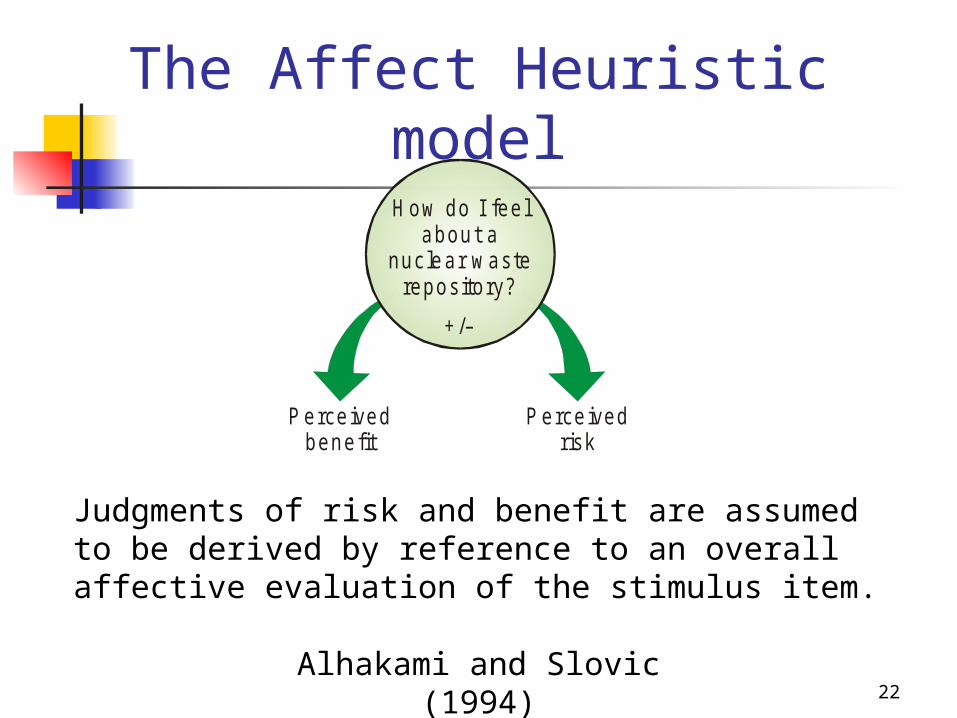
Perceivedbenefit
Perceivedrisk
How do I feel about a
nuclear waste repository?
+/–
Judgments of risk and benefit are assumed to be derived by reference to an overall affective evaluation of the stimulus item.
The Affect Heuristic model
Alhakami and Slovic (1994)
23
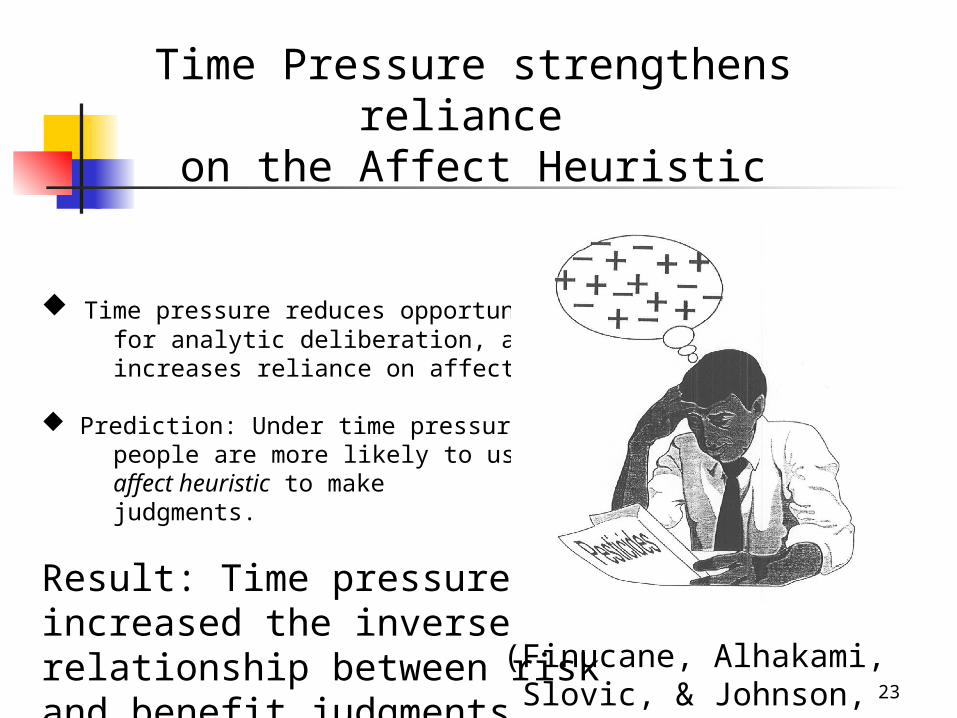
Time Pressure strengthens reliance on the Affect Heuristic
Time pressure reduces opportunity for analytic deliberation, and increases reliance on affect
Prediction: Under time pressure people are more likely to use the affect heuristic to make judgments.
Result: Time pressureincreased the inverse relationship between risk and benefit judgments. (Finucane, Alhakami,
Slovic, & Johnson, 2000)
24
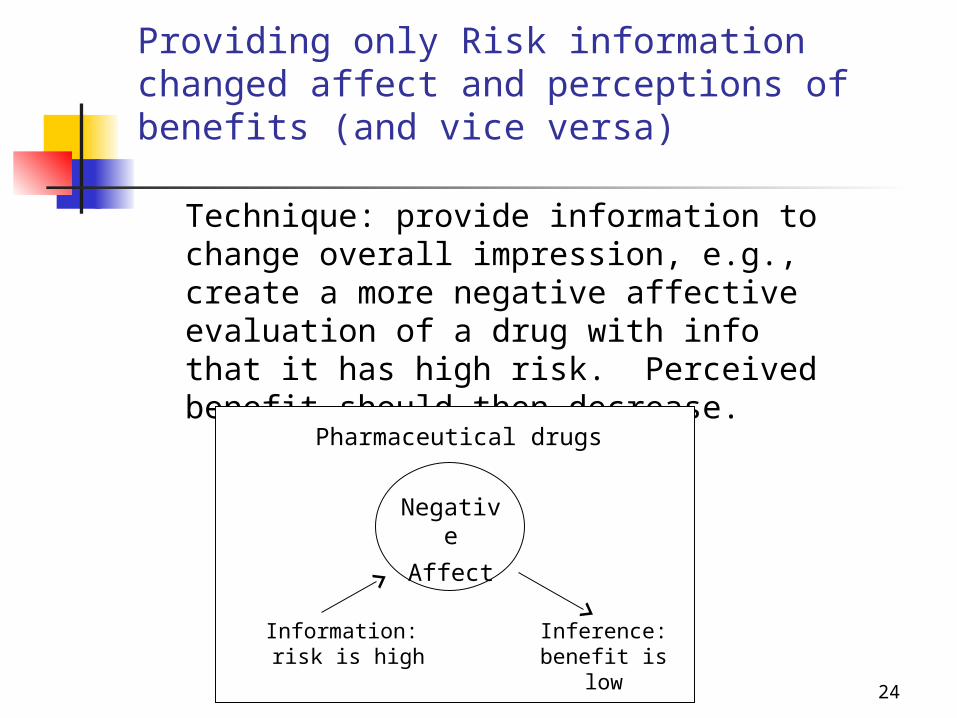
Providing only Risk information changed affect and perceptions of benefits (and vice versa)
Technique: provide information to change overall impression, e.g., create a more negative affective evaluation of a drug with info that it has high risk. Perceived benefit should then decrease.
Negative
Affect
Information: risk is high
Inference: benefit is low
Pharmaceutical drugs
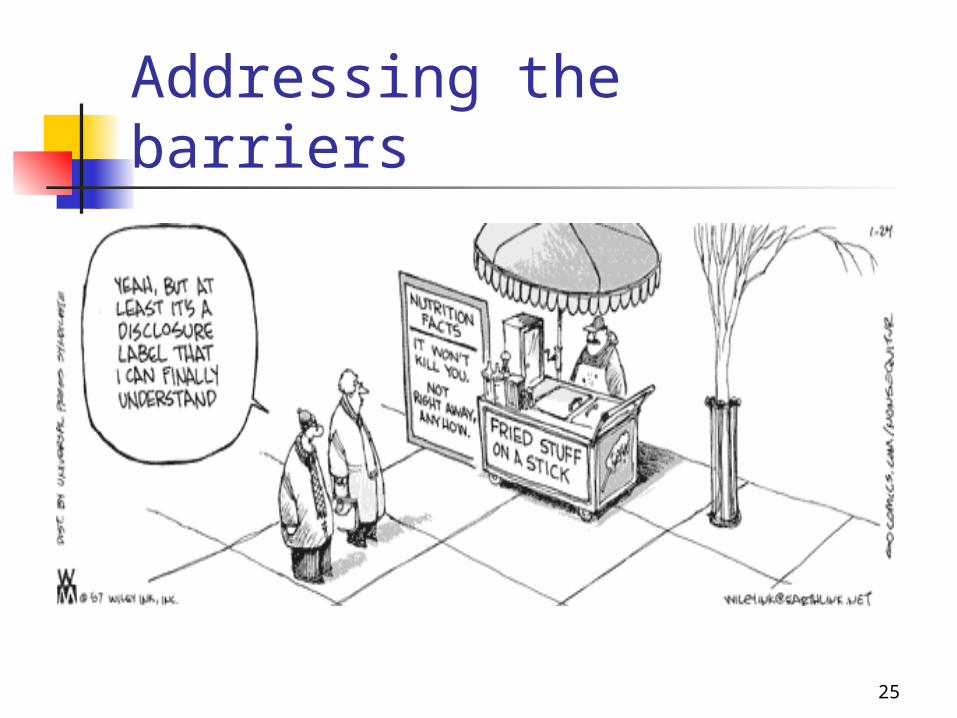
Addressing the barriers
25
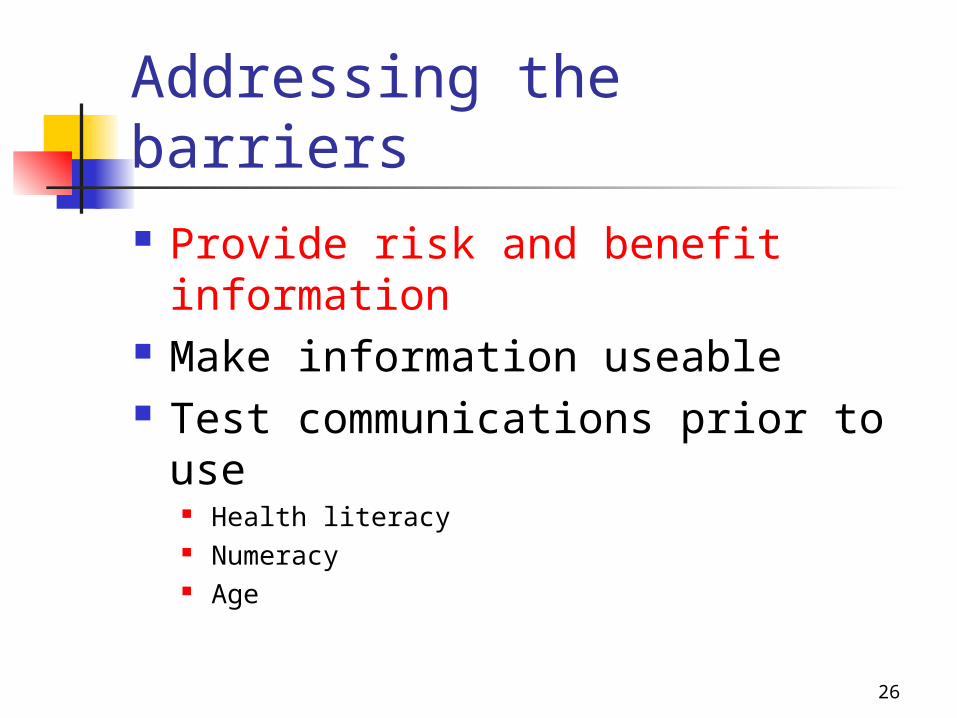
Addressing the barriers Provide risk and benefit
information Make information useable Test communications prior to use
Health literacy Numeracy Age
26
27
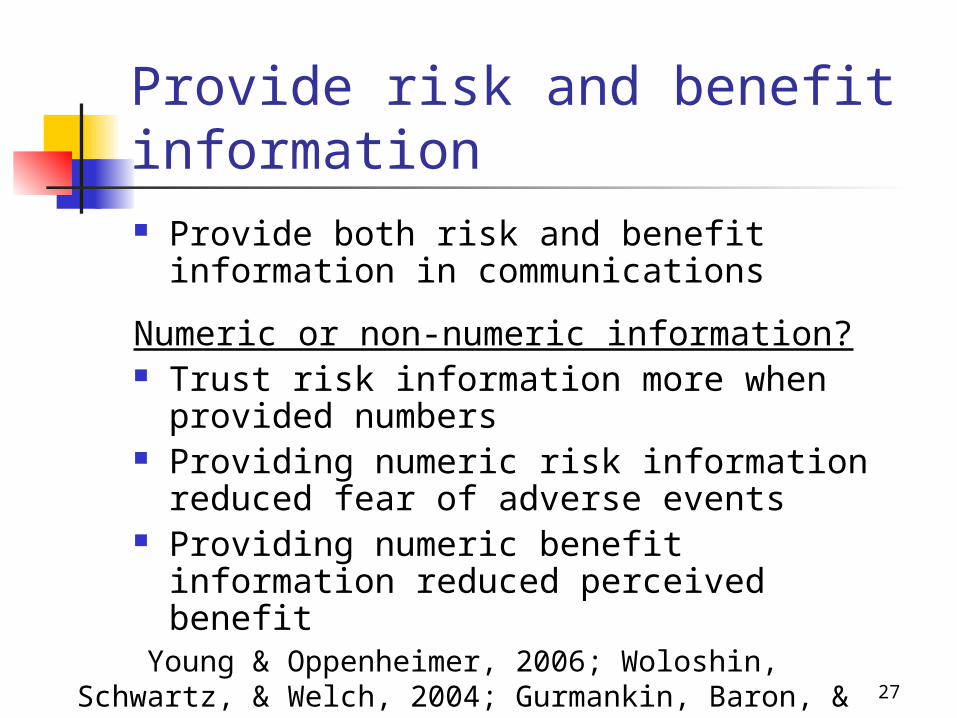
Provide risk and benefit information Provide both risk and benefit information in
communications
Numeric or non-numeric information? Trust risk information more when provided
numbers Providing numeric risk information reduced
fear of adverse events Providing numeric benefit information
reduced perceived benefit
Young & Oppenheimer, 2006; Woloshin, Schwartz, & Welch, 2004; Gurmankin, Baron, & Armstrong, 2004)
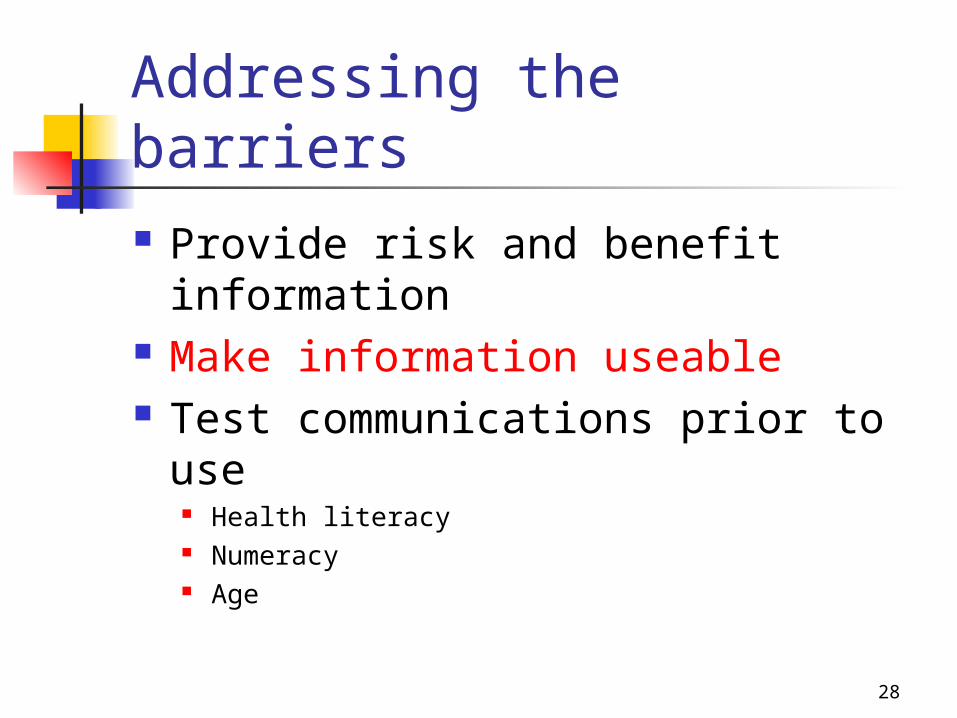
Addressing the barriers Provide risk and benefit
information Make information useable Test communications prior to use
Health literacy Numeracy Age
28
29
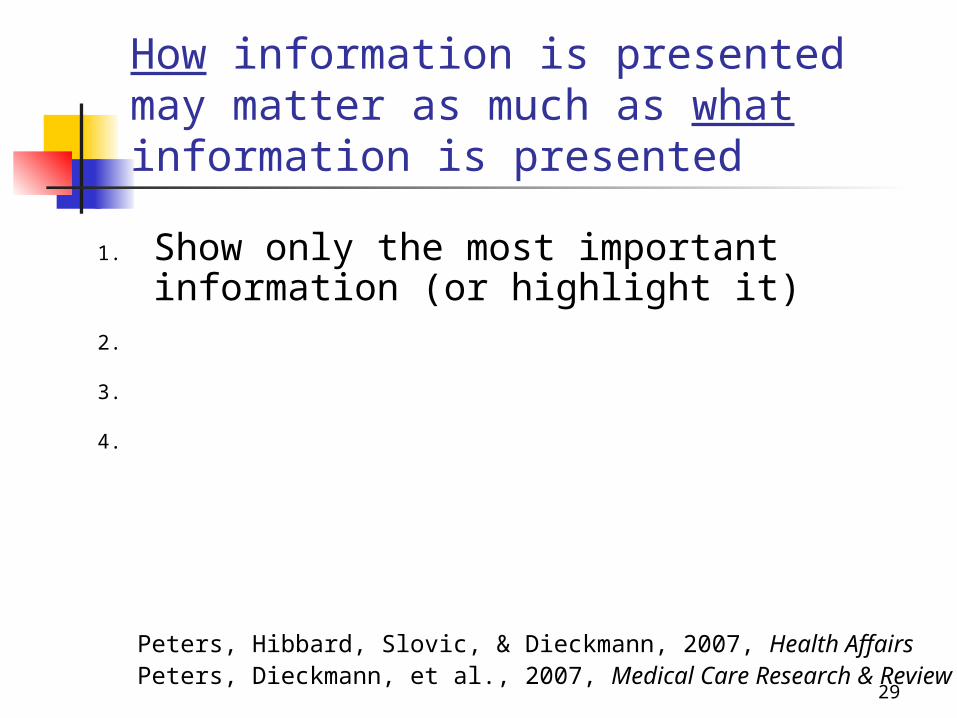
How information is presented may matter as much as what information is presented
1. Show only the most important information (or highlight it)
2. 3. 4.
Peters, Hibbard, Slovic, & Dieckmann, 2007, Health AffairsPeters, Dieckmann, et al., 2007, Medical Care Research & Review
30
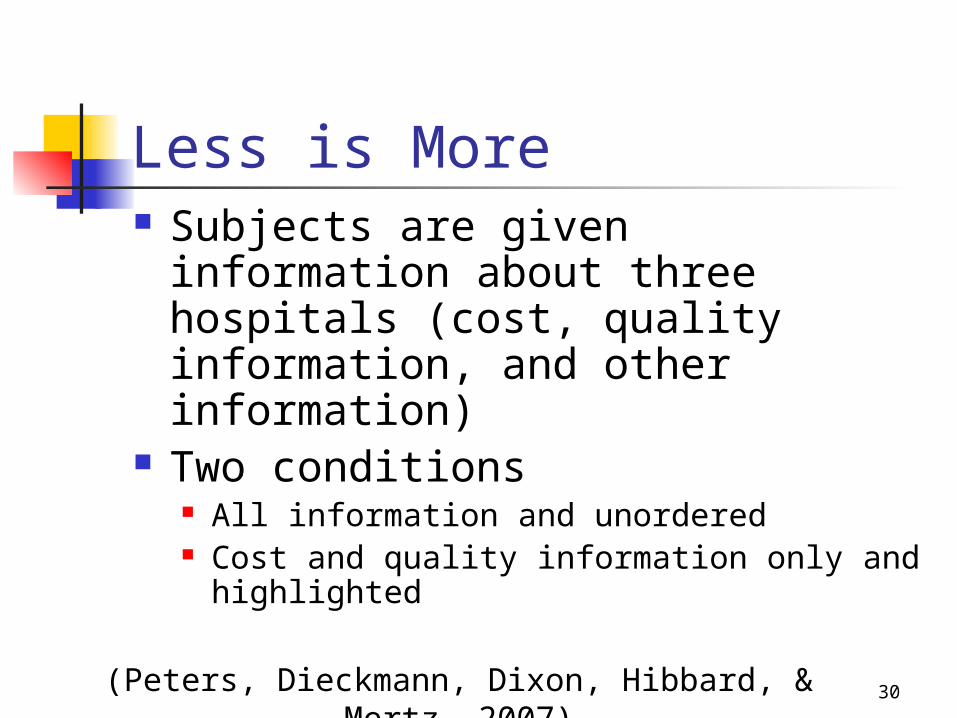
Less is More Subjects are given information
about three hospitals (cost, quality information, and other information)
Two conditions All information and unordered Cost and quality information only and
highlighted
(Peters, Dieckmann, Dixon, Hibbard, & Mertz, 2007)

31
Condition = Unordered, all information
IndicatorsHospita
l XHospita
l YHospit
al Z
Your out-of-pocket costsNumber of general care bedsRated quality of hospital food (higher is better)
$5504.1
$$$2311.1
$$1802.0
% of time guidelines for heart attack care are followed% of time guidelines for pneumonia care are followedNumber of visiting hours per day
82%60%11
92%89%
6
87%78%
8
Number of Registered Nurses per 100 patientsPatient references availableHas computer system to prevent medication errors
18Limited
No
38Limited
Yes
29LimitedLimited
32
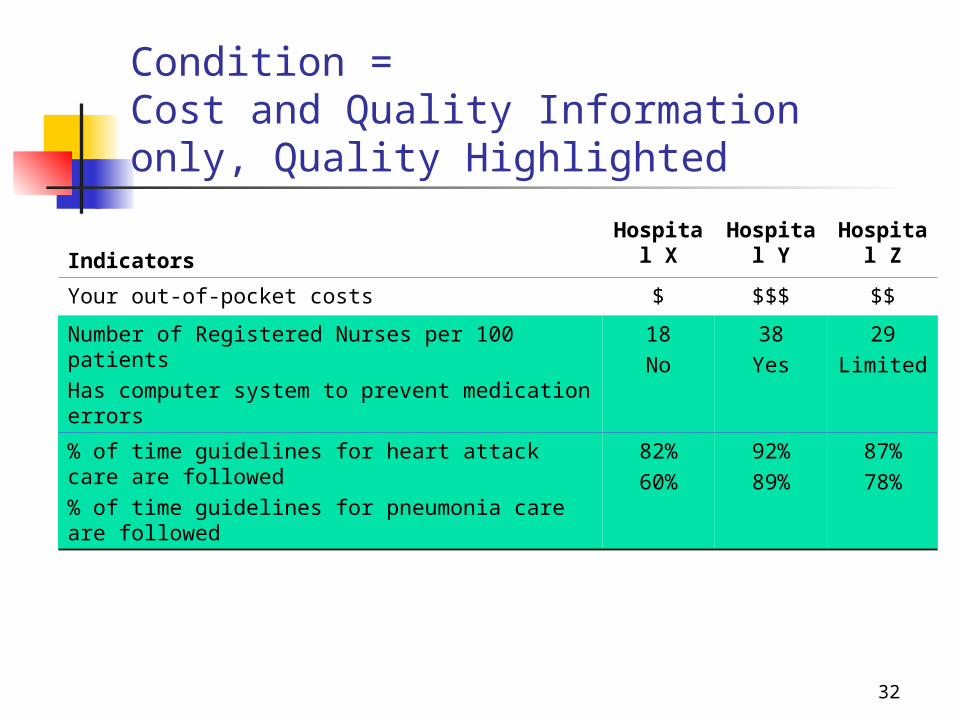
Condition = Cost and Quality Information only, Quality Highlighted
IndicatorsHospita
l XHospita
l YHospit
al Z
Your out-of-pocket costs $ $$$ $$
Number of Registered Nurses per 100 patientsHas computer system to prevent medication errors
18No
38Yes
29Limited
% of time guidelines for heart attack care are followed% of time guidelines for pneumonia care are followed
82%60%
92%89%
87%78%
33
Less is More: Hypotheses
1. Including less information will help comprehension.
2. This will be particularly true for those lower in numeracy
34
Dependent variable Comprehension
(Index = count of 3 items below) Which hospital is most expensive? Which hospital is most likely to follow
the guidelines for heart attack care? Which hospital has the least
Registered Nurses per 100 patients?

35
Including only the most relevant information helps comprehension the most in the less numerate
1.8
2.52.7
3.0
Unordered, allinfo
Cost and Qualityonly
Unordered, allinfo
Cost and Qualityonly
Less Numerate
More Numerate
# correct (out of 3)
36
How information is presented may matter as much as what information is presented
1. Show only the most important information (or highlight it)
2. Make those key points easier to evaluate (order, summarize, interpret information)
3. Require less cognitive effort and fewer inferences (e.g., do the math for them)
Peters, Hibbard, Slovic, & Dieckmann, 2007, Health AffairsPeters, Dieckmann, et al., 2007, Medical Care Research & Review

Addressing the barriers Provide risk and benefit
information Make information useable Test communications prior to use,
including in vulnerable populations Age Health literacy including numeracy
37
38
Conclusions I How information is presented influences
how well it is understood
This appears to be particularly true for less able individuals
Careful choices of information formats may promote wellness and reduce disparities
39
Conclusions II Risk and benefit information should be
communicated In a numeric format?
Communications should be tested
The science of communication exists and should be used as well as developed further by the FDA

Thank you !
40

1
References (pg 1 of 4) Alhakami, A. S., & Slovic, P. (1994). A psychological study of the inverse
relationship between perceived risk and perceived benefit. Risk Analysis, 14(6), 1085-1096.
Finucane, M. L., Alhakami, A., Slovic, P., & Johnson, S. M. (2000). The affect heuristic in judgments of risks and benefits. Journal of Behavioral Decision Making, 13(1), 1-17.
Greene, J., Peters, E., Mertz, C. K., & Hibbard, J. (2008). Comprehension and choice of a consumer-directed health plan: An experimental study. The American Journal of Managed Care, 14(6), 369-376.
Gurmankin, A. D., Baron, J., & Armstrong, K. (2004). The effect of numerical statements of risk on trust and comfort with hypothetical physician risk communication. Medical Decision Making, 24(3), 265-271.
Hawley, S. T., Zikmund-Fisher, B., Ubel, P., Jancovic, A., Lucas, T., & Fagerlin, A. (2008, in press). The impact of the format of graphical presentation on health-related knowledge and treatment choices. Patient Education & Counseling.
References (pg 2 of 4) Hibbard, J. H., & Peters, E. (2003). Supporting informed consumer
health care decisions: Data presentation approaches that facilitate the use of information in choice. Annual Review of Public Health, 24, 413-433.
Hibbard, J. H., Peters, E., Slovic, P., Finucane, M. L., & Tusler, M. (2001). Making health care quality reports easier to use. Journal of Quality Improvement, 27(11), 591-604.
Keysar, B. (2007). Communication and miscommunication: The role of egocentric processes. Intercultural Pragmatics, 4(1), 71-84.
Nelson, W., Reyna, V. F., Fagerlin, A., Lipkus, I., & , & Peters, E. (in press). Clinical implications of numeracy: Theory and practice. Annals of Behavioral Medicine.
Nickerson, R. S. (1999). How we know-and sometimes misjudge-what others know: Imputing one's own knowledge to others. Psychological Bulletin, 125(6), 737-759.
42
References (pg 3 of 4) Nickerson, R. S. (2001). The projective way of knowing: A useful
heuristic that sometimes misleads. Current Directions in Psychological Science, 10(5), 168-172.
Peters, E., Dieckmann, N., Dixon, A., Hibbard, J. H., & Mertz, C. K. (2007). Less is more in presenting quality information to consumers. Medical Care Research and Review, 64, 169-190.
Peters, E., Hess, T. M., Västfjäll, D., & , & Auman, C. (2007). Adult age differences in dual information processes: Implications for the role of affective and deliberative processes in older adults’ decision making. Perspectives on Psychological Science, 2, 1-23.
Peters, E., Hibbard, J. H., Slovic, P., & Dieckmann, N. (2007). Numeracy skill and the communication, comprehension, and use of risk-benefit information. Health Affairs, 26(3), 741-748.
Peters, E., Västfjäll, D., Slovic, P., Mertz, C. K., Mazzocco, K., & Dickert, S. (2006). Numeracy and decision making. Psychological Science, 17, 407-413.
43

References (pg 4 of 4) Woloshin, S., Schwartz, L. M., & Welch, H. G. (2004). The value of
benefit data in direct-to-consumer drug ads. Health Affairs, Supplemental Web Exclusives, W4-45.
Young, S., & Oppenheimer, D. (2006). Different methods of presenting risk information and their influence on medication compliance intentions: Results of three studies. Clinical Therapeutics, 28(1), 129-139.
44