PLASMID ISOLATION AND ANALYSIS Part II Plasmid Purification and Isolation.
Antibiotic-Regulated Plasmid Copy Number
Variation: A Driver of Antibiotic Resistance?
Ahmed Eldek
__________________________________________ Master Degree Project in infection biology, 30 credits. Spring 2019
Department: Department of Medical Biochemistry and Microbiology
Supervisor: Hervé Nicoloff
Co-supervisor: Karin Hjort

UPPSALA UNIVERSITET Master thesis 2 (26)
Abstract
Plasmids are small circular DNA molecules within bacterial cells that are separated from the
bacterial chromosome and replicate independently. Also, they play a crucial role in the
dissemination of antibiotic resistance genes among bacteria through horizontal gene transfer.
They can be present in many copies within host cell, which is known as plasmid copy
number. Plasmids can regulate their own copy number by different mechanisms.
Additionally, the selective pressure can also play a pivotal role in determining plasmid copy
number. The presence of antibiotics in the surrounding environment can drive variations of
plasmid copy number. In this study, we examined plasmid copy number variations of
multidrug resistance plasmids in presence of antibiotics by using EvaGreen® - based
multiplexed digital droplet PCR. We could observe that cultures of Klebsiella pneumoniae
and Escherichia coli harboring multidrug resistance plasmids grown in presence of sub-MIC
concentrations of the antibiotics did not show high variations in plasmid copy numbers. On
the other hand, mutants of K. pneumoniae selected for increased antibiotic resistance showed
high increases in copy number of a multidrug-resistance plasmid.
Keywords: antibiotic resistance, plasmid copy number, ddPCR
Popular scientific summary
Plasmid copy number: a driver of antibiotic resistance?
The evolutionary battle between pathogens and hosts is a never ending process. The
pathogens are trying to break through our defenses, while we are constantly trying to stop this
happening. Plasmids are very valuable weapons for bacteria, because they usually carry genes
that provide resistance against antibiotics. Plasmids are small circular DNA molecules that
can be transferred between bacteria. The spread of resistance is a serious concern, because
antibiotic resistant bacteria are more prone to cause severe infections. Moreover, plasmids are
able to multiply independently in the bacterial cell and present in many copies. Previous
studies suggested that variations in plasmid copy number correlate with the environmental
conditions. Our aim was to monitor the changes in plasmid copy number, while growing
bacteria in presence of different antibiotic concentrations. For this experiment, we used a
novel and promising technique, called digital droplet PCR (ddPCR). ddPCR belongs to the
newest generation of PCRs and gave us the opportunity to quantify the amount of plasmid
and chromosomal DNA in the samples at the same time. Since each cell have one copy of the
chromosomal DNA, this way we could calculate the average plasmid copy number in relation
to the amount of chromosomal DNA. According to our results, bacteria that grew in presence
of low concentrations of antibiotics, showed a little or no increase in their plasmid copy
number. However, we found a remarkable increase in plasmid copy number in case of
bacteria exposed to high concentrations of antibiotics. In the future, we are going to use
different strains of bacteria and various antibiotics in order to get a more complex picture
about the relationship between the plasmid copy number and the antibiotic pressure. Our
findings are promising in the clinical use of antibiotics and it helps us to understand the
nature of antibiotic resistance. With this information in our pocket, we might be able to gain
advantages in the endless war between pathogens and humans.
UPPSALA UNIVERSITET Master thesis 3 (26)
1.Introduction
1.1 Antibiotic resistance
Bacterial infections have always been a major threat to human life and wellbeing. During the
20th century, infections were the most common cause of mortality and shorter life expectancy.
Since the discovery of penicillin by Sir Alexander Fleming in 1928, a new era of medicine
has started. Millions of lives were saved by treating infections using the revolutionary drug.
Penicillin, the first natural antibiotic extracted, exhibits its effect by inhibiting cell wall
synthesis and was found effective against gram positive bacteria. Following the discovery of
penicillin, many studies were performed in order to look for antimicrobial agents produced by
soil and environmental microorganisms. Over the past century, many antibiotics were
discovered and came to clinical use in medicine. They caused a remarkable increase in the
life span of human population and a better quality of life. Antibiotics have been grouped
based on their structure and mechanism of action. These groups include: β-lactams (inhibiting
cell wall synthesis), tetracycline (inhibiting protein synthesis), macrolides (inhibiting protein
synthesis), aminoglycosides (inhibiting protein synthesis), quinolones (inhibiting RNA
synthesis) and sulfonamides (targeting folic acid synthesis). However, bacteria started to
develop resistance against many antibiotics shortly after introducing them for clinical use and
it became a significant clinical problem. Nowadays, resistance to most of the antibiotics has
been described. Unfortunately, antibiotic resistance is still rising to dangerous levels. This
drove the WHO to classify antibiotic resistance as one of the biggest threats to global health.1
The main reason behind the increasing antibiotic resistance was blamed on the overuse of
antibiotics. Generally, bacteria can acquire resistance to antibiotics through mutations or
horizontal gene transfer. The molecular mechanisms of developing resistance against
different antibiotics have been extensively studied. These mechanisms can be due to
antibiotic degradation or modification, increased antibiotic efflux (efflux pump), target
modification or target bypass. Horizontal gene transfer is referred to the acquisition of a
foreign DNA material such as antibiotic resistance genes. Traditionally, horizontal gene
transfer can be achieved by three different mechanisms i) transformation through the uptake
of a foreign DNA from the environment ii) transduction through bacterial phages iii)
conjugation through cell-cell contact and exchange of genetic material through conjugative
plasmids.2 All three mechanisms are common among bacteria present in the environment.
However, some bacterial species favor one mechanism over the others. For example,
enterobacteria commonly use conjugative plasmids while streptococci usually use
transformation to exchange genetic materials.3 However, plasmid-mediated conjugation is
considered as the most prevalent method for spreading resistance genes among bacteria.

UPPSALA UNIVERSITET Master thesis 4 (26)
1.2 Plasmids
Plasmids are extra chromosomal, self-replicating genetic elements that play a critical role in
bacterial evolution and adaptation by horizontal gene transfer. They bring various phenotypes
to bacteria. Moreover, plasmids usually do not carry essential genes, which are needed for the
growth and replication of bacterial cells under optimal growth conditions. However, in stress
conditions, some genes on the plasmid may become essential for maintenance of bacterial
growth e.g. antibiotic resistance genes in presence of antibiotics.4 Plasmids can be transferred
between bacteria by conjugation, transformation or transduction. Moreover, plasmids can
help move genes between different species or genera based on the host range of the plasmids.
They are traditionally classified into different incompatibility groups (Inc groups) based on
their replicon as plasmids. Plasmids with the same replicons are incompatible as they cannot
stably reside together within the same cell due to similar replicon control.5 Additionally,
many plasmids have special systems to ensure a stable maintenance in the bacterial cells e.g.
segregation systems that make sure that each daughter cell get a copy of the plasmid and
toxin-antitoxin systems which kill bacterial cells that lost the plasmid.6, 7
However, mobilization and emergence of new genes are occurring continuously in the
environment; environmental factors usually determine whether to keep these new genotypes
or no. These factors include the selective pressure and fitness cost. 8 Despite the potential
advantage to a bacterial host of carrying a plasmid, plasmids can cause a fitness cost to their
host under conditions which do not select for plasmid encoded genes. The fitness cost can be
presented as slower growth, weaker competitiveness. This cost can cause plasmid instability
and threaten the persistence of plasmids among bacterial communities under conditions that
do not favor bacteria carrying the plasmid. However, plasmids have been present for a long
time without extinction in contrary to what was expected, and this is described as the
―plasmid paradox‖. The exact explanation of plasmid paradox is still not completely
understood. However, some studies suggested that adaptations of the host, compensatory
mutations or variations in plasmid replication frequencies may be involved in the
maintenance in non-selective conditions.9
Plasmids usually code for regulatory network to govern their own replication frequency. This
regulatory network controls the plasmid copy number. The plasmid copy number [PCN] is
defined as the average number of plasmid copies per host cell. It is varying between bacteria
within isogenic population and between different plasmids. It affects both transcriptional and
translational levels of genes present on the plasmid, such as resistance genes. Plasmids vary
widely in their copy number between high and low copy number. This variation depends on i)
origin or replication (ori) and its elements ii) size of the plasmid and its insert as bigger
inserts causes higher metabolic burden on the bacterial host iii) environmental conditions
such as presence of antibiotics in the culture. In presence of antibiotics, the conditions select
for plasmid-bearing bacteria, which become the fittest among susceptible population.
Moreover, presence of antibiotics in the bacterial environment can affect plasmid copy
number to cope with the increasing stress to bacterial cells.10
UPPSALA UNIVERSITET Master thesis 5 (26)
1.3 Background from similar studies
Previous studies have described the effect of the presence of antibiotics in the culture media
on plasmid copy number. One of the antibiotics described is chloramphenicol, a bacteriostatic
antibiotic. Low levels of chloramphenicol were shown to cause an increase in plasmid copy
number.11
Chloramphenicol exerts its activity by targeting protein synthesis. It prevents the
chain elongation step in protein synthesis. This activity is achieved by inhibiting peptidyl
transferase enzyme of the bacterial ribosome. Specifically, it binds to A2451 and A2452
residues in the 23S rRNA of the 50S ribosomal subunit thus, preventing the formation of
peptide bonds. Consequently, bacterial replication and protein synthesis is inhibited while the
plasmids which are self-replicating continue to replicate.12
Therefore, the number of plasmids
increases in relation to the chromosome and total cell mass, and this is described as ―plasmid
amplification‖. This was studied on Escherichia coli bearing pBR322 plasmid (which is 4361
base pairs and carries bla and tetA genes encoding for ampicillin and tetracycline resistance,
respectively).11
pBR322 harbors the origin of replication of pMB1 and plasmid copy number
restrictor genes (rop gene) which regulate plasmid replication by controlling primer RNA
precursor transcription.13
Similarly, another study showed an increase in plasmid copy
number in Haemophilus influenzae bearing pB1000 (a small plasmid that confers resistance
to β lactam antibiotics) in presence of ampicillin in the culture media. This increase in PCN
was related to a higher resistance level to ampicillin which increased the fitness of the
plasmid-bearing bacteria during ampicillin treatment and also promoted the spread of the
plasmid among population.7
Precise quantification of plasmid copy number has been an uprising interest for many
research studies. Hence, it is important to use a reliable method to detect plasmid copy
number variations and fluctuations. Many studies demonstrated scrutinizing plasmid copy
number by many different methods. One of these methods was fluorescent-based
measurement using a microfluidic flow cytometry device. In this study, they inserted two
different fluorescent protein reporters: one for the plasmid and another one for the
chromosome and measured the fluorescence signal from both reporters.14
However, the
results were not accurate due to noise in gene expression, which could affect the fluorescence
signal and resulted in deceptive calculations. Another drawback of this method was the
limited spectrum of detection due to optical diffractions of bacterial cell components. On the
other hand, this method provided an estimation of the mean and standard deviation of
plasmid copy number among monoclonal bacterial population, which results from the
heterogeneity of plasmid copy number within bacterial populations and had not been studied
before.
Other studies were based on detecting plasmid copy number quantitatively by using relative
quantitative PCR (qPCR). However using qPCR is considered comparatively more sensitive
and less time consuming, the measurement is proportionate and dependent on the standard
curves which are error prone.15
However, Real-Time PCR could not detect small fluctuations
in plasmid copy number.

UPPSALA UNIVERSITET Master thesis 6 (26)
1.4 Bacterial strains of interest
Klebsiella pneumoniae is a gram negative, non-motile, rod-shaped bacterium. It is an
opportunistic pathogen that can be found in the normal body flora or the environment (soil).16
Unfortunately, K. pneumoniae is an uprising serious clinical threat due to the emergence of
multi-drug resistant strains. It has been involved in many nosocomial outbreaks. Plasmids
have been identified as the main source of antibiotic resistance genes among Klebsiella
species. Extended spectrum beta-lactamase (ESBL) producing K. pneumoniae are resistant to
almost all beta-lactam antibiotics except carbapenems.17
However, carbapenemase-producing
Enterobacteriaceae are rapidly spreading.
Similarly, Escherichia coli is a gram negative, facultative anaerobe, rod-shaped bacterium.
Although E. coli is usually harmless and present normally in the gut microflora, it has been
involved in many cases of food poisoning, urinary tract infections, gastroenteritis…etc. Due
to the high prevalence of E. coli in nature, it has been extensively studied. Moreover, the
dissemination of plasmid -mediated antibiotic resistance genes among E. coli species caused
emergence more virulent and resistant phenotypes.18
Generally, plasmid copy number variations in presence of different antibiotics have not been
closely studied, especially variation in copy number of the typically large and low copy
number plasmids carrying antibiotic resistance genes in Enterobacteriaceae. Moreover, few
antibiotics were examined for their effects on resistance-plasmids copy number variations.
Therefore, in this study, we studied plasmid copy number variations of multidrug resistance
plasmids present in K. pneumoniae and E. coli in presence of antibiotics.
Aim
To determine the extent of plasmid copy number variation following growth in presence of
antibiotics.
2. Materials and methods
2.1 Bacterial strains, plasmids and culture media
Klebsiella pneumoniae (DA33140) used in this study is a clinical isolate from our collection.
It carries 4 plasmids (pDA33140-112 of 112kb, pDA33140-96 of 96kb, pDA33140-9 of 9kb
and pDA33140-2 of 2kb). Antibiotic resistance genes are carried on pDA33140-96 and are
presented in table 1. Other strains used were Escherichia coli MG1655 (DA5438) and
MG1655 conjugated with multi-resistance plasmid pSMS35-130 (DA50061) also carrying
antibiotic resistance genes. This plasmid (pSMS35-130) carries resistance genes against
tetracyclines (tetA, tetR), sulfonamides (sul2), aminoglycosides (aadA, aph) and beta lactams
(bla) .ddPCR oligos detecting PCN of two other plasmids (a large, multidrug resistant
plasmid pUUH239.2 found in clinical E. coli and K. pneumonia isolates, and a small miniF-
dhfr-orph11 plasmid carrying the replication origin of the E. coli F plasmid) were also
designed but those plasmids were not used in this study. The bacterial cultures were grown on
Mueller-Hinton (MH) agar and overnight cultures were grown on Mueller-Hinton broth, both
UPPSALA UNIVERSITET Master thesis 7 (26)
purchased from Sigma-Aldrich. Cultures were performed at 37C under vigorous shaking for
broth cultures.
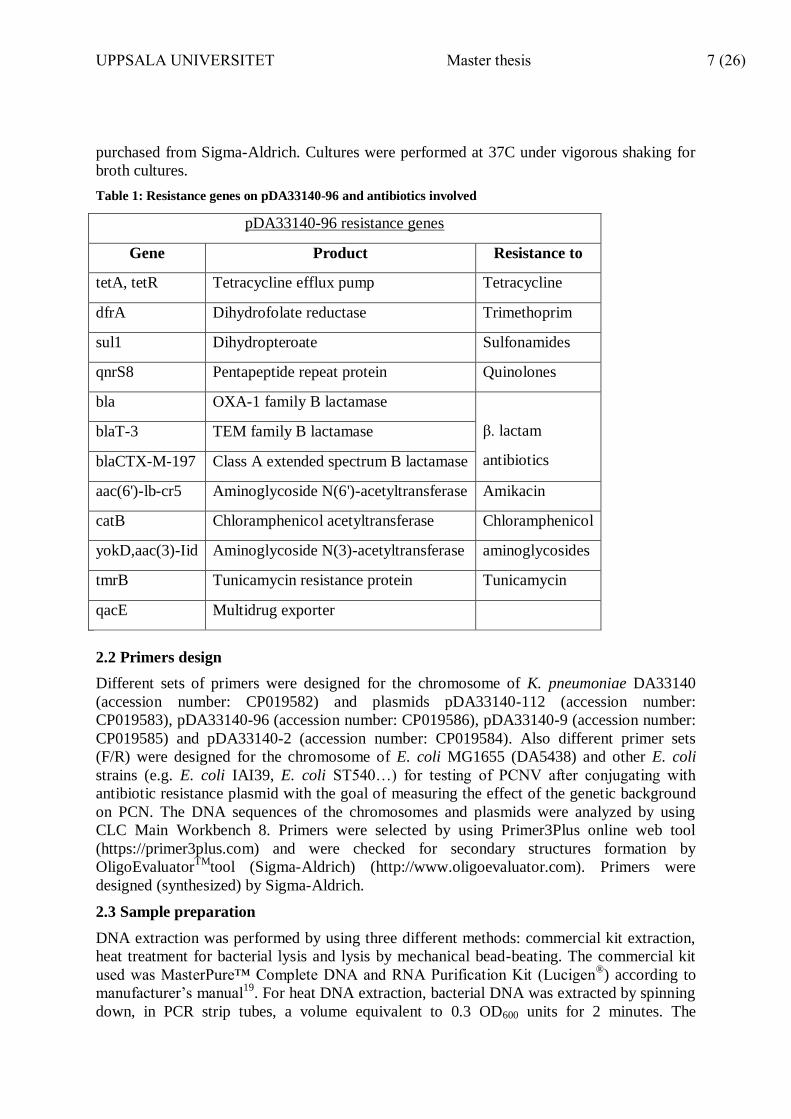
Table 1: Resistance genes on pDA33140-96 and antibiotics involved
pDA33140-96 resistance genes
Gene Product Resistance to
tetA, tetR Tetracycline efflux pump Tetracycline
dfrA Dihydrofolate reductase Trimethoprim
sul1 Dihydropteroate Sulfonamides
qnrS8 Pentapeptide repeat protein Quinolones
bla OXA-1 family B lactamase
β. lactam
antibiotics
blaT-3 TEM family B lactamase
blaCTX-M-197 Class A extended spectrum B lactamase
aac(6')-lb-cr5 Aminoglycoside N(6')-acetyltransferase Amikacin
catB Chloramphenicol acetyltransferase Chloramphenicol
yokD,aac(3)-Iid Aminoglycoside N(3)-acetyltransferase aminoglycosides
tmrB Tunicamycin resistance protein Tunicamycin
qacE Multidrug exporter
2.2 Primers design
Different sets of primers were designed for the chromosome of K. pneumoniae DA33140
(accession number: CP019582) and plasmids pDA33140-112 (accession number:
CP019583), pDA33140-96 (accession number: CP019586), pDA33140-9 (accession number:
CP019585) and pDA33140-2 (accession number: CP019584). Also different primer sets
(F/R) were designed for the chromosome of E. coli MG1655 (DA5438) and other E. coli
strains (e.g. E. coli IAI39, E. coli ST540…) for testing of PCNV after conjugating with
antibiotic resistance plasmid with the goal of measuring the effect of the genetic background
on PCN. The DNA sequences of the chromosomes and plasmids were analyzed by using
CLC Main Workbench 8. Primers were selected by using Primer3Plus online web tool
(https://primer3plus.com) and were checked for secondary structures formation by
OligoEvaluatorTM
tool (Sigma-Aldrich) (http://www.oligoevaluator.com). Primers were
designed (synthesized) by Sigma-Aldrich.
2.3 Sample preparation
DNA extraction was performed by using three different methods: commercial kit extraction,
heat treatment for bacterial lysis and lysis by mechanical bead-beating. The commercial kit
used was MasterPure™ Complete DNA and RNA Purification Kit (Lucigen®) according to
manufacturer’s manual19
. For heat DNA extraction, bacterial DNA was extracted by spinning
down, in PCR strip tubes, a volume equivalent to 0.3 OD600 units for 2 minutes. The
UPPSALA UNIVERSITET Master thesis 8 (26)
supernatant was discarded and the pellet was re-suspended in 25µl of nuclease free water and
25µl of fast lysis buffer for bacterial lysis (QIAGEN), then heated up to 98°C for 10 minutes
followed by cooling down to 4°C by using GeneAmp®
PCR systems 9700 thermal cycler.
The prepared samples were spun down for 1 minute and the supernatant was used as the
template DNA. For bead-beating DNA extraction, a volume equivalent to 2 OD600 units in
1.5 ml sterile eppendorf tubes was centrifuged for 3 minutes at maximum speed, the
supernatant was discarded and the pellet was re-suspended in 500µl elution buffer (Omega
Bio-tek) and loaded in sterile 1.5ml screw-capped micro-centrifuge tubes previously
autoclaved and loaded with 0.75 g of glass beads, acid washed with a diameter of 212-300µm
(50-70 U.S. sieve) (Sigma Aldrich). The vials were incubated on ice for 10 minutes before
homogenization by FastPrep®-24 (MP Biomedicals) for 20 seconds at a speed of 6.5 m/sec.
Tubes containing the extracted DNA were kept on ice and DNA was used immediately for
ddPCR testing to minimize DNA degradation by nucleases.
2.4 Primers testing
PCR reactions were conducted using a 25µl reaction mixture that consisted of 12.5 µl of 2X
DreamTaq Green PCR Master Mix (Thermo Fisher scientific), 1 µl of each forward and
reverse primers (at 10 pmol/ µl), 30 ƞg of kit-extracted template DNA and nuclease free
water (Sigma Aldrich) to reach a volume of 25µl/reaction. PCR amplifications were
performed with the following conditions: initial denaturation at 94°C for 1 minute, followed
by 33 cycles of denaturation at 94°C for 30 seconds, annealing at 58°C for 30 seconds and
extension at 72°C for 30 seconds, followed by a final extension at 72°C for 7 minutes. PCR
products were visualized by gel electrophoresis using 2% agarose gel, and the gel was stained
for 15 minutes in 0.01% ethidium bromide bath. The ladder used was Thermo Fisher
Scientific Gene Ruler 1 Kb DNA ladder.
2.5 MIC determination
MIC values of different antibiotics were determined by Epsilometer test (E-test). Cultures of
DA33140 and DA50061 were grown in 1 ml of MH broth in 10 ml sterile plastic vials and
incubated at 37°C with vigorous shaking overnight. A 1:30 dilution in PBS of the overnight
culture was spread on MH agar plates using a sterile cotton swab dipped in the cell
suspension. The E-strips (of each antibiotic) were placed on each individual plate and the
plates were incubated at 37°C for 18 hours. The MIC values were obtained by reading the
results of the E-test.
2.6 Cultures grown in sub-MIC antibiotics concentrations
For testing plasmid copy number variations, two independent bacterial cultures of DA33140
and DA50061 were grown for 28 generations in MH broth supplemented with antibiotics at
four different concentrations depending on the minimum inhibitory concentration of the
antibiotic. Antibiotic concentrations used were 0.5, 0.25, 0.125 and 0.0625 of MIC
concentrations. A total number of 4 control cultures grown without antibiotics and 4 negative
controls (MH broth without bacterial cultures) were included. Each independent culture was
started from an independent colony on MH plate. After overnight growth in MH in absence
of antibiotics, the cultures were used to start cultures in 96-well microtiter plates in MH broth
supplemented with antibiotics for four days. (Figure 1) A volume of 1µl from the overnight
culture was transferred to 100 µl of fresh MH broth supplemented with antibiotic of the same
concentrations as the overnight cultures on a new 96-well microtiter plate, daily. Each day,
±7 generations of bacteria were expected to grow in the overnight cultures. After the 4th

UPPSALA UNIVERSITET Master thesis 9 (26)
overnight culture, the OD620 was measured using Multiskan FC (Thermo Scientific). DNA
was extracted by heat treatment and 100µl of cultures were stored at -80°C with 10% glycerol
for further testing. For cultures grown in presence of colistin, glass tubes containing 1 ml of
MH broth supplemented with 4 different concentrations of colistin were used instead of 96-
well microtiter plate for only 3 days (expected growth of 10 generation/day). This was due to
the tendency of colistin to bind to plastic materials which may affect the results. Negative
control cultures were included to monitor contaminations.
Figure 1: showing an example set-up of the microtiter plate used for cultures grown in presence of sub-MIC concentrations of antibiotics. Each column contains different antibiotic which each row contains different concentration of the antibiotic. The plate was divided into 2 halves with the same conditions, where the upper and lower parts represent 2 independent cultures serving as biological replicates.
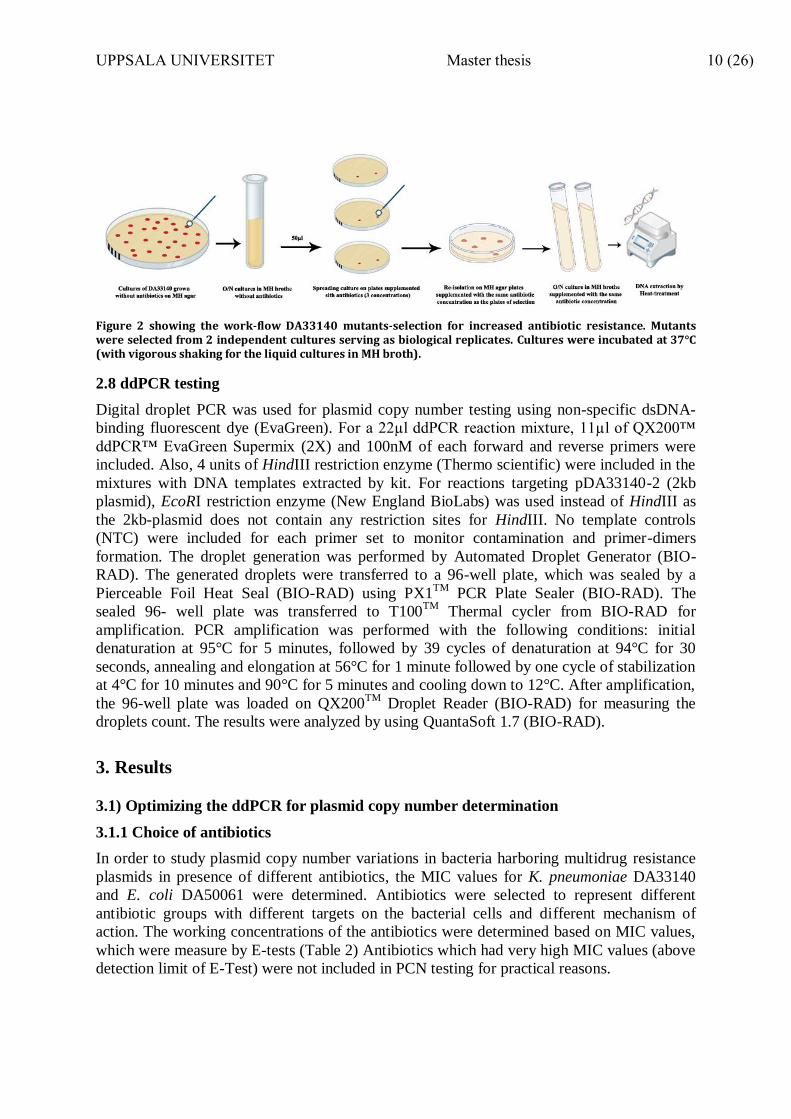
2.7 Mutants selection
Mutants were selected by growing 2 independent cultures of K. pneumoniae (DA33140)
overnight in MH broth and spreading 50 µl of the O/N culture on MH agar plates
supplemented with different concentrations of antibiotics above the MIC. The antibiotic
concentrations used were 2x, 4x and 8x above the MIC. For each antibiotic where mutants
appeared after overnight incubation at 37°C, two mutants were selected and were re-isolated
on MH agar plates supplemented with the same antibiotic and concentration as used for the
selection. After overnight culture of the re-isolated bacteria in MH broth containing the same
antibiotic concentration the mutants were selected on, DNA was extracted by heat treatment
and cultures were stored at -80°C with 10% glycerol for further testing. (Figure 2)
UPPSALA UNIVERSITET Master thesis 10 (26)
Figure 2 showing the work-flow DA33140 mutants-selection for increased antibiotic resistance. Mutants were selected from 2 independent cultures serving as biological replicates. Cultures were incubated at 37°C (with vigorous shaking for the liquid cultures in MH broth).
2.8 ddPCR testing
Digital droplet PCR was used for plasmid copy number testing using non-specific dsDNA-
binding fluorescent dye (EvaGreen). For a 22µl ddPCR reaction mixture, 11µl of QX200™
ddPCR™ EvaGreen Supermix (2X) and 100nM of each forward and reverse primers were
included. Also, 4 units of HindIII restriction enzyme (Thermo scientific) were included in the
mixtures with DNA templates extracted by kit. For reactions targeting pDA33140-2 (2kb
plasmid), EcoRI restriction enzyme (New England BioLabs) was used instead of HindIII as
the 2kb-plasmid does not contain any restriction sites for HindIII. No template controls
(NTC) were included for each primer set to monitor contamination and primer-dimers
formation. The droplet generation was performed by Automated Droplet Generator (BIO-
RAD). The generated droplets were transferred to a 96-well plate, which was sealed by a
Pierceable Foil Heat Seal (BIO-RAD) using PX1TM
PCR Plate Sealer (BIO-RAD). The
sealed 96- well plate was transferred to T100TM
Thermal cycler from BIO-RAD for
amplification. PCR amplification was performed with the following conditions: initial
denaturation at 95°C for 5 minutes, followed by 39 cycles of denaturation at 94°C for 30
seconds, annealing and elongation at 56°C for 1 minute followed by one cycle of stabilization
at 4°C for 10 minutes and 90°C for 5 minutes and cooling down to 12°C. After amplification,
the 96-well plate was loaded on QX200TM
Droplet Reader (BIO-RAD) for measuring the
droplets count. The results were analyzed by using QuantaSoft 1.7 (BIO-RAD).
3. Results
3.1) Optimizing the ddPCR for plasmid copy number determination
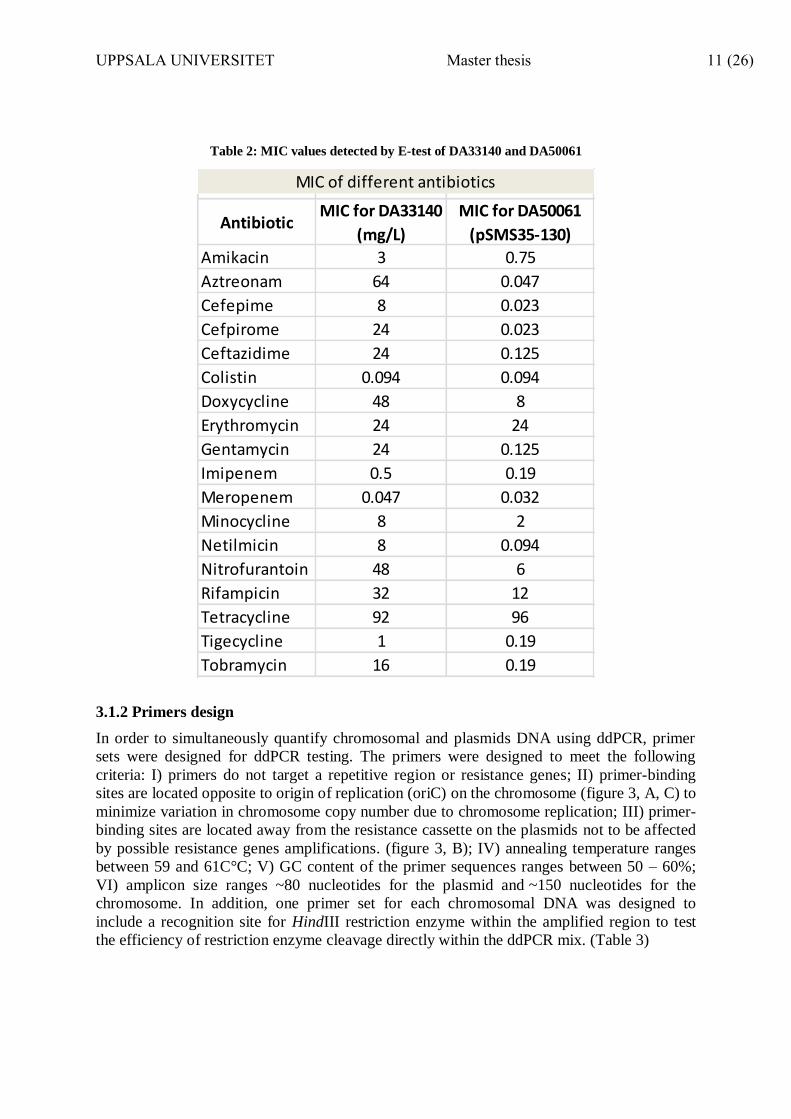
3.1.1 Choice of antibiotics
In order to study plasmid copy number variations in bacteria harboring multidrug resistance
plasmids in presence of different antibiotics, the MIC values for K. pneumoniae DA33140
and E. coli DA50061 were determined. Antibiotics were selected to represent different
antibiotic groups with different targets on the bacterial cells and different mechanism of
action. The working concentrations of the antibiotics were determined based on MIC values,
which were measure by E-tests (Table 2) Antibiotics which had very high MIC values (above
detection limit of E-Test) were not included in PCN testing for practical reasons.
UPPSALA UNIVERSITET Master thesis 11 (26)
Table 2: MIC values detected by E-test of DA33140 and DA50061
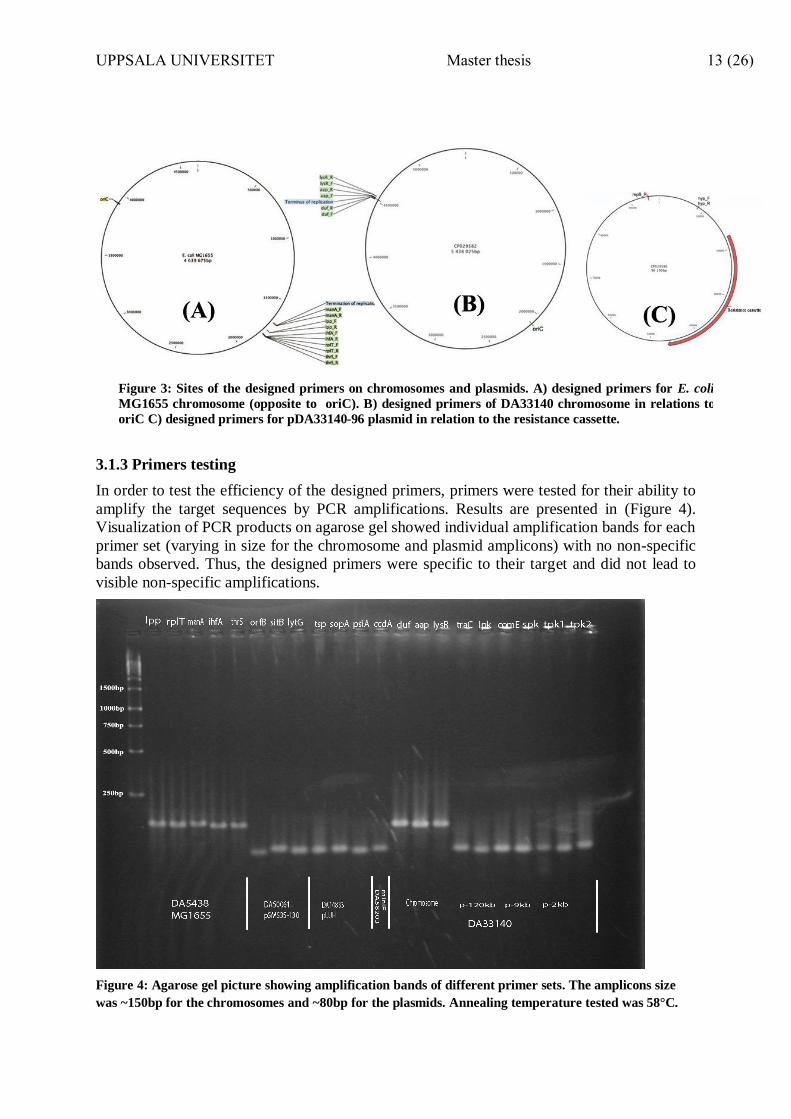
3.1.2 Primers design
In order to simultaneously quantify chromosomal and plasmids DNA using ddPCR, primer
sets were designed for ddPCR testing. The primers were designed to meet the following
criteria: I) primers do not target a repetitive region or resistance genes; II) primer-binding
sites are located opposite to origin of replication (oriC) on the chromosome (figure 3, A, C) to
minimize variation in chromosome copy number due to chromosome replication; III) primer-
binding sites are located away from the resistance cassette on the plasmids not to be affected
by possible resistance genes amplifications. (figure 3, B); IV) annealing temperature ranges
between 59 and 61C°C; V) GC content of the primer sequences ranges between 50 – 60%;
VI) amplicon size ranges ~80 nucleotides for the plasmid and ~150 nucleotides for the
chromosome. In addition, one primer set for each chromosomal DNA was designed to
include a recognition site for HindIII restriction enzyme within the amplified region to test
the efficiency of restriction enzyme cleavage directly within the ddPCR mix. (Table 3)
AntibioticMIC for DA33140
(mg/L)
MIC for DA50061
(pSMS35-130)
Amikacin 3 0.75
Aztreonam 64 0.047
Cefepime 8 0.023
Cefpirome 24 0.023
Ceftazidime 24 0.125
Colistin 0.094 0.094
Doxycycline 48 8
Erythromycin 24 24
Gentamycin 24 0.125
Imipenem 0.5 0.19
Meropenem 0.047 0.032
Minocycline 8 2
Netilmicin 8 0.094
Nitrofurantoin 48 6
Rifampicin 32 12
Tetracycline 92 96
Tigecycline 1 0.19
Tobramycin 16 0.19
MIC of different antibiotics

UPPSALA UNIVERSITET Master thesis 12 (26)
Table 3: showing the designed primers, sequences, amplicon size, features and R
2 & slope values.
Underlined primers are the ones used for PCN testing.
UPPSALA UNIVERSITET Master thesis 13 (26)
3.1.3 Primers testing
In order to test the efficiency of the designed primers, primers were tested for their ability to
amplify the target sequences by PCR amplifications. Results are presented in (Figure 4).
Visualization of PCR products on agarose gel showed individual amplification bands for each
primer set (varying in size for the chromosome and plasmid amplicons) with no non-specific
bands observed. Thus, the designed primers were specific to their target and did not lead to
visible non-specific amplifications.
Figure 4: Agarose gel picture showing amplification bands of different primer sets. The amplicons size
was ~150bp for the chromosomes and ~80bp for the plasmids. Annealing temperature tested was 58°C.
Figure 3: Sites of the designed primers on chromosomes and plasmids. A) designed primers for E. coli
MG1655 chromosome (opposite to oriC). B) designed primers of DA33140 chromosome in relations to
oriC C) designed primers for pDA33140-96 plasmid in relation to the resistance cassette.
UPPSALA UNIVERSITET Master thesis 14 (26)
3.1.4 Sensitivity testing
To test the sensitivity of the designed primers in quantifying number of copies of the target,
kit-prepared DNA templates with 2-folds decreasing concentrations were tested by using
ddPCR. The results showed high sensitivity of the primers suggested by high R2 (coefficient
of determination) and slope values as calculated from the sensitivity curves. Primer sets with
the best values of R2 and slope factor (~1) were chosen to be used for further testing of PCN
and ddPCR multiplexing. (Table 3)
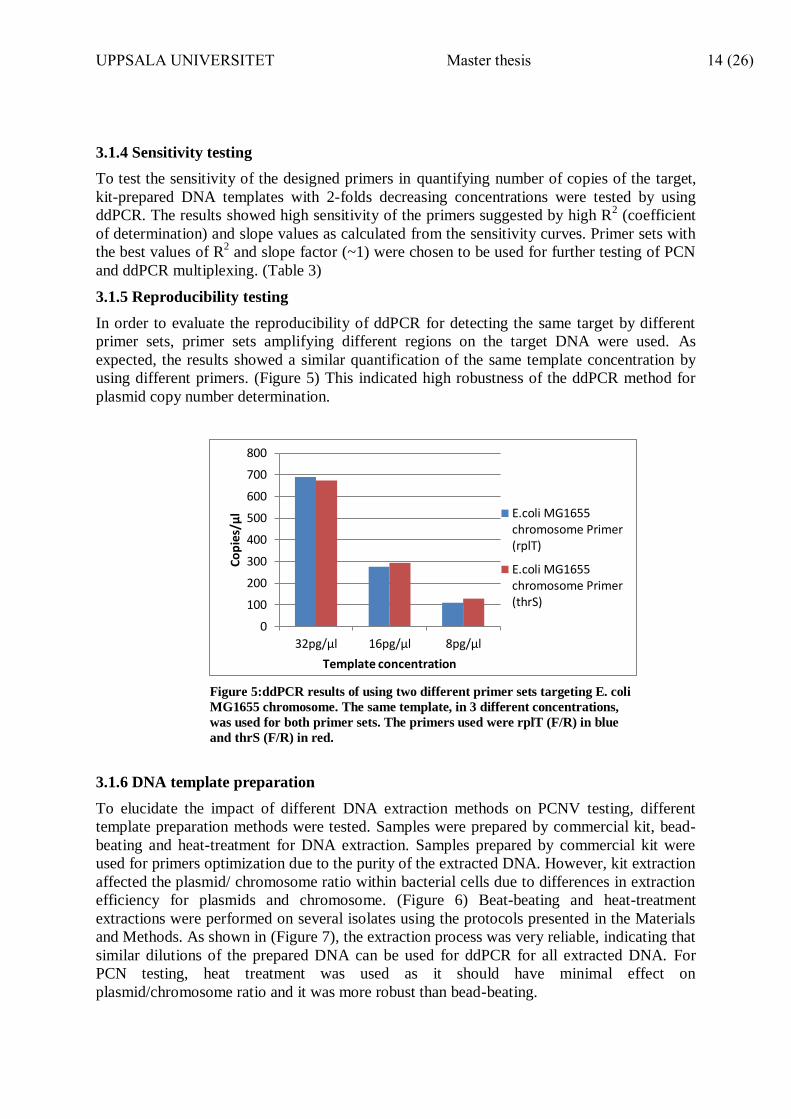
3.1.5 Reproducibility testing
In order to evaluate the reproducibility of ddPCR for detecting the same target by different
primer sets, primer sets amplifying different regions on the target DNA were used. As
expected, the results showed a similar quantification of the same template concentration by
using different primers. (Figure 5) This indicated high robustness of the ddPCR method for
plasmid copy number determination.
3.1.6 DNA template preparation
To elucidate the impact of different DNA extraction methods on PCNV testing, different
template preparation methods were tested. Samples were prepared by commercial kit, bead-
beating and heat-treatment for DNA extraction. Samples prepared by commercial kit were
used for primers optimization due to the purity of the extracted DNA. However, kit extraction
affected the plasmid/ chromosome ratio within bacterial cells due to differences in extraction
efficiency for plasmids and chromosome. (Figure 6) Beat-beating and heat-treatment
extractions were performed on several isolates using the protocols presented in the Materials
and Methods. As shown in (Figure 7), the extraction process was very reliable, indicating that
similar dilutions of the prepared DNA can be used for ddPCR for all extracted DNA. For
PCN testing, heat treatment was used as it should have minimal effect on
plasmid/chromosome ratio and it was more robust than bead-beating.
0
100
200
300
400
500
600
700
800
32pg/µl 16pg/µl 8pg/µl
Co
pie
s/µ
l
Template concentration
E.coli MG1655chromosome Primer(rplT)
E.coli MG1655chromosome Primer(thrS)
Figure 5:ddPCR results of using two different primer sets targeting E. coli
MG1655 chromosome. The same template, in 3 different concentrations,
was used for both primer sets. The primers used were rplT (F/R) in blue
and thrS (F/R) in red.

UPPSALA UNIVERSITET Master thesis 15 (26)
Figure 7 showing agarose gel picture of amplicons from the chromosome of 3 different E. coli strains (MG1655,
55989, IAI39). DNA templates were extracted by mechanical bead-beating (top) and heat-treatment (bottom).
Different template concentrations, (10-3
: 10-6
) prepared by serial dilutions, were tested in duplicates to serve as
biological replicates. The primers used were lpp (F/R) targeting E. coli chromosome.
0.6 0.9 3.0 3.1
1.4 2
8.8 10.2
0
5
10
15
112kb plasmid 96 kb plasmid 9 kb plasmid 2 kb plasmid
Pla
smid
cop
y n
um
ber
DA33140 plasmids average copy numbers normalized to
the chromosome calculated by ddPCR
Kit extraction Heat extraction
Figure 6: Copy number of different plasmids of K. pneumoniae DA33140 calculated by
ddPCR and normalized to the chromosome. Different DNA extraction methods were used
(commercial kit extraction) in blue and (heat treatment) in red.
UPPSALA UNIVERSITET Master thesis 16 (26)
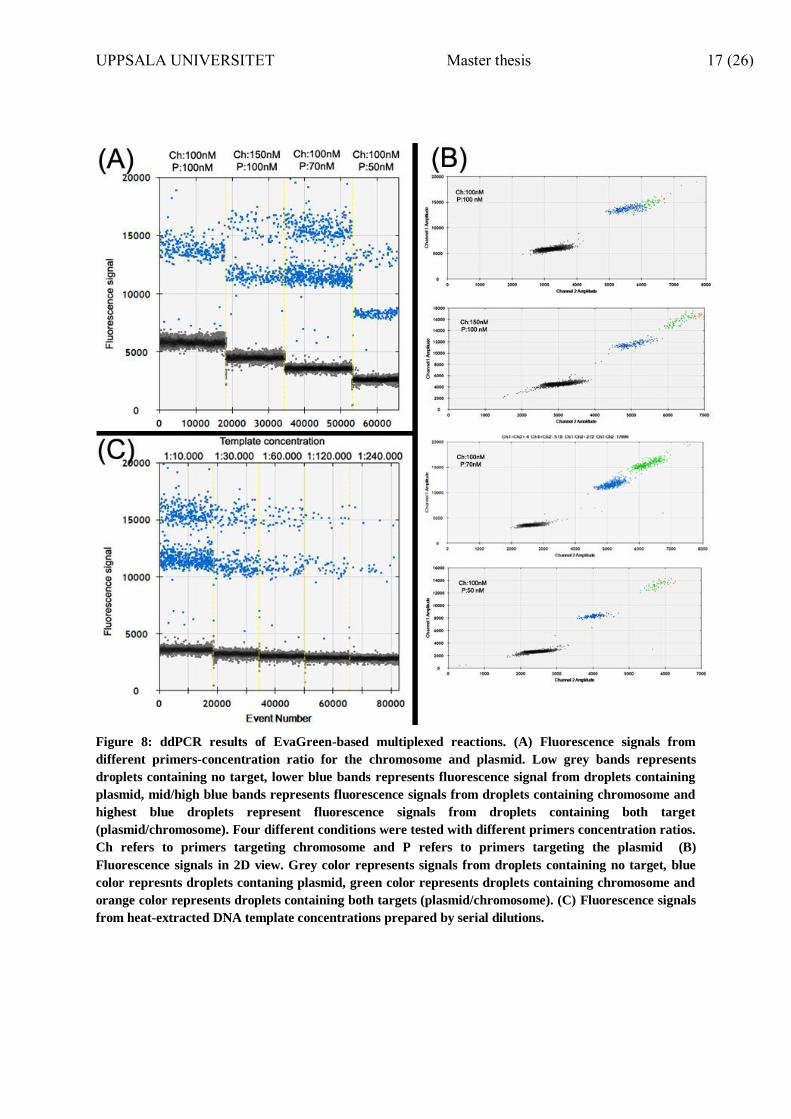
3.1.7 Multiplexing
Multiplexing of EvaGreen® – based ddPCR was used to calculate PCN by quantifying the
number of plasmids DNA copies compared to the number of chromosomal DNA,
simultaneously. The main objective of multiplexing optimization was to amplify the
chromosomal and plasmid amplicons in the same ddPCR reaction, thus decreasing the
number of reactions needed when screening numerous growth conditions. For this, we had to
get a clear separation between four different fluorescence signals originating from droplets
containing different targets. These aforementioned 4 fluorescent signals correspond to signals
from (lowest to highest, correspondingly in Figure 8): I) droplets containing no target II)
droplets containing plasmid DNA II) droplets containing chromosome DNA IV) droplets
containing both plasmid and chromosome DNA.
The optimal primers concentrations chosen were 70nM for the plasmid and 100nM for the
chromosome (0.7/1 ratio). This was chosen based on the better separation observed between
the fluorescence signals from the droplets. (Figure 8- A, B)
The optimal heat-extracted DNA template concentration chosen was 1:10.000 diluted by
serial dilutions. This concentration was chosen based on the detected number of copies of
both targets and the better separation between fluorescence signals. (Figure 8- C)
UPPSALA UNIVERSITET Master thesis 17 (26)
Figure 8: ddPCR results of EvaGreen-based multiplexed reactions. (A) Fluorescence signals from
different primers-concentration ratio for the chromosome and plasmid. Low grey bands represents
droplets containing no target, lower blue bands represents fluorescence signal from droplets containing
plasmid, mid/high blue bands represents fluorescence signals from droplets containing chromosome and
highest blue droplets represent fluorescence signals from droplets containing both target
(plasmid/chromosome). Four different conditions were tested with different primers concentration ratios.
Ch refers to primers targeting chromosome and P refers to primers targeting the plasmid (B)
Fluorescence signals in 2D view. Grey color represents signals from droplets containing no target, blue
color represnts droplets contaning plasmid, green color represents droplets containing chromosome and
orange color represents droplets containing both targets (plasmid/chromosome). (C) Fluorescence signals
from heat-extracted DNA template concentrations prepared by serial dilutions.
UPPSALA UNIVERSITET Master thesis 18 (26)
3.2) Plasmid copy number variation following growth in presence of antibiotics
3.2.1 PCN variation following growth at sub-MIC concentrations of antibiotics
To detect PCN variations due to presence of low concentrations of antibiotics, cultures of
DA33140 and DA50061 were grown in presence of sub-MIC concentrations of antibiotics.
Cultures were grown on micro-titer 96-well plates for 4 days (~28 generations). Each day,
1µl of the overnight cultures was transferred to 100µl of fresh MH broth supplemented with
the same antibiotic concentrations (~7 generations/day).
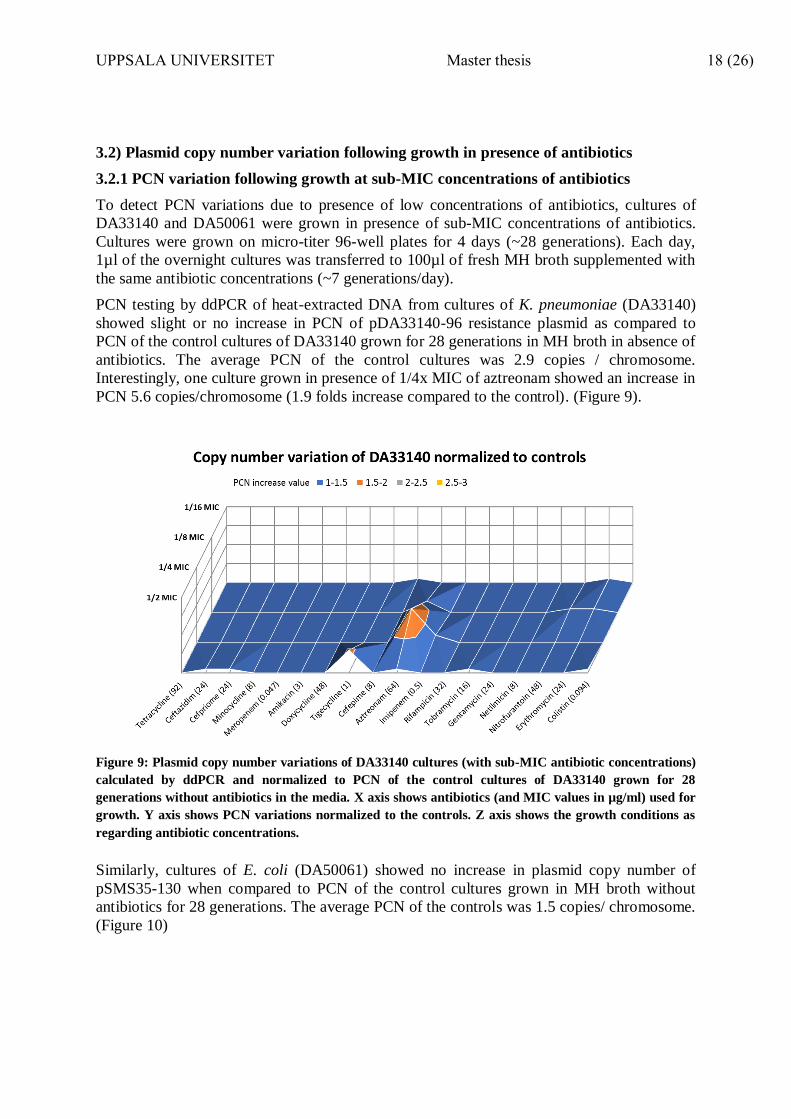
PCN testing by ddPCR of heat-extracted DNA from cultures of K. pneumoniae (DA33140)
showed slight or no increase in PCN of pDA33140-96 resistance plasmid as compared to
PCN of the control cultures of DA33140 grown for 28 generations in MH broth in absence of
antibiotics. The average PCN of the control cultures was 2.9 copies / chromosome.
Interestingly, one culture grown in presence of 1/4x MIC of aztreonam showed an increase in
PCN 5.6 copies/chromosome (1.9 folds increase compared to the control). (Figure 9).
Figure 9: Plasmid copy number variations of DA33140 cultures (with sub-MIC antibiotic concentrations)
calculated by ddPCR and normalized to PCN of the control cultures of DA33140 grown for 28
generations without antibiotics in the media. X axis shows antibiotics (and MIC values in µg/ml) used for
growth. Y axis shows PCN variations normalized to the controls. Z axis shows the growth conditions as
regarding antibiotic concentrations.
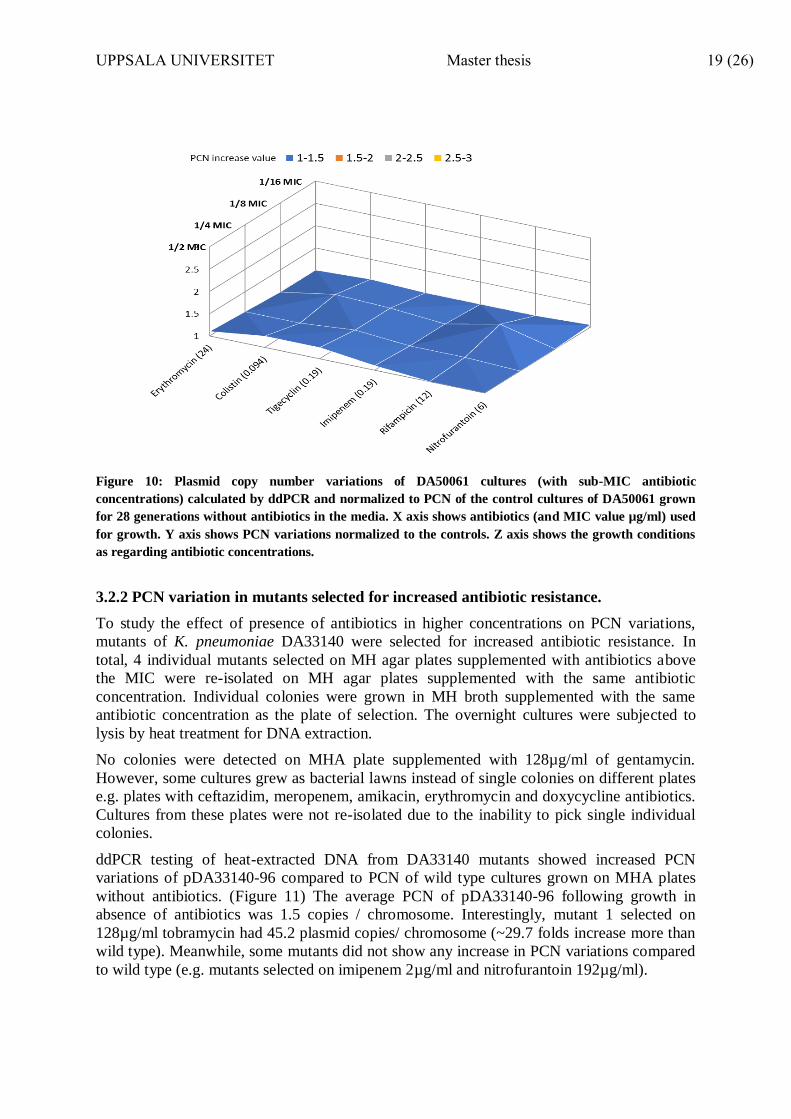
Similarly, cultures of E. coli (DA50061) showed no increase in plasmid copy number of
pSMS35-130 when compared to PCN of the control cultures grown in MH broth without
antibiotics for 28 generations. The average PCN of the controls was 1.5 copies/ chromosome.
(Figure 10)
UPPSALA UNIVERSITET Master thesis 19 (26)
Figure 10: Plasmid copy number variations of DA50061 cultures (with sub-MIC antibiotic
concentrations) calculated by ddPCR and normalized to PCN of the control cultures of DA50061 grown
for 28 generations without antibiotics in the media. X axis shows antibiotics (and MIC value µg/ml) used
for growth. Y axis shows PCN variations normalized to the controls. Z axis shows the growth conditions
as regarding antibiotic concentrations.
3.2.2 PCN variation in mutants selected for increased antibiotic resistance.
To study the effect of presence of antibiotics in higher concentrations on PCN variations,
mutants of K. pneumoniae DA33140 were selected for increased antibiotic resistance. In
total, 4 individual mutants selected on MH agar plates supplemented with antibiotics above
the MIC were re-isolated on MH agar plates supplemented with the same antibiotic
concentration. Individual colonies were grown in MH broth supplemented with the same
antibiotic concentration as the plate of selection. The overnight cultures were subjected to
lysis by heat treatment for DNA extraction.
No colonies were detected on MHA plate supplemented with 128µg/ml of gentamycin.
However, some cultures grew as bacterial lawns instead of single colonies on different plates
e.g. plates with ceftazidim, meropenem, amikacin, erythromycin and doxycycline antibiotics.
Cultures from these plates were not re-isolated due to the inability to pick single individual
colonies.
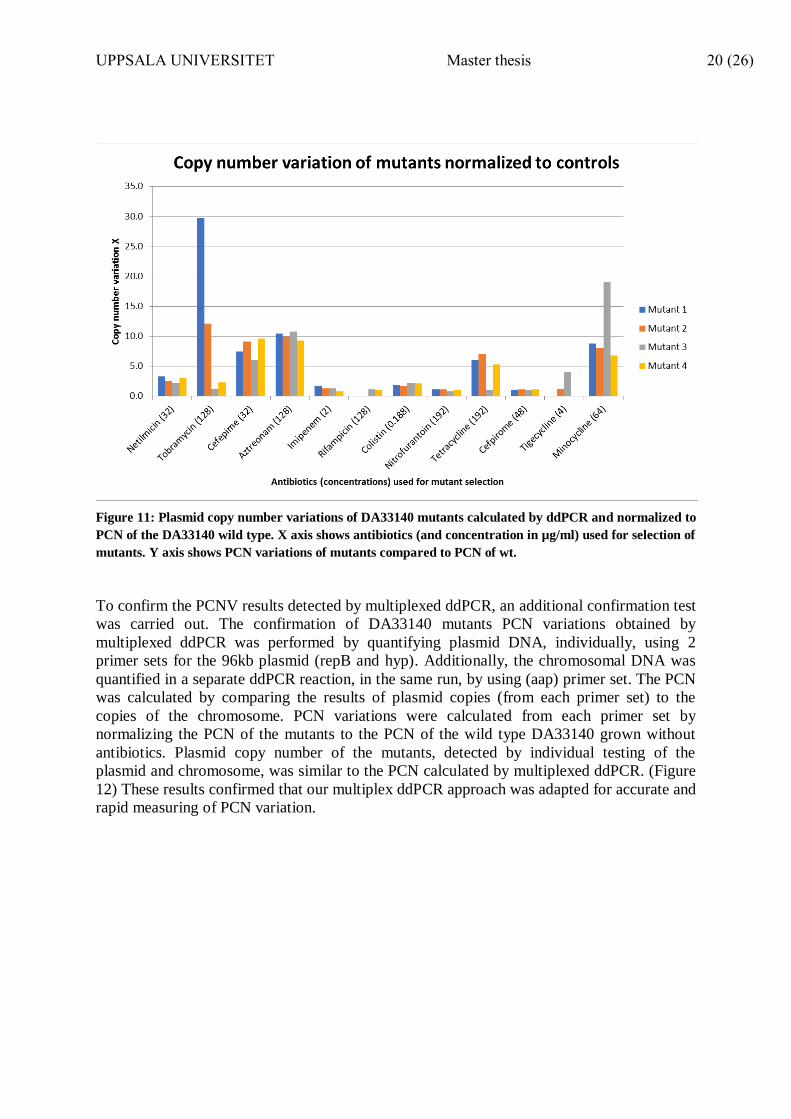
ddPCR testing of heat-extracted DNA from DA33140 mutants showed increased PCN
variations of pDA33140-96 compared to PCN of wild type cultures grown on MHA plates
without antibiotics. (Figure 11) The average PCN of pDA33140-96 following growth in
absence of antibiotics was 1.5 copies / chromosome. Interestingly, mutant 1 selected on
128µg/ml tobramycin had 45.2 plasmid copies/ chromosome (~29.7 folds increase more than
wild type). Meanwhile, some mutants did not show any increase in PCN variations compared
to wild type (e.g. mutants selected on imipenem 2µg/ml and nitrofurantoin 192µg/ml).
UPPSALA UNIVERSITET Master thesis 20 (26)
Figure 11: Plasmid copy number variations of DA33140 mutants calculated by ddPCR and normalized to
PCN of the DA33140 wild type. X axis shows antibiotics (and concentration in µg/ml) used for selection of
mutants. Y axis shows PCN variations of mutants compared to PCN of wt.
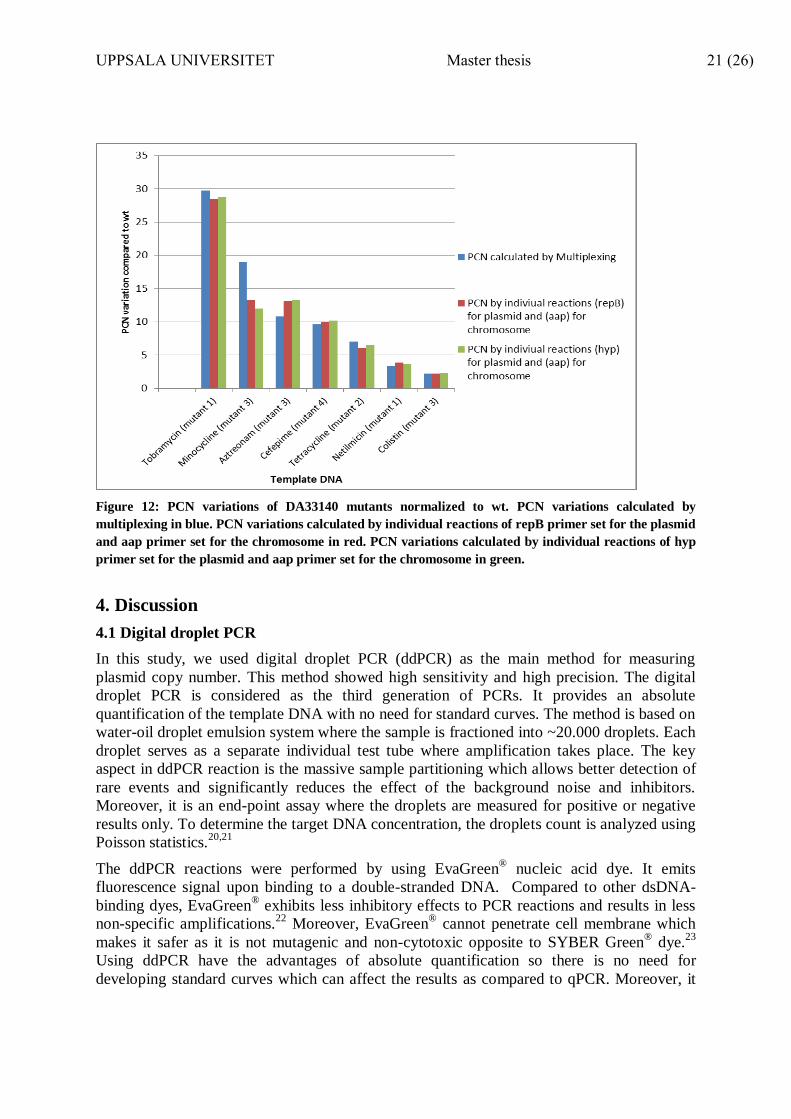
To confirm the PCNV results detected by multiplexed ddPCR, an additional confirmation test
was carried out. The confirmation of DA33140 mutants PCN variations obtained by
multiplexed ddPCR was performed by quantifying plasmid DNA, individually, using 2
primer sets for the 96kb plasmid (repB and hyp). Additionally, the chromosomal DNA was
quantified in a separate ddPCR reaction, in the same run, by using (aap) primer set. The PCN
was calculated by comparing the results of plasmid copies (from each primer set) to the
copies of the chromosome. PCN variations were calculated from each primer set by
normalizing the PCN of the mutants to the PCN of the wild type DA33140 grown without
antibiotics. Plasmid copy number of the mutants, detected by individual testing of the
plasmid and chromosome, was similar to the PCN calculated by multiplexed ddPCR. (Figure
12) These results confirmed that our multiplex ddPCR approach was adapted for accurate and
rapid measuring of PCN variation.
UPPSALA UNIVERSITET Master thesis 21 (26)
Figure 12: PCN variations of DA33140 mutants normalized to wt. PCN variations calculated by
multiplexing in blue. PCN variations calculated by individual reactions of repB primer set for the plasmid
and aap primer set for the chromosome in red. PCN variations calculated by individual reactions of hyp
primer set for the plasmid and aap primer set for the chromosome in green.
4. Discussion
4.1 Digital droplet PCR
In this study, we used digital droplet PCR (ddPCR) as the main method for measuring
plasmid copy number. This method showed high sensitivity and high precision. The digital
droplet PCR is considered as the third generation of PCRs. It provides an absolute
quantification of the template DNA with no need for standard curves. The method is based on
water-oil droplet emulsion system where the sample is fractioned into ~20.000 droplets. Each
droplet serves as a separate individual test tube where amplification takes place. The key
aspect in ddPCR reaction is the massive sample partitioning which allows better detection of
rare events and significantly reduces the effect of the background noise and inhibitors.
Moreover, it is an end-point assay where the droplets are measured for positive or negative
results only. To determine the target DNA concentration, the droplets count is analyzed using
Poisson statistics.20,21
The ddPCR reactions were performed by using EvaGreen® nucleic acid dye. It emits
fluorescence signal upon binding to a double-stranded DNA. Compared to other dsDNA-
binding dyes, EvaGreen® exhibits less inhibitory effects to PCR reactions and results in less
non-specific amplifications.22
Moreover, EvaGreen® cannot penetrate cell membrane which
makes it safer as it is not mutagenic and non-cytotoxic opposite to SYBER Green® dye.
23
Using ddPCR have the advantages of absolute quantification so there is no need for
developing standard curves which can affect the results as compared to qPCR. Moreover, it

UPPSALA UNIVERSITET Master thesis 22 (26)
can detect minor variations in PCN with higher efficiency more than the fluorescence- based
methods and qPCR.
4.2 Template DNA extraction methods
The tested cultures were subjected to DNA extraction by heat treatment. However, for
primers sensitivity testing and digestion efficiency, template DNA extracted by the
commercial kit was used. While using the commercial kit provided a more pure template
DNA and allowed digestion of the template DNA by restriction enzymes, it showed a varying
efficiency in extracting chromosomal and plasmid DNA especially for small plasmids, and
thus kit DNA extraction was not adapted to precise PCN determination. The altered ratio
between the plasmid and chromosomal DNA present in the template DNA can be misleading
when testing for plasmid copy number since the chromosome is used as a reference.
Correspondingly, DNA extraction by mechanical beads-beating was not robust and it did not
show enduring results, as amplification efficiencies seemed to vary with the same DNA,
probably due to nucleases activity in the extract. Additionally, mechanical DNA extraction
resulted in unstable DNA products which could be easily degraded. Although DNA
extraction by heat treatment does not allow digestion of the template DNA due to
denaturation of the double stranded DNA by the heat, it was favored over other DNA
extraction methods. Heat treatment DNA extraction was reliable and resulted in similar DNA
amounts in repeated extractions. Heat treatment was robust and it did not alter the
plasmid/chromosomal DNA abundance in the template DNA.24
4.3 EvaGreen-based multiplexing
Measuring plasmid copy number was performed by using multiplexed EvaGreen®- based
ddPCR. Multiplexing allowed measuring the copy number of the plasmids and chromosome
simultaneously. It also offered the advantage of testing many different conditions on the same
ddPCR run which is time-saving and cost-effective. Nevertheless, due to the non-specific
binding of EvaGreen® to dsDNA, setting the optimal multiplexed assay was challenging.
25
Unfortunately, the size difference between amplicons from the designed primers for plasmids
and chromosome was not enough to distinguish between fluorescent signals from droplets
containing the plasmid, droplets containing the chromosome and droplets containing both.
However with altering the ratio between the plasmid and chromosome primers
concentrations, a better separation between the fluorescence signals could be observed. By
decreasing the plasmid primers concentration or increasing the chromosomal primers
concentration, fluorescence signals became distinguishable. Additionally, template
concentration could also affect the fluorescence signals as it causes overlapping between the
signals in higher template concentrations. Although low template concentrations can result in
better distinguishing between the fluorescence signals, they can cause issues with the droplets
count and the statistical representation of the plasmid copy number inside the bacterial cells.
4.4 Antibiotics tested
Most of the antibiotics chosen were of clinical importance in treating bacterial infections.
However, some antibiotics were not included in PCN testing e.g. chloramphenicol and
ampicillin. This was due to the high resistance levels of the tested strains carrying multidrug
resistant plasmids to these antibiotics. Also, the exact values of the minimum inhibitory
concentration (MIC) for these antibiotics could not be precisely determined. The strains used
(DA33140 and DA50061) were totally resistant to these antibiotics as measured by E-test
(>256mg/L).

UPPSALA UNIVERSITET Master thesis 23 (26)
4.5 Results interpretation
In this study, we tested two different conditions of antibiotics which enabled us to effectively
study the impact of antibiotics on PCN variations. The presence of low concentrations of
antibiotics represents similar conditions to the environment. Meanwhile, the presence of
higher concentrations of antibiotics represents the clinical conditions where antibiotic
treatment is applied. Cultures grown in presence of sub-MIC concentrations of antibiotics did
not show a significant increase in plasmid copy number compared to cultures grown in
absence of antibiotics. The limited plasmid copy number variations may be due to the
heterogeneity of the bacterial populations within the culture with a dominant population of
unchanged plasmid copy number. Another possibility is that the stress conditions (selection
pressure) of having low concentrations of the antibiotics were not enough to cause an
increase in the plasmid copy number due to the fitness cost of increased copy number of the
plasmid on the bacterial host. Subsequently, more generations in presence of sub-MIC
concentrations of antibiotics may be required in order to noticeably increase PCN.
Meanwhile, mutants selected for increased antibiotic resistance for different antibiotics
showed varying increases of plasmid copy number. Furthermore, mutants selected on the
same antibiotic showed variations in their plasmid copy number increase (e.g. mutant 3 and
mutant 4 selected on 64µg/ml minocycline). The average copy number of the wild type
DA33140, selected on MHA plates with no antibiotics, was 1.5 copies/ chromosome.
K. pneumoniae pDA33140-96 resistance plasmid carries resistance genes against many
antibiotics. (Table 1) Interestingly, mutants selected on MH agar plates supplemented with
these antibiotics showed high plasmid copy number variations compared to PCN of the wild
type. Meanwhile, mutants selected on plates supplemented with other antibiotics (no
resistance genes against them on pDA33140-96) did not show variations in PCN compared to
the wild type DA33140. These findings proved over-expression of plasmid-mediated
resistance genes in cases of high selection pressure. Over-expression of resistance genes was
presented as an increase in plasmid copy number. Meanwhile, over-expression can also be
presented as amplifications in resistance genes. Although this study focused on testing
plasmid copy number, gene amplifications should not be ignored as a possible mechanism for
increasing antibiotic resistance. However, because the heat-treated DNA was not digested
during ddPCR, the ddPCR did not measure copy number amplifications on the plasmid but
instead only measured variation in copy number of the whole plasmid.
4.6 Future plans
Future plans include whole genome sequencing of K. pneumoniae DA33140 mutants in order
to understand the mechanism of PCN increase. Also, by using the sequencing data, possible
gene amplifications on the plasmids can be studied. Moreover, sequencing data can give an
idea about whether these amplifications are targeting single or multiple resistance genes on
the plasmid. Additionally, cultures of these mutants will be tested for their resistance level
and how it changed due to plasmid copy number increase. Furthermore, cross-resistance to
other antibiotics, from the same family and different antibiotic families, will be tested. Other
multi resistance plasmids will be studied for plasmid copy number variations in presence of
antibiotics (e.g. pSMS35_130 and pUUH239.2). Also, different strains of E. coli, which were
previously conjugated with the multi resistance plasmid pSMS35_130, will be tested for their
PCN variations in order to elucidate the role of the genetic background on plasmid copy
number variation.

UPPSALA UNIVERSITET Master thesis 24 (26)
Conclusion
EvaGreen® - based multiplexed ddPCR is well adapted for plasmid copy number variations
testing. Cultures grown in presence of low concentrations of antibiotics (below MIC) did not
show high variations in plasmid copy number. Meanwhile, mutants of K. pneumoniae
selected for increased antibiotic resistance in presence of higher concentrations of antibiotics
(above MIC) showed high variations in plasmid copy number. These variations were directly
related to the presence of resistance genes present on the multi-resistance plasmid
Acknowledgment I would like to express my deep gratitude to Hervé Nicoloff and Karin Hjort for their patient
guidance, encouragement and useful critiques of this work. Also, I would like to thank all my
professors and colleagues in the department of medical biochemistry and microbiology
(IMBIM) at Uppsala University for their support and cooperation during my lab work.

UPPSALA UNIVERSITET Master thesis 25 (26)
References
1. Ventola, C. L. The Antibiotic Resistance Crisis Part 1 : Causes and Threats. P T 40,
277–283 (2015).
2. Munita, J. M., Arias, C. A., Unit, A. R. & Santiago, A. De. Mechanisms of Antibiotic
Resistance. Microbiol. Spectr. 4, 1–37 (2016).
3. Barka, E. A. et al. Taxonomy, Physiology, and Natural Products of Actinobacteria.
Microbiol. Mol. Biol. Rev. 80, 1–43 (2016).
4. Wegrzyn, G. & Wegrzyn, A. Stress responses and replication of plasmids in bacterial
cells. Microb. Cell Fact. 1, 1–10 (2002).
5. Johnson, T. J. et al. Plasmid Replicon Typing of Commensal and Pathogenic
Escherichia coli Isolates ᰔ. Appl. Environ. Microbiol. 73, 1976–1983 (2007).
6. Carattoli, A. & Elena, V. R. MINIREVIEW Resistance Plasmid Families in
Enterobacteriaceae ᰔ. Antimicrob. Agents Chemother. 53, 2227–2238 (2009).
7. Millan, A. S. et al. Small-plasmid-mediated antibiotic resistance is enhanced by
increases in plasmid copy number and bacterial fitness. Antimicrob. Agents
Chemother. 59, 3335–3341 (2015).
8. Bengtsson-Palme, J., Kristiansson, E. & Larsson, D. G. J. Environmental factors
influencing the development and spread of antibiotic resistance. FEMS Microbiol. Rev.
42, (2018).
9. Carroll, A. C. & Wong, A. Plasmid persistence: costs, benefits, and the plasmid
paradox. Can. J. Microbiol. 64, 293–304 (2018).
10. Millan, A. S. A. N. & Maclean, R. C. Fitness Costs of Plasmids : a Limit to Plasmid
Transmission. Microbiol. Spectr. 5, 1–12 (2017).
11. Frenkel, L. & Bremer, H. Increased amplification of plasmids pBR322 and pBR327 by
low concentrations of chloramphenicol. DNA 5, 539–44 (1986).
12. Jardetzky, O. Studies on the Mechanism of Action of Chloramphenicol. J. Biol. Chem.
238, 2498–2509 (1963).
13. Balbás, P. et al. Plasmid vector pBR322 and its special-purpose derivatives — a
review. Gene 50, 3–40 (1986).
14. Wong Ng, J., Chatenay, D., Robert, J. & Poirier, M. G. Plasmid copy number noise in
monoclonal populations of bacteria. Phys. Rev. E. Stat. Nonlin. Soft Matter Phys. 81,
1–8 (2010).
15. Anindyajati, Artarini, A. A., Riani, C. & Retnoningrum, D. S. Plasmid Copy Number
Determination by Quantitative Polymerase Chain Reaction. Sci. Pharm. 84, 89–101
(2016).
16. Bagley, S. T. Habitat association of Klebsiella species. Infect. Control 6, 52–58
(1985).
17. Hudson, C. M., Bent, Z. W., Meagher, R. J. & Williams, K. P. Resistance
Determinants and Mobile Genetic Elements of an NDM-1-Encoding Klebsiella
pneumoniae Strain. PLoS One 9, e99209 (2014).
UPPSALA UNIVERSITET Master thesis 26 (26)
18. Rasheed, M. U., Thajuddin, N., Ahamed, P., Teklemariam, Z. & Jamil, K.
Antimicrobial drug resistance in strains of Escherichia coli isolated from food sources.
Rev. Inst. Med. Trop. Sao Paulo 56, 341–346 (2014).
19. Lucigen® epicentre. (2019). MasterPureTM
Complete DNA and RNA Purification Kit:
User manual. Retrieved from https://www.lucigen.com/docs/manuals/MA110E-
MasterPure-Complete.pdf.
20. Deprez, L. et al. Biomolecular Detection and Quantification Validation of a digital
PCR method for quantification of DNA copy number concentrations by using a
certified reference material. Biomol. Detect. Quantif. 9, 29–39 (2016).
21. Plotka, M., Wozniak, M. & Kaczorowski, T. Quantification of plasmid copy number
with single colour droplet digital PCR. PLoS One 12, 1–17 (2017).
22. Mao, F., Leung, W. & Xin, X. Characterization of EvaGreen and the implication of its
physicochemical properties for qPCR applications. BMC Biotechnol. 7, 1–16 (2007).
23. Ohta, T., Tokishita, S. & Yamagata, H. Ethidium bromide and SYBR Green I enhance
the genotoxicity of UV-irradiation and chemical mutagens in E . coli. Mutat. Res. 492,
91–97 (2001).
24. Dashti, A., Jadaon, M., M Abdulsamad, A. & Dashti, H. Heat Treatment of Bacteria:
A Simple Method of DNA Extraction for Molecular Techniques. Kuwait Medical
Journal 41, (2009).
25. Miotke, L., Lau, B. T., Rumma, R. T. & Ji, H. P. High Sensitivity Detection and
Quantitation of DNA Copy Number and Single Nucleotide Variants with Single Color
Droplet Digital PCR. Anal. Chem. 86, 2618–2624 (2014).